December 2014 Hermosa Beach Real Estate Market Trends Update
15
Hermosa Beach Residential Real Estate Market Conditions December 2014
-
Upload
hhc-south-bay-real-estate-agents -
Category
Real Estate
-
view
19 -
download
0
Transcript of December 2014 Hermosa Beach Real Estate Market Trends Update

Table of
Contents
Key Statistics for December
Sales 2014 Residential Sales Stats Year-to-Year Total Sales by Map Area Median 2014 Median Sales Stats Year-to-Year Median Sales by Map Area Listings 2014 Active Listings by Map Area 2014 Total Active Listings vs. Total Sales Year-to-Year Active Listings by Map Area Inventory 2014 Months of Inventory by Map Area Year-to-Year Months of Inventory
Outlook for January
About Hady Chahine Contact Information

Key Statistics for December
Back to Table of Contents
= trending positive = trending positive
= trending negative = trending negative
Month-to-Month Comparison Nov 2014 Dec 2014 Delta (qty) Delta (%) Increase Decrease
Total Sales 12 15 3 25.00%
Median Sales Price 1,437,000 1,570,000 133,000 9.26%
Median Days to Sell 39 51 12 30.77%
Listings 46 25 -21 -45.65%
Sales/Listing Ratio 26.1% 60.0% 33.9% 129.89%
Months of Inventory 3.8 1.7 -2.1 -55.26%
Monthly Comparison Year-to-Year Dec 2013 Dec 2014 Delta Delta Increase Decrease
Total Sales 16 15 -1 -6.25%
Median Sales Price 1,022,500 1,570,000 547,500 53.55%
Median Days to Sell 46 51 5 10.87%
Listings 32 25 -7 -21.88%
Months of Inventory 1.8 1.7 -0.1 -5.56%

Back to Table of Contents
Total Sales Month-to-Month by Map Area Oct Nov Dec
Hermosa Bch Sand 7 6 7
Hermosa Bch Valley 4 4 4
Hermosa Bch East 5 2 4
Total Sales 16 12 15
0
2
4
6
8
10
12
14
16
Oct Nov Dec
2014 Total Sales Month-to-Month by Map Area
Hermosa Bch Sand
Hermosa Bch Valley
Hermosa Bch East
Total Sales
Back to Table of Contents
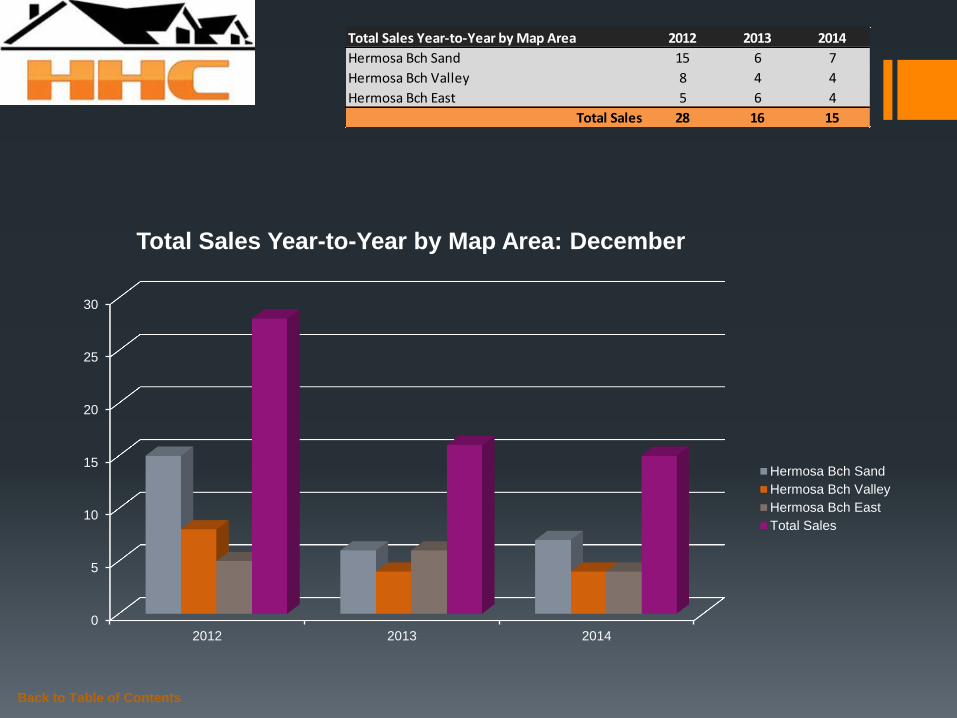
Total Sales Year-to-Year by Map Area 2012 2013 2014
Hermosa Bch Sand 15 6 7
Hermosa Bch Valley 8 4 4
Hermosa Bch East 5 6 4
Total Sales 28 16 15
0
5
10
15
20
25
30
2012 2013 2014
Total Sales Year-to-Year by Map Area: December
Hermosa Bch Sand
Hermosa Bch Valley
Hermosa Bch East
Total Sales

Back to Table of Contents
Median Sales Price Month-to-Month by Map Area Oct Nov Dec
Hermosa Bch Sand 1,499,000 1,615,500 1,875,000
Hermosa Bch Valley 718,000 1,374,500 1,360,000
Hermosa Bch East 1,350,000 946,250 1,460,000
Market Median Sales Price 1,267,500 1,437,000 1,570,000
-
200,000
400,000
600,000
800,000
1,000,000
1,200,000
1,400,000
1,600,000
1,800,000
2,000,000
Oct Nov Dec
2014 Median Sales Price Month-to-Month by Map Area
Hermosa Bch Sand
Hermosa Bch Valley
Hermosa Bch East
Market Median Sales Price
Back to Table of Contents
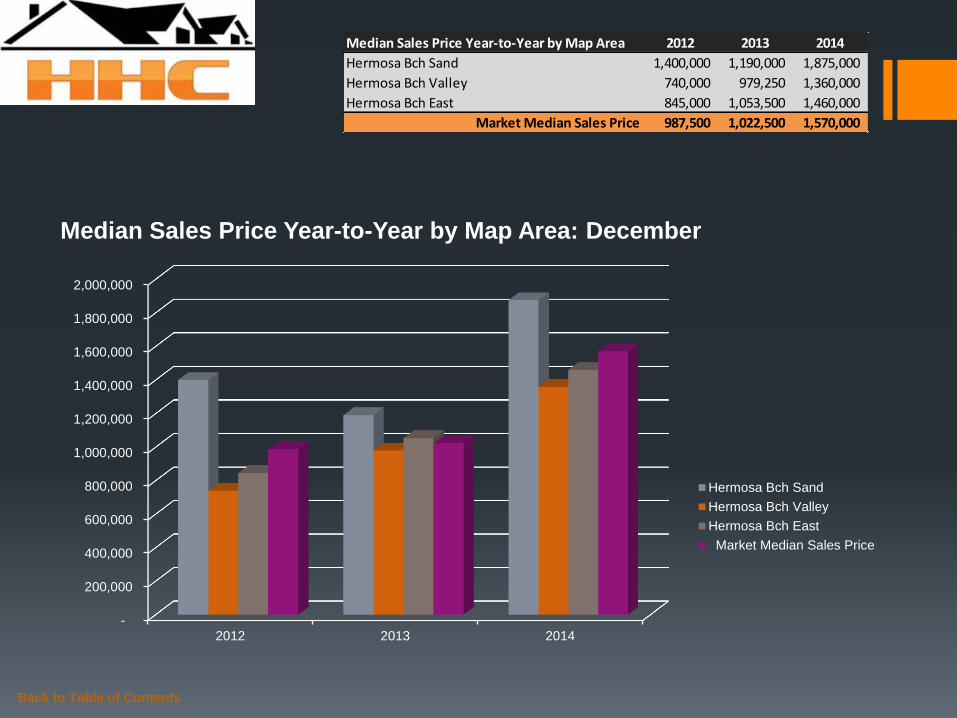
Median Sales Price Year-to-Year by Map Area 2012 2013 2014
Hermosa Bch Sand 1,400,000 1,190,000 1,875,000
Hermosa Bch Valley 740,000 979,250 1,360,000
Hermosa Bch East 845,000 1,053,500 1,460,000
Market Median Sales Price 987,500 1,022,500 1,570,000
-
200,000
400,000
600,000
800,000
1,000,000
1,200,000
1,400,000
1,600,000
1,800,000
2,000,000
2012 2013 2014
Median Sales Price Year-to-Year by Map Area: December
Hermosa Bch Sand
Hermosa Bch Valley
Hermosa Bch East
Market Median Sales Price
Back to Table of Contents
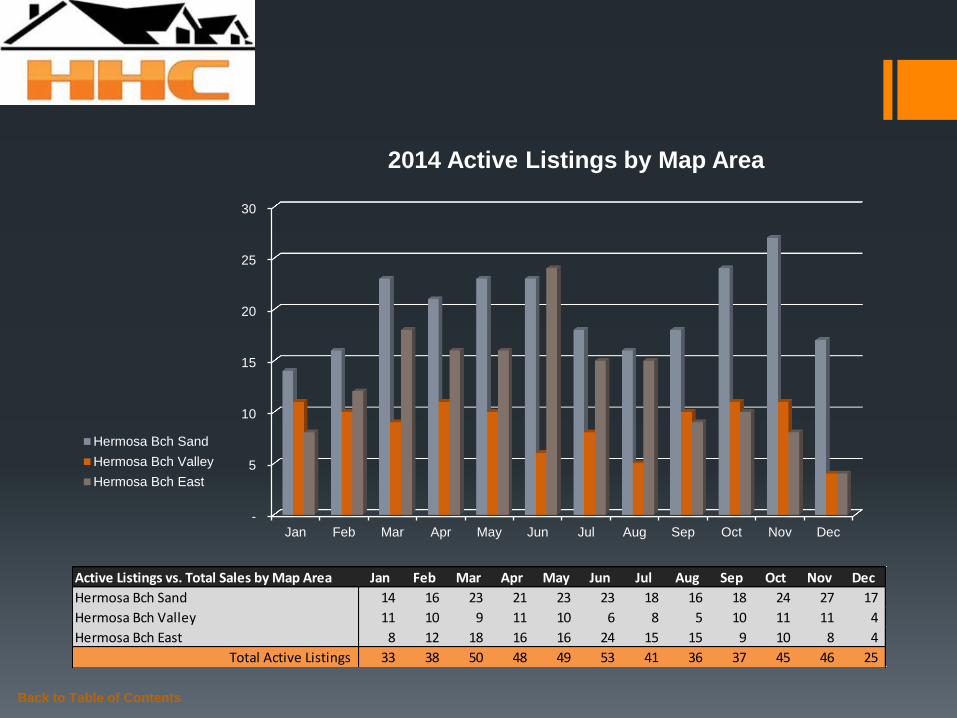
Active Listings vs. Total Sales by Map Area Jan Feb Mar Apr May Jun Jul Aug Sep Oct Nov Dec
Hermosa Bch Sand 14 16 23 21 23 23 18 16 18 24 27 17
Hermosa Bch Valley 11 10 9 11 10 6 8 5 10 11 11 4
Hermosa Bch East 8 12 18 16 16 24 15 15 9 10 8 4
Total Active Listings 33 38 50 48 49 53 41 36 37 45 46 25
-
5
10
15
20
25
30
Jan Feb Mar Apr May Jun Jul Aug Sep Oct Nov Dec
2014 Active Listings by Map Area
Hermosa Bch Sand
Hermosa Bch Valley
Hermosa Bch East

Back to Table of Contents
Active Listings vs. Total Sales by Map Area Jan Feb Mar Apr May Jun Jul Aug Sep Oct Nov Dec
Hermosa Bch Sand 14 16 23 21 23 23 18 16 18 24 27 17
Hermosa Bch Valley 11 10 9 11 10 6 8 5 10 11 11 4
Hermosa Bch East 8 12 18 16 16 24 15 15 9 10 8 4
Total Active Listings 33 38 50 48 49 53 41 36 37 45 46 25
Total Sales 12 14 11 31 18 21 18 17 19 16 12 15
Sales/Listings Ratio 36.4% 36.8% 22.0% 64.6% 36.7% 39.6% 43.9% 47.2% 51.4% 35.6% 26.1% 60.0%
-
10
20
30
40
50
60
Jan Feb Mar Apr May Jun Jul Aug Sep Oct Nov Dec
2014 Total Active Listings vs. Total Sales
Total Active Listings
Total Sales
Back to Table of Contents
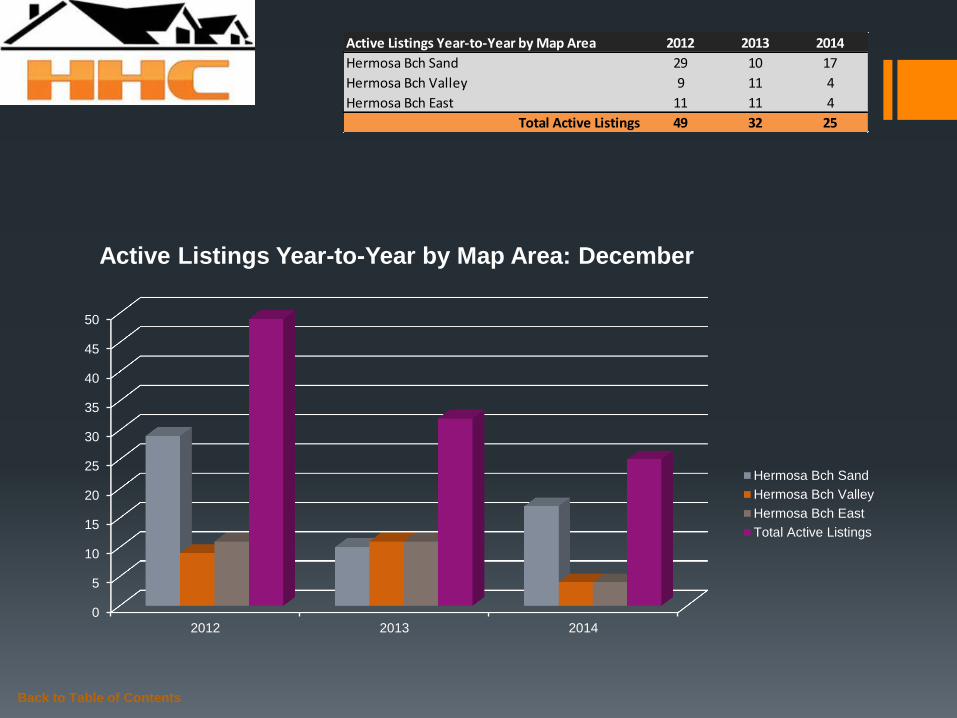
Active Listings Year-to-Year by Map Area 2012 2013 2014
Hermosa Bch Sand 29 10 17
Hermosa Bch Valley 9 11 4
Hermosa Bch East 11 11 4
Total Active Listings 49 32 25
0
5
10
15
20
25
30
35
40
45
50
2012 2013 2014
Active Listings Year-to-Year by Map Area: December
Hermosa Bch Sand
Hermosa Bch Valley
Hermosa Bch East
Total Active Listings
Back to Table of Contents
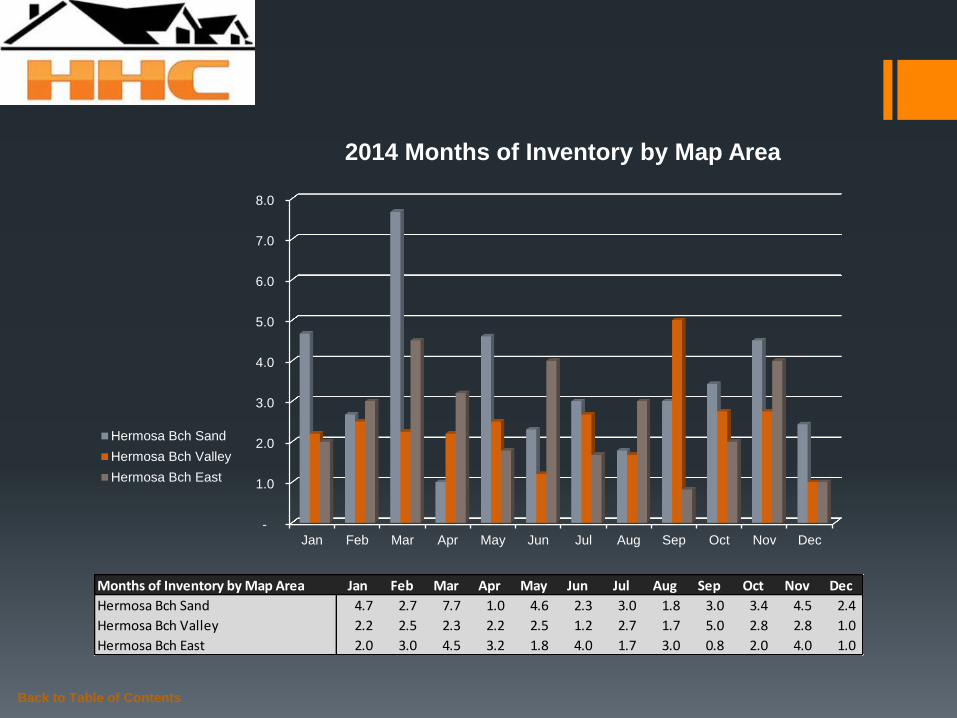
Months of Inventory by Map Area Jan Feb Mar Apr May Jun Jul Aug Sep Oct Nov Dec
Hermosa Bch Sand 4.7 2.7 7.7 1.0 4.6 2.3 3.0 1.8 3.0 3.4 4.5 2.4
Hermosa Bch Valley 2.2 2.5 2.3 2.2 2.5 1.2 2.7 1.7 5.0 2.8 2.8 1.0
Hermosa Bch East 2.0 3.0 4.5 3.2 1.8 4.0 1.7 3.0 0.8 2.0 4.0 1.0
-
1.0
2.0
3.0
4.0
5.0
6.0
7.0
8.0
Jan Feb Mar Apr May Jun Jul Aug Sep Oct Nov Dec
2014 Months of Inventory by Map Area
Hermosa Bch Sand
Hermosa Bch Valley
Hermosa Bch East
Back to Table of Contents
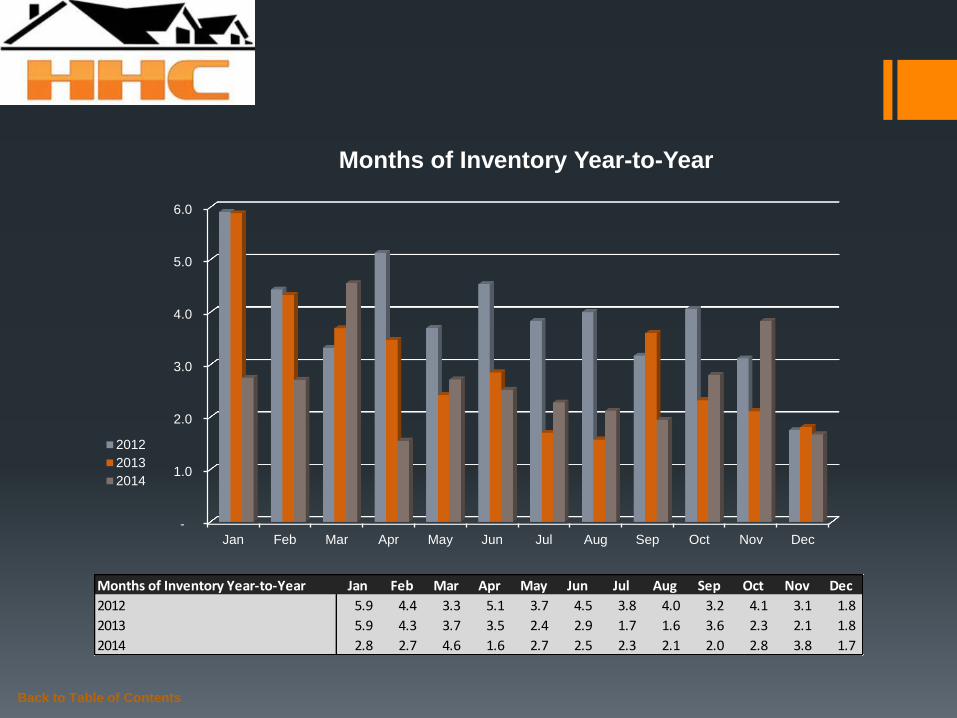
Months of Inventory Year-to-Year Jan Feb Mar Apr May Jun Jul Aug Sep Oct Nov Dec
2012 5.9 4.4 3.3 5.1 3.7 4.5 3.8 4.0 3.2 4.1 3.1 1.8
2013 5.9 4.3 3.7 3.5 2.4 2.9 1.7 1.6 3.6 2.3 2.1 1.8
2014 2.8 2.7 4.6 1.6 2.7 2.5 2.3 2.1 2.0 2.8 3.8 1.7
-
1.0
2.0
3.0
4.0
5.0
6.0
Jan Feb Mar Apr May Jun Jul Aug Sep Oct Nov Dec
Months of Inventory Year-to-Year
2012
2013
2014

Outlook for January
From a month-to-month perspective, the Hermosa Beach real estate market during December proved
encouraging with increases reported for total sales, median market sales price, and the sales/listing ratio.
From year-to-year perspective, this cozy and highly coveted beach market continues to support a healthy
supply and demand relationship as demonstrated by improvements to various major data points over
time. In summary, the beginning of 2015 looks ripe for opportunities favoring both sellers and buyers of
real estate.
Are you interested in selling your property? If so, please call me today to schedule a time when it is most
convenient to drop off a free CMA and marketing plan. How about buying a home? If so, right now is a
perfect time for us to get you pre-approved and positioned to begin shopping and making an offer to
purchase. Initiating the effort to put my expertise to work for you is just a phone call away.
Your recap…
Back to Table of Contents
Month-to-Month Comparison Nov 2014 Dec 2014 Delta (qty) Delta (%) Increase Decrease
Total Sales 12 15 3 25.00%
Median Sales Price 1,437,000 1,570,000 133,000 9.26%
Median Days to Sell 39 51 12 30.77%
Listings 46 25 -21 -45.65%
Sales/Listing Ratio 26.1% 60.0% 33.9% 129.89%
Months of Inventory 3.8 1.7 -2.1 -55.26%

About
Hady Chahine…
Serving South Bay Home Buyers and Sellers Since 2001
RE/MAX Top 4 Team in California – 2012
RE/MAX 100% Club - 2011
Shorewood Realtors Top 5% in Overall Sales 2001-2006, 2008-2010
Back to Table of Contents

The information being provided by CARETS (CLAW, CRISNet MLS, DAMLS, CRMLS, i-Tech MLS, and/or VCRDS) is for the visitor’s personal, non-commercial use and may not be used for
any purpose other than to identify prospective properties visitor may be interested in purchasing. Any information relating to a property referenced on this web site comes from the Internet
Data Exchange (IDX) program of CARETS. This web site may reference real estate listing(s) held by a brokerage firm other than the broker and/or agent who owns this web site. The accuracy
of all information, regardless of source, including but not limited to square footages and lot sizes, is deemed reliable but not guaranteed and should be personally verified through personal
inspection by and/or with the appropriate professionals.
Hady Chahine
• 310-404-5361
Back to Table of Contents
Listings MLS BLOG Website