September 2016 Hermosa Beach Real Estate Market Trends Update
15
Hermosa Beach Residential Real Estate Market Conditions September 2016
-
Upload
hhc-south-bay-real-estate-agents -
Category
Real Estate
-
view
12 -
download
2
Transcript of September 2016 Hermosa Beach Real Estate Market Trends Update

Table of
Contents
Key Statistics for September
Sales 2016 Residential Sales Stats Year-to-Year Total Sales by Map Area Median 2016 Median Sales Stats Year-to-Year Median Sales by Map Area Listings 2016 Active Listings by Map Area 2016 Total Active Listings vs. Total Sales Year-to-Year Active Listings by Map Area Inventory 2016 Months of Inventory by Map Area Year-to-Year Months of Inventory
Summary
About Hady Chahine Contact Information

Key Statistics for September
Back to Table of Contents
= trending positive = trending positive
= trending negative = trending negative
Month-to-Month Comparison Aug 2016 Sep 2016 Delta (qty) Delta (%) Increase Decrease
Total Sales 26 20 -6 -23.08%
Median Sales Price 1,771,250 1,745,000 (26,250) -1.48%
Median Days to Sell 40 37 -3 -7.50%
Listings 70 72 2 2.86%
Sales/Listing Ratio 37.1% 27.8% -9.3% -25.07%
Months of Inventory 3.0 4.0 1 33.33%
Monthly Comparison Year-to-Year Sep 2015 Sep 2016 Delta Delta Increase Decrease
Total Sales 19 20 1 5.26%
Median Sales Price 1,300,000 1,745,000 445,000 34.23%
Median Days to Sell 36 37 1 2.78%
Listings 71 72 1 1.41%
Months of Inventory 3.0 4.0 1 33.33%

Back to Table of Contents
Total Sales Month-to-Month by Map Area Jul Aug Sep
Hermosa Bch Sand 10 13 8
Hermosa Bch Valley 5 5 3
Hermosa Bch East 8 8 9
Total Sales 23 26 20
-
5
10
15
20
25
30
Jul Aug Sep
2016 Total Sales Month-to-Month by Map Area
Hermosa Bch Sand
Hermosa Bch Valley
Hermosa Bch East
Total Sales

Back to Table of Contents
Total Sales Year-to-Year by Map Area 2014 2015 2016
Hermosa Bch Sand 6 7 8
Hermosa Bch Valley 2 7 3
Hermosa Bch East 11 5 9
Total Sales 19 19 20
-
2
4
6
8
10
12
14
16
18
20
2014 2015 2016
Total Sales Year-to-Year by Map Area: September
Hermosa Bch Sand
Hermosa Bch Valley
Hermosa Bch East
Total Sales

Back to Table of Contents
Median Sales Price Month-to-Month by Map Area Jul Aug Sep
Hermosa Bch Sand 1,765,500 2,650,000 2,349,500
Hermosa Bch Valley 1,410,000 1,879,000 1,700,000
Hermosa Bch East 1,212,500 1,340,000 1,347,500
Market Median Sales Price 1,410,000 1,771,250 1,745,000
-
500,000
1,000,000
1,500,000
2,000,000
2,500,000
3,000,000
Jul Aug Sep
2016 Median Sales Price Month-to-Month by Map Area
Hermosa Bch Sand
Hermosa Bch Valley
Hermosa Bch East
Market Median Sales Price
Back to Table of Contents
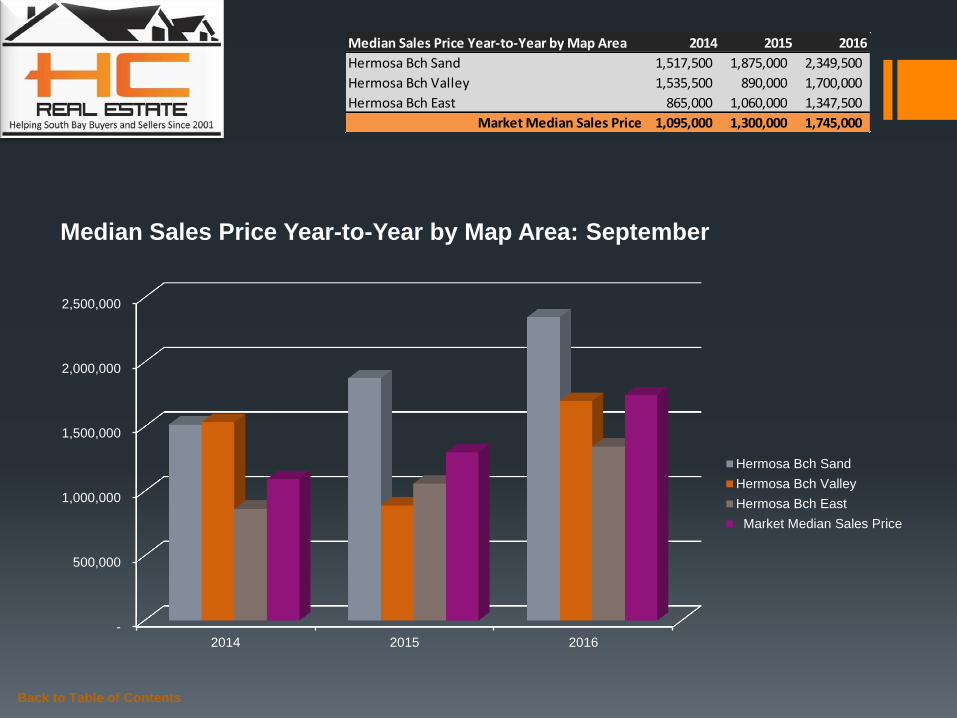
Median Sales Price Year-to-Year by Map Area 2014 2015 2016
Hermosa Bch Sand 1,517,500 1,875,000 2,349,500
Hermosa Bch Valley 1,535,500 890,000 1,700,000
Hermosa Bch East 865,000 1,060,000 1,347,500
Market Median Sales Price 1,095,000 1,300,000 1,745,000
-
500,000
1,000,000
1,500,000
2,000,000
2,500,000
2014 2015 2016
Median Sales Price Year-to-Year by Map Area: September
Hermosa Bch Sand
Hermosa Bch Valley
Hermosa Bch East
Market Median Sales Price

Back to Table of Contents
Active Listings vs. Total Sales by Map Area Jan Feb Mar Apr May Jun Jul Aug Sep Oct Nov Dec
Hermosa Bch Sand 21 24 24 36 35 40 48 41 42
Hermosa Bch Valley 11 9 8 10 13 13 11 13 17
Hermosa Bch East 6 11 19 25 19 19 18 16 13
Total Active Listings 38 44 51 71 67 72 77 70 72
-
5
10
15
20
25
30
35
40
45
50
Jan Feb Mar Apr May Jun Jul Aug Sep Oct Nov Dec
2016 Active Listings by Map Area
Hermosa Bch Sand
Hermosa Bch Valley
Hermosa Bch East

Back to Table of Contents
Active Listings vs. Total Sales by Map Area Jan Feb Mar Apr May Jun Jul Aug Sep Oct Nov Dec
Hermosa Bch Sand 21 24 24 36 35 40 48 41 42
Hermosa Bch Valley 11 9 8 10 13 13 11 13 17
Hermosa Bch East 6 11 19 25 19 19 18 16 13
Total Active Listings 38 44 51 71 67 72 77 70 72
Total Sales 10 18 16 18 18 22 23 26 20
Sales/Listings Ratio 26.3% 40.9% 31.4% 25.4% 26.9% 30.6% 29.9% 37.1% 27.8%
-
10
20
30
40
50
60
70
80
Jan Feb Mar Apr May Jun Jul Aug Sep Oct Nov Dec
2016 Total Active Listings vs. Total Sales
Total Active Listings
Total Sales
Back to Table of Contents
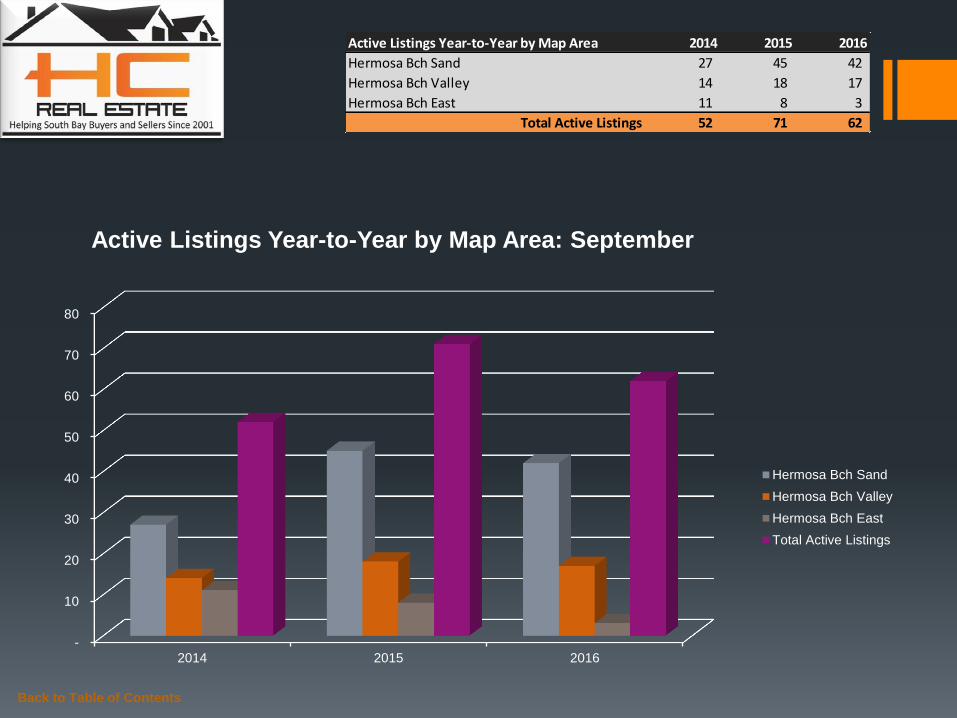
Active Listings Year-to-Year by Map Area 2014 2015 2016
Hermosa Bch Sand 27 45 42
Hermosa Bch Valley 14 18 17
Hermosa Bch East 11 8 3
Total Active Listings 52 71 62
-
10
20
30
40
50
60
70
80
2014 2015 2016
Active Listings Year-to-Year by Map Area: September
Hermosa Bch Sand
Hermosa Bch Valley
Hermosa Bch East
Total Active Listings

Back to Table of Contents
Months of Inventory by Map Area Jan Feb Mar Apr May Jun Jul Aug Sep Oct Nov Dec
Hermosa Bch Sand 3.0 2.0 3.0 6.0 4.0 6.0 5.0 3.0 5.0
Hermosa Bch Valley 6.0 2.0 2.0 2.0 7.0 3.0 2.0 3.0 6.0
Hermosa Bch East 6.0 4.0 6.0 4.0 2.0 2.0 2.0 2.0 1.0
-
1.0
2.0
3.0
4.0
5.0
6.0
7.0
Jan Feb Mar Apr May Jun Jul Aug Sep Oct Nov Dec
2016 Months of Inventory by Map Area
Hermosa Bch Sand
Hermosa Bch Valley
Hermosa Bch East

Back to Table of Contents
Months of Inventory Year-to-Year Jan Feb Mar Apr May Jun Jul Aug Sep Oct Nov Dec
2014 3.0 3.0 5.0 2.0 3.0 3.0 3.0 2.0 2.0 3.0 4.0 2.0
2015 2.0 5.0 2.0 2.0 4.0 3.0 4.0 3.0 3.0 3.0 2.0 2.0
2016 4.0 2.0 3.0 4.0 4.0 3.0 3.0 3.0 4.0
-
0.5
1.0
1.5
2.0
2.5
3.0
3.5
4.0
4.5
5.0
Jan Feb Mar Apr May Jun Jul Aug Sep Oct Nov Dec
Months of Inventory Year-to-Year
2014
2015
2016
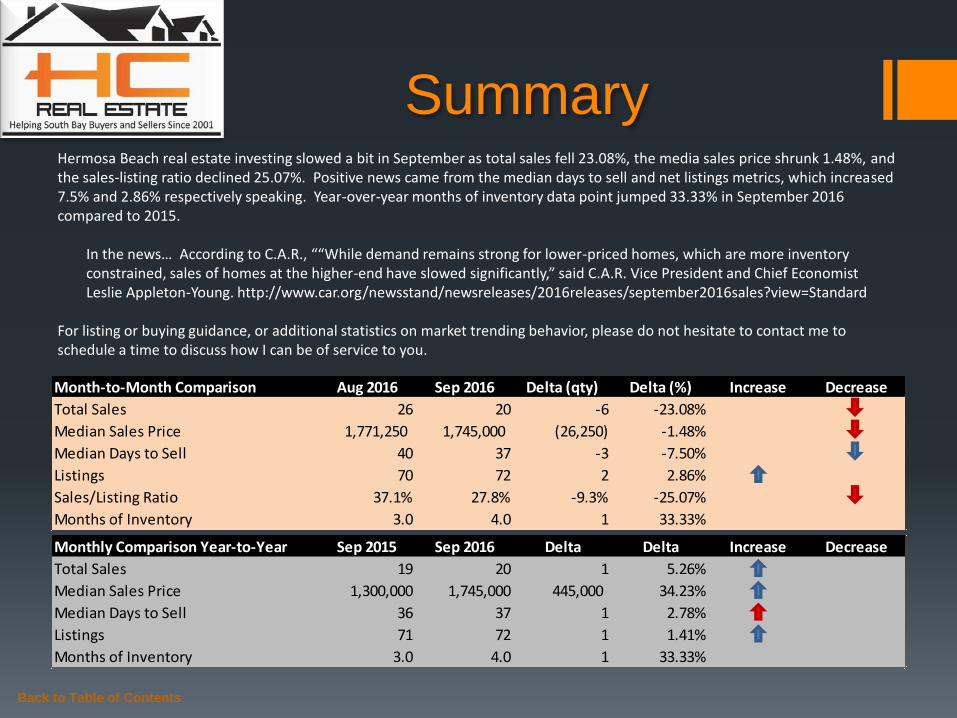
Summary Hermosa Beach real estate investing slowed a bit in September as total sales fell 23.08%, the media sales price shrunk 1.48%, and the sales-listing ratio declined 25.07%. Positive news came from the median days to sell and net listings metrics, which increased 7.5% and 2.86% respectively speaking. Year-over-year months of inventory data point jumped 33.33% in September 2016 compared to 2015.
In the news… According to C.A.R., ““While demand remains strong for lower-priced homes, which are more inventory constrained, sales of homes at the higher-end have slowed significantly,” said C.A.R. Vice President and Chief Economist Leslie Appleton-Young. http://www.car.org/newsstand/newsreleases/2016releases/september2016sales?view=Standard
For listing or buying guidance, or additional statistics on market trending behavior, please do not hesitate to contact me to schedule a time to discuss how I can be of service to you.
Back to Table of Contents
Monthly Comparison Year-to-Year Sep 2015 Sep 2016 Delta Delta Increase Decrease
Total Sales 19 20 1 5.26%
Median Sales Price 1,300,000 1,745,000 445,000 34.23%
Median Days to Sell 36 37 1 2.78%
Listings 71 72 1 1.41%
Months of Inventory 3.0 4.0 1 33.33%
Month-to-Month Comparison Aug 2016 Sep 2016 Delta (qty) Delta (%) Increase Decrease
Total Sales 26 20 -6 -23.08%
Median Sales Price 1,771,250 1,745,000 (26,250) -1.48%
Median Days to Sell 40 37 -3 -7.50%
Listings 70 72 2 2.86%
Sales/Listing Ratio 37.1% 27.8% -9.3% -25.07%
Months of Inventory 3.0 4.0 1 33.33%

About
Hady Chahine…
Serving South Bay Home Buyers and Sellers Since 2001
RE/MAX Top 4 Team in California – 2012
RE/MAX 100% Club - 2011
Shorewood Realtors Top 5% in Overall Sales 2001-2006, 2008-2010
Back to Table of Contents

The information being provided by CARETS (CLAW, CRISNet MLS, DAMLS, CRMLS, i-Tech MLS, and/or VCRDS) is for the visitor’s personal, non-commercial use and may not be used for
any purpose other than to identify prospective properties visitor may be interested in purchasing. Any information relating to a property referenced on this web site comes from the Internet
Data Exchange (IDX) program of CARETS. This web site may reference real estate listing(s) held by a brokerage firm other than the broker and/or agent who owns this web site. The accuracy
of all information, regardless of source, including but not limited to square footages and lot sizes, is deemed reliable but not guaranteed and should be personally verified through personal
inspection by and/or with the appropriate professionals.
Hady Chahine
• 310-404-5361
Back to Table of Contents
Listings MLS BLOG Website