
February 2014 Hermosa Beach Real Estate Market Trends Update
Upload
hhc-south-bay-real-estate-agentsCategory
view
138download
0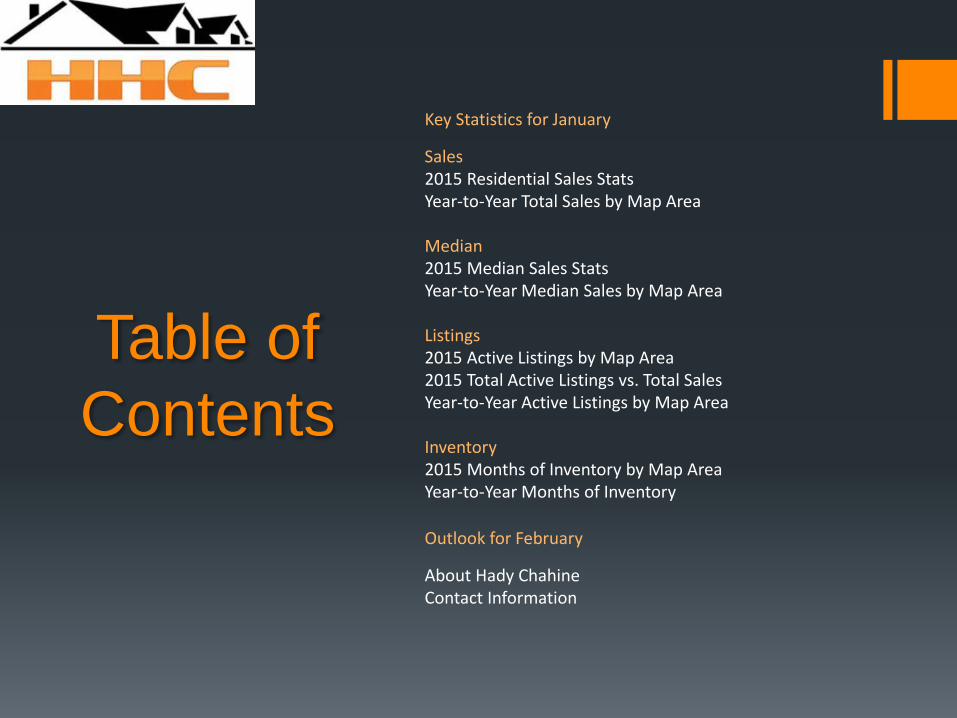
Table of
Contents
Key Statistics for January
Sales 2015 Residential Sales Stats Year-to-Year Total Sales by Map Area Median 2015 Median Sales Stats Year-to-Year Median Sales by Map Area Listings 2015 Active Listings by Map Area 2015 Total Active Listings vs. Total Sales Year-to-Year Active Listings by Map Area Inventory 2015 Months of Inventory by Map Area Year-to-Year Months of Inventory
Outlook for February
About Hady Chahine Contact Information

Key Statistics for January
Back to Table of Contents
= trending positive = trending positive
= trending negative = trending negative
Month-to-Month Comparison Jan 2015 Feb 2015 Delta (qty) Delta (%) Increase Decrease
Total Sales 15 TBD #VALUE! #VALUE!
Median Sales Price 1,640,000 TBD #VALUE! #VALUE!
Median Days to Sell 48 TBD #VALUE! #VALUE!
Listings 27 TBD #VALUE! #VALUE!
Sales/Listing Ratio 55.6% TBD #VALUE! #VALUE!
Months of Inventory 1.8 TBD #VALUE! #VALUE!
Monthly Comparison Year-to-Year Jan 2014 Jan 2015 Delta Delta Increase Decrease
Total Sales 12 15 3 25.00%
Median Sales Price 878,000 1,640,000 762,000 86.79%
Median Days to Sell 51 48 -3 -5.88%
Listings 37 27 -10 -27.03%
Months of Inventory 2.8 1.8 -1 -35.71%

Back to Table of Contents
Total Sales Month-to-Month by Map Area Jan Feb Mar
Hermosa Bch Sand 9
Hermosa Bch Valley 2
Hermosa Bch East 4
Total Sales 15 0 0
0
2
4
6
8
10
12
14
16
Jan Feb Mar
2015 Total Sales Month-to-Month by Map Area
Hermosa Bch Sand
Hermosa Bch Valley
Hermosa Bch East
Total Sales

Back to Table of Contents
Total Sales Year-to-Year by Map Area 2013 2014 2015
Hermosa Bch Sand 3 3 9
Hermosa Bch Valley 2 5 2
Hermosa Bch East 3 4 4
Total Sales 8 12 15
0
2
4
6
8
10
12
14
16
2013 2014 2015
Total Sales Year-to-Year by Map Area: January
Hermosa Bch Sand
Hermosa Bch Valley
Hermosa Bch East
Total Sales

Back to Table of Contents
Median Sales Price Month-to-Month by Map Area Jan Feb Mar
Hermosa Bch Sand 1,695,000
Hermosa Bch Valley 1,500,000
Hermosa Bch East 1,662,500
Market Median Sales Price 1,640,000
1,400,000
1,450,000
1,500,000
1,550,000
1,600,000
1,650,000
1,700,000
Jan Feb Mar
2015 Median Sales Price Month-to-Month by Map Area
Hermosa Bch Sand
Hermosa Bch Valley
Hermosa Bch East
Market Median Sales Price

Back to Table of Contents
Median Sales Price Year-to-Year by Map Area 2013 2014 2015
Hermosa Bch Sand 1,050,000 1,165,000 1,695,000
Hermosa Bch Valley 1,242,250 1,001,500 1,500,000
Hermosa Bch East 1,215,000 715,250 1,662,500
Market Median Sales Price 1,061,250 878,000 1,640,000
-
200,000
400,000
600,000
800,000
1,000,000
1,200,000
1,400,000
1,600,000
1,800,000
2013 2014 2015
Median Sales Price Year-to-Year by Map Area: January
Hermosa Bch Sand
Hermosa Bch Valley
Hermosa Bch East
Market Median Sales Price

Back to Table of Contents
Active Listings vs. Total Sales by Map Area Jan Feb Mar Apr May Jun Jul Aug Sep Oct Nov Dec
Hermosa Bch Sand 16
Hermosa Bch Valley 6
Hermosa Bch East 5
Total Active Listings 27
-
2
4
6
8
10
12
14
16
Jan Feb Mar Apr May Jun Jul Aug Sep Oct Nov Dec
2015 Active Listings by Map Area
Hermosa Bch Sand
Hermosa Bch Valley
Hermosa Bch East

Back to Table of Contents
Active Listings vs. Total Sales by Map Area Jan Feb Mar Apr May Jun Jul Aug Sep Oct Nov Dec
Hermosa Bch Sand 16
Hermosa Bch Valley 6
Hermosa Bch East 5
Total Active Listings 27
Total Sales 15
Sales/Listings Ratio 55.6%
-
5
10
15
20
25
30
Jan Feb Mar Apr May Jun Jul Aug Sep Oct Nov Dec
2015 Total Active Listings vs. Total Sales
Total Active Listings
Total Sales

Back to Table of Contents
Active Listings Year-to-Year by Map Area 2013 2014 2015
Hermosa Bch Sand 18 14 16
Hermosa Bch Valley 17 13 6
Hermosa Bch East 12 10 5
Total Active Listings 47 37 27
0
5
10
15
20
25
30
35
40
45
50
2013 2014 2015
Active Listings Year-to-Year by Map Area: January
Hermosa Bch Sand
Hermosa Bch Valley
Hermosa Bch East
Total Active Listings
Back to Table of Contents
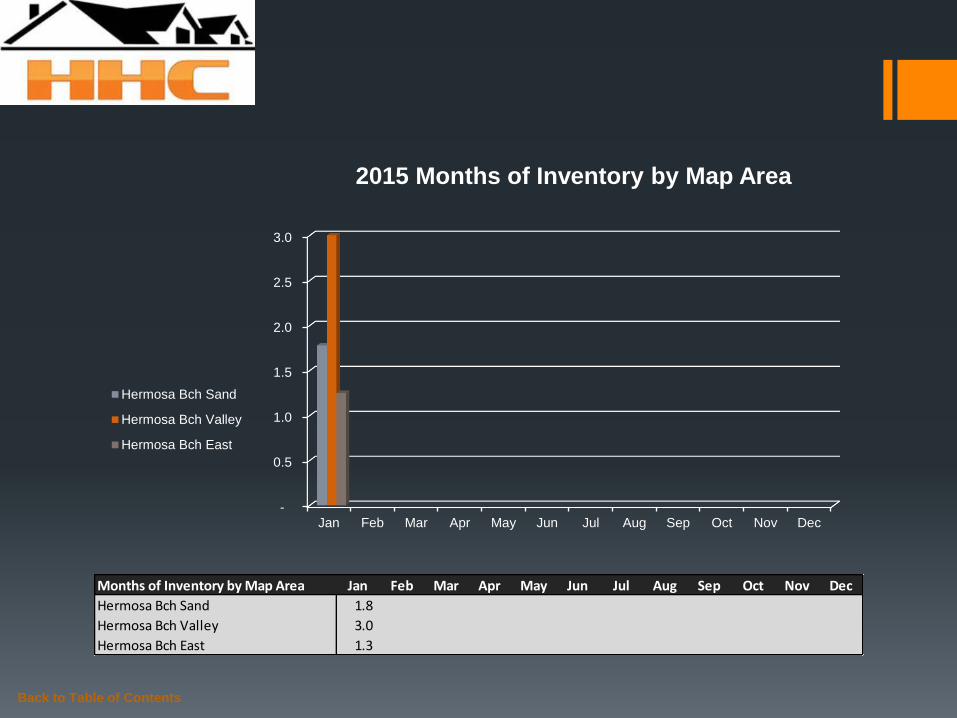
Months of Inventory by Map Area Jan Feb Mar Apr May Jun Jul Aug Sep Oct Nov Dec
Hermosa Bch Sand 1.8
Hermosa Bch Valley 3.0
Hermosa Bch East 1.3
-
0.5
1.0
1.5
2.0
2.5
3.0
Jan Feb Mar Apr May Jun Jul Aug Sep Oct Nov Dec
2015 Months of Inventory by Map Area
Hermosa Bch Sand
Hermosa Bch Valley
Hermosa Bch East

Back to Table of Contents
Months of Inventory Year-to-Year Jan Feb Mar Apr May Jun Jul Aug Sep Oct Nov Dec
2013 5.9 4.3 3.7 3.5 2.4 2.9 1.7 1.6 3.6 2.3 2.1 1.8
2014 2.8 2.7 4.6 1.6 2.7 2.5 2.3 2.1 2.0 2.8 3.8 1.7
2015 1.8
-
1.0
2.0
3.0
4.0
5.0
6.0
Jan Feb Mar Apr May Jun Jul Aug Sep Oct Nov Dec
Months of Inventory Year-to-Year
2013
2014
2015
Outlook for February
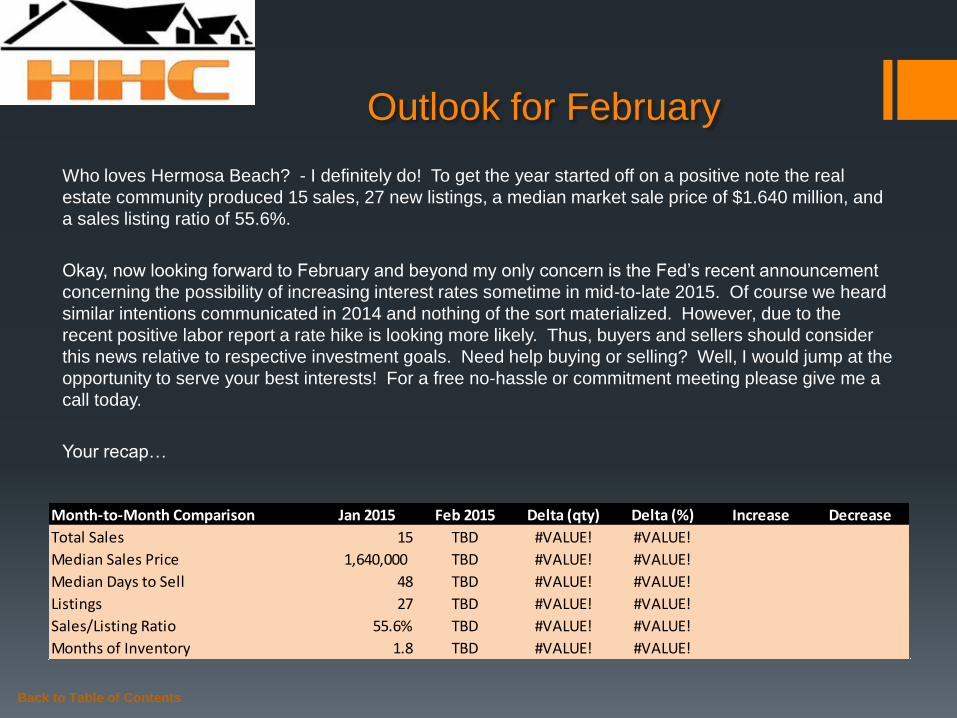
Who loves Hermosa Beach? - I definitely do! To get the year started off on a positive note the real
estate community produced 15 sales, 27 new listings, a median market sale price of $1.640 million, and
a sales listing ratio of 55.6%.
Okay, now looking forward to February and beyond my only concern is the Fed’s recent announcement
concerning the possibility of increasing interest rates sometime in mid-to-late 2015. Of course we heard
similar intentions communicated in 2014 and nothing of the sort materialized. However, due to the
recent positive labor report a rate hike is looking more likely. Thus, buyers and sellers should consider
this news relative to respective investment goals. Need help buying or selling? Well, I would jump at the
opportunity to serve your best interests! For a free no-hassle or commitment meeting please give me a
call today.
Your recap…
Back to Table of Contents
Month-to-Month Comparison Jan 2015 Feb 2015 Delta (qty) Delta (%) Increase Decrease
Total Sales 15 TBD #VALUE! #VALUE!
Median Sales Price 1,640,000 TBD #VALUE! #VALUE!
Median Days to Sell 48 TBD #VALUE! #VALUE!
Listings 27 TBD #VALUE! #VALUE!
Sales/Listing Ratio 55.6% TBD #VALUE! #VALUE!
Months of Inventory 1.8 TBD #VALUE! #VALUE!

About
Hady Chahine…
Serving South Bay Home Buyers and Sellers Since 2001
RE/MAX Top 4 Team in California – 2012
RE/MAX 100% Club - 2011
Shorewood Realtors Top 5% in Overall Sales 2001-2006, 2008-2010
Back to Table of Contents

The information being provided by CARETS (CLAW, CRISNet MLS, DAMLS, CRMLS, i-Tech MLS, and/or VCRDS) is for the visitor’s personal, non-commercial use and may not be used for
any purpose other than to identify prospective properties visitor may be interested in purchasing. Any information relating to a property referenced on this web site comes from the Internet
Data Exchange (IDX) program of CARETS. This web site may reference real estate listing(s) held by a brokerage firm other than the broker and/or agent who owns this web site. The accuracy
of all information, regardless of source, including but not limited to square footages and lot sizes, is deemed reliable but not guaranteed and should be personally verified through personal
inspection by and/or with the appropriate professionals.
Hady Chahine
• 310-404-5361
Back to Table of Contents
Listings MLS BLOG Website