February 2014 Hermosa Beach Real Estate Market Trends Update
Upload
hhc-south-bay-real-estate-agentsCategory
view
15download
2
Table of
Contents
Key Statistics for April
Sales 2015 Residential Sales Stats Year-to-Year Total Sales by Map Area Median 2015 Median Sales Stats Year-to-Year Median Sales by Map Area Listings 2015 Active Listings by Map Area 2015 Total Active Listings vs. Total Sales Year-to-Year Active Listings by Map Area Inventory 2015 Months of Inventory by Map Area Year-to-Year Months of Inventory
Outlook for May
About Hady Chahine Contact Information

Key Statistics for April
Back to Table of Contents
= trending positive = trending positive
= trending negative = trending negative
Month-to-Month Comparison Mar 2015 Apr 2015 Delta (qty) Delta (%) Increase Decrease
Total Sales 20 30 10 50.00%
Median Sales Price 1,310,000 1,404,500 94,500 7.21%
Median Days to Sell 36 33 -3 -8.33%
Listings 38 51 13 34.21%
Sales/Listing Ratio 52.6% 58.8% 6.2% 11.79%
Months of Inventory 1.9 1.7 -0.2 -10.53%
Monthly Comparison Year-to-Year Apr 2014 Apr 2015 Delta Delta Increase Decrease
Total Sales 31 30 -1 -3.23%
Median Sales Price 1,495,000 1,404,500 (90,500) -6.05%
Median Days to Sell 29 33 4 13.79%
Listings 52 51 -1 -1.92%
Months of Inventory 1.6 1.7 0.1 6.25%

Back to Table of Contents
Total Sales Month-to-Month by Map Area Feb Mar Apr
Hermosa Bch Sand 4 10 14
Hermosa Bch Valley 2 4 7
Hermosa Bch East 3 6 9
Total Sales 9 20 30
0
5
10
15
20
25
30
Feb Mar Apr
2015 Total Sales Month-to-Month by Map Area
Hermosa Bch Sand
Hermosa Bch Valley
Hermosa Bch East
Total Sales

Back to Table of Contents
Total Sales Year-to-Year by Map Area 2013 2014 2015
Hermosa Bch Sand 8 21 14
Hermosa Bch Valley 5 5 7
Hermosa Bch East 6 5 9
Total Sales 19 31 30
0
5
10
15
20
25
30
35
2013 2014 2015
Total Sales Year-to-Year by Map Area: April
Hermosa Bch Sand
Hermosa Bch Valley
Hermosa Bch East
Total Sales

Back to Table of Contents
Median Sales Price Month-to-Month by Map Area Feb Mar Apr
Hermosa Bch Sand 2,274,500 3,150,000 2,515,000
Hermosa Bch Valley 1,182,000 941,625 925,000
Hermosa Bch East 1,185,000 1,075,000 949,000
Market Median Sales Price 1,450,000 1,310,000 1,404,500
-
500,000
1,000,000
1,500,000
2,000,000
2,500,000
3,000,000
3,500,000
Feb Mar Apr
2015 Median Sales Price Month-to-Month by Map Area
Hermosa Bch Sand
Hermosa Bch Valley
Hermosa Bch East
Market Median Sales Price

Back to Table of Contents
Median Sales Price Year-to-Year by Map Area 2013 2014 2015
Hermosa Bch Sand 1,401,500 1,565,000 2,515,000
Hermosa Bch Valley 865,000 1,170,000 925,000
Hermosa Bch East 952,000 1,390,000 949,000
Market Median Sales Price 1,140,000 1,495,000 1,404,500
-
500,000
1,000,000
1,500,000
2,000,000
2,500,000
3,000,000
2013 2014 2015
Median Sales Price Year-to-Year by Map Area: April
Hermosa Bch Sand
Hermosa Bch Valley
Hermosa Bch East
Market Median Sales Price
Back to Table of Contents
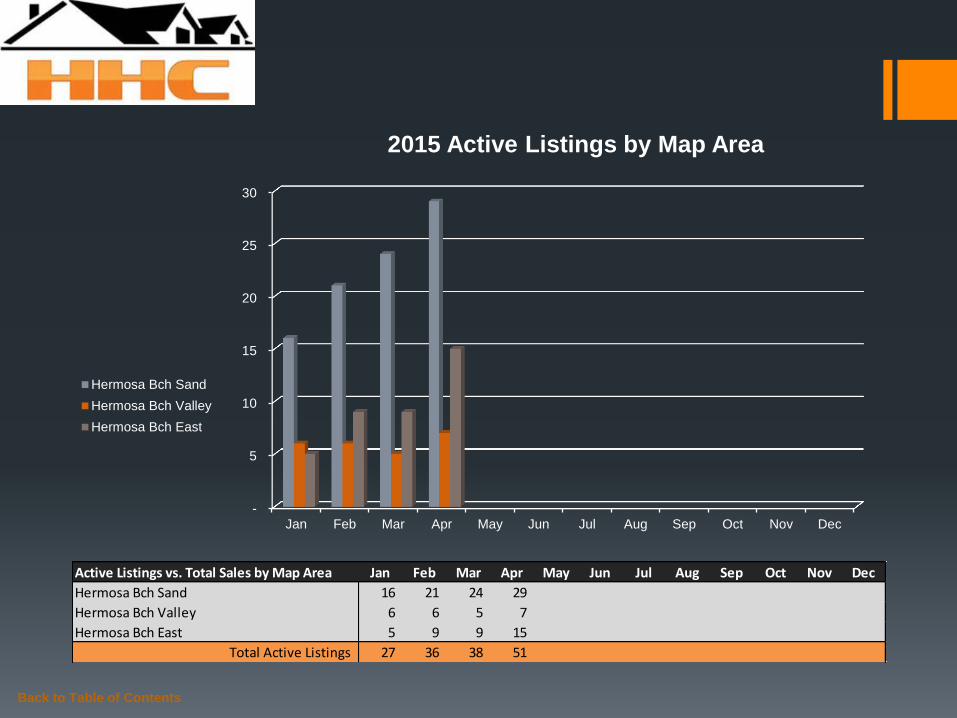
Active Listings vs. Total Sales by Map Area Jan Feb Mar Apr May Jun Jul Aug Sep Oct Nov Dec
Hermosa Bch Sand 16 21 24 29
Hermosa Bch Valley 6 6 5 7
Hermosa Bch East 5 9 9 15
Total Active Listings 27 36 38 51
-
5
10
15
20
25
30
Jan Feb Mar Apr May Jun Jul Aug Sep Oct Nov Dec
2015 Active Listings by Map Area
Hermosa Bch Sand
Hermosa Bch Valley
Hermosa Bch East

Back to Table of Contents
Active Listings vs. Total Sales by Map Area Jan Feb Mar Apr May Jun Jul Aug Sep Oct Nov Dec
Hermosa Bch Sand 16 21 24 29
Hermosa Bch Valley 6 6 5 7
Hermosa Bch East 5 9 9 15
Total Active Listings 27 36 38 51
Total Sales 15 9 20 30
Sales/Listings Ratio 55.6% 25.0% 52.6% 58.8%
-
10
20
30
40
50
60
Jan Feb Mar Apr May Jun Jul Aug Sep Oct Nov Dec
2015 Total Active Listings vs. Total Sales
Total Active Listings
Total Sales

Back to Table of Contents
Active Listings Year-to-Year by Map Area 2013 2014 2015
Hermosa Bch Sand 30 24 29
Hermosa Bch Valley 20 11 7
Hermosa Bch East 16 17 15
Total Active Listings 66 52 51
0
10
20
30
40
50
60
70
2013 2014 2015
Active Listings Year-to-Year by Map Area: April
Hermosa Bch Sand
Hermosa Bch Valley
Hermosa Bch East
Total Active Listings

Back to Table of Contents
Months of Inventory by Map Area Jan Feb Mar Apr May Jun Jul Aug Sep Oct Nov Dec
Hermosa Bch Sand 1.8 5.3 2.4 2.1
Hermosa Bch Valley 3.0 3.0 1.3 1.0
Hermosa Bch East 1.3 3.0 1.5 1.7
-
1.0
2.0
3.0
4.0
5.0
6.0
Jan Feb Mar Apr May Jun Jul Aug Sep Oct Nov Dec
2015 Months of Inventory by Map Area
Hermosa Bch Sand
Hermosa Bch Valley
Hermosa Bch East

Back to Table of Contents
Months of Inventory Year-to-Year Jan Feb Mar Apr May Jun Jul Aug Sep Oct Nov Dec
2013 5.9 4.3 3.7 3.5 2.4 2.9 1.7 1.6 3.6 2.3 2.1 1.8
2014 2.8 2.7 4.6 1.6 2.7 2.5 2.3 2.1 2.0 2.8 3.8 1.7
2015 1.8 4.0 1.9 1.7
-
1.0
2.0
3.0
4.0
5.0
6.0
Jan Feb Mar Apr May Jun Jul Aug Sep Oct Nov Dec
Months of Inventory Year-to-Year
2013
2014
2015
Outlook for May
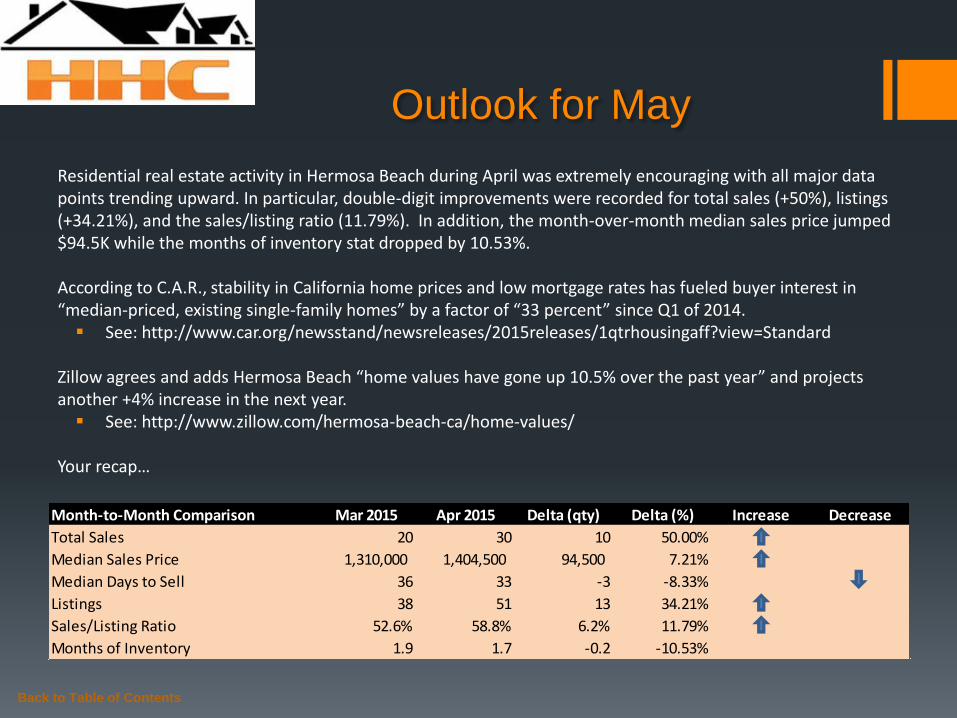
Residential real estate activity in Hermosa Beach during April was extremely encouraging with all major data points trending upward. In particular, double-digit improvements were recorded for total sales (+50%), listings (+34.21%), and the sales/listing ratio (11.79%). In addition, the month-over-month median sales price jumped $94.5K while the months of inventory stat dropped by 10.53%. According to C.A.R., stability in California home prices and low mortgage rates has fueled buyer interest in “median-priced, existing single-family homes” by a factor of “33 percent” since Q1 of 2014.
See: http://www.car.org/newsstand/newsreleases/2015releases/1qtrhousingaff?view=Standard Zillow agrees and adds Hermosa Beach “home values have gone up 10.5% over the past year” and projects another +4% increase in the next year.
See: http://www.zillow.com/hermosa-beach-ca/home-values/ Your recap… Your recap…
Back to Table of Contents
Month-to-Month Comparison Mar 2015 Apr 2015 Delta (qty) Delta (%) Increase Decrease
Total Sales 20 30 10 50.00%
Median Sales Price 1,310,000 1,404,500 94,500 7.21%
Median Days to Sell 36 33 -3 -8.33%
Listings 38 51 13 34.21%
Sales/Listing Ratio 52.6% 58.8% 6.2% 11.79%
Months of Inventory 1.9 1.7 -0.2 -10.53%

About
Hady Chahine…
Serving South Bay Home Buyers and Sellers Since 2001
RE/MAX Top 4 Team in California – 2012
RE/MAX 100% Club - 2011
Shorewood Realtors Top 5% in Overall Sales 2001-2006, 2008-2010
Back to Table of Contents

The information being provided by CARETS (CLAW, CRISNet MLS, DAMLS, CRMLS, i-Tech MLS, and/or VCRDS) is for the visitor’s personal, non-commercial use and may not be used for
any purpose other than to identify prospective properties visitor may be interested in purchasing. Any information relating to a property referenced on this web site comes from the Internet
Data Exchange (IDX) program of CARETS. This web site may reference real estate listing(s) held by a brokerage firm other than the broker and/or agent who owns this web site. The accuracy
of all information, regardless of source, including but not limited to square footages and lot sizes, is deemed reliable but not guaranteed and should be personally verified through personal
inspection by and/or with the appropriate professionals.
Hady Chahine
• 310-404-5361
Back to Table of Contents
Listings MLS BLOG Website