Is E-personalisation a danger for the customers privacy
70
J ÖNKÖPING I NTERNATIONAL B USINESS S CHOOL JÖNKÖPING UNIVERSITY Is E-personalisation a danger for the customer’s privacy? A study on JIBS students Bachelor Thesis within Business Administration Authors: Irina Brezgina Margaux Debouchaud Julia Frehse Supervisors: Olga Sasinovskaya Jönköping June 2008
Transcript of Is E-personalisation a danger for the customers privacy
J Ö N K Ö P I N G I N T E R N A T I O N A L B U S I N E S S S C H O O L JÖNKÖPING UNIVERSITY
Is E-personalisation a danger for the customer’s privacy?
A study on JIBS students
Bachelor Thesis within Business Administration Authors: Irina Brezgina Margaux Debouchaud Julia Frehse Supervisors: Olga Sasinovskaya Jönköping June 2008
i
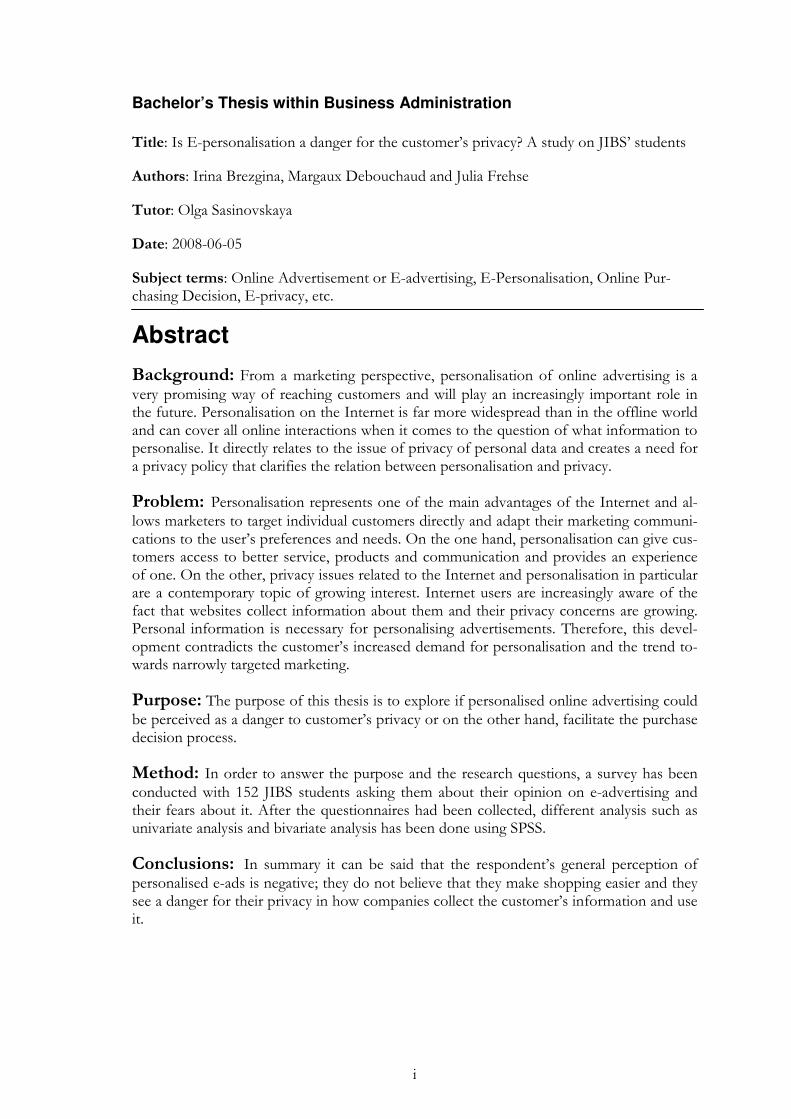
Bachelor’s Thesis within Business Administration
Title: Is E-personalisation a danger for the customer’s privacy? A study on JIBS’ students
Authors: Irina Brezgina, Margaux Debouchaud and Julia Frehse
Tutor: Olga Sasinovskaya
Date: 2008-06-05
Subject terms: Online Advertisement or E-advertising, E-Personalisation, Online Pur-chasing Decision, E-privacy, etc.
Abstract
Background: From a marketing perspective, personalisation of online advertising is a very promising way of reaching customers and will play an increasingly important role in the future. Personalisation on the Internet is far more widespread than in the offline world and can cover all online interactions when it comes to the question of what information to personalise. It directly relates to the issue of privacy of personal data and creates a need for a privacy policy that clarifies the relation between personalisation and privacy.
Problem: Personalisation represents one of the main advantages of the Internet and al-lows marketers to target individual customers directly and adapt their marketing communi-cations to the user’s preferences and needs. On the one hand, personalisation can give cus-tomers access to better service, products and communication and provides an experience of one. On the other, privacy issues related to the Internet and personalisation in particular are a contemporary topic of growing interest. Internet users are increasingly aware of the fact that websites collect information about them and their privacy concerns are growing. Personal information is necessary for personalising advertisements. Therefore, this devel-opment contradicts the customer’s increased demand for personalisation and the trend to-wards narrowly targeted marketing.
Purpose: The purpose of this thesis is to explore if personalised online advertising could be perceived as a danger to customer’s privacy or on the other hand, facilitate the purchase decision process.
Method: In order to answer the purpose and the research questions, a survey has been conducted with 152 JIBS students asking them about their opinion on e-advertising and their fears about it. After the questionnaires had been collected, different analysis such as univariate analysis and bivariate analysis has been done using SPSS.
Conclusions: In summary it can be said that the respondent’s general perception of personalised e-ads is negative; they do not believe that they make shopping easier and they see a danger for their privacy in how companies collect the customer’s information and use it.
ii
Table of Contents
1 Introduction ............................................................................... 1
1.1 Background ............................................................................................ 1
1.2 Problem discussion ................................................................................ 2
1.3 Purpose .................................................................................................. 3
1.4 Perspective ............................................................................................. 3
1.5 Delimitations ........................................................................................... 3
1.6 Definitions ............................................................................................... 3
2 Frame of Reference ................................................................... 4
2.1 E-Advertising .......................................................................................... 5
2.2 E-Personalisation ................................................................................... 7
2.2.1 Personalisation vs. Customisation .......................................................... 7
2.2.2 Highlights on different personalisation approaches ................................ 8
2.2.3 The process of personalisation ............................................................. 11
2.2.4 Values, benefits and costs for customers and marketers ..................... 12
2.3 E-Privacy .............................................................................................. 13
2.4 Gathering and using personal information ............................................ 15
2.5 Online consumer behaviour .................................................................. 17
2.5.1 Customer attitudes towards Internet Advertising .................................. 17
2.5.2 A model of online consumer purchase decision and its process .......... 17
2.6 Research Questions ............................................................................. 19
3 Method ..................................................................................... 20
3.1 Research approach .............................................................................. 20
3.2 Research strategy: quantitative vs. qualitative ..................................... 20
3.2.1 Methods of data collection .................................................................... 21
3.2.2 Planning a Survey ................................................................................ 22
3.2.3 Sample choice ...................................................................................... 22
3.3 Survey design ....................................................................................... 25
3.3.1 Self-completion Questionnaire ............................................................. 25
3.3.2 Survey layout ........................................................................................ 25
3.3.3 Types of questions ............................................................................... 26
3.3.4 Attitude measurement scale ................................................................. 28
3.4 Pilot Study ............................................................................................ 28
3.5 Presentation of the empirical data and analysis ................................... 30
3.6 Generalisability ..................................................................................... 32
3.7 Validity and Reliability ........................................................................... 32
4 Results and analysis ............................................................... 34
4.1 Sample ................................................................................................. 34
4.2 Research question 1: How do different aspects of personalised advertising influence the customer’s concerns for privacy? .................. 34
4.3 Research question 2: How can customers’ awareness of data collection influence the purchasing decision? ....................................... 38
4.4 Research question 3: To what extent are personalised e-ads perceived as helpful for the purchasing decision? ................................ 43
iii
5 Conclusions ............................................................................ 48
6 Discussion ............................................................................... 51
6.1 Managerial implications ........................................................................ 51
6.2 Limitations and suggestions for further research .................................. 52
References ................................................................................... 53
Appendices .................................................................................. 56
Appendix 1 - Glossary ....................................................................................... 56
Appendix 2 - Questionnaire ............................................................................... 58
Appendix 3 - Results from the Survey ............................................................... 60
iv
Table of Figures Figure 2.1 - Theoretical Structure (own model) ................................................... 4
Figure 2.2 - E-Marketing Mix (Karlyanam & McIntyre, 2002) .............................. 6
Figure 2.3 - Example of adaptive personalisation (yahoo.com homepage, 2008)9
Figure 2.4 - Example of transparent personalisation, (Amazon.com homepage, 2008) .................................................................................................... 10
Figure 2.5 - The process of personalisation, Vesanen and Raulas (2006) ........ 11
Figure 2.6 - The benefits and costs of personalisation for the customer and the marketer, (Vesanen, 2007) ................................................................... 12
Figure 2.7 - Dimensions of information privacy (recreated after Harkiolakis, 2007) .................................................................................................... 14
Figure 2.8 - FTC’s Fair Information Practice Principles and the Flow of Online Information (Radin et al., 2007). ........................................................... 16
Figure 2.9 - Model of Online Consumer Behaviour (Laudon & Traver, 2007) ... 18
Figure 2.10 - Online and Offline Communications in the buyer decision process (Laudon & Traver, 2007) ...................................................................... 19
Figure 3.1 - The process of deduction, (Bryman & Bell, 2007) .......................... 20
Figure 3.2 – Steps in survey planning (after Scheaffer et al. 2006)................... 22
Figure 3.3 – Sample Choice (own model) ......................................................... 24
Figure 3.4 – Visualisation of possible relationships between variables in the analysis ................................................................................................ 31
Figure 4.1 – Age distribution of respondents ..................................................... 34
Figure 4.2 – Types of personal information ....................................................... 35
Figure 4.3 – Concern for privacy and age groups ............................................. 36
Figure 4.4 - Concern for privacy and level of studies ........................................ 36
Figure 4.5 – Willingness to reveal personal information .................................... 37
Figure 4.6 – Correlation: “I think it is important to read privacy policies on websites” and “Some websites know too much about me” ................... 38
Figure 4.7 – Respondent’s awareness of personalised e-ads ........................... 39
Figure 4.8 – Crosstabulation: Awareness of collection process and respondent’s gender .................................................................................................. 40
Figure 4.9 – Line diagram: Awareness of collection process and gender ......... 40
Figure 4.11 – Perceived control over the collection process by gender ............ 41
Figure 4.12 – Attitude towards personalised e-ads and purchasing decision .... 43
Figure 4.13 - Correlation: “I often see personalised advertisements on the Internet” and “I would like to see more online advertisements which exactly fit my needs and preferences” .................................................. 44
Figure 4.14 - Correlation: “I like personalised online advertisements because they make shopping easier” and “I would purchase a product online based on a personalised recommendation or advertisement” .............. 45
Figure 4.15 - Correlation table: “I like personalised online advertisements because they make shopping easier” and “I would like to see more online advertisements which exactly fit my needs and preferences”. ... 46
Figure 4.16 – Wish to see more personalised e-ads and level of studies ......... 46
1
1 Introduction
This chapter introduces the chosen area of study by discussing the background and problem of personalised online advertisements and related privacy issues. The resulting purpose is followed by a presentation of the perspective and delimitations of this thesis.
1.1 Background
From our own experience we know that searching for information, communicating with friends as well as other everyday activities is unimaginable without the Internet nowadays. The Internet has had and continues to have a very strong influence on the formation and development of the global information society. As a social phenomenon, the Internet is a global communication tool that provides the exchange of texts, graphics, audio and video files, and access to online services without the territorial and national boundaries. It con-nects 470 million users around the world to each other and to an incredibly large informa-tion repository making it an effective tool for research, communication, the expansion of trade and business. The technological possibilities of the Internet cause a rapid develop-ment of the global information society and let new approaches to business and marketing evolve. The Internet became a useful advertising medium through which companies can promote their products directly to the customer and create value for customers in new and innovative ways. Currently, almost every traditional brick-and-mortar company is also rep-resented on the Internet. A large number of advertising sites, platforms and other resources help the user to find the necessary information online. Thus, the Internet has become an advertising tool, with unique and new features that can compete with the traditional types of advertising (Kotler & Armstrong, 2008).
With a steadily increasing size of the Internet population online shopping is becoming a common experience for consumers around the world. In 2007, more than 50% of consum-ers in the US, the UK, Germany and Sweden had used the Internet for online purchases at least once (eMarketer, 2008). E-commerce digitally enables commercial transactions and is more powerful than any other technology that was used in the past. Laudon and Traver (2007) list seven unique features of e-commerce technology that have significance for busi-ness and distinguish e-commerce from traditional offline business transactions. Among these seven E-commerce technology dimensions is personalisation which is the precise tar-geting and adaptation of advertising messages to match the user’s preferences. The increase in information density enables online merchants to easily collect and store information about the user’s purchasing and click stream behaviour. This information can then be processed and used to target advertisements to specific users (Laudon & Traver, 2007).
From a marketing perspective, personalisation of online advertising is a very promising way of reaching customers and will play an increasingly important role in the future. Personal-isation on the Internet is far more widespread than in the offline world and can cover all online interactions when it comes to the question of what information to personalise. It di-rectly relates to the issue of privacy of personal data and creates a need for a privacy policy that clarifies the relation between personalisation and privacy. A useful privacy policy should provide the possibility to opt-in or opt-out (see Appendix 1) of receiving targeted advertisings and state what information is collected, whether it will be shared with third parties and how it will be used. Personalisation and privacy are closely linked to each other, affect all aspects of online marketing and do not find a counterpiece in the offline market-ing mix. These facts turn them into a topic of high interest that will be further discussed in this thesis (Karlyanam & McIntyre, 2002).
2
1.2 Problem discussion
Recent technological innovations caused the business environment to change and compa-nies to adapt to these new advances. Traditional or standard marketing strategies are not sufficient to cope with the New Economy anymore. Marketers need to develop new tactics and adapt to new ways of communicating with customers and advertising on the Internet, in order to stay competitive. Indeed, using the Internet as an advertising tool represents a competitive advantage for companies due to the growing number of Internet users. Since its creation in the 1990’s, the World Wide Web has changed from a simple communication tool to a certifiable revolutionary technology for marketers (Kotler, 2005). Personalisation represents one of the main advantages of the Internet. Marketers can target individual cus-tomers directly and adapt their marketing communications to the user’s preferences and needs. For marketers, personalisation results in higher prices, satisfied customers, and in-creased differentiation. At the same time, it requires investments in technology and educa-tion.
While many authors praise personalisation on the Internet as a universal solution, others question the very nature of it. They argue that personalisation is about one-to-one relation-ships between human beings and not a human being and a computer. In their opinion, us-ers value the personal experience of shopping including a staff with whom they can be-come acquainted, a local presence or even a flavour that rounds out the experience. These expectations cannot be met online due to the nature of efficiency of e-commerce business models, which do not allow the staff size necessary to personalise every single transaction. It is further argued that due to this fact, what is called “personalisation” in online markets is merely the ultimate of target marketing that goes to the extreme market size of one indi-vidual. There is nothing personal about “personalisation” because the rules-based software does not succeed in identifying the diverse characteristics of users correctly. This may lead to dissatisfaction for customers when they feel that their hopes for personalisation are not fulfilled. These findings can be summarised as follows: “customised target marketing is the best e-commerce can hope to achieve and it’s not their fault” (Monroy, 2000).
Even if personalisation on the Internet is possible nowadays, it is questionable whether it is beneficial for customers. From the customer’s perspective, which will be used throughout this thesis, benefits as well as risks can be identified. Personalisation gives customers access to better service, products and communication and provides an experience of one. It might be helpful and convenient in the purchasing decision process. At the same time, personal-isation is time consuming, might cause extra fees and most importantly represents a risk for customer’s privacy (Vesanen & Raulas, 2007). Internet users are increasingly aware of the fact that websites collect information about them and their privacy concerns are growing. Personal information is necessary for personalising advertisements. Therefore, this devel-opment contradicts the customer’s increased demand for personalisation and the trend to-wards narrowly targeted marketing. Privacy issues related to the Internet and personalisa-tion in particular are a contemporary topic of greatest interest and that is why we decided to research in this field and take a look on the matter from the customer point of view. The following two perspectives on personalised Internet advertising will be subject to our study: First, personalised online advertising is useful for customers and influences the purchasing decision process in a positive way; second, personalised online advertising represents a threat for the customer’s privacy and affects the purchasing decision process negatively.
3
1.3 Purpose
The purpose of this thesis is to explore if personalised online advertising could be per-ceived as a danger to customer’s privacy or on the other hand, facilitate the purchase deci-sion process.
The purpose stated above is narrowed down further with the help of research questions. These research questions are derived from the theoretical framework and can therefore be found in the last section of the frame of reference.
1.4 Perspective
Advertisements on the Internet differ from traditional ways of advertising in the way that they are typically "pulled" by the recipient rather than "pushed" by the sender (Schlosser, Shavitt & Kanfer, 1999). The user often has to actively request further information to be displayed whereas traditional advertising is often received without asking. When a banner is displayed on a website for example, it is for the users to decide if they want to click on it or not. Also, new forms of rich media ads involve the user more and more interactively (Lau-don & Traver, 2007). Cartellieri, Parsons, Rao and Zeisser argued in 1997 that in the future a combination of "pull" and "push" technologies will dominate Internet advertising. Given these facts, it is obvious that users have a high degree of control over the advertisements they are exposed to on the Internet. Therefore we decided to conduct our empirical study from a customer’s perspective. Understanding the customers’ attitude toward the issues of personalisation as well as their privacy concerns is crucial for the success of online market-ing tools. For this reason it is useful to analyse whether the benefits or the risks related to personalisation prevail for customers. We aim to collect empirical data from a customer perspective in order to make the findings available to companies engaged in Internet adver-tising in the form of managerial implications.
1.5 Delimitations
This part is dedicated to the limits of the study. Since this study aims to investigate the cus-tomer perspective and their perception of personalised e-ads as stated above, the technical process of personalisation and the underlying databases and profiling procedures will not be discussed in detail in this thesis. In the same way, we will not go into detail about the le-gal framework regulating personalisation. The fact that there are no universal laws regulat-ing the personalisation of advertisements indicates that this is a complicated and varied is-sue which is not directly relevant for this study and will therefore not be analysed further. Among others, it has to be pointed out that there might be factors other than privacy con-cerns and personalised online advertisements that influence the user’s purchasing decision. These factors are not taken into consideration in this study. Furthermore, this study is lim-ited to a sample of JIBS students and might therefore not be representative for the Internet population in general.
1.6 Definitions
In order to avoid misunderstandings and misinterpretations, a number of important terms, which are used throughout the thesis, need to be defined. An alphabetically arranged glos-sary defining these frequently used terms can be found in Appendix 1. With the help of the glossary, the reader can look up unknown terms at anytime while, before or after reading the thesis.
4
2 Frame of Reference
This chapter provides an overview of research in the areas of e-personalisation, e-privacy and consumer be-haviour and introduces different models which will be used for the analysis of empirical data later on. At the end of this chapter, a specification of the research questions will be presented.
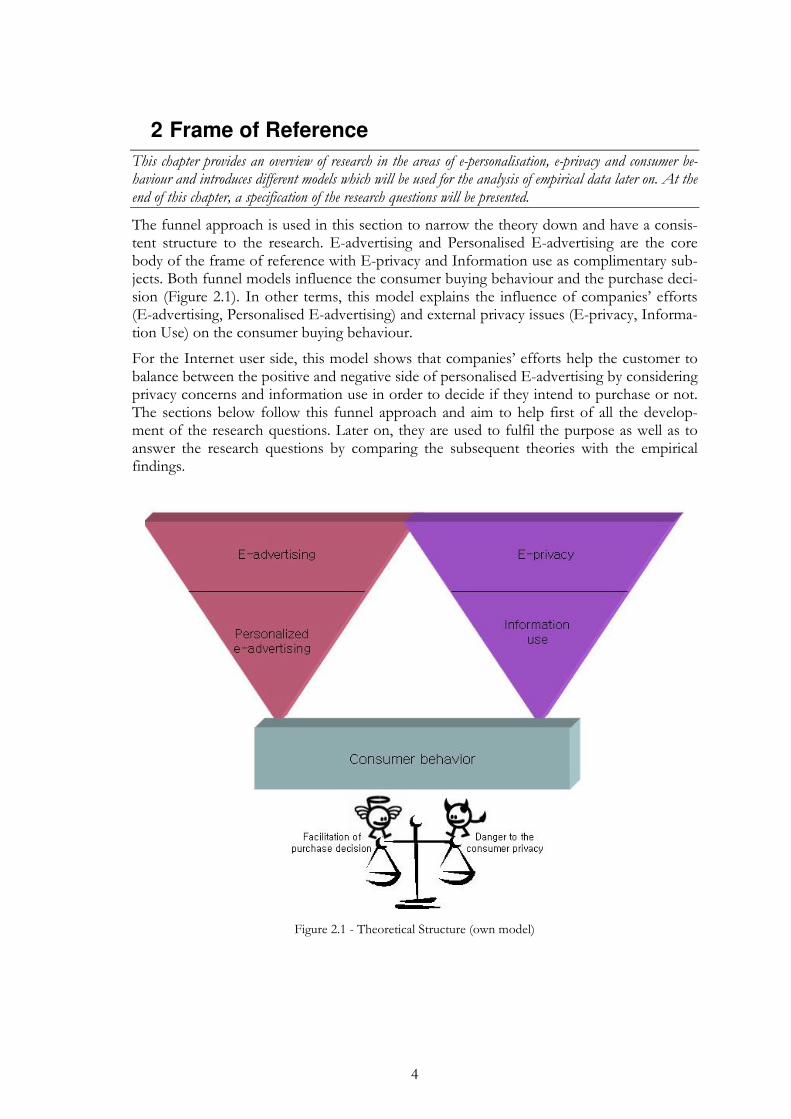
The funnel approach is used in this section to narrow the theory down and have a consis-tent structure to the research. E-advertising and Personalised E-advertising are the core body of the frame of reference with E-privacy and Information use as complimentary sub-jects. Both funnel models influence the consumer buying behaviour and the purchase deci-sion (Figure 2.1). In other terms, this model explains the influence of companies’ efforts (E-advertising, Personalised E-advertising) and external privacy issues (E-privacy, Informa-tion Use) on the consumer buying behaviour.
For the Internet user side, this model shows that companies’ efforts help the customer to balance between the positive and negative side of personalised E-advertising by considering privacy concerns and information use in order to decide if they intend to purchase or not. The sections below follow this funnel approach and aim to help first of all the develop-ment of the research questions. Later on, they are used to fulfil the purpose as well as to answer the research questions by comparing the subsequent theories with the empirical findings.
Figure 2.1 - Theoretical Structure (own model)
5
2.1 E-Advertising
The following paragraphs introduce E-advertising as an increasingly popular form of E-marketing or more precisely direct marketing. The common framework that is presented demonstrates the significance of both personalisation and privacy for the field of E-marketing and thus supports the purpose of this thesis. In the end of this part, different types of personalised advertisements are presented to demonstrate the diversity of person-alised online advertisements and to show where users can be faced with such online ads.
Indeed, the Internet with its diversity and ever developing technologies and services repre-sents a platform for a number of different ways to reach the user. One of them is E-Advertising, an E-Marketing tool which has been flourishing at the same time as the stan-dardisation and democratisation of the Internet. One of the biggest advantages of E-advertising is the possibility to target ads to a specific group of users. Well-targeted ads are a useful tool for companies since they have a greater potential to result in a purchase (Lau-don & Traver, 2007). The trend towards narrowly targeted marketing caused a shift from mass marketing to direct marketing. Customers are increasingly demanding interactive one-to-one relationships and more personal marketing approaches, which pressures companies to change their marketing orientation. As consumers spend more and more time online, companies spend increasing amounts of money on online advertising, a type of direct mar-keting. Direct marketing to individual customers accounted for 48% of total U.S. advertis-ing expenditures in 2007. Spending on online advertising is expected to rise to more than $22 billion by 2009, representing about 11% of direct marketing expenditures. This shows the increasingly important role of online marketing in the marketing mix of companies (Kotler & Armstrong, 2008).
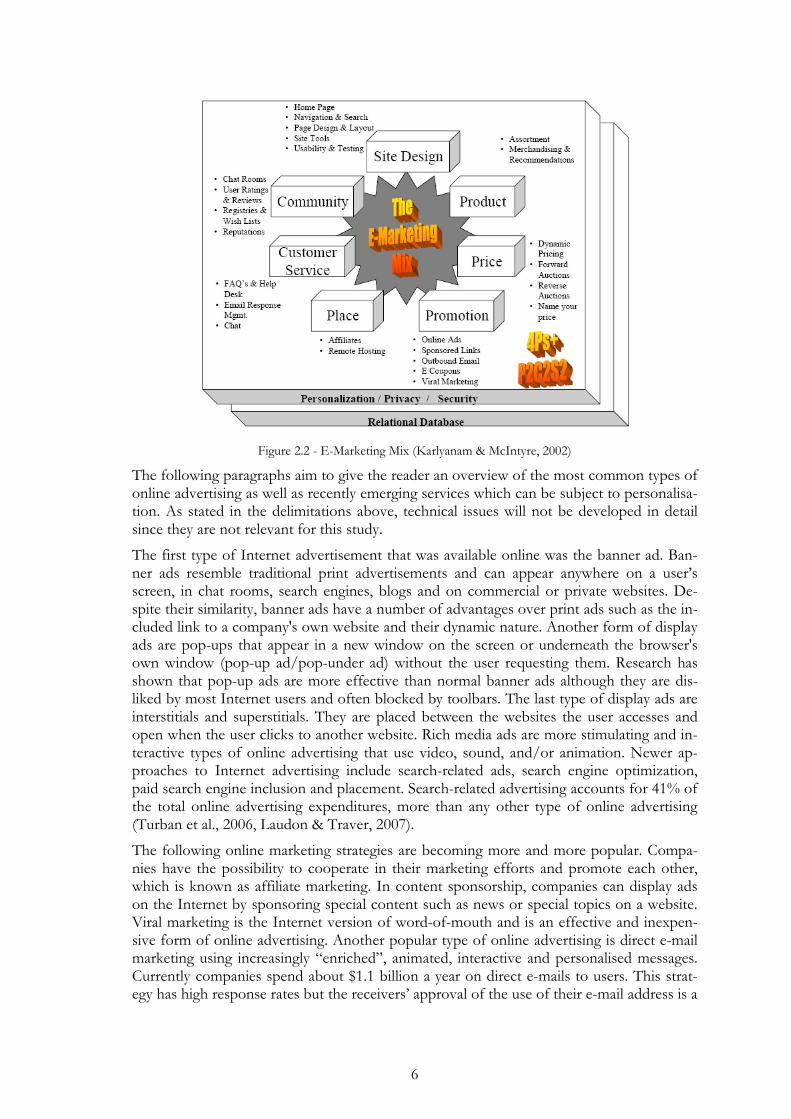
Karlyanam and McIntyre (2002) created a common framework and vocabulary for E-marketing which shows the important role of personalisation and privacy within the field of E-marketing. The authors base their model on the concept of the traditional marketing mix and the 4 Ps introduced by McCarthy (1960). They retain the original 4Ps (Price, Prod-uct, Promotion, and Place) and adjoin six additional elements: Personalisation and Privacy (P²), Customer Service and Community (C²), Security and Site Design (S²). The resulting new E-marketing mix can be described using the formula 4Ps+P²C²S² (Figure 2.2).
It is argued that the 4Ps as well as Site Design, Customer Service and Community should be treated as separate macro-elements in the E-marketing mix. Personalisation and Privacy together with Security then form the foundation of the model, transcending all aspects of E-marketing. They build a policy base to integrate various elements of E-marketing that does not have a counterpart in the traditional offline marketing mix. The transcending na-ture of personalisation and privacy and their position in the foundation of the E-marketing mix shows clearly the significance and importance of these issues for E-marketing and more precisely for E-advertising (Karlyanam & McIntyre, 2002).
6
Figure 2.2 - E-Marketing Mix (Karlyanam & McIntyre, 2002)
The following paragraphs aim to give the reader an overview of the most common types of online advertising as well as recently emerging services which can be subject to personalisa-tion. As stated in the delimitations above, technical issues will not be developed in detail since they are not relevant for this study.
The first type of Internet advertisement that was available online was the banner ad. Ban-ner ads resemble traditional print advertisements and can appear anywhere on a user’s screen, in chat rooms, search engines, blogs and on commercial or private websites. De-spite their similarity, banner ads have a number of advantages over print ads such as the in-cluded link to a company's own website and their dynamic nature. Another form of display ads are pop-ups that appear in a new window on the screen or underneath the browser's own window (pop-up ad/pop-under ad) without the user requesting them. Research has shown that pop-up ads are more effective than normal banner ads although they are dis-liked by most Internet users and often blocked by toolbars. The last type of display ads are interstitials and superstitials. They are placed between the websites the user accesses and open when the user clicks to another website. Rich media ads are more stimulating and in-teractive types of online advertising that use video, sound, and/or animation. Newer ap-proaches to Internet advertising include search-related ads, search engine optimization, paid search engine inclusion and placement. Search-related advertising accounts for 41% of the total online advertising expenditures, more than any other type of online advertising (Turban et al., 2006, Laudon & Traver, 2007).
The following online marketing strategies are becoming more and more popular. Compa-nies have the possibility to cooperate in their marketing efforts and promote each other, which is known as affiliate marketing. In content sponsorship, companies can display ads on the Internet by sponsoring special content such as news or special topics on a website. Viral marketing is the Internet version of word-of-mouth and is an effective and inexpen-sive form of online advertising. Another popular type of online advertising is direct e-mail marketing using increasingly “enriched”, animated, interactive and personalised messages. Currently companies spend about $1.1 billion a year on direct e-mails to users. This strat-egy has high response rates but the receivers’ approval of the use of their e-mail address is a
7
necessary prerequisite. The explosion of spam, unwanted commercial e-mail messages, frustrates many users and has to be kept in mind when dealing with direct e-mail market-ing. Recently emerging features such as video ads, podcasts, personal weblogs (blogs) as well as virtual communities like FaceBook or Myspace open up a number of new opportu-nities and platforms for online advertising and personalisation. (Laudon & Traver, 2007; Kotler & Armstrong, 2008).
This part dealt with the increasing success of e-advertising and the trend towards narrowly targeted markets and one-to-one marketing. In order to help companies implement e-advertising, Karlyanam and McIntyre created an e-marketing model based on the 4p’s and extra elements such as Personalisation, Privacy, etc. Finally, we provided an overview over several types of E-advertisements that could be seen online and subject to personalisation which is explained in more detail in the following section.
2.2 E-Personalisation
“I know you. You tell me what you want. I make it. I remember next time”
(Don Peppers and Martha Rogers, 1997)1
In this section, the key concepts of E-Personalisation are discussed. The first part gives an overview of several contemporary theoretical definitions permitting to distinguish the term Personalisation from Customisation. In the second part an outline of diverse types of Per-sonalisation systems is given. Then, we describe the process of personalisation and the benefits and values for customers and companies in the end.
2.2.1 Personalisation vs. Customisation
Some theorists associate the term ‘Personalisation’ with ‘Customisation’ without differenti-ating the two terms. However, they do not refer to the same strategy and should be clearly defined.
It appears first, important to elucidate what is hidden behind the term “Personalisation”. Personalisation is a specialised form of product differentiation, in which a solution is tailored for a specific individual (Hanson, 2000). In other terms, E-personalisation refers to an adapta-tion of online advertisements to meet customer needs. Amazon.com usually uses this prac-tice when it sends for instance, emails following the e customers’ purchases (books, com-pact disks, etc.) with recommendations for their next purchase. The Personalisation Con-sortium (2005) also defines it as the use of technology and customer information to tailor electronic commerce interactions between a business and each individual customer. Using information either previously obtained or provided in real-time about the customer, the ex-change between the parties is altered to fit the customer’s stated needs as well as needs per-ceived by the business based on the available customer information (Vesanen, 2007). Hence, through e-personalisation, a website can serve as a matchmaker that discovers and delivers personal information to the e-customer. Other theorists have come up with spe-cific definitions of the term “Personalisation” in the last decade. Here is a sample of these definitions:
1 Don Peppers and Martha Rogers, 1997, cited in Paschelke & Roselieb, 2002
8
• Roberts (2003) “The process of preparing an individualised communication for a specific person based on stated or implied preferences”.
• Cöner (2003) “Personalisation is performed by the company and is based on a match of categorized content to profiled users”.
• Rangaswamy (2001) “Personalisation can be initiated by the customer (e.g. cus-tomising the look and contents of a web page) or by the firm (e.g. individual-ized offering, greeting customer by name etc.)”.
• Imhoff et al. (2001) “Personalisation is the ability of a company to recognize and treat its customers as individuals through personal messaging, targeted banner ads, special offers on bills, or other personal transactions”.
• Allen et al. (2001) “Company-driven individualization of customer web experi-ence”.
• Peppers et al. (1999) “Customising some feature of a product or service so that the customer enjoys more convenience, lower cost, or some other benefit”.
Customisation on the other hand, is relatively close to the term Personalisation, but does not exactly refer to the same strategy. Indeed, Customisation is the way to create a product or a service according to the buyer’s specifications (Hanson, 2000). It aims at adapting the product and not the promotion strategy, to the customer’s needs. Even though some economists do not think those two terms should be differentiated, such as Peppers et al. (1999), others have come up with different definitions such as Hanson (2000), Allen et al. (2001), Imhoff et al. (2001), Wind and Rangaswamy (2001), Cöner (2003) or, Roberts (2003). Instead of providing you an inventory of those definitions, it seems more relevant to combine them to provide a complete definition of Customisation that can be used to show the disparity between both terms. First, the user performs customisation as the concept in-cludes individualisation of features such as web contents and so on, by customers. In other terms, regarding to the company’s point of view, it is the process of producing a product, service, or communication to the exact specifications, desires of the purchaser or recipient. Therefore, marketers could use customisation as a business strategy to recast the com-pany’s marketing and customer interfaces to be buyer-centric (Wind & Rangaswamy, 2001).
Thus, the theoretical study has demonstrated that Personalisation and Customisation, even if they are interdependent terms, have some peculiarities showing that the two terms do not refer exactly to the same strategy. It appears though that customisation is a form of personalisation done by the customer that features more in depth individualisation than personalisation (Cöner 2003; Roberts 2003).
2.2.2 Highlights on different personalisation approaches
This part is dealing with the descriptive aspects of E-personalisation such as ways or strate-gies that companies generally use to personalise and advertise at the same time their web-sites. The aim of this section is to give the readers an overview and idea of what is person-alisation and its approaches related to theorists. Therefore, this part will not be compared with the empirical findings.
Many authors, such as W. Hanson (2000) and further, J. Vesanen (2007), have been trying to classify personalisation into different marketing strategies. Personalisation can be cata-logued into several approaches such as Adaptive, Cosmetic, Transparent Personalisation or even Collaborative Customisation. Each strategy has a different position along the axis of product design and representation implications. The most common type of personalisation used
9
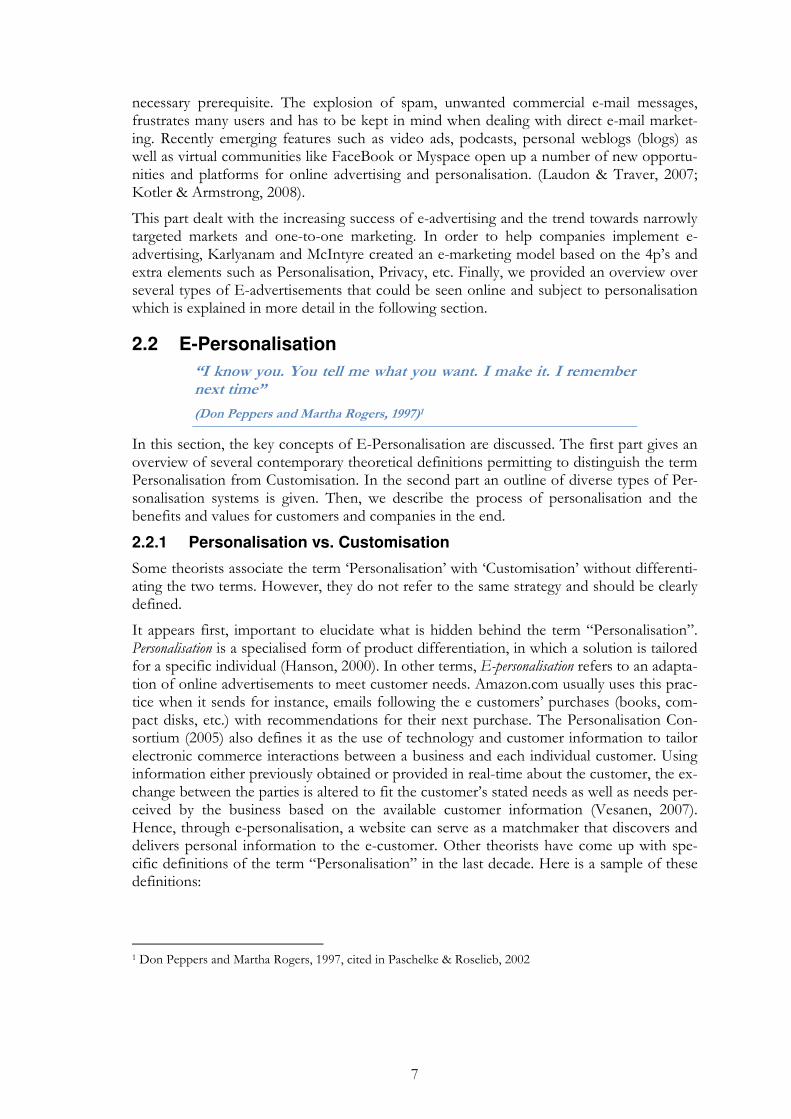
online is the adaptive personalisation which consists of offering the same basic product and representation to everyone but letting users filter out most of the possibilities (Hanson, 2000). Yahoo.com is a relevant example concerning this strategy as it lets customers choose from different options such as colour of the homepage’s wallpaper, and so forth.
Figure 2.3 - Example of adaptive personalisation (yahoo.com homepage, 2008)
While speaking about personalisation, the second approach coming to mind is the Cosmetic Strategy based on taking a standard product and presenting it in a different way. In other terms, cosmetic personalisation consists of keeping the core product, changing the packag-ing, presentation, and other extra components permitting tailoring the product to a specific target group or an individual. This strategy is easy to implement online as it only implies to divide for instance the webpage into different parts such as the heading at the top, the main content of the page, and footer at the bottom. The second step could be to customise each header for each individual while keeping the rest of the content unchanged (Hanson, 2000). A famous illustration of this strategy is Google.com which changes the package of standard goods by collecting information from the customer such as behaviours, age, purchases, and so on. However, this practice is generally relevant on the unique condition that the cus-tomer looks out for the webpage presentation. Moreover, cosmetic personalisation com-pared to the adaptive one does not require a high degree of customer interaction.
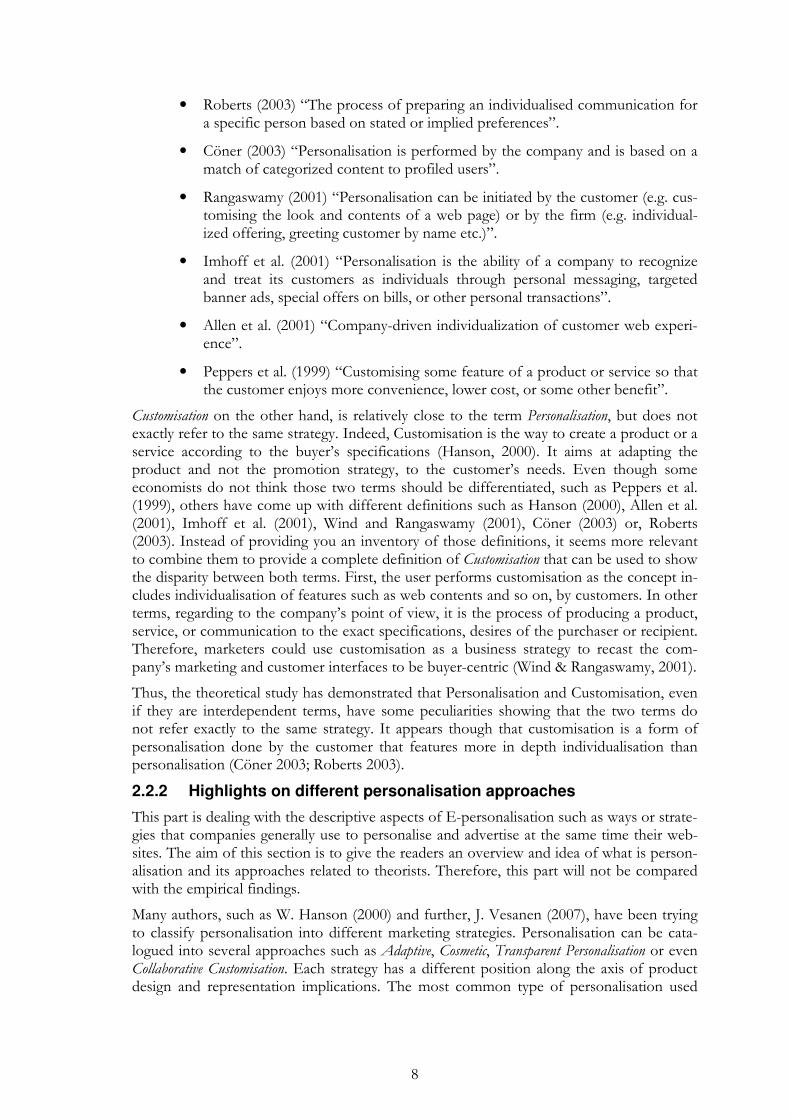
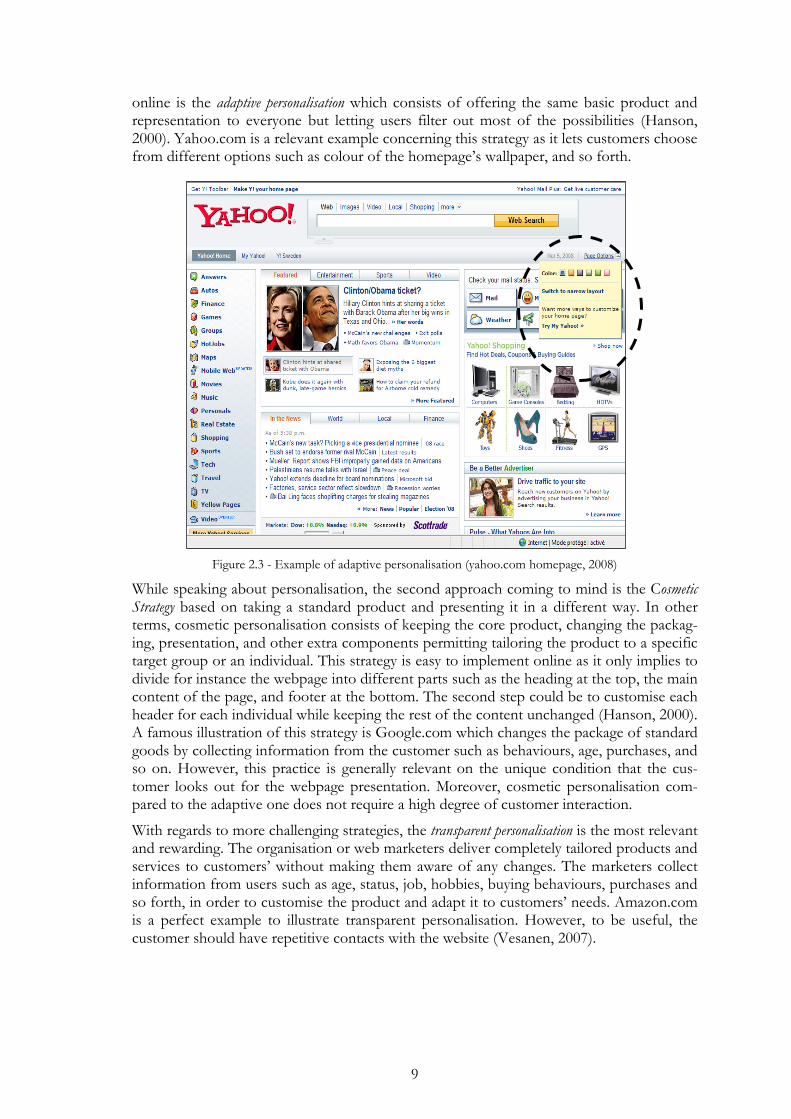
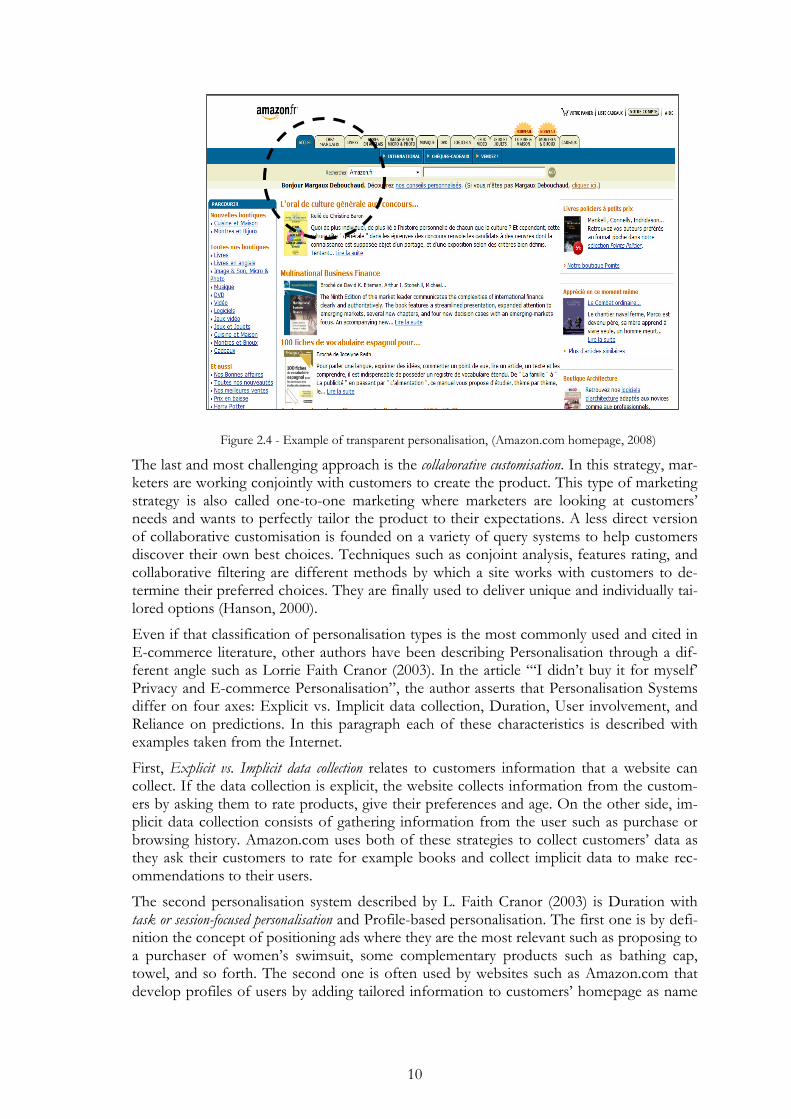
With regards to more challenging strategies, the transparent personalisation is the most relevant and rewarding. The organisation or web marketers deliver completely tailored products and services to customers’ without making them aware of any changes. The marketers collect information from users such as age, status, job, hobbies, buying behaviours, purchases and so forth, in order to customise the product and adapt it to customers’ needs. Amazon.com is a perfect example to illustrate transparent personalisation. However, to be useful, the customer should have repetitive contacts with the website (Vesanen, 2007).
10
Figure 2.4 - Example of transparent personalisation, (Amazon.com homepage, 2008)
The last and most challenging approach is the collaborative customisation. In this strategy, mar-keters are working conjointly with customers to create the product. This type of marketing strategy is also called one-to-one marketing where marketers are looking at customers’ needs and wants to perfectly tailor the product to their expectations. A less direct version of collaborative customisation is founded on a variety of query systems to help customers discover their own best choices. Techniques such as conjoint analysis, features rating, and collaborative filtering are different methods by which a site works with customers to de-termine their preferred choices. They are finally used to deliver unique and individually tai-lored options (Hanson, 2000).
Even if that classification of personalisation types is the most commonly used and cited in E-commerce literature, other authors have been describing Personalisation through a dif-ferent angle such as Lorrie Faith Cranor (2003). In the article “‘I didn’t buy it for myself’ Privacy and E-commerce Personalisation”, the author asserts that Personalisation Systems differ on four axes: Explicit vs. Implicit data collection, Duration, User involvement, and Reliance on predictions. In this paragraph each of these characteristics is described with examples taken from the Internet.
First, Explicit vs. Implicit data collection relates to customers information that a website can collect. If the data collection is explicit, the website collects information from the custom-ers by asking them to rate products, give their preferences and age. On the other side, im-plicit data collection consists of gathering information from the user such as purchase or browsing history. Amazon.com uses both of these strategies to collect customers’ data as they ask their customers to rate for example books and collect implicit data to make rec-ommendations to their users.
The second personalisation system described by L. Faith Cranor (2003) is Duration with task or session-focused personalisation and Profile-based personalisation. The first one is by defi-nition the concept of positioning ads where they are the most relevant such as proposing to a purchaser of women’s swimsuit, some complementary products such as bathing cap, towel, and so forth. The second one is often used by websites such as Amazon.com that develop profiles of users by adding tailored information to customers’ homepage as name
11
or date. Each time users log into the website they can see a page customised to their inter-ests and see their last purchases and orders.
The third personalisation system, User involvement, includes user-initiated and system-initiated personalisation. This strategy has two faces: the first one implies that the user is aware of personalisation and interested in it and the other one, on the contrary, collects and uses in-formation from customers even if they do not request it. However, on the second case, us-ers can sometimes opt-out of personalisation.
The fourth and last personalisation method relies on predictions. The first prediction is based on discovering similar user profiles. For instance, if two individuals give the same rates to some products, the organisation will deduce that both of them have similar preferences and would suggest the same services or products to both users. Regarding the other prediction technique, websites can recommend products to customers that are related to the ones they purchased previously. This technique is frequently used by Amazon.com which sends emails to customers, proposing them for instance, books to buy in the future with a theme or subject related to the one they bought before.
2.2.3 The process of personalisation
When dealing with E-Personalisation process, it is first important to relate it to the E-Targeting strategy which is a significant tool in order to seek customer’s requirements. E-commerce technology permits personalisation to an extent that was unthinkable in tradi-tional offline markets. Online merchants are able to gather more information about their customers and use this information more effectively than ever before. The Internet allows merchants to segment down to the level of the individual. Rich, personalised messages can be used to target an endless number of customer subgroups and precisely fit their needs and wants. This so-called ad-targeting is also the foundation of new information asymmetry and price discrimination whose principle is explained further on in the section 2.4 on “Gathering and using personal information”. It is argued that in general e-commerce tech-nology and online markets succeeded in reducing information asymmetry for all parties in-volved. It is much easier for customers to find information about merchants and products and to compare different offers in online markets.
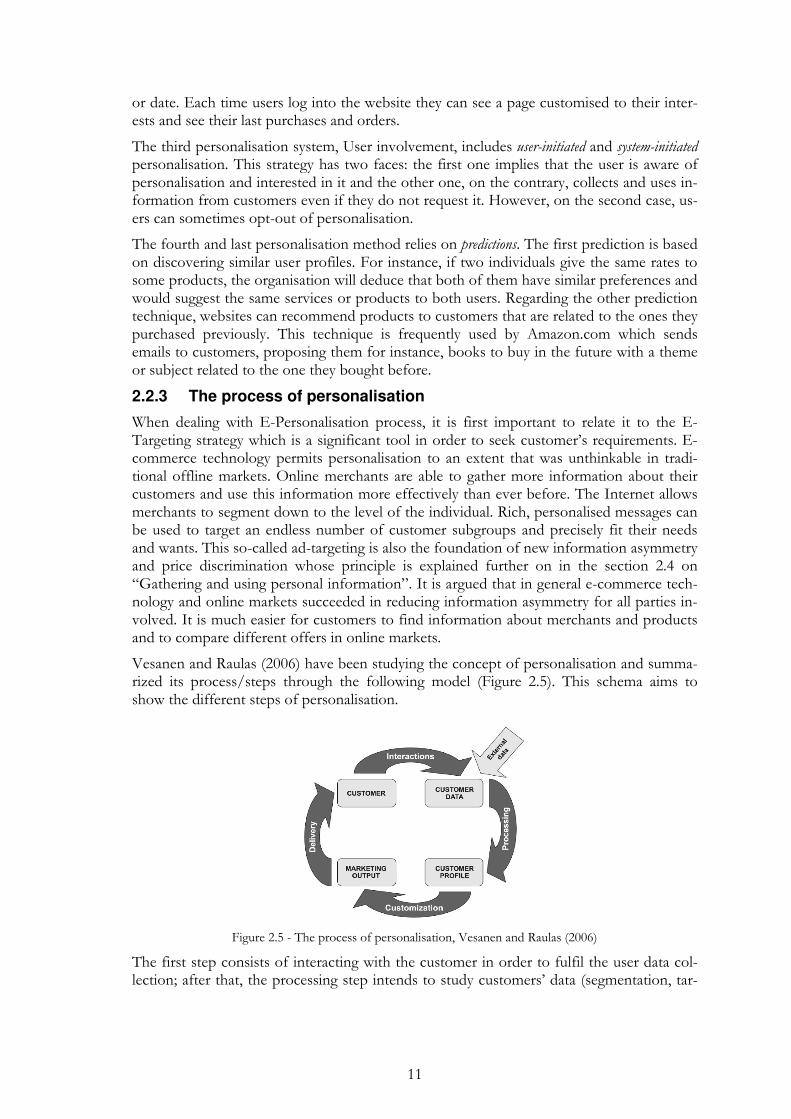
Vesanen and Raulas (2006) have been studying the concept of personalisation and summa-rized its process/steps through the following model (Figure 2.5). This schema aims to show the different steps of personalisation.
Figure 2.5 - The process of personalisation, Vesanen and Raulas (2006)
The first step consists of interacting with the customer in order to fulfil the user data col-lection; after that, the processing step intends to study customers’ data (segmentation, tar-
12
geting, data removal, etc.) with the purpose of categorising the users through profiles and subsequently, personalise the website content to the customer needs (cf. marketing output). The final step of the personalisation process resides in delivering a personalised e-advertising, homepage contents, and so forth that matches customers’ requirements and expectations. Finally, personalisation can be processed within each of the 4P’s: Promotion, Price, Product, and Place. Within this thesis, it is important to notice that we are only fo-cusing on one of the 4P’s: Promotion and not the other variables.
2.2.4 Values, benefits and costs for customers and marketers
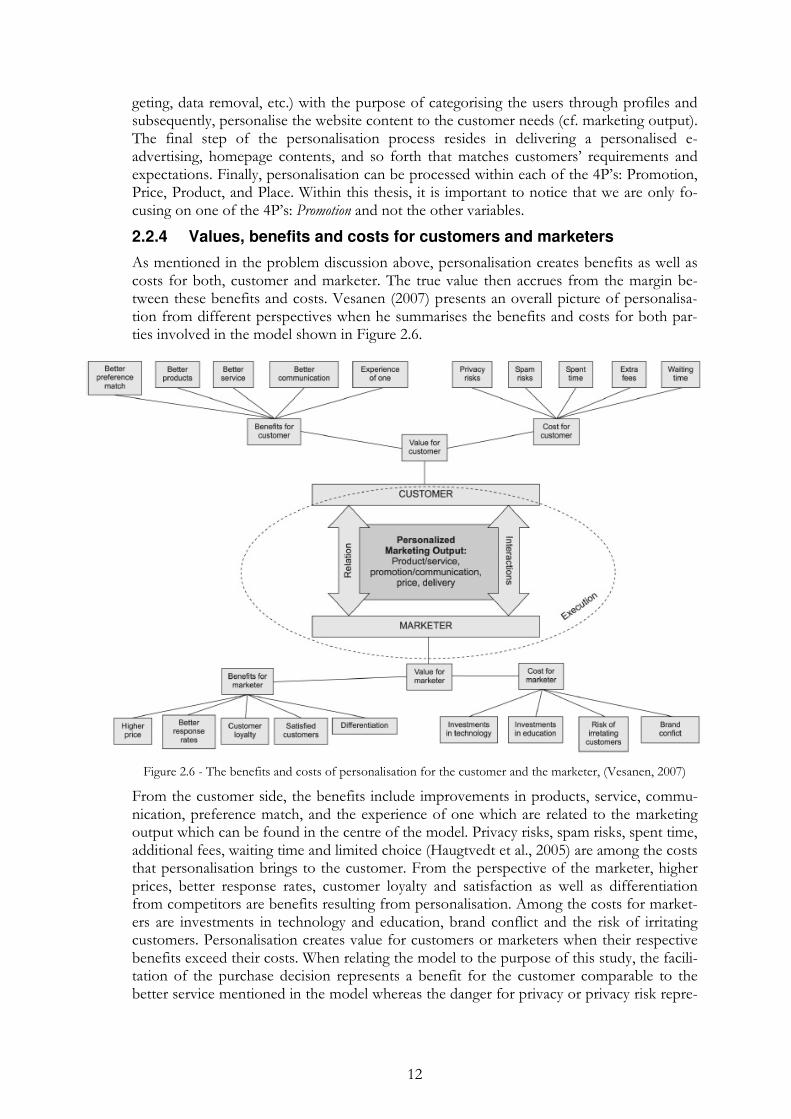
As mentioned in the problem discussion above, personalisation creates benefits as well as costs for both, customer and marketer. The true value then accrues from the margin be-tween these benefits and costs. Vesanen (2007) presents an overall picture of personalisa-tion from different perspectives when he summarises the benefits and costs for both par-ties involved in the model shown in Figure 2.6.
Figure 2.6 - The benefits and costs of personalisation for the customer and the marketer, (Vesanen, 2007)
From the customer side, the benefits include improvements in products, service, commu-nication, preference match, and the experience of one which are related to the marketing output which can be found in the centre of the model. Privacy risks, spam risks, spent time, additional fees, waiting time and limited choice (Haugtvedt et al., 2005) are among the costs that personalisation brings to the customer. From the perspective of the marketer, higher prices, better response rates, customer loyalty and satisfaction as well as differentiation from competitors are benefits resulting from personalisation. Among the costs for market-ers are investments in technology and education, brand conflict and the risk of irritating customers. Personalisation creates value for customers or marketers when their respective benefits exceed their costs. When relating the model to the purpose of this study, the facili-tation of the purchase decision represents a benefit for the customer comparable to the better service mentioned in the model whereas the danger for privacy or privacy risk repre-
13
sents a cost. From the marketer’s perspective, the facilitation of the purchase decision can lead to the benefit of increased customer satisfaction and loyalty while privacy risk is re-lated to the risk of irritating customers (Vesanen, 2007).
In this section, we first differentiated the term “Personalisation” from “Customisation” by looking at other researchers’ approaches and theories. It still seems though that both terms are closely related to each other. In this thesis only the term Personalisation is used to relate to companies’ efforts to adapt e-ads to their customers. In the second part, an outline of different Personalisation systems that companies use to adapt ads to their customers was given. Secondly, we illustrated the process of personalisation consisting of first targeting customers in order to find the right ad which would fit to its requirements, then collecting data and fulfilling personalised ad to each consumer profile. Finally, it has been shown that E-Advertisement could create value and benefits for the customer and the marketer but also involve non-negligible costs which can balance the value for the customer and risk for the customer not to purchase. Danger for Privacy is one of the most significant risks for customers, which could make them refuse to purchase a good if they do not feel at ease with a website or are not willing to reveal certain confidential information. The concern for Privacy is explained in more detail in the following section.
2.3 E-Privacy
“You do a survey and consumers say they are very concerned about their privacy. Then you offer them a discount on a book and they’ll tell you everything.”
(Esther Dyson, 2002)2
In the purpose of the study two different concepts were broached, personalisation and pri-vacy. The first issue was widely discussed in the previous parts; privacy is the matter that is touched upon in the following section. Initially, the definition and main attributes of the privacy are described, further ways of gathering and using personal data are presented and finally, model of fare information flow is explained.
Originally the Internet or World Wide Web was a mean of sharing and exchanging of in-formation between different parties but nowadays it becomes more of a tool for providing services such as e-commerce, e-education or e-entertainment. It is mostly regarded as a positive force as it can facilitate the purchasing process, obliterate the borders between countries and make it possible for each customer to get individualised and unique goods. Consumers can easily compare the prices and quality of goods with the help of various de-vices available on the Internet. From one hand, it enhances the power and choice of the customer, but from the other, it is a threat to their privacy (Edwards, 2003).
The term privacy is mostly defined as the right to act freely and keep thoughts and beliefs to be private from others, and in the era of changing technologies and innovations, in the era of Internet, more and more people are concerned about e-privacy. “E-privacy is an in-dividual’s right to act freely online without being monitored, traced, restricted, and to keep their personal identifiable information (PII) from being collected or distributed to other parties without their consent” (Shata, 2006).
2 Esther Dyson, 2002, cited in Nicoll et al., 2003
14
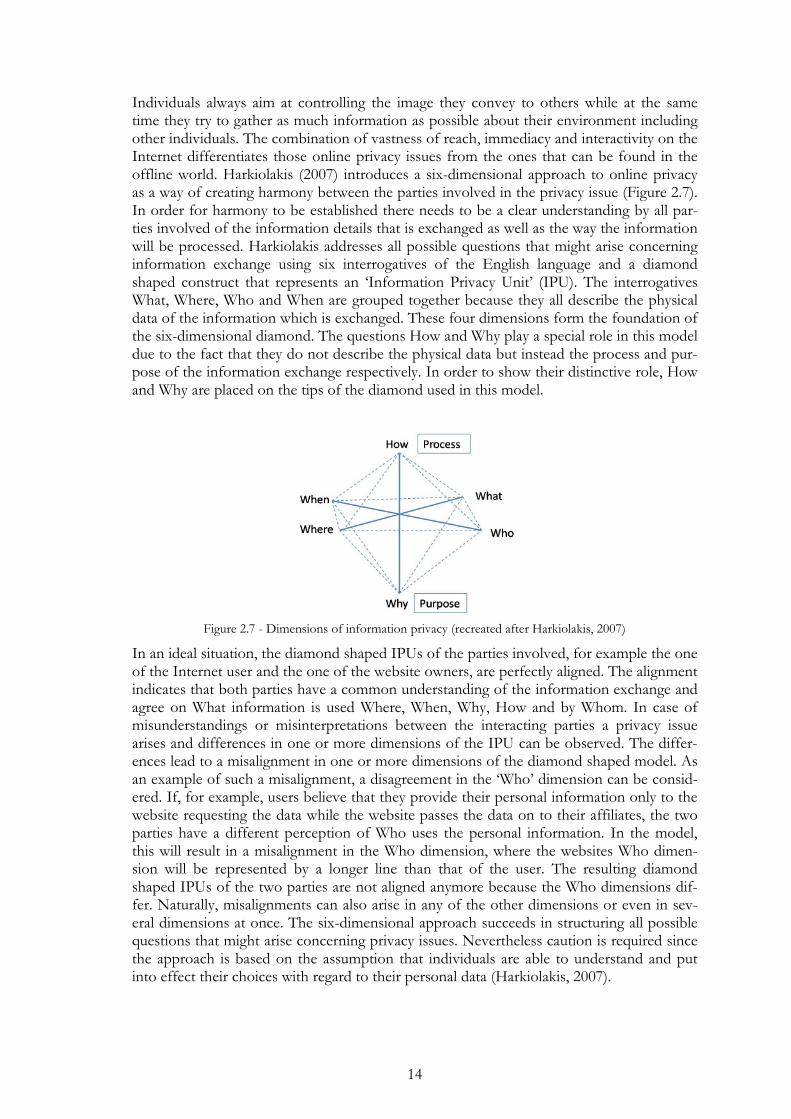
Individuals always aim at controlling the image they convey to others while at the same time they try to gather as much information as possible about their environment including other individuals. The combination of vastness of reach, immediacy and interactivity on the Internet differentiates those online privacy issues from the ones that can be found in the offline world. Harkiolakis (2007) introduces a six-dimensional approach to online privacy as a way of creating harmony between the parties involved in the privacy issue (Figure 2.7). In order for harmony to be established there needs to be a clear understanding by all par-ties involved of the information details that is exchanged as well as the way the information will be processed. Harkiolakis addresses all possible questions that might arise concerning information exchange using six interrogatives of the English language and a diamond shaped construct that represents an ‘Information Privacy Unit’ (IPU). The interrogatives What, Where, Who and When are grouped together because they all describe the physical data of the information which is exchanged. These four dimensions form the foundation of the six-dimensional diamond. The questions How and Why play a special role in this model due to the fact that they do not describe the physical data but instead the process and pur-pose of the information exchange respectively. In order to show their distinctive role, How and Why are placed on the tips of the diamond used in this model.
Figure 2.7 - Dimensions of information privacy (recreated after Harkiolakis, 2007)
In an ideal situation, the diamond shaped IPUs of the parties involved, for example the one of the Internet user and the one of the website owners, are perfectly aligned. The alignment indicates that both parties have a common understanding of the information exchange and agree on What information is used Where, When, Why, How and by Whom. In case of misunderstandings or misinterpretations between the interacting parties a privacy issue arises and differences in one or more dimensions of the IPU can be observed. The differ-ences lead to a misalignment in one or more dimensions of the diamond shaped model. As an example of such a misalignment, a disagreement in the ‘Who’ dimension can be consid-ered. If, for example, users believe that they provide their personal information only to the website requesting the data while the website passes the data on to their affiliates, the two parties have a different perception of Who uses the personal information. In the model, this will result in a misalignment in the Who dimension, where the websites Who dimen-sion will be represented by a longer line than that of the user. The resulting diamond shaped IPUs of the two parties are not aligned anymore because the Who dimensions dif-fer. Naturally, misalignments can also arise in any of the other dimensions or even in sev-eral dimensions at once. The six-dimensional approach succeeds in structuring all possible questions that might arise concerning privacy issues. Nevertheless caution is required since the approach is based on the assumption that individuals are able to understand and put into effect their choices with regard to their personal data (Harkiolakis, 2007).
15
2.4 Gathering and using personal information
The following paragraphs explain how personal information can be collected and used by websites. In addition, the origin of privacy concerns and violation, as mentioned in the purpose, is explained in this part. In the end, the Fair Information Practice Principles are introduced which can companies to prevent such privacy issues from arising.
Different ways of PII information mining can be used by companies. Two categories exist: visible collected data and invisible collected data. The first type is the information that users consciously reveal in particular transactions, that can be some site registration forms or questionnaires that the user can fill in exchange for a free software or a discount. This in-formation is transparent in its collection but consumers are mostly unaware of the way it will be subsequently used (Edwards, 2003). Some organizations use various types of unau-thorized software to track the users of the e-service; the most popular are spy-ware, ad-ware, cookies and online activities trackers. This can be called invisible data collection as in most cases the customers are not aware of their existence. It is questionable to what extent it is ethical and legal to use this type of gathered information. However, some companies claim that they use PII and track the process of surfing the web-sites only for improving the customer service and make new and better suggestions for solving the customer’s prob-lems (O. Shata, 2006).
Many websites collect information about their customers and create profiles. Two different types of profiling exist: anonymous and personal, the difference is in the amount of data collected on the person (Laudon & Traver, 2007). Such profiles help companies like Dou-bleClick to target personalised advertisements to particular customers as they surf on the Internet. But the combination of information from Internet profiles and “real world” cus-tomer information can bring not only an enormous value to the e-commerce companies but an increase in the risk to the privacy of users (Edwards, 2003). That is why nowadays there are a lot of debates concerning the announcement of Google.com about their inten-tion to buy DoubleClick. Many people worry about the amount of information that was separated previously but after merging it can make Google.com a “Big Brother” of the Internet. However, the Google.com spokesman said, “In terms of privacy, we have clear and stringent guidelines about what we do and don't do with user data, and would never do anything to undermine the confidence of web users” (Brooks, 2007).
There are various advantages and disadvantages for the consumer to disclose personal in-formation. The main advantage is that the purchasing process becomes easier, more per-sonalised and efficient. A good example is how Amazon.com uses the previously collected data. It gives the consumers advices about the new items for sale of possible interest based on the information from the previous purchases. It also facilitates the process of filling the information form and combines the orders to save postage (L. Edwards, 2003). However, organizations and individuals providing and using e-services become subject to many po-tential risks and inequalities between them (Shata, 2006). Indeed, for instance, merchants in online markets have deeper knowledge about their customers which makes it possible for them to charge customers different prices for the same products or services. This price dis-crimination represents a new type of information asymmetry. However, there are no exist-ing regulations or laws that can rule the merchants’ behaviour and nowadays, only ethicality of the company can determine to what extent customers’ information will be misused and what criteria are used in market segmentation (Radin, 2007; Rozario, 2005).
Different types of threats exist that are relevant to the Internet. The most common ones are unauthorized intrusion and collection of IP addresses or coping/stealing information. In this paper we want to concentrate more on violating the privacy of e-service users. Shata
16
(2006) distinguishes two types of violation. The reason for the first one is that it can be-come harmful software that collects sensitive information in order to steal or destroy it. The second type of violation is collection of some PII and using it in an inappropriate way or sharing it with the third party. Here arises the clash of opinions between organizations and users of the service. The former see Internet as a public environment and in those who join it should expect to be noticed. The users of the service consider their PII as private and belonging to them and they see revelation of their private information as unauthorized intrusion (Shata, 2006). A good example for this situation can be the FaceBook fiasco. In November 2007 FaceBook.com signed a contract with very well known and popular sites such as Blockbuster, eBay, Coca-Cola, Overstock.com and others. With the help of a Bea-con the information about purchases on these websites could be immediately published in the “mini-feed” section on FaceBook. Most users of this network were unsatisfied with re-vealing their private information as it could damage their image or spoil the surprise for their friends (H. McCracken, 2008).
Information that the company gathers is mostly regarded as a valuable asset but at the same time it can also be a source of delicate legal difficulty, especially in the cases concerning in-dividual privacy. While information increases in value, there arises the necessity in legal re-gime protecting the individual data which balance the individuals, commerce and society at-titudes towards this matter. Personal data can be protected by different laws as intellectual property, trespass to persons, and the interception of communications, however, none of these laws can fully protect the individual right to privacy (Reed C. & Angel J., 2007)
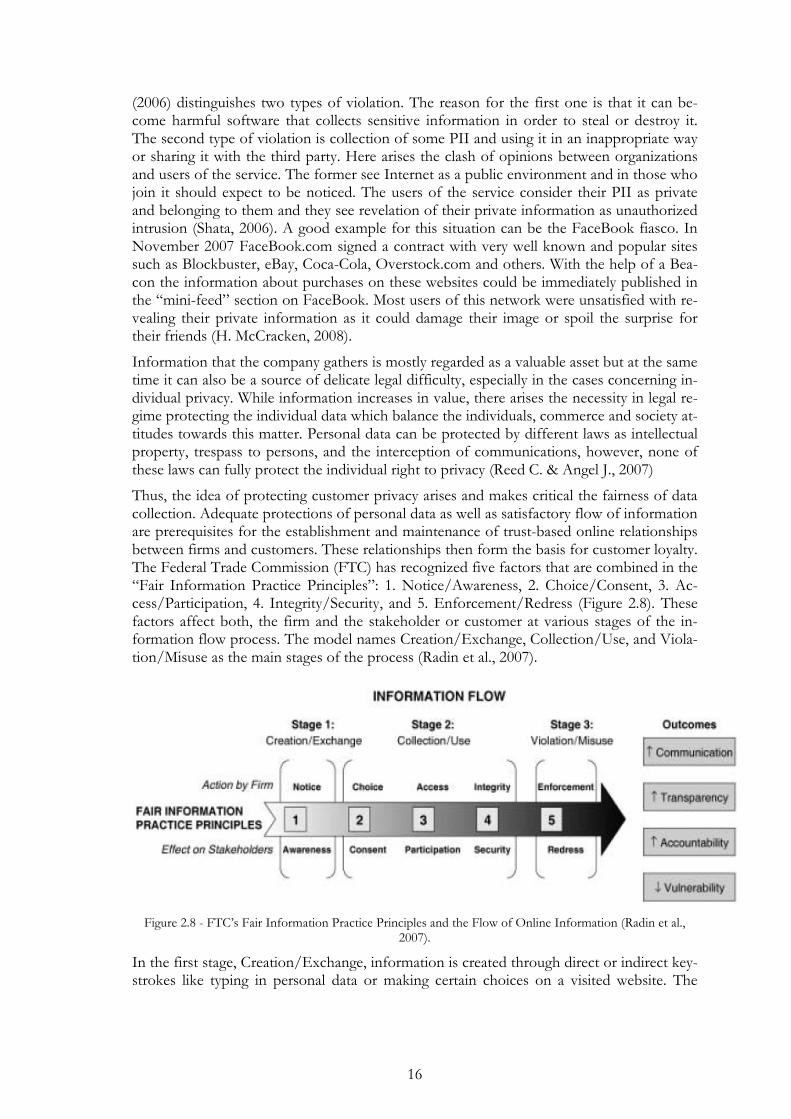
Thus, the idea of protecting customer privacy arises and makes critical the fairness of data collection. Adequate protections of personal data as well as satisfactory flow of information are prerequisites for the establishment and maintenance of trust-based online relationships between firms and customers. These relationships then form the basis for customer loyalty. The Federal Trade Commission (FTC) has recognized five factors that are combined in the “Fair Information Practice Principles”: 1. Notice/Awareness, 2. Choice/Consent, 3. Ac-cess/Participation, 4. Integrity/Security, and 5. Enforcement/Redress (Figure 2.8). These factors affect both, the firm and the stakeholder or customer at various stages of the in-formation flow process. The model names Creation/Exchange, Collection/Use, and Viola-tion/Misuse as the main stages of the process (Radin et al., 2007).
Figure 2.8 - FTC’s Fair Information Practice Principles and the Flow of Online Information (Radin et al., 2007).
In the first stage, Creation/Exchange, information is created through direct or indirect key-strokes like typing in personal data or making certain choices on a visited website. The
17
main concern in this stage is the extent to which the firm gives notice about the personal information that is collected and the degree to which the customer is aware of this process. In the second stage, the concepts of choice, consent, access and participation are empha-sized. They refer to the ability of users to decide how their personal information is used by firms and whether it is shared with third parties. Allowing the user to participate in the process of data collection and use increases the fairness of information practices. Further, firms should preserve integrity of data and provide sufficient security for users. The third stage is concerned with enforcing compliance on firms and giving users the opportunity to seek redress in case of misuse of personal data. With regard to this study, fair information use and notice about data collection decreases the danger for privacy for the customer (Radin et al., 2007).
In summary, it can be said that in order to cope with the lack of security online and fulfil trust from e-consumers, companies need to study customers’ behaviours online and the process of purchase decision in more detail (e.g. where they are looking for information, how do they decide to buy online, etc.). If so, they could prevent some restraints from Internet users to purchase and build up trust and loyalty. The next section is specifically dealing with this subject giving an overview of customer’s attitudes and their process of purchase decision online.
2.5 Online consumer behaviour According to the purpose of this thesis, personalisation and privacy issues should not be examined in isolation. Instead, the influence of these two matters on the purchasing deci-sion is subject of this study. Therefore, customer attitudes towards Internet advertising are discussed in the following before a model of online consumer behaviour is introduced. In the end of this part, the different types of online advertisements that were mentioned above are related to the steps of the buyer decision process to demonstrate how personal-ised advertisements can influence each step of this process.
2.5.1 Customer attitudes towards Internet Advertising
Consumer’s attitude towards advertising is likely to influence their exposure, attention and reaction to advertisements and is therefore worth analysing. Schlosser et al. (1999) com-pared users’ attitudes to Internet advertisements (IA) to those attitudes concerning adver-tising in general (GA) and found that online advertisements are perceived as less intrusive than offline advertisements. Respondents are approximately equally divided between liking IA (38%), disliking IA (35%) and feeling neutral towards IA (28%). Nevertheless more than 50% perceive IA as informative, not insulting, and trustworthy. The authors found that trust contributed only to a small percentage to the overall attitude toward IA and ex-plain this phenomenon by the fact that trust is already included in the behavioural utility of advertising, the use of an ad to make a purchasing decision. The “pull” nature of IA and the user’s control over advertising exposure could explain why users feel less indignant and why they judge IA as being more trustworthy compared to GA. (Schlosser et al., 1999). However, the personalisation of online advertisements raises a number of privacy issues as illustrated above.
2.5.2 A model of online consumer purchase decision and its process
Regarding the consumer purchasing decision process, it appears important to deal with the external and internal factors acting on the customer choice. Laudon and Traver (2007) ex-tended the general model of consumer behaviour by Kotler and Armstrong to better suit the online environment. The purchase decision in the resulting model of online consumer behaviour is shaped by the culture, social norms, psychological factors as well as back-
18
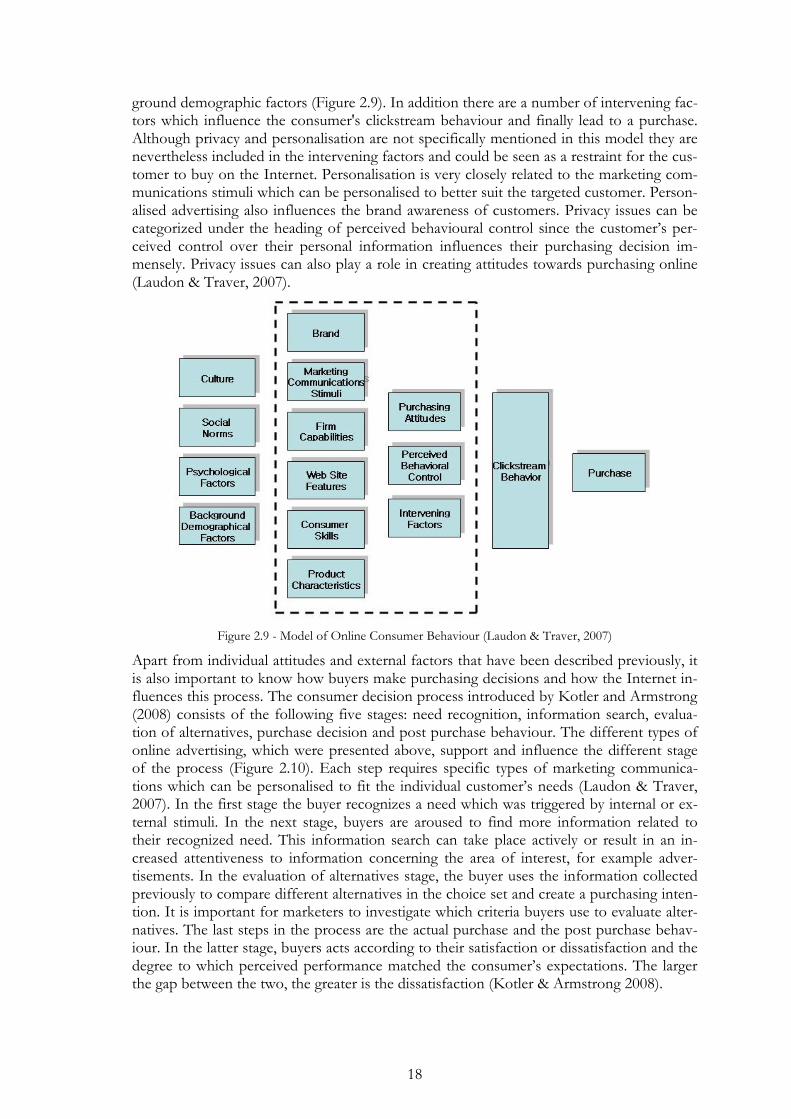
ground demographic factors (Figure 2.9). In addition there are a number of intervening fac-tors which influence the consumer's clickstream behaviour and finally lead to a purchase. Although privacy and personalisation are not specifically mentioned in this model they are nevertheless included in the intervening factors and could be seen as a restraint for the cus-tomer to buy on the Internet. Personalisation is very closely related to the marketing com-munications stimuli which can be personalised to better suit the targeted customer. Person-alised advertising also influences the brand awareness of customers. Privacy issues can be categorized under the heading of perceived behavioural control since the customer’s per-ceived control over their personal information influences their purchasing decision im-mensely. Privacy issues can also play a role in creating attitudes towards purchasing online (Laudon & Traver, 2007).
Figure 2.9 - Model of Online Consumer Behaviour (Laudon & Traver, 2007)
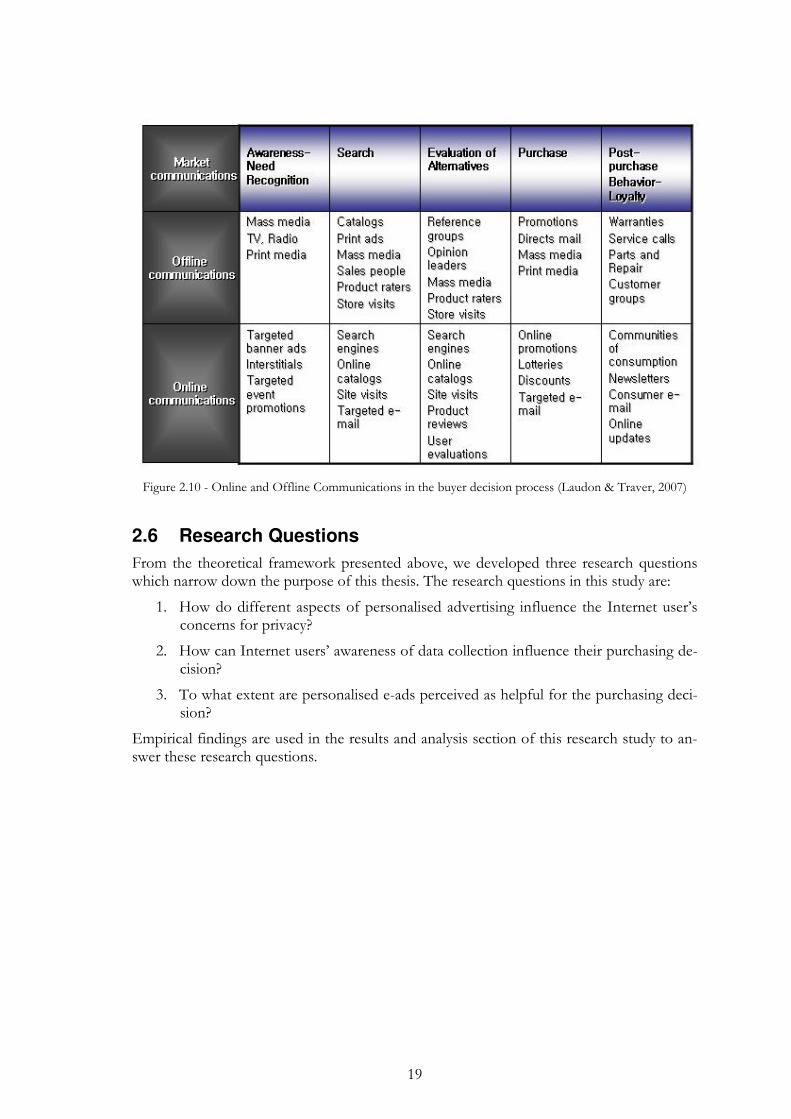
Apart from individual attitudes and external factors that have been described previously, it is also important to know how buyers make purchasing decisions and how the Internet in-fluences this process. The consumer decision process introduced by Kotler and Armstrong (2008) consists of the following five stages: need recognition, information search, evalua-tion of alternatives, purchase decision and post purchase behaviour. The different types of online advertising, which were presented above, support and influence the different stage of the process (Figure 2.10). Each step requires specific types of marketing communica-tions which can be personalised to fit the individual customer’s needs (Laudon & Traver, 2007). In the first stage the buyer recognizes a need which was triggered by internal or ex-ternal stimuli. In the next stage, buyers are aroused to find more information related to their recognized need. This information search can take place actively or result in an in-creased attentiveness to information concerning the area of interest, for example adver-tisements. In the evaluation of alternatives stage, the buyer uses the information collected previously to compare different alternatives in the choice set and create a purchasing inten-tion. It is important for marketers to investigate which criteria buyers use to evaluate alter-natives. The last steps in the process are the actual purchase and the post purchase behav-iour. In the latter stage, buyers acts according to their satisfaction or dissatisfaction and the degree to which perceived performance matched the consumer’s expectations. The larger the gap between the two, the greater is the dissatisfaction (Kotler & Armstrong 2008).
19
Figure 2.10 - Online and Offline Communications in the buyer decision process (Laudon & Traver, 2007)
2.6 Research Questions
From the theoretical framework presented above, we developed three research questions which narrow down the purpose of this thesis. The research questions in this study are:
1. How do different aspects of personalised advertising influence the Internet user’s concerns for privacy?
2. How can Internet users’ awareness of data collection influence their purchasing de-cision?
3. To what extent are personalised e-ads perceived as helpful for the purchasing deci-sion?
Empirical findings are used in the results and analysis section of this research study to an-swer these research questions.
20
3 Method
This Chapter describes the methods selected to collect and analyse empirical data in order to fulfil the pur-pose and answer the research questions.
3.1 Research approach
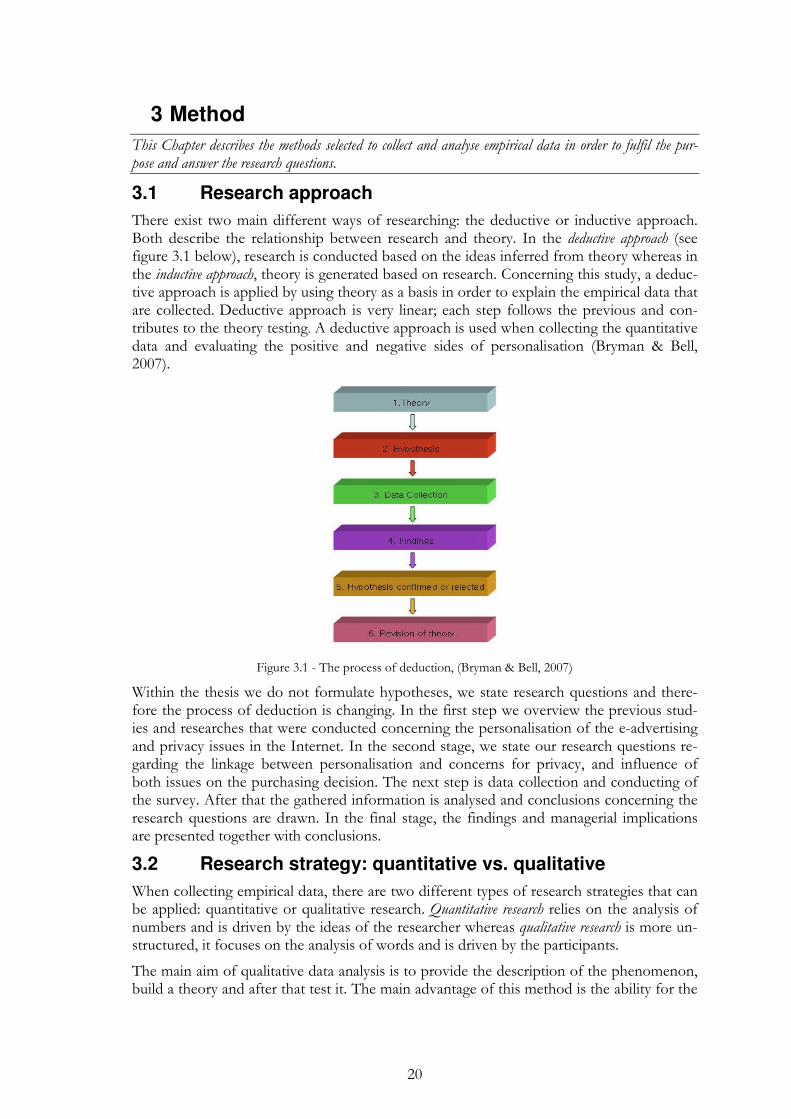
There exist two main different ways of researching: the deductive or inductive approach. Both describe the relationship between research and theory. In the deductive approach (see figure 3.1 below), research is conducted based on the ideas inferred from theory whereas in the inductive approach, theory is generated based on research. Concerning this study, a deduc-tive approach is applied by using theory as a basis in order to explain the empirical data that are collected. Deductive approach is very linear; each step follows the previous and con-tributes to the theory testing. A deductive approach is used when collecting the quantitative data and evaluating the positive and negative sides of personalisation (Bryman & Bell, 2007).
Figure 3.1 - The process of deduction, (Bryman & Bell, 2007)
Within the thesis we do not formulate hypotheses, we state research questions and there-fore the process of deduction is changing. In the first step we overview the previous stud-ies and researches that were conducted concerning the personalisation of the e-advertising and privacy issues in the Internet. In the second stage, we state our research questions re-garding the linkage between personalisation and concerns for privacy, and influence of both issues on the purchasing decision. The next step is data collection and conducting of the survey. After that the gathered information is analysed and conclusions concerning the research questions are drawn. In the final stage, the findings and managerial implications are presented together with conclusions.
3.2 Research strategy: quantitative vs. qualitative
When collecting empirical data, there are two different types of research strategies that can be applied: quantitative or qualitative research. Quantitative research relies on the analysis of numbers and is driven by the ideas of the researcher whereas qualitative research is more un-structured, it focuses on the analysis of words and is driven by the participants.
The main aim of qualitative data analysis is to provide the description of the phenomenon, build a theory and after that test it. The main advantage of this method is the ability for the
21
researcher to discover new variables and relationships, to disclose and comprehend com-plex processes, and to describe the influence of the social context (Shah S.K. & Corley K.G., 2006).
The main aim of the quantitative research strategy is to collect data from different re-sponses and subsequently measure their response. The main issues of the quantitative re-search strategy are the use of formal measurement, the use of many observations, and the use of statistical analysis techniques. Quantitative analysis gives the statistically approved evidences concerning the phenomenon or the relation between several variables, well de-fined analysis tools make research easier to communicate. This method of strategy in terms of generalisability and objectivity is always superior to a qualitative approach. However, at the same time several disadvantages exist associated with the quantitative research. First of all, even if this approach is considered to be objective, still a lot of subjectivity is involved. Moreover, the uncertainty of the relevance of the research findings and theoretical con-cepts can be considered as a drawback of the quantitative method. And in comparison with the qualitative research it does not give the deep understanding of the phenomenon and in-formation is more standardised (Davidsson P., 1997).
It was decided to conduct a quantitative research to evaluate to what degree E-personalisation could be intrusive into customers’ privacy or helpful for the customer, and how both these issues affect the purchasing decision. This was done by interviewing JIBS student through surveys. As we needed to estimate opinions from many interviewees, it appeared that a quantitative research was the best alternative compared to qualitative re-search. Data can then be analysed statistically in order to answer the research questions. The survey addresses all issues mentioned in the purpose and the research questions. Fur-ther, it aims to analyse the relationship between personalisation, privacy concerns and the purchasing decision as stated in the purpose and it also considers the issues of awareness of personalised e-advertisements and the factors influencing the customer’s privacy concern according to the research questions.
3.2.1 Methods of data collection
When conducting a research, there are two different types of data that could be collected: Primary and Secondary data. Both can be independent or complementary. The secondary data already exists and has been collected before, not particularly for the same purpose (articles, books, data basis, etc.). A special type of secondary data is verbal data, in order to analyse this data a content analysis is used. The primary data are those collected specifically for re-search from the examined sample or population. Data collection procedures that are used to generate primary data are surveys or experiments. Concerning this study, the empirical data collected are primary data (Davidsson P., 1997).
In our research we use a survey in order to collect the empirical data. The main purpose of surveys is to provide information about the views of people and their motives and evalua-tions of social phenomena. As these views, motives and phenomena are objects of the re-search, surveys give the necessary information about them. The significance of surveys is growing, if there is no sufficient documented information about phenomenon and if it is not accessible by direct observation or experiment. In such situations, a survey could be-come a major method of gathering information. Data collected from the survey are subjec-tive views of the respondents; they should be compared with objective information gath-ered by other researches to be more relevant and trustworthy. There are a variety of meth-ods for survey data collection. The most common is questionnaire but it can also be inter-views, postal, telephone, fax, and other expert surveys. A survey should be preceded by the development of a research program, a clear definition of goals, objectives, concepts (cate-
22
gories of analysis), hypotheses object and subject, as well as sampling and research tools. Every survey suggests an orderly set of issues (questionnaire), servant to the goal of the study, addressing his goals, and the proof or disproof of its hypotheses.
3.2.2 Planning a Survey
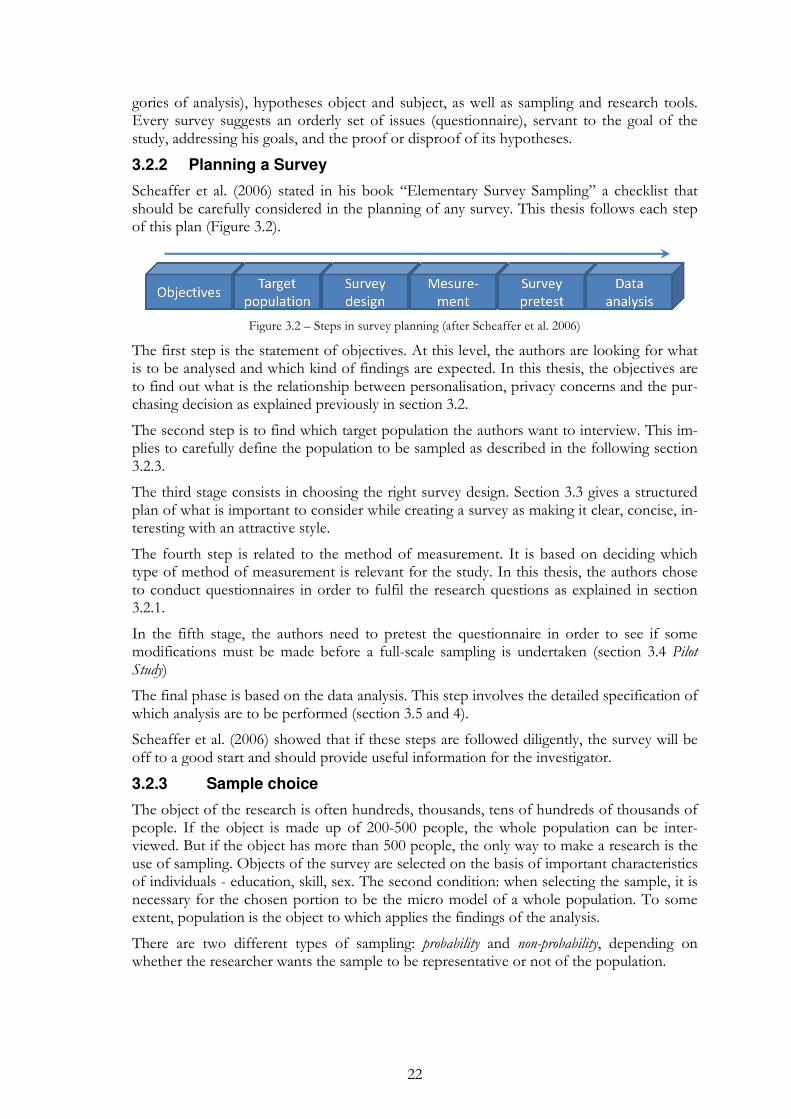
Scheaffer et al. (2006) stated in his book “Elementary Survey Sampling” a checklist that should be carefully considered in the planning of any survey. This thesis follows each step of this plan (Figure 3.2).
Figure 3.2 – Steps in survey planning (after Scheaffer et al. 2006)
The first step is the statement of objectives. At this level, the authors are looking for what is to be analysed and which kind of findings are expected. In this thesis, the objectives are to find out what is the relationship between personalisation, privacy concerns and the pur-chasing decision as explained previously in section 3.2.
The second step is to find which target population the authors want to interview. This im-plies to carefully define the population to be sampled as described in the following section 3.2.3.
The third stage consists in choosing the right survey design. Section 3.3 gives a structured plan of what is important to consider while creating a survey as making it clear, concise, in-teresting with an attractive style.
The fourth step is related to the method of measurement. It is based on deciding which type of method of measurement is relevant for the study. In this thesis, the authors chose to conduct questionnaires in order to fulfil the research questions as explained in section 3.2.1.
In the fifth stage, the authors need to pretest the questionnaire in order to see if some modifications must be made before a full-scale sampling is undertaken (section 3.4 Pilot Study)
The final phase is based on the data analysis. This step involves the detailed specification of which analysis are to be performed (section 3.5 and 4).
Scheaffer et al. (2006) showed that if these steps are followed diligently, the survey will be off to a good start and should provide useful information for the investigator.
3.2.3 Sample choice
The object of the research is often hundreds, thousands, tens of hundreds of thousands of people. If the object is made up of 200-500 people, the whole population can be inter-viewed. But if the object has more than 500 people, the only way to make a research is the use of sampling. Objects of the survey are selected on the basis of important characteristics of individuals - education, skill, sex. The second condition: when selecting the sample, it is necessary for the chosen portion to be the micro model of a whole population. To some extent, population is the object to which applies the findings of the analysis.
There are two different types of sampling: probability and non-probability, depending on whether the researcher wants the sample to be representative or not of the population.
23
Among the probability sample the most common example is simple random sample. The main characteristics of a simple random sample is that members of the population can be se-lected one at a time, independent of one another and without replacement; once it is se-lected it cannot be selected anymore. The respondents are chosen from the list of the whole population with the help of the random number generator (Fowler F., 2002).
Another type of probability sample is systematic sampling. This method is similar to the ran-dom sample but the respondents are chosen by the system, for example each 20th in the list. The interval between the chosen people is a step of selection (Bryman, 2001).
Unlike the simple random and systematic sample where the selection of the individuals, is independent and unaffected by any selections made before, stratified sample where the re-searcher beforehand divided the population into several subgroups and after that choose the respondents from each group independently. Usually stratified sample is appropriate to the different departments in the company or different geographical regions (Fowler F., 2002).
There is one more type of probability sample which is called cluster sampling. In the first phase, usually the geographical region is chosen, after that a city, district, specific company, if the research concerns the business field. This is a good technique in order to reduce the costs of the research as the other types could be very costly for this type of data collection but at the same time there is no guarantee that the company that was chosen at the end re-flect the diverse range of industrial activities that are in the whole region (population) (Bryman & Bell, 2007).
Among non-probability sample there are two main sampling techniques: convenience sample and judgment sample. By drawing convenience sample, the researcher selects those respondents who are easier to reach. In making a judgment sample the researcher contacts those re-spondents that are seen to be the most interesting and valuable to acquire information from. Both of these types are very subjective and it can affect the outcomes of the research findings (Davidsson P., 1997).
In our thesis we use simple random probability sampling as all JIBS students have the same probability to participate in the survey, however we do not have a list of their names and we do not use random number generator. Therefore, the sample has been drawn by ran-domization to ensure that there is no sampling bias. Indeed, we met the students on cam-pus in places with a high density of JIBS students at the given time, for example at the en-trance of the JIBS building, during lunch and coffee breaks in class rooms and the cafeteria and at different university events (International Day, Yearbook Photo Session). First, it was made sure that the potential respondents were JIBS students and if so, they were asked to participate in the survey by filling in the paper questionnaire and returning it immediately after. Students were provided with a pen and the questionnaire which was printed on both sides of one sheet of paper. The atmosphere in which the survey was conducted can be de-scribed as informal since it took place during the student’s spare time at school and not during lectures or set up interviews. The researchers did not have a fixed table or booth but moved around the university building while conducting the survey. It is also worth men-tioning, that the survey was conducted on several days during the period of approximately one week. In total, 152 students participated in the survey.
The target group for the empirical study in this thesis consists of students studying at Jönköping International Business School (JIBS). The following reasons led to the decision to draw a sample from this group;
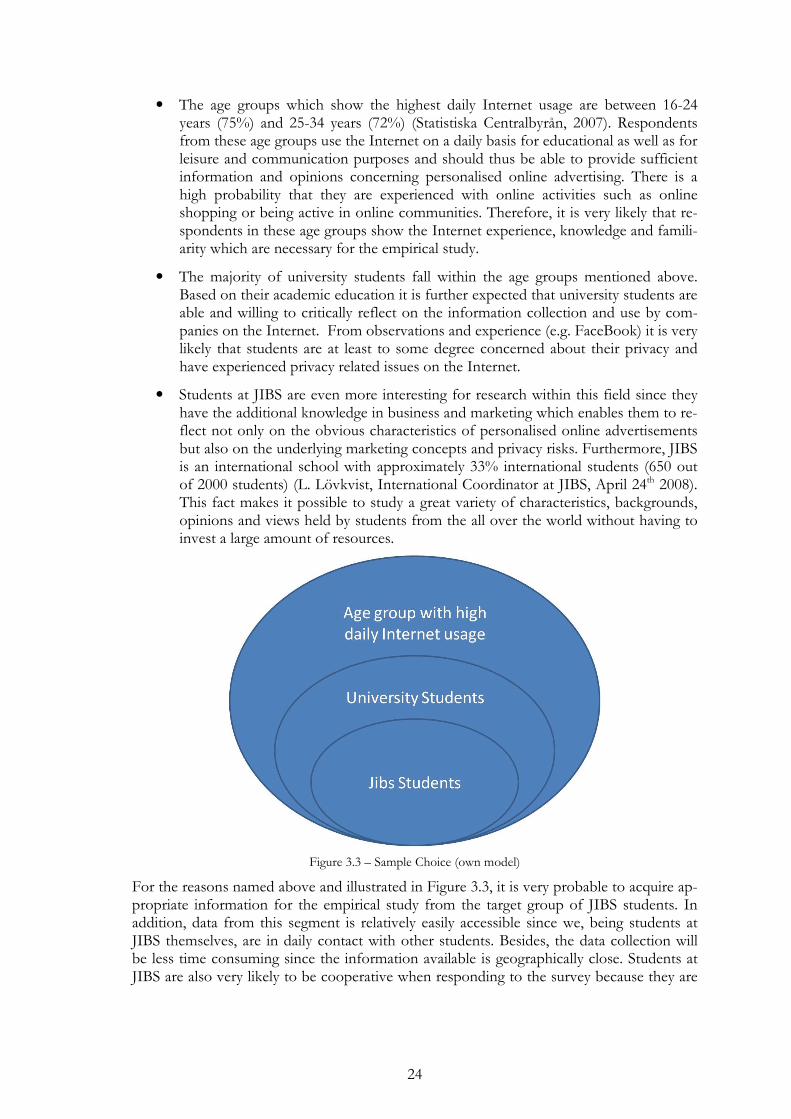
24
• The age groups which show the highest daily Internet usage are between 16-24 years (75%) and 25-34 years (72%) (Statistiska Centralbyrån, 2007). Respondents from these age groups use the Internet on a daily basis for educational as well as for leisure and communication purposes and should thus be able to provide sufficient information and opinions concerning personalised online advertising. There is a high probability that they are experienced with online activities such as online shopping or being active in online communities. Therefore, it is very likely that re-spondents in these age groups show the Internet experience, knowledge and famili-arity which are necessary for the empirical study.
• The majority of university students fall within the age groups mentioned above. Based on their academic education it is further expected that university students are able and willing to critically reflect on the information collection and use by com-panies on the Internet. From observations and experience (e.g. FaceBook) it is very likely that students are at least to some degree concerned about their privacy and have experienced privacy related issues on the Internet.
• Students at JIBS are even more interesting for research within this field since they have the additional knowledge in business and marketing which enables them to re-flect not only on the obvious characteristics of personalised online advertisements but also on the underlying marketing concepts and privacy risks. Furthermore, JIBS is an international school with approximately 33% international students (650 out of 2000 students) (L. Lövkvist, International Coordinator at JIBS, April 24th 2008). This fact makes it possible to study a great variety of characteristics, backgrounds, opinions and views held by students from the all over the world without having to invest a large amount of resources.
Figure 3.3 – Sample Choice (own model)
For the reasons named above and illustrated in Figure 3.3, it is very probable to acquire ap-propriate information for the empirical study from the target group of JIBS students. In addition, data from this segment is relatively easily accessible since we, being students at JIBS themselves, are in daily contact with other students. Besides, the data collection will be less time consuming since the information available is geographically close. Students at JIBS are also very likely to be cooperative when responding to the survey because they are
25
used to empirical studies within projects and might have needed or need help themselves with a survey for past or future courses.
3.3 Survey design
3.3.1 Self-completion Questionnaire
For the empirical study, a self-completion or self-administered questionnaire is used. This type of questionnaire requires the respondents to complete the survey by themselves and has sev-eral advantages over structured interviews. The main advantages of self-administered ques-tionnaires are, that they are relatively inexpensive and quick to administer, they provide the respondent with the convenience of completing the questionnaire at their own speed and the results are not influenced by interviewers. Compared to interviews, self-administered questionnaires also have a number of disadvantages among them, the lack of prompting and probing, ‘respondent fatigue’, risk of missing data and the fact that the questionnaire can be read as a whole. It was decided to use a self-administered questionnaire in this re-search study, because the advantages related to this approach outweigh the disadvantages compared to interviews. This decision was heavily influenced by time and resource con-straints. The disadvantages of a self-administered questionnaire which were mentioned above are minimized in the following way. Concerning the lack of prompting, the questions and instructions are given as clear and unambiguous as possible and we were present at the time of the completion of the questionnaire in case misunderstandings or difficulties arose. Probing respondents to elaborate upon answer is not possible in self-administered ques-tionnaire but does not pose a problem for this research study because it applies almost en-tirely to open questions which are not used in this survey. By keeping the questionnaire relatively short and dividing it into a number of sections the issue of ‘respondent fatigue’ has been addressed. In addition, the length of the questionnaire has been tested in a pilot study. The risk of missing data resulting from only partially answered questionnaires cannot be completely avoided. Nevertheless, we tried to minimize this effect by supervising the re-spondents when completing the questionnaires and checking the questionnaires for com-pleteness when collecting them. The last disadvantage mentioned above is the possibility of reading the whole questionnaire before answering questions and the risk that questions might not be answered in the intended order and can never be completely prevented when administering a self-completion questionnaire. In order to make sure that the questions are answered in the right order, extensive supervision would be necessary which would offset the advantage of cheap administration mentioned above (Bryman & Bell, 2007).
3.3.2 Survey layout
Scheaffer et al. (2006) stated that one objective of any survey is to minimize the non-sampling errors that may arise. As for that, the survey authors should be careful when cre-ating the questionnaire. A well-designed survey is the first step in order to reduce non-responses.
The success of a survey depends heavily on the appearance of the questionnaire and the understandability and ease of answering the questions (Brace, 2004). Brace (2004) mention the paper and printing quality, the use of colour and a clear statement of the title and re-searchers conducting the study as ways of making a questionnaire more attractive. Due to limited funds, no colour was used in the survey. However, we used different tools to make the questionnaire attractive. According to Bryman (2001), the following concerns should be considered when designing and laying out the questionnaire. Firstly, it is important not to cramp the questionnaire. Although it is very common to make the questionnaire appear shorter by cutting margins and/or space between questions, research has shown that these
26
tactics make a questionnaire less attractive whereas a good layout is likely to increase re-sponse rates. It is also helpful to divide the questions into sections with a clear heading to make the flow of the questionnaire easier to follow and give the respondent a sense of achievement after the completion of a section (Brace, 2004). The questionnaire used in this survey (Appendix 2) starts with general questions about the respondent followed by the sections Awareness (Part 1), Personalisation (Part 2), Privacy (Part 3), and Purchasing De-cision (Part 4). Secondly, the presentation should be as clear and understandable as possible and one general printing style should be used consistently. Nevertheless, using different printing styles for instructions, questions and answers can be helpful for the respondent. In the questionnaire for this study, the instructions were printed in italics while key words were printed in bold to set them apart from the normal text. Thirdly, it has to be decided whether the answers to closed questions are presented horizontally, as in this study, or ver-tically. Fourthly, clear instructions about how to respond to questions and mark answers have to be provided. It has to be made clear whether the answer has to be ticked or circled and how many answers can be chosen. This information was provided in the instructions in the questionnaire. Both Bryman and Bell (2007) and Brace (2004) mention the simple and obvious importance of keeping questions and answers together and not to allow ques-tions to go over two pages. The survey used in this study consisted of two pages printed on one sheet of paper. In order to avoid confusion, it was made sure that questions do not go over two pages and the text “Please turn to the next page!” was included (Bryman, 2001; Bry-man & Bell, 2007).
Scheaffer et al. (2006) also stated in their book “Elementary Survey Sampling” that some other major concerns in questionnaire construction need to be taken into consideration, such as the question ordering, or the wording of questions. “Question ordering” is rather impor-tant when designing a survey. Order is important in the relative positioning of specific ver-sus general questions. In this thesis, we have been grouping the question within themes which are classified from the general information to the more specific ones in order to make questions more relevant and logical as explained in the previous paragraph (Brace, 2004). An attitude survey has been conducted. A list of simple choices, such as strongly disagree, disagree, neither agree nor disagree, agree, strongly agree has been provided to the respondents avoiding the use of “don’t know” as an alternative as it could be interpreted in two ways and is too vague. It seems that when alternatives are listed first, they tend to re-ceive the highest frequency of response. This literally means that the proportion who an-swer “strongly disagree” will tend to be higher when that option is a first choice rather than a fifth choice. Therefore, the order of possible choices (answers) is as important as the po-sition of a question. We are aware of that and tried to see during the pilot study if this could be representative or not. Choice of words within a question is also strongly impor-tant as it could influence the interviewees’ response and opinion. Therefore, the answers cannot be relevant and the matter of reliability is put in jeopardy. Words employed in the questions should be easy to understand in order to avoid problems with non-responses. Regarding this thesis, we took it into consideration when creating the survey and chose specific questions, narrow and not too vague, with simple words and verbs in order to cope with response errors. Responses can always contain some errors. However, a careful ques-tioning can reduce these errors to a point at which the results are still useful (Scheaffer et al. 2006).
3.3.3 Types of questions
Depending on the purpose of the study and the type of data that is used, different types of questions can be asked in a questionnaire. Questions can be classified in the following cate-gories:
27
• Open or closed questions, depending on whether or not the answer can come from only a finite number of possible choices (Brace, 2004). Open questions do not provide a range of possible answers from which the respondent can chose. Instead, the re-spondents are expected to answer open questions in their own words. The answers to open questions can vary from just one word to longer texts. In contrast, closed questions provide a predictable and small set of possible answers the respondent can choose from (Fowler, 2002). Closed questions do not only include questions that can be answered with ‘yes’ or ‘no’ but also ones where the respondent can choose from several different alternative answers. In research, closed questions are often used because the respondent or the interviewer only has to circle the selected answer from the given set (Brace, 2004). Closed questions allow the respondent to answer the questions more reliably and the researcher to interpret the meaning of the answers more consistently when response alternatives are given (Fowler, 2002). A questionnaire with closed questions is easy to administer, makes the data entry easier and is usually relatively inexpensive (Brace, 2004).
• Spontaneous or prompted questions, depending on whether respondents are asked to an-swer in their own words or choose from a number of possible answers. Spontane-ous question reveal what is front-of-mind and do not give a set of possible answers to choose from. They are used if researchers want to collect data in the respon-dent’s own words or if they do not know what the answers to their questions are likely to be. Spontaneous questions can be either open or closed depending on the importance of a verbatim answer and whether likely answers are known or not. Since most people have difficulties articulating everything they know or feel, prompting or providing a set of possible answers is a good way of testing what re-spondents know or recognize. It is important to mention that in self-completion paper surveys, respondents can read through the whole survey before answering the questions and therefore, any list of possible answers can act as a prompt to any other question. For this reason, spontaneous and prompted questions on the same subject cannot be asked in one self-completion paper survey (Brace, 2004).
• Open-ended or pre-coded questions, referring to whether responses are recorded verbatim or pre-coded. Open-ended questions are open questions where the answer is re-corded verbatim whereas pre-coded questions provide a coded list of possible an-swers (Brace, 2004).
• Exclusion and screening questions aim to identify whether the respondents belong to the research population of the study. An exclusion question is usually the first question of the questionnaire and excludes respondents from certain industries or business fields, for example market research or journalism in order to protect the confidenti-ality and security of the survey content. Screening questions usually follow the ex-clusion question and test whether the respondent is eligible for the survey and part of the population studied. Including these types of questions in the beginning of the questionnaire saves the researchers time and resources.
In this thesis, neither exclusion nor screening questions are used because by administering the survey in the JIBS building it is almost certain that the respondents belong to the re-search population of JIBS students. According to Groves et al. (2004), closed questions are used in this study to measure attitudes since open-ended ones would be very difficult to code (Groves et al., 2004). Also, the questions in this survey are prompted and pre-coded except for the question concerning the respondent’s age and the last response alternative to
28
the last question (“other ___________”) which allow the respondents to express their an-swer in a number or their own words respectively.
3.3.4 Attitude measurement scale
The measurement of attitudes is more challenging than the one of behaviour. According to Brace (2004), it is relatively easy for respondents to answer questions concerning past be-haviour whereas they frequently need help to express their answers to questions concerning feelings, attitudes and perceptions. Itemized rating scales offer this help in an easy and straightforward way by providing a scale of prompts or dimensions the respondent can choose from. Likert scales also known as ‘agree-disagree’ scales, were introduced by Rensis Likert in 1932. They provide the respondent with a number of attitude dimensions that have to be rated on a five-point scale with the positions ranging from disagree strongly to agree strongly. Each response can then be given a score from negative to positive, 1 to 5, or from -2 to +2 with the 0 as the neutral middle option. This technique is easy to adminis-ter and is therefore often used in self-administered questionnaires. It is very common to use balanced scales when asking the respondents about their attitude. This implies that there are equal numbers of positive and negative attitudes to choose from. If the scale is not balanced and has for example more positive attitudes listed, the total number of posi-tive answers to this question is likely to be higher than for a balanced scale. The number of points on the scale should be carefully considered subject to the degree of distinction be-tween the points, the type of survey and attributes like the additional paper space in self-administered questionnaires. Another important decision concerns even or odd numbers of points on the scale. Even-number scales force the respondent in one direction whereas odd-number scales also provide a neutral option in the middle of the scale (Brace, 2004).
In this study, a balanced five-point Likert scale is used in the questionnaire because it pro-vides sufficient discrimination and can at the same time easily be understood by respon-dents. An odd-number scale gives respondents the possibility to give a neutral answer. Groves et al. (2004) advise researchers to include such middle options unless there is a compelling reason not to do so. This is useful and maybe even necessary since not all re-spondents might have enough experience in all areas that are subject to the survey. Never-theless, it has to be kept in mind that including a neutral response possibility increases the number of neutral answers given. When using a Likert scale, researchers have to be aware of the following issues. The order effect refers to the tendency of participants to select re-sponses on the left rather than on the right side of the scale whereas central tendency ex-presses the reluctance of respondents to choose extreme answers. Acquiescence describes the bias to agree rather than disagree with a statement. Finally, pattern answering can be a sign of boredom or fatigue and occurs when a respondent starts to tick boxes in a certain pattern. To avoid this phenomenon, Brace suggests including positive as well as negative statements in the questions so that the respondent has to carefully read the question in order to under-stand the dimensions and give reliable answers (Brace, 2004). Therefore, negative statement questions are included in this questionnaire. Concerning the order of questions, Brace (2004) argues that questions concerning behaviour should precede those concerning atti-tude to give the respondent the chance to assess his behaviour and clarify it through his at-titude. Consequently, the only behavioural question of this survey is the first question fol-lowing the questions about the respondent’s personal information.
3.4 Pilot Study
Even the most experienced researchers rarely succeed in creating a perfect questionnaire at first attempt. Especially for self-administered questionnaires, it is vital to thoroughly pre-test the questionnaires because the interviewers might have difficulties to clear up confu-
29
sion and solve problems that might arise for every single respondent (Bryman & Bell, 2007; Fowler, 2002). Revising, testing and improving the questionnaire is essential before launch-ing a large-scale study and failing to go through these processes presents a serious danger for the success of the study (Brace, 2004). Conducting a pilot study is also a way to increase validity and reliability of the study (Davidsson, 1997). According to Brace (2004), Bryman and Bell (2007) and Fowler (2002), a pilot study helps the researchers to address the follow-ing issues:
• Do the respondents understand the questions and are able to answer them?
• Are the instructions in the survey understandable?
• Do some questions make the respondent feel uncomfortable?
• Is the order of questions logical?
• Do the responses provide sufficient discrimination?
• How long does it take to complete the survey?
• Have mistakes been made?
For this study, the pilot study can be subdivided into three stages. In the first stage, four in-formal pilots with accompanying interviews were carried out with JIBS students who are colleagues of the researchers. This first pilot sample consisted of one female and three male students. Two of the students were English native speakers in order to reveal any spelling or grammatical mistakes. Informal pilots are usually carried out with a number of col-leagues who meet the eligibility criteria for the study. Brace (2004) states two or three as a sufficient number of pilots that should be conducted by the questionnaire writers them-selves because they have the best knowledge of their work. After having asked a number of eligible respondents to complete the survey, the questions and responses can be discussed in an accompanying interview (Brace 2004). This is necessary since problems concerning comprehension and difficulties that occur while answering the questions are less evident in self-administered questionnaires (Fowler, 2002).
Among the changes that were made on the survey, following the first stage of the pilot study, were:
• Shortening of the introductory text,
• Including the expected completion time of three minutes (average completion time of the pilot respondents) in the introductory text,
• Changing the word order in the Likert scale from ‘disagree strongly’ and ‘agree strongly’ to ‘strongly disagree’ and ‘strongly agree’,
• Rephrasing of the statements 4., 12., and 13. to make them more understandable.
After having modified the questionnaire, it was presented to the thesis supervisor and the opposition groups. The feedback from this second stage was then implemented in the questionnaire and included:
• Rewording of statements 5., 11., 12., and 13. and the introductory text,
• Changing of the titles for the subparts from ‘Awareness’, ‘Personalisation’, ‘Privacy’ and ‘Purchasing Decision’ to ‘Part 1’, ‘Part 2’, ‘Part 3’ and ‘Part 4’,
• Moving the researcher’s names to the end of the survey,
• Modifying the layout.
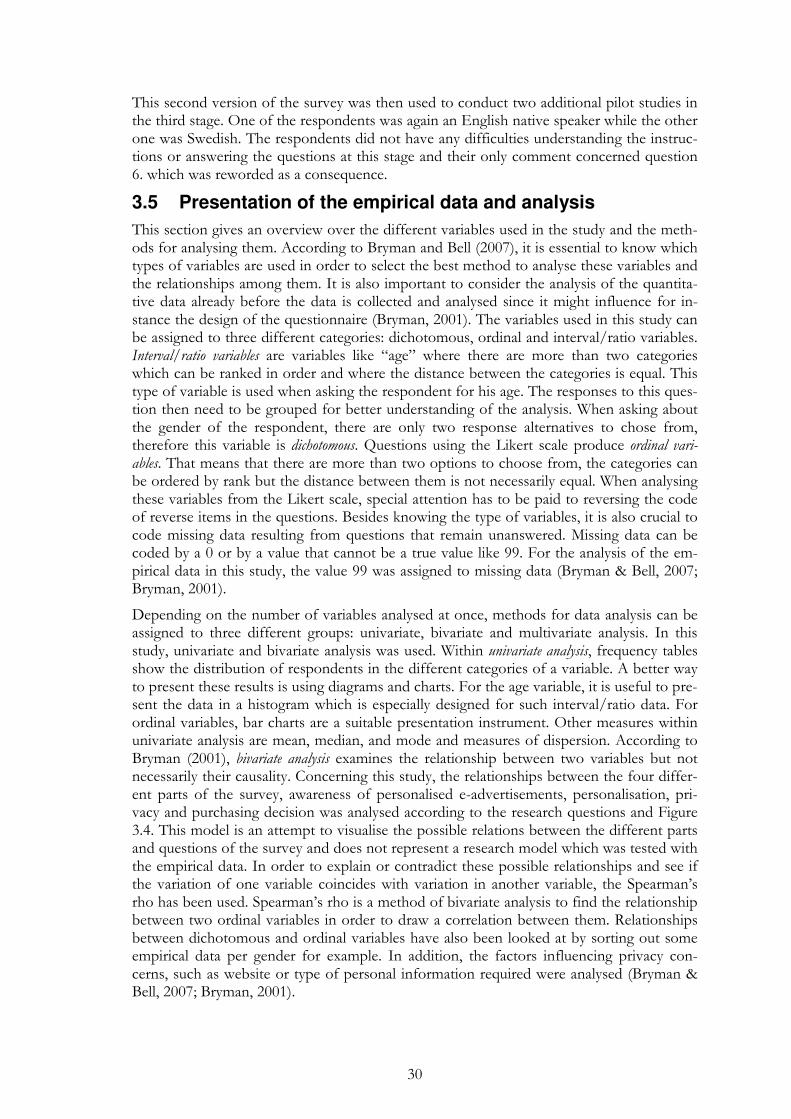
30
This second version of the survey was then used to conduct two additional pilot studies in the third stage. One of the respondents was again an English native speaker while the other one was Swedish. The respondents did not have any difficulties understanding the instruc-tions or answering the questions at this stage and their only comment concerned question 6. which was reworded as a consequence.
3.5 Presentation of the empirical data and analysis
This section gives an overview over the different variables used in the study and the meth-ods for analysing them. According to Bryman and Bell (2007), it is essential to know which types of variables are used in order to select the best method to analyse these variables and the relationships among them. It is also important to consider the analysis of the quantita-tive data already before the data is collected and analysed since it might influence for in-stance the design of the questionnaire (Bryman, 2001). The variables used in this study can be assigned to three different categories: dichotomous, ordinal and interval/ratio variables. Interval/ratio variables are variables like “age” where there are more than two categories which can be ranked in order and where the distance between the categories is equal. This type of variable is used when asking the respondent for his age. The responses to this ques-tion then need to be grouped for better understanding of the analysis. When asking about the gender of the respondent, there are only two response alternatives to chose from, therefore this variable is dichotomous. Questions using the Likert scale produce ordinal vari-ables. That means that there are more than two options to choose from, the categories can be ordered by rank but the distance between them is not necessarily equal. When analysing these variables from the Likert scale, special attention has to be paid to reversing the code of reverse items in the questions. Besides knowing the type of variables, it is also crucial to code missing data resulting from questions that remain unanswered. Missing data can be coded by a 0 or by a value that cannot be a true value like 99. For the analysis of the em-pirical data in this study, the value 99 was assigned to missing data (Bryman & Bell, 2007; Bryman, 2001).
Depending on the number of variables analysed at once, methods for data analysis can be assigned to three different groups: univariate, bivariate and multivariate analysis. In this study, univariate and bivariate analysis was used. Within univariate analysis, frequency tables show the distribution of respondents in the different categories of a variable. A better way to present these results is using diagrams and charts. For the age variable, it is useful to pre-sent the data in a histogram which is especially designed for such interval/ratio data. For ordinal variables, bar charts are a suitable presentation instrument. Other measures within univariate analysis are mean, median, and mode and measures of dispersion. According to Bryman (2001), bivariate analysis examines the relationship between two variables but not necessarily their causality. Concerning this study, the relationships between the four differ-ent parts of the survey, awareness of personalised e-advertisements, personalisation, pri-vacy and purchasing decision was analysed according to the research questions and Figure 3.4. This model is an attempt to visualise the possible relations between the different parts and questions of the survey and does not represent a research model which was tested with the empirical data. In order to explain or contradict these possible relationships and see if the variation of one variable coincides with variation in another variable, the Spearman’s rho has been used. Spearman’s rho is a method of bivariate analysis to find the relationship between two ordinal variables in order to draw a correlation between them. Relationships between dichotomous and ordinal variables have also been looked at by sorting out some empirical data per gender for example. In addition, the factors influencing privacy con-cerns, such as website or type of personal information required were analysed (Bryman & Bell, 2007; Bryman, 2001).
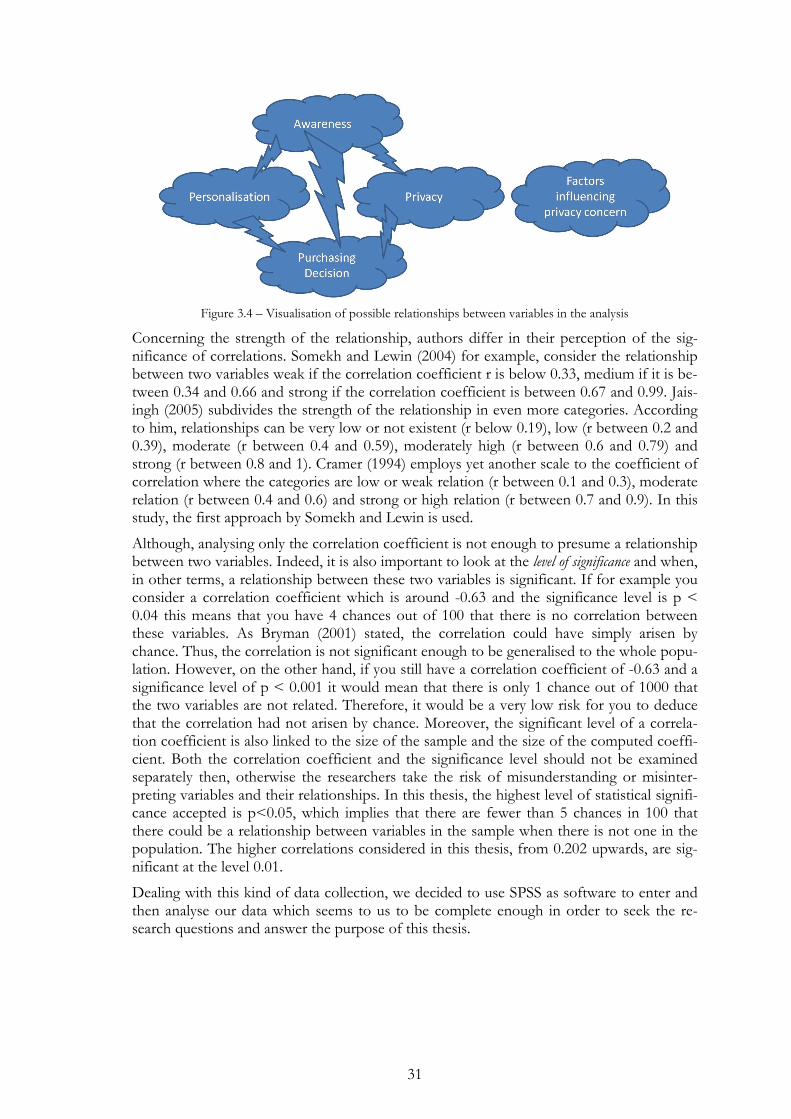
31
Figure 3.4 – Visualisation of possible relationships between variables in the analysis
Concerning the strength of the relationship, authors differ in their perception of the sig-nificance of correlations. Somekh and Lewin (2004) for example, consider the relationship between two variables weak if the correlation coefficient r is below 0.33, medium if it is be-tween 0.34 and 0.66 and strong if the correlation coefficient is between 0.67 and 0.99. Jais-ingh (2005) subdivides the strength of the relationship in even more categories. According to him, relationships can be very low or not existent (r below 0.19), low (r between 0.2 and 0.39), moderate (r between 0.4 and 0.59), moderately high (r between 0.6 and 0.79) and strong (r between 0.8 and 1). Cramer (1994) employs yet another scale to the coefficient of correlation where the categories are low or weak relation (r between 0.1 and 0.3), moderate relation (r between 0.4 and 0.6) and strong or high relation (r between 0.7 and 0.9). In this study, the first approach by Somekh and Lewin is used.
Although, analysing only the correlation coefficient is not enough to presume a relationship between two variables. Indeed, it is also important to look at the level of significance and when, in other terms, a relationship between these two variables is significant. If for example you consider a correlation coefficient which is around -0.63 and the significance level is p < 0.04 this means that you have 4 chances out of 100 that there is no correlation between these variables. As Bryman (2001) stated, the correlation could have simply arisen by chance. Thus, the correlation is not significant enough to be generalised to the whole popu-lation. However, on the other hand, if you still have a correlation coefficient of -0.63 and a significance level of p < 0.001 it would mean that there is only 1 chance out of 1000 that the two variables are not related. Therefore, it would be a very low risk for you to deduce that the correlation had not arisen by chance. Moreover, the significant level of a correla-tion coefficient is also linked to the size of the sample and the size of the computed coeffi-cient. Both the correlation coefficient and the significance level should not be examined separately then, otherwise the researchers take the risk of misunderstanding or misinter-preting variables and their relationships. In this thesis, the highest level of statistical signifi-cance accepted is p<0.05, which implies that there are fewer than 5 chances in 100 that there could be a relationship between variables in the sample when there is not one in the population. The higher correlations considered in this thesis, from 0.202 upwards, are sig-nificant at the level 0.01.
Dealing with this kind of data collection, we decided to use SPSS as software to enter and then analyse our data which seems to us to be complete enough in order to seek the re-search questions and answer the purpose of this thesis.
32
3.6 Generalisability
Bryman and Bell (2007) stated that generalisability in quantitative research is crucial. In-deed, in quantitative research, the researcher is usually concerned to be able to say that his or her findings can be generalised beyond the particular context in which the study was driven. In other terms, “generalisability” implies that the authors are willing to say that their results can be applied to individuals other than those who were interviewed in the study.
Concerning this study, it can be said that the results are not unique to the particular group chosen: JIBS students. In order to cope with generalisability problems, we chose a probabil-ity sampling called, simple random sampling. This technique helps researchers to generate a representative sampling within a young Internet users’ population. This procedure largely eliminates bias from the selection of a sample by using a process of random selection (Bryman & Bell, 2007).
Therefore, this study is not only applicable to JIBS’s students but can also be generalised to the whole population, meaning to business students worldwide who use the Internet and are experienced with online activities. This generality is based on the assumption that com-parable age groups in other countries also have a high Internet usage rate. In our opinion, the generalisation of the study cannot be broadened to all university students due to diverse knowledge about online practices. Nevertheless, the results can be an indicator for the atti-tude towards personalised online advertisements in other target groups. In this sense, our study can be seen as the first step of a wider research with different samples using the ques-tionnaire designed in this thesis.
3.7 Validity and Reliability
If there is a difference between the reality and the observations in a research study, the measure is subject to measurement error. Validity and reliability refer to the extent of this measurement error (Davidsson, 1997). When evaluating a quantitative business research, it is important, that the measures used are reliable, valid and replicable. Perfect reliability and validity are very difficult to achieve, they are therefore more of an ideal that researchers strive for (Bryman & Bell, 2007).
Reliability is concerned with whether or not the results of the study are consistent and re-peatable. If a measure, like an IQ test for example, reports different scores when conducted on several different occasions, it would be considered unreliable and inconsistent. Different key terms are related to reliability. Stability is concerned with the stability and fluctuation of measures over time. When administering a survey and re-administering it to the same sam-ple, there should be high correlation between the results obtained. Nevertheless, it has to be considered that respondent’s answers to the first survey and events which occurred in the meantime might influence their responses to the second one. Such events could be new personalised advertisements which the user is confronted with. This can happen any time, since the Internet is highly dynamic. Therefore, we will not carry out any tests of stability. Inter-observer consistency is about inconsistencies that might arise if more than one so-called ‘observer’ is involved in making subjective decisions concerning the categorising of open-ended questions or other types of classifications. In this study, which was conducted by a group of three students, inter-observer consistency was increased by designing the ques-tionnaire as objective as possible, for example without using open-ended questions for the main part of the survey. The design of the survey minimised the subjective judgement in-volved but nevertheless, no research study succeeds in being perfectly objective since it is always conducted by humans. The concept of reliability is closely related to that of replica-tion. In order for a study to be replicable, the procedure conducted has to be explained in
33
great detail so that other researchers are able to recreate it. Likewise, a study has to be rep-licable by other researchers if one wants to assess its reliability. The replicability of this study will be increased by including the questionnaire which was used, explaining exactly how the sample was selected and how the study was conducted (Bryman & Bell, 2007).
Bryman and Bell (2007) name validity as the most important criterion of research. Validity refers to whether or not the measure selected for a concept really measures that concept. According to the authors, validity assumes reliability and therefore, a measure which is not reliable cannot be valid. The minimum validity test which researchers should apply is called face validity and refers to the fact that the measure should apparently reflect the concept to be measured. This can be done by asking people with experience in the field studied about their opinion. For this study, face validity was tested during the meetings with our supervi-sor and several oppositions with other bachelor thesis groups. Internal validity is a type of va-lidity that is concerned with the causality between two or more variables. The theories which were presented in the theoretical framework show that there is a causal relationship between personalised advertisements and privacy concern and between personalised adver-tisements and benefits for the customer. The empirical study will then be used to evaluate the effect of personalised advertisements on the purchasing decision. External validity on the other hand refers to the extent to which the results obtained can be generalised to situa-tions beyond the specific context of the study, from the sample to the population. This is the reason why researchers always aim to obtain representative samples (Bryman & Bell, 2007; Bryman, 2001).
Both reliability and validity were significantly increased in this study by conducting a pilot study (Davidsson, 1997). Problems concerning reliability and validity can be partly avoided by trying out measures before conducting the research study. This improves the question-naire and helps to make sure the respondents know how to understand and answer ques-tions. Another way of increasing reliability and validity is to use measures that have been tested and used in earlier studies (Davidsson, 1997). The questionnaire used in this study can be compared to and has significant similarities with the ones used in “Survey of Inter-net Users‘ Attitudes toward Internet Advertising” (Schlosser, Shavitt & Kanfer, 1999) and “An Empirical Evaluation of Online Privacy Concerns with a Special Focus on the Impor-tance of Information Transparency and Personality Traits” (Friberg, 2007).
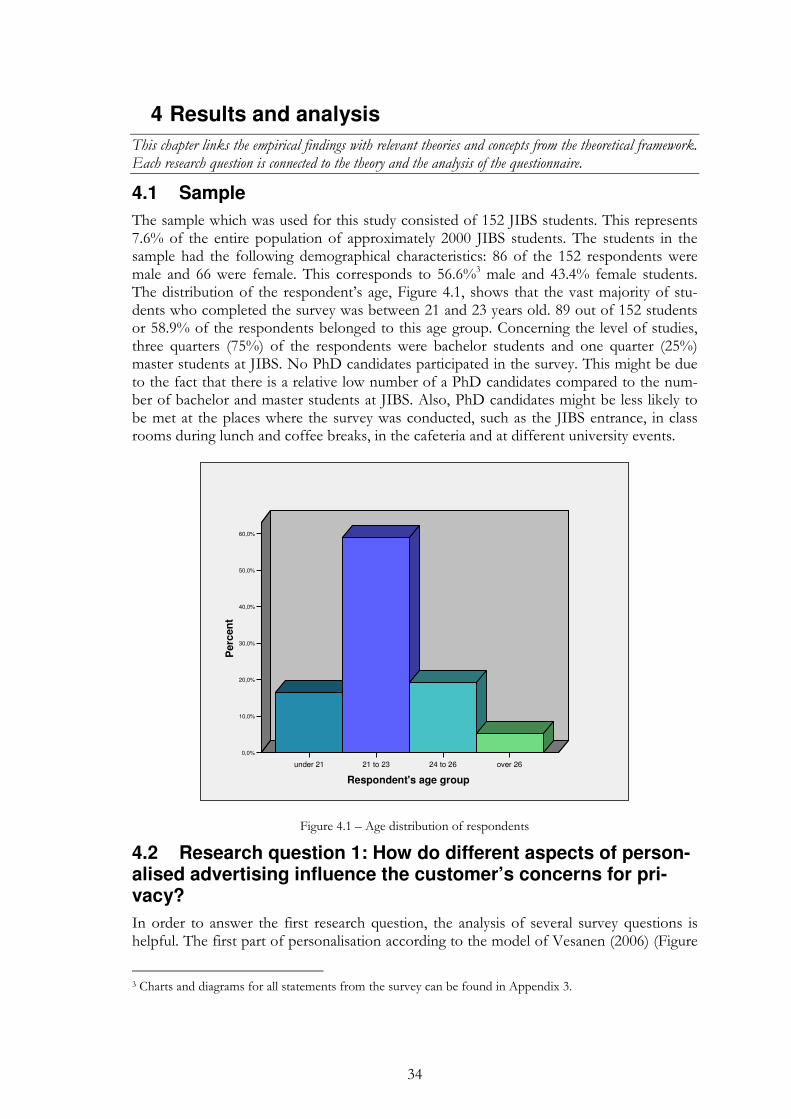
34
4 Results and analysis
This chapter links the empirical findings with relevant theories and concepts from the theoretical framework. Each research question is connected to the theory and the analysis of the questionnaire.
4.1 Sample
The sample which was used for this study consisted of 152 JIBS students. This represents 7.6% of the entire population of approximately 2000 JIBS students. The students in the sample had the following demographical characteristics: 86 of the 152 respondents were male and 66 were female. This corresponds to 56.6%3 male and 43.4% female students. The distribution of the respondent’s age, Figure 4.1, shows that the vast majority of stu-dents who completed the survey was between 21 and 23 years old. 89 out of 152 students or 58.9% of the respondents belonged to this age group. Concerning the level of studies, three quarters (75%) of the respondents were bachelor students and one quarter (25%) master students at JIBS. No PhD candidates participated in the survey. This might be due to the fact that there is a relative low number of a PhD candidates compared to the num-ber of bachelor and master students at JIBS. Also, PhD candidates might be less likely to be met at the places where the survey was conducted, such as the JIBS entrance, in class rooms during lunch and coffee breaks, in the cafeteria and at different university events.
Perc
en
t
60,0%
50,0%
40,0%
30,0%
20,0%
10,0%
Respondent's age group
over 2624 to 2621 to 23
0,0%
under 21
Figure 4.1 – Age distribution of respondents
4.2 Research question 1: How do different aspects of person-alised advertising influence the customer’s concerns for pri-vacy?
In order to answer the first research question, the analysis of several survey questions is helpful. The first part of personalisation according to the model of Vesanen (2006) (Figure
3 Charts and diagrams for all statements from the survey can be found in Appendix 3.
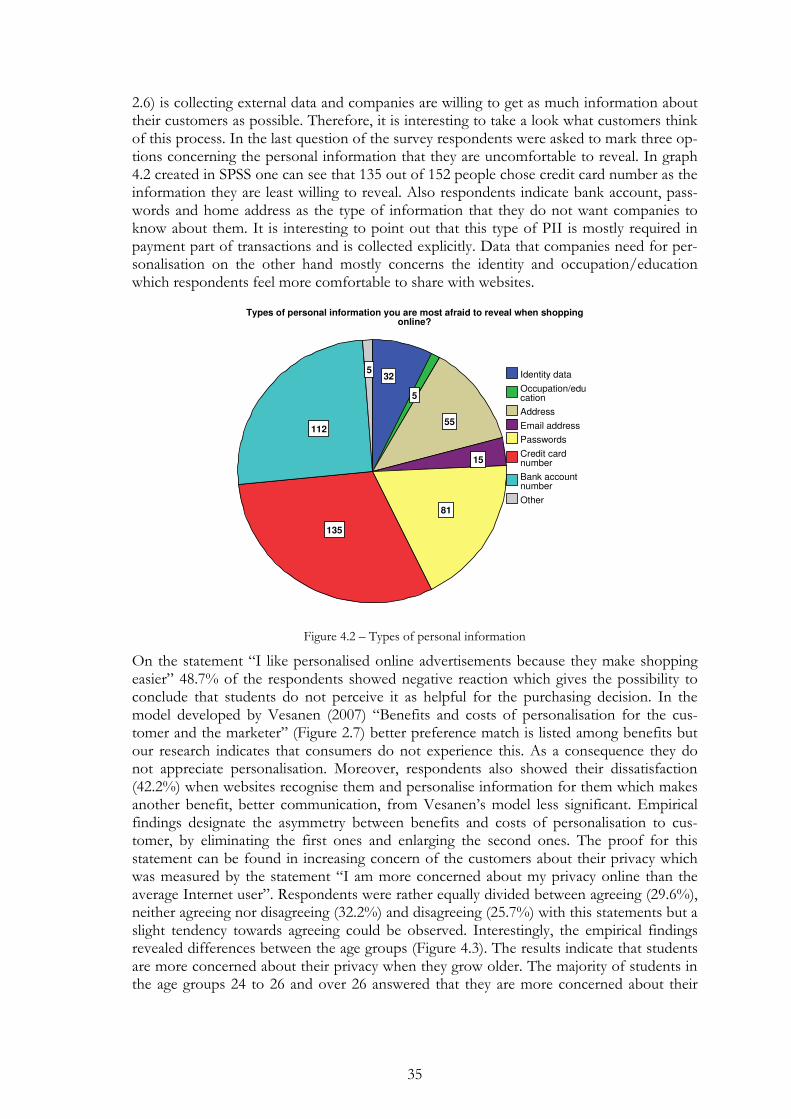
35
2.6) is collecting external data and companies are willing to get as much information about their customers as possible. Therefore, it is interesting to take a look what customers think of this process. In the last question of the survey respondents were asked to mark three op-tions concerning the personal information that they are uncomfortable to reveal. In graph 4.2 created in SPSS one can see that 135 out of 152 people chose credit card number as the information they are least willing to reveal. Also respondents indicate bank account, pass-words and home address as the type of information that they do not want companies to know about them. It is interesting to point out that this type of PII is mostly required in payment part of transactions and is collected explicitly. Data that companies need for per-sonalisation on the other hand mostly concerns the identity and occupation/education which respondents feel more comfortable to share with websites.
5
112
135
81
15
55
5
32
Other
Bank account number
Credit card number
Passwords
Email address
Address
Occupation/education
Identity data
Types of personal information you are most afraid to reveal when shopping online?
Figure 4.2 – Types of personal information
On the statement “I like personalised online advertisements because they make shopping easier” 48.7% of the respondents showed negative reaction which gives the possibility to conclude that students do not perceive it as helpful for the purchasing decision. In the model developed by Vesanen (2007) “Benefits and costs of personalisation for the cus-tomer and the marketer” (Figure 2.7) better preference match is listed among benefits but our research indicates that consumers do not experience this. As a consequence they do not appreciate personalisation. Moreover, respondents also showed their dissatisfaction (42.2%) when websites recognise them and personalise information for them which makes another benefit, better communication, from Vesanen’s model less significant. Empirical findings designate the asymmetry between benefits and costs of personalisation to cus-tomer, by eliminating the first ones and enlarging the second ones. The proof for this statement can be found in increasing concern of the customers about their privacy which was measured by the statement “I am more concerned about my privacy online than the average Internet user”. Respondents were rather equally divided between agreeing (29.6%), neither agreeing nor disagreeing (32.2%) and disagreeing (25.7%) with this statements but a slight tendency towards agreeing could be observed. Interestingly, the empirical findings revealed differences between the age groups (Figure 4.3). The results indicate that students are more concerned about their privacy when they grow older. The majority of students in the age groups 24 to 26 and over 26 answered that they are more concerned about their
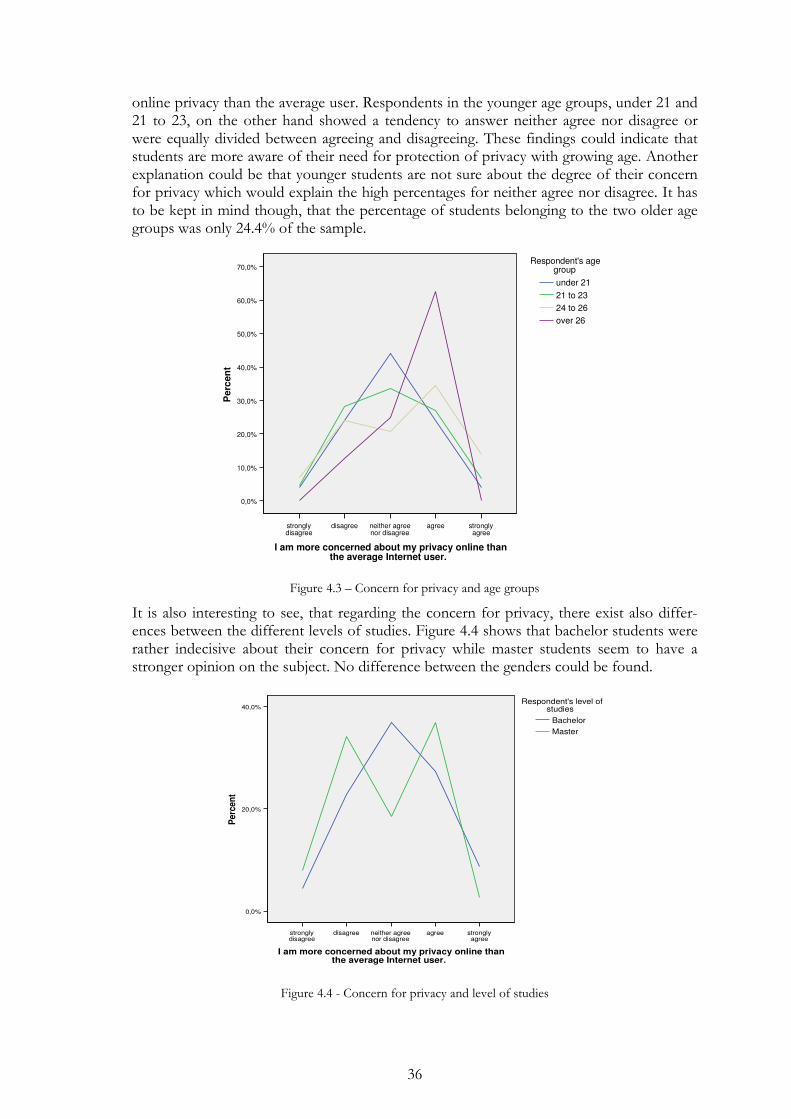
36
online privacy than the average user. Respondents in the younger age groups, under 21 and 21 to 23, on the other hand showed a tendency to answer neither agree nor disagree or were equally divided between agreeing and disagreeing. These findings could indicate that students are more aware of their need for protection of privacy with growing age. Another explanation could be that younger students are not sure about the degree of their concern for privacy which would explain the high percentages for neither agree nor disagree. It has to be kept in mind though, that the percentage of students belonging to the two older age groups was only 24.4% of the sample.
strongly agree
agreeneither agree nor disagree
disagreestrongly disagree
I am more concerned about my privacy online than the average Internet user.
70,0%
60,0%
50,0%
40,0%
30,0%
20,0%
10,0%
0,0%
Perc
en
t
over 26
24 to 26
21 to 23
under 21
Respondent's age group
Figure 4.3 – Concern for privacy and age groups
It is also interesting to see, that regarding the concern for privacy, there exist also differ-ences between the different levels of studies. Figure 4.4 shows that bachelor students were rather indecisive about their concern for privacy while master students seem to have a stronger opinion on the subject. No difference between the genders could be found.
strongly agree
agreeneither agree nor disagree
disagreestrongly disagree
I am more concerned about my privacy online than the average Internet user.
40,0%
20,0%
0,0%
Perc
en
t
Master
Bachelor
Respondent's level of studies
Figure 4.4 - Concern for privacy and level of studies
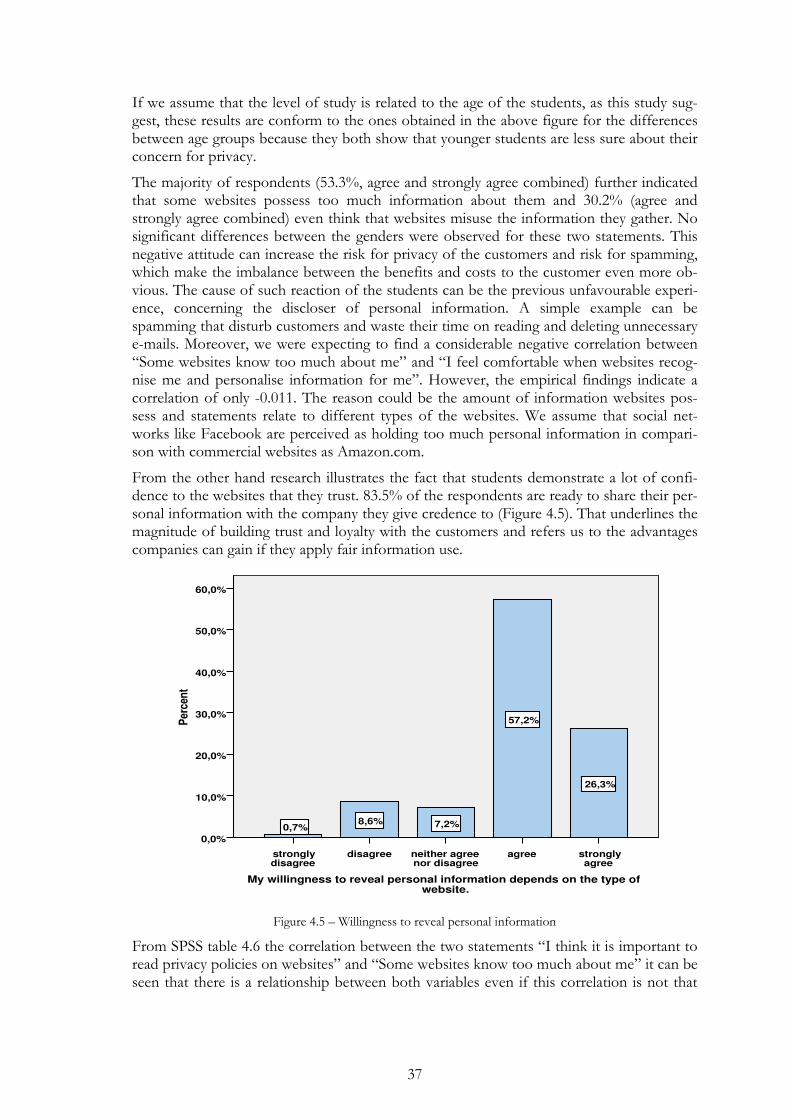
37
If we assume that the level of study is related to the age of the students, as this study sug-gest, these results are conform to the ones obtained in the above figure for the differences between age groups because they both show that younger students are less sure about their concern for privacy.
The majority of respondents (53.3%, agree and strongly agree combined) further indicated that some websites possess too much information about them and 30.2% (agree and strongly agree combined) even think that websites misuse the information they gather. No significant differences between the genders were observed for these two statements. This negative attitude can increase the risk for privacy of the customers and risk for spamming, which make the imbalance between the benefits and costs to the customer even more ob-vious. The cause of such reaction of the students can be the previous unfavourable experi-ence, concerning the discloser of personal information. A simple example can be spamming that disturb customers and waste their time on reading and deleting unnecessary e-mails. Moreover, we were expecting to find a considerable negative correlation between “Some websites know too much about me” and “I feel comfortable when websites recog-nise me and personalise information for me”. However, the empirical findings indicate a correlation of only -0.011. The reason could be the amount of information websites pos-sess and statements relate to different types of the websites. We assume that social net-works like Facebook are perceived as holding too much personal information in compari-son with commercial websites as Amazon.com.
From the other hand research illustrates the fact that students demonstrate a lot of confi-dence to the websites that they trust. 83.5% of the respondents are ready to share their per-sonal information with the company they give credence to (Figure 4.5). That underlines the magnitude of building trust and loyalty with the customers and refers us to the advantages companies can gain if they apply fair information use.
strongly agree
agreeneither agree nor disagree
disagreestrongly disagree
My willingness to reveal personal information depends on the type of website.
60,0%
50,0%
40,0%
30,0%
20,0%
10,0%
0,0%
Per
cen
t
26,3%
57,2%
7,2%8,6%0,7%
Figure 4.5 – Willingness to reveal personal information
From SPSS table 4.6 the correlation between the two statements “I think it is important to read privacy policies on websites” and “Some websites know too much about me” it can be seen that there is a relationship between both variables even if this correlation is not that
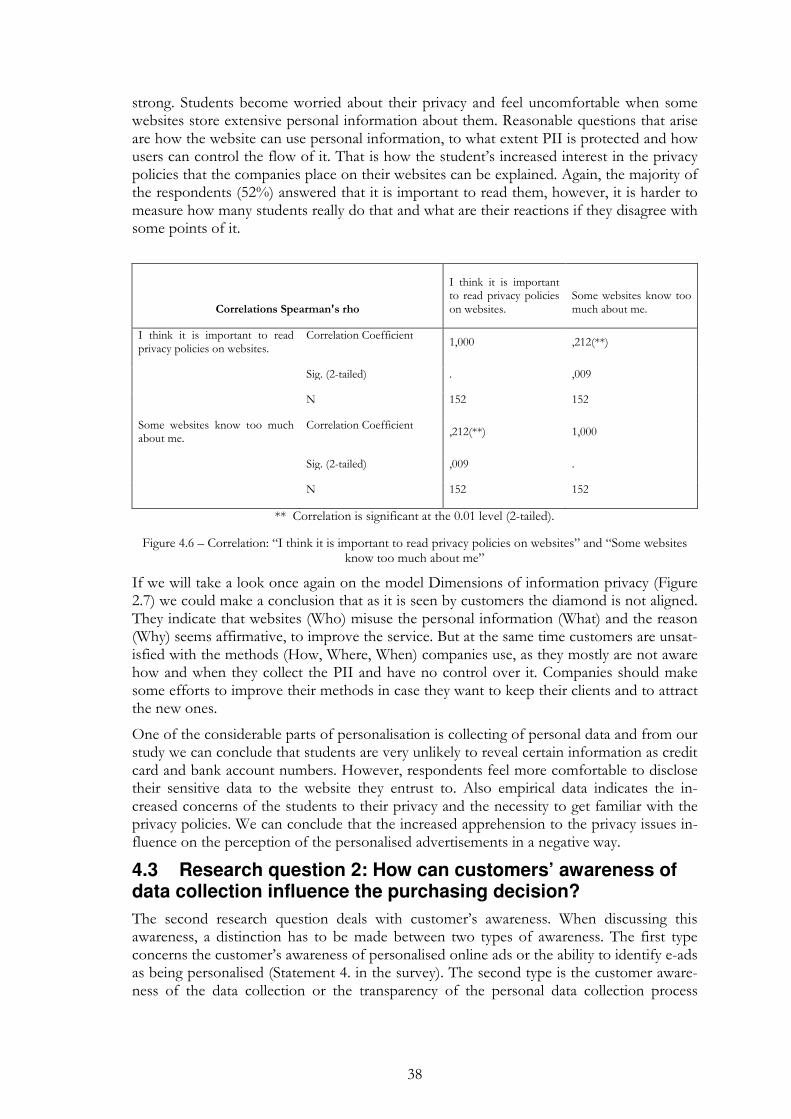
38
strong. Students become worried about their privacy and feel uncomfortable when some websites store extensive personal information about them. Reasonable questions that arise are how the website can use personal information, to what extent PII is protected and how users can control the flow of it. That is how the student’s increased interest in the privacy policies that the companies place on their websites can be explained. Again, the majority of the respondents (52%) answered that it is important to read them, however, it is harder to measure how many students really do that and what are their reactions if they disagree with some points of it.
Correlations Spearman's rho
I think it is important to read privacy policies on websites.
Some websites know too much about me.
I think it is important to read privacy policies on websites.
Correlation Coefficient 1,000 ,212(**)
Sig. (2-tailed) . ,009
N 152 152
Some websites know too much about me.
Correlation Coefficient ,212(**) 1,000
Sig. (2-tailed) ,009 .
N 152 152
** Correlation is significant at the 0.01 level (2-tailed).
Figure 4.6 – Correlation: “I think it is important to read privacy policies on websites” and “Some websites know too much about me”
If we will take a look once again on the model Dimensions of information privacy (Figure 2.7) we could make a conclusion that as it is seen by customers the diamond is not aligned. They indicate that websites (Who) misuse the personal information (What) and the reason (Why) seems affirmative, to improve the service. But at the same time customers are unsat-isfied with the methods (How, Where, When) companies use, as they mostly are not aware how and when they collect the PII and have no control over it. Companies should make some efforts to improve their methods in case they want to keep their clients and to attract the new ones.
One of the considerable parts of personalisation is collecting of personal data and from our study we can conclude that students are very unlikely to reveal certain information as credit card and bank account numbers. However, respondents feel more comfortable to disclose their sensitive data to the website they entrust to. Also empirical data indicates the in-creased concerns of the students to their privacy and the necessity to get familiar with the privacy policies. We can conclude that the increased apprehension to the privacy issues in-fluence on the perception of the personalised advertisements in a negative way.
4.3 Research question 2: How can customers’ awareness of data collection influence the purchasing decision?
The second research question deals with customer’s awareness. When discussing this awareness, a distinction has to be made between two types of awareness. The first type concerns the customer’s awareness of personalised online ads or the ability to identify e-ads as being personalised (Statement 4. in the survey). The second type is the customer aware-ness of the data collection or the transparency of the personal data collection process
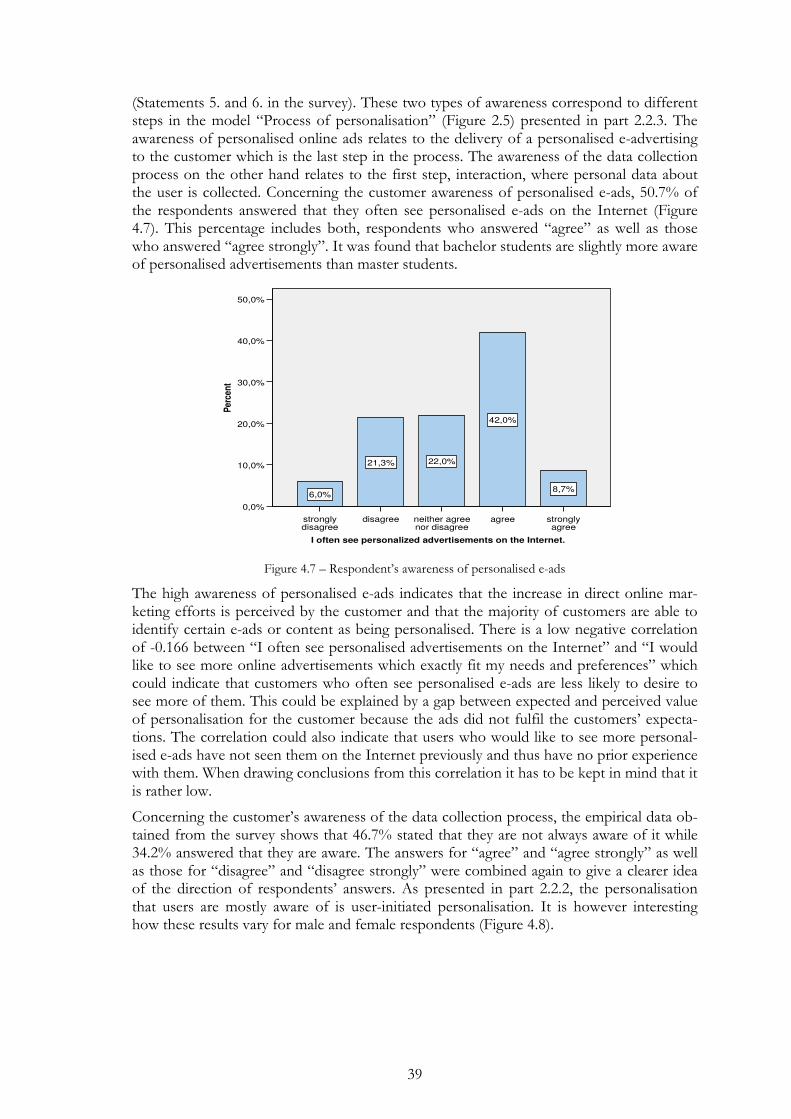
39
(Statements 5. and 6. in the survey). These two types of awareness correspond to different steps in the model “Process of personalisation” (Figure 2.5) presented in part 2.2.3. The awareness of personalised online ads relates to the delivery of a personalised e-advertising to the customer which is the last step in the process. The awareness of the data collection process on the other hand relates to the first step, interaction, where personal data about the user is collected. Concerning the customer awareness of personalised e-ads, 50.7% of the respondents answered that they often see personalised e-ads on the Internet (Figure 4.7). This percentage includes both, respondents who answered “agree” as well as those who answered “agree strongly”. It was found that bachelor students are slightly more aware of personalised advertisements than master students.
strongly agree
agreeneither agree nor disagree
disagreestrongly disagree
I often see personalized advertisements on the Internet.
50,0%
40,0%
30,0%
20,0%
10,0%
0,0%
Per
cen
t
8,7%
42,0%
22,0%21,3%
6,0%
Figure 4.7 – Respondent’s awareness of personalised e-ads
The high awareness of personalised e-ads indicates that the increase in direct online mar-keting efforts is perceived by the customer and that the majority of customers are able to identify certain e-ads or content as being personalised. There is a low negative correlation of -0.166 between “I often see personalised advertisements on the Internet” and “I would like to see more online advertisements which exactly fit my needs and preferences” which could indicate that customers who often see personalised e-ads are less likely to desire to see more of them. This could be explained by a gap between expected and perceived value of personalisation for the customer because the ads did not fulfil the customers’ expecta-tions. The correlation could also indicate that users who would like to see more personal-ised e-ads have not seen them on the Internet previously and thus have no prior experience with them. When drawing conclusions from this correlation it has to be kept in mind that it is rather low.
Concerning the customer’s awareness of the data collection process, the empirical data ob-tained from the survey shows that 46.7% stated that they are not always aware of it while 34.2% answered that they are aware. The answers for “agree” and “agree strongly” as well as those for “disagree” and “disagree strongly” were combined again to give a clearer idea of the direction of respondents’ answers. As presented in part 2.2.2, the personalisation that users are mostly aware of is user-initiated personalisation. It is however interesting how these results vary for male and female respondents (Figure 4.8).
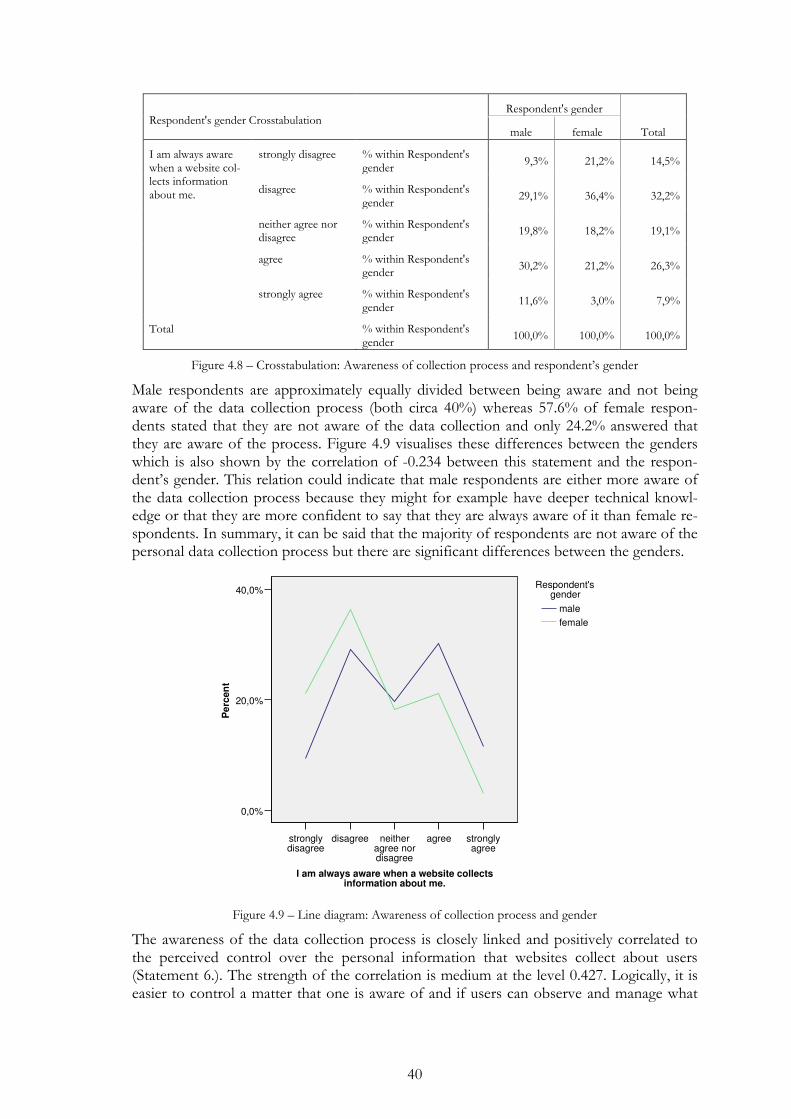
40
Respondent's gender Crosstabulation
Respondent's gender
Total male female
I am always aware when a website col-lects information about me.
strongly disagree % within Respondent's gender
9,3% 21,2% 14,5%
disagree % within Respondent's gender
29,1% 36,4% 32,2%
neither agree nor disagree
% within Respondent's gender
19,8% 18,2% 19,1%
agree % within Respondent's gender
30,2% 21,2% 26,3%
strongly agree % within Respondent's gender
11,6% 3,0% 7,9%
Total % within Respondent's gender
100,0% 100,0% 100,0%
Figure 4.8 – Crosstabulation: Awareness of collection process and respondent’s gender
Male respondents are approximately equally divided between being aware and not being aware of the data collection process (both circa 40%) whereas 57.6% of female respon-dents stated that they are not aware of the data collection and only 24.2% answered that they are aware of the process. Figure 4.9 visualises these differences between the genders which is also shown by the correlation of -0.234 between this statement and the respon-dent’s gender. This relation could indicate that male respondents are either more aware of the data collection process because they might for example have deeper technical knowl-edge or that they are more confident to say that they are always aware of it than female re-spondents. In summary, it can be said that the majority of respondents are not aware of the personal data collection process but there are significant differences between the genders.
strongly agree
agreeneither agree nor disagree
disagreestrongly disagree
I am always aware when a website collects information about me.
40,0%
20,0%
0,0%
Pe
rcen
t
female
male
Respondent's gender
Figure 4.9 – Line diagram: Awareness of collection process and gender
The awareness of the data collection process is closely linked and positively correlated to the perceived control over the personal information that websites collect about users (Statement 6.). The strength of the correlation is medium at the level 0.427. Logically, it is easier to control a matter that one is aware of and if users can observe and manage what
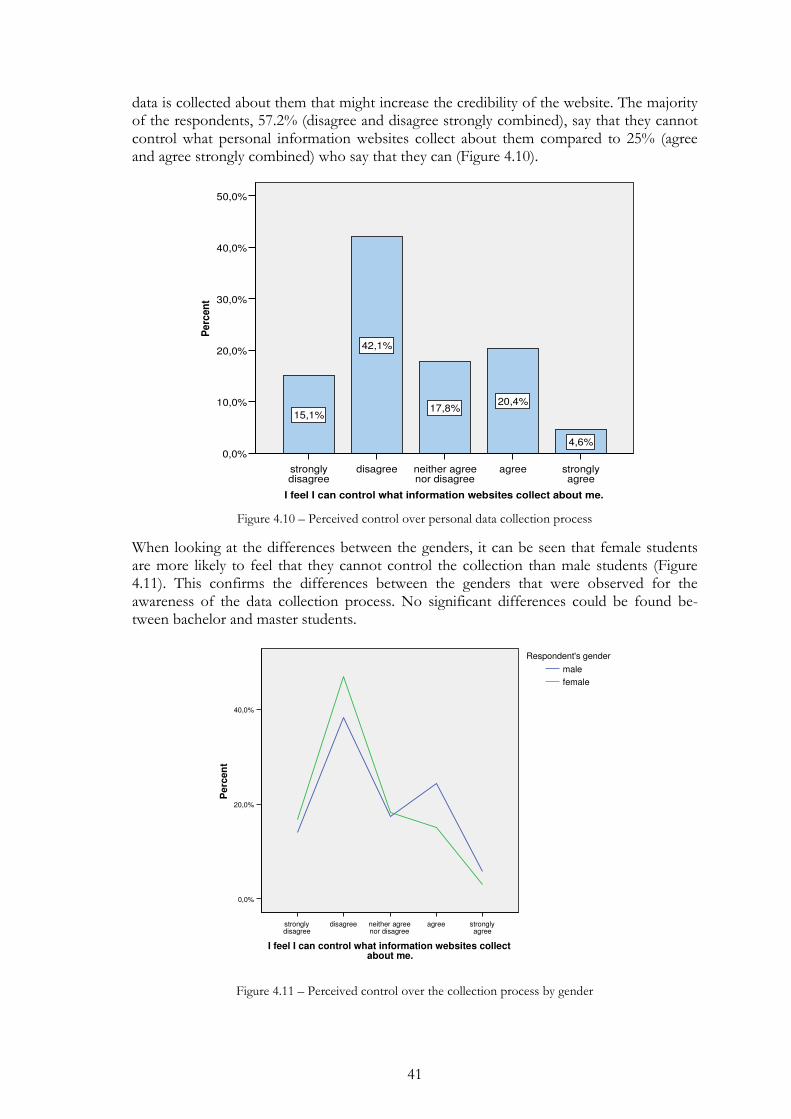
41
data is collected about them that might increase the credibility of the website. The majority of the respondents, 57.2% (disagree and disagree strongly combined), say that they cannot control what personal information websites collect about them compared to 25% (agree and agree strongly combined) who say that they can (Figure 4.10).
strongly agree
agreeneither agree nor disagree
disagreestrongly disagree
I feel I can control what information websites collect about me.
50,0%
40,0%
30,0%
20,0%
10,0%
0,0%
Pe
rcen
t
4,6%
20,4%17,8%
42,1%
15,1%
Figure 4.10 – Perceived control over personal data collection process
When looking at the differences between the genders, it can be seen that female students are more likely to feel that they cannot control the collection than male students (Figure 4.11). This confirms the differences between the genders that were observed for the awareness of the data collection process. No significant differences could be found be-tween bachelor and master students.
strongly agree
agreeneither agree nor disagree
disagreestrongly disagree
I feel I can control what information websites collect about me.
40,0%
20,0%
0,0%
Pe
rcen
t
female
male
Respondent's gender
Figure 4.11 – Perceived control over the collection process by gender
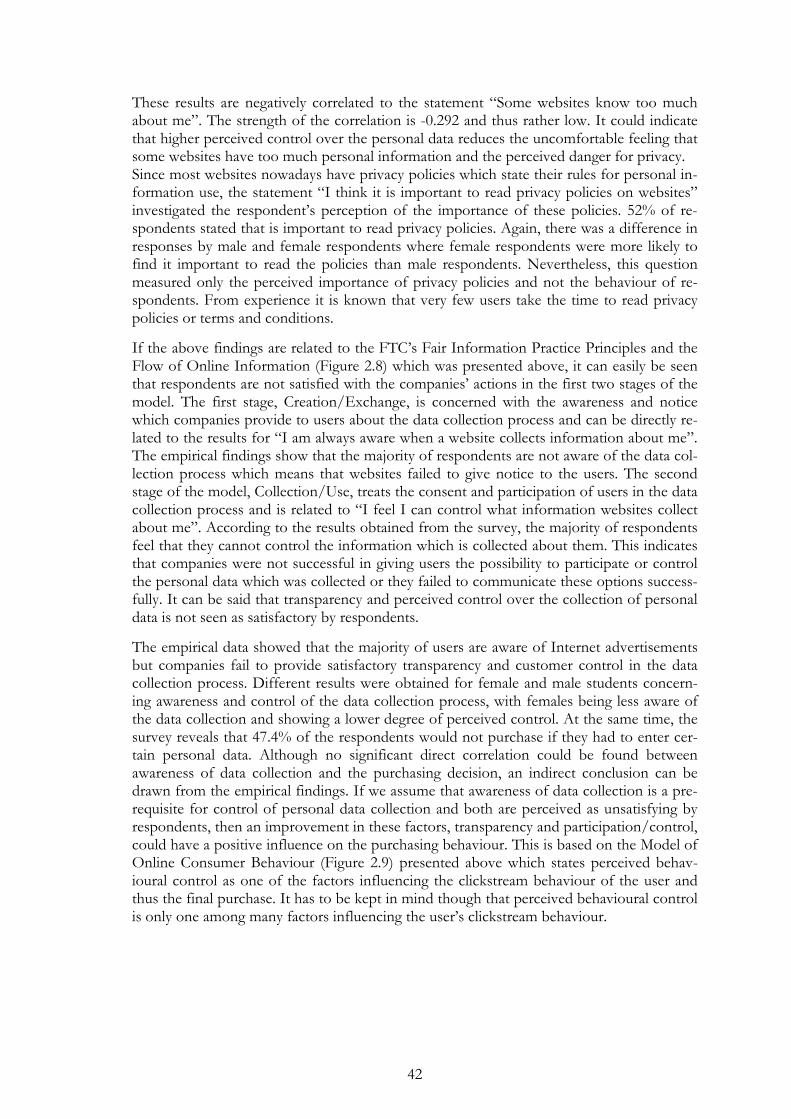
42
These results are negatively correlated to the statement “Some websites know too much about me”. The strength of the correlation is -0.292 and thus rather low. It could indicate that higher perceived control over the personal data reduces the uncomfortable feeling that some websites have too much personal information and the perceived danger for privacy. Since most websites nowadays have privacy policies which state their rules for personal in-formation use, the statement “I think it is important to read privacy policies on websites” investigated the respondent’s perception of the importance of these policies. 52% of re-spondents stated that is important to read privacy policies. Again, there was a difference in responses by male and female respondents where female respondents were more likely to find it important to read the policies than male respondents. Nevertheless, this question measured only the perceived importance of privacy policies and not the behaviour of re-spondents. From experience it is known that very few users take the time to read privacy policies or terms and conditions.
If the above findings are related to the FTC’s Fair Information Practice Principles and the Flow of Online Information (Figure 2.8) which was presented above, it can easily be seen that respondents are not satisfied with the companies’ actions in the first two stages of the model. The first stage, Creation/Exchange, is concerned with the awareness and notice which companies provide to users about the data collection process and can be directly re-lated to the results for “I am always aware when a website collects information about me”. The empirical findings show that the majority of respondents are not aware of the data col-lection process which means that websites failed to give notice to the users. The second stage of the model, Collection/Use, treats the consent and participation of users in the data collection process and is related to “I feel I can control what information websites collect about me”. According to the results obtained from the survey, the majority of respondents feel that they cannot control the information which is collected about them. This indicates that companies were not successful in giving users the possibility to participate or control the personal data which was collected or they failed to communicate these options success-fully. It can be said that transparency and perceived control over the collection of personal data is not seen as satisfactory by respondents.
The empirical data showed that the majority of users are aware of Internet advertisements but companies fail to provide satisfactory transparency and customer control in the data collection process. Different results were obtained for female and male students concern-ing awareness and control of the data collection process, with females being less aware of the data collection and showing a lower degree of perceived control. At the same time, the survey reveals that 47.4% of the respondents would not purchase if they had to enter cer-tain personal data. Although no significant direct correlation could be found between awareness of data collection and the purchasing decision, an indirect conclusion can be drawn from the empirical findings. If we assume that awareness of data collection is a pre-requisite for control of personal data collection and both are perceived as unsatisfying by respondents, then an improvement in these factors, transparency and participation/control, could have a positive influence on the purchasing behaviour. This is based on the Model of Online Consumer Behaviour (Figure 2.9) presented above which states perceived behav-ioural control as one of the factors influencing the clickstream behaviour of the user and thus the final purchase. It has to be kept in mind though that perceived behavioural control is only one among many factors influencing the user’s clickstream behaviour.
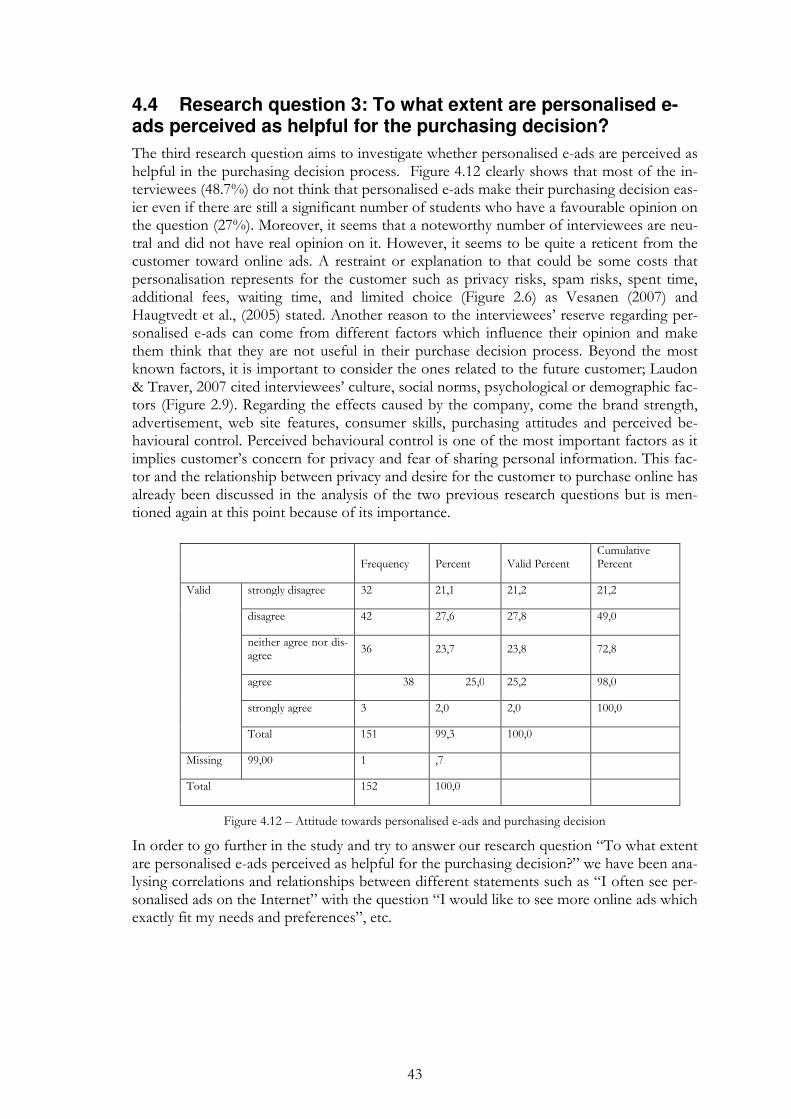
43
4.4 Research question 3: To what extent are personalised e-ads perceived as helpful for the purchasing decision?
The third research question aims to investigate whether personalised e-ads are perceived as helpful in the purchasing decision process. Figure 4.12 clearly shows that most of the in-terviewees (48.7%) do not think that personalised e-ads make their purchasing decision eas-ier even if there are still a significant number of students who have a favourable opinion on the question (27%). Moreover, it seems that a noteworthy number of interviewees are neu-tral and did not have real opinion on it. However, it seems to be quite a reticent from the customer toward online ads. A restraint or explanation to that could be some costs that personalisation represents for the customer such as privacy risks, spam risks, spent time, additional fees, waiting time, and limited choice (Figure 2.6) as Vesanen (2007) and Haugtvedt et al., (2005) stated. Another reason to the interviewees’ reserve regarding per-sonalised e-ads can come from different factors which influence their opinion and make them think that they are not useful in their purchase decision process. Beyond the most known factors, it is important to consider the ones related to the future customer; Laudon & Traver, 2007 cited interviewees’ culture, social norms, psychological or demographic fac-tors (Figure 2.9). Regarding the effects caused by the company, come the brand strength, advertisement, web site features, consumer skills, purchasing attitudes and perceived be-havioural control. Perceived behavioural control is one of the most important factors as it implies customer’s concern for privacy and fear of sharing personal information. This fac-tor and the relationship between privacy and desire for the customer to purchase online has already been discussed in the analysis of the two previous research questions but is men-tioned again at this point because of its importance.
Frequency Percent Valid Percent Cumulative Percent
Valid strongly disagree 32 21,1 21,2 21,2
disagree 42 27,6 27,8 49,0
neither agree nor dis-agree
36 23,7 23,8 72,8
agree 38 25,0 25,2 98,0
strongly agree 3 2,0 2,0 100,0
Total 151 99,3 100,0
Missing 99,00 1 ,7
Total 152 100,0
Figure 4.12 – Attitude towards personalised e-ads and purchasing decision
In order to go further in the study and try to answer our research question “To what extent are personalised e-ads perceived as helpful for the purchasing decision?” we have been ana-lysing correlations and relationships between different statements such as “I often see per-sonalised ads on the Internet” with the question “I would like to see more online ads which exactly fit my needs and preferences”, etc.
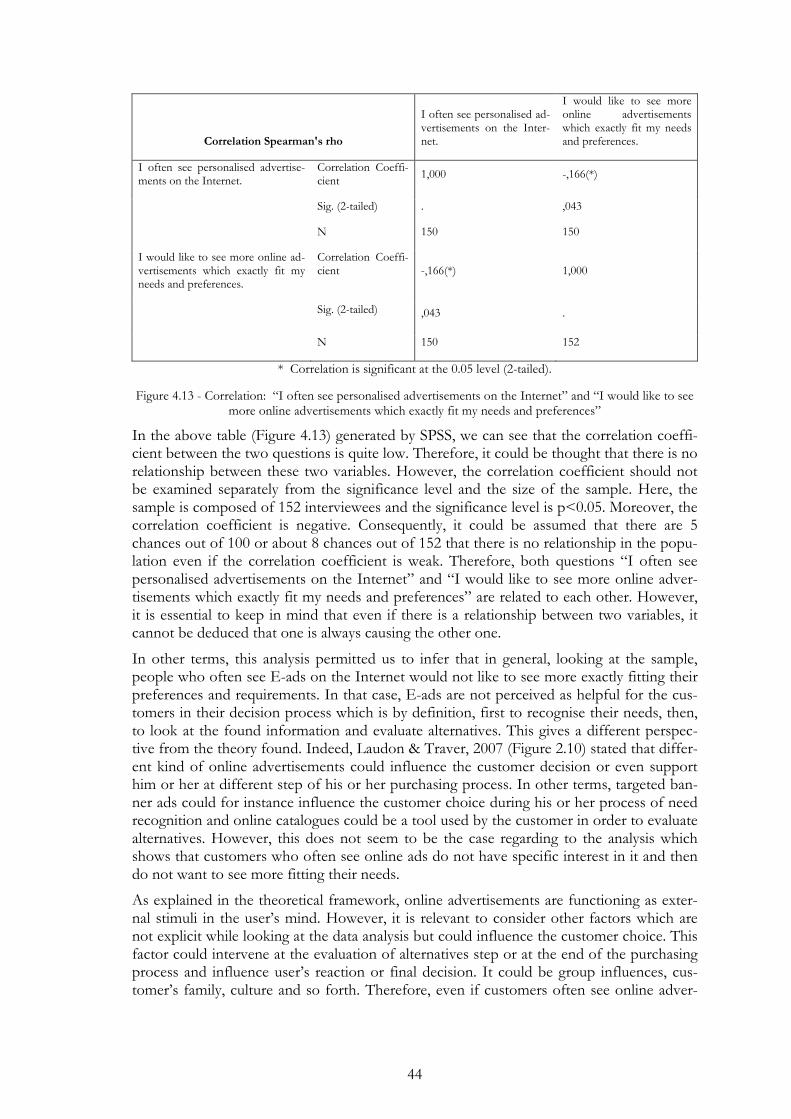
44
Correlation Spearman's rho
I often see personalised ad-vertisements on the Inter-net.
I would like to see more online advertisements which exactly fit my needs and preferences.
I often see personalised advertise-ments on the Internet.
Correlation Coeffi-cient
1,000 -,166(*)
Sig. (2-tailed) . ,043
N 150 150
I would like to see more online ad-vertisements which exactly fit my needs and preferences.
Correlation Coeffi-cient -,166(*) 1,000
Sig. (2-tailed) ,043 .
N 150 152
* Correlation is significant at the 0.05 level (2-tailed).
Figure 4.13 - Correlation: “I often see personalised advertisements on the Internet” and “I would like to see more online advertisements which exactly fit my needs and preferences”
In the above table (Figure 4.13) generated by SPSS, we can see that the correlation coeffi-cient between the two questions is quite low. Therefore, it could be thought that there is no relationship between these two variables. However, the correlation coefficient should not be examined separately from the significance level and the size of the sample. Here, the sample is composed of 152 interviewees and the significance level is p<0.05. Moreover, the correlation coefficient is negative. Consequently, it could be assumed that there are 5 chances out of 100 or about 8 chances out of 152 that there is no relationship in the popu-lation even if the correlation coefficient is weak. Therefore, both questions “I often see personalised advertisements on the Internet” and “I would like to see more online adver-tisements which exactly fit my needs and preferences” are related to each other. However, it is essential to keep in mind that even if there is a relationship between two variables, it cannot be deduced that one is always causing the other one.
In other terms, this analysis permitted us to infer that in general, looking at the sample, people who often see E-ads on the Internet would not like to see more exactly fitting their preferences and requirements. In that case, E-ads are not perceived as helpful for the cus-tomers in their decision process which is by definition, first to recognise their needs, then, to look at the found information and evaluate alternatives. This gives a different perspec-tive from the theory found. Indeed, Laudon & Traver, 2007 (Figure 2.10) stated that differ-ent kind of online advertisements could influence the customer decision or even support him or her at different step of his or her purchasing process. In other terms, targeted ban-ner ads could for instance influence the customer choice during his or her process of need recognition and online catalogues could be a tool used by the customer in order to evaluate alternatives. However, this does not seem to be the case regarding to the analysis which shows that customers who often see online ads do not have specific interest in it and then do not want to see more fitting their needs.
As explained in the theoretical framework, online advertisements are functioning as exter-nal stimuli in the user’s mind. However, it is relevant to consider other factors which are not explicit while looking at the data analysis but could influence the customer choice. This factor could intervene at the evaluation of alternatives step or at the end of the purchasing process and influence user’s reaction or final decision. It could be group influences, cus-tomer’s family, culture and so forth. Therefore, even if customers often see online adver-
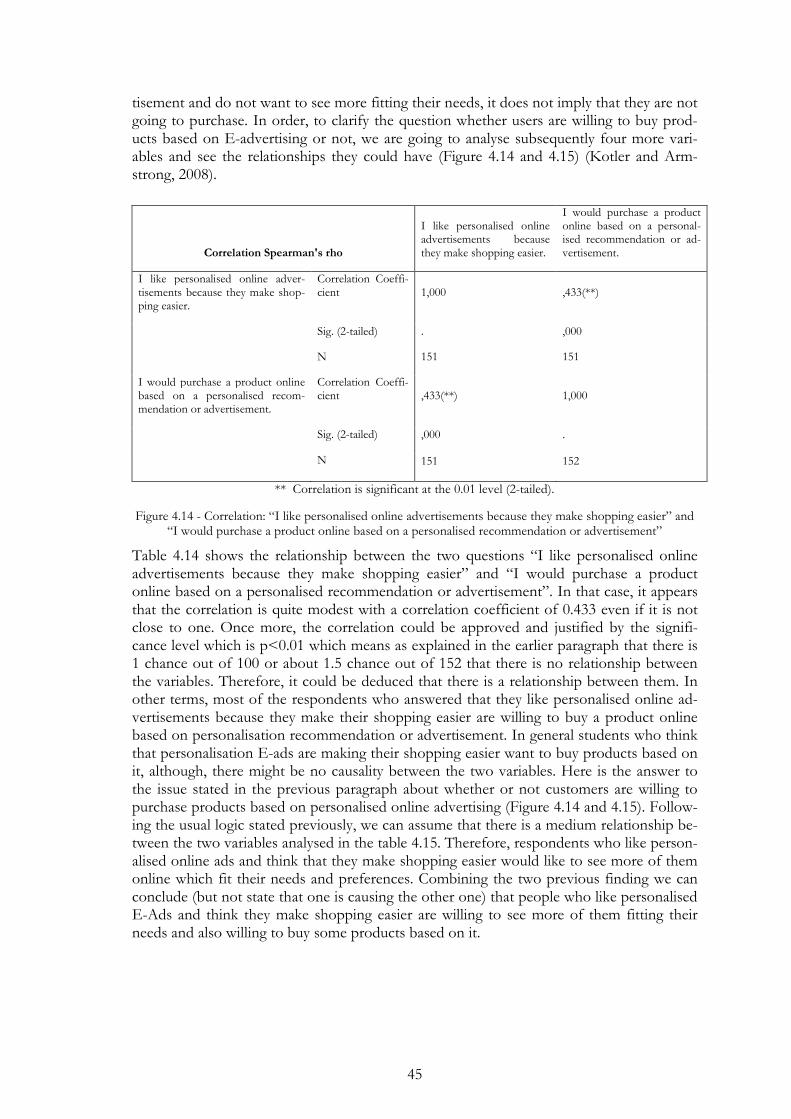
45
tisement and do not want to see more fitting their needs, it does not imply that they are not going to purchase. In order, to clarify the question whether users are willing to buy prod-ucts based on E-advertising or not, we are going to analyse subsequently four more vari-ables and see the relationships they could have (Figure 4.14 and 4.15) (Kotler and Arm-strong, 2008).
Correlation Spearman's rho
I like personalised online advertisements because they make shopping easier.
I would purchase a product online based on a personal-ised recommendation or ad-vertisement.
I like personalised online adver-tisements because they make shop-ping easier.
Correlation Coeffi-cient 1,000 ,433(**)
Sig. (2-tailed) . ,000
N 151 151
I would purchase a product online based on a personalised recom-mendation or advertisement.
Correlation Coeffi-cient ,433(**) 1,000
Sig. (2-tailed) ,000 .
N 151 152
** Correlation is significant at the 0.01 level (2-tailed).
Figure 4.14 - Correlation: “I like personalised online advertisements because they make shopping easier” and “I would purchase a product online based on a personalised recommendation or advertisement”
Table 4.14 shows the relationship between the two questions “I like personalised online advertisements because they make shopping easier” and “I would purchase a product online based on a personalised recommendation or advertisement”. In that case, it appears that the correlation is quite modest with a correlation coefficient of 0.433 even if it is not close to one. Once more, the correlation could be approved and justified by the signifi-cance level which is p<0.01 which means as explained in the earlier paragraph that there is 1 chance out of 100 or about 1.5 chance out of 152 that there is no relationship between the variables. Therefore, it could be deduced that there is a relationship between them. In other terms, most of the respondents who answered that they like personalised online ad-vertisements because they make their shopping easier are willing to buy a product online based on personalisation recommendation or advertisement. In general students who think that personalisation E-ads are making their shopping easier want to buy products based on it, although, there might be no causality between the two variables. Here is the answer to the issue stated in the previous paragraph about whether or not customers are willing to purchase products based on personalised online advertising (Figure 4.14 and 4.15). Follow-ing the usual logic stated previously, we can assume that there is a medium relationship be-tween the two variables analysed in the table 4.15. Therefore, respondents who like person-alised online ads and think that they make shopping easier would like to see more of them online which fit their needs and preferences. Combining the two previous finding we can conclude (but not state that one is causing the other one) that people who like personalised E-Ads and think they make shopping easier are willing to see more of them fitting their needs and also willing to buy some products based on it.
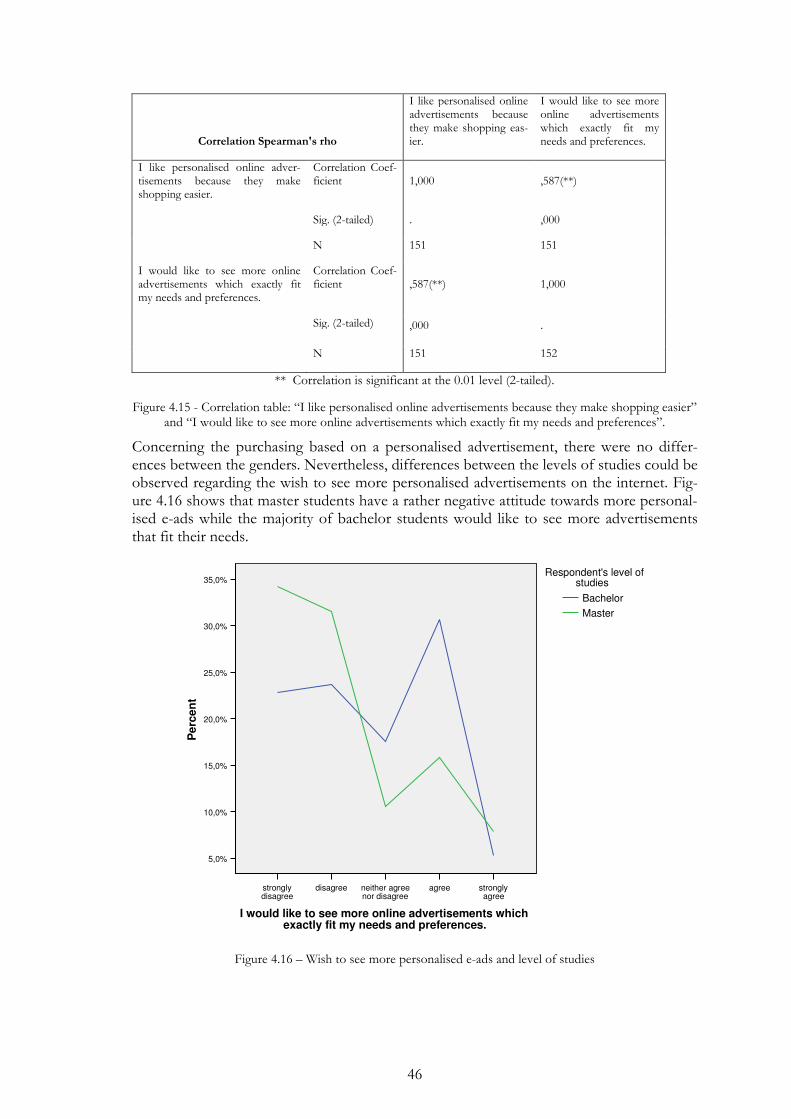
46
Correlation Spearman's rho
I like personalised online advertisements because they make shopping eas-ier.
I would like to see more online advertisements which exactly fit my needs and preferences.
I like personalised online adver-tisements because they make shopping easier.
Correlation Coef-ficient 1,000 ,587(**)
Sig. (2-tailed) . ,000
N 151 151
I would like to see more online advertisements which exactly fit my needs and preferences.
Correlation Coef-ficient ,587(**) 1,000
Sig. (2-tailed) ,000 .
N 151 152
** Correlation is significant at the 0.01 level (2-tailed).
Figure 4.15 - Correlation table: “I like personalised online advertisements because they make shopping easier” and “I would like to see more online advertisements which exactly fit my needs and preferences”.
Concerning the purchasing based on a personalised advertisement, there were no differ-ences between the genders. Nevertheless, differences between the levels of studies could be observed regarding the wish to see more personalised advertisements on the internet. Fig-ure 4.16 shows that master students have a rather negative attitude towards more personal-ised e-ads while the majority of bachelor students would like to see more advertisements that fit their needs.
strongly agree
agreeneither agree nor disagree
disagreestrongly disagree
I would like to see more online advertisements which exactly fit my needs and preferences.
35,0%
30,0%
25,0%
20,0%
15,0%
10,0%
5,0%
Pe
rce
nt
Master
Bachelor
Respondent's level of studies
Figure 4.16 – Wish to see more personalised e-ads and level of studies
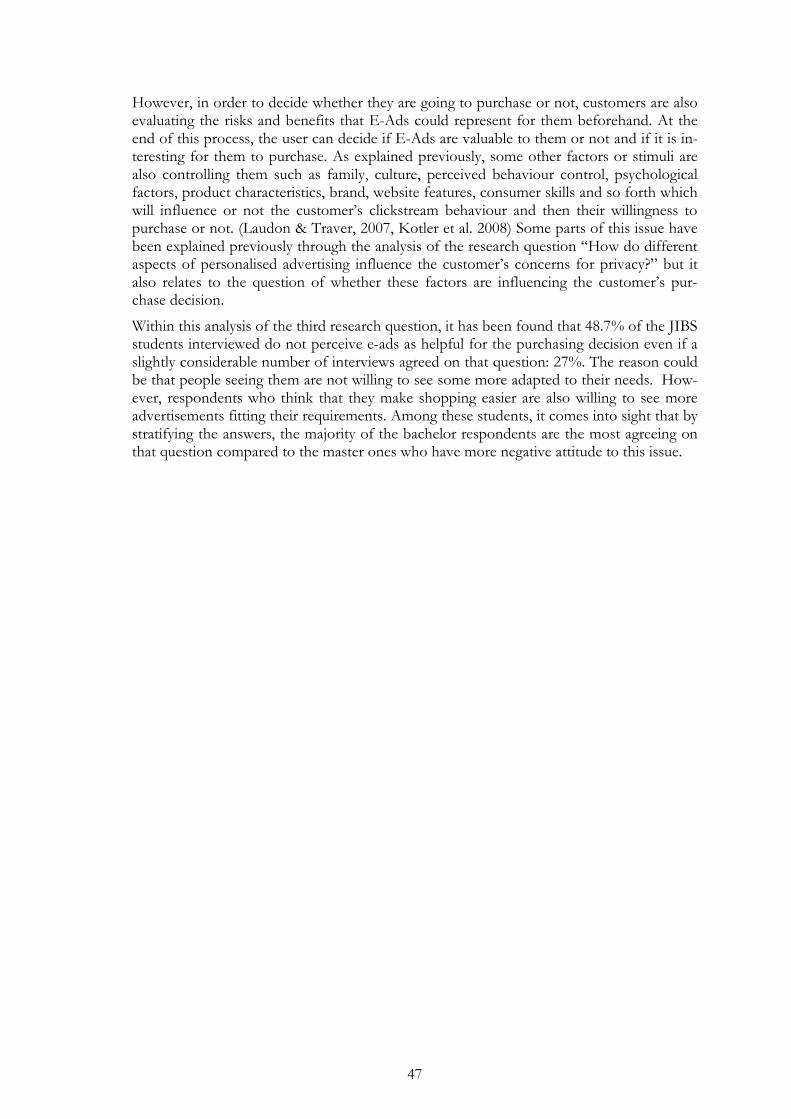
47
However, in order to decide whether they are going to purchase or not, customers are also evaluating the risks and benefits that E-Ads could represent for them beforehand. At the end of this process, the user can decide if E-Ads are valuable to them or not and if it is in-teresting for them to purchase. As explained previously, some other factors or stimuli are also controlling them such as family, culture, perceived behaviour control, psychological factors, product characteristics, brand, website features, consumer skills and so forth which will influence or not the customer’s clickstream behaviour and then their willingness to purchase or not. (Laudon & Traver, 2007, Kotler et al. 2008) Some parts of this issue have been explained previously through the analysis of the research question “How do different aspects of personalised advertising influence the customer’s concerns for privacy?” but it also relates to the question of whether these factors are influencing the customer’s pur-chase decision.
Within this analysis of the third research question, it has been found that 48.7% of the JIBS students interviewed do not perceive e-ads as helpful for the purchasing decision even if a slightly considerable number of interviews agreed on that question: 27%. The reason could be that people seeing them are not willing to see some more adapted to their needs. How-ever, respondents who think that they make shopping easier are also willing to see more advertisements fitting their requirements. Among these students, it comes into sight that by stratifying the answers, the majority of the bachelor respondents are the most agreeing on that question compared to the master ones who have more negative attitude to this issue.
48
5 Conclusions This part draws conclusions from the previous analysis part, summarises the analysis of the research ques-tions and gives answers to the general purpose of the study.
After having analysed the empirical findings and related them to the theoretical framework it is possible to draw conclusions concerning the research questions and the purpose of the study. The way different aspects of personalised advertising influence the consumer’s con-cerns for privacy is the issue discussed in the first research question. As already mentioned, customers react negatively to the collection of sensitive information, because in the case of misuse, it can cause monetary losses. Moreover, respondents do not appreciate when some websites recognise them, but from the other hand they are ready to share certain personal information with the websites that they perceive as credible. The reason for that could be the absence of previous negative experience. It is possible to indicate how customer’s be-haviour might have changed through the last several years. After experiencing several nega-tive situations that occurred as a result of revealing personal data, the concerns for privacy increased. Students pay more attention to the information they place online, and they try to control the flow of their personal data or at least familiarise themselves with privacy poli-cies of the websites. The augmented attention to privacy eliminates the benefits of the per-sonalised advertising and leads to the negative attitude to it.
Concerning the second research question about the relationships between awareness of data collection and purchasing decision the following conclusions can be drawn. A signifi-cant direct correlation between awareness of personalisation and the purchasing decision, as we expected to find, could not be derived from the empirical findings. Nevertheless, the results obtained suggest that an improvement in transparency and customer control during the data collection process, according to the Fair Information Practice Principles, will have a positive effect on the purchasing decision. Moreover, it is interesting to emphasize the differences between the genders regarding the ability to control the information gathering process where males show slightly higher rate. In contrast, women reflect the opinion that it is important to read the privacy policies of the websites in order to be aware of the ways in which companies gather and exploit personal data and manage to control its flow. Per-ceived control over the information that users reveal to the websites eliminate the sensation that companies possess a lot more user’s PII than it should be and might increase the credibility of the website and contribute to the development of business.
Regarding the research question about personalisation and its influence on purchasing deci-sion the following conclusions could be derived. After several analyses, it could be seen that most of the respondents do not think that personalised E-ads make their purchasing decision easier, even if there is still a significant number of students who have a favourable opinion upon the question. From the analysis it could also be seen that a considerable number of respondents do not have an opinion on the question or are not willing to share it. This could be caused by the fact that some interviewees were not aware of the personal-isation process. Looking at the answer to the question “I often see personalised advertise-ment on the Internet”, half of the sample students appear to see them quite often. None-theless, on the other hand, about half as well did not see them or answered “neither agree nor disagree” to the question which could be interpreted as “don’t know in that case”. It also appeared that respondents who are often seeing online advertisements are not willing to see more adapted to their needs and preferences. Thus, it could be said that E-ads are not perceived as helpful for the customers in their decision process when they are aware of
49
it. However, it has been found out that students who think that E-ads are making shop-ping easier are willing to see more fitting their needs and want to buy products based on it.
The above made conclusions help us to answer the purpose of this thesis: if personalised online advertising could be perceived as a danger to customer’s privacy or on the other hand, facilitate the purchase decision process. The easiest way to measure the customer’s responses is to take a look on the questions we asked and try to separate the results in two columns, positive and negative influence, this will help us to determine which aspect out-weighs. Unfortunately, not all questions can be assessed as influential to the results, thus we will take a look only on those that can give us a clear and understandable conclusion. Cus-tomers are not aware when websites collect information about them, and this can be seen as a danger for privacy. In addition, customers cannot control the PII collection process, what can be perceived as a risk as well. Students do not like personalised advertising and are not willing to see more of them as they do not consider them helpful. At the same time, they feel uncomfortable when websites recognise them and they are very concerned about their privacy, which again gives points to the negative side of personalised advertising. Moreover, customers think that some websites know too much about them and sometimes even misuse the information. Finally, people would not make their purchasing decision based on personalised recommendations in case they have to reveal certain personal infor-mation.
It becomes clear that the negative side of personalised advertising and risk for privacy out-weigh the benefits of it and that the respondent’s general perception of personalised E-ads is negative. They do not believe that they make shopping easier and see a danger for their privacy in how companies collect the customer’s information and use it. This contradicts the increase in efforts and money companies put into direct online marketing. Although re-spondents were aware of the personalised content, the personal data collection process still lacks transparency and the user’s possibility to participate and control the process. This could be one reason for the negative attitude towards personalisation which can also be ex-plained by the Model of Online Consumer Behaviour mentioning perceived behavioural control as one factor which influences the purchasing decision. Companies have to im-prove the application of fair information use in order to build up trust and create loyalty.
Concerning danger for privacy, the empirical findings show that the majority of respon-dents are worried about their privacy, feel uncomfortable when websites recognise them and believe that some websites have too much personal information about them. The high perceived importance of privacy policies revealed by the empirical data might be caused by the concern for privacy which depends heavily on the website requesting the personal data, on the type of information requested, the transparency of the data collection process as well as on the perceived control over this process. However, respondents are willing to share personal information with websites they trust which again indicates the importance of fair information use to increase websites’ reliability. This could be one way for compa-nies to improve the negative perception of personalisation.
When it comes to the purchasing decision based on a personalised advertisement, the ma-jority of students did not give an opinion about whether or not they would purchase in such a situation. The remaining respondents were approximately equally divided between “I would purchase based on a personalised recommendation or advertisement” and “I would not purchase based on a personalised recommendation or advertisement”. This can be explained by a lack of experience with purchases based on personalised recommenda-tions or by a lack of ability to relate purchases to personalised advertisements. Neverthe-less, most students would not purchase online if they had to reveal certain personal infor-
50
mation. The correlations show that respondents who feel comfortable when websites rec-ognise them and thus have a low perceived danger for privacy are more likely to purchase based on personalisation. Students who feel that websites know too much about them and thus have a high perceived danger for privacy on the other hand are less likely to purchase online if they had to reveal certain personal information. This indicates the influence of privacy concern on the purchasing decision.
The conclusions previously drawn have shown that the negative aspect of personalised online advertisements prevails. Consequently, companies should change their strategy re-garding online marketing and try to improve the customer’s perception towards E-ads. Some suggestions for companies’ enhancements and further studies related to the subject are given in the following discussion.
51
6 Discussion
This chapter discusses managerial implications which can be deduced from the empirical study. Limitations of the study as well as suggestions for further research are also subject of discussion in this part.
6.1 Managerial implications
After we have finished our research we are able to contribute to improving the perception of personalised advertisements by giving some implications to marketers and e-commerce websites.
Through analysis it has been shown that people who think that personalised e-ads make shopping easier are also willing to see more advertisements fitting their needs and prefer-ences. However, this does not mean that people are willing to purchase these products. Moreover, it seems that most of respondents did not agree to the fact that Online Advertis-ing is making purchasing decision easier. Therefore, marketers should be aware of that and maybe work on the e-ads image in users’ mind in order to seek more customers and win their trust and loyalty. Differences between the genders and age groups should be taken into consideration as well. One thing which is also important to consider for companies is that people who see online advertising are not willing to see more fitting their wants and preferences. It seems that Online Advertising has a dreadful image in users’ mind and might annoy them. This is why once again companies’ marketers should either create transparent online advertising which users cannot see are hardly be aware of it in order to attract them or try to change customers’ opinions.
As we indicated in our result and analysis part, a lot of respondents feel uncomfortable to disclose their credit card, bank account numbers and passwords while making purchase online. A possible solution can be found in observing the latest tendencies in financial insti-tutions when banks suggest their clients to use special passwords for online payments that are valid in one occasion only which their clients can get in the ATM machines. This prac-tice is very new and only few banks offer this service and even less websites make it possi-ble to pay with such passwords. Another possibility to avoid the revealing of credit card and bank account numbers is using web money nevertheless customer again face the prob-lem of impossibility to choose this payment option on many websites that provide sell/buy services. And it is important to mention that this type of the information is not mostly nec-essary to personalise the new offer for the clients. Thus, it becomes obvious that in order to increase credibility and protection of the customers company should suggest different payment options including safer and more convenient ones.
As we already mentioned in the results a lot of students are willing to disclose their per-sonal information to the websites they trust and they had no previous unfavourable experi-ence with. That is why we can suggest to keep the PII of the customers as safe as possible, give the user the possibility to revise the information collected about him or contradict the collection from the beginning, and do not share it with other companies This increase the transparency and control according to the fair information use model and will help to built trust and loyalty of the customers. People are usually afraid of what they do not know or cannot control and it is essential to keep the gathered data as transparent to the customer as possible. Probably, if the client will have a possibility to access their personal informa-tion and control it they will feel much more relief and show more confidence to the web-site which again will help to increase loyalty and as a consequence rise sells and profits of the company.
52
6.2 Limitations and suggestions for further research
The limitations of the study which emerged during the research process are discussed in this part. From these statements, suggestions for future research can be developed.
In the survey used in this thesis, only the respondent’s perception of personalised e-ads was measured, but not their real behaviour. The perception of these ads and the user’s intention to purchase which was analysed with the help of the survey naturally influence the final de-cision to purchase. An experiment could clarify to what extent the perception and purchas-ing intention match the customer’s real behaviour.
Nevertheless, other factors than concern for privacy influence the purchasing decision but were not considered in this study. These could be for example family, culture, psychologi-cal factors or even the degree of Internet usage etc. Therefore, it might be interesting to conduct further research relating other influencing factors than privacy concern to the pur-chasing decision process based on personalised e-ads.
Concerning privacy policies, this study measured only the user’s perceived importance of these documents. Whether respondents actually take the time to read privacy policies on websites was not measured in this survey. Based on experience, very few users read these policies which contradict their high importance based on empirical findings. Consequently, it would be interesting to conduct an experiment which compares the user’s perception of privacy policies to their real reading behaviour.
When it comes to revealing personal information, the empirical data shows that respon-dent’s are willing to share personal data with websites they trust. However, the survey did not answer the question which websites are perceived as more trustworthy than others. This could also be the subject of further research studies.
Finally, it would be useful to confirm the results obtained in this study by repeating it with a larger sample or a different group of Internet users. Although this study used a sample of only 152 students, it succeeded in providing a tool which can also be used in other studies. The survey that was created can be helpful in comparable studies of larger samples of stu-dent populations at other universities in order to confirm the results obtained and their re-liability. In addition, studies on other Internet user target groups which can be chosen based on age, demographics or geographical factors can be conducted using the same sur-vey. This would be useful in order to analyse the differences between age groups that were revealed in this study in greater detail. The survey could also be extended to include ques-tions concerning different types of personalised ads. These future studies might reveal find-ings which could be combined with the ones from this thesis to form a more complete pic-ture of the user’s perception of personalised e-advertisements and whether their positive or negative aspects outweigh.
53
References
• Brace, Ian. Questionnaire Design. London, GBR: Kogan Page, Limited, 2004. http://site.ebrary.com.bibl.proxy.hj.se/lib/jonhh/Doc?id=10084461&ppg=68
• Bryman, A. & Bell, E. (2007). Business research methods, second edition. Oxford: Oxford
University Press.
• Bryman, A. (2001). Social Research Methods. Oxford: Oxford University Press.
• Cartellieri, C., Parsons, A. J., Rao, V., & Zeisser, M. P. (1997). The real Impact of
Internet advertising. The McKinsey Quarterly, number 3, 45-62.
• Cox, B. & Koelzer, W. (2001). Internet Marketing in Real Estate. Upper Saddle River:
Pearson Prentice Hall
• Cramer, Duncan (1994). Introducing Statistics for Social Research: Step-by-step Calculations. Routledge. Retrieved from http://books.google.de/books?id=yxk-AAAAIAAJ&printsec=frontcover&sig=5RE9FSWHR0ggsS3eW5fZlzmwWF0#PPA218,M1 on May 21st 2008.
• Cranor Lorrie Faith. (2003). ‘I Didn’t Buy it for Myself’ Privacy and Ecommerce Personal-ization. WPES’03, Washington, DC, USA. ACM 1-58113-776-1/03/0010
• Dahlén, M. (2001). Marketing on the Web: Empirical Studies of Advertising and Promotion
Effectivenes. Stockholm: Stockholm School of Economics, EFI, the economic re-
search institute.
• Davidsson, Per (1997). On the quantitative approach to research, 2nd revision. Jönköping International Business School.
• Denver D’Rozario and Jerome D. Williams, (2005). Retail Redlining: Definition, Theory, Typology, and Measurement. Journal of Macromarketing; 25; 175. Sage Publications.
• DoubleClick.com (2008). Retrieved from http://www.doubleclick.com/about/about_us.aspx on March 13th 2008.
• Edwards Lillian. (2003). Consumer Privacy, On-Line Business and the Internet: Looking for Privacy in all the Wrong places. International Journal of Law and Information Tech-nology, Vol.11 #3. Oxford University Press.
• eMarketer (February 20, 2008), Online Buying Grows, But How Much? Retrieved Feb-ruary 26, 2008, from http://www.emarketer.com/Article.aspx?id=1005942&src=article_head_sitesearch
• FaceBook.com (2008). Retrieved from http://www.facebook.com/about.php on March 13th 2008.
• Fowler, Floyd J. Jr. (2002). Survey Research Methods. Third Edition. Thousand Oaks, California: Sage Publication, Inc.
• Friberg, A (2007). An Empirical Evaluation of Online Privacy Concerns with a Special Focus on the Importance of Information Transparency and Personality Traits. Luleå University of Technology Department of Business Administration and Social Sciences Division of Industrial Marketing and e-Commerce
54
• Groves, Robert M., Fowler, Floyd J. Jr., Couper, Mick P., Lepkowski, James M., Singer, Eleanor, and Tourangeau, Roger (2004). Survey Methodology. Hoboken, New Jersey: John Wiley & Sons, Inc.
• Hanson W. (2000). Principles of Internet Marketing. South-Western College.
• Harkiolakis, N. (2007). A six-dimensional approach to online privacy. Int. J. Technol-ogy Transfer and Commercialisation, Vol. 6, No. 1, pp. 56-63.
• Haugtvedt, C. P., Machleit, K. A. and Yalch, R. F. (2005). Online Consumer Psychology – Understanding and Influencing Consumer Behaviour in the Virtual World. Mahwah, New Jersey: Lawrence Erlbaum Associates, Publisher.
• Internet World Stats (2008). Internet Usage in the European Union. Retrieved on April 20th 2008 from http://www.internetworldstats.com/stats9.htm
• Internet World Stats (2008). Top 43 countries with the highest Internet Penetration Rate. Retrieved on April 20th 2008 from http://www.internetworldstats.com/top25.htm,
• Jaisingh, Lloyd R. (2005). Statistics for the Utterly Confused. McGraw-Hill Professional. Retrieved from http://books.google.de/books?id=N1dDaPOoeXUC&printsec=frontcover&sig=nKJV_zGgVaUXn-MSOE2gcTbTze8#PPA106,M1 on May 21st 2008.
• Kalyanam, K. & McIntyre, S. (2002). The E-Marketing Mix: A contribution of the
E-Tailing Wars. Department of Marketing Leavey School of Business, Santa Clara University.
• Kotler et al. (2005). Principles of Marketing, the Fourth European Edition. Pearson Edu-
cation Limited.
• Kotler, P. and Armstrong, G. (2008). Principles of Marketing 12e. Upper Saddle River: Pearson Prentice Hall.
• Laudon, K. C. & Traver, C. G. (2007). E-commerce: business. technology. society. Upper
Saddle River: Pearson Prentice Hall
• Lorrie Faith Cranor (2003). 'I didn't buy it for myself' privacy and ecommerce personalization.
AT&T Labs-Research, Florham Park, NJ
• McCarty, E. J. (1960). Basic Marketing: A Managerial Approach. Richard D. Irwin, Homewood, IL
• Monroy, T. (2000). Personalization or Just the Illusion? Inter@ctive Week, May 29th 2000
• Nicoll, C, Prins, J.E.J. and van Dellen M.J.M. (2003). Digital Anonymity and the Law: Tensions and Dimensions. Cambridge University Press. Retrieved from http://books.google.com/books?id=_IC831WguIgC&printsec=frontcover&dq=Digi-tal+Anonymity+and+the+Law:+Tensions+and+Dimensions.&ei=M4g1SIbnMKXEyAT4tcnLDw&hl=de&sig=RfsFipe6p-zyrCe1wvVFf1YT-5s on May 22nd 2008.
• O'Byrne, F. (2004). 10 Online Marketing & Search Engine Essentials every Executive needs
to know. Apatore, Inc.
• Paschelke, Bernd and Roselieb, Arnd (2002). Online Distribution. Erich Schmidt Verlag GmbH. Retrieved from
55
http://books.google.com/books?id=zWStFVwalVYC&printsec=frontcover&hl=de&sig=DdCAU0crosjeEJebVAhlKb2FYy0 on May 22nd 2008.
• Pre Gauntt, J. du (2006). The future of marketing: from monolog to dialog.
http://graphics.eiu.com/files/ad_pdfs/Google_Future_of_Marketing_060907.pdf
• Radin, Tara J., Martin Calkins, Carolyn Predmore, (2007). New Challenges to Old Problems: Building Trust in E-marketing. Business and Society Review 112:1 73–98. Centre for Business Ethics at Bentley College. Published by Blackwell Publishing.
• Reed Chris and Angel John. (2007). Computer Law: The Law and Regulation of Informa-tion Technology. Oxford University Press, 6th edition.
• Scheaffer L. Richard et al. (2006). Elementary Survey Sampling. Duxbury Advanced Se-ries, Sixth edition, Thomson Brooks/Cole.
• Schlosser, A., Shavitt, S. & Kanfer, A. (1999). Survey of Internet Users‘ Attitudes
toward Internet Advertising. Journal of Interactive Marketing, Volume 13 (3), 34-54.
• Shah, S.K. & Corley K.G. (2006). Building Better theory by Bridging the Quantitative- Qualitative Divide. Journal of Management Studies, 43(8), 1821-1835
• Shata, O. (2006). E-Services Privacy: Needs, Approaches, Challenges, Models, and Dimensions. In G. Yee, Privacy Protection for E-Services (p. 94.113). Hershey: Idea Group Inc.
• Somekh, Bridget and Lewin, Cathy (2004). Research Methods in the Social Sciences. Re-trieved from http://books.google.de/books?id=qNOJj3avR0wC&printsec=frontcover&sig=dZ1TdBpYhc1lFAAIg7xAoE6n2yQ#PPA230,M1 on May 21st 2008.
• Statistiska Centralbyrån (2007). Daily use of the Internet by gender and age 2007. Re-trieved on April 20th 2008 from http://www.scb.se/templates/tableOrChart____201808.asp
• Turban, E., King, D., Viehland, D., & Lee, J. (2006). Electronic commerce 2006: a managerial perspective. Upper Saddle River, New Jersey: Pearson Education, Inc.
• Vesanen, J. (2007). What is personalization? A conceptual framework. Helsinki School of Economics, LTT Research Ltd, Helsinki, Finland European Journal of Marketing. Vol. 41 No. 5/6, 2007
56
Appendices
Appendix 1 - Glossary
Clickstream behaviour – Customer movements on the Internet (Turban et al, 2006).
Cookie- a tool used by Web sites to store information about a user. When a visitor enters a Web site, the site sends a small text file to the user’s computer so that information from the site can be loaded more quickly on future visits. The cookie can contain any information desired by the site designer (Laudon & Traver, 2007).
DoubleClick - is a provider of digital marketing technology and services. The world's top marketers, publishers and agencies utilize DoubleClick's expertise in ad serving, rich media, video, search and affiliate marketing to help them make the most of the digital medium (doubleclick.com, 2008).
E-Business – the digital enablement of transactions and processes within a firm, involving information systems under the control of the firm (Laudon & Traver, 2007).
E-commerce – the use of the Internet and the web to transact business. More formally, digitally enabled commercial transactions between and among organisations and individuals (Laudon & Traver, 2007).
E-marketing – the marketing side of E-commerce - company efforts to communicate about, promote and sell products and services over the Internet (Kotler et al., 2005).
FaceBook - FaceBook is a social utility that connects people with friends and others who work, study and live around them. People use FaceBook to keep up with friends, upload an unlimited number of photos, share links and videos, and learn more about the people they meet (Facebook.com, 2008).
Internet – A public, global communications network that provides direct connectivity (Turban et al, 2006).
Internet/e-/electronic/online advertising – Throughout this thesis we will use the ex-pressions Internet advertising, e-advertising, electronic advertising and online advertising synonymously for any type of paid message available anywhere on the Internet that reveals information about a product or a service to a potential customer. Our definition combines the one given by Schlosser, Shavitt and Kanfer being “commercial content available on the Internet that is designed by business to inform customers about a product or a service” (1999) with the definition by Laudon and Traver: "a paid message on a Web site, online service, or other interactive medium" (2007).
Opt-in clause – an agreement that requires computer users to take specific steps to allow the collection of personal information (Turban et al, 2006).
Opt-out – an agreement that requires computer users to take specific steps to prevent the collection of personal information (Turban et al, 2006).
Personalised advertising - Into the term “online advertising”, is considered another type of promotion named “Personalised advertisement”. Personalised advertisement is by defi-nition referring to the matching of services, products and advertising content to individuals (Turban et al., 2006). An e-tailer (or Internet resellers) can for instance, use cookie trackers to know customers buying behaviours and then generate a marketing plan using the infor-mation collected.
57
Personally identifiable information (PII) – PII describes any data which can be used to identify, locate or contact an individual customer (Laudon & Traver, 2007).
Podcast – an audio presentation (radio show, personal presentation or audio from movies) posted to the web as an audio file (Laudon & Traver, 2007).
Privacy policy – a document which addresses what information is collected, how it will be used and whether it will be shared with third parties; may also contain opt-in/opt-out op-tions for targeted mailing (Karlyanam & McIntyre, 2002).
Search engine – a computer program that can access a database of Internet resources, search for specific information or keywords, and report the result (Turban et al, 2006).
Web Beacon (Web Bug) –tiny graphics files embedded on e-mail messages and in Web sites that transmit information about the user and their movements to a Web server. (Tur-ban et al, 2006).
Weblog (blog) - a personal website that is open to the public to read and to interact with; dedicated to specific topics or issues (Turban et al, 2006).
World Wide Web (WWW) – most popular service on the Internet which provides easy access to web pages (Laudon & Traver, 2007).
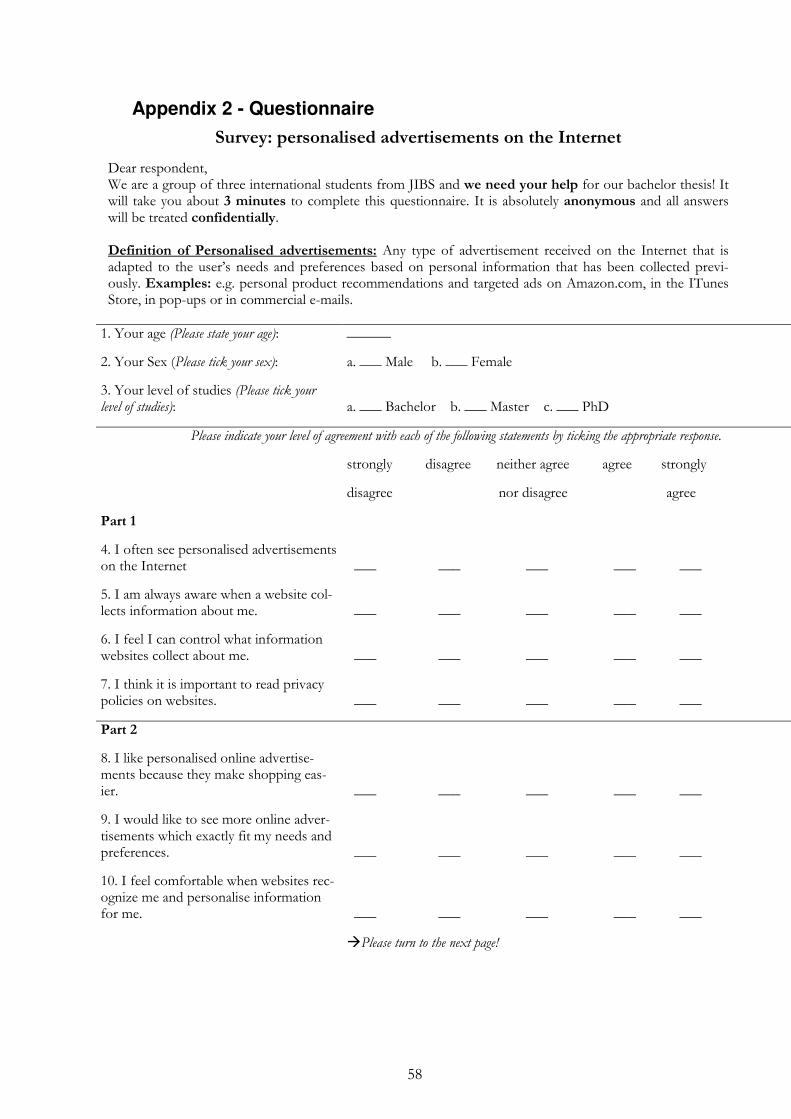
58
Appendix 2 - Questionnaire
Survey: personalised advertisements on the Internet
Dear respondent, We are a group of three international students from JIBS and we need your help for our bachelor thesis! It will take you about 3 minutes to complete this questionnaire. It is absolutely anonymous and all answers will be treated confidentially. Definition of Personalised advertisements: Any type of advertisement received on the Internet that is adapted to the user’s needs and preferences based on personal information that has been collected previ-ously. Examples: e.g. personal product recommendations and targeted ads on Amazon.com, in the ITunes Store, in pop-ups or in commercial e-mails.
1. Your age (Please state your age): ______
2. Your Sex (Please tick your sex): a. ___ Male b. ___ Female
3. Your level of studies (Please tick your level of studies): a. ___ Bachelor b. ___ Master c. ___ PhD
Please indicate your level of agreement with each of the following statements by ticking the appropriate response.
strongly disagree neither agree agree strongly
disagree nor disagree agree
Part 1
4. I often see personalised advertisements on the Internet ___ ___ ___ ___ ___
5. I am always aware when a website col-lects information about me. ___ ___ ___ ___ ___
6. I feel I can control what information websites collect about me. ___ ___ ___ ___ ___
7. I think it is important to read privacy policies on websites. ___ ___ ___ ___ ___
Part 2
8. I like personalised online advertise-ments because they make shopping eas-ier. ___ ___ ___ ___ ___
9. I would like to see more online adver-tisements which exactly fit my needs and preferences. ___ ___ ___ ___ ___
10. I feel comfortable when websites rec-ognize me and personalise information for me. ___ ___ ___ ___ ___
�Please turn to the next page!
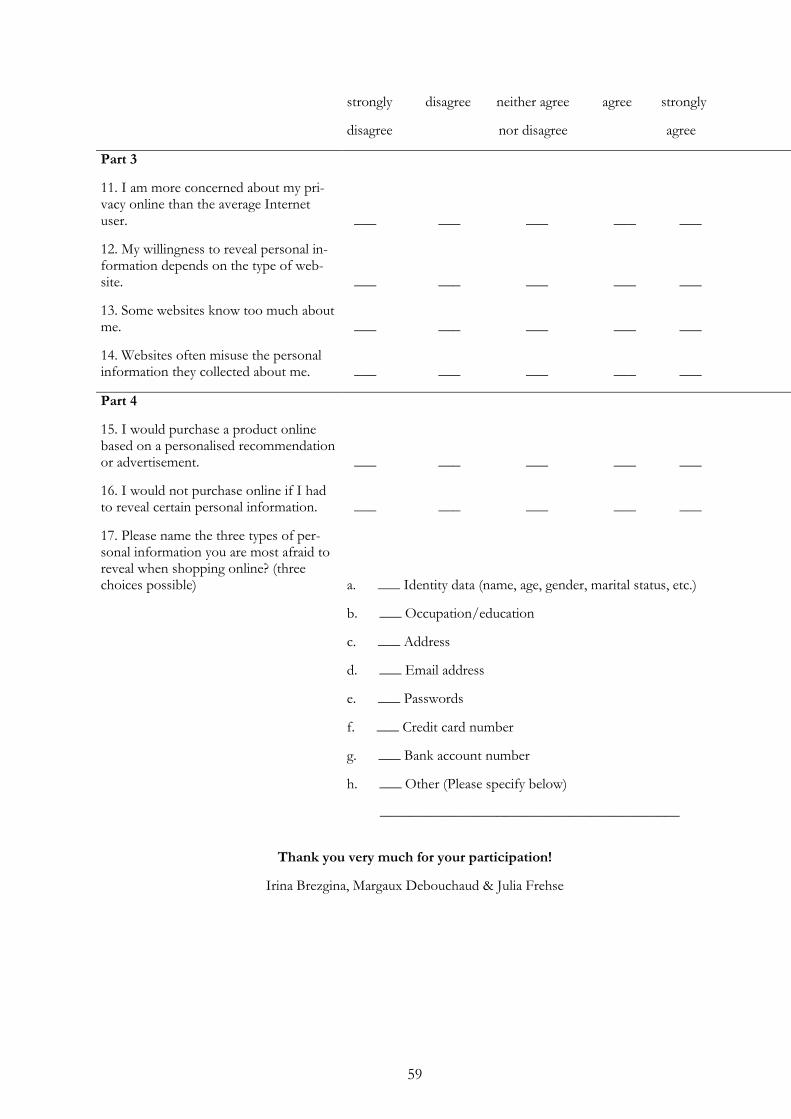
59
strongly disagree neither agree agree strongly
disagree nor disagree agree
Part 3
11. I am more concerned about my pri-vacy online than the average Internet user. ___ ___ ___ ___ ___
12. My willingness to reveal personal in-formation depends on the type of web-site. ___ ___ ___ ___ ___
13. Some websites know too much about me. ___ ___ ___ ___ ___
14. Websites often misuse the personal information they collected about me. ___ ___ ___ ___ ___
Part 4
15. I would purchase a product online based on a personalised recommendation or advertisement. ___ ___ ___ ___ ___
16. I would not purchase online if I had to reveal certain personal information. ___ ___ ___ ___ ___
17. Please name the three types of per-sonal information you are most afraid to reveal when shopping online? (three choices possible) a. ___ Identity data (name, age, gender, marital status, etc.)
b. ___ Occupation/education
c. ___ Address
d. ___ Email address
e. ___ Passwords
f. ___ Credit card number
g. ___ Bank account number
h. ___ Other (Please specify below)
_________________________________________
Thank you very much for your participation!
Irina Brezgina, Margaux Debouchaud & Julia Frehse
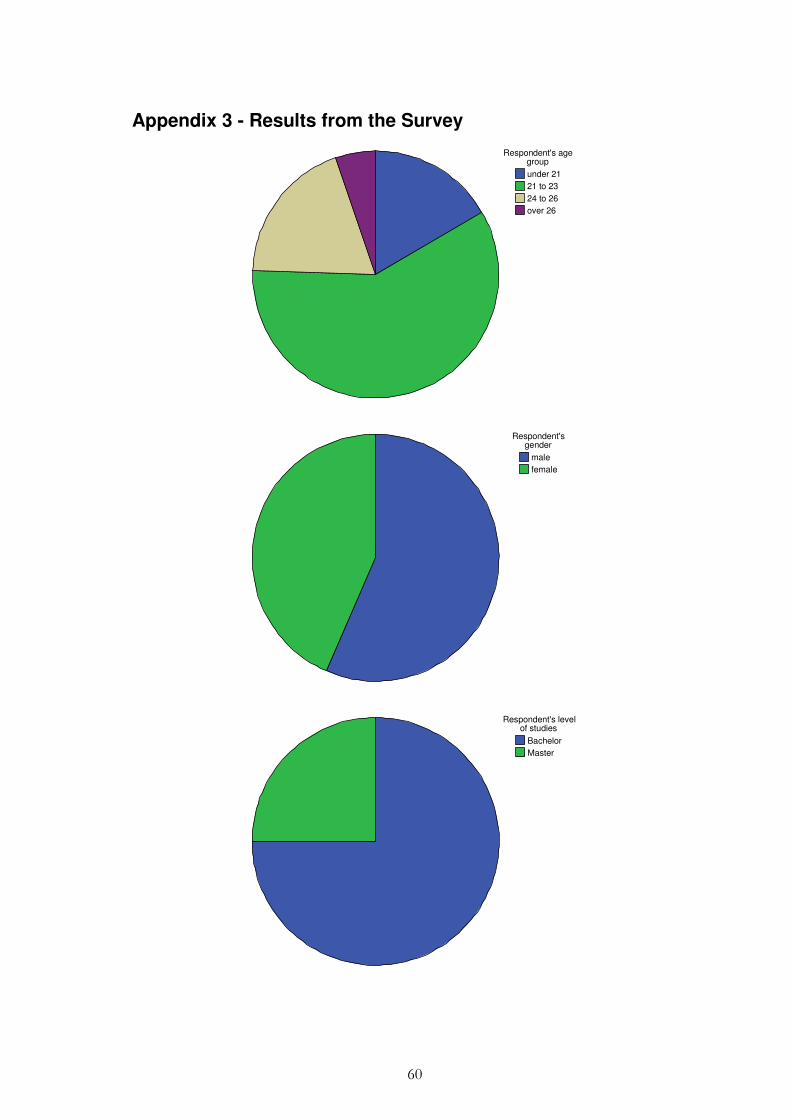
60
Appendix 3 - Results from the Survey
over 26
24 to 26
21 to 23
under 21
Respondent's age group
female
male
Respondent's gender
Master
Bachelor
Respondent's level of studies
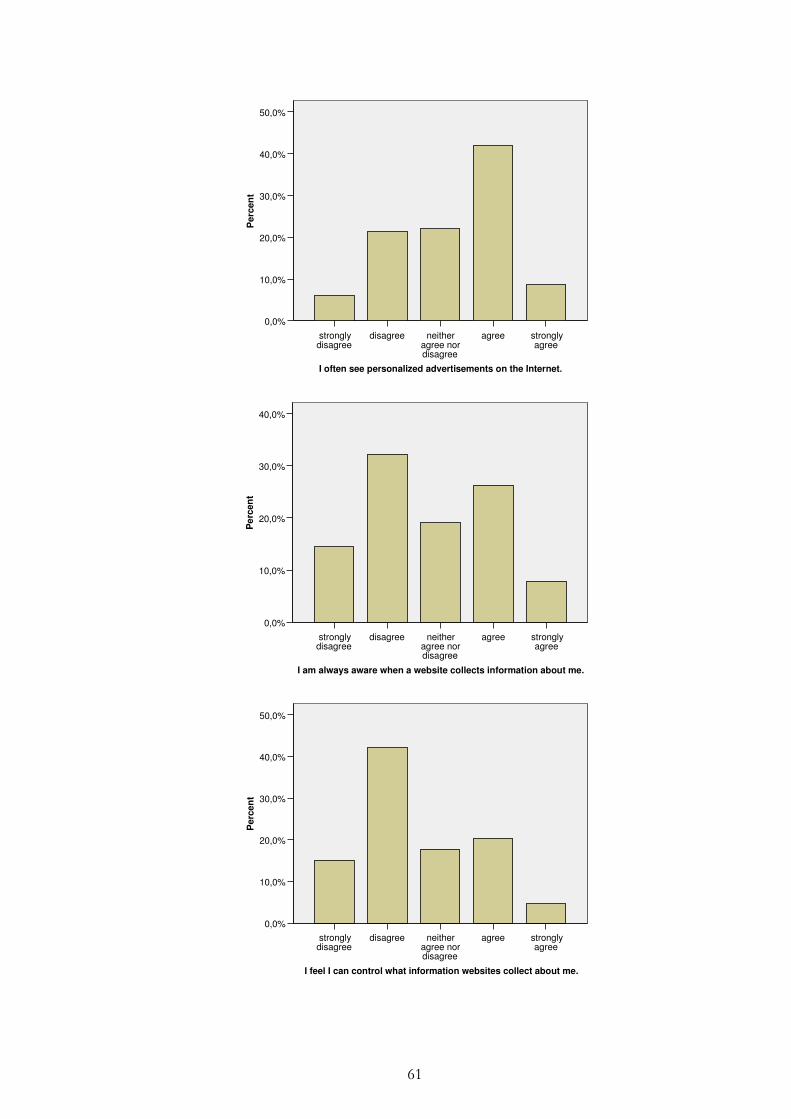
61
strongly agree
agreeneither agree nor disagree
disagreestrongly disagree
I often see personalized advertisements on the Internet.
50,0%
40,0%
30,0%
20,0%
10,0%
0,0%
Perc
en
t
strongly agree
agreeneither agree nor disagree
disagreestrongly disagree
I am always aware when a website collects information about me.
40,0%
30,0%
20,0%
10,0%
0,0%
Pe
rcen
t
strongly agree
agreeneither agree nor disagree
disagreestrongly disagree
I feel I can control what information websites collect about me.
50,0%
40,0%
30,0%
20,0%
10,0%
0,0%
Perc
en
t
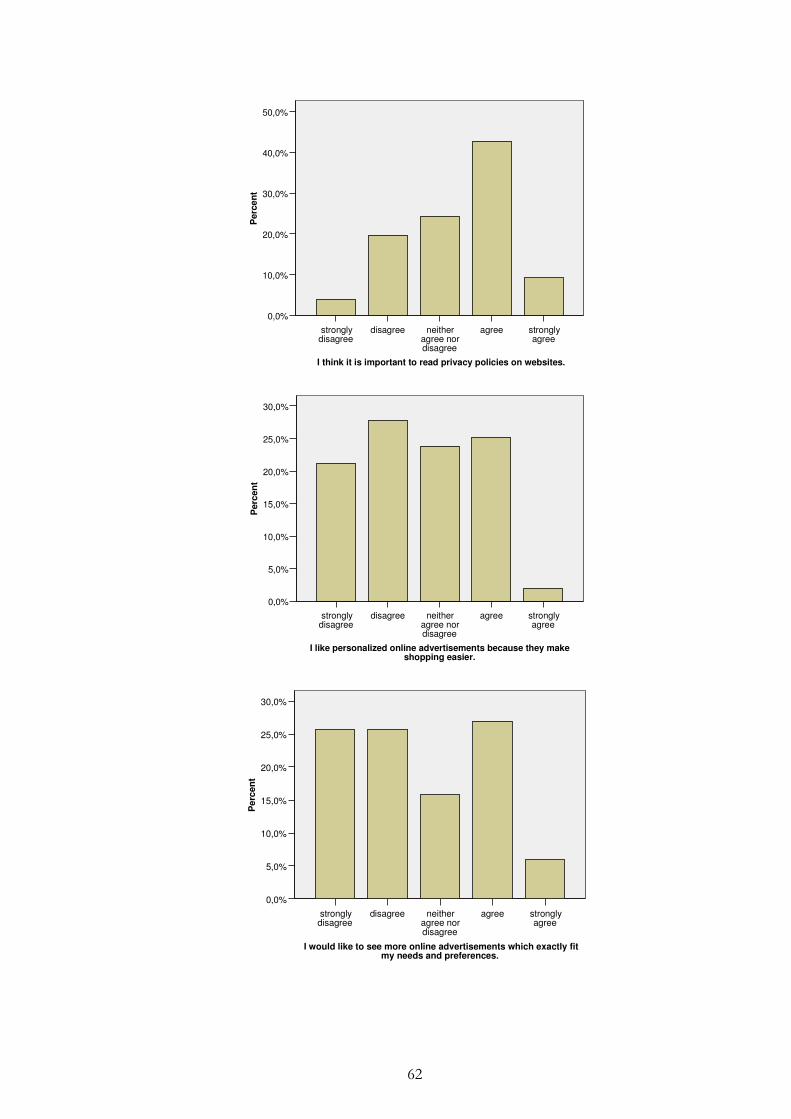
62
strongly agree
agreeneither agree nor disagree
disagreestrongly disagree
I think it is important to read privacy policies on websites.
50,0%
40,0%
30,0%
20,0%
10,0%
0,0%
Perc
en
t
strongly agree
agreeneither agree nor disagree
disagreestrongly disagree
I like personalized online advertisements because they make shopping easier.
30,0%
25,0%
20,0%
15,0%
10,0%
5,0%
0,0%
Perc
en
t
strongly agree
agreeneither agree nor disagree
disagreestrongly disagree
I would like to see more online advertisements which exactly fit my needs and preferences.
30,0%
25,0%
20,0%
15,0%
10,0%
5,0%
0,0%
Perc
en
t
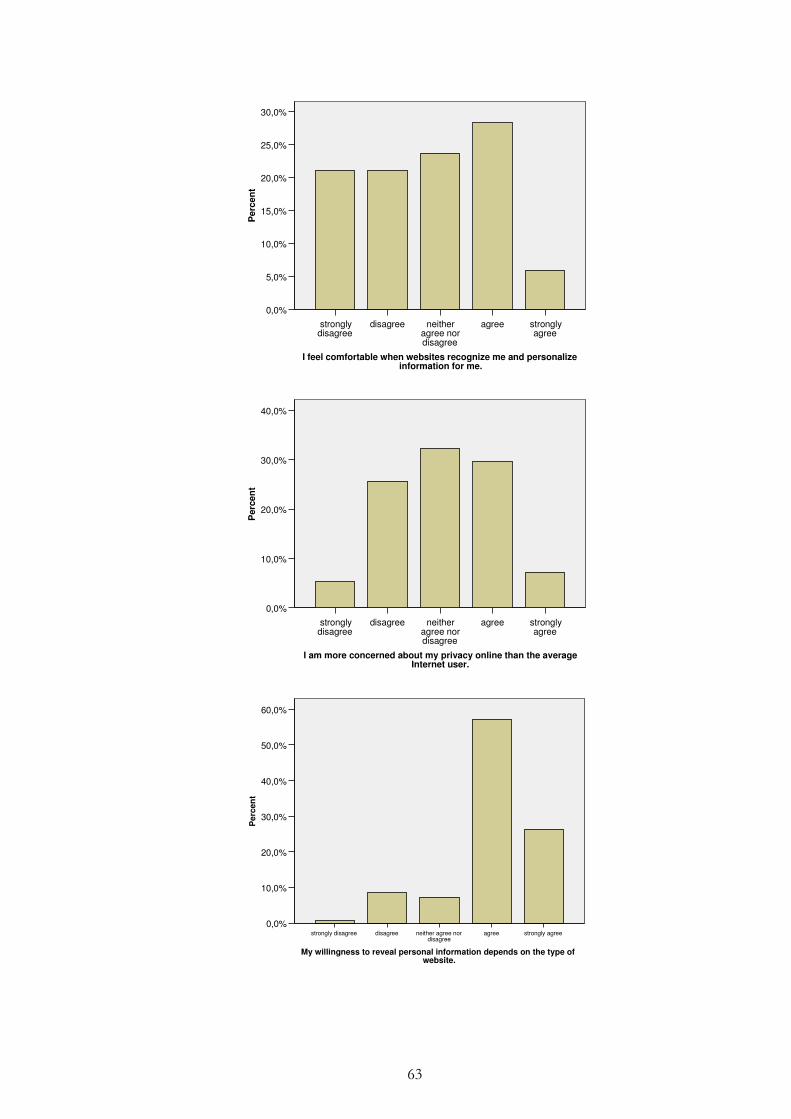
63
strongly agree
agreeneither agree nor disagree
disagreestrongly disagree
I feel comfortable when websites recognize me and personalize information for me.
30,0%
25,0%
20,0%
15,0%
10,0%
5,0%
0,0%
Perc
en
t
strongly agree
agreeneither agree nor disagree
disagreestrongly disagree
I am more concerned about my privacy online than the average Internet user.
40,0%
30,0%
20,0%
10,0%
0,0%
Perc
en
t
strongly agreeagreeneither agree nor disagree
disagreestrongly disagree
My willingness to reveal personal information depends on the type of website.
60,0%
50,0%
40,0%
30,0%
20,0%
10,0%
0,0%
Pe
rce
nt
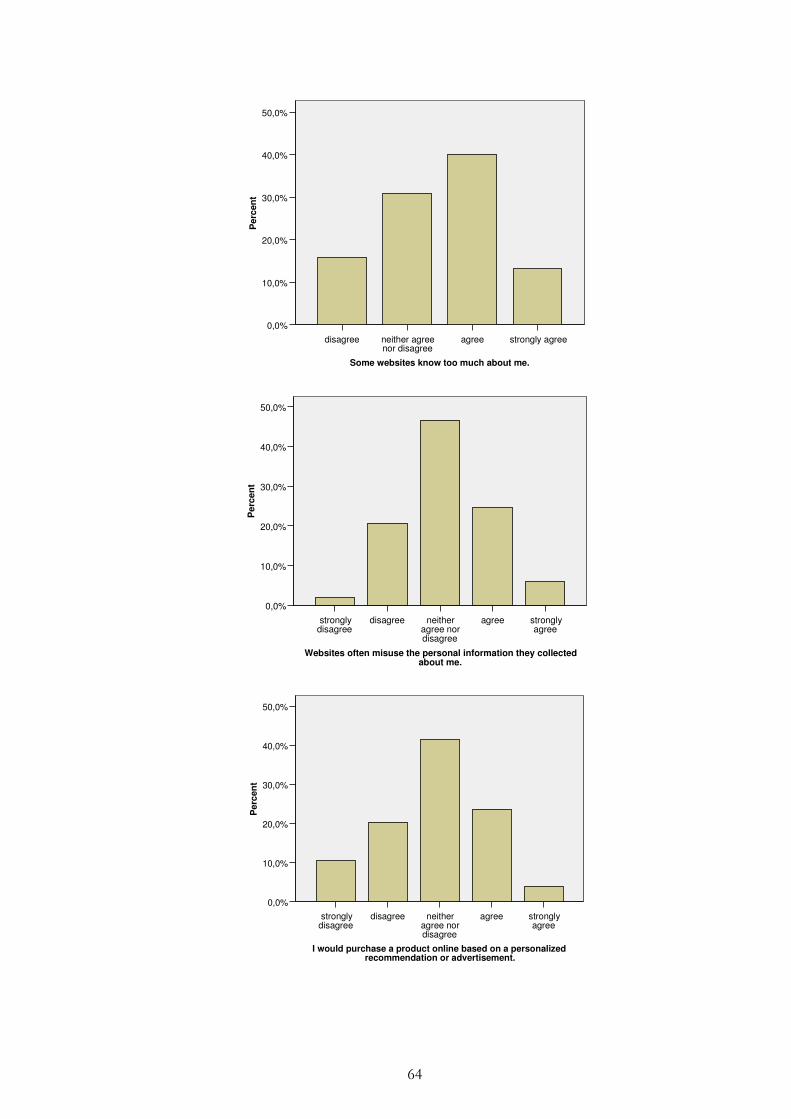
64
strongly agreeagreeneither agree nor disagree
disagree
Some websites know too much about me.
50,0%
40,0%
30,0%
20,0%
10,0%
0,0%
Perc
en
t
strongly agree
agreeneither agree nor disagree
disagreestrongly disagree
Websites often misuse the personal information they collected about me.
50,0%
40,0%
30,0%
20,0%
10,0%
0,0%
Perc
en
t
strongly agree
agreeneither agree nor disagree
disagreestrongly disagree
I would purchase a product online based on a personalized recommendation or advertisement.
50,0%
40,0%
30,0%
20,0%
10,0%
0,0%
Perc
en
t
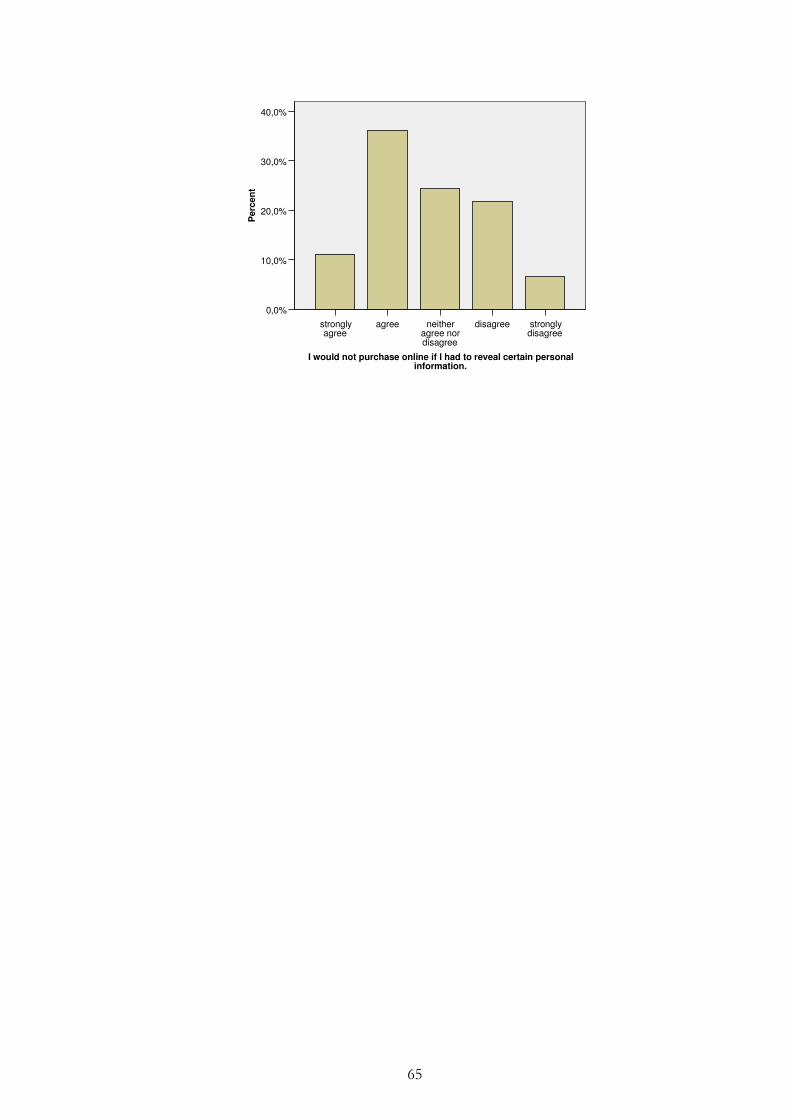
65
strongly disagree
disagreeneither agree nor disagree
agreestrongly agree
I would not purchase online if I had to reveal certain personal information.
40,0%
30,0%
20,0%
10,0%
0,0%
Perc
en
t