(11.3MB) Purpose Megatrends
43
Purpose+ Inspiration Pack, 2015 NOT CONFIDENTIAL OR PROPRIETARY – ENTIRELY SHAREABLE Purpose+, Amstel 95, Amsterdam, The Netherlands Purpose Megatrends
Transcript of (11.3MB) Purpose Megatrends

Purpose+ Inspiration Pack, 2015
NOT CONFIDENTIAL OR PROPRIETARY –ENTIRELY SHAREABLEPurpose+, Amstel 95, Amsterdam, The Netherlands
Purpose Megatrends

Develop a global
partnership for develop-
ment
Eradicate extreme hunger
Achieve universal primary education Ensure
environ-mental sustaina-bility
Improve maternal health
Combat HIV/AIDS/Malaria and other
diseases
Reduce child
mortalityPromote gender
equality and empower women Improve
people’s subjective well-being
Eradicate extreme poverty
Trends: global partnership

Countries are already starting to ‘quantify’ purpose through MDGs...
Source: The Millennium Development Goals Report, 2015 (UN)
19
62
30
126
48
1913
2
64
79
0
10
20
30
40
50
60
70
80
90
2003 2006 2013
0 to 5 6 to 10 11 to 15 16 to 22
Number of indicator series with at least two data points
Proportion of countries and territories in the developing regions with at least two data points for 22 selected MDG indicators
...but together we’re not giving enough of our wealth away to actually reach the targets set by the UN
0.70%
0.23%
0.29%
0.00%
0.10%
0.20%
0.30%
0.40%
0.50%
0.60%
0.70%
0.80%
UN Target Actual, 2002 Actual, 2012
% of Gross National Income
UN Target Actual, 2002 Actual, 2012
Source: OECD, UN
Note: The UK, Denmark, Sweden, Norway, and Luxembourg generally exceed the 0,7% target
Develop a global
partnership for develop-
ment
Eradicate extreme hunger
Achieve universal primary education Ensure
environ-mental sustaina-bility
Improve maternal health
Combat HIV/AIDS/Malaria and other
diseases
Reduce child
mortalityPromote gender
equality and empower women Improve
people’s subjective well-being
Eradicate extreme poverty
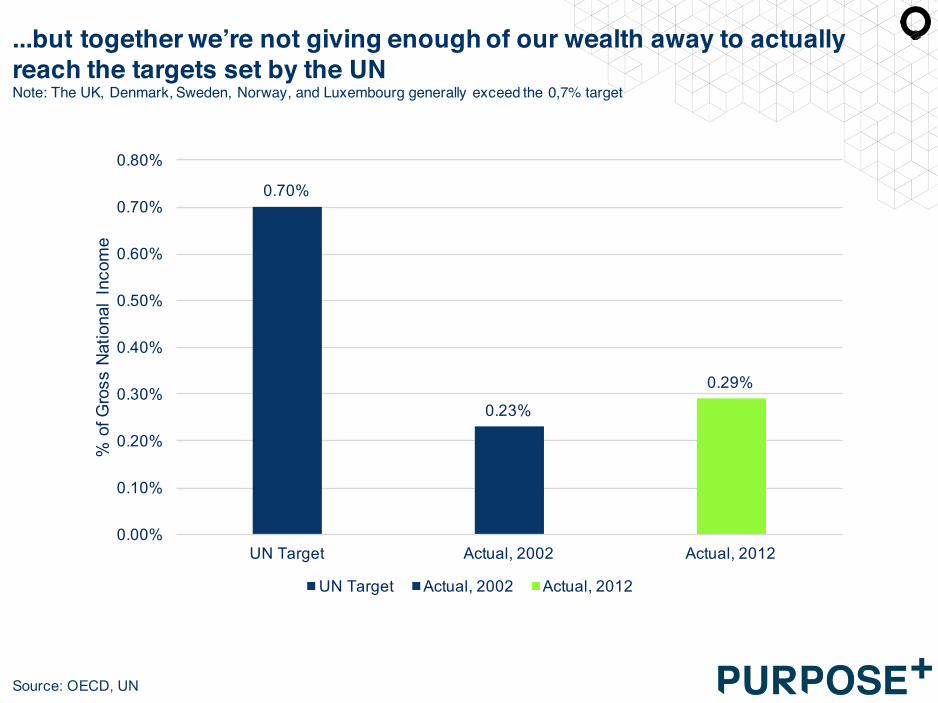
Trends: hunger

The amount of undernourished people is dropping fast – but still 1 in every 9 humans doesn’t have enough to eat on a daily basis
Source: UN MDG report 2015
991 991926 902 940 927
843 793 780
0
200
400
600
800
1000
1200
Number of undernourished people on the planet, millions
23%22% 20%
18% 18% 17%15%
14%13%
00%
05%
10%
15%
20%
25%
Proportion of undernourished people on the planet, %
Common obstacles to reach lower numbers: volatile commodity prices, higher food and energy prices, rising unemployment, economic
recessions and extreme weather events.
Absolute number of undernourished people, millions Proportion of undernourished people, %

Develop a global
partnership for develop-
ment
Eradicate extreme hunger
Achieve universal primary education Ensure
environ-mental sustaina-bility
Improve maternal health
Combat HIV/AIDS/Malaria and other
diseases
Reduce child
mortalityPromote gender
equality and empower women Improve
people’s subjective well-being
Eradicate extreme poverty
Trends: poverty

The decline in poverty has been staggering in absolute terms, with over ~1 billion people lifted out of poverty in ~25 years
Source: UN MDG report 2015
1926 1939
1754 17511632
13711255
1011
836
0
500
1000
1500
2000
2500
Number of people living on less than 1,25 dollar a day worldwide, millions
1990 1993 1996 1999 2002 2005 2008 2011 2015 (projection)

This decline is visible regardless of the population growth
Source: The Millennium Development Goals Report, 2015 (UN)
1990
2015
47%
14%
Amount of people living in extreme poverty, percentage of global population, 1990 and 2015
7,4 billion people
5,3 billion people

The decline in poverty has not led to equal outcomes for all;inequality is on the rise
Source: Piketty, Capital in the Twenty-First Century, 2013;; Angus Deaton, The Great Escape (2013)
25%
30%
35%
40%
45%
50%
1910 1920 1930 1940 1950 1960 1970 1980 1990 2000 2010
Share of top decile in national income
Share of top decile in total income (incl. capital gains)
Excl. capital gains
The distribution of the world output, 1700-2012

Employment opportunities are not rising fast enough – since they are being outpaced by the growing labour force
Source: UN MDG report 2015
41%
47%
58%
58%
57%
63%
67%
74%
67%
43%
46%
53%
60%
62%
65%
67%
68%
68%
Northern Africa
Western Asia
Southern Asia
Caucasus and Central Asia
Latin America and the Caribbean
Sub-Saharan Africa
South-Eastern Asia
Eastern Asia
Oceania
2015 projection 1991
Employment-to-population ratio
Global employment-to-population rate has fallen from 62% to 60%;;
204 million people are still unemployed in 2015.
Youth unemployment rate is almost three times higher than that of adults.

Develop a global
partnership for develop-
ment
Eradicate extreme hunger
Achieve universal primary education Ensure
environ-mental sustaina-bility
Improve maternal health
Combat HIV/AIDS/Malaria and other
diseases
Reduce child
mortalityPromote gender
equality and empower women Improve
people’s subjective well-being
Eradicate extreme poverty
Trends: education

More children are enrolled in school than ever before in our history...
Source: UN MDG report 2015
52%
87%
93%
75%
84%
69%
97%
80%
60%
94%
93%
95%
80%
86%
96%
90%
80%
94%
94%
95%
95%
95%
95%
97%
99%
Sub-Saharan Africa
Latin America and the Carribean
South-Eastern Asia
Caucaus and Central Asia*
Southern Asia
Western Asia
Oceania*
Eastern Asia
Northern Africa
1990
2000
2015 projection
Adjusted net enrolment rate in primary education; 97% is usual treshold for ‘universal education’
* Missing data not available

...but despite the progress still 57 million children are not in school at this point in time
Source: The Millennium Development Goals Report, 2015 (UN)
2000
2015
From 100 million out-of-school children…
…to 57 million million out-of-school children

The number of out-of-school children all live in developing regions...
Source: UN MDG report 2015
Number of out-of-school children of primary school age, millions, world compared to developing regions
103.999.8
57.8 56.7
100.6 97.5
55.2 53.6
0
20
40
60
80
100
120
1990 2000 2012 2015 (projected)
World Developing regions
Children from the poorest households are 4 times more likely to be out of school as children in
the richest households.
Disability is a major factor: in India more than 1 in 3 disabled children aged 6-13 are out of school.

...and boys getting more school hours than girls
7.37
7.67
7.27
6.54
5.78
5.15
0 5 10 15
15
25
35
45
55
65
Age groups on vertical axis, average amount of education years on horizontal axis
8.26
8.61
8.23
7.64
6.73
5.99
0 5 10 15
15
25
35
45
55
65
9.87
10.21
9.72
9.14
8.42
7.49
0 5 10 15
15
25
35
45
55
65
6.63
6.42
5.87
5.07
4.42
4.25
0 5 10 15
15
25
35
45
55
65
7.66
7.37
6.8
6.09
5.15
4.49
0 5 10 15
15
25
35
45
55
65
9.49
9.09
8.23
7.46
6.74
5.97
0 5 10 15
15
25
35
45
55
65
In 1990… …in 2000… …and in 2015
Source: Institute for Health Metrics and Evaluation, University of Washington VizHub (2015)

Conflicts are a huge risk and have forced ~60 million people out of their homes in 2014 alone – with a huge impact on education
Source: UN MDG report 2015
Number of forcibly displaced persons, 2000-2014, millions
0
10
20
30
40
50
60
70
2000 2001 2002 2003 2004 2005 2006 2007 2008 2009 2010 2011 2012 2013 2014
People, millions
Internally displaced persons Refugees and asylum seekers
By the end of 2014, ~60 million people were displaced. This isthe highest level recorded
since WWII.
Chilldren accounted for half of the global refugee population in 2014;; the highest
proportion in 10 years.

Develop a global
partnership for develop-
ment
Eradicate extreme hunger
Achieve universal primary education Ensure
environ-mental sustaina-bility
Improve maternal health
Combat HIV/AIDS/Malaria and other
diseases
Reduce child
mortalityPromote gender
equality and empower women Improve
people’s subjective well-being
Eradicate extreme poverty
Trends: equality

Women remain at a disadvantage in the labour market...
Source: UN MDG report 2015
Distribution of working-age women and men (aged 15 and above) by labour force participation and employed women and men by status in employment, 2015
47%
72%
3%
4%50%
23%
0%
10%
20%
30%
40%
50%
60%
70%
80%
90%
100%
Women Men
Employed Unemployed Economically inactive
Fewer women participate in the labour market… …and they spend more time on family work than men
18%7%
29%37%
2% 4%
52% 52%
0%
10%
20%
30%
40%
50%
60%
70%
80%
90%
100%
Women Men
Wage and salaried workers EmployersOwn-account workers Contributing family workers
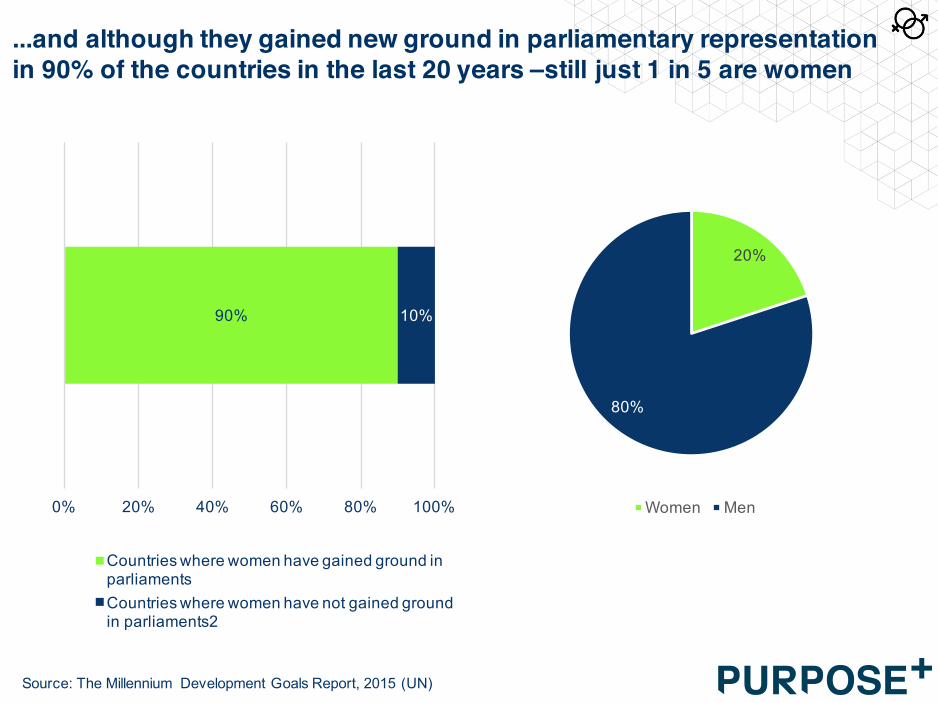
...and although they gained new ground in parliamentary representation in 90% of the countries in the last 20 years –still just 1 in 5 are women
Source: The Millennium Development Goals Report, 2015 (UN)
90% 10%
0% 20% 40% 60% 80% 100%
Countries where women have gained ground in parliamentsCountries where women have not gained ground in parliaments2
20%
80%
Women Men

Develop a global
partnership for develop-
ment
Eradicate extreme hunger
Achieve universal primary education Ensure
environ-mental sustaina-bility
Improve maternal health
Combat HIV/AIDS/Malaria and other
diseases
Reduce child
mortalityPromote gender
equality and empower women Improve
people’s subjective well-being
Eradicate extreme poverty
Trends: sustainability

Energy consumption is on the rise globally, as well as per person
Source: WHO
0
50,000
100,000
150,000
200,000
250,000
300,000
Terawatt*hours
Total energy consumption in Terawatt*hours
0
10
20
30
40
50
60
70
80
Terawatt*hours
Average kWh per person per day
Global use of energy is rising… …and this is partly because people individually use more*
* And partly due to population growth.

Most scenario’s for the future predict a temperature rise by the end of the century of at least 2C°
Source: IPCC scenario’s, 2007;; Information is Beautiful database ‘Gigatons CO2’;; Rahmstorf, Foster, Cazenave (2012), Comparing climate projections to observations up to 2011
0 1 2 3 4 5
Rapid but green growth towards a service economy + clean energy
Globalisation and rapid economic growth;; emphasis on non-fossil
energy sources
Intermediate growth, less rapid technological change
Globalisation and rapid economic growth;; balance between different
energy sources
Independent nations, regionally orientated development
Globalisation and rapid economic growth;; fossil-fuel intensive
development
B1A1T
B2A1B
A2A1FI
Temp in 2090-99, °C higher than 1980-99
The three IEA scenario’s, published in 2012...0 1 2 3 4 5 6 7
Current trends continue
Countries stick to recent pledges to limit emissions
Energy-related CO2 emissions are cut by half by 2050 (compared with
2009) and continue to fall afterwards
Pessimistic
Middle
Optimistic
Long term By 2100
...and the IPCC scenario’s, 2007
Safe limit
* Estimated upper barrier to stay relatively safe** Estimated IPCC projections are closely matched by reality so far;; except sea level rise goes faster than predicted

...which will cause severe damage to our planet and our species
+0,8C° +1,5C° +2C° +3-4C° +5-6C°
Sea level rise by 2100*
Cities drowned
Corn & wheat yields
% more heavy rain over land
% increase power hurricanes
Species at risk of extinction
Happened Inevitable ‘Safe limit’ Tipping point Nightmare
0.85 1.04 1.24 1.43
-10%-20%
-35%
07% 13%23%
39%
Source: Information is Beautiful database ‘Gigatons CO2’;; Rahmstorf, Foster, Cazenave (2012), Comparing climate projections to observations up to 2011
Amsterdam New York Bangkok
?
08% 15%26%
41%
30%40% ?
* Note that the sea level has steadily been rising by ~3,2mm per year from 1993-2011

We have way more energy ‘stored to release’ than our environment can safely handle, and energy firms will play a large role
1970
Fossil fuel reserves of energy
companies;; 760 Gigatons
Remaining reserves that could be developed;; 780 Gigatons
Other reserves (incl. state-owned);; 1320 Gigatons
850
The amount of CO2 we have released since 1850...
...the amount we could safely* release: our carbon budget...
...and the amount that is left to release within current reserves (2860 Gigatons).
* Before 2015 and still have an 80% chance of staying below 2C°warmingSource: IPCC scenario’s, 2007;; Information is Beautiful database ‘Gigatons CO2’

CO2 emissions in the developing regions rise fast
Source: UN MDG Report, 2015
21.6
6.7
14.9
23.8
9.9
13.9
33
19.8
13.1
0
5
10
15
20
25
30
35
World Developing regions Developed regions
Billionsof metrictons, carbon dioxide
1990 2000 2012
Emissions of carbon dioxide, 1990, 2000 and 2012*, in billions of metric tons
* data for 2012 are preliminary estimates.
Increase of 100% in the last ~12 years
Decrease of ~6% in last ~12 years

There are many theoretical climate change solutions that could work, but they are not undertaken due to many reasons
Source: dataset provided by David McCandless, Knowledge is Beautiful
Ratings on methods to combat global warming, the Royal Society, 2009
0 2 4 6 8 10 12 14 16
CCS at source
Carbon taxes with trade monitoring
Afforestation
Stratospheric aerosols
CO2 air capture
Enhanced weathering
BECS
Cloud albedo
Surface albedo (urban)
Space reflectors
Biochar
Surface albedo (desert)
Ocean fertilisation
Effectiveness
Affordability
Timeliness
Safety

We face a severe extinction of species if we continue on our path – with predictions showing huge amounts of species threatened
36%
14%
56%
42%
21%
13%
31%
39%
25%
13%
41% 41%
0%
10%
20%
30%
40%
50%
60%
Mammals Birds Amphibians Gymnosperms (plant species)
Number of threatened species*, %
Upper estimate, % Lower estimate, % Best estimate, %
Source: IUCN Red List
* Most species are not covered well enough to provide useful data;; out of the 23 species on the list, just 5 have sufficient data coverage** Threatened: either critically endangered, endangered or vulnerable

We will face tipping points within the next decades on non-renewables when usage remains constant
Source: Information is Beautiful (2012)
175
85
65
41
35
35
80
54
43
28
24
9
0 20 40 60 80 100 120 140 160 180 200
Rainforests
Coral reefs
Agricultural land
Coal
Gas
Oil
Phosphorus
Tantalum
Titanium
Uranium
Copper
Indium
Remainder of years for non-renewables, from 2015
2050: 1/3 of land, plant, andanimals species extinct due
to climate change.
0 = 2015, calculations assume fixed % yearly consumption rate
2060: dangerous tippingpoint of 2C global warming.
End of Brazilian rainforest. Indonesia will be deforested~100 years earlier already.

Develop a global
partnership for develop-
ment
Eradicate extreme hunger
Achieve universal primary education Ensure
environ-mental sustaina-bility
Improve maternal health
Combat HIV/AIDS/Malaria and other
diseases
Reduce child
mortalityPromote gender
equality and empower women Improve
people’s subjective well-being
Eradicate extreme poverty
Trends: subjective well-being

On our planet, roughly 17% is flourishing
61%44%
40%39%39%
37%37%36%
34%34%
7%7%6%6%6%5%5%
3%1%1%
PanamaCosta RicaDenmarkAustriaBrazil
UruquayEl SalvadorSweden
GuatemalaCanada
GeorgiaCroatiaBenin
UgandaMadagascar
ChadCongoHaïti
AfghanistanSyria
Flourishing in 3+ elements
17% on average globally
Source: Gallup, State of Global Well-Being, 2015

We tend to be quite pessimistic in developing countries about our future, and more optimistic about our future in emerging economies
58%
60%
61%
64%
64%
68%
72%
66%
85%
34%
32%
31%
27%
26%
25%
18%
15%
14%
0% 20% 40% 60% 80% 100% 120%
Germany
US
Spain
Canada
Australia
UK
Japan
Italy
France
Worse off Better off
When children today grow up, will they be ... financially than their parents?*
Source: Spring 2015 Global Attitudes survey. Q6.
7%
5%
11%
18%
16%
21%
35%
34%
18%
91%
86%
84%
74%
67%
65%
61%
55%
51%
0% 20% 40% 60% 80% 100% 120%
Vietnam
China
Nigeria
India
Chile
Peru
Brazil
Argentina
Indonesia
Worse off Better off
Advanced economies... ...and emerging economies
* Note that numbers don’t add to 100 due to not showing of the ‘same’ category.

Develop a global
partnership for develop-
ment
Eradicate extreme hunger
Achieve universal primary education Ensure
environ-mental sustaina-bility
Improve maternal health
Combat HIV/AIDS/Malaria and other
diseases
Reduce child
mortalityPromote gender
equality and empower women Improve
people’s subjective well-being
Eradicate extreme poverty
Trends: combat diseases

Millions of deaths per year on our planet occur due to diseases we know how to treat – but don’t spend enough money on
Source: World Health Organization, Global Health Observatory Data Repository – as mentioned by Angus Deaton in The Great Escape (2013)
Millions of deaths in 2008, based on income category quartiles (only bottom and top quartile shown)
1.07
0.730.8
0.76
0.40.48
0.120.17 0.16
0.35
0.02 0.04 0.02 0.01 0 0 0.02 00
0.2
0.4
0.6
0.8
1
1.2
Respiratory infections*
Perinatal deaths**
Diarrheal disease
HIV/aids Tuberculose Malaria Childhood diseases***
Nutritional deficiencies
Maternal mortality
Low-income High-income
* E.g. pneumonia, bronchitis, influenza** Deaths of children at birth or immediately thereafter*** Whooping cough, diphtheria, polio, measles and tetanus
Total amount of preventable deaths annually if income gap was overcome: 4,23
million

We have had some successes with malaria – with more than 900 million insecticide-treated nets delivered to countries
Source: UN MDG report 2015
Proportion of children under age five sleeping under insecticide-treated nets*, 2001 and 2013
* Insecticide-treated nets are one of the best interventions to prevent malaria
1% 1% 1% 1%
9%2% 2%
15%
2% 1% 1% 0%3%
7%2% 4%
17%20%
37%41% 41% 43%
46% 47% 49%54% 56%
62%66%
70% 72% 74%
0%
10%
20%
30%
40%
50%
60%
70%
80%
Around 2001 Around 2013

Some diseases have been eradicated, but we now face different opponents on the road to longevity
-100.00% -100.00%
-82.00% -78.00%
-51.00% -51.00%
-7.00%
27.00%35.00%
-120.00%
-100.00%
-80.00%
-60.00%
-40.00%
-20.00%
0.00%
20.00%
40.00%
60.00%
Smallpox Rinderpest Measles Tetanus Rabies Whooping cough
COPD Stroke Coronary heart disease
Change in number of deaths, compared to 1990
Source: WHO
Complete eradication*
* Other diseases that are deemed eradicable are Polio and Guinea Worm Disease. Potentially eradicable are Measles, Mumps, Rubella, Lymphatic Filariasis and Pork Tapeworm.
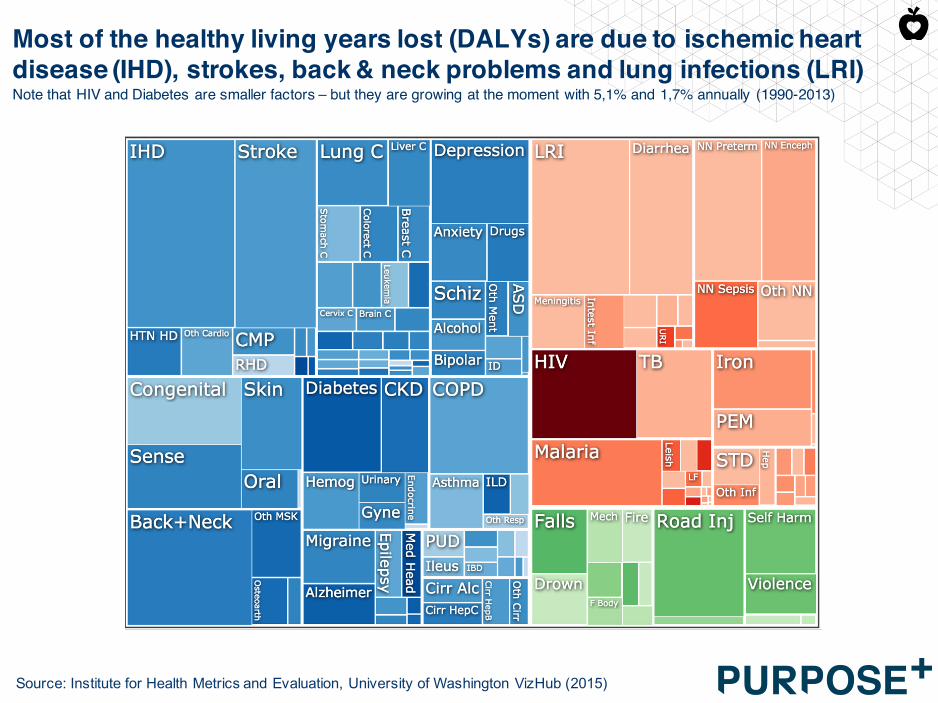
Most of the healthy living years lost (DALYs) are due to ischemic heart disease (IHD), strokes, back & neck problems and lung infections (LRI)
Source: Institute for Health Metrics and Evaluation, University of Washington VizHub (2015)
Note that HIV and Diabetes are smaller factors – but they are growing at the moment with 5,1% and 1,7% annually (1990-2013)

Develop a global
partnership for develop-
ment
Eradicate extreme hunger
Achieve universal primary education Ensure
environ-mental sustaina-bility
Improve maternal health
Combat HIV/AIDS/Malaria and other
diseases
Reduce child
mortalityPromote gender
equality and empower women Improve
people’s subjective well-being
Eradicate extreme poverty
Trends: maternal health

Global maternal mortality has declined by 45% worldwide, with thegreatest reduction in the last 15 years
Source: The Millennium Development Goals Report, 2015 (UN), Purpose+ database
380
330
210
0
50
100
150
200
250
300
350
400
1990 2000 2013
1990 2000 2013

Develop a global
partnership for develop-
ment
Eradicate extreme hunger
Achieve universal primary education Ensure
environ-mental sustaina-bility
Improve maternal health
Combat HIV/AIDS/Malaria and other
diseases
Reduce child
mortalityPromote gender
equality and empower women Improve
people’s subjective well-being
Eradicate extreme poverty
Trends: child mortality

We live longer today than ever before in our history, but much of the numbers have to do with reduced child mortality...
20
26 2825 26 26
31
49
6771
0
10
20
30
40
50
60
70
80
Life expectancy
Source: Galor et al. (2007) The Neolithic Revolution and Contemporary Variations in Life Expectancy; www.ourworldindata.org; Frier (2001) More is worse: some observations on the population of the Roman empire; www.wikipedia.org; CIA The World Factbook; WHO.
Partly due to child mortality rates;; where 300-
500 per 1,000 was ‘normal’...
In industrialized countries child mortality is below 5/1000 today!

...which has made great final progress in the last 25 years
Source: UN MDG report 2015
179
54
71
73
126
65
74
53
73
86
17
27
33
50
23
51
11
24
Sub-Saharan Africa
Latin America and the Carribean
South-Eastern Asia
Caucaus and Central Asia*
Southern Asia
Western Asia
Oceania
Eastern Asia
Northern Africa
1990 2015
Under-five mortality rate, 1990 and 2015, deaths per 1,000 births

For more information:[email protected]