Modelling and Simulation of a DC Motor Drive - Aalto · Modelling and Simulation of a DC Motor...
12
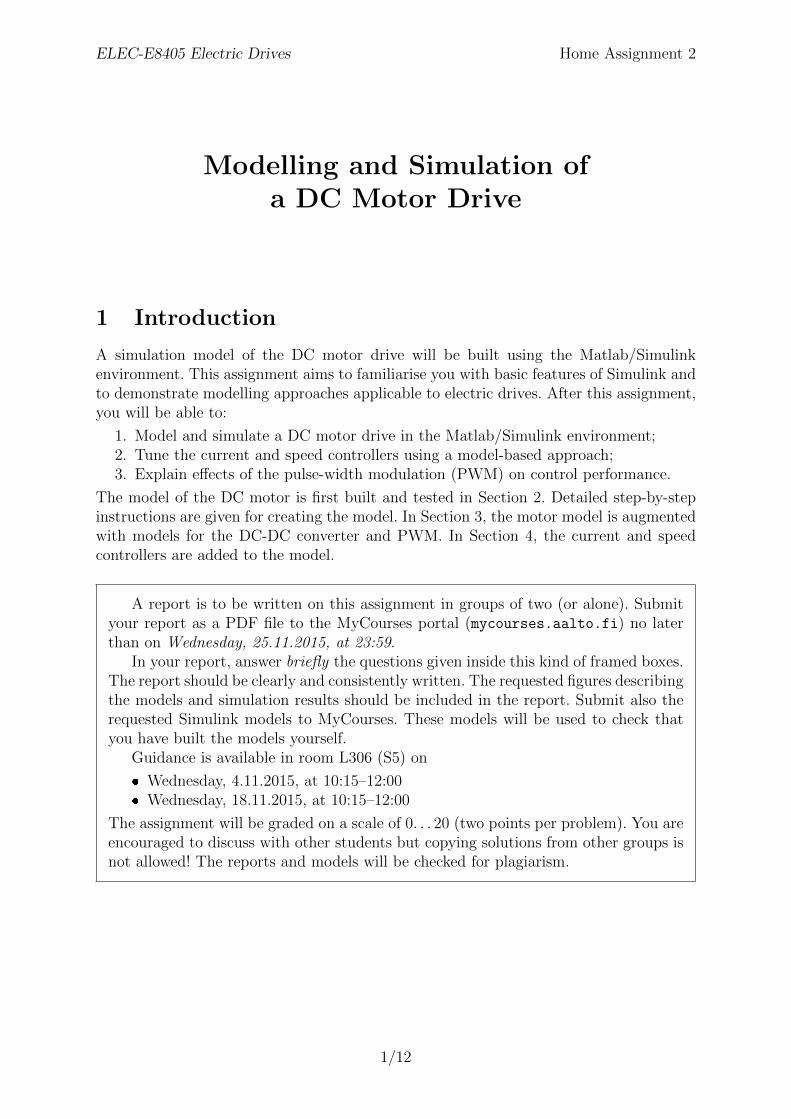
ELEC-E8405 Electric Drives Home Assignment 2 Modelling and Simulation of a DC Motor Drive 1 Introduction A simulation model of the DC motor drive will be built using the Matlab/Simulink environment. This assignment aims to familiarise you with basic features of Simulink and to demonstrate modelling approaches applicable to electric drives. After this assignment, you will be able to: 1. Model and simulate a DC motor drive in the Matlab/Simulink environment; 2. Tune the current and speed controllers using a model-based approach; 3. Explain effects of the pulse-width modulation (PWM) on control performance. The model of the DC motor is first built and tested in Section 2. Detailed step-by-step instructions are given for creating the model. In Section 3, the motor model is augmented with models for the DC-DC converter and PWM. In Section 4, the current and speed controllers are added to the model. A report is to be written on this assignment in groups of two (or alone). Submit your report as a PDF file to the MyCourses portal (mycourses.aalto.fi) no later than on Wednesday, 25.11.2015, at 23:59. In your report, answer briefly the questions given inside this kind of framed boxes. The report should be clearly and consistently written. The requested figures describing the models and simulation results should be included in the report. Submit also the requested Simulink models to MyCourses. These models will be used to check that you have built the models yourself. Guidance is available in room L306 (S5) on Wednesday, 4.11.2015, at 10:15–12:00 Wednesday, 18.11.2015, at 10:15–12:00 The assignment will be graded on a scale of 0. . . 20 (two points per problem). You are encouraged to discuss with other students but copying solutions from other groups is not allowed! The reports and models will be checked for plagiarism. 1/12
Transcript of Modelling and Simulation of a DC Motor Drive - Aalto · Modelling and Simulation of a DC Motor...
ELEC-E8405 Electric Drives Home Assignment 2
Modelling and Simulation ofa DC Motor Drive
1 Introduction
A simulation model of the DC motor drive will be built using the Matlab/Simulinkenvironment. This assignment aims to familiarise you with basic features of Simulink andto demonstrate modelling approaches applicable to electric drives. After this assignment,you will be able to:
1. Model and simulate a DC motor drive in the Matlab/Simulink environment;2. Tune the current and speed controllers using a model-based approach;3. Explain effects of the pulse-width modulation (PWM) on control performance.
The model of the DC motor is first built and tested in Section 2. Detailed step-by-stepinstructions are given for creating the model. In Section 3, the motor model is augmentedwith models for the DC-DC converter and PWM. In Section 4, the current and speedcontrollers are added to the model.
A report is to be written on this assignment in groups of two (or alone). Submityour report as a PDF file to the MyCourses portal (mycourses.aalto.fi) no laterthan on Wednesday, 25.11.2015, at 23:59.
In your report, answer briefly the questions given inside this kind of framed boxes.The report should be clearly and consistently written. The requested figures describingthe models and simulation results should be included in the report. Submit also therequested Simulink models to MyCourses. These models will be used to check thatyou have built the models yourself.
Guidance is available in room L306 (S5) on
Wednesday, 4.11.2015, at 10:15–12:00 Wednesday, 18.11.2015, at 10:15–12:00
The assignment will be graded on a scale of 0. . . 20 (two points per problem). You areencouraged to discuss with other students but copying solutions from other groups isnot allowed! The reports and models will be checked for plagiarism.
1/12

ELEC-E8405 Electric Drives Home Assignment 2
2 DC Motor Model
2.1 Dynamic Equations
First, a simulation model of the permanent-magnet DC motor will be built. The followingstate equations are taken as a starting point:
Ladiadt
= ua −Raia − kfωM (1a)
JdωM
dt= kfia − TL (1b)
The armature voltage ua and the load torque TL are the inputs of the model. The armaturecurrent ia and the angular rotor speed ωM are the outputs of the model. Rating andparameters of the motor are given in Table 1.
Table 1: Rating and parameters of the DC motor.
Rated voltage UN 120 VRated current IN 20 ARated speed nN 3000 r/minRated torque TN 7 NmArmature resistance Ra 0.5 ΩArmature inductance La 2.5 mHFlux constant kf 0.35 VsTotal moment of inertia J 0.001 kgm2
(a) (b)
Figure 1: Blocks needed to build the DC motor model: (a) Drag and drop these blocks from the LibraryBrowser to your model; (b) Rename the input and output signals by selecting their names and typingnew names. Double click the Sum and Gain blocks and specify them according to the figure.
2/12

ELEC-E8405 Electric Drives Home Assignment 2
2.2 Building the Model
Start Simulink by writing the command simulink in the Matlab Command Window.The Simulink Library Browser opens up, and you can see the blocks available. Createa new Simulink model using the button or the menu (File→New→Model). For the DCmotor model, you will need the blocks shown in Fig. 1(a). Drag and drop these blocksfrom the Library Browser to your new model. Then, rename the input and output signalsby selecting their names and typing new names according to Fig. 1(b). Double click theSum and Gain blocks and specify them according to Fig. 1(b).
Next, connect the blocks according to the equations given in (1). Use the current iaand the speed ωM as state variables in your model. This means that the output of oneintegrator block should be the current ia and the output of the other integrator blockshould be the speed ωM. The inputs of these integrator blocks should be dia/dt anddωM/dt, which you can solve from (1).
Create the subsystem from your model. You can create the subsystem by selecting allthe blocks and then right-clicking one of the selected blocks. This opens a menu similarto one shown in Fig. 2, where you should choose Create Subsystem from Selection. Youcan rename the new subsystem as DC Motor (click its name and type the new name).
Next, the subsystem will be masked. Open the Mask Editor by right-clicking the sub-system and choosing Mask→Create Mask. In the Mask Editor, choose the pane Parameters& Dialog. Mask the subsystem according to Fig. 3. After you have masked it, you can setnumerical values for the model parameters by double-clicking the subsystem, cf. Fig. 4.
Open the Configuration Parameters window, e.g., using the menu: Simulation→ModelConfiguration Parameters. Set the values 0.5 and 1e-4 for the parameters Stop time andMax step size, respectively, according to Fig. 5. Remember to save your model regularly.
Figure 2: Creating a subsystem.
3/12

ELEC-E8405 Electric Drives Home Assignment 2
2.3 Testing the Model
Before starting to build the control system, the motor model will be tested. Connect theblocks Step and To Workspace to the motor model according to Fig. 6. Specify the namesof the workspace variables to which the To Workspace block writes the data according to
Figure 3: Masking the subsystem.
Figure 4: Giving numerical values for parameters.
4/12

ELEC-E8405 Electric Drives Home Assignment 2
the figure. Specify the voltage step block so that the voltage is stepped to its rated value120 V at t = 0.1 s. The load torque should be stepped to its rated value at t = 0.3 s.
Simulate the model, for example, using the menu: Simulation→Run. After the simu-lation, you can plot the results in the Matlab workspace using the following commands:
subplot(2,1,1); % Divides the figure to two subplotsplot(ia.time,ia.data); grid on;%IN = 20; % Rated current%plot(ia.time,ia.data/IN); % This would plot the p.u. currentxlabel('Time (s)'); ylabel('Current (A)');subplot(2,1,2);plot(wM.time,wM.data); grid on;xlabel('Time (s)'); ylabel('Speed (rad/s)');
It is practical to write and save these commands as a script (e.g., using the name fig.m)and then run the script by typing its name (fig) in the workspace. This way you caneasily edit and reuse your scripts. The simulation results should look similar to thoseshown in Fig. 7. If they look different, you should debug your model.
Figure 5: Configuration parameters. Set the new values for the parameters Stop time and Max step size.
5/12

ELEC-E8405 Electric Drives Home Assignment 2
Figure 6: Step inputs for the voltage and load torque.
Figure 7: Rated voltage step at t = 0.1 s and rated load torque step t = 0.3 s.
Figure 8: Rate limiter. Select the continuous sample time mode.
6/12

ELEC-E8405 Electric Drives Home Assignment 2
1. Simulate the sequence corresponding to Fig. 7. Modify the plotting script sothat the per-unit current and the per-unit speed are plotted (use their ratedvalues as base values and do not normalize time). Show this result in yourreport. Remember to change the axis labels. Explain why there is a very largepeak in the current after the voltage step is applied.
2. Using the analytical motor model, calculate the values for the current ia andthe rotor speed ωM in the steady state, when the voltage ua = UN and the loadtorque TL = TN. Compare these values to your simulation results.
3. Limit the rising rate of the voltage to 120 V/0.1 s using the Rate Limiter block, cf.Fig. 8. Place this block between the voltage step and the motor model. Simulatethe model and show the results in your report. Briefly comment on the currentand speed responses.
3 DC-DC Converter and Unipolar PWM
The motor is fed from a four-quadrant DC-DC converter, whose DC-bus voltage is Udc =140 V. Ideal power switches are assumed. Hence, the converter can be modelled using theequivalent circuit shown in Fig. 9(a).
The switching states of the two bi-positional switches are denoted by qA and qB.The value of the switching state is 1 if the switch is connected to the positive potentialof the DC bus and otherwise 0. The instantaneous output voltage of the converter isua = uAN − uBN, where uAN is the voltage between potentials A and N and uBN is thevoltage between potentials B and N. Hence, the instantaneous output voltage can beexpressed as
ua = (qA − qB)Udc (2)
Udc
ia
qA
qBPWMua,ref
ua
A
B
N
(a)
qA
t
t
t
ua
qB
Tsw
0
0
0
1
1
Udcua,ref
dA
dB
carrier
(b)
Figure 9: (a) Equivalent circuit of the four-quadrant DC-DC converter. The potentials A, B, and Nare marked in the circuit. The positions of the bi-positional switches in the figure correspond to theswitching states qA = 1 and qB = 0, and the output voltage is ua = Udc. (b) Example waveforms inunipolar PWM.
7/12

ELEC-E8405 Electric Drives Home Assignment 2
The average voltage over the switching cycle is
ua = (dA − dB)Udc (3)
where 0 ≤ dA ≤ 1 and 0 ≤ dB ≤ 1 are the duty cycles.The switching states of the chopper are to be generated using unipolar PWM, whose
operating principle is illustrated in Fig. 9(b). The references for the duty cycles aredetermined by
dA =1
2
(1 +
ua,refUdc
), dB =
1
2
(1− ua,ref
Udc
)(4)
where ua,ref is the reference voltage. The duty ratios are compared to the carrier signal,which is a triangular wave alternating between 0 and 1 and having a period of Tsw =200 µs. When the duty ratio is higher than the carrier, the corresponding switching stateis 1 and otherwise 0. An implementation of unipolar PWM is shown in Fig. 10(a).
For simulating fast switching phenomena with good accuracy, the solver time stepshould be a few decades shorter than the switching period (or, alternatively, the solvershould be informed about the switching instants). Open the Configuration Parameterswindow and set the value 1e-6 for the parameter Max step size (cf. Fig. 5). Naturally,the simulation becomes slower due to the shorter time step.
(a)
(b)
Figure 10: (a) Simulink implementation of unipolar PWM. (b) Motor model with unipolar PWM andconverter model. Specify the Repeating Sequence block by setting Tsw*[0 0.5 1] for the Time values and[1 0 1] for the Output values. The Zero-Order Hold block represents sampling synchronised to the PWM(set the value Tsw/2 for the Sampling period parameter). You can assign the values for the variables Udcand Tsw either via masking the subsystem (as was done in the case of the DC motor) or simply via theMatlab workspace (i.e., type Udc = 140 and Tsw = 200e-6 in the workspace).
8/12

ELEC-E8405 Electric Drives Home Assignment 2
4. Augment your simulation model with unipolar PWM and converter models.Your model should look similar to the model in Fig. 10(b). Simulate the modeland show the results in your report. Briefly comment on differences comparedto the previous simulation, where an ideal voltage source was assumed. Submitthis version of your simulation model to MyCourses.
5. Plot the waveforms of the actual current ia and the synchronously sampledcurrent ia k in the same subplot. Show also the waveform of the voltage ua.You can plot the results using the following script:
subplot(2,1,1)plot(ia.time,ia.data); grid on; hold on;stairs(ia k.time,ia k.data,'r'); % Discrete signalaxis([0.15 0.1504 9 11]); % Controls axis scalingxlabel('Time (s)'); ylabel('Current (A)');subplot(2,1,2)plot(ua.time,ua.data); grid on;axis([0.15 0.1504 −10 150]);xlabel('Time (s)'); ylabel('Voltage (V)');
Show the results in your report and briefly comment on them.
4 Cascaded Control
The control system of the DC motor is shown in Fig. 11. The control structure is cascaded:the outer loop is the speed control loop and the inner loop is the current-control loop.For simplicity, the switching harmonics due to the PWM will be omitted in the following(but the voltage saturation will be taken into account).
Save the simulation model you have made, and copy it using a new name for thefollowing changes. You can remove the PWM and converter models. In order to speed upyour simulations, open the Configuration Parameters window and set 1e-4 for the Maxstep size parameter.
4.1 Current Control
Augment your simulation model according to Fig. 12(a). An implementation of the 2DOFPI current controller with the anti-windup scheme is shown in Fig. 12(b). You can tune the
Currentcontroller
ωM,refSpeed
controller PWMua,ref
ia
ωM
ia,ref1
kf
TM,ref qA, qB
iaua
Udc
Figure 11: Cascaded control system of the DC motor. In the following, PWM and converter models areomitted for simplicity.
9/12

ELEC-E8405 Electric Drives Home Assignment 2
controller using the following script, which you should run before starting the simulation:
clear; % Removes variables from the workspace%% Parameter estimatesRa = 0.5; % Armature resistanceLa = 2.5e−3; % Armature inductancekf = 0.35; % Flux constantJ = 1e−3; % Moment of inertia%% Gains of the 2DOF PI current controlleralphac = 2*pi*500; % Closed−loop bandwidthkpc = alphac*La; % Proportional gainkic = alphacˆ2*La; % Integral gainr = kpc − Ra; % Active resistanceUmax = 140; % Saturation: upper limitUmin = −140; % Saturation: lower limit%% Gains of the 2DOF PI speed controller (for Section 4.2)%alphas = 0.1*alphac; % Closed−loop bandwidth%kps = ...; % Proportional gain%kis = ...; % Integral gain%b = ...; % Active damping%TN = 7; % Rated torque%Tmax = 2*TN; % Saturation: upper limit%Tmin = −2*TN; % Saturation: lower limit
Test your model using a 1-Nm 100-Hz square-wave torque reference. The results shouldlook similar to those in Fig. 13.
6. Calculate the theoretical rise time of the torque and compare it to the simulatedrise time.
4.2 Speed Control
Finally, the 2DOF PI speed controller will be implemented and tuned. This controller hasa similar structure as the 2DOF PI current controller. An implementation of the controlsystem is shown in Fig. 14.
(a) (b)
Figure 12: (a) Torque control. For testing the model, specify the Signal Generator block to generate thesquare wave with an amplitude of 1 Nm and a frequency of 100 Hz. (b) 2DOF PI current controller withanti-windup. Set Umax for the upper limit and Umin for the lower limit in the Saturation block.
10/12

ELEC-E8405 Electric Drives Home Assignment 2
7. A term proportional to the measured speed is subtracted from the output T ′M,ref
of the PI speed controller, i.e. TM,ref = T ′M,ref−bωM, where b is the active damping
constant. Derive the transfer function G′(s) from T ′M,ref to the angular speed ωM
assuming the current control to be ideal (i.e., the torque equals its reference).Based on this result, give the tuning equations for the 2DOF PI speed controller.
8. Tune the speed controller of your simulation model for the closed-loop band-width αs = αc/10. Test your model using the square-wave speed reference,whose amplitude is 160 rad/s and frequency is 4 Hz. Generate the rated loadtorque step at t = 0.3 s. Show results of this simulation in your report. Showalso the figures describing the main level of your simulation model and theimplemented speed controller. Submit this version of your Simulink model toMyCourses (including your initialisation script).
9. This problem aims to illustrate the robustness of the closed-loop control schemeagainst parameter errors. Generally, resistances depend on temperature (about0.4%/K) and inductances may vary due to the magnetic saturation. Change theactual armature resistance in the motor model to 150% of the original value andthe actual armature inductance to 70% of the original value, but do not changethe values in the control system. Simulate the model. Show the results andcomment on them in your report. After this problem, restore these parametervalues back to their original values.
10. This problem aims to illustrate the importance of the anti-windup scheme. Re-move the anti-windup in the speed controller (but do not remove the saturationof the controller output). Show results of your simulation and comment on them.
Figure 13: Testing of the torque controller with a 1-Nm 100-Hz square-wave torque reference.
11/12

ELEC-E8405 Electric Drives Home Assignment 2
Figure 14: Cascaded control. Specify the Signal Generator block to generate the square wave with anamplitude of 160 rad/s and a frequency of 4 Hz. Specify the Step block to generate the rated torque stepat t = 0.3 s.
Give Us Feedback
In order to improve this assignment, please give us feedback. In order to estimate thestudent workload, we would also be happy to know how many hours did you use to dothis assignment. All other comments are also welcome.
12/12