New Simulation Methods to Facilitate Achieving a Mechanistic
Mechanistic Modelling and Simulation in Medicines Development:
Diabetes
Maria C. Kjellsson, PhD
Pharmacometrics Research Group
Dept of Pharmaceutical Biosciences
Uppsala University
Sweden
2 Maria Kjellsson The Pharmacometrics Research Group, Uppsala University
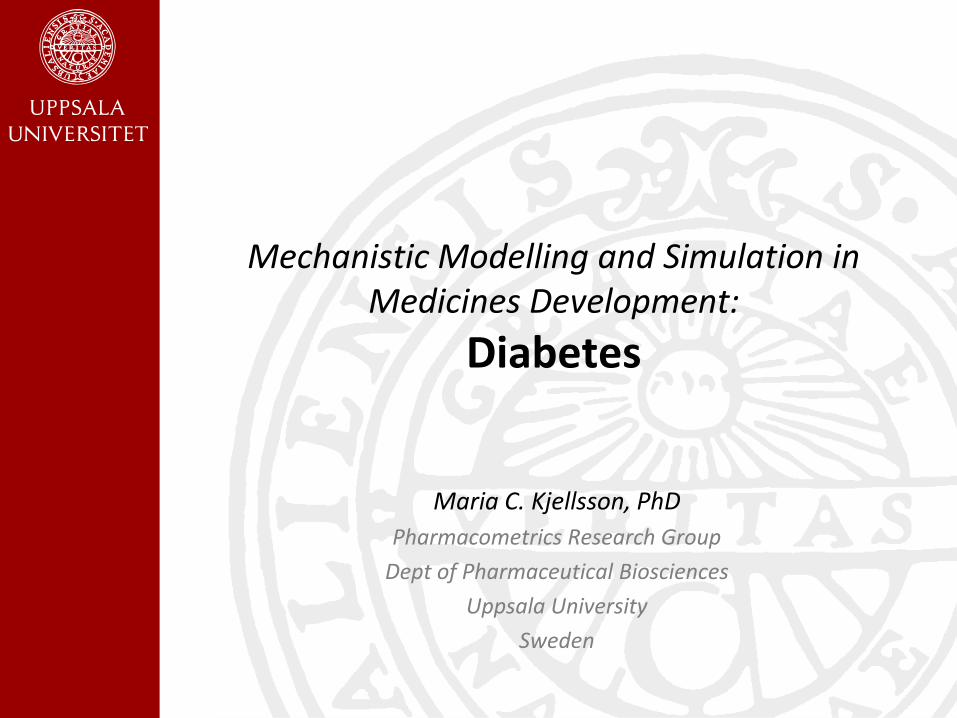
Glucose-Insulin System The glucose homeostatis is tightly regulated
3 Maria Kjellsson The Pharmacometrics Research Group, Uppsala University
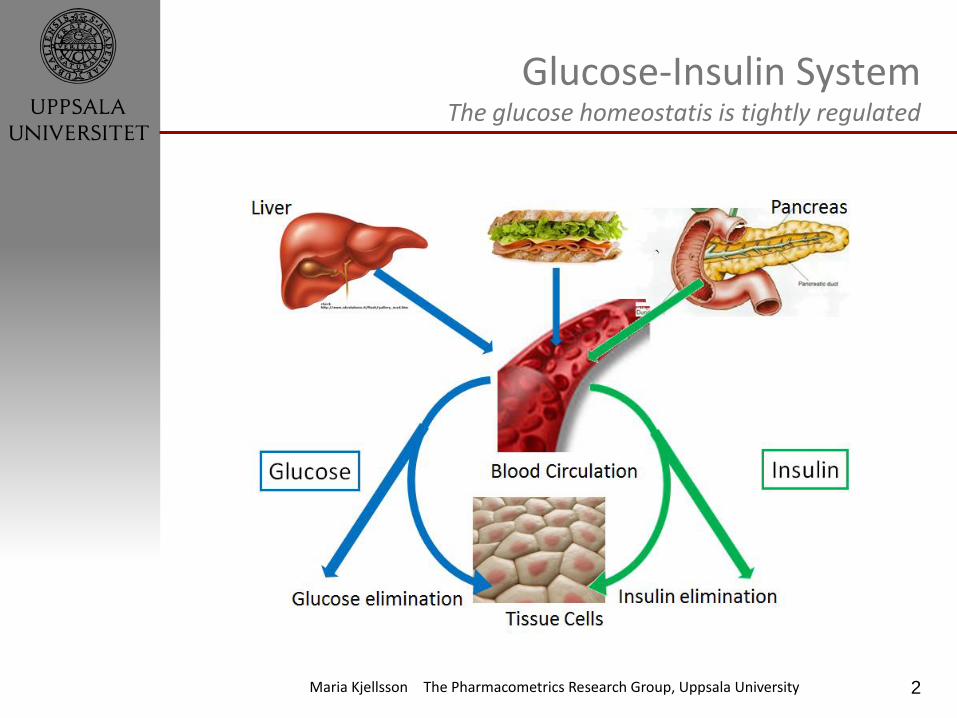
Glucose-Insulin System The glucose homeostatis is tightly regulated
Insulin stimulates glucose uptake from blood +
4 Maria Kjellsson The Pharmacometrics Research Group, Uppsala University
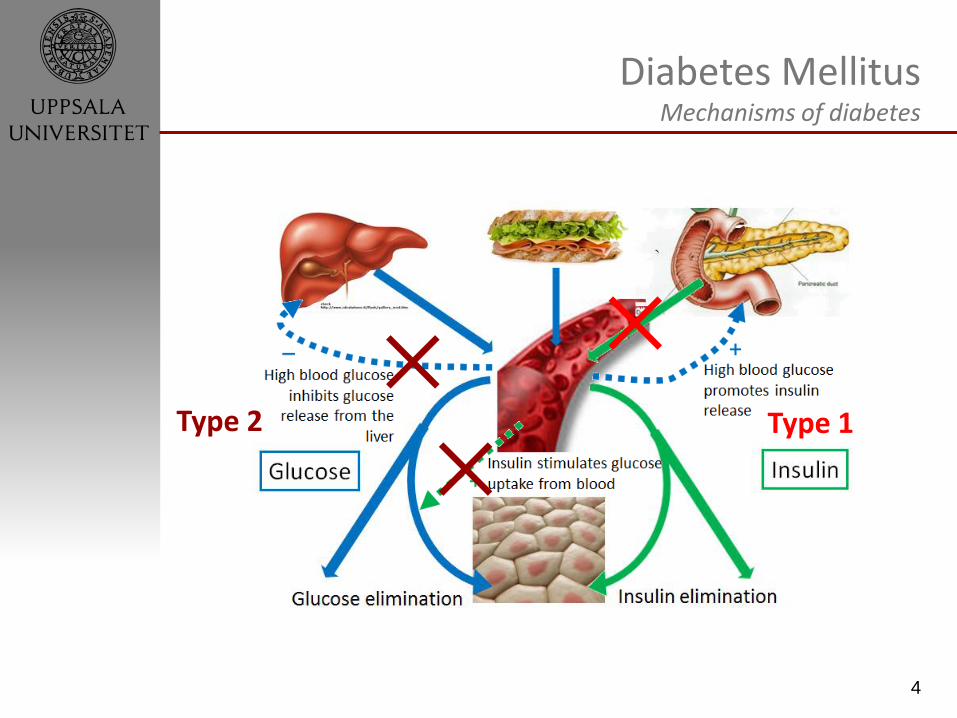
Diabetes Mellitus Mechanisms of diabetes
Insulin stimulates glucose uptake from blood +
Type 2 Type 1
5 Maria Kjellsson The Pharmacometrics Research Group, Uppsala University
Diabetes Mellitus Reasons to treat hyperglycemia
Chronic disease with high glucose in blood (hyperglycemia).
Acute hyperglycemia
• Extreme thirst, frequent urination, weight loss, cardiac arrhythmia, ketoacidosis (related to lack of insulin)
Chronic hyperglycemia
• Microvascular complications e.g. Retinopathy, Neuropathy, Nephropathy
• Macrovascular complications e.g. Cardiovascular disease
6 Maria Kjellsson The Pharmacometrics Research Group, Uppsala University
Diabetes Mellitus Monitoring glucose
• Fasting glucose – FPG • Sensitive to length of fasting
• Postprandial glucose – PPG • Sensitive to size of meal
• HbA1c • Glycation of haemoglobin
• Average glucose over 2-3 months
Sensitive to stress, circadian rhythms, etc.
7 Maria Kjellsson The Pharmacometrics Research Group, Uppsala University
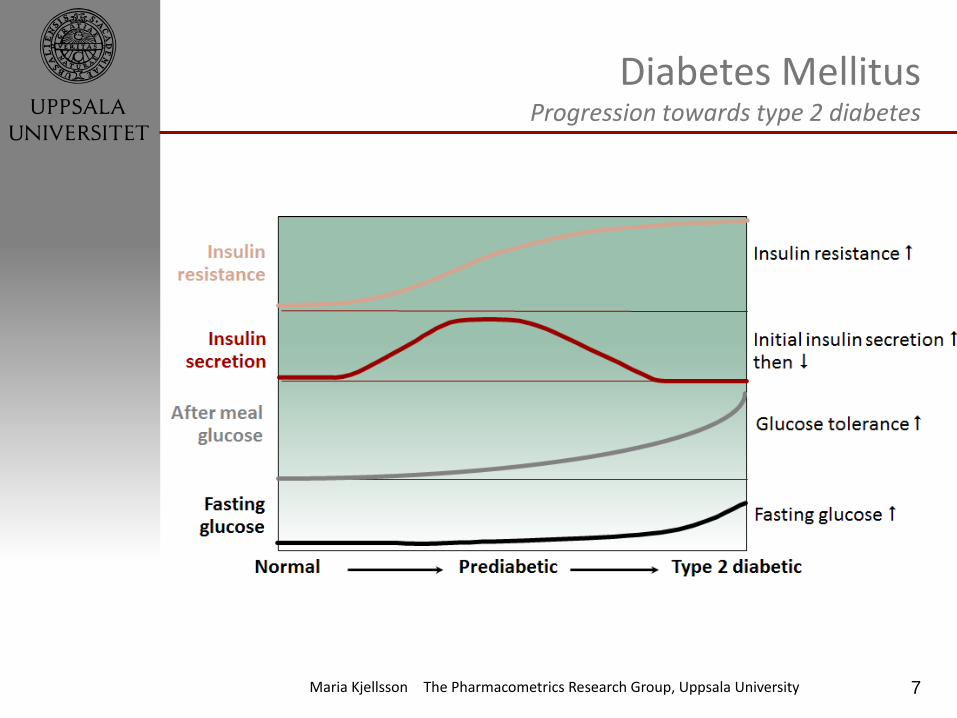
Diabetes Mellitus Progression towards type 2 diabetes
8 Maria Kjellsson The Pharmacometrics Research Group, Uppsala University
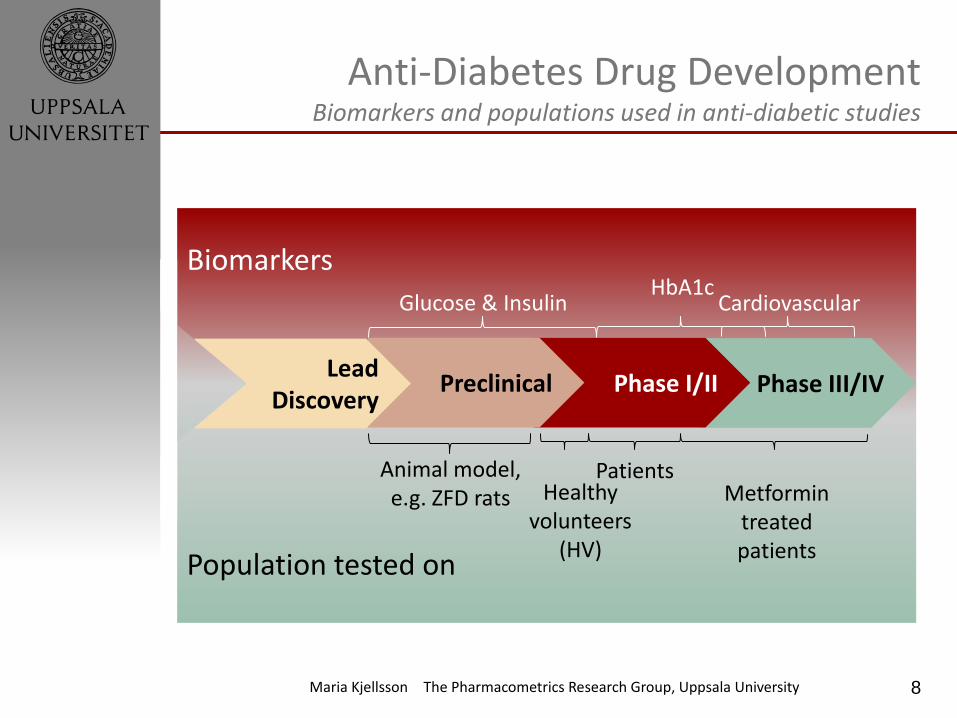
Population tested on
Biomarkers
Anti-Diabetes Drug Development Biomarkers and populations used in anti-diabetic studies
Glucose & Insulin HbA1c
Cardiovascular
Animal model, e.g. ZFD rats Healthy
volunteers (HV)
Patients Metformin
treated patients
Phase III/IV Phase I/II Preclinical Lead
Discovery
9 Maria Kjellsson The Pharmacometrics Research Group, Uppsala University
Anti-Diabetes Drug Development Modelling and simulation can aid in informing decisions
• Quantification of drug effects
• Study design optimisation
• Translation from animal studies to human
• Predictions of long-term gain
• Dose response
• Bridging from phase 1 studies to phase 2 studies
10 Maria Kjellsson The Pharmacometrics Research Group, Uppsala University
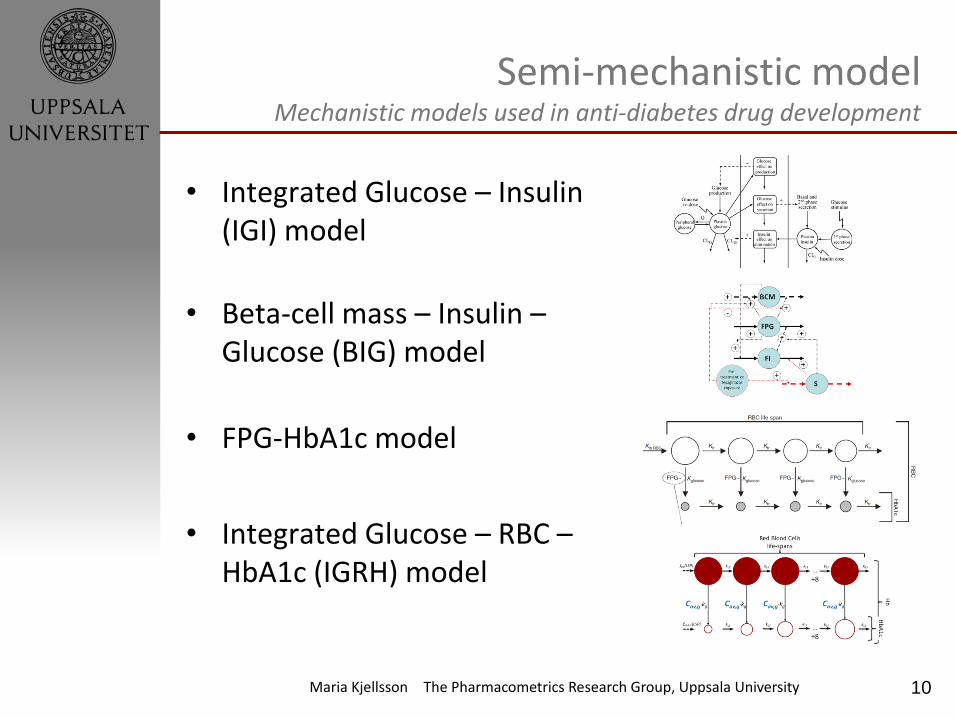
Semi-mechanistic model Mechanistic models used in anti-diabetes drug development
• Integrated Glucose – Insulin (IGI) model
• Beta-cell mass – Insulin – Glucose (BIG) model
• FPG-HbA1c model
• Integrated Glucose – RBC – HbA1c (IGRH) model
11 Maria Kjellsson The Pharmacometrics Research Group, Uppsala University
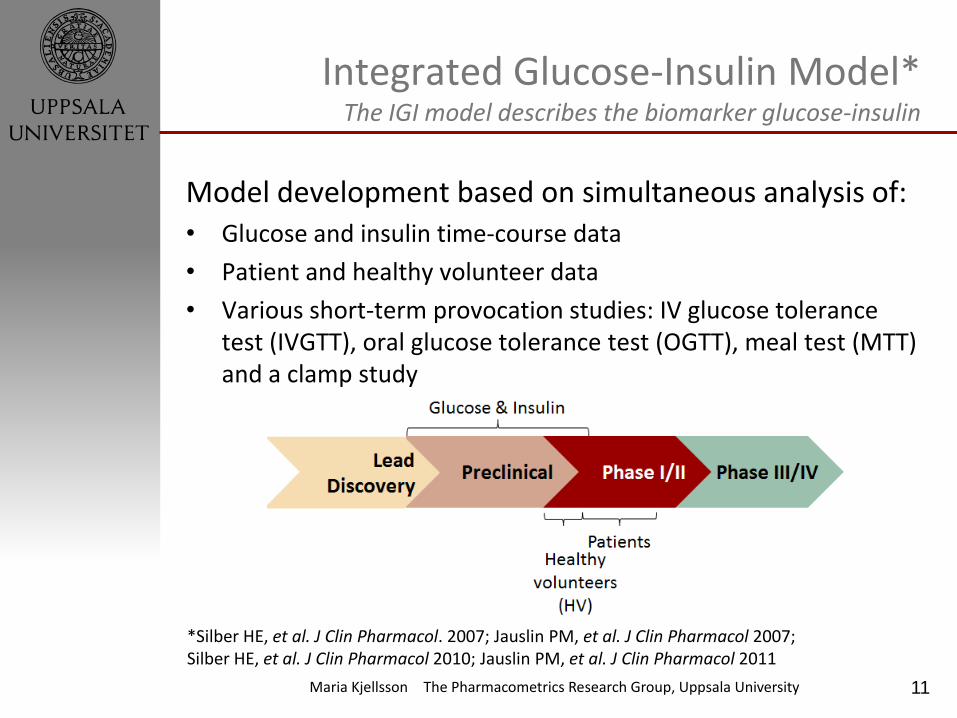
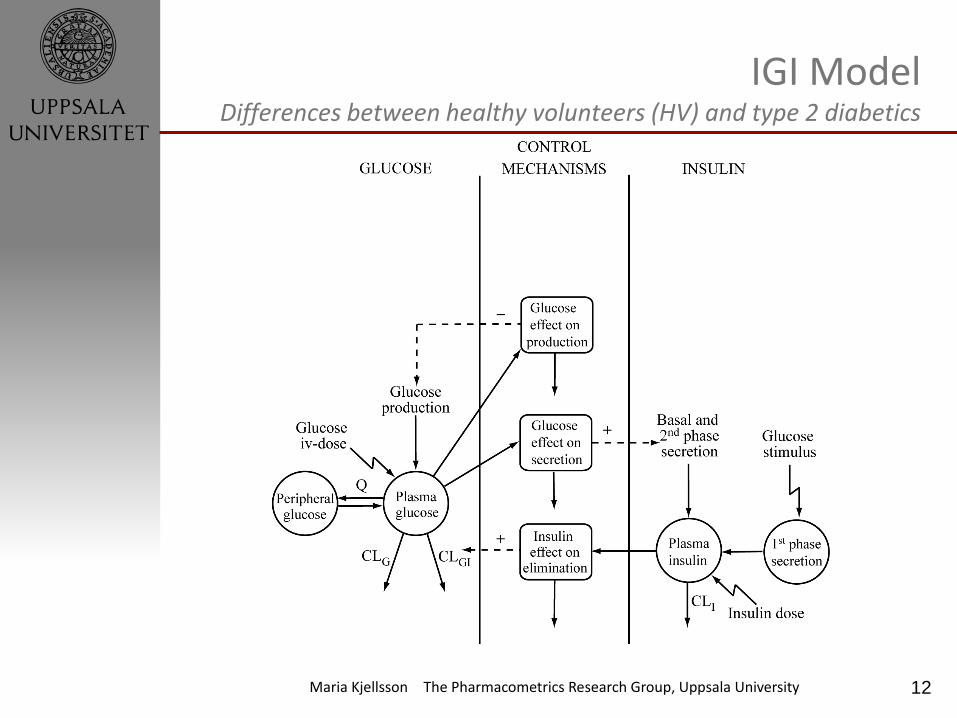
Integrated Glucose-Insulin Model* The IGI model describes the biomarker glucose-insulin
Model development based on simultaneous analysis of: • Glucose and insulin time-course data
• Patient and healthy volunteer data
• Various short-term provocation studies: IV glucose tolerance test (IVGTT), oral glucose tolerance test (OGTT), meal test (MTT) and a clamp study
*Silber HE, et al. J Clin Pharmacol. 2007; Jauslin PM, et al. J Clin Pharmacol 2007; Silber HE, et al. J Clin Pharmacol 2010; Jauslin PM, et al. J Clin Pharmacol 2011
12 Maria Kjellsson The Pharmacometrics Research Group, Uppsala University
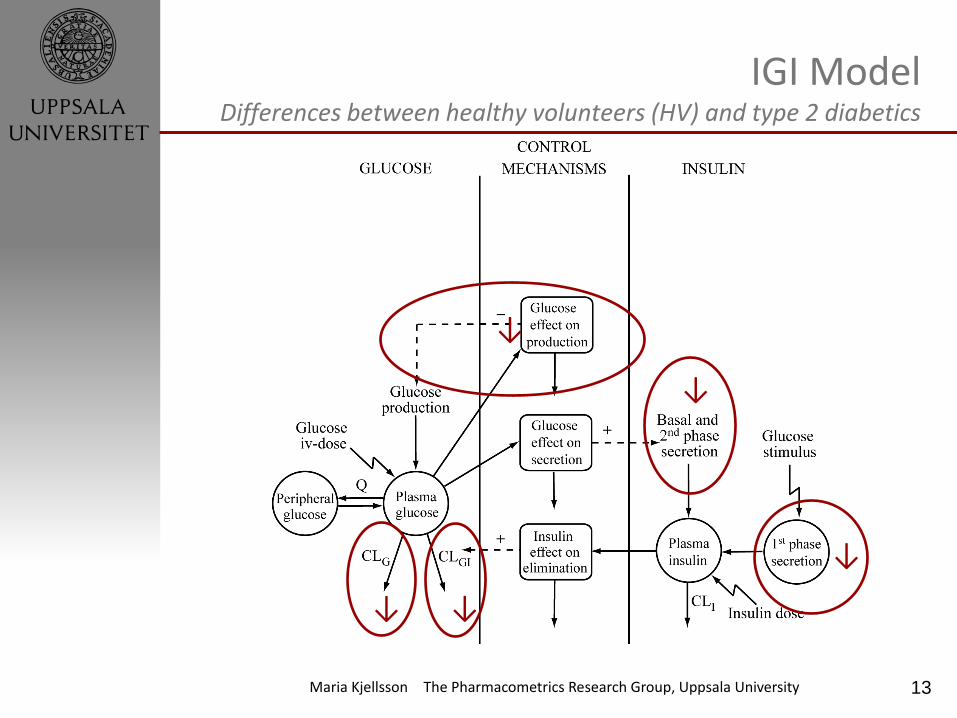
IGI Model Differences between healthy volunteers (HV) and type 2 diabetics
13 Maria Kjellsson The Pharmacometrics Research Group, Uppsala University
↓
↓
↓
↓
↓
IGI Model Differences between healthy volunteers (HV) and type 2 diabetics
14 Maria Kjellsson The Pharmacometrics Research Group, Uppsala University
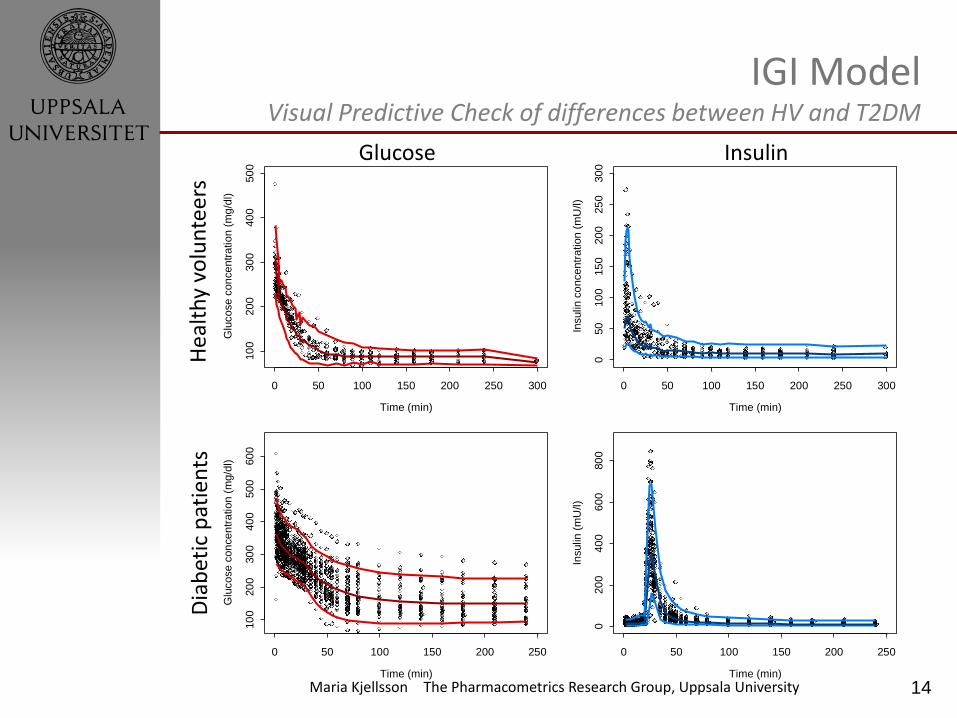
IGI Model Visual Predictive Check of differences between HV and T2DM
Time (min)
Glu
co
se c
on
ce
ntr
atio
n (
mg
/dl)
0 50 100 150 200 250 300
10
020
030
040
050
0
Time (min)
Insulin
co
nce
ntr
ation
(m
U/l)
0 50 100 150 200 250 300
050
10
015
020
025
030
0
Time (min)
Glu
co
se c
on
ce
ntr
atio
n (
mg
/dl)
0 50 100 150 200 250
10
020
030
040
050
060
0
Time (min)
Insulin
(m
U/l)
0 50 100 150 200 250
020
040
060
080
0
Hea
lth
y vo
lun
teer
s D
iab
etic
pat
ien
ts
Glucose Insulin
15 Maria Kjellsson The Pharmacometrics Research Group, Uppsala University
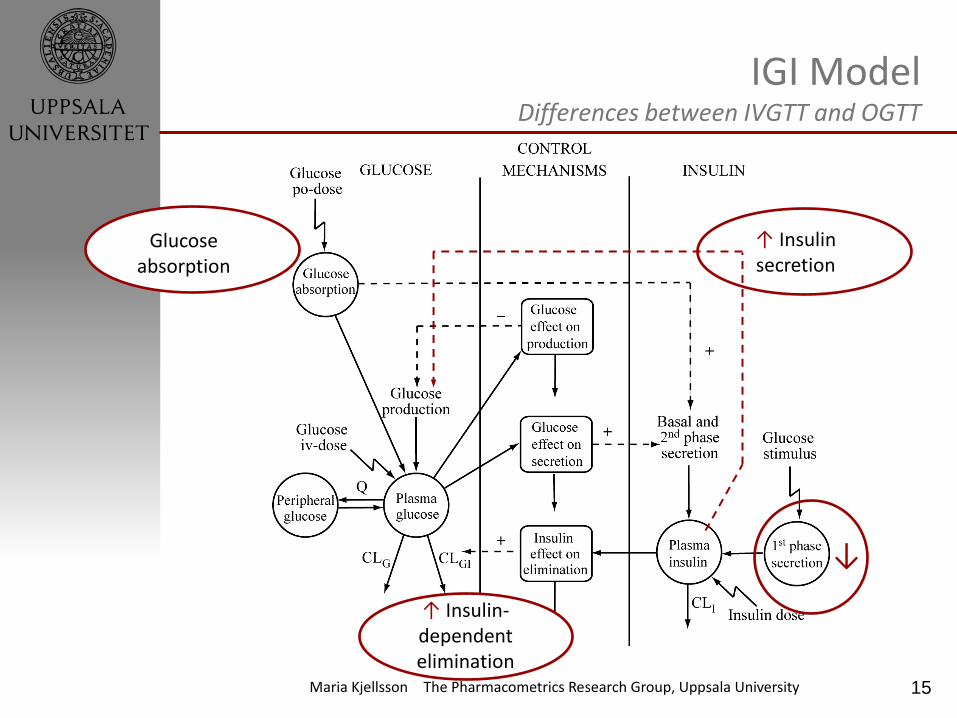
↑ Insulin secretion
↑ Insulin-dependent elimination
Glucose absorption
IGI Model Differences between IVGTT and OGTT
↓
16 Maria Kjellsson The Pharmacometrics Research Group, Uppsala University
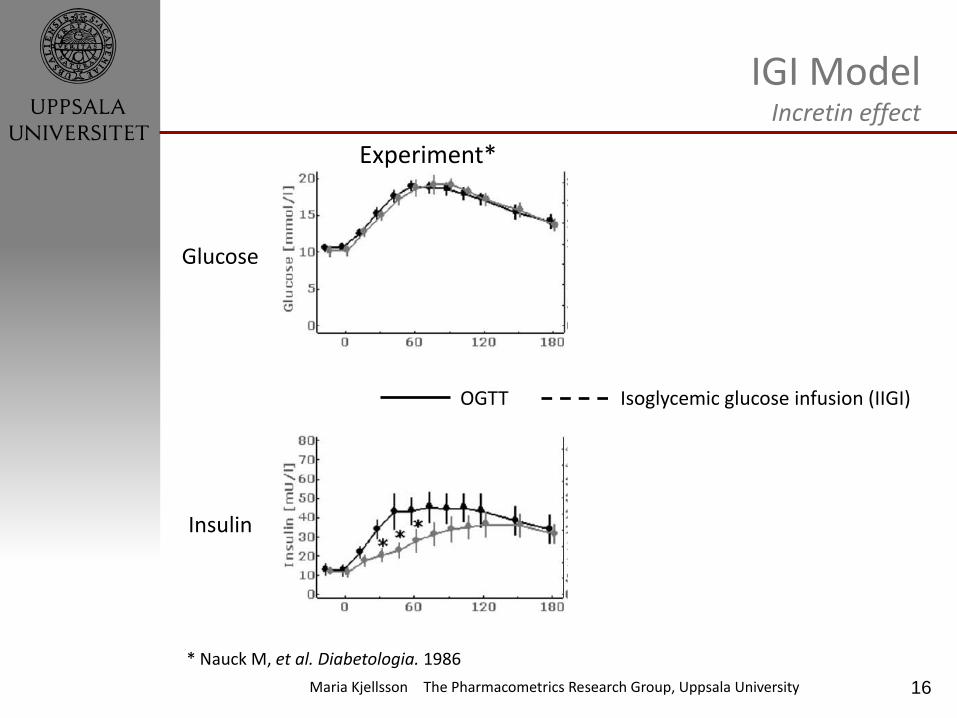
IGI Model Incretin effect
Experiment* Simulation
* Nauck M, et al. Diabetologia. 1986
OGTT Isoglycemic glucose infusion (IIGI)
Glucose
Insulin
17 Maria Kjellsson The Pharmacometrics Research Group, Uppsala University
Time (min)
Glu
co
se
co
nce
ntr
atio
n (
mg
/dl)
0 50 100 150 200 250
05
01
00
15
02
00
25
0
Time (min)
Insu
lin c
on
ce
ntr
atio
n (
mU
/l)
0 50 100 150 200 250
15
10
50
50
0
Time (min)
Glu
co
se
co
nce
ntr
atio
n (
mg
/dl)
0 50 100 150 200 250
10
02
00
30
04
00
50
06
00
Time (min)
Insu
lin c
on
ce
ntr
atio
n (
mU
/l)
0 50 100 150 200 250
02
04
06
08
01
00
12
0
Hea
lth
y vo
lun
teer
s D
iab
etic
pat
ien
ts
Glucose Insulin
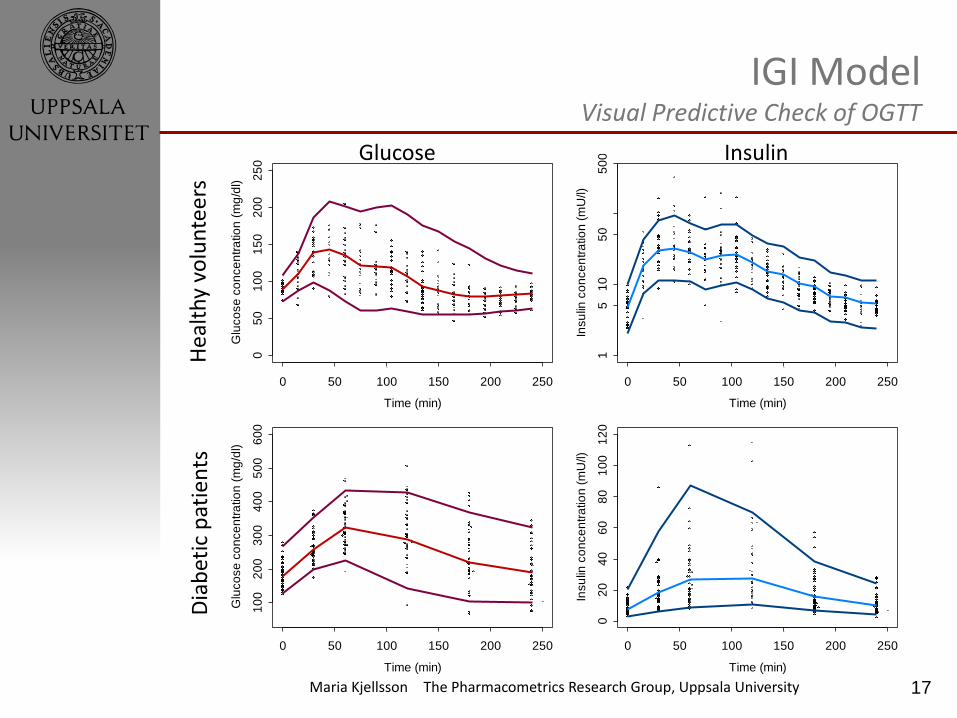
IGI Model Visual Predictive Check of OGTT
18 Maria Kjellsson The Pharmacometrics Research Group, Uppsala University
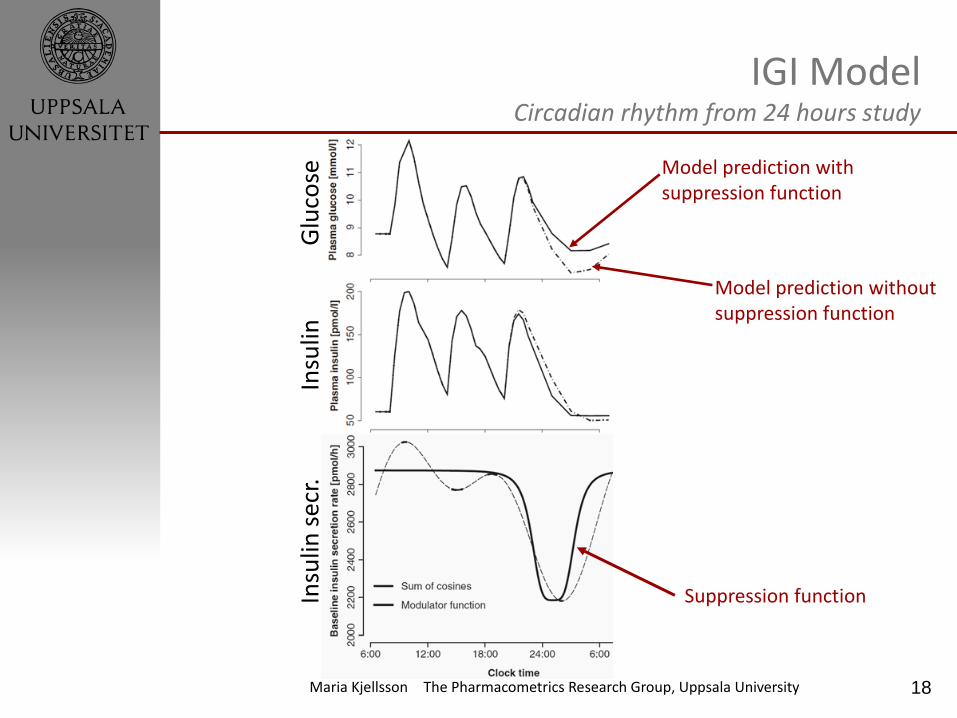
IGI Model Circadian rhythm from 24 hours study
Glu
cose
In
sulin
In
sulin
sec
r.
Suppression function
Model prediction with suppression function
Model prediction without suppression function
19 Maria Kjellsson The Pharmacometrics Research Group, Uppsala University
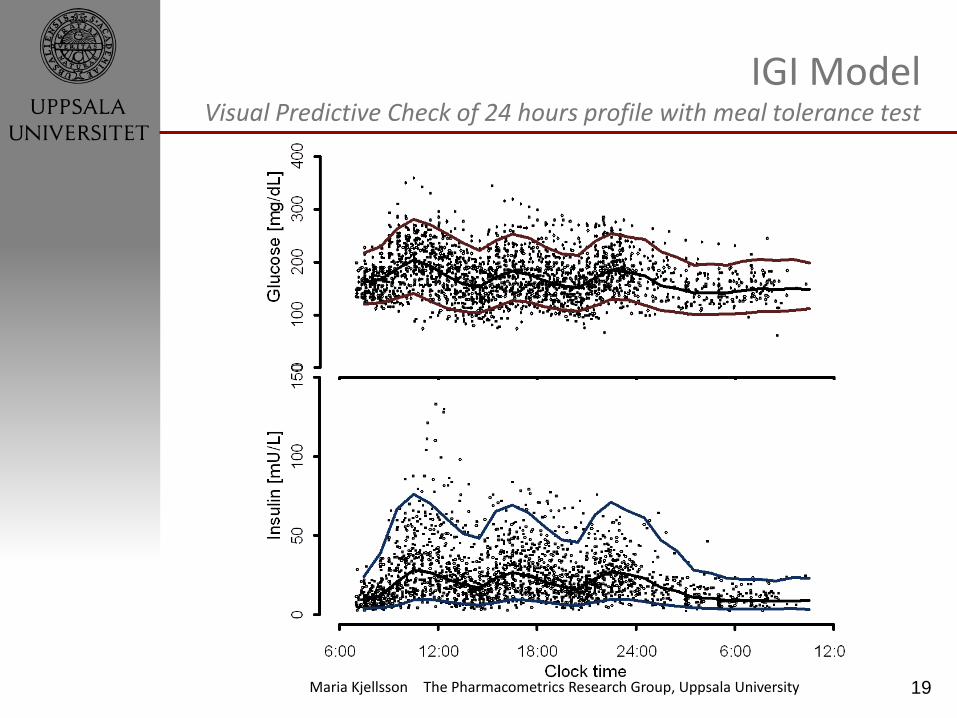
IGI Model Visual Predictive Check of 24 hours profile with meal tolerance test
20 Maria Kjellsson The Pharmacometrics Research Group, Uppsala University
IGI Model Decision supported by the IGI model
• Quantification of drug effects
• Study design optimisation
• Translation from animal studies to human
• Predictions of long-term gain
• Dose reponse
• Bridging from phase 1 studies to phase 2 studies
21 Maria Kjellsson The Pharmacometrics Research Group, Uppsala University
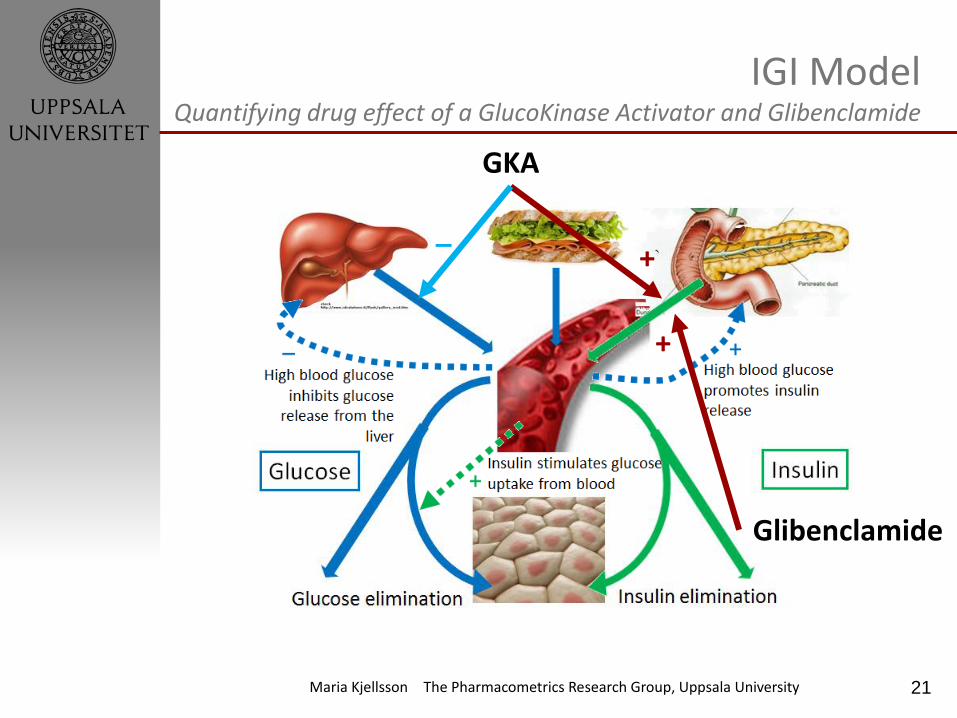
IGI Model Quantifying drug effect of a GlucoKinase Activator and Glibenclamide
Insulin stimulates glucose uptake from blood +
GKA
Glibenclamide
+ _
+
22 Maria Kjellsson The Pharmacometrics Research Group, Uppsala University
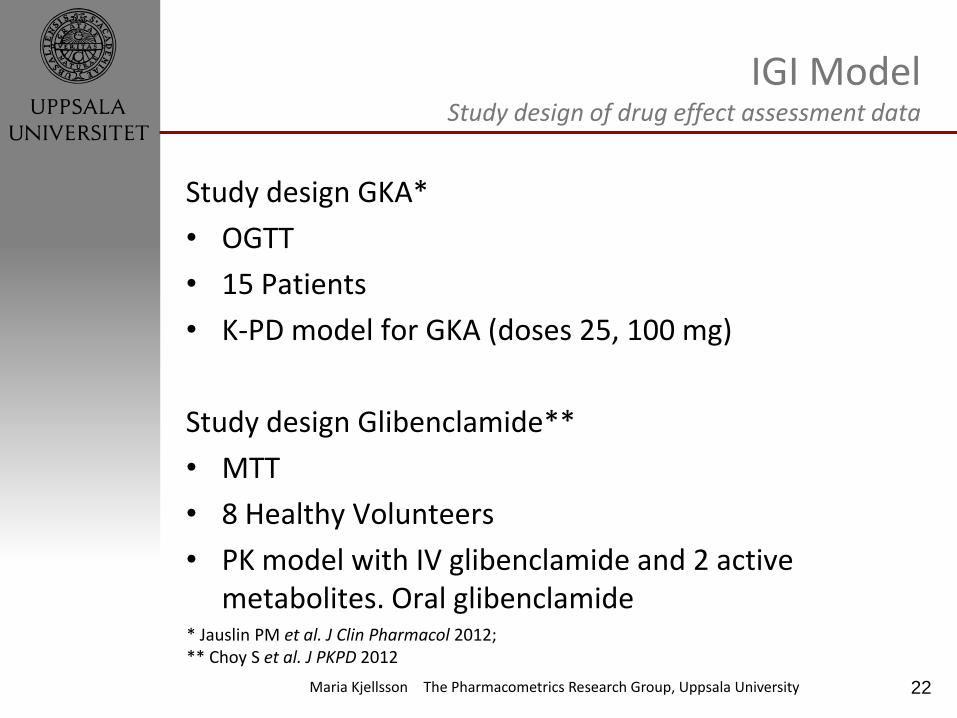
IGI Model Study design of drug effect assessment data
Study design GKA*
• OGTT
• 15 Patients
• K-PD model for GKA (doses 25, 100 mg)
Study design Glibenclamide**
• MTT
• 8 Healthy Volunteers
• PK model with IV glibenclamide and 2 active metabolites. Oral glibenclamide
* Jauslin PM et al. J Clin Pharmacol 2012; ** Choy S et al. J PKPD 2012
23 Maria Kjellsson The Pharmacometrics Research Group, Uppsala University
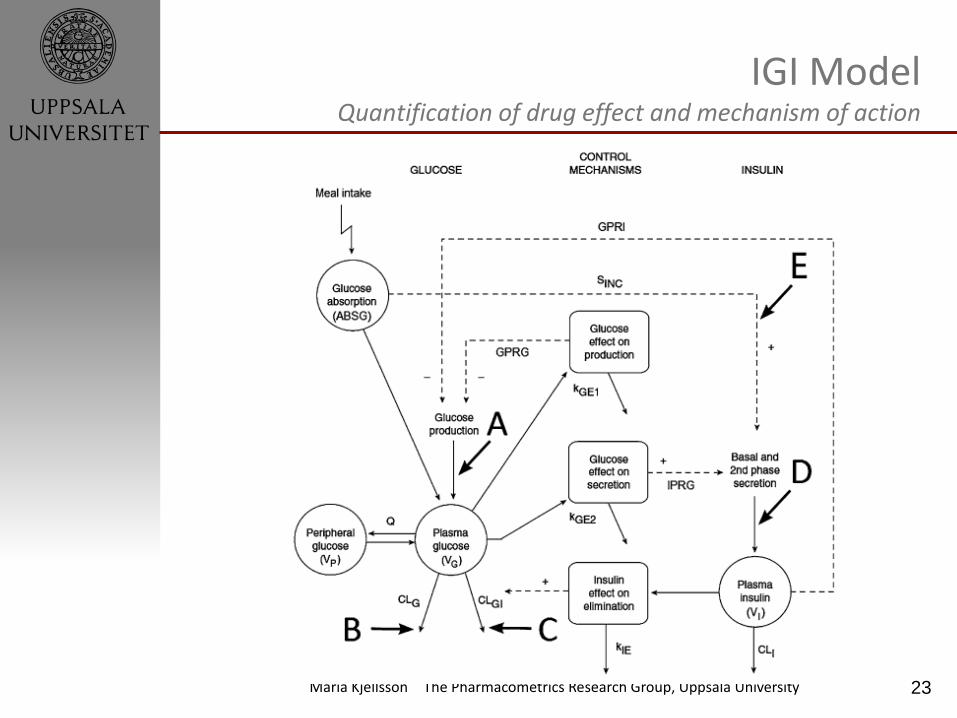
IGI Model Quantification of drug effect and mechanism of action
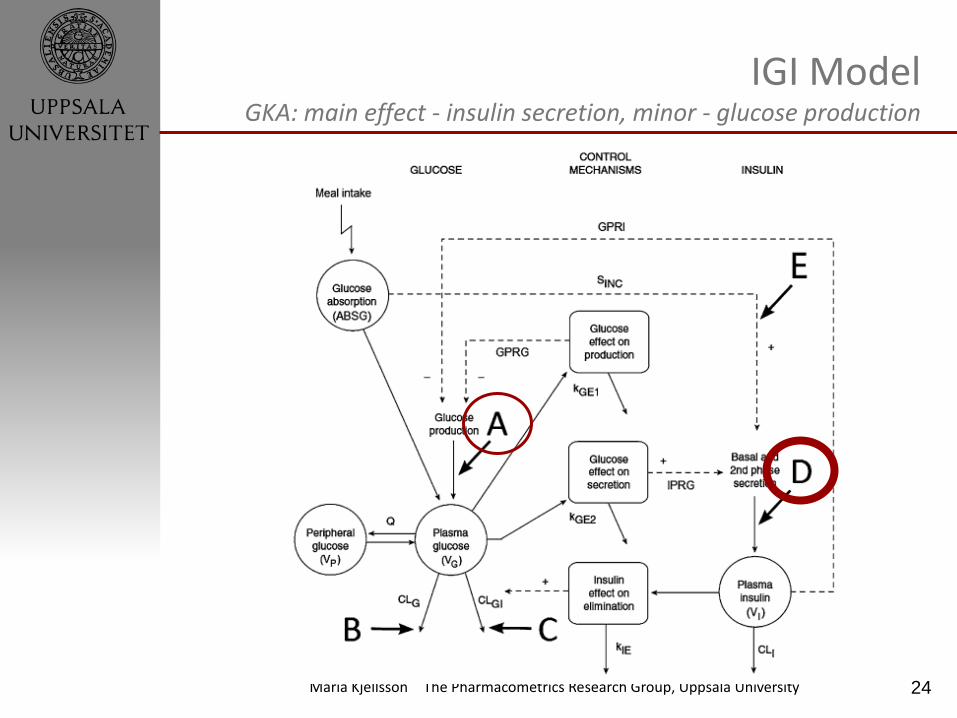
24 Maria Kjellsson The Pharmacometrics Research Group, Uppsala University
IGI Model GKA: main effect - insulin secretion, minor - glucose production
25 Maria Kjellsson The Pharmacometrics Research Group, Uppsala University
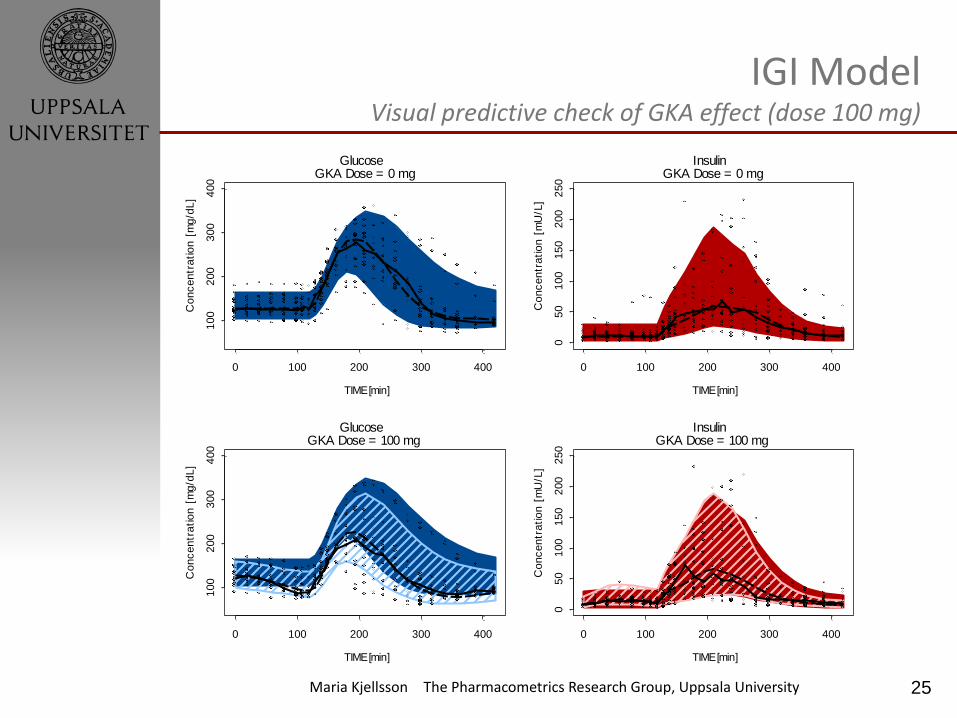
IGI Model Visual predictive check of GKA effect (dose 100 mg)
TIME [min]
Co
nc
en
tra
tio
n [
mg
/dL
]
0 100 200 300 400
100
200
300
400
Glucose GKA Dose = 0 mg
TIME [min]
Co
nc
en
tra
tio
n [
mU
/L]
0 100 200 300 400
05
01
00
150
200
250
Insulin GKA Dose = 0 mg
TIME [min]
Co
nc
en
tra
tio
n [
mg
/dL
]
0 100 200 300 400
100
200
300
400
Glucose GKA Dose = 100 mg
TIME [min]
Co
nc
en
tra
tio
n [
mU
/L]
0 100 200 300 400
05
01
00
150
200
250
Insulin GKA Dose = 100 mg
26 Maria Kjellsson The Pharmacometrics Research Group, Uppsala University
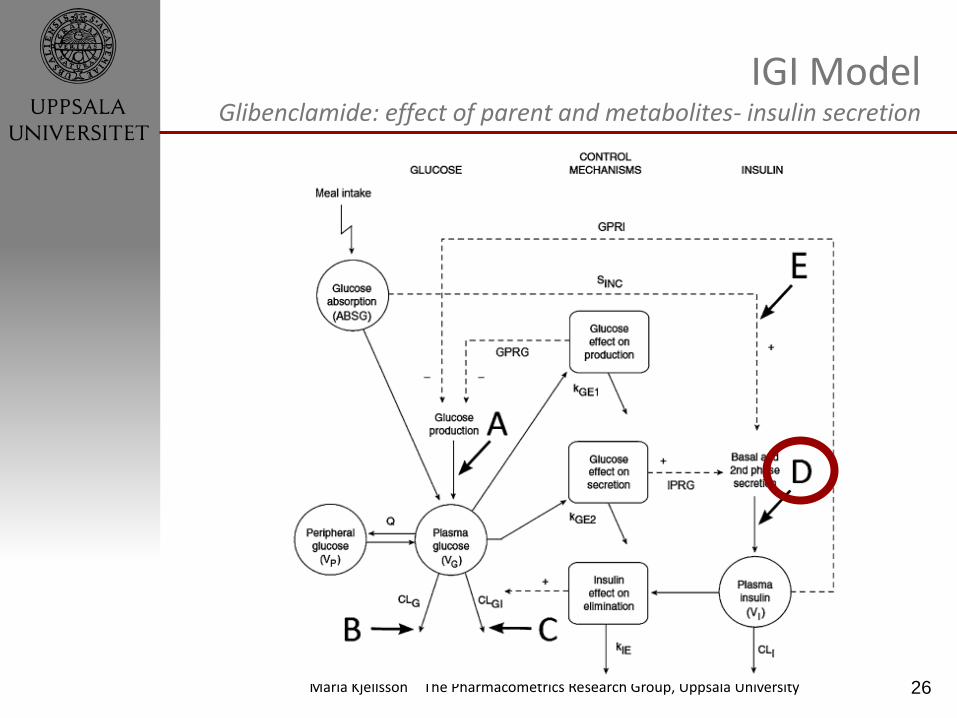
IGI Model Glibenclamide: effect of parent and metabolites- insulin secretion
27 Maria Kjellsson The Pharmacometrics Research Group, Uppsala University
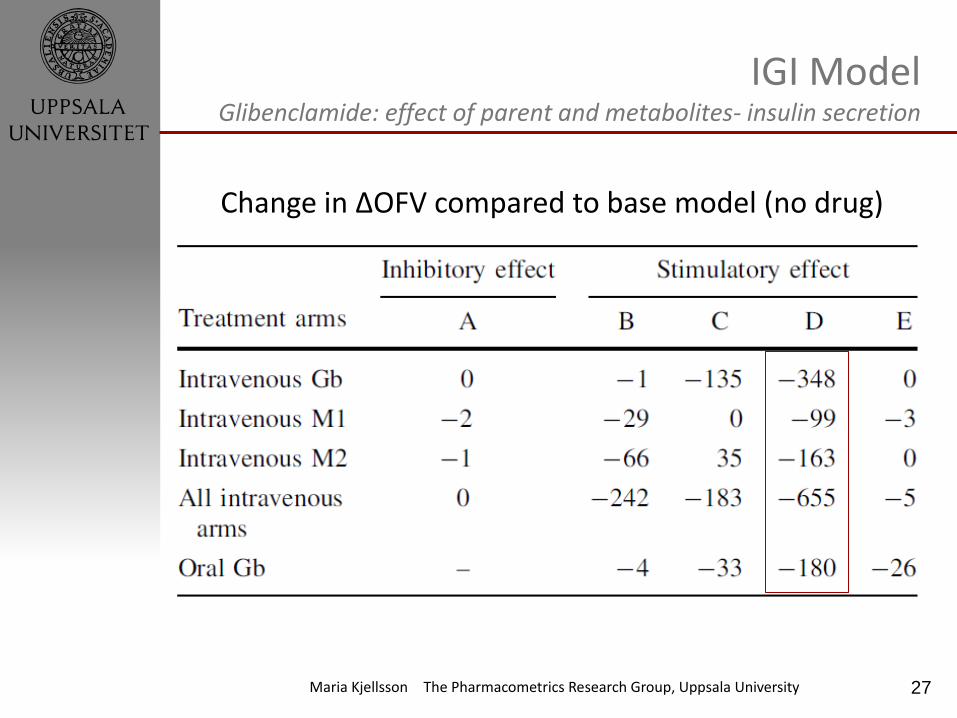
IGI Model Glibenclamide: effect of parent and metabolites- insulin secretion
Change in ΔOFV compared to base model (no drug)
28 Maria Kjellsson The Pharmacometrics Research Group, Uppsala University
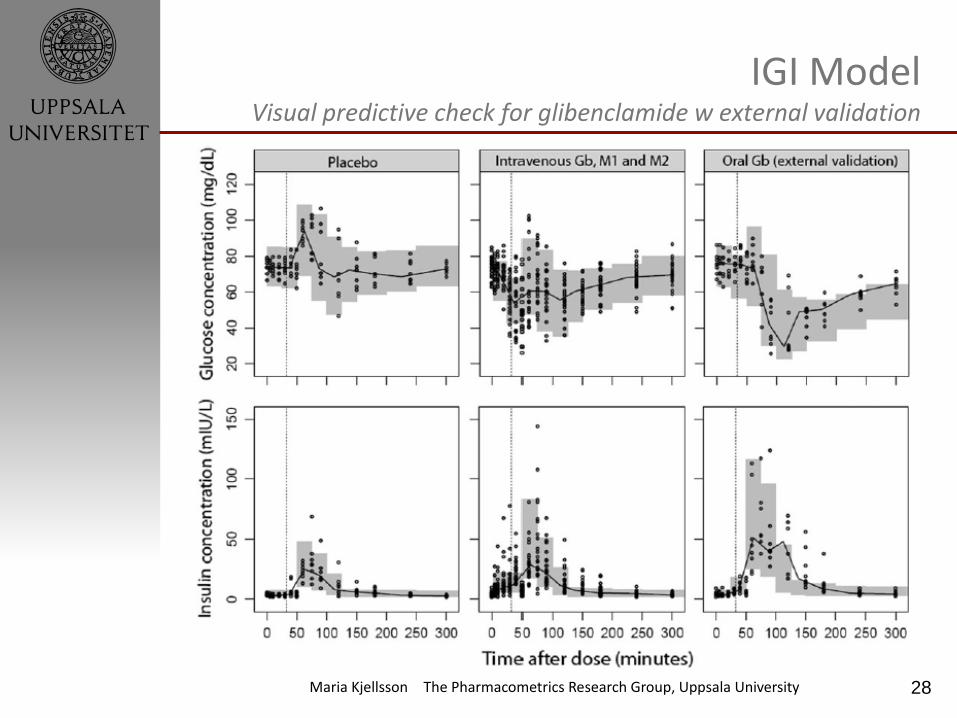
IGI Model Visual predictive check for glibenclamide w external validation
29 Maria Kjellsson The Pharmacometrics Research Group, Uppsala University
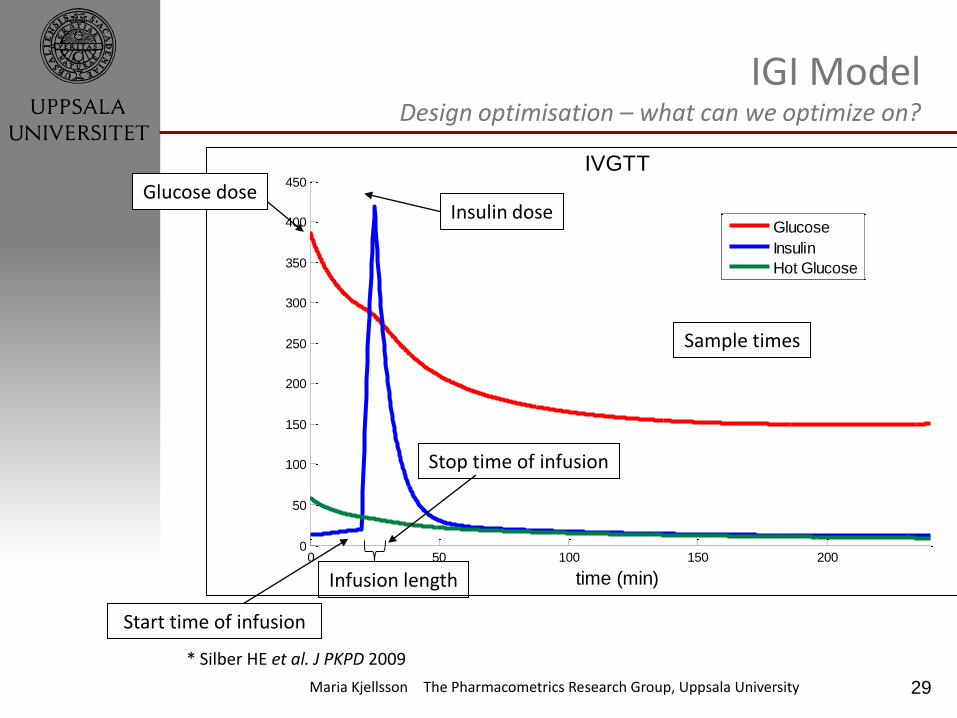
IGI Model Design optimisation – what can we optimize on?
0 50 100 150 2000
50
100
150
200
250
300
350
400
450
IVGTT
time (min)
mg
/DL
Glucose
Insulin
Hot Glucose
Start time of infusion
Stop time of infusion
Infusion length
Insulin dose Glucose dose
Sample times
* Silber HE et al. J PKPD 2009
30 Maria Kjellsson The Pharmacometrics Research Group, Uppsala University
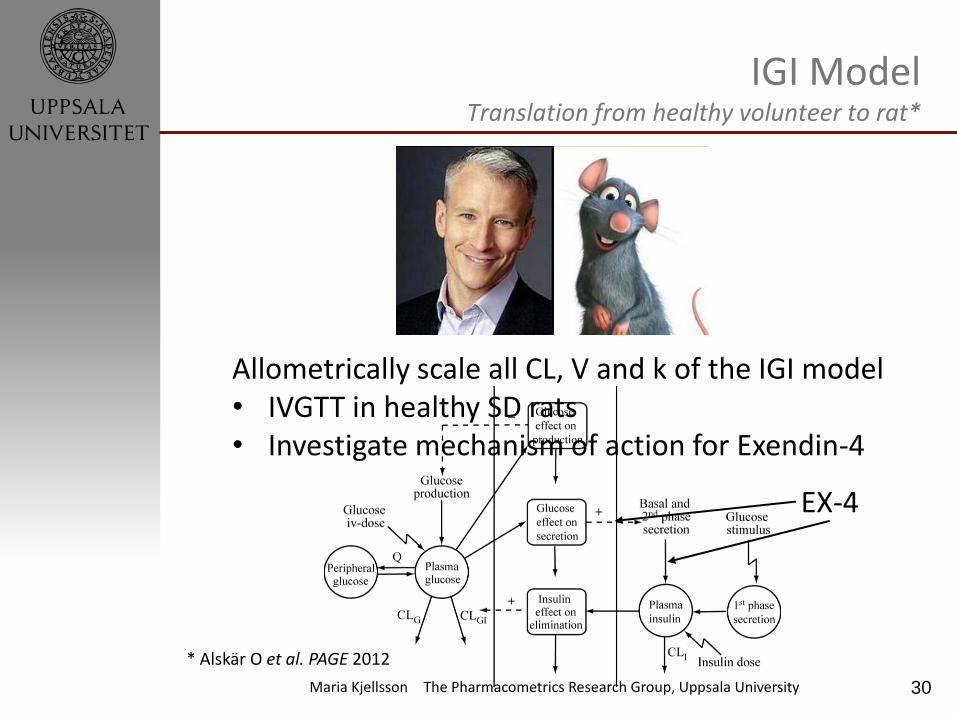
IGI Model Translation from healthy volunteer to rat*
* Alskär O et al. PAGE 2012
Allometrically scale all CL, V and k of the IGI model • IVGTT in healthy SD rats • Investigate mechanism of action for Exendin-4
EX-4
31 Maria Kjellsson The Pharmacometrics Research Group, Uppsala University
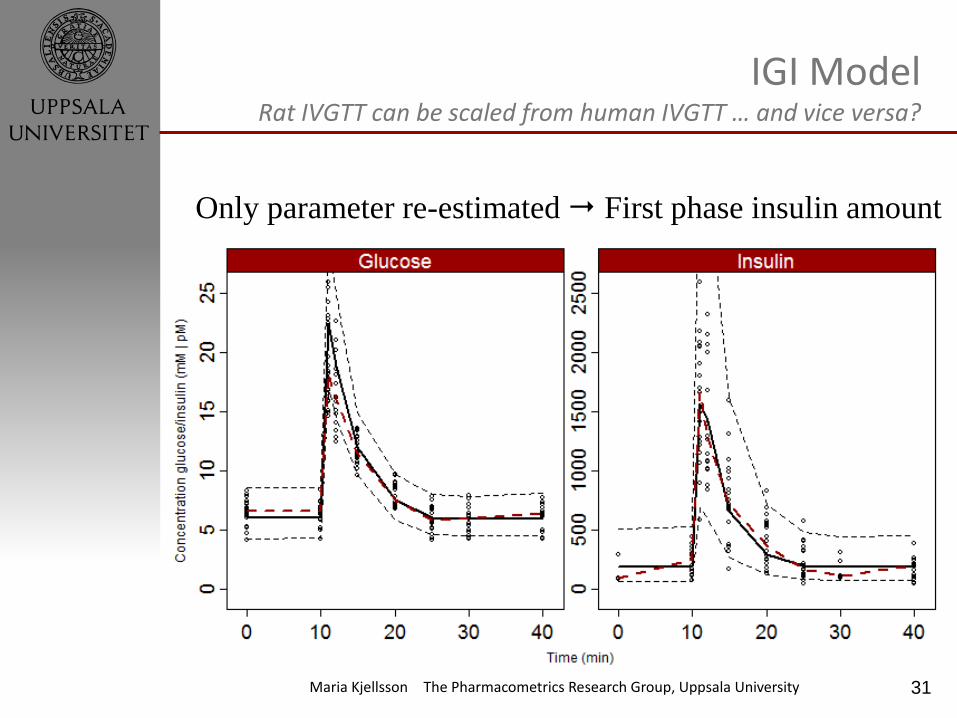
IGI Model Rat IVGTT can be scaled from human IVGTT … and vice versa?
Only parameter re-estimated First phase insulin amount
32 Maria Kjellsson The Pharmacometrics Research Group, Uppsala University
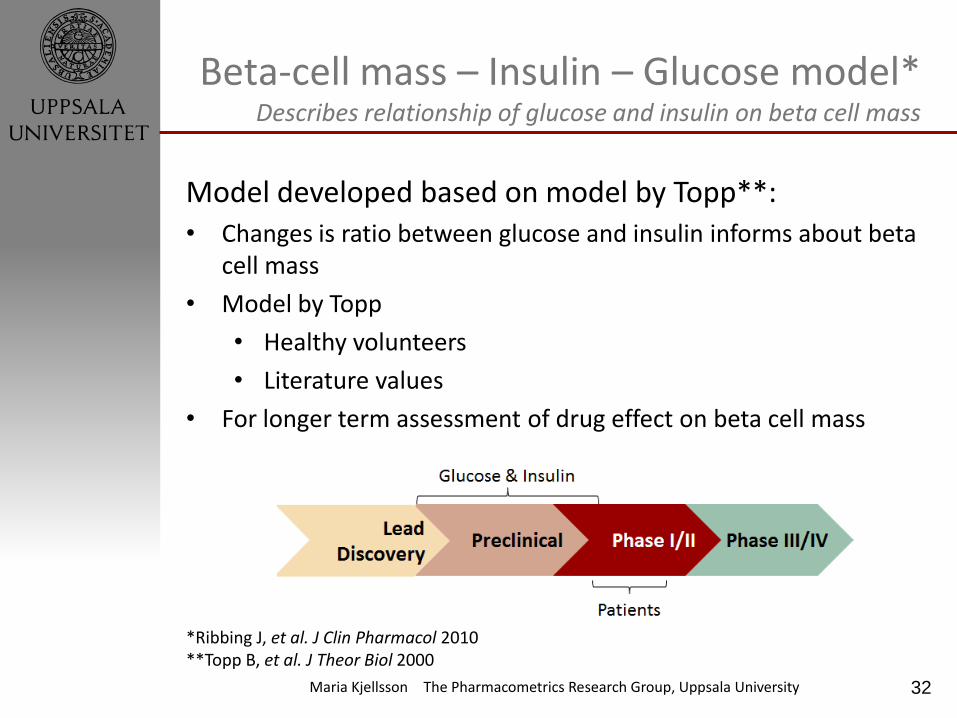
Beta-cell mass – Insulin – Glucose model* Describes relationship of glucose and insulin on beta cell mass
Model developed based on model by Topp**: • Changes is ratio between glucose and insulin informs about beta
cell mass
• Model by Topp
• Healthy volunteers
• Literature values
• For longer term assessment of drug effect on beta cell mass
*Ribbing J, et al. J Clin Pharmacol 2010 **Topp B, et al. J Theor Biol 2000


![PUB and Data-Based Mechanistic Modelling: the Importance ... · Based Mechanistic (DBM) approach to modelling [e.g. Young, 2001 and the prior references therein] is applied to a typical](https://static.fdocuments.us/doc/165x107/5f61d44a9742ea68b934254b/pub-and-data-based-mechanistic-modelling-the-importance-based-mechanistic-dbm.jpg)