
February 2016 Hermosa Beach Real Estate Market Trends Update
15
Hermosa Beach Residential Real Estate Market Conditions February 2016
-
Upload
hhc-south-bay-real-estate-agents -
Category
Real Estate
-
view
221 -
download
1
Transcript of February 2016 Hermosa Beach Real Estate Market Trends Update

Table of
Contents
Key Statistics for February
Sales 2016 Residential Sales Stats Year-to-Year Total Sales by Map Area Median 2016 Median Sales Stats Year-to-Year Median Sales by Map Area Listings 2016 Active Listings by Map Area 2016 Total Active Listings vs. Total Sales Year-to-Year Active Listings by Map Area Inventory 2016 Months of Inventory by Map Area Year-to-Year Months of Inventory
Summary
About Hady Chahine Contact Information
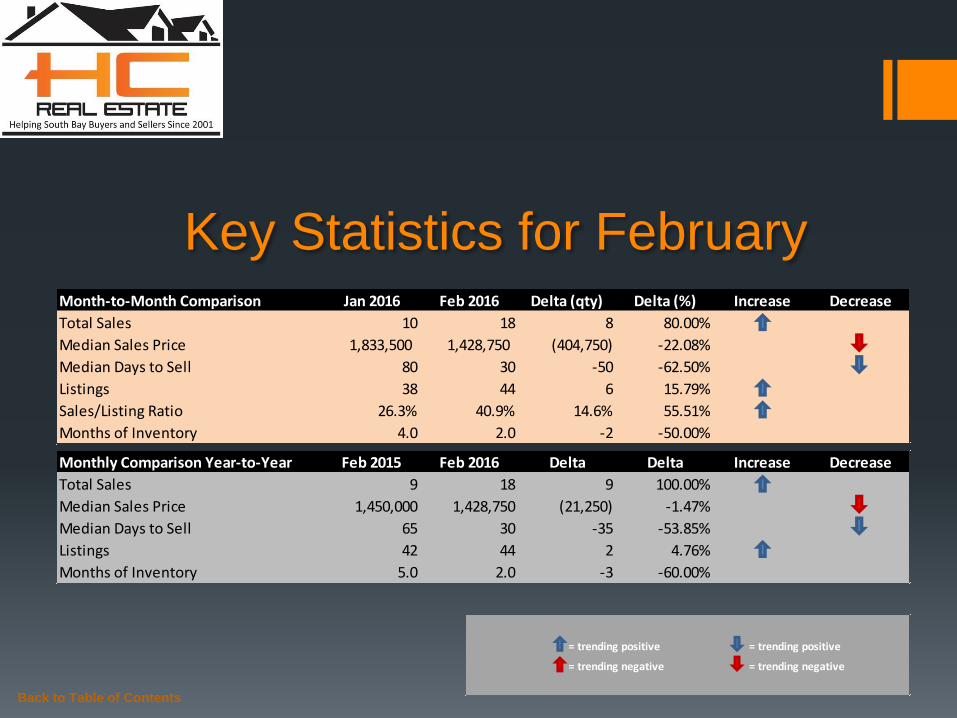
Key Statistics for February
Back to Table of Contents
= trending positive = trending positive
= trending negative = trending negative
Month-to-Month Comparison Jan 2016 Feb 2016 Delta (qty) Delta (%) Increase Decrease
Total Sales 10 18 8 80.00%
Median Sales Price 1,833,500 1,428,750 (404,750) -22.08%
Median Days to Sell 80 30 -50 -62.50%
Listings 38 44 6 15.79%
Sales/Listing Ratio 26.3% 40.9% 14.6% 55.51%
Months of Inventory 4.0 2.0 -2 -50.00%
Monthly Comparison Year-to-Year Feb 2015 Feb 2016 Delta Delta Increase Decrease
Total Sales 9 18 9 100.00%
Median Sales Price 1,450,000 1,428,750 (21,250) -1.47%
Median Days to Sell 65 30 -35 -53.85%
Listings 42 44 2 4.76%
Months of Inventory 5.0 2.0 -3 -60.00%

Back to Table of Contents
Total Sales Month-to-Month by Map Area Jan Feb Mar
Hermosa Bch Sand 7 11
Hermosa Bch Valley 2 4
Hermosa Bch East 1 3
Total Sales 10 18
-
2
4
6
8
10
12
14
16
18
Jan Feb Mar
2016 Total Sales Month-to-Month by Map Area
Hermosa Bch Sand
Hermosa Bch Valley
Hermosa Bch East
Total Sales

Back to Table of Contents
Total Sales Year-to-Year by Map Area 2014 2015 2016
Hermosa Bch Sand 5 4 11
Hermosa Bch Valley 5 2 4
Hermosa Bch East 4 3 3
Total Sales 14 9 18
-
2
4
6
8
10
12
14
16
18
2014 2015 2016
Total Sales Year-to-Year by Map Area: February
Hermosa Bch Sand
Hermosa Bch Valley
Hermosa Bch East
Total Sales

Back to Table of Contents
Median Sales Price Month-to-Month by Map Area Jan Feb Mar
Hermosa Bch Sand 1,792,000 1,449,000
Hermosa Bch Valley 2,158,750 1,043,750
Hermosa Bch East 1,310,000 1,225,000
Market Median Sales Price 1,833,500 1,428,750
-
500,000
1,000,000
1,500,000
2,000,000
2,500,000
Jan Feb Mar
2016 Median Sales Price Month-to-Month by Map Area
Hermosa Bch Sand
Hermosa Bch Valley
Hermosa Bch East
Market Median Sales Price

Back to Table of Contents
Median Sales Price Year-to-Year by Map Area 2014 2015 2016
Hermosa Bch Sand 1,550,000 2,274,500 1,449,000
Hermosa Bch Valley 1,265,000 1,182,000 1,043,750
Hermosa Bch East 1,290,000 1,185,000 1,225,000
Market Median Sales Price 1,344,750 1,450,000 1,428,750
-
500,000
1,000,000
1,500,000
2,000,000
2,500,000
2014 2015 2016
Median Sales Price Year-to-Year by Map Area: February
Hermosa Bch Sand
Hermosa Bch Valley
Hermosa Bch East
Market Median Sales Price

Back to Table of Contents
Active Listings vs. Total Sales by Map Area Jan Feb Mar Apr May Jun Jul Aug Sep Oct Nov Dec
Hermosa Bch Sand 21 24
Hermosa Bch Valley 11 9
Hermosa Bch East 6 11
Total Active Listings 38 44
-
5
10
15
20
25
Jan Feb Mar Apr May Jun Jul Aug Sep Oct Nov Dec
2016 Active Listings by Map Area
Hermosa Bch Sand
Hermosa Bch Valley
Hermosa Bch East

Back to Table of Contents
Active Listings vs. Total Sales by Map Area Jan Feb Mar Apr May Jun Jul Aug Sep Oct Nov Dec
Hermosa Bch Sand 21 24
Hermosa Bch Valley 11 9
Hermosa Bch East 6 11
Total Active Listings 38 44
Total Sales 10 18
Sales/Listings Ratio 26.3% 40.9%
-
5
10
15
20
25
30
35
40
45
Jan Feb Mar Apr May Jun Jul Aug Sep Oct Nov Dec
2016 Total Active Listings vs. Total Sales
Total Active Listings
Total Sales
Back to Table of Contents
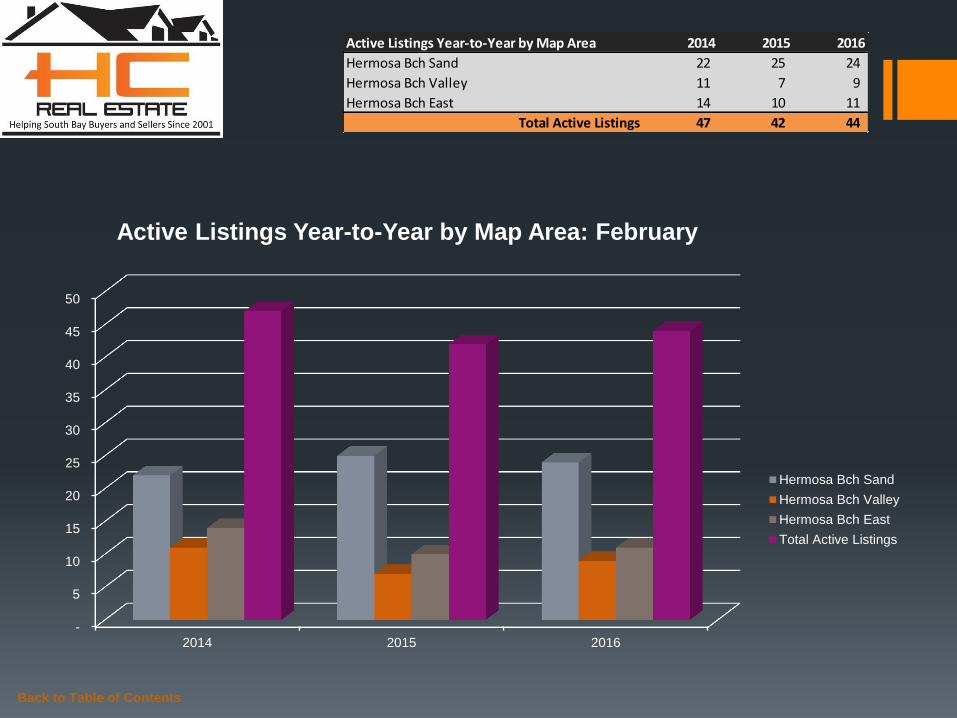
Active Listings Year-to-Year by Map Area 2014 2015 2016
Hermosa Bch Sand 22 25 24
Hermosa Bch Valley 11 7 9
Hermosa Bch East 14 10 11
Total Active Listings 47 42 44
-
5
10
15
20
25
30
35
40
45
50
2014 2015 2016
Active Listings Year-to-Year by Map Area: February
Hermosa Bch Sand
Hermosa Bch Valley
Hermosa Bch East
Total Active Listings
Back to Table of Contents
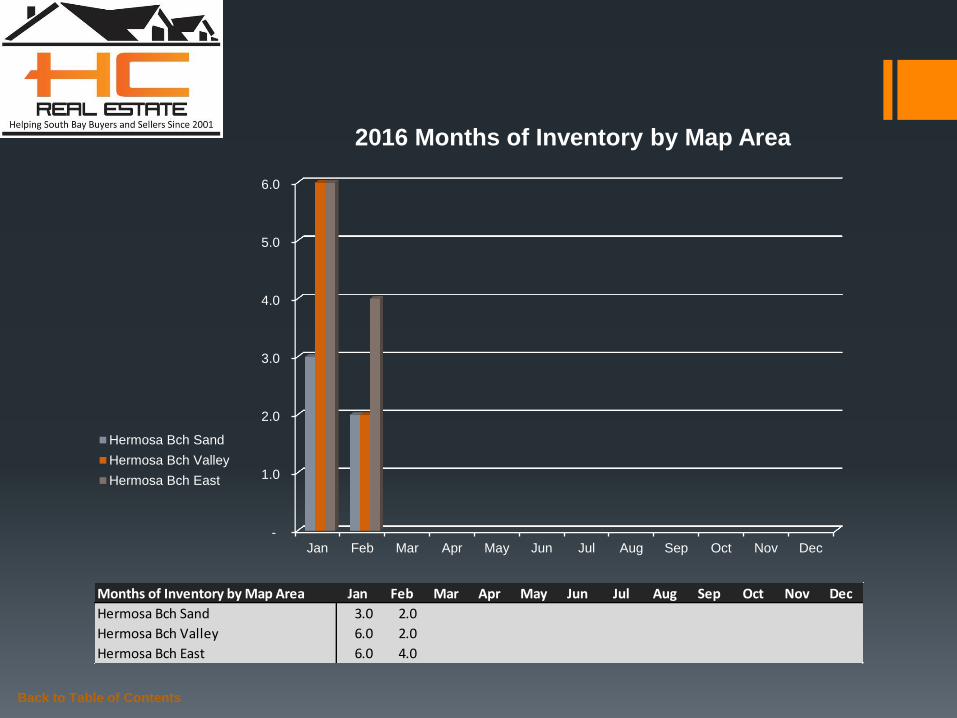
Months of Inventory by Map Area Jan Feb Mar Apr May Jun Jul Aug Sep Oct Nov Dec
Hermosa Bch Sand 3.0 2.0
Hermosa Bch Valley 6.0 2.0
Hermosa Bch East 6.0 4.0
-
1.0
2.0
3.0
4.0
5.0
6.0
Jan Feb Mar Apr May Jun Jul Aug Sep Oct Nov Dec
2016 Months of Inventory by Map Area
Hermosa Bch Sand
Hermosa Bch Valley
Hermosa Bch East
Back to Table of Contents
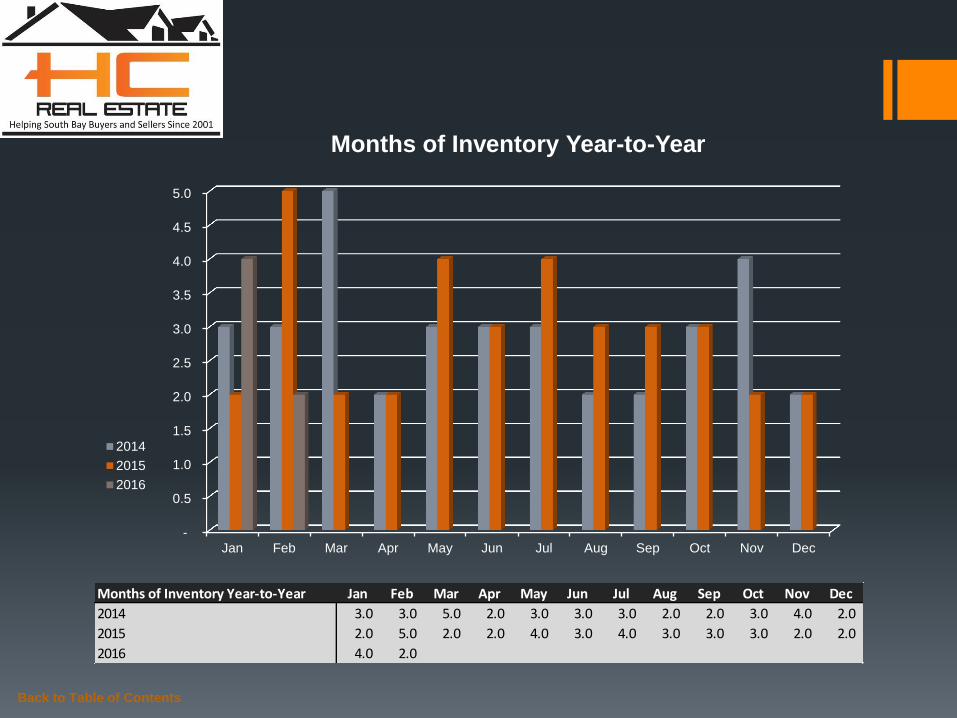
Months of Inventory Year-to-Year Jan Feb Mar Apr May Jun Jul Aug Sep Oct Nov Dec
2014 3.0 3.0 5.0 2.0 3.0 3.0 3.0 2.0 2.0 3.0 4.0 2.0
2015 2.0 5.0 2.0 2.0 4.0 3.0 4.0 3.0 3.0 3.0 2.0 2.0
2016 4.0 2.0
-
0.5
1.0
1.5
2.0
2.5
3.0
3.5
4.0
4.5
5.0
Jan Feb Mar Apr May Jun Jul Aug Sep Oct Nov Dec
Months of Inventory Year-to-Year
2014
2015
2016

Summary Hermosa Beach real estate activity picked up in February with an 80% improvement in total sales month-over-month. In addition, positive moment was recorded for median days to sell, listings, and sales-listing ratio data points. Year-over-year, however, the market median sales price dropped 1.47% or $21.25K for the month of February.
In the news… According to C.A.R., “Existing, single-family home sales totaled 393,360 in February on a seasonally adjusted annualized rate, up 2.6 percent from January and 6.4 percent above February 2015.” http://www.car.org/newsstand/newsreleases/2016releases/february2016sales?view=Standard
For listing or buying guidance, or additional statistics on market trending behavior, please do not hesitate to contact me to schedule a time to discuss how I can be of service to you.
Back to Table of Contents
Monthly Comparison Year-to-Year Feb 2015 Feb 2016 Delta Delta Increase Decrease
Total Sales 9 18 9 100.00%
Median Sales Price 1,450,000 1,428,750 (21,250) -1.47%
Median Days to Sell 65 30 -35 -53.85%
Listings 42 44 2 4.76%
Months of Inventory 5.0 2.0 -3 -60.00%
Month-to-Month Comparison Jan 2016 Feb 2016 Delta (qty) Delta (%) Increase Decrease
Total Sales 10 18 8 80.00%
Median Sales Price 1,833,500 1,428,750 (404,750) -22.08%
Median Days to Sell 80 30 -50 -62.50%
Listings 38 44 6 15.79%
Sales/Listing Ratio 26.3% 40.9% 14.6% 55.51%
Months of Inventory 4.0 2.0 -2 -50.00%

About
Hady Chahine…
Serving South Bay Home Buyers and Sellers Since 2001
RE/MAX Top 4 Team in California – 2012
RE/MAX 100% Club - 2011
Shorewood Realtors Top 5% in Overall Sales 2001-2006, 2008-2010
Back to Table of Contents

The information being provided by CARETS (CLAW, CRISNet MLS, DAMLS, CRMLS, i-Tech MLS, and/or VCRDS) is for the visitor’s personal, non-commercial use and may not be used for
any purpose other than to identify prospective properties visitor may be interested in purchasing. Any information relating to a property referenced on this web site comes from the Internet
Data Exchange (IDX) program of CARETS. This web site may reference real estate listing(s) held by a brokerage firm other than the broker and/or agent who owns this web site. The accuracy
of all information, regardless of source, including but not limited to square footages and lot sizes, is deemed reliable but not guaranteed and should be personally verified through personal
inspection by and/or with the appropriate professionals.
Hady Chahine
• 310-404-5361
Back to Table of Contents
Listings MLS BLOG Website