2016-17 Texas Academic Performance Report - fsisd.net · TEA Division of Performance Reporting Page...
167
2016-17 Texas Academic Performance Report 2016-17 Texas Academic Performance Report District Name: FORT STOCKTON ISD District Number: 186902 2017 Accountability Rating: Met Standard 2017 Special Education Determination Status: Meets Requirements
Transcript of 2016-17 Texas Academic Performance Report - fsisd.net · TEA Division of Performance Reporting Page...

2016-17 Texas Academic Performance Report2016-17 Texas Academic Performance Report
District Name: FORT STOCKTON ISD
District Number: 186902
2017 Accountability Rating: Met Standard
2017 Special Education Determination Status:
Meets Requirements

This page intentionally left blank.

TEA Division of Performance Reporting Page 1
TEXAS EDUCATION AGENCYDistrict Name: FORT STOCKTON ISD Texas Academic Performance ReportCounty Name: PECOS 2016-17 District PerformanceDistrict Number: 186902
StateRegion
18 DistrictAfrican
American Hispanic WhiteAmerican
Indian AsianPacific
Islander
Two orMore
RacesSpecial
EdEcon
Disadv ELL^STAARPercent at Approaches Grade Level or Above
Grade 3
Reading 2017 73% 65% 71% * 68% 86% - * - - 63% 66% 46%
2016 73% 63% 72% * 72% 67% * * - * * 66% 56%
Mathematics 2017 78% 69% 78% * 77% 82% - * - - 63% 77% 68%
2016 75% 62% 76% * 77% 71% * * - * * 72% 74%
STAARPercent at Approaches Grade Level or AboveGrade 4
Reading 2017 70% 58% 64% * 63% 70% * * - * * 59% 43%
2016 75% 63% 70% - 68% 83% - - - * * 62% 38%
Mathematics 2017 76% 63% 77% * 78% 70% * * - * * 73% 86%
2016 73% 57% 71% - 69% 83% - - - * * 66% 46%
Writing 2017 65% 53% 53% * 52% 57% * * - * * 47% 41%
2016 69% 58% 56% - 54% 72% - - - * * 52% *
STAARPercent at Approaches Grade Level or AboveGrade 5 ***
Reading 2017 82% 72% 76% - 75% 82% - * - * 71% 73% 46%
2016 81% 70% 72% - 70% 87% - - - * 69% 65% 52%
Mathematics 2017 87% 79% 79% - 78% 76% - * - * * 76% 54%
2016 86% 76% 82% - 82% 83% - - - * 77% 77% 81%
Science 2017 74% 64% 58% - 55% 81% - * - * * 53% 45%
2016 74% 61% 64% - 62% 77% - - - * 62% 54% 45%
STAARPercent at Approaches Grade Level or AboveGrade 6
Reading 2017 69% 57% 60% - 57% 77% - - - * 60% 54% *
2016 69% 55% 54% - 52% 69% - * - - * 47% *
Mathematics 2017 76% 63% 51% - 50% 68% - - - * 60% 46% 36%
2016 72% 55% 59% - 58% 63% - * - - * 55% *

TEA Division of Performance Reporting Page 2
TEXAS EDUCATION AGENCYDistrict Name: FORT STOCKTON ISD Texas Academic Performance ReportCounty Name: PECOS 2016-17 District PerformanceDistrict Number: 186902
StateRegion
18 DistrictAfrican
American Hispanic WhiteAmerican
Indian AsianPacific
Islander
Two orMore
RacesSpecial
EdEcon
Disadv ELL^STAARPercent at Approaches Grade Level or Above
Grade 7
Reading 2017 73% 59% 53% - 52% 59% - * - - * 48% *
2016 71% 59% 61% - 58% 75% - * - - * 53% *
Mathematics 2017 70% 53% 57% - 55% 65% - * - - * 53% *
2016 69% 51% 59% - 58% 65% - * - - * 51% *
Writing 2017 70% 56% 55% - 54% 53% - * - - * 49% *
2016 69% 58% 70% - 67% 90% - * - - * 63% 44%
STAARPercent at Approaches Grade Level or AboveGrade 8 ***
Reading 2017 86% 79% 80% - 79% 86% - * - - * 77% 50%
2016 87% 78% 79% * 78% 100% - - - - * 76% 36%
Mathematics 2017 85% 77% 82% - 80% 95% - * - - * 79% 63%
2016 82% 71% 80% * 78% 100% - - - - * 77% 55%
Science 2017 76% 64% 55% - 51% 77% - * - - * 50% *
2016 75% 61% 56% * 55% 62% - - - - * 49% *
Social Studies 2017 63% 48% 45% - 42% 64% - * - - * 35% *
2016 63% 45% 29% * 28% 38% - - - - * 22% *
STAARPercent at Approaches Grade Level or AboveEnd of Course
English I 2017 64% 52% 56% * 55% 63% - - - - * 51% *
2016 65% 56% 65% * 62% 84% - * - - * 58% *
English II 2017 66% 57% 64% * 61% 80% - * - - * 54% *
2016 67% 61% 60% * 59% 72% - * - - * 54% *
Algebra I 2017 83% 75% 79% * 78% 93% - - - - 50% 72% 70%
2016 78% 67% 80% * 80% 88% - - - - * 77% 50%

TEA Division of Performance Reporting Page 3
TEXAS EDUCATION AGENCYDistrict Name: FORT STOCKTON ISD Texas Academic Performance ReportCounty Name: PECOS 2016-17 District PerformanceDistrict Number: 186902
StateRegion
18 DistrictAfrican
American Hispanic WhiteAmerican
Indian AsianPacific
Islander
Two orMore
RacesSpecial
EdEcon
Disadv ELL^STAARPercent at Approaches Grade Level or Above
End of Course
Biology 2017 86% 83% 85% * 83% 92% - - - - 56% 80% *
2016 87% 85% 93% * 92% 96% - * - - 83% 92% 100%
U.S. History 2017 91% 85% 90% * 89% 100% - - - - 60% 85% *
2016 91% 86% 90% - 89% 100% - * - - 46% 87% 78%
STAARPercent at Approaches Grade Level or AboveAll Grades
All Subjects 2017 75% 65% 66% 63% 65% 76% * 100% - 54% 41% 61% 40%
2016 75% 63% 68% 50% 67% 79% * 94% - 73% 37% 62% 43%
Reading 2017 72% 62% 65% * 63% 77% * 100% - * 40% 60% 31%
2016 73% 63% 66% * 65% 79% * 88% - * 33% 60% 36%
Mathematics 2017 79% 68% 71% * 70% 78% * 100% - * 45% 68% 60%
2016 76% 63% 73% * 72% 78% * 100% - * 39% 68% 57%
Writing 2017 67% 54% 54% * 53% 55% * * - * 37% 48% 33%
2016 69% 58% 63% - 60% 82% - * - * 33% 57% 37%
Science 2017 79% 71% 67% * 64% 84% - * - * 36% 59% 25%
2016 79% 68% 71% * 70% 81% - * - * 51% 63% 41%
Social Studies 2017 77% 66% 67% * 65% 79% - * - - 37% 56% *
2016 77% 65% 60% * 59% 68% - * - - 22% 52% 23%
STAARPercent at Meets Grade LevelAll Grades
Two or More Subjects 2017 48% 33% 33% * 30% 52% * 89% - * 25% 25% 10%
2016 45% 30% 32% * 31% 40% * 78% - * 8% 24% 14%
Reading 2017 48% 36% 36% * 34% 54% * 89% - * 29% 30% 13%
2016 46% 33% 35% * 33% 46% * 75% - * 7% 27% 11%
Mathematics 2017 48% 34% 36% * 34% 49% * 100% - * 31% 31% 25%
2016 43% 27% 38% * 37% 41% * 100% - * * 32% 31%

TEA Division of Performance Reporting Page 4
TEXAS EDUCATION AGENCYDistrict Name: FORT STOCKTON ISD Texas Academic Performance ReportCounty Name: PECOS 2016-17 District PerformanceDistrict Number: 186902
StateRegion
18 DistrictAfrican
American Hispanic WhiteAmerican
Indian AsianPacific
Islander
Two orMore
RacesSpecial
EdEcon
Disadv ELL^STAARPercent at Meets Grade Level
All Grades
Writing 2017 38% 25% 20% * 18% 30% * * - * 26% 15% *
2016 41% 28% 27% - 26% 33% - * - * * 23% *
Science 2017 52% 38% 36% * 33% 57% - * - * 20% 27% *
2016 47% 34% 38% * 36% 51% - * - * * 30% *
Social Studies 2017 51% 36% 34% * 32% 51% - * - - * 24% *
2016 47% 34% 31% * 30% 40% - * - - * 25% *
STAARPercent at Masters Grade LevelAll Grades
All Subjects 2017 20% 12% 12% * 10% 20% * 56% - * 11% 9% 7%
2016 18% 10% 10% * 9% 18% * 33% - * 7% 7% 5%
Reading 2017 19% 12% 11% * 10% 21% * 60% - * 9% 8% 5%
2016 17% 10% 10% * 9% 16% * * - * * 7% 4%
Mathematics 2017 23% 13% 15% * 14% 23% * 63% - * 14% 13% 14%
2016 19% 9% 14% * 13% 22% * * - * 11% 11% 10%
Writing 2017 12% 5% 4% * 4% * * * - * * 4% *
2016 15% 8% 5% - 4% * - * - * * 3% *
Science 2017 19% 11% 9% * 8% 16% - * - * * 7% *
2016 16% 8% 7% * 5% 19% - * - * * 3% *
Social Studies 2017 27% 16% 14% * 12% 29% - * - - * 8% *
2016 22% 12% 8% * 7% 24% - * - - * 5% *
STAARPercent Met or Exceeded ProgressAll Grades
All Subjects 2017 61% 57% 51% * 50% 59% * * - * 47% 50% 47%
2016 62% 57% 61% * 61% 61% - * - * 59% 60% 54%
Reading 2017 59% 56% 51% * 50% 62% * * - * 55% 50% 43%
2016 60% 56% 59% * 59% 59% - * - * 59% 58% 52%

TEA Division of Performance Reporting Page 5
TEXAS EDUCATION AGENCYDistrict Name: FORT STOCKTON ISD Texas Academic Performance ReportCounty Name: PECOS 2016-17 District PerformanceDistrict Number: 186902
StateRegion
18 DistrictAfrican
American Hispanic WhiteAmerican
Indian AsianPacific
Islander
Two orMore
RacesSpecial
EdEcon
Disadv ELL^STAARPercent Met or Exceeded Progress
All Grades
Mathematics 2017 64% 59% 50% * 50% 56% * * - * 40% 51% 51%
2016 63% 57% 64% * 64% 63% - * - * * 62% 57%
STAARPercent Exceeded ProgressAll Grades
All Subjects 2017 19% 16% 11% * 11% 11% * * - * 9% 11% 9%
2016 17% 14% 15% * 15% 19% - * - * 14% 15% 14%
Reading 2017 17% 15% 12% * 12% 14% * * - * 11% 13% 10%
2016 16% 15% 16% * 15% 18% - * - * 21% 16% 17%
Mathematics 2017 20% 16% 9% * 9% 8% * * - * 8% 9% 9%
2016 17% 13% 15% * 14% 19% - * - * * 15% 11%
Progress of Prior-Year Non-Proficient StudentsSum of Grades 4-8
Reading 2017 35% 29% 26% * 27% 22% - - - * * 27% 26%
2016 35% 29% 35% * 32% 60% - - - * 27% 32% 22%
Mathematics 2017 43% 37% 34% * 34% 38% - - - * * 33% 36%

TEA Division of Performance Reporting Page 6
TEXAS EDUCATION AGENCYDistrict Name: FORT STOCKTON ISD Texas Academic Performance ReportCounty Name: PECOS 2016-17 District PerformanceDistrict Number: 186902
StateRegion
18 DistrictAfrican
American Hispanic WhiteAmerican
Indian AsianPacific
Islander
Two orMore
RacesSpecial
EdEcon
Disadv ELLStudent Success Initiative
Grade 5 Reading
Students Meeting Approaches Grade Level on First STAARAdministration
2017 72% 60% 60% - 59% 60% - * - * * 55% *
Students Requiring Accelerated Instruction
2017 28% 40% 40% - 41% 40% - * - * * 45% 69%
STAARCumulative Met Standard
2017 81% 72% 76% - 75% 80% - * - * * 72% 46%
Grade 5 Mathematics
Students Meeting Approaches Grade Level on First STAARAdministration
2017 81% 71% 74% - 73% 73% - * - * * 70% 38%
Students Requiring Accelerated Instruction
2017 19% 29% 26% - 27% * - * - * * 30% 62%
STAARCumulative Met Standard
2017 87% 78% 78% - 78% 73% - * - * * 76% 54%

TEA Division of Performance Reporting Page 7
TEXAS EDUCATION AGENCYDistrict Name: FORT STOCKTON ISD Texas Academic Performance ReportCounty Name: PECOS 2016-17 District PerformanceDistrict Number: 186902
StateRegion
18 DistrictAfrican
American Hispanic WhiteAmerican
Indian AsianPacific
Islander
Two orMore
RacesSpecial
EdEcon
Disadv ELLStudent Success Initiative
Grade 8 Reading
Students Meeting Approaches Grade Level on First STAARAdministration
2017 76% 67% 66% - 65% 73% - * - - * 59% *
Students Requiring Accelerated Instruction
2017 24% 33% 34% - 35% 27% - * - - 78% 41% 82%
STAARCumulative Met Standard
2017 85% 78% 79% - 77% 86% - * - - * 75% 41%
Grade 8 Mathematics
Students Meeting Approaches Grade Level on First STAARAdministration
2017 75% 63% 70% - 68% 77% - * - - * 63% 41%
Students Requiring Accelerated Instruction
2017 25% 37% 30% - 32% 23% - * - - 89% 37% 59%
STAARCumulative Met Standard
2017 85% 76% 82% - 80% 95% - * - - * 79% 59%

TEA Division of Performance Reporting Page 8
TEXAS EDUCATION AGENCYDistrict Name: FORT STOCKTON ISD Texas Academic Performance ReportCounty Name: PECOS 2016-17 District PerformanceDistrict Number: 186902 Bilingual Education/English as a Second Language (Current Year ELL Students)
StateRegion
18 DistrictBilingual
EducationBE-TransEarly Exit
BE-TransLate Exit
BE-DualTwo-Way
BE-DualOne-Way ESL
ESLContent
ESLPull-Out
LEP NoServices
LEP WithServices
TotalELL
STAARPercent at Approaches Grade Level or AboveAll Grades
All Subjects 2017 75% 65% 66% 54% 54% - - - 39% 48% 24% * 40% 40%2016 75% 63% 68% 64% 64% - - - 36% 47% 27% 63% 42% 43%
Reading 2017 72% 62% 65% 43% 43% - - - 30% 31% 28% * 31% 31%2016 73% 63% 66% 55% 55% - - - 26% 31% 22% * 34% 36%
Mathematics 2017 79% 68% 71% 64% 64% - - - 60% 75% 36% * 60% 60%2016 76% 63% 73% 74% 74% - - - 47% 62% 35% 100% 55% 57%
Writing 2017 67% 54% 54% - - - - - 31% 39% * * 31% 33%2016 69% 58% 63% - - - - - 37% * 44% - 37% 37%
Science 2017 79% 71% 67% - - - - - 25% 37% * - 25% 25%2016 79% 68% 71% - - - - - 41% 52% 30% * 41% 41%
Social Studies 2017 77% 66% 67% - - - - - * * * - * *2016 77% 65% 60% - - - - - 24% 100% * * 24% 23%
STAARPercent at Meets Grade LevelAll Grades
Two or More Subjects 2017 48% 33% 33% * * - - - 8% 10% * * 11% 10%2016 45% 30% 32% 60% 60% - - - 7% * * * 13% 14%
Reading 2017 48% 36% 36% * * - - - 10% 14% * * 13% 13%2016 46% 33% 35% 60% 60% - - - * * * * 11% 11%
Mathematics 2017 48% 34% 36% * * - - - 23% 33% * * 25% 25%2016 43% 27% 38% 100% 100% - - - 20% 30% 14% * 30% 31%
Writing 2017 38% 25% 20% - - - - - * * * * * *2016 41% 28% 27% - - - - - * * * - * *
Science 2017 52% 38% 36% - - - - - * * * - * *2016 47% 34% 38% - - - - - * * * * * *
Social Studies 2017 51% 36% 34% - - - - - * * * - * *2016 47% 34% 31% - - - - - * * * * * *

TEA Division of Performance Reporting Page 9
TEXAS EDUCATION AGENCYDistrict Name: FORT STOCKTON ISD Texas Academic Performance ReportCounty Name: PECOS 2016-17 District PerformanceDistrict Number: 186902 Bilingual Education/English as a Second Language (Current Year ELL Students)
StateRegion
18 DistrictBilingual
EducationBE-TransEarly Exit
BE-TransLate Exit
BE-DualTwo-Way
BE-DualOne-Way ESL
ESLContent
ESLPull-Out
LEP NoServices
LEP WithServices
TotalELL
STAARPercent at Masters Grade LevelAll Grades
All Subjects 2017 20% 12% 12% 21% 21% - - - 6% 8% * * 7% 7%2016 18% 10% 10% 22% 22% - - - * * * * 5% 5%
Reading 2017 19% 12% 11% * * - - - 4% 6% * * 5% 5%2016 17% 10% 10% 13% 13% - - - * * * * 4% 4%
Mathematics 2017 23% 13% 15% * * - - - 12% 17% * * 14% 14%2016 19% 9% 14% 38% 38% - - - * * * * 10% 10%
Writing 2017 12% 5% 4% - - - - - * * * * * *2016 15% 8% 5% - - - - - * * * - * *
Science 2017 19% 11% 9% - - - - - * * * - * *2016 16% 8% 7% - - - - - * * * * * *
Social Studies 2017 27% 16% 14% - - - - - * * * - * *2016 22% 12% 8% - - - - - * * * * * *
STAARPercent Met or Exceeded ProgressAll Grades
All Subjects 2017 61% 57% 51% * * - - - 48% 44% * * 47% 46%2016 62% 57% 61% 55% 55% - - - 52% 46% 56% * 53% 53%
Reading 2017 59% 56% 51% * * - - - 39% 31% * * 38% 38%2016 60% 56% 59% * * - - - 55% 60% 52% * 53% 53%
Mathematics 2017 64% 59% 50% * * - - - 56% 57% * * 56% 55%2016 63% 57% 64% 64% 64% - - - 48% * * * 52% 53%
STAARPercent Exceeded ProgressAll Grades
All Subjects 2017 19% 16% 11% * * - - - 10% 14% * * 11% 10%2016 17% 14% 15% 18% 18% - - - 13% 11% 14% * 14% 15%
Reading 2017 17% 15% 12% * * - - - 10% 13% * * 10% 10%2016 16% 15% 16% * * - - - 17% 14% 19% * 17% 18%

TEA Division of Performance Reporting Page 10
TEXAS EDUCATION AGENCYDistrict Name: FORT STOCKTON ISD Texas Academic Performance ReportCounty Name: PECOS 2016-17 District PerformanceDistrict Number: 186902 Bilingual Education/English as a Second Language (Current Year ELL Students)
StateRegion
18 DistrictBilingual
EducationBE-TransEarly Exit
BE-TransLate Exit
BE-DualTwo-Way
BE-DualOne-Way ESL
ESLContent
ESLPull-Out
LEP NoServices
LEP WithServices
TotalELL
STAARPercent Exceeded ProgressAll Grades
Mathematics 2017 20% 16% 9% * * - - - 9% 15% * * 11% 11%2016 17% 13% 15% 21% 21% - - - 8% * * * 11% 13%
Progress of Prior-Year Non-Proficient StudentsSum of Grades 4-8
Reading 2017 35% 29% 26% - - - - - 26% 36% 19% * 26% 26%2016 35% 29% 35% - - - - - 20% 29% 15% * 20% 22%
Mathematics 2017 43% 37% 34% - - - - - 36% 44% 32% * 36% 36%

TEA Division of Performance Reporting Page 11
TEXAS EDUCATION AGENCYDistrict Name: FORT STOCKTON ISD Texas Academic Performance ReportCounty Name: PECOS 2016-17 District ParticipationDistrict Number: 186902
StateRegion
18 DistrictAfrican
American Hispanic WhiteAmerican
Indian AsianPacific
Islander
Two orMoreRaces
SpecialEd
EconDisadv ELL
2017 STAARParticipation(All Grades)
All TestsTest Participant 99% 99% 99% 100% 99% 100% * 100% - 100% 98% 99% 100%
Included in Accountability 94% 94% 95% 100% 96% 92% * 100% - 100% 89% 96% 92%Not Included in Accountability
Mobile 4% 4% 3% 0% 3% 8% * 0% - 0% 8% 3% 2%Other Exclusions 1% 1% 1% 0% 1% 0% * 0% - 0% 0% 1% 6%
Not Tested 1% 1% 1% 0% 1% 0% * 0% - 0% 2% 1% 0%Absent 1% 1% 1% 0% 1% 0% * 0% - 0% 2% 1% 0%Other 0% 0% 0% 0% 0% 0% * 0% - 0% 0% 0% 0%
2016 STAARParticipation(All Grades)
All TestsTest Participant 99% 99% 100% 100% 99% 100% * 100% - 100% 100% 99% 100%
Included in Accountability 94% 94% 95% 100% 95% 94% * 69% - 100% 91% 93% 85%Not Included in Accountability
Mobile 4% 4% 4% 0% 4% 6% * 27% - 0% 6% 5% 10%Other Exclusions 1% 1% 1% 0% 1% 0% * 4% - 0% 2% 1% 5%
Not Tested 1% 1% 0% 0% 1% 0% * 0% - 0% 0% 1% 0%Absent 1% 1% 0% 0% 0% 0% * 0% - 0% 0% 1% 0%Other 0% 0% 0% 0% 0% 0% * 0% - 0% 0% 0% 0%

TEA Division of Performance Reporting Page 12
TEXAS EDUCATION AGENCYDistrict Name: FORT STOCKTON ISD Texas Academic Performance ReportCounty Name: PECOS 2016-17 District Attendance and Postsecondary ReadinessDistrict Number: 186902
State Region 18 DistrictAfrican
American Hispanic WhiteAmerican
Indian AsianPacific
IslanderTwo or
More RacesSpecial
EdEcon
Disadv ELL
Attendance Rate2015-16 95.8% 94.9% 93.3% 95.2% 93.2% 93.6% * 97.0% - 91.9% 92.2% 93.1% 94.0%2014-15 95.7% 94.5% 93.6% 96.0% 93.6% 93.8% * 96.7% - 94.6% 92.8% 93.4% 94.1%
Annual Dropout Rate (Gr 7-8)2015-16 0.4% 0.5% 0.3% * 0.3% 0.0% * * - - 0.0% 0.4% 2.1%2014-15 0.3% 0.4% 1.1% * 0.9% 1.9% * * - - 3.7% 0.8% 0.0%
Annual Dropout Rate (Gr 9-12)2015-16 2.0% 2.2% 1.3% * 1.2% 2.3% - * - * 2.2% 1.6% 3.6%2014-15 2.1% 2.9% 1.1% * 1.2% 0.0% - * - * 0.0% 0.9% 8.0%
4-Year Longitudinal Rate (Gr 9-12)Class of 2016
Graduated 89.1% 85.9% 93.8% - 93.0% 100.0% - - - * 87.5% 92.4% *Received GED 0.5% 1.6% 0.0% - 0.0% 0.0% - - - * 0.0% 0.0% *Continued HS 4.2% 3.3% 2.1% - 2.3% 0.0% - - - * 12.5% 1.5% *Dropped Out 6.2% 9.2% 4.1% - 4.7% 0.0% - - - * 0.0% 6.1% *Graduates and GED 89.6% 87.5% 93.8% - 93.0% 100.0% - - - * 87.5% 92.4% *Grads, GED, & Cont 93.8% 90.8% 95.9% - 95.3% 100.0% - - - * 100.0% 93.9% *
Class of 2015Graduated 89.0% 83.3% 88.3% * 87.0% 100.0% - - - * * 81.7% *Received GED 0.6% 2.0% 0.0% * 0.0% 0.0% - - - * * 0.0% *Continued HS 4.1% 3.6% 0.7% * 0.8% 0.0% - - - * * 0.0% *Dropped Out 6.3% 11.0% 11.0% * 12.2% 0.0% - - - * * 18.3% *Graduates and GED 89.6% 85.3% 88.3% * 87.0% 100.0% - - - * * 81.7% *Grads, GED, & Cont 93.7% 89.0% 89.0% * 87.8% 100.0% - - - * * 81.7% *
5-Year Extended Longitudinal Rate (Gr 9-12)Class of 2015
Graduated 91.3% 85.6% 88.4% * 87.1% 100.0% - - - * * 80.6% *Received GED 0.8% 2.6% 0.0% * 0.0% 0.0% - - - * * 0.0% *Continued HS 1.2% 0.7% 0.0% * 0.0% 0.0% - - - * * 0.0% *Dropped Out 6.7% 11.1% 11.6% * 12.9% 0.0% - - - * * 19.4% *Graduates and GED 92.1% 88.1% 88.4% * 87.1% 100.0% - - - * * 80.6% *Grads, GED, & Cont 93.3% 88.9% 88.4% * 87.1% 100.0% - - - * * 80.6% *
Class of 2014Graduated 90.4% 83.9% 88.1% * 87.0% 93.8% - * - - 83.3% 82.4% 71.4%Received GED 1.0% 2.1% 0.8% * 0.9% 0.0% - * - - 0.0% 1.5% 0.0%Continued HS 1.3% 0.7% 0.0% * 0.0% 0.0% - * - - 0.0% 0.0% 0.0%Dropped Out 7.2% 13.3% 11.1% * 12.0% 6.3% - * - - 16.7% 16.2% 28.6%Graduates and GED 91.5% 86.0% 88.9% * 88.0% 93.8% - * - - 83.3% 83.8% 71.4%Grads, GED, & Cont 92.8% 86.7% 88.9% * 88.0% 93.8% - * - - 83.3% 83.8% 71.4%

TEA Division of Performance Reporting Page 13
TEXAS EDUCATION AGENCYDistrict Name: FORT STOCKTON ISD Texas Academic Performance ReportCounty Name: PECOS 2016-17 District Attendance and Postsecondary ReadinessDistrict Number: 186902
State Region 18 DistrictAfrican
American Hispanic WhiteAmerican
Indian AsianPacific
IslanderTwo or
More RacesSpecial
EdEcon
Disadv ELL
6-Year Extended Longitudinal Rate (Gr 9-12)Class of 2014
Graduated 90.9% 84.2% 88.1% * 87.0% 93.8% - * - - 83.3% 82.4% 71.4%Received GED 1.2% 2.5% 0.8% * 0.9% 0.0% - * - - 0.0% 1.5% 0.0%Continued HS 0.6% 0.2% 0.0% * 0.0% 0.0% - * - - 0.0% 0.0% 0.0%Dropped Out 7.2% 13.1% 11.1% * 12.0% 6.3% - * - - 16.7% 16.2% 28.6%Graduates and GED 92.2% 86.7% 88.9% * 88.0% 93.8% - * - - 83.3% 83.8% 71.4%Grads, GED, & Cont 92.8% 86.9% 88.9% * 88.0% 93.8% - * - - 83.3% 83.8% 71.4%
Class of 2013Graduated 90.9% 83.0% 89.5% - 89.6% 87.5% - * - - 100.0% 84.4% *Received GED 1.4% 2.5% 0.0% - 0.0% 0.0% - * - - 0.0% 0.0% *Continued HS 0.6% 0.3% 0.0% - 0.0% 0.0% - * - - 0.0% 0.0% *Dropped Out 7.2% 14.2% 10.5% - 10.4% 12.5% - * - - 0.0% 15.6% *Graduates and GED 92.3% 85.5% 89.5% - 89.6% 87.5% - * - - 100.0% 84.4% *Grads, GED, & Cont 92.8% 85.8% 89.5% - 89.6% 87.5% - * - - 100.0% 84.4% *
4-Year Federal Graduation Rate Without Exclusions (Gr 9-12)Class of 2016 89.1% 85.9% 92.6% - 92.4% 94.1% - - - * 87.5% 91.0% *Class of 2015 89.0% 83.3% 86.5% * 85.1% 100.0% - - - * * 79.5% *
5-Year Extended Federal Graduation Rate Without Exclusions (Gr 9-12)Class of 2015 91.3% 85.6% 86.6% * 85.2% 100.0% - - - * * 78.4% *Class of 2014 90.4% 83.9% 88.1% * 87.0% 93.8% - * - - 83.3% 82.4% 71.4%
6-Year Extended Federal Graduation Rate Without Exclusions (Gr 9-12)Class of 2014 90.9% 84.2% 88.1% * 87.0% 93.8% - * - - 83.3% 82.4% 71.4%Class of 2013 90.9% 83.0% 89.6% - 89.8% 87.5% - * - - 100.0% 84.8% *
RHSP/DAP Graduates (Longitudinal Rate)Class of 2016 87.4% 85.8% 95.6% - 95.0% 100.0% - - - * 42.9% 93.4% *Class of 2015 86.1% 86.4% 95.3% * 95.6% 91.7% - - - * * 91.4% *
RHSP/DAP/FHSP-E/FHSP-DLA Graduates (Longitudinal Rate)Class of 2016 85.1% 83.2% 95.6% - 95.0% 100.0% - - - * 42.9% 93.4% *Class of 2015 84.1% 80.6% 95.3% * 95.6% 91.7% - - - * * 91.4% *
RHSP/DAP Graduates (Annual Rate)2015-16 85.6% 84.8% 95.0% - 95.1% 94.1% - - - * 42.9% 93.2% 100.0%2014-15 84.3% 84.8% 95.3% * 95.7% 91.7% - - - * * 94.8% *
RHSP/DAP/FHSP-E/FHSP-DLA Graduates (Annual Rate)2015-16 83.3% 81.8% 95.0% - 95.1% 94.1% - - - * 42.9% 93.2% 100.0%2014-15 82.2% 78.8% 95.3% * 95.7% 91.7% - - - * * 94.8% *

TEA Division of Performance Reporting Page 14
TEXAS EDUCATION AGENCYDistrict Name: FORT STOCKTON ISD Texas Academic Performance ReportCounty Name: PECOS 2016-17 District Attendance and Postsecondary ReadinessDistrict Number: 186902
State Region 18 DistrictAfrican
American Hispanic WhiteAmerican
Indian AsianPacific
IslanderTwo or
More RacesSpecial
EdEcon
Disadv ELL
Advanced Course/Dual-Credit Course Completion (Grades 11-12)Any Subject
2015-16 55.0% 55.2% 70.3% - 69.1% 82.1% - * - * 20.0% 66.9% 80.0%2014-15 54.5% 55.5% 65.8% * 64.3% 75.0% - - - * 9.1% 58.3% 40.0%
English Language Arts2015-16 30.1% 28.6% 40.2% - 39.2% 46.4% - * - * 5.0% 33.1% 60.0%2014-15 29.0% 27.7% 26.2% * 23.7% 46.4% - - - * 0.0% 12.7% *
Mathematics2015-16 43.1% 39.1% 43.4% - 41.6% 61.5% - * - * 0.0% 39.2% 40.0%2014-15 43.8% 42.3% 53.2% * 52.7% 52.0% - - - * 0.0% 55.1% *
Science2015-16 12.2% 4.1% 0.0% - 0.0% 0.0% - * - * 0.0% 0.0% 0.0%2014-15 12.7% 5.9% 0.0% - 0.0% 0.0% - - - - 0.0% 0.0% *
Social Studies2015-16 29.0% 26.4% 29.6% - 27.0% 50.0% - * - * 0.0% 16.8% 0.0%2014-15 28.4% 26.6% 24.2% * 22.7% 35.7% - - - * 0.0% 9.7% 0.0%
Advanced Course/Dual-Credit Course Completion (Grades 9-12)Any Subject
2015-16 35.9% 32.6% 38.2% * 38.2% 39.0% - * - * 11.6% 33.7% 29.6%2014-15 34.6% 30.8% 28.8% * 28.3% 31.3% - * - * 2.7% 21.9% 14.3%
English Language Arts2015-16 16.2% 15.4% 21.5% * 21.5% 21.0% - * - * 2.4% 17.3% 22.2%2014-15 15.7% 14.7% 11.7% * 10.7% 20.0% - * - * 0.0% 5.3% 10.0%
Mathematics2015-16 19.3% 16.8% 19.2% * 18.9% 21.8% - * - * 0.0% 16.0% 14.8%2014-15 19.4% 17.8% 22.5% * 22.4% 21.0% - * - * 0.0% 19.4% 5.6%
Science2015-16 5.1% 1.6% 0.0% * 0.0% 0.0% - * - * 0.0% 0.0% 0.0%2014-15 5.2% 2.2% 0.0% * 0.0% 0.0% - * - - 0.0% 0.0% 0.0%
Social Studies2015-16 20.8% 14.8% 18.4% * 17.0% 27.5% - * - * 0.0% 9.9% 0.0%2014-15 19.5% 14.8% 14.4% * 13.4% 23.3% - * - * 0.0% 5.2% 0.0%
College-Ready GraduatesEnglish Language Arts
2015-16 50.6% 37.5% 20.9% - 15.5% 50.0% - - - * * 15.0% *2014-15 42.0% 39.0% 25.0% * 18.0% 63.0% - - - * - 9.0% -
Mathematics2015-16 44.6% 33.9% 35.7% - 29.8% 62.5% - - - * * 21.4% -2014-15 38.0% 34.0% 22.0% * 14.0% 75.0% - - - * - 9.0% -

TEA Division of Performance Reporting Page 15
TEXAS EDUCATION AGENCYDistrict Name: FORT STOCKTON ISD Texas Academic Performance ReportCounty Name: PECOS 2016-17 District Attendance and Postsecondary ReadinessDistrict Number: 186902
State Region 18 DistrictAfrican
American Hispanic WhiteAmerican
Indian AsianPacific
IslanderTwo or
More RacesSpecial
EdEcon
Disadv ELL
College-Ready GraduatesBoth Subjects
2015-16 38.7% 26.0% 16.7% - 8.9% 50.0% - - - * * 16.7% -2014-15 35.0% 29.0% 18.0% * 11.0% 63.0% - - - * - 9.0% -
Either Subject2015-16 56.4% 45.1% 36.2% - 31.7% 62.5% - - - * * 18.2% *2014-15 45.0% 43.0% 28.0% * 21.0% 75.0% - - - * - 9.0% -
College and Career Ready Graduates2015-16 75.9% 72.5% 85.8% - 84.6% 94.1% - - - * 71.4% 84.7% 80.0%2014-15 74.5% 68.9% 70.5% * 69.6% 75.0% - - - * * 70.7% *
Texas Success Initiative Assessment (TSIA)English Language Arts
2015-16 22.6% 17.5% 5.7% - 6.5% 0.0% - - - * 0.0% 3.4% 0.0%2014-15 10.6% 10.6% 9.3% * 8.7% 16.7% - - - * * 3.4% *
Mathematics2015-16 18.1% 15.4% 9.9% - 10.6% 5.9% - - - * 0.0% 3.4% 0.0%2014-15 7.1% 8.1% 7.8% * 7.0% 16.7% - - - * * 3.4% *
Completion of Two or More Advanced/Dual-Credit Courses in Current and/or Prior Year (Annual Graduates)2015-16 48.7% 48.4% 64.5% - 61.8% 82.4% - - - * 0.0% 62.7% 80.0%2014-15 48.1% 49.4% 39.5% * 36.5% 66.7% - - - * * 36.2% *
Completion of Twelve or More Hours of Postsecondary Credit (Annual Graduates)Any Subject
2015-16 12.2% 19.9% 30.5% - 28.5% 41.2% - - - * 0.0% 13.6% 20.0%2014-15 10.6% 20.5% 23.3% * 20.9% 41.7% - - - * * 20.7% *
AP/IB Course Completion (Annual Graduates)2015-16 44.8% 31.6% 1.4% - 0.8% 5.9% - - - * 0.0% 1.7% 0.0%2014-15 43.4% 31.6% 0.8% * 0.0% 8.3% - - - * * 0.0% *
CTE Coherent Sequence (Annual Graduates)2015-16 47.8% 42.3% 68.8% - 67.5% 76.5% - - - * 71.4% 66.1% 40.0%2014-15 46.6% 34.7% 51.9% * 52.2% 41.7% - - - * * 55.2% *
AP/IB Results (Participation)All Subjects
2016 25.5% 16.6% 0.0% - 0.0% 0.0% - * - * n/a 0.0% n/a2015 24.9% 14.6% 0.0% * 0.0% 0.0% - - - * n/a 0.0% n/a
English Language Arts2016 15.5% 10.8% 0.0% - 0.0% 0.0% - * - * n/a 0.0% n/a2015 15.1% 9.4% 0.0% * 0.0% 0.0% - - - * n/a 0.0% n/a
Mathematics2016 6.8% 2.9% 0.0% - 0.0% 0.0% - * - * n/a 0.0% n/a2015 6.8% 2.6% 0.0% * 0.0% 0.0% - - - * n/a 0.0% n/a

TEA Division of Performance Reporting Page 16
TEXAS EDUCATION AGENCYDistrict Name: FORT STOCKTON ISD Texas Academic Performance ReportCounty Name: PECOS 2016-17 District Attendance and Postsecondary ReadinessDistrict Number: 186902
State Region 18 DistrictAfrican
American Hispanic WhiteAmerican
Indian AsianPacific
IslanderTwo or
More RacesSpecial
EdEcon
Disadv ELL
AP/IB Results (Participation)Science
2016 10.4% 4.3% 0.0% - 0.0% 0.0% - * - * n/a 0.0% n/a2015 10.2% 3.3% 0.0% * 0.0% 0.0% - - - * n/a 0.0% n/a
Social Studies2016 14.8% 8.9% 0.0% - 0.0% 0.0% - * - * n/a 0.0% n/a2015 14.4% 7.7% 0.0% * 0.0% 0.0% - - - * n/a 0.0% n/a
SAT/ACT ResultsTested
Class of 2016 71.6% 65.5% 32.6% - 30.1% 47.1% - - - * n/a 14.5% n/aClass of 2015 68.3% 48.4% 49.6% * 47.0% 66.7% - - - * n/a 37.3% n/a
At/Above CriterionClass of 2016 22.5% 11.2% 8.7% - 2.7% 37.5% - - - * n/a 0.0% n/aClass of 2015 24.3% 18.3% 4.7% * 0.0% 37.5% - - - * n/a 0.0% n/a
Average SAT ScoreAll Subjects
Class of 2016 1375 1262 1368 - 1332 1503 - - - * n/a 1316 n/aClass of 2015 1394 1386 1260 * 1219 1460 - - - * n/a 1210 n/a
English Language Arts and WritingClass of 2016 903 829 904 - 884 983 - - - * n/a 865 n/aClass of 2015 912 909 827 * 803 935 - - - * n/a 785 n/a
MathematicsClass of 2016 472 434 464 - 449 518 - - - * n/a 451 n/aClass of 2015 482 477 433 * 416 525 - - - * n/a 426 n/a
Average ACT ScoreAll Subjects
Class of 2016 20.3 19.0 20.5 - 19.4 * - - - - n/a * n/aClass of 2015 20.6 19.5 16.9 - 16.6 * - - - - n/a 15.6 n/a
English Language ArtsClass of 2016 19.8 18.5 20.6 - 19.3 * - - - - n/a * n/aClass of 2015 20.1 18.9 16.2 - 16.0 * - - - - n/a 14.6 n/a
MathematicsClass of 2016 20.5 19.2 20.2 - 19.3 * - - - - n/a * n/aClass of 2015 20.9 19.9 17.8 - 17.3 * - - - - n/a 16.5 n/a
ScienceClass of 2016 20.5 19.2 20.0 - 18.9 * - - - - n/a * n/aClass of 2015 20.7 19.9 16.7 - 16.5 * - - - - n/a 16.0 n/a
Graduates Enrolled in Texas Institution of Higher Education (TX IHE)2014-15 56.1% 54.8% 45.7% n/a n/a n/a n/a n/a n/a n/a n/a n/a n/a2013-14 57.5% 54.5% 45.0% n/a n/a n/a n/a n/a n/a n/a n/a n/a n/a

TEA Division of Performance Reporting Page 17
TEXAS EDUCATION AGENCYDistrict Name: FORT STOCKTON ISD Texas Academic Performance ReportCounty Name: PECOS 2016-17 District Attendance and Postsecondary ReadinessDistrict Number: 186902
State Region 18 DistrictAfrican
American Hispanic WhiteAmerican
Indian AsianPacific
IslanderTwo or
More RacesSpecial
EdEcon
Disadv ELL
Graduates in TX IHE Completing One Year Without Remediation2014-15 55.6% 54.4% 52.5% n/a n/a n/a n/a n/a n/a n/a n/a n/a n/a2013-14 70.5% 67.5% 72.0% n/a n/a n/a n/a n/a n/a n/a n/a n/a n/a

TEA Division of Performance Reporting Page 18
TEXAS EDUCATION AGENCYDistrict Name: FORT STOCKTON ISD Texas Academic Performance ReportCounty Name: PECOS 2016-17 District ProfileDistrict Number: 186902
---------------- District ---------------- ------------------ State ------------------Student Information Count Percent Count Percent
Total Students: 2,456 100.0% 5,343,834 100.0%
Students by Grade:Early Childhood Education 4 0.2% 13,821 0.3%Pre-Kindergarten 23 0.9% 223,833 4.2%Kindergarten 194 7.9% 371,682 7.0%Grade 1 172 7.0% 395,568 7.4%Grade 2 221 9.0% 408,582 7.6%Grade 3 217 8.8% 412,581 7.7%Grade 4 209 8.5% 410,882 7.7%Grade 5 165 6.7% 400,016 7.5%Grade 6 211 8.6% 398,017 7.4%Grade 7 200 8.1% 396,001 7.4%Grade 8 170 6.9% 392,231 7.3%Grade 9 182 7.4% 431,486 8.1%Grade 10 192 7.8% 395,057 7.4%Grade 11 145 5.9% 363,655 6.8%Grade 12 151 6.1% 330,422 6.2%
Ethnic Distribution:African American 16 0.7% 673,291 12.6%Hispanic 2,129 86.7% 2,802,180 52.4%White 283 11.5% 1,499,559 28.1%American Indian 3 0.1% 20,701 0.4%Asian 16 0.7% 224,834 4.2%Pacific Islander 0 0.0% 7,687 0.1%Two or More Races 9 0.4% 115,582 2.2%
Economically Disadvantaged 1,637 66.7% 3,155,117 59.0%Non-Educationally Disadvantaged 819 33.3% 2,188,717 41.0%English Language Learners (ELL) 221 9.0% 1,010,168 18.9%Students w/ Disciplinary Placements (2015-2016) 7 0.3% 74,803 1.4%At-Risk 1,543 62.8% 2,685,789 50.3%
Students with Disabilities by Type of Primary Disability:Total Students with DisabilitiesBy Type of Primary Disability
147 467,611
Students with Intellectual Disabilities 94 63.9% 207,935 44.5%Students with Physical Disabilities 22 15.0% 102,283 21.9%Students with Autism 22 15.0% 58,444 12.5%Students with Behavioral Disabilities ** ** 93,082 19.9%Students with Non-Categorical Early Childhood * * 5,867 1.3%

TEA Division of Performance Reporting Page 19
TEXAS EDUCATION AGENCYDistrict Name: FORT STOCKTON ISD Texas Academic Performance ReportCounty Name: PECOS 2016-17 District ProfileDistrict Number: 186902
---------------- District ---------------- ------------------ State ------------------Student Information Count Percent Count Percent
Graduates (Class of 2016):Total Graduates 141 100.0% 324,311 100.0%
By Ethnicity (incl. Special Ed.):African American 0 0.0% 41,084 12.7%Hispanic 123 87.2% 157,633 48.6%White 17 12.1% 104,551 32.2%American Indian 0 0.0% 1,280 0.4%Asian 0 0.0% 13,481 4.2%Pacific Islander 0 0.0% 449 0.1%Two or More Races 1 0.7% 5,833 1.8%
By Graduation Type (incl. Special Ed.):Minimum H.S. Program 7 5.0% 42,804 13.2%Recommended H.S. Program/DAP 134 95.0% 254,625 78.5%Foundation High School Plan (No Endorsement) 0 0.0% 11,477 3.5%Foundation High School Plan (Endorsement) 0 0.0% 1,501 0.5%Foundation High School Plan (DLA) 0 0.0% 13,904 4.3%
Special Education Graduates 7 5.0% 23,325 7.2%

TEA Division of Performance Reporting Page 20
TEXAS EDUCATION AGENCYDistrict Name: FORT STOCKTON ISD Texas Academic Performance ReportCounty Name: PECOS 2016-17 District ProfileDistrict Number: 186902
- Non-Special Education Rates - - Special Education Rates -Student Information District State District State
Retention Rates by Grade:
Kindergarten 1.2% 1.8% 0.0% 7.7%Grade 1 0.5% 3.8% 0.0% 6.8%Grade 2 0.5% 2.4% 0.0% 3.1%Grade 3 1.4% 1.6% 0.0% 1.2%Grade 4 0.0% 0.8% 0.0% 0.7%Grade 5 0.5% 0.4% 0.0% 0.7%Grade 6 0.5% 0.6% 0.0% 0.7%Grade 7 0.0% 0.7% 0.0% 0.8%Grade 8 0.0% 0.5% 0.0% 0.9%
---------- District ---------- ------------ State ------------Count Percent Count Percent
Data Quality:Underreported Students 2 0.2% 6,686 0.3%
Class Size Information District State
Class Size Averages by Grade and Subject (Derived from teacher responsibility records):
Elementary:Kindergarten 18.7 18.8Grade 1 16.9 18.8Grade 2 20.0 18.9Grade 3 19.7 19.0Grade 4 15.7 19.0Grade 5 15.9 20.9Grade 6 18.3 20.4
Secondary:English/Language Arts 18.2 16.8Foreign Languages 19.3 18.7Mathematics 17.0 18.0Science 18.9 19.0Social Studies 20.0 19.4

TEA Division of Performance Reporting Page 21
TEXAS EDUCATION AGENCYDistrict Name: FORT STOCKTON ISD Texas Academic Performance ReportCounty Name: PECOS 2016-17 District ProfileDistrict Number: 186902
---------------- District ---------------- ------------------ State ------------------Staff Information Count Percent Count Percent
Total Staff 346.1 100.0% 705,007.9 100.0%
Professional Staff: 211.2 61.0% 451,253.5 64.0%Teachers 161.0 46.5% 352,756.1 50.0%Professional Support 33.7 9.7% 70,392.1 10.0%Campus Administration (School Leadership) 10.5 3.0% 20,492.1 2.9%Central Administration 6.0 1.7% 7,613.2 1.1%
Educational Aides: 46.7 13.5% 67,934.0 9.6%
Auxiliary Staff: 88.2 25.5% 185,820.3 26.4%
Total Minority Staff: 238.1 68.8% 346,378.5 49.1%
Teachers by Ethnicity and Sex:African American 3.0 1.9% 35,986.3 10.2%Hispanic 81.0 50.3% 93,694.5 26.6%White 72.0 44.7% 211,028.1 59.8%American Indian 1.0 0.6% 1,243.7 0.4%Asian 3.0 1.9% 5,383.5 1.5%Pacific Islander 0.0 0.0% 1,521.6 0.4%Two or More Races 1.0 0.6% 3,898.4 1.1%
Males 44.0 27.3% 83,544.8 23.7%Females 117.0 72.7% 269,211.3 76.3%
Teachers by Highest Degree Held:No Degree 0.0 0.0% 4,333.3 1.2%Bachelors 130.0 80.7% 262,745.0 74.5%Masters 29.0 18.0% 83,426.6 23.6%Doctorate 2.0 1.2% 2,251.2 0.6%
Teachers by Years of Experience:Beginning Teachers 13.0 8.1% 27,413.0 7.8%1-5 Years Experience 52.0 32.3% 98,846.9 28.0%6-10 Years Experience 26.0 16.1% 73,646.0 20.9%11-20 Years Experience 38.0 23.6% 98,156.2 27.8%Over 20 Years Experience 32.0 19.9% 54,694.0 15.5%
Number of Students per Teacher 15.3 n/a 15.1 n/a

TEA Division of Performance Reporting Page 22
TEXAS EDUCATION AGENCYDistrict Name: FORT STOCKTON ISD Texas Academic Performance ReportCounty Name: PECOS 2016-17 District ProfileDistrict Number: 186902
Staff Information District State
Experience of Campus Leadership:Average Years Experience of Principals 19.2 19.5Average Years Experience of Principals with District 13.2 12.2Average Years Experience of Assistant Principals 30.0 15.7Average Years Experience of Assistant Principals with District 19.0 10.1
Average Years Experience of Teachers: 11.2 10.9Average Years Experience of Teachers with District: 6.8 7.2
Average Teacher Salary by Years of Experience (regular duties only):Beginning Teachers $42,252 $46,1991-5 Years Experience $42,749 $48,7796-10 Years Experience $47,014 $51,18411-20 Years Experience $52,824 $54,396Over 20 Years Experience $58,184 $60,913
Average Actual Salaries (regular duties only):Teachers $48,844 $52,525Professional Support $53,424 $61,728Campus Administration (School Leadership) $73,613 $76,471Central Administration $96,775 $100,397
Instructional Staff Percent: 59.0% 64.6%
Turnover Rate for Teachers: 20.1% 16.4%
Staff Exclusions:Shared Services Arrangement Staff:
Professional Staff 0.0 1,112.5Educational Aides 0.0 216.4Auxiliary Staff 0.0 454.3
Contracted Instructional Staff: 7.0 2,110.5

TEA Division of Performance Reporting Page 23
TEXAS EDUCATION AGENCYDistrict Name: FORT STOCKTON ISD Texas Academic Performance ReportCounty Name: PECOS 2016-17 District ProfileDistrict Number: 186902
---------------- District ---------------- ------------------ State ------------------Program Information Count Percent Count Percent
Student Enrollment by Program:Bilingual/ESL Education 214 8.7% 1,005,219 18.8%Career & Technical Education 782 31.8% 1,336,684 25.0%Gifted & Talented Education 70 2.9% 415,641 7.8%Special Education 147 6.0% 467,611 8.8%
Teachers by Program (population served):Bilingual/ESL Education 8.7 5.4% 21,143.9 6.0%Career & Technical Education 9.0 5.6% 15,992.3 4.5%Compensatory Education 6.6 4.1% 9,777.0 2.8%Gifted & Talented Education 0.0 0.0% 6,556.8 1.9%Regular Education 123.3 76.6% 256,918.3 72.8%Special Education 7.0 4.3% 30,361.9 8.6%Other 6.3 3.9% 12,005.8 3.4%
Link to: PEIMS Financial Standard Reports/ 2015-2016Financial Actual Report
' '̂ Indicates that ELL rates at met or exceeded standard and exceeded standard include current and monitored students.'*' Indicates results are masked due to small numbers to protect student confidentiality.'**' When only one group is masked, then the second smallest group is masked (regardless of size).'-' Indicates zero observations reported for this group.'n/a' Indicates data reporting is not applicable for this group.'***' Indicates that rates for Reading and Mathematics are based on the cumulative results from the first and second administrations of STAAR.'?' Indicates that the data for this item were statistically improbable, or were reported outside a reasonable range.

This page intentionally left blank.

2016-17 Texas Academic Performance Report2016-17 Texas Academic Performance Report
District Name: FORT STOCKTON ISD
Campus Name: FORT STOCKTON H S
Campus Number: 186902001
2017 Accountability Rating: Met Standard

This page intentionally left blank.

TEA Division of Performance Reporting Page 1
TEXAS EDUCATION AGENCYDistrict Name: FORT STOCKTON ISD Texas Academic Performance Report Total Students: 670
Campus Name: FORT STOCKTON H S 2016-17 Campus Performance Grade Span: 09 - 12Campus Number: 186902001 School Type: High School
State District CampusAfrican
American Hispanic WhiteAmerican
Indian AsianPacific
Islander
Two orMore
RacesSpecial
EdEcon
Disadv ELL^STAARPercent at Approaches Grade Level or Above
End of Course
English I 2017 64% 56% 56% * 55% 63% - - - - * 51% *
2016 65% 65% 65% * 62% 84% - * - - * 58% *
English II 2017 66% 64% 64% * 61% 80% - * - - * 54% *
2016 67% 60% 60% * 59% 72% - * - - * 54% *
Algebra I 2017 83% 79% 79% * 78% 93% - - - - 50% 72% 70%
2016 78% 80% 79% * 78% 87% - - - - * 76% 50%
Biology 2017 86% 85% 85% * 83% 92% - - - - 56% 80% *
2016 87% 93% 93% * 92% 96% - * - - 83% 92% 100%
U.S. History 2017 91% 90% 90% * 89% 100% - - - - 60% 85% *
2016 91% 90% 90% - 89% 100% - * - - 46% 87% 78%
STAARPercent at Approaches Grade Level or AboveAll Grades
All Subjects 2017 75% 66% 72% 56% 71% 85% - * - - 41% 65% 32%
2016 75% 68% 75% * 74% 86% - * - - 38% 70% 46%
Reading 2017 72% 65% 60% * 58% 75% - * - - 24% 52% 12%
2016 73% 66% 62% * 60% 79% - * - - 19% 56% *
Mathematics 2017 79% 71% 79% * 78% 93% - - - - 50% 72% 70%
2016 76% 73% 79% * 78% 87% - - - - * 76% 50%
Science 2017 79% 67% 85% * 83% 92% - - - - 56% 80% *
2016 79% 71% 93% * 92% 96% - * - - 83% 92% 100%
Social Studies 2017 77% 67% 90% * 89% 100% - - - - 60% 85% *
2016 77% 60% 90% - 89% 100% - * - - 46% 87% 78%
STAARPercent at Meets Grade LevelAll Grades
Two or More Subjects 2017 48% 33% 41% * 37% 68% - * - - * 30% *
2016 45% 32% 40% * 38% 49% - * - - * 32% *

TEA Division of Performance Reporting Page 2
TEXAS EDUCATION AGENCYDistrict Name: FORT STOCKTON ISD Texas Academic Performance Report Total Students: 670
Campus Name: FORT STOCKTON H S 2016-17 Campus Performance Grade Span: 09 - 12Campus Number: 186902001 School Type: High School
State District CampusAfrican
American Hispanic WhiteAmerican
Indian AsianPacific
Islander
Two orMore
RacesSpecial
EdEcon
Disadv ELL^STAARPercent at Meets Grade Level
All Grades
Reading 2017 48% 36% 41% * 38% 63% - * - - * 32% *
2016 46% 35% 40% * 37% 60% - * - - * 30% *
Mathematics 2017 48% 36% 37% * 38% * - - - - * 31% *
2016 43% 38% 39% * 40% 36% - - - - * 33% *
Science 2017 52% 36% 56% * 54% 74% - - - - * 46% *
2016 47% 38% 65% * 63% 76% - * - - * 61% *
Social Studies 2017 51% 34% 53% * 49% 88% - - - - * 41% *
2016 47% 31% 51% - 50% 58% - * - - * 45% *
STAARPercent at Masters Grade LevelAll Grades
All Subjects 2017 20% 12% 8% * 7% 14% - * - - * 5% *
2016 18% 10% 6% * 5% 11% - * - - * 4% *
Reading 2017 19% 11% 2% * 2% * - * - - * * *
2016 17% 10% 2% * 1% * - * - - * * *
Mathematics 2017 23% 15% 10% * 11% * - - - - * 9% *
2016 19% 14% 9% * 10% * - - - - * 8% *
Science 2017 19% 9% 11% * 10% * - - - - * 11% *
2016 16% 7% 7% * 4% 22% - * - - * * *
Social Studies 2017 27% 14% 19% * 16% 44% - - - - * 9% *
2016 22% 8% 13% - 11% 42% - * - - * 8% *
STAARPercent Met or Exceeded ProgressAll Grades
All Subjects 2017 61% 51% 42% * 40% * - * - - * 35% *
2016 62% 61% 45% * 46% * - * - - * * *
Reading 2017 59% 51% * * * * - * - - * * *
2016 60% 59% * * * * - * - - * * *

TEA Division of Performance Reporting Page 3
TEXAS EDUCATION AGENCYDistrict Name: FORT STOCKTON ISD Texas Academic Performance Report Total Students: 670
Campus Name: FORT STOCKTON H S 2016-17 Campus Performance Grade Span: 09 - 12Campus Number: 186902001 School Type: High School
State District CampusAfrican
American Hispanic WhiteAmerican
Indian AsianPacific
Islander
Two orMore
RacesSpecial
EdEcon
Disadv ELL^STAARPercent Met or Exceeded Progress
All Grades
Mathematics 2017 64% 50% 37% * 36% * - - - - * 30% *
2016 63% 64% 38% * 39% * - - - - * * *
STAARPercent Exceeded ProgressAll Grades
All Subjects 2017 19% 11% 4% * 4% * - * - - * 3% *
2016 17% 15% 4% * 4% * - * - - * * *
Reading 2017 17% 12% * * * * - * - - * * *
2016 16% 16% * * * * - * - - * * *
Mathematics 2017 20% 9% 7% * 8% * - - - - * 7% *
2016 17% 15% 7% * 8% * - - - - * * *

TEA Division of Performance Reporting Page 4
TEXAS EDUCATION AGENCYDistrict Name: FORT STOCKTON ISD Texas Academic Performance Report Total Students: 670
Campus Name: FORT STOCKTON H S 2016-17 Campus Performance Grade Span: 09 - 12Campus Number: 186902001 Bilingual Education/English as a Second Language (Current Year ELL Students)
State District CampusBilingual
EducationBE-TransEarly Exit
BE-TransLate Exit
BE-DualTwo-Way
BE-DualOne-Way ESL
ESLContent
ESLPull-Out
LEP NoServices
LEP WithServices
TotalELL
STAARPercent at Approaches Grade Level or AboveAll Grades
All Subjects 2017 75% 66% 72% - - - - - 32% 33% * - 32% 32%2016 75% 68% 75% - - - - - 46% 43% 54% - 46% 46%
Reading 2017 72% 65% 60% - - - - - 12% 13% * - 12% 12%2016 73% 66% 62% - - - - - * * * - * *
Mathematics 2017 79% 71% 79% - - - - - 70% 72% * - 70% 70%2016 76% 73% 79% - - - - - 50% * * - 50% 50%
Science 2017 79% 67% 85% - - - - - * * * - * *2016 79% 71% 93% - - - - - 100% * * - 100% 100%
Social Studies 2017 77% 67% 90% - - - - - * * * - * *2016 77% 60% 90% - - - - - 78% 100% * - 78% 78%
STAARPercent at Meets Grade LevelAll Grades
Two or More Subjects 2017 48% 33% 41% - - - - - * * * - * *2016 45% 32% 40% - - - - - * * * - * *
Reading 2017 48% 36% 41% - - - - - * * * - * *2016 46% 35% 40% - - - - - * * - - * *
Mathematics 2017 48% 36% 37% - - - - - * * - - * *2016 43% 38% 39% - - - - - * * * - * *
Science 2017 52% 36% 56% - - - - - * * - - * *2016 47% 38% 65% - - - - - * * - - * *
Social Studies 2017 51% 34% 53% - - - - - * * - - * *2016 47% 31% 51% - - - - - * * - - * *
STAARPercent at Masters Grade LevelAll Grades
All Subjects 2017 20% 12% 8% - - - - - * * * - * *2016 18% 10% 6% - - - - - * * * - * *

TEA Division of Performance Reporting Page 5
TEXAS EDUCATION AGENCYDistrict Name: FORT STOCKTON ISD Texas Academic Performance Report Total Students: 670
Campus Name: FORT STOCKTON H S 2016-17 Campus Performance Grade Span: 09 - 12Campus Number: 186902001 Bilingual Education/English as a Second Language (Current Year ELL Students)
State District CampusBilingual
EducationBE-TransEarly Exit
BE-TransLate Exit
BE-DualTwo-Way
BE-DualOne-Way ESL
ESLContent
ESLPull-Out
LEP NoServices
LEP WithServices
TotalELL
STAARPercent at Masters Grade LevelAll Grades
Reading 2017 19% 11% 2% - - - - - * * * - * *2016 17% 10% 2% - - - - - * * * - * *
Mathematics 2017 23% 15% 10% - - - - - * * * - * *2016 19% 14% 9% - - - - - * * * - * *
Science 2017 19% 9% 11% - - - - - * * - - * *2016 16% 7% 7% - - - - - * * * - * *
Social Studies 2017 27% 14% 19% - - - - - * * - - * *2016 22% 8% 13% - - - - - * * * - * *
STAARPercent Met or Exceeded ProgressAll Grades
All Subjects 2017 61% 51% 42% - - - - - * * * - * *2016 62% 61% 45% - - - - - * * * - * *
Reading 2017 59% 51% * - - - - - * * - - * *2016 60% 59% * - - - - - * * * - * *
Mathematics 2017 64% 50% 37% - - - - - * * * - * *2016 63% 64% 38% - - - - - * * * - * *
STAARPercent Exceeded ProgressAll Grades
All Subjects 2017 19% 11% 4% - - - - - * * * - * *2016 17% 15% 4% - - - - - * * * - * *
Reading 2017 17% 12% * - - - - - * * - - * *2016 16% 16% * - - - - - * * * - * *
Mathematics 2017 20% 9% 7% - - - - - * * * - * *2016 17% 15% 7% - - - - - * * * - * *

TEA Division of Performance Reporting Page 6
TEXAS EDUCATION AGENCYDistrict Name: FORT STOCKTON ISD Texas Academic Performance Report Total Students: 670
Campus Name: FORT STOCKTON H S 2016-17 Campus Participation Grade Span: 09 - 12Campus Number: 186902001 School Type: High School
State District CampusAfrican
American Hispanic WhiteAmerican
Indian AsianPacific
Islander
Two orMoreRaces
SpecialEd
EconDisadv ELL
2017 STAARParticipation(All Grades)
All TestsTest Participant 99% 99% 98% 100% 98% 98% - * - - 99% 98% 100%
Included in Accountability 94% 95% 94% 100% 94% 91% - * - - 85% 95% 93%Not Included in Accountability
Mobile 4% 3% 3% 0% 3% 7% - * - - 12% 3% 1%Other Exclusions 1% 1% 1% 0% 1% 0% - * - - 1% 0% 6%
Not Tested 1% 1% 2% 0% 2% 2% - * - - 1% 2% 0%Absent 1% 1% 2% 0% 2% 2% - * - - 1% 2% 0%Other 0% 0% 0% 0% 0% 0% - * - - 0% 0% 0%
2016 STAARParticipation(All Grades)
All TestsTest Participant 99% 100% 100% * 99% 100% - 100% - - 100% 99% 100%
Included in Accountability 94% 95% 96% * 96% 94% - 63% - - 88% 94% 75%Not Included in Accountability
Mobile 4% 4% 2% * 2% 6% - 25% - - 9% 4% 3%Other Exclusions 1% 1% 1% * 2% 0% - 13% - - 3% 1% 22%
Not Tested 1% 0% 0% * 1% 0% - 0% - - 0% 1% 0%Absent 1% 0% 0% * 1% 0% - 0% - - 0% 1% 0%Other 0% 0% 0% * 0% 0% - 0% - - 0% 0% 0%

TEA Division of Performance Reporting Page 7
TEXAS EDUCATION AGENCYDistrict Name: FORT STOCKTON ISD Texas Academic Performance Report Total Students: 670
Campus Name: FORT STOCKTON H S 2016-17 Campus Attendance and Postsecondary Readiness Grade Span: 09 - 12Campus Number: 186902001 School Type: High School
State District CampusAfrican
American Hispanic WhiteAmerican
Indian AsianPacific
IslanderTwo or
More RacesSpecial
EdEcon
Disadv ELL
Attendance Rate2015-16 95.8% 93.3% 90.7% * 90.7% 90.6% - * - * 89.1% 89.9% 91.7%2014-15 95.7% 93.6% 91.7% * 91.7% 91.7% - * - * 90.1% 91.3% 89.5%
Annual Dropout Rate (Gr 9-12)2015-16 2.0% 1.3% 1.3% * 1.2% 2.3% - * - * 2.2% 1.6% 3.6%2014-15 2.1% 1.1% 1.1% * 1.2% 0.0% - * - * 0.0% 0.9% 8.0%
4-Year Longitudinal Rate (Gr 9-12)Class of 2016
Graduated 89.1% 93.8% 93.8% - 93.0% 100.0% - - - * 87.5% 92.4% *Received GED 0.5% 0.0% 0.0% - 0.0% 0.0% - - - * 0.0% 0.0% *Continued HS 4.2% 2.1% 2.1% - 2.3% 0.0% - - - * 12.5% 1.5% *Dropped Out 6.2% 4.1% 4.1% - 4.7% 0.0% - - - * 0.0% 6.1% *Graduates and GED 89.6% 93.8% 93.8% - 93.0% 100.0% - - - * 87.5% 92.4% *Grads, GED, & Cont 93.8% 95.9% 95.9% - 95.3% 100.0% - - - * 100.0% 93.9% *
Class of 2015Graduated 89.0% 88.3% 88.3% * 87.0% 100.0% - - - * * 81.7% *Received GED 0.6% 0.0% 0.0% * 0.0% 0.0% - - - * * 0.0% *Continued HS 4.1% 0.7% 0.7% * 0.8% 0.0% - - - * * 0.0% *Dropped Out 6.3% 11.0% 11.0% * 12.2% 0.0% - - - * * 18.3% *Graduates and GED 89.6% 88.3% 88.3% * 87.0% 100.0% - - - * * 81.7% *Grads, GED, & Cont 93.7% 89.0% 89.0% * 87.8% 100.0% - - - * * 81.7% *
5-Year Extended Longitudinal Rate (Gr 9-12)Class of 2015
Graduated 91.3% 88.4% 88.4% * 87.1% 100.0% - - - * * 80.6% *Received GED 0.8% 0.0% 0.0% * 0.0% 0.0% - - - * * 0.0% *Continued HS 1.2% 0.0% 0.0% * 0.0% 0.0% - - - * * 0.0% *Dropped Out 6.7% 11.6% 11.6% * 12.9% 0.0% - - - * * 19.4% *Graduates and GED 92.1% 88.4% 88.4% * 87.1% 100.0% - - - * * 80.6% *Grads, GED, & Cont 93.3% 88.4% 88.4% * 87.1% 100.0% - - - * * 80.6% *
Class of 2014Graduated 90.4% 88.1% 88.1% * 87.0% 93.8% - * - - 83.3% 82.4% 71.4%Received GED 1.0% 0.8% 0.8% * 0.9% 0.0% - * - - 0.0% 1.5% 0.0%Continued HS 1.3% 0.0% 0.0% * 0.0% 0.0% - * - - 0.0% 0.0% 0.0%Dropped Out 7.2% 11.1% 11.1% * 12.0% 6.3% - * - - 16.7% 16.2% 28.6%Graduates and GED 91.5% 88.9% 88.9% * 88.0% 93.8% - * - - 83.3% 83.8% 71.4%Grads, GED, & Cont 92.8% 88.9% 88.9% * 88.0% 93.8% - * - - 83.3% 83.8% 71.4%

TEA Division of Performance Reporting Page 8
TEXAS EDUCATION AGENCYDistrict Name: FORT STOCKTON ISD Texas Academic Performance Report Total Students: 670
Campus Name: FORT STOCKTON H S 2016-17 Campus Attendance and Postsecondary Readiness Grade Span: 09 - 12Campus Number: 186902001 School Type: High School
State District CampusAfrican
American Hispanic WhiteAmerican
Indian AsianPacific
IslanderTwo or
More RacesSpecial
EdEcon
Disadv ELL
6-Year Extended Longitudinal Rate (Gr 9-12)Class of 2014
Graduated 90.9% 88.1% 88.1% * 87.0% 93.8% - * - - 83.3% 82.4% 71.4%Received GED 1.2% 0.8% 0.8% * 0.9% 0.0% - * - - 0.0% 1.5% 0.0%Continued HS 0.6% 0.0% 0.0% * 0.0% 0.0% - * - - 0.0% 0.0% 0.0%Dropped Out 7.2% 11.1% 11.1% * 12.0% 6.3% - * - - 16.7% 16.2% 28.6%Graduates and GED 92.2% 88.9% 88.9% * 88.0% 93.8% - * - - 83.3% 83.8% 71.4%Grads, GED, & Cont 92.8% 88.9% 88.9% * 88.0% 93.8% - * - - 83.3% 83.8% 71.4%
Class of 2013Graduated 90.9% 89.5% 89.5% - 89.6% 87.5% - * - - 100.0% 84.4% *Received GED 1.4% 0.0% 0.0% - 0.0% 0.0% - * - - 0.0% 0.0% *Continued HS 0.6% 0.0% 0.0% - 0.0% 0.0% - * - - 0.0% 0.0% *Dropped Out 7.2% 10.5% 10.5% - 10.4% 12.5% - * - - 0.0% 15.6% *Graduates and GED 92.3% 89.5% 89.5% - 89.6% 87.5% - * - - 100.0% 84.4% *Grads, GED, & Cont 92.8% 89.5% 89.5% - 89.6% 87.5% - * - - 100.0% 84.4% *
4-Year Federal Graduation Rate Without Exclusions (Gr 9-12)Class of 2016 89.1% 92.6% 92.6% - 92.4% 94.1% - - - * 87.5% 91.0% *Class of 2015 89.0% 86.5% 86.5% * 85.1% 100.0% - - - * * 79.5% *
5-Year Extended Federal Graduation Rate Without Exclusions (Gr 9-12)Class of 2015 91.3% 86.6% 86.6% * 85.2% 100.0% - - - * * 78.4% *Class of 2014 90.4% 88.1% 88.1% * 87.0% 93.8% - * - - 83.3% 82.4% 71.4%
6-Year Extended Federal Graduation Rate Without Exclusions (Gr 9-12)Class of 2014 90.9% 88.1% 88.1% * 87.0% 93.8% - * - - 83.3% 82.4% 71.4%Class of 2013 90.9% 89.6% 89.6% - 89.8% 87.5% - * - - 100.0% 84.8% *
RHSP/DAP Graduates (Longitudinal Rate)Class of 2016 87.4% 95.6% 95.6% - 95.0% 100.0% - - - * 42.9% 93.4% *Class of 2015 86.1% 95.3% 95.3% * 95.6% 91.7% - - - * * 91.4% *
RHSP/DAP/FHSP-E/FHSP-DLA Graduates (Longitudinal Rate)Class of 2016 85.1% 95.6% 95.6% - 95.0% 100.0% - - - * 42.9% 93.4% *Class of 2015 84.1% 95.3% 95.3% * 95.6% 91.7% - - - * * 91.4% *
RHSP/DAP Graduates (Annual Rate)2015-16 85.6% 95.0% 95.0% - 95.1% 94.1% - - - * 42.9% 93.2% 100.0%2014-15 84.3% 95.3% 95.3% * 95.7% 91.7% - - - * * 94.8% *
RHSP/DAP/FHSP-E/FHSP-DLA Graduates (Annual Rate)2015-16 83.3% 95.0% 95.0% - 95.1% 94.1% - - - * 42.9% 93.2% 100.0%2014-15 82.2% 95.3% 95.3% * 95.7% 91.7% - - - * * 94.8% *

TEA Division of Performance Reporting Page 9
TEXAS EDUCATION AGENCYDistrict Name: FORT STOCKTON ISD Texas Academic Performance Report Total Students: 670
Campus Name: FORT STOCKTON H S 2016-17 Campus Attendance and Postsecondary Readiness Grade Span: 09 - 12Campus Number: 186902001 School Type: High School
State District CampusAfrican
American Hispanic WhiteAmerican
Indian AsianPacific
IslanderTwo or
More RacesSpecial
EdEcon
Disadv ELL
Advanced Course/Dual-Credit Course Completion (Grades 11-12)Any Subject
2015-16 55.0% 70.3% 70.3% - 69.1% 82.1% - * - * 20.0% 66.9% 80.0%2014-15 54.5% 65.8% 65.8% * 64.3% 75.0% - - - * 9.1% 58.3% 40.0%
English Language Arts2015-16 30.1% 40.2% 40.2% - 39.2% 46.4% - * - * 5.0% 33.1% 60.0%2014-15 29.0% 26.2% 26.2% * 23.7% 46.4% - - - * 0.0% 12.7% *
Mathematics2015-16 43.1% 43.4% 43.4% - 41.6% 61.5% - * - * 0.0% 39.2% 40.0%2014-15 43.8% 53.2% 53.2% * 52.7% 52.0% - - - * 0.0% 55.1% *
Science2015-16 12.2% 0.0% 0.0% - 0.0% 0.0% - * - * 0.0% 0.0% 0.0%2014-15 12.7% 0.0% 0.0% - 0.0% 0.0% - - - - 0.0% 0.0% *
Social Studies2015-16 29.0% 29.6% 29.6% - 27.0% 50.0% - * - * 0.0% 16.8% 0.0%2014-15 28.4% 24.2% 24.2% * 22.7% 35.7% - - - * 0.0% 9.7% 0.0%
Advanced Course/Dual-Credit Course Completion (Grades 9-12)Any Subject
2015-16 35.9% 38.2% 38.2% * 38.2% 39.0% - * - * 11.6% 33.7% 29.6%2014-15 34.6% 28.8% 28.8% * 28.3% 31.3% - * - * 2.7% 21.9% 14.3%
English Language Arts2015-16 16.2% 21.5% 21.5% * 21.5% 21.0% - * - * 2.4% 17.3% 22.2%2014-15 15.7% 11.7% 11.7% * 10.7% 20.0% - * - * 0.0% 5.3% 10.0%
Mathematics2015-16 19.3% 19.2% 19.2% * 18.9% 21.8% - * - * 0.0% 16.0% 14.8%2014-15 19.4% 22.5% 22.5% * 22.4% 21.0% - * - * 0.0% 19.4% 5.6%
Science2015-16 5.1% 0.0% 0.0% * 0.0% 0.0% - * - * 0.0% 0.0% 0.0%2014-15 5.2% 0.0% 0.0% * 0.0% 0.0% - * - - 0.0% 0.0% 0.0%
Social Studies2015-16 20.8% 18.4% 18.4% * 17.0% 27.5% - * - * 0.0% 9.9% 0.0%2014-15 19.5% 14.4% 14.4% * 13.4% 23.3% - * - * 0.0% 5.2% 0.0%
College-Ready GraduatesEnglish Language Arts
2015-16 50.6% 20.9% 20.9% - 15.5% 50.0% - - - * * 15.0% *2014-15 42.0% 25.0% 25.0% * 18.0% 63.0% - - - * - 9.0% -
Mathematics2015-16 44.6% 35.7% 35.7% - 29.8% 62.5% - - - * * 21.4% -2014-15 38.0% 22.0% 22.0% * 14.0% 75.0% - - - * - 9.0% -

TEA Division of Performance Reporting Page 10
TEXAS EDUCATION AGENCYDistrict Name: FORT STOCKTON ISD Texas Academic Performance Report Total Students: 670
Campus Name: FORT STOCKTON H S 2016-17 Campus Attendance and Postsecondary Readiness Grade Span: 09 - 12Campus Number: 186902001 School Type: High School
State District CampusAfrican
American Hispanic WhiteAmerican
Indian AsianPacific
IslanderTwo or
More RacesSpecial
EdEcon
Disadv ELL
College-Ready GraduatesBoth Subjects
2015-16 38.7% 16.7% 16.7% - 8.9% 50.0% - - - * * 16.7% -2014-15 35.0% 18.0% 18.0% * 11.0% 63.0% - - - * - 9.0% -
Either Subject2015-16 56.4% 36.2% 36.2% - 31.7% 62.5% - - - * * 18.2% *2014-15 45.0% 28.0% 28.0% * 21.0% 75.0% - - - * - 9.0% -
College and Career Ready Graduates2015-16 75.9% 85.8% 85.8% - 84.6% 94.1% - - - * 71.4% 84.7% 80.0%2014-15 74.5% 70.5% 70.5% * 69.6% 75.0% - - - * * 70.7% *
Texas Success Initiative Assessment (TSIA)English Language Arts
2015-16 22.6% 5.7% 5.7% - 6.5% 0.0% - - - * 0.0% 3.4% 0.0%2014-15 10.6% 9.3% 9.3% * 8.7% 16.7% - - - * * 3.4% *
Mathematics2015-16 18.1% 9.9% 9.9% - 10.6% 5.9% - - - * 0.0% 3.4% 0.0%2014-15 7.1% 7.8% 7.8% * 7.0% 16.7% - - - * * 3.4% *
Completion of Two or More Advanced/Dual-Credit Courses in Current and/or Prior Year (Annual Graduates)2015-16 48.7% 64.5% 64.5% - 61.8% 82.4% - - - * 0.0% 62.7% 80.0%2014-15 48.1% 39.5% 39.5% * 36.5% 66.7% - - - * * 36.2% *
Completion of Twelve or More Hours of Postsecondary Credit (Annual Graduates)Any Subject
2015-16 12.2% 30.5% 30.5% - 28.5% 41.2% - - - * 0.0% 13.6% 20.0%2014-15 10.6% 23.3% 23.3% * 20.9% 41.7% - - - * * 20.7% *
AP/IB Course Completion (Annual Graduates)2015-16 44.8% 1.4% 1.4% - 0.8% 5.9% - - - * 0.0% 1.7% 0.0%2014-15 43.4% 0.8% 0.8% * 0.0% 8.3% - - - * * 0.0% *
CTE Coherent Sequence (Annual Graduates)2015-16 47.8% 68.8% 68.8% - 67.5% 76.5% - - - * 71.4% 66.1% 40.0%2014-15 46.6% 51.9% 51.9% * 52.2% 41.7% - - - * * 55.2% *
AP/IB Results (Participation)All Subjects
2016 25.5% 0.0% 0.0% - 0.0% 0.0% - * - * n/a 0.0% n/a2015 24.9% 0.0% 0.0% * 0.0% 0.0% - - - * n/a 0.0% n/a
English Language Arts2016 15.5% 0.0% 0.0% - 0.0% 0.0% - * - * n/a 0.0% n/a2015 15.1% 0.0% 0.0% * 0.0% 0.0% - - - * n/a 0.0% n/a
Mathematics2016 6.8% 0.0% 0.0% - 0.0% 0.0% - * - * n/a 0.0% n/a2015 6.8% 0.0% 0.0% * 0.0% 0.0% - - - * n/a 0.0% n/a

TEA Division of Performance Reporting Page 11
TEXAS EDUCATION AGENCYDistrict Name: FORT STOCKTON ISD Texas Academic Performance Report Total Students: 670
Campus Name: FORT STOCKTON H S 2016-17 Campus Attendance and Postsecondary Readiness Grade Span: 09 - 12Campus Number: 186902001 School Type: High School
State District CampusAfrican
American Hispanic WhiteAmerican
Indian AsianPacific
IslanderTwo or
More RacesSpecial
EdEcon
Disadv ELL
AP/IB Results (Participation)Science
2016 10.4% 0.0% 0.0% - 0.0% 0.0% - * - * n/a 0.0% n/a2015 10.2% 0.0% 0.0% * 0.0% 0.0% - - - * n/a 0.0% n/a
Social Studies2016 14.8% 0.0% 0.0% - 0.0% 0.0% - * - * n/a 0.0% n/a2015 14.4% 0.0% 0.0% * 0.0% 0.0% - - - * n/a 0.0% n/a
SAT/ACT ResultsTested
Class of 2016 71.6% 32.6% 32.6% - 30.1% 47.1% - - - * n/a 14.5% n/aClass of 2015 68.3% 49.6% 49.6% * 47.0% 66.7% - - - * n/a 37.3% n/a
At/Above CriterionClass of 2016 22.5% 8.7% 8.7% - 2.7% 37.5% - - - * n/a 0.0% n/aClass of 2015 24.3% 4.7% 4.7% * 0.0% 37.5% - - - * n/a 0.0% n/a
Average SAT ScoreAll Subjects
Class of 2016 1375 1368 1368 - 1332 1503 - - - * n/a 1316 n/aClass of 2015 1394 1260 1260 * 1219 1460 - - - * n/a 1210 n/a
English Language Arts and WritingClass of 2016 903 904 904 - 884 983 - - - * n/a 865 n/aClass of 2015 912 827 827 * 803 935 - - - * n/a 785 n/a
MathematicsClass of 2016 472 464 464 - 449 518 - - - * n/a 451 n/aClass of 2015 482 433 433 * 416 525 - - - * n/a 426 n/a
Average ACT ScoreAll Subjects
Class of 2016 20.3 20.5 20.5 - 19.4 * - - - - n/a * n/aClass of 2015 20.6 16.9 16.9 - 16.6 * - - - - n/a 15.6 n/a
English Language ArtsClass of 2016 19.8 20.6 20.6 - 19.3 * - - - - n/a * n/aClass of 2015 20.1 16.2 16.2 - 16.0 * - - - - n/a 14.6 n/a
MathematicsClass of 2016 20.5 20.2 20.2 - 19.3 * - - - - n/a * n/aClass of 2015 20.9 17.8 17.8 - 17.3 * - - - - n/a 16.5 n/a
ScienceClass of 2016 20.5 20.0 20.0 - 18.9 * - - - - n/a * n/aClass of 2015 20.7 16.7 16.7 - 16.5 * - - - - n/a 16.0 n/a
Graduates Enrolled in Texas Institution of Higher Education (TX IHE)2014-15 56.1% 45.7% 45.7% n/a n/a n/a n/a n/a n/a n/a n/a n/a n/a2013-14 57.5% 45.0% 45.0% n/a n/a n/a n/a n/a n/a n/a n/a n/a n/a

TEA Division of Performance Reporting Page 12
TEXAS EDUCATION AGENCYDistrict Name: FORT STOCKTON ISD Texas Academic Performance Report Total Students: 670
Campus Name: FORT STOCKTON H S 2016-17 Campus Attendance and Postsecondary Readiness Grade Span: 09 - 12Campus Number: 186902001 School Type: High School
State District CampusAfrican
American Hispanic WhiteAmerican
Indian AsianPacific
IslanderTwo or
More RacesSpecial
EdEcon
Disadv ELL
Graduates in TX IHE Completing One Year Without Remediation2014-15 55.6% 52.5% 52.5% n/a n/a n/a n/a n/a n/a n/a n/a n/a n/a2013-14 70.5% 72.0% 72.0% n/a n/a n/a n/a n/a n/a n/a n/a n/a n/a

TEA Division of Performance Reporting Page 13
TEXAS EDUCATION AGENCYDistrict Name: FORT STOCKTON ISD Texas Academic Performance Report Total Students: 670
Campus Name: FORT STOCKTON H S 2016-17 Campus Profile Grade Span: 09 - 12Campus Number: 186902001 School Type: High School
---------------- Campus ----------------Student Information Count Percent District State
Total Students: 670 100.0% 2,456 5,343,834
Students by Grade:Early Childhood Education 0 0.0% 0.2% 0.3%Pre-Kindergarten 0 0.0% 0.9% 4.2%Kindergarten 0 0.0% 7.9% 7.0%Grade 1 0 0.0% 7.0% 7.4%Grade 2 0 0.0% 9.0% 7.6%Grade 3 0 0.0% 8.8% 7.7%Grade 4 0 0.0% 8.5% 7.7%Grade 5 0 0.0% 6.7% 7.5%Grade 6 0 0.0% 8.6% 7.4%Grade 7 0 0.0% 8.1% 7.4%Grade 8 0 0.0% 6.9% 7.3%Grade 9 182 27.2% 7.4% 8.1%Grade 10 192 28.7% 7.8% 7.4%Grade 11 145 21.6% 5.9% 6.8%Grade 12 151 22.5% 6.1% 6.2%
Ethnic Distribution:African American 5 0.7% 0.7% 12.6%Hispanic 586 87.5% 86.7% 52.4%White 77 11.5% 11.5% 28.1%American Indian 0 0.0% 0.1% 0.4%Asian 2 0.3% 0.7% 4.2%Pacific Islander 0 0.0% 0.0% 0.1%Two or More Races 0 0.0% 0.4% 2.2%
Economically Disadvantaged 353 52.7% 66.7% 59.0%Non-Educationally Disadvantaged 317 47.3% 33.3% 41.0%English Language Learners (ELL) 33 4.9% 9.0% 18.9%Students w/ Disciplinary Placements (2015-2016) 5 0.7% 0.3% 1.4%At-Risk 433 64.6% 62.8% 50.3%
Students with Disabilities by Type of Primary Disability:Total Students with DisabilitiesBy Type of Primary Disability
47
Students with Intellectual Disabilities 42 89.4% 63.9% 44.5%Students with Physical Disabilities 0 0.0% 15.0% 21.9%Students with Autism * * 15.0% 12.5%Students with Behavioral Disabilities * * ** 19.9%Students with Non-Categorical Early Childhood 0 0.0% * 1.3%

TEA Division of Performance Reporting Page 14
TEXAS EDUCATION AGENCYDistrict Name: FORT STOCKTON ISD Texas Academic Performance Report Total Students: 670
Campus Name: FORT STOCKTON H S 2016-17 Campus Profile Grade Span: 09 - 12Campus Number: 186902001 School Type: High School
---------------- Campus ----------------Student Information Count Percent District State
Mobility (2015-2016):Total Mobile Students
By Ethnicity:74 10.8% 12.6% 16.2%
African American 0 0.0%Hispanic 61 8.9%White 12 1.7%American Indian 0 0.0%Asian 1 0.1%Pacific Islander 0 0.0%Two or More Races 0 0.0%
Graduates (Class of 2016):Total Graduates 141 100.0% 141 324,311
By Ethnicity (incl. Special Ed.):African American 0 0.0% 0 41,084Hispanic 123 87.2% 123 157,633White 17 12.1% 17 104,551American Indian 0 0.0% 0 1,280Asian 0 0.0% 0 13,481Pacific Islander 0 0.0% 0 449Two or More Races 1 0.7% 1 5,833
By Graduation Type (incl. Special Ed.):Minimum H.S. Program 7 5.0% 7 42,804Recommended H.S. Program/DAP 134 95.0% 134 254,625Foundation High School Plan (No Endorsement) 0 0.0% 0 11,477Foundation High School Plan (Endorsement) 0 0.0% 0 1,501Foundation High School Plan (DLA) 0 0.0% 0 13,904
Special Education Graduates 7 5.0% 7 23,325

TEA Division of Performance Reporting Page 15
TEXAS EDUCATION AGENCYDistrict Name: FORT STOCKTON ISD Texas Academic Performance Report Total Students: 670
Campus Name: FORT STOCKTON H S 2016-17 Campus Profile Grade Span: 09 - 12Campus Number: 186902001 School Type: High School
Class Size Information Campus District State
Class Size Averages by Grade and Subject (Derived from teacher responsibility records):
Elementary:Kindergarten - 18.7 18.8Grade 1 - 16.9 18.8Grade 2 - 20.0 18.9Grade 3 - 19.7 19.0Grade 4 - 15.7 19.0Grade 5 - 15.9 20.9Grade 6 - 18.3 20.4
Secondary:English/Language Arts 16.7 18.2 16.8Foreign Languages 18.4 19.3 18.7Mathematics 19.2 17.0 18.0Science 18.6 18.9 19.0Social Studies 20.4 20.0 19.4

TEA Division of Performance Reporting Page 16
TEXAS EDUCATION AGENCYDistrict Name: FORT STOCKTON ISD Texas Academic Performance Report Total Students: 670
Campus Name: FORT STOCKTON H S 2016-17 Campus Profile Grade Span: 09 - 12Campus Number: 186902001 School Type: High School
---------------- Campus ----------------Staff Information Count/Average Percent District State
Total Staff 63.2 100.0% 100.0% 100.0%
Professional Staff: 53.2 84.2% 61.0% 64.0%Teachers 45.4 71.9% 46.5% 50.0%Professional Support 3.2 5.1% 9.7% 10.0%Campus Administration (School Leadership) 4.5 7.1% 3.0% 2.9%
Educational Aides: 10.0 15.8% 13.5% 9.6%
Total Minority Staff: 30.4 48.1% 68.8% 49.1%
Teachers by Ethnicity and Sex:African American 3.0 6.6% 1.9% 10.2%Hispanic 13.8 30.5% 50.3% 26.6%White 26.6 58.5% 44.7% 59.8%American Indian 1.0 2.2% 0.6% 0.4%Asian 0.0 0.0% 1.9% 1.5%Pacific Islander 0.0 0.0% 0.0% 0.4%Two or More Races 1.0 2.2% 0.6% 1.1%
Males 24.3 53.4% 27.3% 23.7%Females 21.2 46.6% 72.7% 76.3%
Teachers by Highest Degree Held:No Degree 0.0 0.0% 0.0% 1.2%Bachelors 31.9 70.1% 80.7% 74.5%Masters 11.6 25.5% 18.0% 23.6%Doctorate 2.0 4.4% 1.2% 0.6%
Teachers by Years of Experience:Beginning Teachers 4.0 8.8% 8.1% 7.8%1-5 Years Experience 12.4 27.3% 32.3% 28.0%6-10 Years Experience 6.0 13.1% 16.1% 20.9%11-20 Years Experience 11.0 24.2% 23.6% 27.8%Over 20 Years Experience 12.1 26.6% 19.9% 15.5%
Number of Students per Teacher 14.7 n/a 15.3 15.1
TEA Division of Performance Reporting Page 17
TEXAS EDUCATION AGENCYDistrict Name: FORT STOCKTON ISD Texas Academic Performance Report Total Students: 670
Campus Name: FORT STOCKTON H S 2016-17 Campus Profile Grade Span: 09 - 12Campus Number: 186902001 School Type: High School
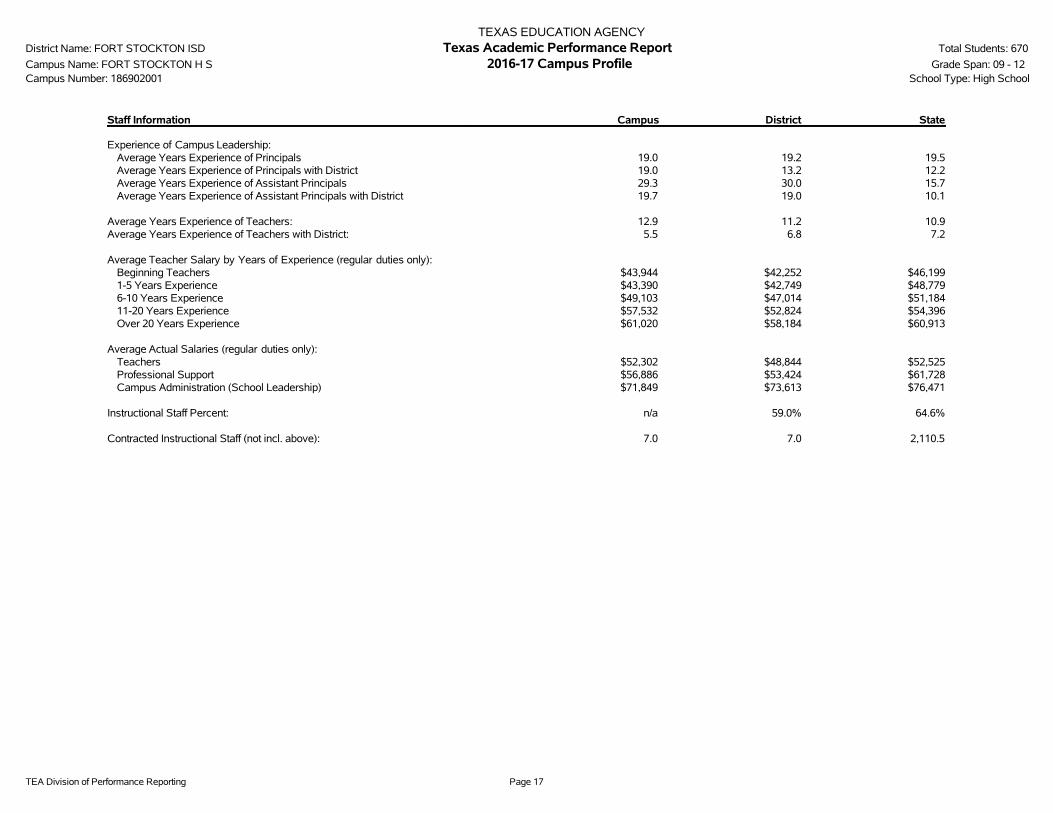
Staff Information Campus District State
Experience of Campus Leadership:Average Years Experience of Principals 19.0 19.2 19.5Average Years Experience of Principals with District 19.0 13.2 12.2Average Years Experience of Assistant Principals 29.3 30.0 15.7Average Years Experience of Assistant Principals with District 19.7 19.0 10.1
Average Years Experience of Teachers: 12.9 11.2 10.9Average Years Experience of Teachers with District: 5.5 6.8 7.2
Average Teacher Salary by Years of Experience (regular duties only):Beginning Teachers $43,944 $42,252 $46,1991-5 Years Experience $43,390 $42,749 $48,7796-10 Years Experience $49,103 $47,014 $51,18411-20 Years Experience $57,532 $52,824 $54,396Over 20 Years Experience $61,020 $58,184 $60,913
Average Actual Salaries (regular duties only):Teachers $52,302 $48,844 $52,525Professional Support $56,886 $53,424 $61,728Campus Administration (School Leadership) $71,849 $73,613 $76,471
Instructional Staff Percent: n/a 59.0% 64.6%
Contracted Instructional Staff (not incl. above): 7.0 7.0 2,110.5

TEA Division of Performance Reporting Page 18
TEXAS EDUCATION AGENCYDistrict Name: FORT STOCKTON ISD Texas Academic Performance Report Total Students: 670
Campus Name: FORT STOCKTON H S 2016-17 Campus Profile Grade Span: 09 - 12Campus Number: 186902001 School Type: High School
---------------- Campus ----------------Program Information Count Percent District State
Student Enrollment by Program:Bilingual/ESL Education 33 4.9% 8.7% 18.8%Career & Technical Education 622 92.8% 31.8% 25.0%Gifted & Talented Education 32 4.8% 2.9% 7.8%Special Education 47 7.0% 6.0% 8.8%
Teachers by Program (population served):Bilingual/ESL Education 0.2 0.4% 5.4% 6.0%Career & Technical Education 8.0 17.5% 5.6% 4.5%Compensatory Education 1.0 2.2% 4.1% 2.8%Gifted & Talented Education 0.0 0.0% 0.0% 1.9%Regular Education 31.0 68.3% 76.6% 72.8%Special Education 0.9 1.9% 4.3% 8.6%Other 4.4 9.7% 3.9% 3.4%
Link to: PEIMS Financial Standard Reports/ 2015-2016 Financial Actual Report
' '̂ Indicates that ELL rates at met or exceeded standard and exceeded standard include current and monitored students.'*' Indicates results are masked due to small numbers to protect student confidentiality.'**' When only one group is masked, then the second smallest group is masked (regardless of size).'-' Indicates zero observations reported for this group.'n/a' Indicates data reporting is not applicable for this group.'***' Indicates that rates for Reading and Mathematics are based on the cumulative results from the first and second administrations of STAAR.'?' Indicates that the data for this item were statistically improbable, or were reported outside a reasonable range.

2016-17 Texas Academic Performance Report
District Name: FORT STOCKTON ISD
Campus Name: FORT STOCKTON MIDDLE
Campus Number: 186902041
2017 Accountability Rating: Met Standard

This page intentionally left blank.

TEA Division of Performance Reporting Page 1
TEXAS EDUCATION AGENCYDistrict Name: FORT STOCKTON ISD Texas Academic Performance Report Total Students: 581
Campus Name: FORT STOCKTON MIDDLE 2016-17 Campus Performance Grade Span: 06 - 08Campus Number: 186902041 School Type: Middle
State District CampusAfrican
American Hispanic WhiteAmerican
Indian AsianPacific
Islander
Two orMore
RacesSpecial
EdEcon
Disadv ELL^STAARPercent at Approaches Grade Level or Above
Grade 6
Reading 2017 69% 60% 60% - 57% 77% - - - * 60% 54% *
2016 69% 54% 54% - 52% 69% - * - - * 47% *
Mathematics 2017 76% 51% 51% - 50% 68% - - - * 60% 46% 36%
2016 72% 59% 59% - 58% 63% - * - - * 55% *
STAARPercent at Approaches Grade Level or AboveGrade 7
Reading 2017 73% 53% 53% - 52% 59% - * - - * 48% *
2016 71% 61% 61% - 58% 75% - * - - * 53% *
Mathematics 2017 70% 57% 57% - 55% 65% - * - - * 53% *
2016 69% 59% 59% - 58% 65% - * - - * 51% *
Writing 2017 70% 55% 55% - 54% 53% - * - - * 49% *
2016 69% 70% 70% - 67% 90% - * - - * 63% 44%
STAARPercent at Approaches Grade Level or AboveGrade 8 ***
Reading 2017 86% 80% 80% - 79% 86% - * - - * 77% 50%
2016 87% 79% 79% * 78% 100% - - - - * 76% 36%
Mathematics 2017 85% 82% 82% - 80% 95% - * - - * 79% 63%
2016 82% 80% 80% * 78% 100% - - - - * 77% 55%
Science 2017 76% 55% 55% - 51% 77% - * - - * 50% *
2016 75% 56% 56% * 55% 62% - - - - * 49% *
Social Studies 2017 63% 45% 45% - 42% 64% - * - - * 35% *
2016 63% 29% 29% * 28% 38% - - - - * 22% *
STAARPercent at Approaches Grade Level or AboveEnd of Course
Algebra I 2016 78% 80% 100% - 100% * - - - - - 100% -
TEA Division of Performance Reporting Page 2
TEXAS EDUCATION AGENCYDistrict Name: FORT STOCKTON ISD Texas Academic Performance Report Total Students: 581
Campus Name: FORT STOCKTON MIDDLE 2016-17 Campus Performance Grade Span: 06 - 08Campus Number: 186902041 School Type: Middle
State District CampusAfrican
American Hispanic WhiteAmerican
Indian AsianPacific
Islander
Two orMore
RacesSpecial
EdEcon
Disadv ELL^STAARPercent at Approaches Grade Level or Above
All Grades
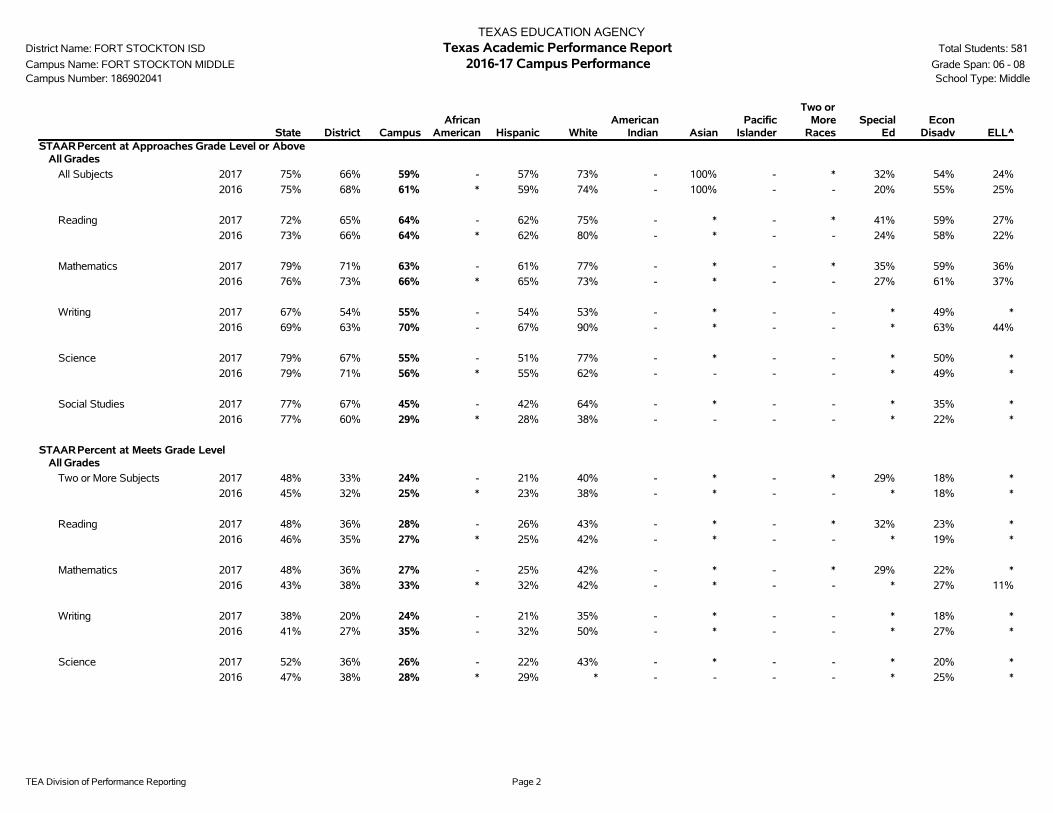
All Subjects 2017 75% 66% 59% - 57% 73% - 100% - * 32% 54% 24%
2016 75% 68% 61% * 59% 74% - 100% - - 20% 55% 25%
Reading 2017 72% 65% 64% - 62% 75% - * - * 41% 59% 27%
2016 73% 66% 64% * 62% 80% - * - - 24% 58% 22%
Mathematics 2017 79% 71% 63% - 61% 77% - * - * 35% 59% 36%
2016 76% 73% 66% * 65% 73% - * - - 27% 61% 37%
Writing 2017 67% 54% 55% - 54% 53% - * - - * 49% *
2016 69% 63% 70% - 67% 90% - * - - * 63% 44%
Science 2017 79% 67% 55% - 51% 77% - * - - * 50% *
2016 79% 71% 56% * 55% 62% - - - - * 49% *
Social Studies 2017 77% 67% 45% - 42% 64% - * - - * 35% *
2016 77% 60% 29% * 28% 38% - - - - * 22% *
STAARPercent at Meets Grade LevelAll Grades
Two or More Subjects 2017 48% 33% 24% - 21% 40% - * - * 29% 18% *
2016 45% 32% 25% * 23% 38% - * - - * 18% *
Reading 2017 48% 36% 28% - 26% 43% - * - * 32% 23% *
2016 46% 35% 27% * 25% 42% - * - - * 19% *
Mathematics 2017 48% 36% 27% - 25% 42% - * - * 29% 22% *
2016 43% 38% 33% * 32% 42% - * - - * 27% 11%
Writing 2017 38% 20% 24% - 21% 35% - * - - * 18% *
2016 41% 27% 35% - 32% 50% - * - - * 27% *
Science 2017 52% 36% 26% - 22% 43% - * - - * 20% *
2016 47% 38% 28% * 29% * - - - - * 25% *

TEA Division of Performance Reporting Page 3
TEXAS EDUCATION AGENCYDistrict Name: FORT STOCKTON ISD Texas Academic Performance Report Total Students: 581
Campus Name: FORT STOCKTON MIDDLE 2016-17 Campus Performance Grade Span: 06 - 08Campus Number: 186902041 School Type: Middle
State District CampusAfrican
American Hispanic WhiteAmerican
Indian AsianPacific
Islander
Two orMore
RacesSpecial
EdEcon
Disadv ELL^STAARPercent at Meets Grade Level
All Grades
Social Studies 2017 51% 34% 17% - 16% 24% - * - - * 13% *
2016 47% 31% 12% * 11% * - - - - * 9% *
STAARPercent at Masters Grade LevelAll Grades
All Subjects 2017 20% 12% 8% - 6% 17% - 62% - * 10% 6% *
2016 18% 10% 8% * 7% 17% - * - - * 6% *
Reading 2017 19% 11% 9% - 7% 18% - * - * * 5% *
2016 17% 10% 9% * 7% 18% - * - - * 6% *
Mathematics 2017 23% 15% 8% - 6% 21% - * - * 21% 6% *
2016 19% 14% 9% * 8% 20% - * - - * 7% *
Writing 2017 12% 4% 7% - 6% * - * - - * 5% *
2016 15% 5% 6% - 5% * - * - - * * *
Science 2017 19% 9% 7% - 6% * - * - - * 6% *
2016 16% 7% 7% * 6% * - - - - * 6% *
Social Studies 2017 27% 14% 9% - 7% * - * - - * 8% *
2016 22% 8% 4% * 3% * - - - - * * *
STAARPercent Met or Exceeded ProgressAll Grades
All Subjects 2017 61% 51% 48% - 47% 56% - * - * 47% 49% 46%
2016 62% 61% 60% * 60% 58% - * - - 65% 60% 53%
Reading 2017 59% 51% 51% - 50% 58% - * - * * 51% 47%
2016 60% 59% 55% * 55% 49% - * - - 61% 55% 46%
Mathematics 2017 64% 50% 45% - 44% * - * - * * 47% *
2016 63% 64% 66% * 66% 67% - * - - * 65% 59%

TEA Division of Performance Reporting Page 4
TEXAS EDUCATION AGENCYDistrict Name: FORT STOCKTON ISD Texas Academic Performance Report Total Students: 581
Campus Name: FORT STOCKTON MIDDLE 2016-17 Campus Performance Grade Span: 06 - 08Campus Number: 186902041 School Type: Middle
State District CampusAfrican
American Hispanic WhiteAmerican
Indian AsianPacific
Islander
Two orMore
RacesSpecial
EdEcon
Disadv ELL^STAARPercent Exceeded Progress
All Grades
All Subjects 2017 19% 11% 9% - 8% 14% - * - * 9% 9% 4%
2016 17% 15% 11% * 11% 16% - * - - 14% 11% 13%
Reading 2017 17% 12% 13% - 12% 20% - * - * * 14% 7%
2016 16% 16% 15% * 15% 16% - * - - 27% 15% 21%
Mathematics 2017 20% 9% 4% - 4% * - * - * * 4% *
2016 17% 15% 8% * 7% 16% - * - - * 8% 6%
Progress of Prior-Year Non-Proficient StudentsSum of Grades 4-8
Reading 2017 35% 26% 25% - 24% * - - - - * 24% 19%
2016 35% 35% 30% * 29% 45% - - - - 20% 29% 17%
Mathematics 2017 43% 34% 35% - 34% 53% - - - * * 36% 31%

TEA Division of Performance Reporting Page 5
TEXAS EDUCATION AGENCYDistrict Name: FORT STOCKTON ISD Texas Academic Performance Report Total Students: 581
Campus Name: FORT STOCKTON MIDDLE 2016-17 Campus Performance Grade Span: 06 - 08Campus Number: 186902041 School Type: Middle
State District CampusAfrican
American Hispanic WhiteAmerican
Indian AsianPacific
Islander
Two orMore
RacesSpecial
EdEcon
Disadv ELLStudent Success Initiative
Grade 8 Reading
Students Meeting Approaches Grade Level on First STAARAdministration
2017 76% 66% 66% - 65% 73% - * - - * 59% *
Students Requiring Accelerated Instruction
2017 24% 34% 34% - 35% 27% - * - - 78% 41% 82%
STAARCumulative Met Standard
2017 85% 79% 79% - 77% 86% - * - - * 75% 41%
Grade 8 Mathematics
Students Meeting Approaches Grade Level on First STAARAdministration
2017 75% 70% 70% - 68% 77% - * - - * 63% 41%
Students Requiring Accelerated Instruction
2017 25% 30% 30% - 32% 23% - * - - 89% 37% 59%
STAARCumulative Met Standard
2017 85% 82% 82% - 80% 95% - * - - * 79% 59%

TEA Division of Performance Reporting Page 6
TEXAS EDUCATION AGENCYDistrict Name: FORT STOCKTON ISD Texas Academic Performance Report Total Students: 581
Campus Name: FORT STOCKTON MIDDLE 2016-17 Campus Performance Grade Span: 06 - 08Campus Number: 186902041 Bilingual Education/English as a Second Language (Current Year ELL Students)
State District CampusBilingual
EducationBE-TransEarly Exit
BE-TransLate Exit
BE-DualTwo-Way
BE-DualOne-Way ESL
ESLContent
ESLPull-Out
LEP NoServices
LEP WithServices
TotalELL
STAARPercent at Approaches Grade Level or AboveAll Grades
All Subjects 2017 75% 66% 59% - - - - - 24% - 24% * 24% 24%2016 75% 68% 61% - - - - - 25% - 25% * 25% 25%
Reading 2017 72% 65% 64% - - - - - 29% - 29% * 29% 27%2016 73% 66% 64% - - - - - 20% - 20% * 20% 22%
Mathematics 2017 79% 71% 63% - - - - - 36% - 36% * 36% 36%2016 76% 73% 66% - - - - - 35% - 35% * 35% 37%
Writing 2017 67% 54% 55% - - - - - * - * - * *2016 69% 63% 70% - - - - - 44% - 44% - 44% 44%
Science 2017 79% 67% 55% - - - - - * - * - * *2016 79% 71% 56% - - - - - * - * * * *
Social Studies 2017 77% 67% 45% - - - - - * - * - * *2016 77% 60% 29% - - - - - * - * * * *
STAARPercent at Meets Grade LevelAll Grades
Two or More Subjects 2017 48% 33% 24% - - - - - * - * * * *2016 45% 32% 25% - - - - - * - * * * *
Reading 2017 48% 36% 28% - - - - - * - * * * *2016 46% 35% 27% - - - - - * - * * * *
Mathematics 2017 48% 36% 27% - - - - - * - * * * *2016 43% 38% 33% - - - - - 12% - 12% * 12% 11%
Writing 2017 38% 20% 24% - - - - - * - * - * *2016 41% 27% 35% - - - - - * - * - * *
Science 2017 52% 36% 26% - - - - - * - * - * *2016 47% 38% 28% - - - - - * - * * * *
Social Studies 2017 51% 34% 17% - - - - - * - * - * *2016 47% 31% 12% - - - - - * - * * * *

TEA Division of Performance Reporting Page 7
TEXAS EDUCATION AGENCYDistrict Name: FORT STOCKTON ISD Texas Academic Performance Report Total Students: 581
Campus Name: FORT STOCKTON MIDDLE 2016-17 Campus Performance Grade Span: 06 - 08Campus Number: 186902041 Bilingual Education/English as a Second Language (Current Year ELL Students)
State District CampusBilingual
EducationBE-TransEarly Exit
BE-TransLate Exit
BE-DualTwo-Way
BE-DualOne-Way ESL
ESLContent
ESLPull-Out
LEP NoServices
LEP WithServices
TotalELL
STAARPercent at Masters Grade LevelAll Grades
All Subjects 2017 20% 12% 8% - - - - - * - * * * *2016 18% 10% 8% - - - - - * - * * * *
Reading 2017 19% 11% 9% - - - - - * - * * * *2016 17% 10% 9% - - - - - * - * * * *
Mathematics 2017 23% 15% 8% - - - - - * - * * * *2016 19% 14% 9% - - - - - * - * * * *
Writing 2017 12% 4% 7% - - - - - * - * - * *2016 15% 5% 6% - - - - - * - * - * *
Science 2017 19% 9% 7% - - - - - * - * - * *2016 16% 7% 7% - - - - - * - * * * *
Social Studies 2017 27% 14% 9% - - - - - * - * - * *2016 22% 8% 4% - - - - - * - * * * *
STAARPercent Met or Exceeded ProgressAll Grades
All Subjects 2017 61% 51% 48% - - - - - * - * * * *2016 62% 61% 60% - - - - - 57% - 57% * 57% 58%
Reading 2017 59% 51% 51% - - - - - * - * * * *2016 60% 59% 55% - - - - - 53% - 53% * 53% 53%
Mathematics 2017 64% 50% 45% - - - - - * - * * * *2016 63% 64% 66% - - - - - * - * * * *
STAARPercent Exceeded ProgressAll Grades
All Subjects 2017 19% 11% 9% - - - - - * - * * * *2016 17% 15% 11% - - - - - 15% - 15% * 15% 15%
Reading 2017 17% 12% 13% - - - - - * - * * * *2016 16% 16% 15% - - - - - 21% - 21% * 21% 22%

TEA Division of Performance Reporting Page 8
TEXAS EDUCATION AGENCYDistrict Name: FORT STOCKTON ISD Texas Academic Performance Report Total Students: 581
Campus Name: FORT STOCKTON MIDDLE 2016-17 Campus Performance Grade Span: 06 - 08Campus Number: 186902041 Bilingual Education/English as a Second Language (Current Year ELL Students)
State District CampusBilingual
EducationBE-TransEarly Exit
BE-TransLate Exit
BE-DualTwo-Way
BE-DualOne-Way ESL
ESLContent
ESLPull-Out
LEP NoServices
LEP WithServices
TotalELL
STAARPercent Exceeded ProgressAll Grades
Mathematics 2017 20% 9% 4% - - - - - * - * * * *2016 17% 15% 8% - - - - - * - * * * *
Progress of Prior-Year Non-Proficient StudentsSum of Grades 4-8
Reading 2017 35% 26% 25% - - - - - 19% - 19% * 19% 19%2016 35% 35% 30% - - - - - 15% - 15% * 15% 17%
Mathematics 2017 43% 34% 35% - - - - - 32% - 32% * 32% 31%

TEA Division of Performance Reporting Page 9
TEXAS EDUCATION AGENCYDistrict Name: FORT STOCKTON ISD Texas Academic Performance Report Total Students: 581
Campus Name: FORT STOCKTON MIDDLE 2016-17 Campus Participation Grade Span: 06 - 08Campus Number: 186902041 School Type: Middle
State District CampusAfrican
American Hispanic WhiteAmerican
Indian AsianPacific
Islander
Two orMoreRaces
SpecialEd
EconDisadv ELL
2017 STAARParticipation(All Grades)
All TestsTest Participant 99% 99% 99% - 99% 100% - 100% - * 95% 99% 100%
Included in Accountability 94% 95% 95% - 96% 90% - 100% - * 89% 96% 92%Not Included in Accountability
Mobile 4% 3% 3% - 2% 10% - 0% - * 6% 2% 0%Other Exclusions 1% 1% 1% - 1% 0% - 0% - * 0% 1% 8%
Not Tested 1% 1% 1% - 1% 0% - 0% - * 5% 1% 0%Absent 1% 1% 1% - 1% 0% - 0% - * 4% 1% 0%Other 0% 0% 0% - 0% 0% - 0% - * 1% 0% 0%
2016 STAARParticipation(All Grades)
All TestsTest Participant 99% 100% 99% * 99% 100% - 100% - - 100% 99% 100%
Included in Accountability 94% 95% 94% * 94% 97% - 82% - - 93% 92% 87%Not Included in Accountability
Mobile 4% 4% 5% * 5% 3% - 18% - - 7% 6% 11%Other Exclusions 1% 1% 0% * 0% 0% - 0% - - 0% 0% 2%
Not Tested 1% 0% 1% * 1% 0% - 0% - - 0% 1% 0%Absent 1% 0% 1% * 1% 0% - 0% - - 0% 1% 0%Other 0% 0% 0% * 0% 0% - 0% - - 0% 0% 0%
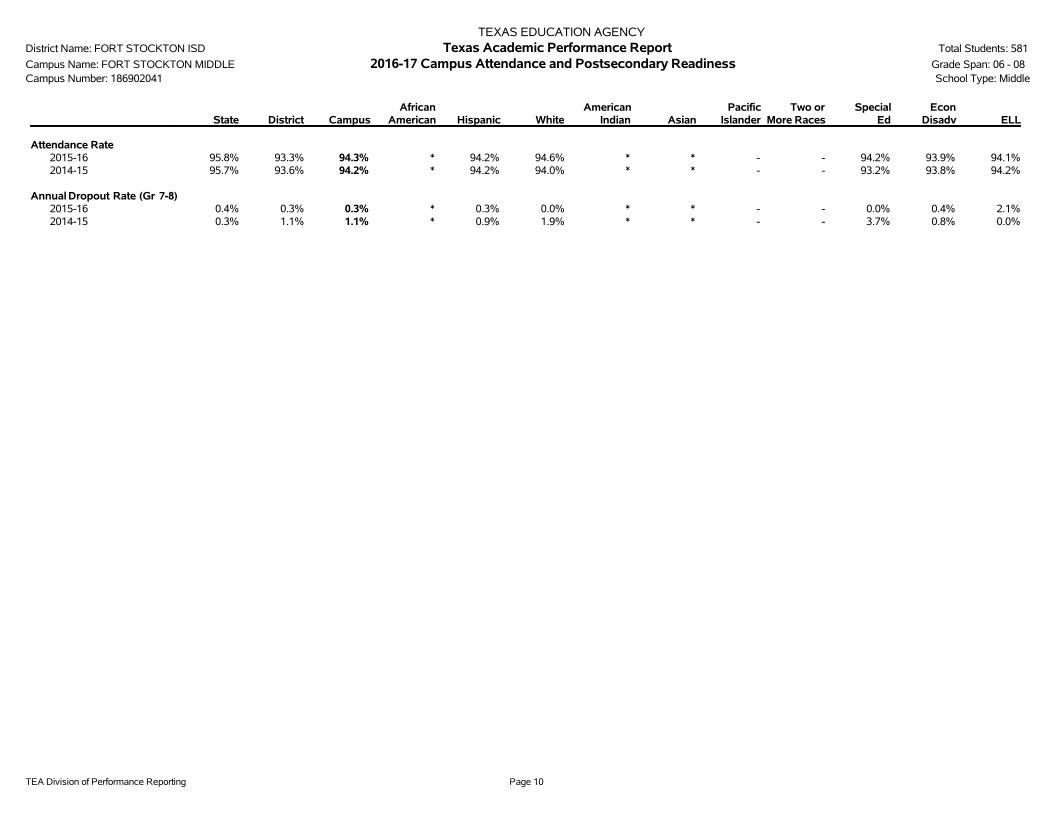
TEA Division of Performance Reporting Page 10
TEXAS EDUCATION AGENCYDistrict Name: FORT STOCKTON ISD Texas Academic Performance Report Total Students: 581
Campus Name: FORT STOCKTON MIDDLE 2016-17 Campus Attendance and Postsecondary Readiness Grade Span: 06 - 08Campus Number: 186902041 School Type: Middle
State District CampusAfrican
American Hispanic WhiteAmerican
Indian AsianPacific
IslanderTwo or
More RacesSpecial
EdEcon
Disadv ELL
Attendance Rate2015-16 95.8% 93.3% 94.3% * 94.2% 94.6% * * - - 94.2% 93.9% 94.1%2014-15 95.7% 93.6% 94.2% * 94.2% 94.0% * * - - 93.2% 93.8% 94.2%
Annual Dropout Rate (Gr 7-8)2015-16 0.4% 0.3% 0.3% * 0.3% 0.0% * * - - 0.0% 0.4% 2.1%2014-15 0.3% 1.1% 1.1% * 0.9% 1.9% * * - - 3.7% 0.8% 0.0%

TEA Division of Performance Reporting Page 11
TEXAS EDUCATION AGENCYDistrict Name: FORT STOCKTON ISD Texas Academic Performance Report Total Students: 581
Campus Name: FORT STOCKTON MIDDLE 2016-17 Campus Profile Grade Span: 06 - 08Campus Number: 186902041 School Type: Middle
---------------- Campus ----------------Student Information Count Percent District State
Total Students: 581 100.0% 2,456 5,343,834
Students by Grade:Early Childhood Education 0 0.0% 0.2% 0.3%Pre-Kindergarten 0 0.0% 0.9% 4.2%Kindergarten 0 0.0% 7.9% 7.0%Grade 1 0 0.0% 7.0% 7.4%Grade 2 0 0.0% 9.0% 7.6%Grade 3 0 0.0% 8.8% 7.7%Grade 4 0 0.0% 8.5% 7.7%Grade 5 0 0.0% 6.7% 7.5%Grade 6 211 36.3% 8.6% 7.4%Grade 7 200 34.4% 8.1% 7.4%Grade 8 170 29.3% 6.9% 7.3%Grade 9 0 0.0% 7.4% 8.1%Grade 10 0 0.0% 7.8% 7.4%Grade 11 0 0.0% 5.9% 6.8%Grade 12 0 0.0% 6.1% 6.2%
Ethnic Distribution:African American 0 0.0% 0.7% 12.6%Hispanic 511 88.0% 86.7% 52.4%White 64 11.0% 11.5% 28.1%American Indian 0 0.0% 0.1% 0.4%Asian 4 0.7% 0.7% 4.2%Pacific Islander 0 0.0% 0.0% 0.1%Two or More Races 2 0.3% 0.4% 2.2%
Economically Disadvantaged 414 71.3% 66.7% 59.0%Non-Educationally Disadvantaged 167 28.7% 33.3% 41.0%English Language Learners (ELL) 51 8.8% 9.0% 18.9%Students w/ Disciplinary Placements (2015-2016) 1 0.2% 0.3% 1.4%At-Risk 398 68.5% 62.8% 50.3%
Students with Disabilities by Type of Primary Disability:Total Students with DisabilitiesBy Type of Primary Disability
38
Students with Intellectual Disabilities 25 65.8% 63.9% 44.5%Students with Physical Disabilities * * 15.0% 21.9%Students with Autism 7 18.4% 15.0% 12.5%Students with Behavioral Disabilities * * ** 19.9%Students with Non-Categorical Early Childhood 0 0.0% * 1.3%

TEA Division of Performance Reporting Page 12
TEXAS EDUCATION AGENCYDistrict Name: FORT STOCKTON ISD Texas Academic Performance Report Total Students: 581
Campus Name: FORT STOCKTON MIDDLE 2016-17 Campus Profile Grade Span: 06 - 08Campus Number: 186902041 School Type: Middle
---------------- Campus ----------------Student Information Count Percent District State
Mobility (2015-2016):Total Mobile Students
By Ethnicity:76 13.0% 12.6% 16.2%
African American 0 0.0%Hispanic 59 10.1%White 15 2.6%American Indian 1 0.2%Asian 1 0.2%Pacific Islander 0 0.0%Two or More Races 0 0.0%

TEA Division of Performance Reporting Page 13
TEXAS EDUCATION AGENCYDistrict Name: FORT STOCKTON ISD Texas Academic Performance Report Total Students: 581
Campus Name: FORT STOCKTON MIDDLE 2016-17 Campus Profile Grade Span: 06 - 08Campus Number: 186902041 School Type: Middle
--------- Non-Special Education Rates --------- ------------- Special Education Rates -------------Student Information Campus District State Campus District State
Retention Rates by Grade:
Kindergarten - 1.2% 1.8% - 0.0% 7.7%Grade 1 - 0.5% 3.8% - 0.0% 6.8%Grade 2 - 0.5% 2.4% - 0.0% 3.1%Grade 3 - 1.4% 1.6% - 0.0% 1.2%Grade 4 - 0.0% 0.8% - 0.0% 0.7%Grade 5 - 0.5% 0.4% - 0.0% 0.7%Grade 6 0.5% 0.5% 0.6% 0.0% 0.0% 0.7%Grade 7 0.0% 0.0% 0.7% 0.0% 0.0% 0.8%Grade 8 0.0% 0.0% 0.5% 0.0% 0.0% 0.9%
Class Size Information Campus District State
Class Size Averages by Grade and Subject (Derived from teacher responsibility records):
Elementary:Kindergarten - 18.7 18.8Grade 1 - 16.9 18.8Grade 2 - 20.0 18.9Grade 3 - 19.7 19.0Grade 4 - 15.7 19.0Grade 5 - 15.9 20.9Grade 6 18.3 18.3 20.4
Secondary:English/Language Arts 20.3 18.2 16.8Foreign Languages 28.0 19.3 18.7Mathematics 14.2 17.0 18.0Science 19.5 18.9 19.0Social Studies 19.5 20.0 19.4

TEA Division of Performance Reporting Page 14
TEXAS EDUCATION AGENCYDistrict Name: FORT STOCKTON ISD Texas Academic Performance Report Total Students: 581
Campus Name: FORT STOCKTON MIDDLE 2016-17 Campus Profile Grade Span: 06 - 08Campus Number: 186902041 School Type: Middle
---------------- Campus ----------------Staff Information Count/Average Percent District State
Total Staff 53.9 100.0% 100.0% 100.0%
Professional Staff: 44.9 83.5% 61.0% 64.0%Teachers 38.2 71.0% 46.5% 50.0%Professional Support 3.7 6.9% 9.7% 10.0%Campus Administration (School Leadership) 3.0 5.6% 3.0% 2.9%
Educational Aides: 8.9 16.5% 13.5% 9.6%
Total Minority Staff: 31.7 58.9% 68.8% 49.1%
Teachers by Ethnicity and Sex:African American 0.0 0.0% 1.9% 10.2%Hispanic 17.3 45.3% 50.3% 26.6%White 18.9 49.4% 44.7% 59.8%American Indian 0.0 0.0% 0.6% 0.4%Asian 2.0 5.2% 1.9% 1.5%Pacific Islander 0.0 0.0% 0.0% 0.4%Two or More Races 0.0 0.0% 0.6% 1.1%
Males 12.2 31.9% 27.3% 23.7%Females 26.0 68.1% 72.7% 76.3%
Teachers by Highest Degree Held:No Degree 0.0 0.0% 0.0% 1.2%Bachelors 32.8 85.8% 80.7% 74.5%Masters 5.4 14.2% 18.0% 23.6%Doctorate 0.0 0.0% 1.2% 0.6%
Teachers by Years of Experience:Beginning Teachers 4.0 10.5% 8.1% 7.8%1-5 Years Experience 13.1 34.3% 32.3% 28.0%6-10 Years Experience 5.0 13.1% 16.1% 20.9%11-20 Years Experience 9.2 24.1% 23.6% 27.8%Over 20 Years Experience 6.9 18.1% 19.9% 15.5%
Number of Students per Teacher 15.2 n/a 15.3 15.1

TEA Division of Performance Reporting Page 15
TEXAS EDUCATION AGENCYDistrict Name: FORT STOCKTON ISD Texas Academic Performance Report Total Students: 581
Campus Name: FORT STOCKTON MIDDLE 2016-17 Campus Profile Grade Span: 06 - 08Campus Number: 186902041 School Type: Middle
Staff Information Campus District State
Experience of Campus Leadership:Average Years Experience of Principals 11.0 19.2 19.5Average Years Experience of Principals with District 11.0 13.2 12.2Average Years Experience of Assistant Principals 30.7 30.0 15.7Average Years Experience of Assistant Principals with District 18.3 19.0 10.1
Average Years Experience of Teachers: 10.5 11.2 10.9Average Years Experience of Teachers with District: 6.1 6.8 7.2
Average Teacher Salary by Years of Experience (regular duties only):Beginning Teachers $41,875 $42,252 $46,1991-5 Years Experience $42,238 $42,749 $48,7796-10 Years Experience $49,016 $47,014 $51,18411-20 Years Experience $51,595 $52,824 $54,396Over 20 Years Experience $57,611 $58,184 $60,913
Average Actual Salaries (regular duties only):Teachers $48,119 $48,844 $52,525Professional Support $51,528 $53,424 $61,728Campus Administration (School Leadership) $72,703 $73,613 $76,471
Instructional Staff Percent: n/a 59.0% 64.6%
Contracted Instructional Staff (not incl. above): 0.0 7.0 2,110.5

TEA Division of Performance Reporting Page 16
TEXAS EDUCATION AGENCYDistrict Name: FORT STOCKTON ISD Texas Academic Performance Report Total Students: 581
Campus Name: FORT STOCKTON MIDDLE 2016-17 Campus Profile Grade Span: 06 - 08Campus Number: 186902041 School Type: Middle
---------------- Campus ----------------Program Information Count Percent District State
Student Enrollment by Program:Bilingual/ESL Education 49 8.4% 8.7% 18.8%Career & Technical Education 160 27.5% 31.8% 25.0%Gifted & Talented Education 20 3.4% 2.9% 7.8%Special Education 38 6.5% 6.0% 8.8%
Teachers by Program (population served):Bilingual/ESL Education 0.8 2.0% 5.4% 6.0%Career & Technical Education 1.0 2.7% 5.6% 4.5%Compensatory Education 0.0 0.0% 4.1% 2.8%Gifted & Talented Education 0.0 0.0% 0.0% 1.9%Regular Education 33.0 86.2% 76.6% 72.8%Special Education 1.5 4.0% 4.3% 8.6%Other 1.9 5.0% 3.9% 3.4%
Link to: PEIMS Financial Standard Reports/ 2015-2016 Financial Actual Report
' '̂ Indicates that ELL rates at met or exceeded standard and exceeded standard include current and monitored students.'*' Indicates results are masked due to small numbers to protect student confidentiality.'**' When only one group is masked, then the second smallest group is masked (regardless of size).'-' Indicates zero observations reported for this group.'n/a' Indicates data reporting is not applicable for this group.'***' Indicates that rates for Reading and Mathematics are based on the cumulative results from the first and second administrations of STAAR.'?' Indicates that the data for this item were statistically improbable, or were reported outside a reasonable range.

2016-17 Texas Academic Performance Report
District Name: FORT STOCKTON ISD
Campus Name: INT
Campus Number: 186902101
2017 Accountability Rating: Met Standard

This page intentionally left blank.

TEA Division of Performance Reporting Page 1
TEXAS EDUCATION AGENCYDistrict Name: FORT STOCKTON ISD Texas Academic Performance Report Total Students: 374
Campus Name: INT 2016-17 Campus Performance Grade Span: 04 - 05Campus Number: 186902101 School Type: Elementary
State District CampusAfrican
American Hispanic WhiteAmerican
Indian AsianPacific
Islander
Two orMore
RacesSpecial
EdEcon
Disadv ELL^STAARPercent at Approaches Grade Level or Above
Grade 4
Reading 2017 70% 64% 64% * 63% 70% * * - * * 59% 43%
2016 75% 70% 70% - 68% 83% - - - * * 62% 38%
Mathematics 2017 76% 77% 77% * 78% 70% * * - * * 73% 86%
2016 73% 71% 71% - 69% 83% - - - * * 66% 46%
Writing 2017 65% 53% 53% * 52% 57% * * - * * 47% 41%
2016 69% 56% 56% - 54% 72% - - - * * 52% *
STAARPercent at Approaches Grade Level or AboveGrade 5 ***
Reading 2017 82% 76% 76% - 75% 82% - * - * 71% 73% 46%
2016 81% 72% 72% - 70% 87% - - - * 69% 65% 52%
Mathematics 2017 87% 79% 79% - 78% 76% - * - * * 76% 54%
2016 86% 82% 82% - 82% 83% - - - * 77% 77% 81%
Science 2017 74% 58% 58% - 55% 81% - * - * * 53% 45%
2016 74% 64% 64% - 62% 77% - - - * 62% 54% 45%
STAARPercent at Approaches Grade Level or AboveAll Grades
All Subjects 2017 75% 66% 67% * 67% 71% * 100% - 67% 50% 63% 54%
2016 75% 68% 70% - 68% 81% - - - 89% 62% 63% 51%
Reading 2017 72% 65% 69% * 68% 75% * * - * 56% 66% 44%
2016 73% 66% 71% - 69% 85% - - - * 60% 64% 47%
Mathematics 2017 79% 71% 77% * 78% 73% * * - * 50% 75% 76%
2016 76% 73% 77% - 76% 83% - - - * 65% 72% 68%
Writing 2017 67% 54% 53% * 52% 57% * * - * * 47% 41%
2016 69% 63% 56% - 54% 72% - - - * * 52% *
Science 2017 79% 67% 58% - 55% 81% - * - * * 53% 45%
2016 79% 71% 64% - 62% 77% - - - * 62% 54% 45%

TEA Division of Performance Reporting Page 2
TEXAS EDUCATION AGENCYDistrict Name: FORT STOCKTON ISD Texas Academic Performance Report Total Students: 374
Campus Name: INT 2016-17 Campus Performance Grade Span: 04 - 05Campus Number: 186902101 School Type: Elementary
State District CampusAfrican
American Hispanic WhiteAmerican
Indian AsianPacific
Islander
Two orMore
RacesSpecial
EdEcon
Disadv ELL^STAARPercent at Meets Grade Level
All Grades
Two or More Subjects 2017 48% 33% 32% * 30% 43% * * - * 38% 26% *
2016 45% 32% 31% - 30% 37% - - - * * 24% *
Reading 2017 48% 36% 38% * 36% 50% * * - * 44% 32% *
2016 46% 35% 37% - 36% 42% - - - * * 31% *
Mathematics 2017 48% 36% 42% * 40% 53% * * - * 38% 38% 33%
2016 43% 38% 38% - 38% 45% - - - * * 32% 42%
Writing 2017 38% 20% 17% * 16% 26% * * - * * 12% *
2016 41% 27% 19% - 20% * - - - * * 17% *
Science 2017 52% 36% 24% - 21% 50% - * - * * 20% *
2016 47% 38% 22% - 20% 43% - - - * * 14% *
STAARPercent at Masters Grade LevelAll Grades
All Subjects 2017 20% 12% 15% * 14% 18% * * - * 13% 12% 7%
2016 18% 10% 13% - 12% 24% - - - * 17% 8% *
Reading 2017 19% 11% 19% * 17% 28% * * - * * 14% *
2016 17% 10% 16% - 14% 27% - - - * * 10% *
Mathematics 2017 23% 15% 21% * 21% 20% * * - * * 18% 20%
2016 19% 14% 17% - 16% 32% - - - * 25% 11% *
Writing 2017 12% 4% * * * * * * - * * * *
2016 15% 5% 4% - 4% * - - - * * * *
Science 2017 19% 9% 9% - 7% * - * - * * 6% *
2016 16% 7% 7% - 5% * - - - * * * *

TEA Division of Performance Reporting Page 3
TEXAS EDUCATION AGENCYDistrict Name: FORT STOCKTON ISD Texas Academic Performance Report Total Students: 374
Campus Name: INT 2016-17 Campus Performance Grade Span: 04 - 05Campus Number: 186902101 School Type: Elementary
State District CampusAfrican
American Hispanic WhiteAmerican
Indian AsianPacific
Islander
Two orMore
RacesSpecial
EdEcon
Disadv ELL^STAARPercent Met or Exceeded Progress
All Grades
All Subjects 2017 61% 51% 59% * 58% 63% * * - * 63% 58% 56%
2016 62% 61% 71% - 70% 75% - - - * 59% 67% 62%
Reading 2017 59% 51% 55% * 53% * * * - * * 53% 47%
2016 60% 59% 69% - 68% 76% - - - * * 66% 66%
Mathematics 2017 64% 50% 62% * 63% 61% * * - * * 62% 65%
2016 63% 64% 72% - 72% 74% - - - * * 68% 58%
STAARPercent Exceeded ProgressAll Grades
All Subjects 2017 19% 11% 17% * 17% 12% * * - * 16% 15% 16%
2016 17% 15% 26% - 26% 30% - - - * 22% 24% 16%
Reading 2017 17% 12% 17% * 17% * * * - * * 16% 15%
2016 16% 16% 24% - 24% 29% - - - * * 22% 17%
Mathematics 2017 20% 9% 17% * 17% 13% * * - * * 15% 17%
2016 17% 15% 28% - 28% 32% - - - * * 26% 14%
Progress of Prior-Year Non-Proficient StudentsSum of Grades 4-8
Reading 2017 35% 26% 30% * 32% * - - - * * 31% 36%
2016 35% 35% 40% - 36% 71% - - - * 45% 35% 30%
Mathematics 2017 43% 34% 31% * 35% * - - - * * 28% 44%

TEA Division of Performance Reporting Page 4
TEXAS EDUCATION AGENCYDistrict Name: FORT STOCKTON ISD Texas Academic Performance Report Total Students: 374
Campus Name: INT 2016-17 Campus Performance Grade Span: 04 - 05Campus Number: 186902101 School Type: Elementary
State District CampusAfrican
American Hispanic WhiteAmerican
Indian AsianPacific
Islander
Two orMore
RacesSpecial
EdEcon
Disadv ELLStudent Success Initiative
Grade 5 Reading
Students Meeting Approaches Grade Level on First STAARAdministration
2017 72% 60% 60% - 59% 60% - * - * * 55% *
Students Requiring Accelerated Instruction
2017 28% 40% 40% - 41% 40% - * - * * 45% 69%
STAARCumulative Met Standard
2017 81% 76% 76% - 75% 80% - * - * * 72% 46%
Grade 5 Mathematics
Students Meeting Approaches Grade Level on First STAARAdministration
2017 81% 74% 74% - 73% 73% - * - * * 70% 38%
Students Requiring Accelerated Instruction
2017 19% 26% 26% - 27% * - * - * * 30% 62%
STAARCumulative Met Standard
2017 87% 78% 78% - 78% 73% - * - * * 76% 54%

TEA Division of Performance Reporting Page 5
TEXAS EDUCATION AGENCYDistrict Name: FORT STOCKTON ISD Texas Academic Performance Report Total Students: 374
Campus Name: INT 2016-17 Campus Performance Grade Span: 04 - 05Campus Number: 186902101 Bilingual Education/English as a Second Language (Current Year ELL Students)
State District CampusBilingual
EducationBE-TransEarly Exit
BE-TransLate Exit
BE-DualTwo-Way
BE-DualOne-Way ESL
ESLContent
ESLPull-Out
LEP NoServices
LEP WithServices
TotalELL
STAARPercent at Approaches Grade Level or AboveAll Grades
All Subjects 2017 75% 66% 67% - - - - - 53% 53% - * 53% 54%2016 75% 68% 70% - - - - - 48% 48% - 78% 48% 51%
Reading 2017 72% 65% 69% - - - - - 43% 43% - * 43% 44%2016 73% 66% 71% - - - - - 45% 45% - * 45% 47%
Mathematics 2017 79% 71% 77% - - - - - 75% 75% - * 75% 76%2016 76% 73% 77% - - - - - 65% 65% - * 65% 68%
Writing 2017 67% 54% 53% - - - - - 39% 39% - * 39% 41%2016 69% 63% 56% - - - - - * * - - * *
Science 2017 79% 67% 58% - - - - - 45% 45% - - 45% 45%2016 79% 71% 64% - - - - - 41% 41% - * 41% 45%
STAARPercent at Meets Grade LevelAll Grades
Two or More Subjects 2017 48% 33% 32% - - - - - * * - * * *2016 45% 32% 31% - - - - - * * - * * *
Reading 2017 48% 36% 38% - - - - - * * - * * *2016 46% 35% 37% - - - - - * * - * * *
Mathematics 2017 48% 36% 42% - - - - - 31% 31% - * 31% 33%2016 43% 38% 38% - - - - - 38% 38% - * 38% 42%
Writing 2017 38% 20% 17% - - - - - * * - * * *2016 41% 27% 19% - - - - - * * - - * *
Science 2017 52% 36% 24% - - - - - * * - - * *2016 47% 38% 22% - - - - - * * - * * *
STAARPercent at Masters Grade LevelAll Grades
All Subjects 2017 20% 12% 15% - - - - - 7% 7% - * 7% 7%2016 18% 10% 13% - - - - - * * - * * *

TEA Division of Performance Reporting Page 6
TEXAS EDUCATION AGENCYDistrict Name: FORT STOCKTON ISD Texas Academic Performance Report Total Students: 374
Campus Name: INT 2016-17 Campus Performance Grade Span: 04 - 05Campus Number: 186902101 Bilingual Education/English as a Second Language (Current Year ELL Students)
State District CampusBilingual
EducationBE-TransEarly Exit
BE-TransLate Exit
BE-DualTwo-Way
BE-DualOne-Way ESL
ESLContent
ESLPull-Out
LEP NoServices
LEP WithServices
TotalELL
STAARPercent at Masters Grade LevelAll Grades
Reading 2017 19% 11% 19% - - - - - * * - * * *2016 17% 10% 16% - - - - - * * - * * *
Mathematics 2017 23% 15% 21% - - - - - 18% 18% - * 18% 20%2016 19% 14% 17% - - - - - * * - * * *
Writing 2017 12% 4% * - - - - - * * - * * *2016 15% 5% 4% - - - - - * * - - * *
Science 2017 19% 9% 9% - - - - - * * - - * *2016 16% 7% 7% - - - - - * * - * * *
STAARPercent Met or Exceeded ProgressAll Grades
All Subjects 2017 61% 51% 59% - - - - - 53% 53% - * 53% 52%2016 62% 61% 71% - - - - - 53% 53% - * 53% 54%
Reading 2017 59% 51% 55% - - - - - 38% 38% - * 38% 39%2016 60% 59% 69% - - - - - 68% 68% - * 68% 68%
Mathematics 2017 64% 50% 62% - - - - - 68% 68% - * 68% 66%2016 63% 64% 72% - - - - - * * - * * 41%
STAARPercent Exceeded ProgressAll Grades
All Subjects 2017 19% 11% 17% - - - - - 18% 18% - * 18% 17%2016 17% 15% 26% - - - - - 13% 13% - * 13% 16%
Reading 2017 17% 12% 17% - - - - - 15% 15% - * 15% 15%2016 16% 16% 24% - - - - - 16% 16% - * 16% 18%
Mathematics 2017 20% 9% 17% - - - - - 20% 20% - * 20% 20%2016 17% 15% 28% - - - - - * * - * * 15%
Progress of Prior-Year Non-Proficient StudentsSum of Grades 4-8
Reading 2017 35% 26% 30% - - - - - 36% 36% - - 36% 36%2016 35% 35% 40% - - - - - 29% 29% - * 29% 30%

TEA Division of Performance Reporting Page 7
TEXAS EDUCATION AGENCYDistrict Name: FORT STOCKTON ISD Texas Academic Performance Report Total Students: 374
Campus Name: INT 2016-17 Campus Performance Grade Span: 04 - 05Campus Number: 186902101 Bilingual Education/English as a Second Language (Current Year ELL Students)
State District CampusBilingual
EducationBE-TransEarly Exit
BE-TransLate Exit
BE-DualTwo-Way
BE-DualOne-Way ESL
ESLContent
ESLPull-Out
LEP NoServices
LEP WithServices
TotalELL
Progress of Prior-Year Non-Proficient StudentsSum of Grades 4-8
Mathematics 2017 43% 34% 31% - - - - - 44% 44% - - 44% 44%

TEA Division of Performance Reporting Page 8
TEXAS EDUCATION AGENCYDistrict Name: FORT STOCKTON ISD Texas Academic Performance Report Total Students: 374
Campus Name: INT 2016-17 Campus Participation Grade Span: 04 - 05Campus Number: 186902101 School Type: Elementary
State District CampusAfrican
American Hispanic WhiteAmerican
Indian AsianPacific
Islander
Two orMoreRaces
SpecialEd
EconDisadv ELL
2017 STAARParticipation(All Grades)
All TestsTest Participant 99% 99% 100% 100% 100% 100% * 100% - 100% 100% 100% 99%
Included in Accountability 94% 95% 97% 100% 97% 95% * 100% - 100% 100% 96% 92%Not Included in Accountability
Mobile 4% 3% 3% 0% 3% 5% * 0% - 0% 0% 3% 5%Other Exclusions 1% 1% 0% 0% 0% 0% * 0% - 0% 0% 0% 3%
Not Tested 1% 1% 0% 0% 0% 0% * 0% - 0% 0% 0% 1%Absent 1% 1% 0% 0% 0% 0% * 0% - 0% 0% 0% 1%Other 0% 0% 0% 0% 0% 0% * 0% - 0% 0% 0% 0%
2016 STAARParticipation(All Grades)
All TestsTest Participant 99% 100% 100% - 100% 100% - * - 100% 100% 100% 98%
Included in Accountability 94% 95% 94% - 95% 89% - * - 100% 95% 93% 82%Not Included in Accountability
Mobile 4% 4% 6% - 5% 11% - * - 0% 5% 7% 16%Other Exclusions 1% 1% 0% - 0% 0% - * - 0% 0% 0% 1%
Not Tested 1% 0% 0% - 0% 0% - * - 0% 0% 0% 2%Absent 1% 0% 0% - 0% 0% - * - 0% 0% 0% 2%Other 0% 0% 0% - 0% 0% - * - 0% 0% 0% 0%

TEA Division of Performance Reporting Page 9
TEXAS EDUCATION AGENCYDistrict Name: FORT STOCKTON ISD Texas Academic Performance Report Total Students: 374
Campus Name: INT 2016-17 Campus Attendance and Postsecondary Readiness Grade Span: 04 - 05Campus Number: 186902101 School Type: Elementary
State District CampusAfrican
American Hispanic WhiteAmerican
Indian AsianPacific
IslanderTwo or
More RacesSpecial
EdEcon
Disadv ELL
Attendance Rate2015-16 95.8% 93.3% 94.2% * 94.1% 95.1% * * - * 93.9% 93.8% 93.1%2014-15 95.7% 93.6% 94.4% * 94.3% 94.9% * * - * 95.3% 93.9% 94.7%

TEA Division of Performance Reporting Page 10
TEXAS EDUCATION AGENCYDistrict Name: FORT STOCKTON ISD Texas Academic Performance Report Total Students: 374
Campus Name: INT 2016-17 Campus Profile Grade Span: 04 - 05Campus Number: 186902101 School Type: Elementary
---------------- Campus ----------------Student Information Count Percent District State
Total Students: 374 100.0% 2,456 5,343,834
Students by Grade:Early Childhood Education 0 0.0% 0.2% 0.3%Pre-Kindergarten 0 0.0% 0.9% 4.2%Kindergarten 0 0.0% 7.9% 7.0%Grade 1 0 0.0% 7.0% 7.4%Grade 2 0 0.0% 9.0% 7.6%Grade 3 0 0.0% 8.8% 7.7%Grade 4 209 55.9% 8.5% 7.7%Grade 5 165 44.1% 6.7% 7.5%Grade 6 0 0.0% 8.6% 7.4%Grade 7 0 0.0% 8.1% 7.4%Grade 8 0 0.0% 6.9% 7.3%Grade 9 0 0.0% 7.4% 8.1%Grade 10 0 0.0% 7.8% 7.4%Grade 11 0 0.0% 5.9% 6.8%Grade 12 0 0.0% 6.1% 6.2%
Ethnic Distribution:African American 2 0.5% 0.7% 12.6%Hispanic 322 86.1% 86.7% 52.4%White 44 11.8% 11.5% 28.1%American Indian 1 0.3% 0.1% 0.4%Asian 2 0.5% 0.7% 4.2%Pacific Islander 0 0.0% 0.0% 0.1%Two or More Races 3 0.8% 0.4% 2.2%
Economically Disadvantaged 272 72.7% 66.7% 59.0%Non-Educationally Disadvantaged 102 27.3% 33.3% 41.0%English Language Learners (ELL) 42 11.2% 9.0% 18.9%Students w/ Disciplinary Placements (2015-2016) 0 0.0% 0.3% 1.4%At-Risk 172 46.0% 62.8% 50.3%
Students with Disabilities by Type of Primary Disability:Total Students with DisabilitiesBy Type of Primary Disability
20
Students with Intellectual Disabilities 16 80.0% 63.9% 44.5%Students with Physical Disabilities * * 15.0% 21.9%Students with Autism * * 15.0% 12.5%Students with Behavioral Disabilities * * ** 19.9%Students with Non-Categorical Early Childhood 0 0.0% * 1.3%

TEA Division of Performance Reporting Page 11
TEXAS EDUCATION AGENCYDistrict Name: FORT STOCKTON ISD Texas Academic Performance Report Total Students: 374
Campus Name: INT 2016-17 Campus Profile Grade Span: 04 - 05Campus Number: 186902101 School Type: Elementary
---------------- Campus ----------------Student Information Count Percent District State
Mobility (2015-2016):Total Mobile Students
By Ethnicity:63 15.1% 12.6% 16.2%
African American 0 0.0%Hispanic 47 11.3%White 14 3.4%American Indian 1 0.2%Asian 1 0.2%Pacific Islander 0 0.0%Two or More Races 0 0.0%

TEA Division of Performance Reporting Page 12
TEXAS EDUCATION AGENCYDistrict Name: FORT STOCKTON ISD Texas Academic Performance Report Total Students: 374
Campus Name: INT 2016-17 Campus Profile Grade Span: 04 - 05Campus Number: 186902101 School Type: Elementary
--------- Non-Special Education Rates --------- ------------- Special Education Rates -------------Student Information Campus District State Campus District State
Retention Rates by Grade:
Kindergarten - 1.2% 1.8% - 0.0% 7.7%Grade 1 - 0.5% 3.8% - 0.0% 6.8%Grade 2 - 0.5% 2.4% - 0.0% 3.1%Grade 3 - 1.4% 1.6% - 0.0% 1.2%Grade 4 0.0% 0.0% 0.8% 0.0% 0.0% 0.7%Grade 5 0.5% 0.5% 0.4% 0.0% 0.0% 0.7%Grade 6 - 0.5% 0.6% - 0.0% 0.7%Grade 7 - 0.0% 0.7% - 0.0% 0.8%Grade 8 - 0.0% 0.5% - 0.0% 0.9%
Class Size Information Campus District State
Class Size Averages by Grade and Subject (Derived from teacher responsibility records):
Elementary:Kindergarten - 18.7 18.8Grade 1 - 16.9 18.8Grade 2 - 20.0 18.9Grade 3 - 19.7 19.0Grade 4 15.7 15.7 19.0Grade 5 15.9 15.9 20.9Grade 6 - 18.3 20.4
Secondary:English/Language Arts - 18.2 16.8Foreign Languages - 19.3 18.7Mathematics - 17.0 18.0Science - 18.9 19.0Social Studies - 20.0 19.4

TEA Division of Performance Reporting Page 13
TEXAS EDUCATION AGENCYDistrict Name: FORT STOCKTON ISD Texas Academic Performance Report Total Students: 374
Campus Name: INT 2016-17 Campus Profile Grade Span: 04 - 05Campus Number: 186902101 School Type: Elementary
---------------- Campus ----------------Staff Information Count/Average Percent District State
Total Staff 37.8 100.0% 100.0% 100.0%
Professional Staff: 27.8 73.5% 61.0% 64.0%Teachers 24.6 65.1% 46.5% 50.0%Professional Support 2.2 5.8% 9.7% 10.0%Campus Administration (School Leadership) 1.0 2.6% 3.0% 2.9%
Educational Aides: 10.0 26.5% 13.5% 9.6%
Total Minority Staff: 31.1 82.3% 68.8% 49.1%
Teachers by Ethnicity and Sex:African American 0.0 0.0% 1.9% 10.2%Hispanic 18.1 73.6% 50.3% 26.6%White 5.5 22.3% 44.7% 59.8%American Indian 0.0 0.0% 0.6% 0.4%Asian 1.0 4.1% 1.9% 1.5%Pacific Islander 0.0 0.0% 0.0% 0.4%Two or More Races 0.0 0.0% 0.6% 1.1%
Males 6.5 26.4% 27.3% 23.7%Females 18.1 73.6% 72.7% 76.3%
Teachers by Highest Degree Held:No Degree 0.0 0.0% 0.0% 1.2%Bachelors 20.6 83.7% 80.7% 74.5%Masters 4.0 16.3% 18.0% 23.6%Doctorate 0.0 0.0% 1.2% 0.6%
Teachers by Years of Experience:Beginning Teachers 2.0 8.1% 8.1% 7.8%1-5 Years Experience 13.5 54.9% 32.3% 28.0%6-10 Years Experience 3.0 12.2% 16.1% 20.9%11-20 Years Experience 4.2 16.9% 23.6% 27.8%Over 20 Years Experience 1.9 7.8% 19.9% 15.5%
Number of Students per Teacher 15.2 n/a 15.3 15.1

TEA Division of Performance Reporting Page 14
TEXAS EDUCATION AGENCYDistrict Name: FORT STOCKTON ISD Texas Academic Performance Report Total Students: 374
Campus Name: INT 2016-17 Campus Profile Grade Span: 04 - 05Campus Number: 186902101 School Type: Elementary
Staff Information Campus District State
Experience of Campus Leadership:Average Years Experience of Principals 22.0 19.2 19.5Average Years Experience of Principals with District 0.0 13.2 12.2Average Years Experience of Assistant Principals 0.0 30.0 15.7Average Years Experience of Assistant Principals with District 0.0 19.0 10.1
Average Years Experience of Teachers: 7.9 11.2 10.9Average Years Experience of Teachers with District: 6.5 6.8 7.2
Average Teacher Salary by Years of Experience (regular duties only):Beginning Teachers $41,500 $42,252 $46,1991-5 Years Experience $43,118 $42,749 $48,7796-10 Years Experience $46,140 $47,014 $51,18411-20 Years Experience $51,048 $52,824 $54,396Over 20 Years Experience $55,105 $58,184 $60,913
Average Actual Salaries (regular duties only):Teachers $45,636 $48,844 $52,525Professional Support $40,198 $53,424 $61,728Campus Administration (School Leadership) $72,500 $73,613 $76,471
Instructional Staff Percent: n/a 59.0% 64.6%
Contracted Instructional Staff (not incl. above): 0.0 7.0 2,110.5

TEA Division of Performance Reporting Page 15
TEXAS EDUCATION AGENCYDistrict Name: FORT STOCKTON ISD Texas Academic Performance Report Total Students: 374
Campus Name: INT 2016-17 Campus Profile Grade Span: 04 - 05Campus Number: 186902101 School Type: Elementary
---------------- Campus ----------------Program Information Count Percent District State
Student Enrollment by Program:Bilingual/ESL Education 41 11.0% 8.7% 18.8%Career & Technical Education 0 0.0% 31.8% 25.0%Gifted & Talented Education 10 2.7% 2.9% 7.8%Special Education 20 5.3% 6.0% 8.8%
Teachers by Program (population served):Bilingual/ESL Education 0.0 0.0% 5.4% 6.0%Career & Technical Education 0.0 0.0% 5.6% 4.5%Compensatory Education 0.6 2.6% 4.1% 2.8%Gifted & Talented Education 0.0 0.0% 0.0% 1.9%Regular Education 21.1 85.9% 76.6% 72.8%Special Education 2.8 11.5% 4.3% 8.6%Other 0.0 0.0% 3.9% 3.4%
Link to: PEIMS Financial Standard Reports/ 2015-2016 Financial Actual Report
' '̂ Indicates that ELL rates at met or exceeded standard and exceeded standard include current and monitored students.'*' Indicates results are masked due to small numbers to protect student confidentiality.'**' When only one group is masked, then the second smallest group is masked (regardless of size).'-' Indicates zero observations reported for this group.'n/a' Indicates data reporting is not applicable for this group.'***' Indicates that rates for Reading and Mathematics are based on the cumulative results from the first and second administrations of STAAR.'?' Indicates that the data for this item were statistically improbable, or were reported outside a reasonable range.

This page intentionally left blank.

2016-17 Texas Academic Performance Report
District Name: FORT STOCKTON ISD
Campus Name: ALAMO EL
Campus Number: 186902102
2017 Accountability Rating: Met Standard
Distinction Designations:
Postsecondary Readiness

This page intentionally left blank.

TEA Division of Performance Reporting Page 1
TEXAS EDUCATION AGENCYDistrict Name: FORT STOCKTON ISD Texas Academic Performance Report Total Students: 509
Campus Name: ALAMO EL 2016-17 Campus Performance Grade Span: EE - 03Campus Number: 186902102 School Type: Elementary
State District CampusAfrican
American Hispanic WhiteAmerican
Indian AsianPacific
Islander
Two orMore
RacesSpecial
EdEcon
Disadv ELL^STAARPercent at Approaches Grade Level or Above
Grade 3
Reading 2017 73% 71% 65% * 61% 88% - * - - 63% 58% 40%
2016 73% 72% 72% * 72% 77% - - - * * 63% 56%
Mathematics 2017 78% 78% 76% * 73% 88% - * - - 63% 73% 60%
2016 75% 76% 74% * 75% 77% - - - * * 67% 76%
STAARPercent at Approaches Grade Level or AboveAll Grades
All Subjects 2017 75% 66% 70% * 67% 88% - * - - 63% 66% 50%
2016 75% 68% 73% * 74% 77% - - - * 57% 65% 66%
Reading 2017 72% 65% 65% * 61% 88% - * - - 63% 58% 40%
2016 73% 66% 72% * 72% 77% - - - * * 63% 56%
Mathematics 2017 79% 71% 76% * 73% 88% - * - - 63% 73% 60%
2016 76% 73% 74% * 75% 77% - - - * * 67% 76%
STAARPercent at Meets Grade LevelAll Grades
Two or More Subjects 2017 48% 33% 35% * 30% 65% - * - - 63% 31% *
2016 45% 32% 32% * 30% 42% - - - * * 22% *
Reading 2017 48% 36% 45% * 39% 76% - * - - 63% 41% *
2016 46% 35% 46% * 46% 50% - - - * * 35% *
Mathematics 2017 48% 36% 48% * 45% 65% - * - - 63% 44% *
2016 43% 38% 45% * 45% 50% - - - * * 33% 100%
STAARPercent at Masters Grade LevelAll Grades
All Subjects 2017 20% 12% 24% * 21% 44% - * - - 44% 20% 20%
2016 18% 10% 22% * 20% 35% - - - * * 13% 21%
Reading 2017 19% 11% 26% * 21% 53% - * - - * 19% *
2016 17% 10% 23% * 21% * - - - * * 15% *

TEA Division of Performance Reporting Page 2
TEXAS EDUCATION AGENCYDistrict Name: FORT STOCKTON ISD Texas Academic Performance Report Total Students: 509
Campus Name: ALAMO EL 2016-17 Campus Performance Grade Span: EE - 03Campus Number: 186902102 School Type: Elementary
State District CampusAfrican
American Hispanic WhiteAmerican
Indian AsianPacific
Islander
Two orMore
RacesSpecial
EdEcon
Disadv ELL^STAARPercent at Masters Grade Level
All Grades
Mathematics 2017 23% 15% 23% * 20% 35% - * - - * 20% *
2016 19% 14% 20% * 18% 38% - - - * * 10% *
STAARPercent Met or Exceeded ProgressAll Grades
All Subjects 2017 61% 51% * - * - - - - - - * *
2016 62% 61% 58% - 58% - - - - - - 56% 58%
Reading 2017 59% 51% * - * - - - - - - * *
2016 60% 59% * - * - - - - - - * *
Mathematics 2017 64% 50% * - * - - - - - - * *
2016 63% 64% * - * - - - - - - * *
STAARPercent Exceeded ProgressAll Grades
All Subjects 2017 19% 11% * - * - - - - - - * *
2016 17% 15% 16% - 16% - - - - - - 18% 16%
Reading 2017 17% 12% * - * - - - - - - * *
2016 16% 16% * - * - - - - - - * *
Mathematics 2017 20% 9% * - * - - - - - - * *
2016 17% 15% * - * - - - - - - * *

TEA Division of Performance Reporting Page 3
TEXAS EDUCATION AGENCYDistrict Name: FORT STOCKTON ISD Texas Academic Performance Report Total Students: 509
Campus Name: ALAMO EL 2016-17 Campus Performance Grade Span: EE - 03Campus Number: 186902102 Bilingual Education/English as a Second Language (Current Year ELL Students)
State District CampusBilingual
EducationBE-TransEarly Exit
BE-TransLate Exit
BE-DualTwo-Way
BE-DualOne-Way ESL
ESLContent
ESLPull-Out
LEP NoServices
LEP WithServices
TotalELL
STAARPercent at Approaches Grade Level or AboveAll Grades
All Subjects 2017 75% 66% 70% 54% 54% - - - - - - * 54% 50%2016 75% 68% 73% 66% 66% - - - - - - - 66% 66%
Reading 2017 72% 65% 65% 43% 43% - - - - - - * 43% 40%2016 73% 66% 72% 56% 56% - - - - - - - 56% 56%
Mathematics 2017 79% 71% 76% 64% 64% - - - - - - * 64% 60%2016 76% 73% 74% 76% 76% - - - - - - - 76% 76%
STAARPercent at Meets Grade LevelAll Grades
Two or More Subjects 2017 48% 33% 35% * * - - - - - - * * *2016 45% 32% 32% * * - - - - - - - * *
Reading 2017 48% 36% 45% * * - - - - - - * * *2016 46% 35% 46% * * - - - - - - - * *
Mathematics 2017 48% 36% 48% * * - - - - - - * * *2016 43% 38% 45% 100% 100% - - - - - - - 100% 100%
STAARPercent at Masters Grade LevelAll Grades
All Subjects 2017 20% 12% 24% 21% 21% - - - - - - * 21% 20%2016 18% 10% 22% 21% 21% - - - - - - - 21% 21%
Reading 2017 19% 11% 26% * * - - - - - - * * *2016 17% 10% 23% * * - - - - - - - * *
Mathematics 2017 23% 15% 23% * * - - - - - - * * *2016 19% 14% 20% * * - - - - - - - * *
STAARPercent Met or Exceeded ProgressAll Grades
All Subjects 2017 61% 51% * * * - - - - - - - * *2016 62% 61% 58% 58% 58% - - - - - - - 58% 58%
Reading 2017 59% 51% * * * - - - - - - - * *2016 60% 59% * * * - - - - - - - * *

TEA Division of Performance Reporting Page 4
TEXAS EDUCATION AGENCYDistrict Name: FORT STOCKTON ISD Texas Academic Performance Report Total Students: 509
Campus Name: ALAMO EL 2016-17 Campus Performance Grade Span: EE - 03Campus Number: 186902102 Bilingual Education/English as a Second Language (Current Year ELL Students)
State District CampusBilingual
EducationBE-TransEarly Exit
BE-TransLate Exit
BE-DualTwo-Way
BE-DualOne-Way ESL
ESLContent
ESLPull-Out
LEP NoServices
LEP WithServices
TotalELL
STAARPercent Met or Exceeded ProgressAll Grades
Mathematics 2017 64% 50% * * * - - - - - - - * *2016 63% 64% * * * - - - - - - - * *
STAARPercent Exceeded ProgressAll Grades
All Subjects 2017 19% 11% * * * - - - - - - - * *2016 17% 15% 16% 16% 16% - - - - - - - 16% 16%
Reading 2017 17% 12% * * * - - - - - - - * *2016 16% 16% * * * - - - - - - - * *
Mathematics 2017 20% 9% * * * - - - - - - - * *2016 17% 15% * * * - - - - - - - * *
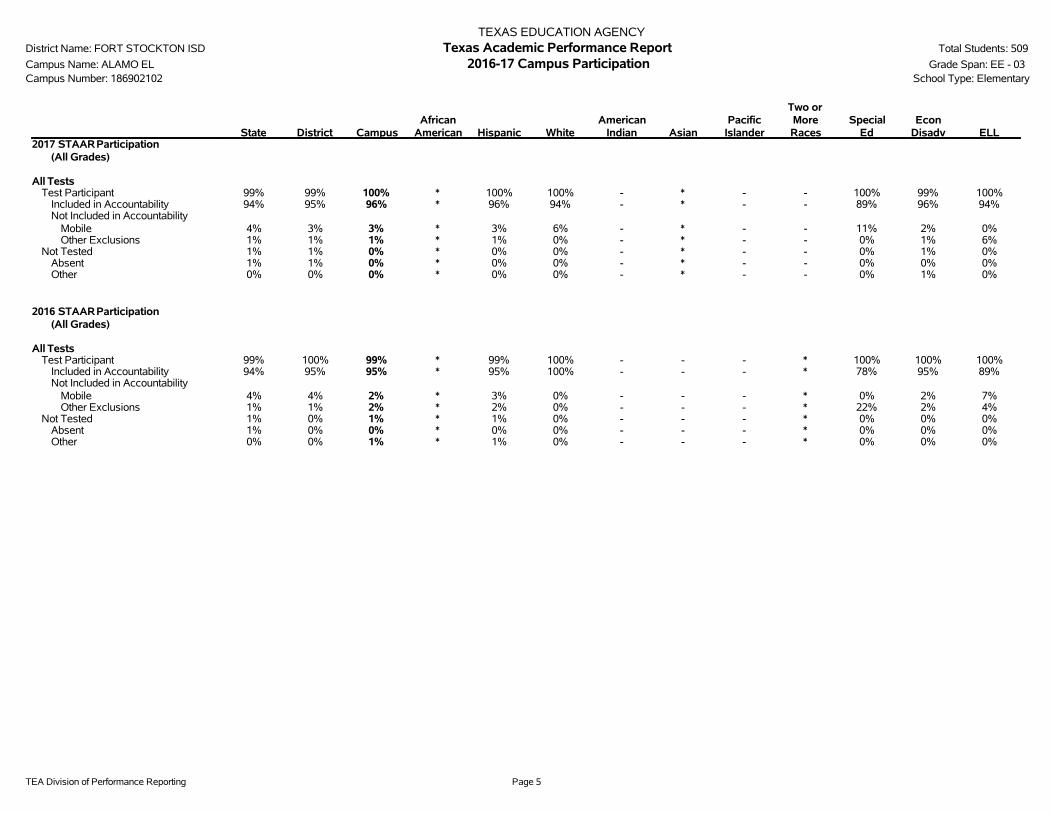
TEA Division of Performance Reporting Page 5
TEXAS EDUCATION AGENCYDistrict Name: FORT STOCKTON ISD Texas Academic Performance Report Total Students: 509
Campus Name: ALAMO EL 2016-17 Campus Participation Grade Span: EE - 03Campus Number: 186902102 School Type: Elementary
State District CampusAfrican
American Hispanic WhiteAmerican
Indian AsianPacific
Islander
Two orMoreRaces
SpecialEd
EconDisadv ELL
2017 STAARParticipation(All Grades)
All TestsTest Participant 99% 99% 100% * 100% 100% - * - - 100% 99% 100%
Included in Accountability 94% 95% 96% * 96% 94% - * - - 89% 96% 94%Not Included in Accountability
Mobile 4% 3% 3% * 3% 6% - * - - 11% 2% 0%Other Exclusions 1% 1% 1% * 1% 0% - * - - 0% 1% 6%
Not Tested 1% 1% 0% * 0% 0% - * - - 0% 1% 0%Absent 1% 1% 0% * 0% 0% - * - - 0% 0% 0%Other 0% 0% 0% * 0% 0% - * - - 0% 1% 0%
2016 STAARParticipation(All Grades)
All TestsTest Participant 99% 100% 99% * 99% 100% - - - * 100% 100% 100%
Included in Accountability 94% 95% 95% * 95% 100% - - - * 78% 95% 89%Not Included in Accountability
Mobile 4% 4% 2% * 3% 0% - - - * 0% 2% 7%Other Exclusions 1% 1% 2% * 2% 0% - - - * 22% 2% 4%
Not Tested 1% 0% 1% * 1% 0% - - - * 0% 0% 0%Absent 1% 0% 0% * 0% 0% - - - * 0% 0% 0%Other 0% 0% 1% * 1% 0% - - - * 0% 0% 0%

TEA Division of Performance Reporting Page 6
TEXAS EDUCATION AGENCYDistrict Name: FORT STOCKTON ISD Texas Academic Performance Report Total Students: 509
Campus Name: ALAMO EL 2016-17 Campus Attendance and Postsecondary Readiness Grade Span: EE - 03Campus Number: 186902102 School Type: Elementary
State District CampusAfrican
American Hispanic WhiteAmerican
Indian AsianPacific
IslanderTwo or
More RacesSpecial
EdEcon
Disadv ELL
Attendance Rate2015-16 95.8% 93.3% 94.5% 94.7% 94.5% 95.2% - * - * 92.2% 94.2% 95.2%2014-15 95.7% 93.6% 94.6% 95.4% 94.4% 95.3% - * - * 92.6% 94.1% 95.2%

TEA Division of Performance Reporting Page 7
TEXAS EDUCATION AGENCYDistrict Name: FORT STOCKTON ISD Texas Academic Performance Report Total Students: 509
Campus Name: ALAMO EL 2016-17 Campus Profile Grade Span: EE - 03Campus Number: 186902102 School Type: Elementary
---------------- Campus ----------------Student Information Count Percent District State
Total Students: 509 100.0% 2,456 5,343,834
Students by Grade:Early Childhood Education 4 0.8% 0.2% 0.3%Pre-Kindergarten 23 4.5% 0.9% 4.2%Kindergarten 110 21.6% 7.9% 7.0%Grade 1 113 22.2% 7.0% 7.4%Grade 2 119 23.4% 9.0% 7.6%Grade 3 140 27.5% 8.8% 7.7%Grade 4 0 0.0% 8.5% 7.7%Grade 5 0 0.0% 6.7% 7.5%Grade 6 0 0.0% 8.6% 7.4%Grade 7 0 0.0% 8.1% 7.4%Grade 8 0 0.0% 6.9% 7.3%Grade 9 0 0.0% 7.4% 8.1%Grade 10 0 0.0% 7.8% 7.4%Grade 11 0 0.0% 5.9% 6.8%Grade 12 0 0.0% 6.1% 6.2%
Ethnic Distribution:African American 7 1.4% 0.7% 12.6%Hispanic 436 85.7% 86.7% 52.4%White 61 12.0% 11.5% 28.1%American Indian 0 0.0% 0.1% 0.4%Asian 3 0.6% 0.7% 4.2%Pacific Islander 0 0.0% 0.0% 0.1%Two or More Races 2 0.4% 0.4% 2.2%
Economically Disadvantaged 372 73.1% 66.7% 59.0%Non-Educationally Disadvantaged 137 26.9% 33.3% 41.0%English Language Learners (ELL) 51 10.0% 9.0% 18.9%Students w/ Disciplinary Placements (2015-2016) 0 0.0% 0.3% 1.4%At-Risk 344 67.6% 62.8% 50.3%
Students with Disabilities by Type of Primary Disability:Total Students with DisabilitiesBy Type of Primary Disability
31
Students with Intellectual Disabilities 11 35.5% 63.9% 44.5%Students with Physical Disabilities 10 32.3% 15.0% 21.9%Students with Autism 8 25.8% 15.0% 12.5%Students with Behavioral Disabilities * * ** 19.9%Students with Non-Categorical Early Childhood * * * 1.3%

TEA Division of Performance Reporting Page 8
TEXAS EDUCATION AGENCYDistrict Name: FORT STOCKTON ISD Texas Academic Performance Report Total Students: 509
Campus Name: ALAMO EL 2016-17 Campus Profile Grade Span: EE - 03Campus Number: 186902102 School Type: Elementary
---------------- Campus ----------------Student Information Count Percent District State
Mobility (2015-2016):Total Mobile Students
By Ethnicity:58 13.9% 12.6% 16.2%
African American 2 0.5%Hispanic 43 10.3%White 11 2.6%American Indian 0 0.0%Asian 0 0.0%Pacific Islander 0 0.0%Two or More Races 2 0.5%

TEA Division of Performance Reporting Page 9
TEXAS EDUCATION AGENCYDistrict Name: FORT STOCKTON ISD Texas Academic Performance Report Total Students: 509
Campus Name: ALAMO EL 2016-17 Campus Profile Grade Span: EE - 03Campus Number: 186902102 School Type: Elementary
--------- Non-Special Education Rates --------- ------------- Special Education Rates -------------Student Information Campus District State Campus District State
Retention Rates by Grade:
Kindergarten 1.9% 1.2% 1.8% 0.0% 0.0% 7.7%Grade 1 1.0% 0.5% 3.8% 0.0% 0.0% 6.8%Grade 2 0.8% 0.5% 2.4% 0.0% 0.0% 3.1%Grade 3 0.0% 1.4% 1.6% 0.0% 0.0% 1.2%Grade 4 - 0.0% 0.8% - 0.0% 0.7%Grade 5 - 0.5% 0.4% - 0.0% 0.7%Grade 6 - 0.5% 0.6% - 0.0% 0.7%Grade 7 - 0.0% 0.7% - 0.0% 0.8%Grade 8 - 0.0% 0.5% - 0.0% 0.9%
Class Size Information Campus District State
Class Size Averages by Grade and Subject (Derived from teacher responsibility records):
Elementary:Kindergarten 17.1 18.7 18.8Grade 1 18.3 16.9 18.8Grade 2 19.8 20.0 18.9Grade 3 20.0 19.7 19.0Grade 4 - 15.7 19.0Grade 5 - 15.9 20.9Grade 6 - 18.3 20.4
Secondary:English/Language Arts - 18.2 16.8Foreign Languages - 19.3 18.7Mathematics - 17.0 18.0Science - 18.9 19.0Social Studies - 20.0 19.4

TEA Division of Performance Reporting Page 10
TEXAS EDUCATION AGENCYDistrict Name: FORT STOCKTON ISD Texas Academic Performance Report Total Students: 509
Campus Name: ALAMO EL 2016-17 Campus Profile Grade Span: EE - 03Campus Number: 186902102 School Type: Elementary
---------------- Campus ----------------Staff Information Count/Average Percent District State
Total Staff 47.5 100.0% 100.0% 100.0%
Professional Staff: 35.7 75.1% 61.0% 64.0%Teachers 31.5 66.3% 46.5% 50.0%Professional Support 3.2 6.7% 9.7% 10.0%Campus Administration (School Leadership) 1.0 2.1% 3.0% 2.9%
Educational Aides: 11.8 24.9% 13.5% 9.6%
Total Minority Staff: 29.4 62.0% 68.8% 49.1%
Teachers by Ethnicity and Sex:African American 0.0 0.0% 1.9% 10.2%Hispanic 16.6 52.9% 50.3% 26.6%White 14.8 47.1% 44.7% 59.8%American Indian 0.0 0.0% 0.6% 0.4%Asian 0.0 0.0% 1.9% 1.5%Pacific Islander 0.0 0.0% 0.0% 0.4%Two or More Races 0.0 0.0% 0.6% 1.1%
Males 1.0 3.2% 27.3% 23.7%Females 30.5 96.8% 72.7% 76.3%
Teachers by Highest Degree Held:No Degree 0.0 0.0% 0.0% 1.2%Bachelors 25.5 80.9% 80.7% 74.5%Masters 6.0 19.1% 18.0% 23.6%Doctorate 0.0 0.0% 1.2% 0.6%
Teachers by Years of Experience:Beginning Teachers 2.0 6.4% 8.1% 7.8%1-5 Years Experience 6.0 19.1% 32.3% 28.0%6-10 Years Experience 7.8 24.9% 16.1% 20.9%11-20 Years Experience 6.6 21.1% 23.6% 27.8%Over 20 Years Experience 9.0 28.6% 19.9% 15.5%
Number of Students per Teacher 16.2 n/a 15.3 15.1

TEA Division of Performance Reporting Page 11
TEXAS EDUCATION AGENCYDistrict Name: FORT STOCKTON ISD Texas Academic Performance Report Total Students: 509
Campus Name: ALAMO EL 2016-17 Campus Profile Grade Span: EE - 03Campus Number: 186902102 School Type: Elementary
Staff Information Campus District State
Experience of Campus Leadership:Average Years Experience of Principals 19.0 19.2 19.5Average Years Experience of Principals with District 12.0 13.2 12.2Average Years Experience of Assistant Principals 0.0 30.0 15.7Average Years Experience of Assistant Principals with District 0.0 19.0 10.1
Average Years Experience of Teachers: 13.1 11.2 10.9Average Years Experience of Teachers with District: 9.4 6.8 7.2
Average Teacher Salary by Years of Experience (regular duties only):Beginning Teachers $41,000 $42,252 $46,1991-5 Years Experience $42,083 $42,749 $48,7796-10 Years Experience $45,411 $47,014 $51,18411-20 Years Experience $50,686 $52,824 $54,396Over 20 Years Experience $55,944 $58,184 $60,913
Average Actual Salaries (regular duties only):Teachers $48,621 $48,844 $52,525Professional Support $47,417 $53,424 $61,728Campus Administration (School Leadership) $77,000 $73,613 $76,471
Instructional Staff Percent: n/a 59.0% 64.6%
Contracted Instructional Staff (not incl. above): 0.0 7.0 2,110.5

TEA Division of Performance Reporting Page 12
TEXAS EDUCATION AGENCYDistrict Name: FORT STOCKTON ISD Texas Academic Performance Report Total Students: 509
Campus Name: ALAMO EL 2016-17 Campus Profile Grade Span: EE - 03Campus Number: 186902102 School Type: Elementary
---------------- Campus ----------------Program Information Count Percent District State
Student Enrollment by Program:Bilingual/ESL Education 49 9.6% 8.7% 18.8%Career & Technical Education 0 0.0% 31.8% 25.0%Gifted & Talented Education 4 0.8% 2.9% 7.8%Special Education 31 6.1% 6.0% 8.8%
Teachers by Program (population served):Bilingual/ESL Education 3.4 10.7% 5.4% 6.0%Career & Technical Education 0.0 0.0% 5.6% 4.5%Compensatory Education 3.0 9.5% 4.1% 2.8%Gifted & Talented Education 0.0 0.0% 0.0% 1.9%Regular Education 23.5 74.8% 76.6% 72.8%Special Education 1.6 5.0% 4.3% 8.6%Other 0.0 0.0% 3.9% 3.4%
Link to: PEIMS Financial Standard Reports/ 2015-2016 Financial Actual Report
' '̂ Indicates that ELL rates at met or exceeded standard and exceeded standard include current and monitored students.'*' Indicates results are masked due to small numbers to protect student confidentiality.'**' When only one group is masked, then the second smallest group is masked (regardless of size).'-' Indicates zero observations reported for this group.'n/a' Indicates data reporting is not applicable for this group.'***' Indicates that rates for Reading and Mathematics are based on the cumulative results from the first and second administrations of STAAR.'?' Indicates that the data for this item were statistically improbable, or were reported outside a reasonable range.

2016-17 Texas Academic Performance Report
District Name: FORT STOCKTON ISD
Campus Name: APACHE EL
Campus Number: 186902104
2017 Accountability Rating: Met Standard
Distinction Designations:
Top 25 Percent: Closing Performance Gaps
Postsecondary Readiness

This page intentionally left blank.

TEA Division of Performance Reporting Page 1
TEXAS EDUCATION AGENCYDistrict Name: FORT STOCKTON ISD Texas Academic Performance Report Total Students: 322
Campus Name: APACHE EL 2016-17 Campus Performance Grade Span: KG - 03Campus Number: 186902104 School Type: Elementary
State District CampusAfrican
American Hispanic WhiteAmerican
Indian AsianPacific
Islander
Two orMore
RacesSpecial
EdEcon
Disadv ELL^STAARPercent at Approaches Grade Level or Above
Grade 3
Reading 2017 73% 71% 79% - 79% 82% - * - - - 77% 54%
2016 73% 72% 72% * 73% 55% * * - - * 69% 57%
Mathematics 2017 78% 78% 84% - 85% 73% - * - - - 83% 77%
2016 75% 76% 79% * 80% 64% * * - - * 77% 71%
STAARPercent at Approaches Grade Level or AboveAll Grades
All Subjects 2017 75% 66% 82% - 82% 77% - * - - - 80% 65%
2016 75% 68% 76% * 77% 59% * * - - * 73% 64%
Reading 2017 72% 65% 79% - 79% 82% - * - - - 77% 54%
2016 73% 66% 72% * 73% 55% * * - - * 69% 57%
Mathematics 2017 79% 71% 84% - 85% 73% - * - - - 83% 77%
2016 76% 73% 79% * 80% 64% * * - - * 77% 71%
STAARPercent at Meets Grade LevelAll Grades
Two or More Subjects 2017 48% 33% 51% - 49% 55% - * - - - 44% *
2016 45% 32% 34% * 38% * * * - - * 30% *
Reading 2017 48% 36% 57% - 55% 64% - * - - - 47% *
2016 46% 35% 37% * 40% * * * - - * 32% *
Mathematics 2017 48% 36% 63% - 61% 73% - * - - - 58% *
2016 43% 38% 53% * 54% * * * - - * 50% 100%
STAARPercent at Masters Grade LevelAll Grades
All Subjects 2017 20% 12% 34% - 32% 41% - * - - - 28% 35%
2016 18% 10% 26% * 28% * * * - - * 23% 21%
Reading 2017 19% 11% 32% - 31% * - * - - - 23% *
2016 17% 10% 20% * 21% * * * - - * 17% *

TEA Division of Performance Reporting Page 2
TEXAS EDUCATION AGENCYDistrict Name: FORT STOCKTON ISD Texas Academic Performance Report Total Students: 322
Campus Name: APACHE EL 2016-17 Campus Performance Grade Span: KG - 03Campus Number: 186902104 School Type: Elementary
State District CampusAfrican
American Hispanic WhiteAmerican
Indian AsianPacific
Islander
Two orMore
RacesSpecial
EdEcon
Disadv ELL^STAARPercent at Masters Grade Level
All Grades
Mathematics 2017 23% 15% 37% - 33% 55% - * - - - 34% 38%
2016 19% 14% 32% * 35% * * * - - * 28% *
STAARPercent Met or Exceeded ProgressAll Grades
All Subjects 2017 61% 51% * - * - - - - - - * *
2016 62% 61% * - * - - - - - - * *
Reading 2017 59% 51% * - * - - - - - - * *
2016 60% 59% * - * - - - - - - * *
Mathematics 2017 64% 50% * - * - - - - - - * *
2016 63% 64% * - * - - - - - - * *
STAARPercent Exceeded ProgressAll Grades
All Subjects 2017 19% 11% * - * - - - - - - * *
2016 17% 15% * - * - - - - - - * *
Reading 2017 17% 12% * - * - - - - - - * *
2016 16% 16% * - * - - - - - - * *
Mathematics 2017 20% 9% * - * - - - - - - * *
2016 17% 15% * - * - - - - - - * *

TEA Division of Performance Reporting Page 3
TEXAS EDUCATION AGENCYDistrict Name: FORT STOCKTON ISD Texas Academic Performance Report Total Students: 322
Campus Name: APACHE EL 2016-17 Campus Performance Grade Span: KG - 03Campus Number: 186902104 Bilingual Education/English as a Second Language (Current Year ELL Students)
State District CampusBilingual
EducationBE-TransEarly Exit
BE-TransLate Exit
BE-DualTwo-Way
BE-DualOne-Way ESL
ESLContent
ESLPull-Out
LEP NoServices
LEP WithServices
TotalELL
STAARPercent at Approaches Grade Level or AboveAll Grades
All Subjects 2017 75% 66% 82% - - - - - 65% 65% - - 65% 65%2016 75% 68% 76% 62% 62% - - - - - - * 62% 64%
Reading 2017 72% 65% 79% - - - - - 54% 54% - - 54% 54%2016 73% 66% 72% 54% 54% - - - - - - * 54% 57%
Mathematics 2017 79% 71% 84% - - - - - 77% 77% - - 77% 77%2016 76% 73% 79% 69% 69% - - - - - - * 69% 71%
STAARPercent at Meets Grade LevelAll Grades
Two or More Subjects 2017 48% 33% 51% - - - - - * * - - * *2016 45% 32% 34% * * - - - - - - * * *
Reading 2017 48% 36% 57% - - - - - * * - - * *2016 46% 35% 37% * * - - - - - - * * *
Mathematics 2017 48% 36% 63% - - - - - * * - - * *2016 43% 38% 53% * * - - - - - - * * 100%
STAARPercent at Masters Grade LevelAll Grades
All Subjects 2017 20% 12% 34% - - - - - 35% 35% - - 35% 35%2016 18% 10% 26% 23% 23% - - - - - - * 23% 21%
Reading 2017 19% 11% 32% - - - - - * * - - * *2016 17% 10% 20% * * - - - - - - * * *
Mathematics 2017 23% 15% 37% - - - - - 38% 38% - - 38% 38%2016 19% 14% 32% * * - - - - - - * * *
STAARPercent Met or Exceeded ProgressAll Grades
All Subjects 2017 61% 51% * - - - - - * * - - * *2016 62% 61% * * * - - - - - - - * *
Reading 2017 59% 51% * - - - - - * * - - * *2016 60% 59% * * * - - - - - - - * *

TEA Division of Performance Reporting Page 4
TEXAS EDUCATION AGENCYDistrict Name: FORT STOCKTON ISD Texas Academic Performance Report Total Students: 322
Campus Name: APACHE EL 2016-17 Campus Performance Grade Span: KG - 03Campus Number: 186902104 Bilingual Education/English as a Second Language (Current Year ELL Students)
State District CampusBilingual
EducationBE-TransEarly Exit
BE-TransLate Exit
BE-DualTwo-Way
BE-DualOne-Way ESL
ESLContent
ESLPull-Out
LEP NoServices
LEP WithServices
TotalELL
STAARPercent Met or Exceeded ProgressAll Grades
Mathematics 2017 64% 50% * - - - - - * * - - * *2016 63% 64% * * * - - - - - - - * *
STAARPercent Exceeded ProgressAll Grades
All Subjects 2017 19% 11% * - - - - - * * - - * *2016 17% 15% * * * - - - - - - - * *
Reading 2017 17% 12% * - - - - - * * - - * *2016 16% 16% * * * - - - - - - - * *
Mathematics 2017 20% 9% * - - - - - * * - - * *2016 17% 15% * * * - - - - - - - * *

TEA Division of Performance Reporting Page 5
TEXAS EDUCATION AGENCYDistrict Name: FORT STOCKTON ISD Texas Academic Performance Report Total Students: 322
Campus Name: APACHE EL 2016-17 Campus Participation Grade Span: KG - 03Campus Number: 186902104 School Type: Elementary
State District CampusAfrican
American Hispanic WhiteAmerican
Indian AsianPacific
Islander
Two orMoreRaces
SpecialEd
EconDisadv ELL
2017 STAARParticipation(All Grades)
All TestsTest Participant 99% 99% 100% - 100% 100% - * - - * 100% 100%
Included in Accountability 94% 95% 90% - 91% 85% - * - - * 91% 93%Not Included in Accountability
Mobile 4% 3% 9% - 7% 15% - * - - * 7% 0%Other Exclusions 1% 1% 1% - 1% 0% - * - - * 2% 7%
Not Tested 1% 1% 0% - 0% 0% - * - - * 0% 0%Absent 1% 1% 0% - 0% 0% - * - - * 0% 0%Other 0% 0% 0% - 0% 0% - * - - * 0% 0%
2016 STAARParticipation(All Grades)
All TestsTest Participant 99% 100% 100% * 100% 100% * * - - * 100% 100%
Included in Accountability 94% 95% 99% * 99% 100% * * - - * 99% 100%Not Included in Accountability
Mobile 4% 4% 1% * 1% 0% * * - - * 1% 0%Other Exclusions 1% 1% 0% * 0% 0% * * - - * 0% 0%
Not Tested 1% 0% 0% * 0% 0% * * - - * 0% 0%Absent 1% 0% 0% * 0% 0% * * - - * 0% 0%Other 0% 0% 0% * 0% 0% * * - - * 0% 0%

TEA Division of Performance Reporting Page 6
TEXAS EDUCATION AGENCYDistrict Name: FORT STOCKTON ISD Texas Academic Performance Report Total Students: 322
Campus Name: APACHE EL 2016-17 Campus Attendance and Postsecondary Readiness Grade Span: KG - 03Campus Number: 186902104 School Type: Elementary
State District CampusAfrican
American Hispanic WhiteAmerican
Indian AsianPacific
IslanderTwo or
More RacesSpecial
EdEcon
Disadv ELL
Attendance Rate2015-16 95.8% 93.3% 94.5% * 94.5% 94.7% * * - * 94.8% 94.2% 94.5%2014-15 95.7% 93.6% 94.4% * 94.5% 94.0% * * - * 96.1% 94.5% 94.1%

TEA Division of Performance Reporting Page 7
TEXAS EDUCATION AGENCYDistrict Name: FORT STOCKTON ISD Texas Academic Performance Report Total Students: 322
Campus Name: APACHE EL 2016-17 Campus Profile Grade Span: KG - 03Campus Number: 186902104 School Type: Elementary
---------------- Campus ----------------Student Information Count Percent District State
Total Students: 322 100.0% 2,456 5,343,834
Students by Grade:Early Childhood Education 0 0.0% 0.2% 0.3%Pre-Kindergarten 0 0.0% 0.9% 4.2%Kindergarten 84 26.1% 7.9% 7.0%Grade 1 59 18.3% 7.0% 7.4%Grade 2 102 31.7% 9.0% 7.6%Grade 3 77 23.9% 8.8% 7.7%Grade 4 0 0.0% 8.5% 7.7%Grade 5 0 0.0% 6.7% 7.5%Grade 6 0 0.0% 8.6% 7.4%Grade 7 0 0.0% 8.1% 7.4%Grade 8 0 0.0% 6.9% 7.3%Grade 9 0 0.0% 7.4% 8.1%Grade 10 0 0.0% 7.8% 7.4%Grade 11 0 0.0% 5.9% 6.8%Grade 12 0 0.0% 6.1% 6.2%
Ethnic Distribution:African American 2 0.6% 0.7% 12.6%Hispanic 274 85.1% 86.7% 52.4%White 37 11.5% 11.5% 28.1%American Indian 2 0.6% 0.1% 0.4%Asian 5 1.6% 0.7% 4.2%Pacific Islander 0 0.0% 0.0% 0.1%Two or More Races 2 0.6% 0.4% 2.2%
Economically Disadvantaged 226 70.2% 66.7% 59.0%Non-Educationally Disadvantaged 96 29.8% 33.3% 41.0%English Language Learners (ELL) 44 13.7% 9.0% 18.9%Students w/ Disciplinary Placements (2015-2016) 1 0.3% 0.3% 1.4%At-Risk 196 60.9% 62.8% 50.3%
Students with Disabilities by Type of Primary Disability:Total Students with DisabilitiesBy Type of Primary Disability
11
Students with Intellectual Disabilities 0 0.0% 63.9% 44.5%Students with Physical Disabilities 9 81.8% 15.0% 21.9%Students with Autism * * 15.0% 12.5%Students with Behavioral Disabilities * * ** 19.9%Students with Non-Categorical Early Childhood 0 0.0% * 1.3%

TEA Division of Performance Reporting Page 8
TEXAS EDUCATION AGENCYDistrict Name: FORT STOCKTON ISD Texas Academic Performance Report Total Students: 322
Campus Name: APACHE EL 2016-17 Campus Profile Grade Span: KG - 03Campus Number: 186902104 School Type: Elementary
---------------- Campus ----------------Student Information Count Percent District State
Mobility (2015-2016):Total Mobile Students
By Ethnicity:31 10.4% 12.6% 16.2%
African American 0 0.0%Hispanic 22 7.4%White 6 2.0%American Indian 0 0.0%Asian 1 0.3%Pacific Islander 0 0.0%Two or More Races 2 0.7%

TEA Division of Performance Reporting Page 9
TEXAS EDUCATION AGENCYDistrict Name: FORT STOCKTON ISD Texas Academic Performance Report Total Students: 322
Campus Name: APACHE EL 2016-17 Campus Profile Grade Span: KG - 03Campus Number: 186902104 School Type: Elementary
--------- Non-Special Education Rates --------- ------------- Special Education Rates -------------Student Information Campus District State Campus District State
Retention Rates by Grade:
Kindergarten 0.0% 1.2% 1.8% 0.0% 0.0% 7.7%Grade 1 0.0% 0.5% 3.8% 0.0% 0.0% 6.8%Grade 2 0.0% 0.5% 2.4% 0.0% 0.0% 3.1%Grade 3 3.2% 1.4% 1.6% 0.0% 0.0% 1.2%Grade 4 - 0.0% 0.8% - 0.0% 0.7%Grade 5 - 0.5% 0.4% - 0.0% 0.7%Grade 6 - 0.5% 0.6% - 0.0% 0.7%Grade 7 - 0.0% 0.7% - 0.0% 0.8%Grade 8 - 0.0% 0.5% - 0.0% 0.9%
Class Size Information Campus District State
Class Size Averages by Grade and Subject (Derived from teacher responsibility records):
Elementary:Kindergarten 21.7 18.7 18.8Grade 1 14.8 16.9 18.8Grade 2 20.4 20.0 18.9Grade 3 19.1 19.7 19.0Grade 4 - 15.7 19.0Grade 5 - 15.9 20.9Grade 6 - 18.3 20.4
Secondary:English/Language Arts - 18.2 16.8Foreign Languages - 19.3 18.7Mathematics - 17.0 18.0Science - 18.9 19.0Social Studies - 20.0 19.4

TEA Division of Performance Reporting Page 10
TEXAS EDUCATION AGENCYDistrict Name: FORT STOCKTON ISD Texas Academic Performance Report Total Students: 322
Campus Name: APACHE EL 2016-17 Campus Profile Grade Span: KG - 03Campus Number: 186902104 School Type: Elementary
---------------- Campus ----------------Staff Information Count/Average Percent District State
Total Staff 29.6 100.0% 100.0% 100.0%
Professional Staff: 23.6 79.7% 61.0% 64.0%Teachers 21.3 71.7% 46.5% 50.0%Professional Support 1.4 4.6% 9.7% 10.0%Campus Administration (School Leadership) 1.0 3.4% 3.0% 2.9%
Educational Aides: 6.0 20.3% 13.5% 9.6%
Total Minority Staff: 21.3 71.7% 68.8% 49.1%
Teachers by Ethnicity and Sex:African American 0.0 0.0% 1.9% 10.2%Hispanic 15.1 71.0% 50.3% 26.6%White 6.2 29.0% 44.7% 59.8%American Indian 0.0 0.0% 0.6% 0.4%Asian 0.0 0.0% 1.9% 1.5%Pacific Islander 0.0 0.0% 0.0% 0.4%Two or More Races 0.0 0.0% 0.6% 1.1%
Males 0.0 0.0% 27.3% 23.7%Females 21.3 100.0% 72.7% 76.3%
Teachers by Highest Degree Held:No Degree 0.0 0.0% 0.0% 1.2%Bachelors 19.3 90.6% 80.7% 74.5%Masters 2.0 9.4% 18.0% 23.6%Doctorate 0.0 0.0% 1.2% 0.6%
Teachers by Years of Experience:Beginning Teachers 1.0 4.7% 8.1% 7.8%1-5 Years Experience 7.0 32.9% 32.3% 28.0%6-10 Years Experience 4.2 19.6% 16.1% 20.9%11-20 Years Experience 7.0 32.9% 23.6% 27.8%Over 20 Years Experience 2.1 9.8% 19.9% 15.5%
Number of Students per Teacher 15.2 n/a 15.3 15.1

TEA Division of Performance Reporting Page 11
TEXAS EDUCATION AGENCYDistrict Name: FORT STOCKTON ISD Texas Academic Performance Report Total Students: 322
Campus Name: APACHE EL 2016-17 Campus Profile Grade Span: KG - 03Campus Number: 186902104 School Type: Elementary
Staff Information Campus District State
Experience of Campus Leadership:Average Years Experience of Principals 25.0 19.2 19.5Average Years Experience of Principals with District 24.0 13.2 12.2Average Years Experience of Assistant Principals 0.0 30.0 15.7Average Years Experience of Assistant Principals with District 0.0 19.0 10.1
Average Years Experience of Teachers: 10.0 11.2 10.9Average Years Experience of Teachers with District: 7.8 6.8 7.2
Average Teacher Salary by Years of Experience (regular duties only):Beginning Teachers $41,000 $42,252 $46,1991-5 Years Experience $42,429 $42,749 $48,7796-10 Years Experience $45,268 $47,014 $51,18411-20 Years Experience $50,121 $52,824 $54,396Over 20 Years Experience $56,147 $58,184 $60,913
Average Actual Salaries (regular duties only):Teachers $46,794 $48,844 $52,525Professional Support $34,374 $53,424 $61,728Campus Administration (School Leadership) $82,000 $73,613 $76,471
Instructional Staff Percent: n/a 59.0% 64.6%
Contracted Instructional Staff (not incl. above): 0.0 7.0 2,110.5
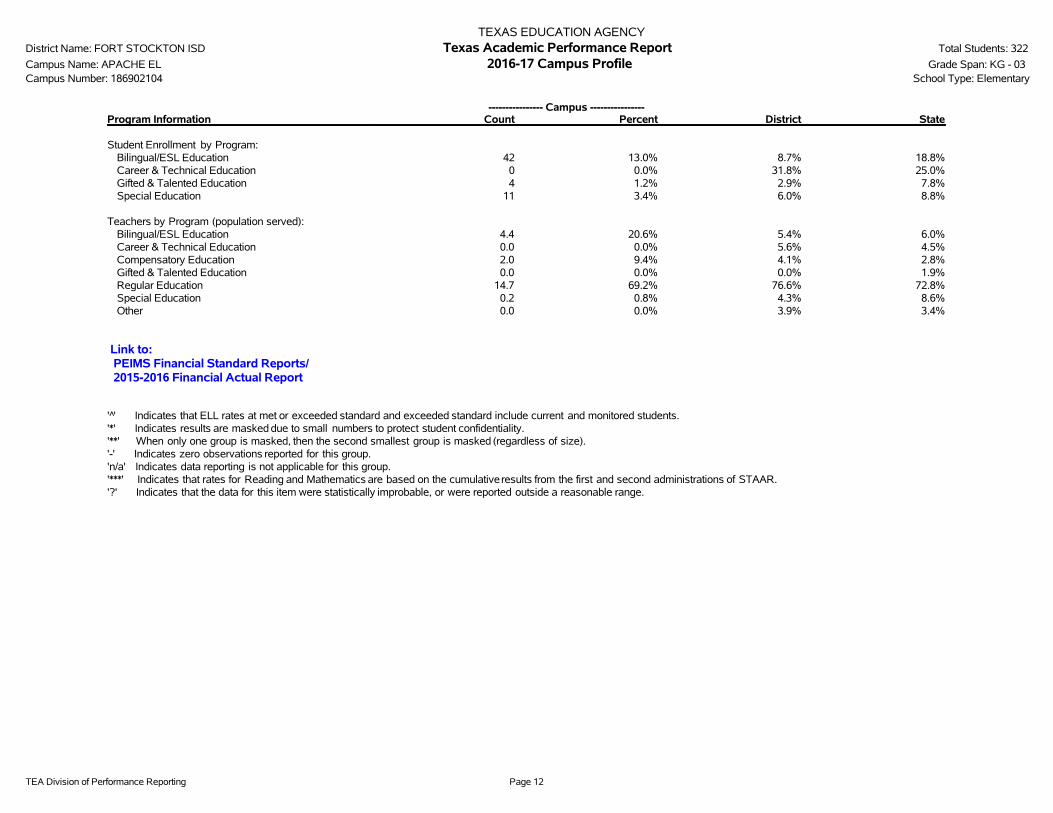
TEA Division of Performance Reporting Page 12
TEXAS EDUCATION AGENCYDistrict Name: FORT STOCKTON ISD Texas Academic Performance Report Total Students: 322
Campus Name: APACHE EL 2016-17 Campus Profile Grade Span: KG - 03Campus Number: 186902104 School Type: Elementary
---------------- Campus ----------------Program Information Count Percent District State
Student Enrollment by Program:Bilingual/ESL Education 42 13.0% 8.7% 18.8%Career & Technical Education 0 0.0% 31.8% 25.0%Gifted & Talented Education 4 1.2% 2.9% 7.8%Special Education 11 3.4% 6.0% 8.8%
Teachers by Program (population served):Bilingual/ESL Education 4.4 20.6% 5.4% 6.0%Career & Technical Education 0.0 0.0% 5.6% 4.5%Compensatory Education 2.0 9.4% 4.1% 2.8%Gifted & Talented Education 0.0 0.0% 0.0% 1.9%Regular Education 14.7 69.2% 76.6% 72.8%Special Education 0.2 0.8% 4.3% 8.6%Other 0.0 0.0% 3.9% 3.4%
Link to: PEIMS Financial Standard Reports/ 2015-2016 Financial Actual Report
' '̂ Indicates that ELL rates at met or exceeded standard and exceeded standard include current and monitored students.'*' Indicates results are masked due to small numbers to protect student confidentiality.'**' When only one group is masked, then the second smallest group is masked (regardless of size).'-' Indicates zero observations reported for this group.'n/a' Indicates data reporting is not applicable for this group.'***' Indicates that rates for Reading and Mathematics are based on the cumulative results from the first and second administrations of STAAR.'?' Indicates that the data for this item were statistically improbable, or were reported outside a reasonable range.

11/27/2017 2015-2016 Actual Financial data
https://rptsvr1.tea.texas.gov/cgi/sas/broker?_service=marykay&_program=sfadhoc.actual_report_2016.sas&_service=appserv&_debug=0&who_box=186902 1/3
2015-2016 Actual Financial dataTotals for Fort Stockton ISD (186902)
Total Enrolled Students in Membership: 2,451
District StateGeneral Fund % Per Student All Funds % Per Student All Funds % Per Student
ReceiptsTotal Revenue 23,732,376 100.00% 9,683 29,551,775 100.00% 12,057 58,796,907,294 100.00% 11,133Local Tax 10,767,157 45.37% 4,393 13,686,874 46.31% 5,584 26,455,661,555 44.99% 5,009Other Local and Intermediate 1,883,819 7.94% 769 2,143,901 7.25% 875 2,349,072,062 4.00% 445State 11,049,793 46.56% 4,508 11,335,118 38.36% 4,625 24,001,676,516 40.82% 4,545Federal 31,607 0.13% 13 2,385,882 8.07% 973 5,990,497,161 10.19% 1,134
Total Receipts 23,790,495 100.00% 9,706 39,359,656 100.00% 16,059 79,076,472,196 100.00% 14,973Total Revenue 23,732,376 99.76% 9,683 29,551,775 75.08% 12,057 58,796,907,294 100.00% 11,133Recapture 0 0.00% 0 0 0.00% 0 1,659,235,826 2.10% 314Total Other Resources 58,119 0.24% 24 9,807,881 24.92% 4,002 18,620,329,076 23.55% 3,526
Fund Balances (for ISDs)Total Fund Balance** 36,322,188 153.05% 14,819 44,321,517 149.98% 18,083 31,967,587,564 56.70% 6,346Nonspendable Fund Balance 0 0.00% 0 0 0.00% 0 218,493,906 0.39% 43Restricted Fund Balance 0 0.00% 0 7,999,329 27.07% 3,264 14,718,290,785 26.11% 2,922Commi�ed Fund Balance 14,705,608 61.96% 6,000 14,705,608 49.76% 6,000 3,375,181,653 5.99% 670Assigned Fund Balance 34,265 0.14% 14 34,265 0.12% 14 2,279,728,046 4.04% 453Unassigned Fund Balance 21,582,315 90.94% 8,806 21,582,315 73.03% 8,806 11,375,893,174 20.18% 2,258
DisbursementsTotal ExpendituresBY OBJECT 22,837,328 100.00% 9,318 35,236,891 100.00% 14,377 64,767,380,510 100.00% 12,264
Payroll (Objects 6100) 15,555,947 68.12% 6,347 17,682,674 50.18% 7,214 38,907,642,648 60.07% 7,367Other Opera�ng (Objects 6200-6400) 4,431,099 19.40% 1,808 5,690,800 16.15% 2,322 10,955,841,240 16.92% 2,074
Debt Service (Objects 6500) 29,086 0.13% 12 3,057,382 8.68% 1,247 7,300,880,526 11.27% 1,382Capital Outlay (Objects 6600) 2,821,196 12.35% 1,151 8,806,035 24.99% 3,593 7,603,016,096 11.74% 1,440
BY FUNCTION (Objects 6100-6400only)
Debt Service (71) 0 0 0 0 149 281 0

11/27/2017 2015-2016 Actual Financial data
https://rptsvr1.tea.texas.gov/cgi/sas/broker?_service=marykay&_program=sfadhoc.actual_report_2016.sas&_service=appserv&_debug=0&who_box=186902 2/3
Debt Service (71) 0 0 0 0 149,281 0
Facili�es Acquisi�on &Construc�on (81) 0 0 0 0 363,840,575 69
Total Opera�ng Expenditures 19,987,046 100.00% 8,155 23,373,474 100.00% 9,536 49,499,494,032 100.00% 9,373Instruc�on (11,95) 10,283,422 51.45% 4,196 11,896,268 50.90% 4,854 28,078,212,757 56.72% 5,317Instruc�onal Res Media (12) 112,317 0.56% 46 112,317 0.48% 46 596,968,139 1.21% 113Curriculum/Staff Develop (13) 285,430 1.43% 116 333,176 1.43% 136 1,079,964,071 2.18% 204Instruc�onal Leadership (21) 340,259 1.70% 139 345,342 1.48% 141 756,662,275 1.53% 143School Leadership (23) 1,286,985 6.44% 525 1,286,985 5.51% 525 2,871,203,149 5.80% 544Guidance Counseling Svcs (31) 706,267 3.53% 288 731,769 3.13% 299 1,764,695,464 3.57% 334Social Work Services (32) 0 0.00% 0 74,913 0.32% 31 131,529,766 0.27% 25Health Services (33) 232,404 1.16% 95 233,354 1.00% 95 496,777,676 1.00% 94Transporta�on (34) 625,831 3.13% 255 639,006 2.73% 261 1,406,946,577 2.84% 266Food (35) 8,307 0.04% 3 1,286,223 5.50% 525 2,794,517,327 5.65% 529Extracurricular (36) 1,122,269 5.61% 458 1,122,269 4.80% 458 1,452,331,030 2.93% 275General Administra�on(41,92) 1,137,348 5.69% 464 1,139,748 4.88% 465 1,545,042,287 3.12% 293
Plant Maint/Opera�on (51) 3,130,547 15.66% 1,277 3,330,319 14.25% 1,359 4,902,348,081 9.90% 928Security/Monitoring (52) 43,695 0.22% 18 109,971 0.47% 45 443,468,185 0.90% 84Data Processing Services (53) 495,137 2.48% 202 541,292 2.32% 221 956,927,919 1.93% 181Community Services (61) 176,828 0.88% 72 190,522 0.82% 78 221,899,329 0.00% 42
Total Disbursements 23,131,292 100.00% 9,437 35,530,855 100.00% 14,496 76,944,709,361 100.00% 14,569Total Expenditures 22,837,328 98.73% 9,318 35,236,891 99.17% 14,377 64,767,380,510 100.00% 12,264Recapture 0 0.00% 0 0 0.00% 0 1,659,235,826 2.10% 314Total Other Uses 0 0.00% 0 0 0.00% 0 9,922,469,353 12.90% 1,879Intergovernmental Charge 293,964 1.27% 120 293,964 0.83% 120 595,623,672 1.20% 113
Program ExpendituresOpera�ng Expenditures - Program 14,193,630 100.00% 5,791 15,967,173 100.00% 6,515 36,778,299,808 100.00% 6,964Regular 9,002,054 63.42% 3,673 9,316,497 58.35% 3,801 22,101,503,025 60.09% 4,185Gi�ed and Talented 68,021 0.48% 28 68,021 0.43% 28 412,775,016 1.12% 78Career and Technical 764,067 5.38% 312 790,934 4.95% 323 1,403,587,116 3.82% 266Students with Disabili�es 1,104,974 7.78% 451 1,681,094 10.53% 686 5,595,169,798 15.21% 1,059Accelerated Educa�on 213,424 1.50% 87 484,375 3.03% 198 1,773,289,297 4.82% 336Bilingual 219,561 1.55% 90 247,867 1.55% 101 836,638,263 2.27% 158Nondisc Alt Ed-AEP Basic Serv 0 0.00% 0 0 0.00% 0 143,556,319 0.39% 27Disc Alt Ed-DAEP Basic Serv 81,345 0.57% 33 81,345 0.51% 33 223,027,599 0.61% 42Disc Alt Ed-DAEP Supplemental 0 0.00% 0 0 0.00% 0 26,121,857 0.07% 5T1 A Schoolwide-St Comp>=40% 1,614,464 11.37% 659 2,171,320 13.60% 886 1,947,322,924 5.29% 369

11/27/2017 2015-2016 Actual Financial data
https://rptsvr1.tea.texas.gov/cgi/sas/broker?_service=marykay&_program=sfadhoc.actual_report_2016.sas&_service=appserv&_debug=0&who_box=186902 3/3
Athle�cs/Related Ac�vi�es 849,033 5.98% 346 849,033 5.32% 346 970,746,104 2.64% 184High School Allotment 214,950 1.51% 88 214,950 1.35% 88 446,570,319 1.21% 85Prekindergarten 61,737 0.43% 25 61,737 0.39% 25 897,992,171 2.44% 170
District State
Instruc�onal Expenditure Ra�o 55.9% 63.6%
Tax Rates2015 (current tax year) Tax RatesMaintenance and Opera�ons 1.0400 1.0812Interest and Sinking Funds 0.2190 0.1991Total Tax Rate 1.2590 1.2803
2014 Tax Year State Cer�fied Property ValuesAmount Percent Amount Percent
Property Value 1,149,642,663 N/A 2,035,667,288,244 N/AProperty Value per pupil 469,050 N/A 404,762 N/AProperty Value by category:Business 769,415,410 51.14% 782,956,483,668 35.20%Residen�al 224,943,760 14.95% 1,212,041,953,115 54.50%Land 35,624,090 2.37% 58,960,007,888 2.65%Oil and Gas 466,712,530 31.02% 158,021,121,792 7.11%Other 7,971,840 0.53% 12,102,856,856 0.54%
Unassigned Fund Balance percentage of total budgeted expenditures2015-2016 School Districts' GeneralFund Unassigned Fund Balance*** 21,582,315 11,332,627,827
2015-2016 School Districts' GeneralFund Total Budgeted Expenditures 25,725,318 42,855,266,369
2015-2016 School Districts' Percent ofTotal Budgeted Expenditures 83.9% 26.4%
** Fund balance percentages are calculated by dividing the fund balance by either the general revenue or all funds. The percentages illustrate the size of the fund balance in relation to total revenues. Charter schools report net assets rather than fund balances. *** The TEA does not have encumbrance data to subtract from the fund balances.

Note: Some amounts may not total due to rounding.
TEXAS EDUCATION AGENCY2015-2016 PEIMS Actual Financial Data, Organized by Campus
Note: Some amounts may not total due to rounding.
TEXAS EDUCATION AGENCY2015-2016 PEIMS Actual Financial Data, Organized by Campus
School Campus:Alamo El District:FORT STOCKTONISD County:Pecos CountyCampus Number:186902102 Total Membership: 529
GeneralFund %
PerStudent
AllFunds %
PerStudent
Expenditures by Object (Objects 6100-6600)
Total Expenditures 2,336,212 100.00 4,416 2,902,282 100.00 5,486
Operating-Payroll 2,023,293 86.61 3,825 2,521,217 86.87 4,766
Other Operating 304,592 13.04 576 352,151 12.13 666
Non-Operating(Equipt/Supplies) 8,327 0.36 16 28,914 1.00 55
Expenditures by Function (Objects 6100-6400 Only)
Total Operating Expenditures 2,327,885 100.00 4,401 2,873,368 100.00 5,432
Instruction (11,95) * 1,718,392 73.82 3,248 2,263,875 78.79 4,280
Instructional Res/Media (12) * 21,720 0.93 41 21,720 0.76 41
Curriculum/Staff Develop (13) * 41,427 1.78 78 41,427 1.44 78
Instructional Leadership (21) * 25,361 1.09 48 25,361 0.88 48
School Leadership (23) * 162,362 6.97 307 162,362 5.65 307
Guidance/Counseling Svcs (31) * 69,733 3.00 132 69,733 2.43 132
Social Work Services (32) * 0 0.00 0 0 0.00 0
Health Services (33) * 41,487 1.78 78 41,487 1.44 78
Food (35) ** 0 0.00 0 0 0.00 0
Extracurricular (36) * 0 0.00 0 0 0.00 0
Plant Maint/Operation (51) * ** 245,963 10.57 465 245,963 8.56 465
Security/Monitoring (52) * ** 1,440 0.06 3 1,440 0.05 3
Data Processing Svcs (53)* ** 0 0.00 0 0 0.00 0
Program expenditures by Program (Objects 6100-6400 only)
Total Operating Expenditures 2,080,482 100.00 3,933 2,625,965 100.00 4,964
Regular 1,647,334 79.18 3,114 1,694,893 64.54 3,204
Gifted & Talented 114 0.01 0 114 0.00 0
Career & Technical 0 0.00 0 0 0.00 0
Students with Disabilities 4,221 0.20 8 279,310 10.64 528
Accelerated Education 4,400 0.21 8 62,635 2.39 118
Bilingual 150 0.01 0 150 0.01 0
Nondisc Alted-AEP Basic Serv 0 0.00 0 0 0.00 0
Disc Alted-DAEP Basic Serv 0 0.00 0 0 0.00 0
Disc Alted-DAEP Supplemental 0 0.00 0 0 0.00 0
*Please refer to Sections 1.4.13-1.4.13.2 in the Financial Accountability System Resource Guide for information concerning requirements foraccounting for expenditures by campus.**Please note that, in many instances, expenditures under function codes 34-99 are not directly attributable to a specific campus. It isrecommended that district-level data(http://tea.texas.gov/financialstandardreports/) be used for the analysis of costs reported by comparable school districts.

Note: Some amounts may not total due to rounding.
TEXAS EDUCATION AGENCY2015-2016 PEIMS Actual Financial Data, Organized by Campus
School Campus:Alamo El District:FORT STOCKTONISD County:Pecos CountyCampus Number:186902102 Total Membership: 529
GeneralFund %
PerStudent
AllFunds %
PerStudent
T1 A Schoolwide-St Comp >=40% 362,526 17.43 685 527,126 20.07 996
Athletic Programming 0 0.00 0 0 0.00 0
High School Allotment 0 0.00 0 0 0.00 0
Prekindergarten 61,737 2.97 117 61,737 2.35 117
*Please refer to Sections 1.4.13-1.4.13.2 in the Financial Accountability System Resource Guide for information concerning requirements foraccounting for expenditures by campus.**Please note that, in many instances, expenditures under function codes 34-99 are not directly attributable to a specific campus. It isrecommended that district-level data(http://tea.texas.gov/financialstandardreports/) be used for the analysis of costs reported by comparable school districts.

Note: Some amounts may not total due to rounding.
TEXAS EDUCATION AGENCY2015-2016 PEIMS Actual Financial Data, Organized by Campus
Note: Some amounts may not total due to rounding.
TEXAS EDUCATION AGENCY2015-2016 PEIMS Actual Financial Data, Organized by Campus
School Campus:Apache El District:FORT STOCKTONISD County:Pecos CountyCampus Number:186902104 Total Membership: 348
GeneralFund %
PerStudent
AllFunds %
PerStudent
Expenditures by Object (Objects 6100-6600)
Total Expenditures 1,744,541 100.00 5,013 2,017,101 100.00 5,796
Operating-Payroll 1,512,080 86.67 4,345 1,750,967 86.81 5,032
Other Operating 232,461 13.33 668 266,134 13.19 765
Non-Operating(Equipt/Supplies) 0 0.00 0 0 0.00 0
Expenditures by Function (Objects 6100-6400 Only)
Total Operating Expenditures 1,744,541 100.00 5,013 2,017,101 100.00 5,796
Instruction (11,95) * 1,190,444 68.24 3,421 1,463,004 72.53 4,204
Instructional Res/Media (12) * 20,151 1.16 58 20,151 1.00 58
Curriculum/Staff Develop (13) * 31,828 1.82 91 31,828 1.58 91
Instructional Leadership (21) * 20,120 1.15 58 20,120 1.00 58
School Leadership (23) * 158,471 9.08 455 158,471 7.86 455
Guidance/Counseling Svcs (31) * 74,728 4.28 215 74,728 3.70 215
Social Work Services (32) * 0 0.00 0 0 0.00 0
Health Services (33) * 42,021 2.41 121 42,021 2.08 121
Food (35) ** 0 0.00 0 0 0.00 0
Extracurricular (36) * 0 0.00 0 0 0.00 0
Plant Maint/Operation (51) * ** 204,858 11.74 589 204,858 10.16 589
Security/Monitoring (52) * ** 1,920 0.11 6 1,920 0.10 6
Data Processing Svcs (53)* ** 0 0.00 0 0 0.00 0
Program expenditures by Program (Objects 6100-6400 only)
Total Operating Expenditures 1,537,763 100.00 4,419 1,810,323 100.00 5,202
Regular 1,226,582 79.76 3,525 1,260,255 69.61 3,621
Gifted & Talented 0 0.00 0 0 0.00 0
Career & Technical 0 0.00 0 0 0.00 0
Students with Disabilities 5,137 0.33 15 5,137 0.28 15
Accelerated Education 0 0.00 0 95,259 5.26 274
Bilingual 0 0.00 0 0 0.00 0
Nondisc Alted-AEP Basic Serv 0 0.00 0 0 0.00 0
Disc Alted-DAEP Basic Serv 0 0.00 0 0 0.00 0
Disc Alted-DAEP Supplemental 0 0.00 0 0 0.00 0
*Please refer to Sections 1.4.13-1.4.13.2 in the Financial Accountability System Resource Guide for information concerning requirements foraccounting for expenditures by campus.**Please note that, in many instances, expenditures under function codes 34-99 are not directly attributable to a specific campus. It isrecommended that district-level data(http://tea.texas.gov/financialstandardreports/) be used for the analysis of costs reported by comparable school districts.

Note: Some amounts may not total due to rounding.
TEXAS EDUCATION AGENCY2015-2016 PEIMS Actual Financial Data, Organized by Campus
School Campus:Apache El District:FORT STOCKTONISD County:Pecos CountyCampus Number:186902104 Total Membership: 348
GeneralFund %
PerStudent
AllFunds %
PerStudent
T1 A Schoolwide-St Comp >=40% 306,044 19.90 879 449,672 24.84 1,292
Athletic Programming 0 0.00 0 0 0.00 0
High School Allotment 0 0.00 0 0 0.00 0
Prekindergarten 0 0.00 0 0 0.00 0
*Please refer to Sections 1.4.13-1.4.13.2 in the Financial Accountability System Resource Guide for information concerning requirements foraccounting for expenditures by campus.**Please note that, in many instances, expenditures under function codes 34-99 are not directly attributable to a specific campus. It isrecommended that district-level data(http://tea.texas.gov/financialstandardreports/) be used for the analysis of costs reported by comparable school districts.

Note: Some amounts may not total due to rounding.
TEXAS EDUCATION AGENCY2015-2016 PEIMS Actual Financial Data, Organized by Campus
Note: Some amounts may not total due to rounding.
TEXAS EDUCATION AGENCY2015-2016 PEIMS Actual Financial Data, Organized by Campus
School Campus:Fort Stockton H S District:FORT STOCKTONISD County:Pecos CountyCampus Number:186902001 Total Membership: 652
GeneralFund %
PerStudent
AllFunds %
PerStudent
Expenditures by Object (Objects 6100-6600)
Total Expenditures 5,382,451 100.00 8,255 5,546,666 100.00 8,507
Operating-Payroll 4,262,148 79.19 6,537 4,375,777 78.89 6,711
Other Operating 1,077,197 20.01 1,652 1,127,783 20.33 1,730
Non-Operating(Equipt/Supplies) 43,106 0.80 66 43,106 0.78 66
Expenditures by Function (Objects 6100-6400 Only)
Total Operating Expenditures 5,339,345 100.00 8,189 5,503,560 100.00 8,441
Instruction (11,95) * 3,320,854 62.20 5,093 3,459,567 62.86 5,306
Instructional Res/Media (12) * 26,397 0.49 40 26,397 0.48 40
Curriculum/Staff Develop (13) * 92,547 1.73 142 92,547 1.68 142
Instructional Leadership (21) * 128,391 2.40 197 128,391 2.33 197
School Leadership (23) * 490,412 9.18 752 490,412 8.91 752
Guidance/Counseling Svcs (31) * 269,188 5.04 413 294,690 5.35 452
Social Work Services (32) * 0 0.00 0 0 0.00 0
Health Services (33) * 54,631 1.02 84 54,631 0.99 84
Food (35) ** 0 0.00 0 0 0.00 0
Extracurricular (36) * 360,001 6.74 552 360,001 6.54 552
Plant Maint/Operation (51) * ** 586,962 10.99 900 586,962 10.67 900
Security/Monitoring (52) * ** 9,962 0.19 15 9,962 0.18 15
Data Processing Svcs (53)* ** 0 0.00 0 0 0.00 0
Program expenditures by Program (Objects 6100-6400 only)
Total Operating Expenditures 4,382,420 100.00 6,722 4,546,635 100.00 6,973
Regular 2,475,463 56.49 3,797 2,524,684 55.53 3,872
Gifted & Talented 0 0.00 0 0 0.00 0
Career & Technical 727,997 16.61 1,117 754,864 16.60 1,158
Students with Disabilities 472,628 10.78 725 511,090 11.24 784
Accelerated Education 33,696 0.77 52 33,696 0.74 52
Bilingual 114,002 2.60 175 114,002 2.51 175
Nondisc Alted-AEP Basic Serv 0 0.00 0 0 0.00 0
Disc Alted-DAEP Basic Serv 41,741 0.95 64 41,741 0.92 64
Disc Alted-DAEP Supplemental 0 0.00 0 0 0.00 0
*Please refer to Sections 1.4.13-1.4.13.2 in the Financial Accountability System Resource Guide for information concerning requirements foraccounting for expenditures by campus.**Please note that, in many instances, expenditures under function codes 34-99 are not directly attributable to a specific campus. It isrecommended that district-level data(http://tea.texas.gov/financialstandardreports/) be used for the analysis of costs reported by comparable school districts.

Note: Some amounts may not total due to rounding.
TEXAS EDUCATION AGENCY2015-2016 PEIMS Actual Financial Data, Organized by Campus
School Campus:Fort Stockton H S District:FORT STOCKTONISD County:Pecos CountyCampus Number:186902001 Total Membership: 652
GeneralFund %
PerStudent
AllFunds %
PerStudent
T1 A Schoolwide-St Comp >=40% 301,943 6.89 463 351,608 7.73 539
Athletic Programming 0 0.00 0 0 0.00 0
High School Allotment 214,950 4.90 330 214,950 4.73 330
Prekindergarten 0 0.00 0 0 0.00 0
*Please refer to Sections 1.4.13-1.4.13.2 in the Financial Accountability System Resource Guide for information concerning requirements foraccounting for expenditures by campus.**Please note that, in many instances, expenditures under function codes 34-99 are not directly attributable to a specific campus. It isrecommended that district-level data(http://tea.texas.gov/financialstandardreports/) be used for the analysis of costs reported by comparable school districts.

Note: Some amounts may not total due to rounding.
TEXAS EDUCATION AGENCY2015-2016 PEIMS Actual Financial Data, Organized by Campus
Note: Some amounts may not total due to rounding.
TEXAS EDUCATION AGENCY2015-2016 PEIMS Actual Financial Data, Organized by Campus
School Campus:Fort Stockton Middle District:FORT STOCKTONISD County:Pecos CountyCampus Number:186902041 Total Membership: 538
GeneralFund %
PerStudent
AllFunds %
PerStudent
Expenditures by Object (Objects 6100-6600)
Total Expenditures 3,617,994 100.00 6,725 3,934,886 100.00 7,314
Operating-Payroll 3,154,358 87.19 5,863 3,339,692 84.87 6,208
Other Operating 454,381 12.56 845 585,939 14.89 1,089
Non-Operating(Equipt/Supplies) 9,255 0.26 17 9,255 0.24 17
Expenditures by Function (Objects 6100-6400 Only)
Total Operating Expenditures 3,608,739 100.00 6,708 3,925,631 100.00 7,297
Instruction (11,95) * 2,502,237 69.34 4,651 2,777,243 70.75 5,162
Instructional Res/Media (12) * 25,128 0.70 47 25,128 0.64 47
Curriculum/Staff Develop (13) * 70,479 1.95 131 70,479 1.80 131
Instructional Leadership (21) * 104,536 2.90 194 104,536 2.66 194
School Leadership (23) * 317,229 8.79 590 317,229 8.08 590
Guidance/Counseling Svcs (31) * 170,812 4.73 317 170,812 4.35 317
Social Work Services (32) * 0 0.00 0 0 0.00 0
Health Services (33) * 52,627 1.46 98 52,627 1.34 98
Food (35) ** 0 0.00 0 0 0.00 0
Extracurricular (36) * 93,300 2.59 173 93,300 2.38 173
Plant Maint/Operation (51) * ** 270,951 7.51 504 286,947 7.31 533
Security/Monitoring (52) * ** 1,440 0.04 3 27,330 0.70 51
Data Processing Svcs (53)* ** 0 0.00 0 0 0.00 0
Program expenditures by Program (Objects 6100-6400 only)
Total Operating Expenditures 3,243,048 100.00 6,028 3,518,054 100.00 6,539
Regular 2,402,691 74.09 4,466 2,492,363 70.84 4,633
Gifted & Talented 67,907 2.09 126 67,907 1.93 126
Career & Technical 0 0.00 0 0 0.00 0
Students with Disabilities 248,702 7.67 462 381,148 10.83 708
Accelerated Education 3,553 0.11 7 3,553 0.10 7
Bilingual 105,323 3.25 196 105,323 2.99 196
Nondisc Alted-AEP Basic Serv 0 0.00 0 0 0.00 0
Disc Alted-DAEP Basic Serv 39,604 1.22 74 39,604 1.13 74
Disc Alted-DAEP Supplemental 0 0.00 0 0 0.00 0
*Please refer to Sections 1.4.13-1.4.13.2 in the Financial Accountability System Resource Guide for information concerning requirements foraccounting for expenditures by campus.**Please note that, in many instances, expenditures under function codes 34-99 are not directly attributable to a specific campus. It isrecommended that district-level data(http://tea.texas.gov/financialstandardreports/) be used for the analysis of costs reported by comparable school districts.

Note: Some amounts may not total due to rounding.
TEXAS EDUCATION AGENCY2015-2016 PEIMS Actual Financial Data, Organized by Campus
School Campus:Fort Stockton Middle District:FORT STOCKTONISD County:Pecos CountyCampus Number:186902041 Total Membership: 538
GeneralFund %
PerStudent
AllFunds %
PerStudent
T1 A Schoolwide-St Comp >=40% 375,268 11.57 698 428,156 12.17 796
Athletic Programming 0 0.00 0 0 0.00 0
High School Allotment 0 0.00 0 0 0.00 0
Prekindergarten 0 0.00 0 0 0.00 0
*Please refer to Sections 1.4.13-1.4.13.2 in the Financial Accountability System Resource Guide for information concerning requirements foraccounting for expenditures by campus.**Please note that, in many instances, expenditures under function codes 34-99 are not directly attributable to a specific campus. It isrecommended that district-level data(http://tea.texas.gov/financialstandardreports/) be used for the analysis of costs reported by comparable school districts.

Note: Some amounts may not total due to rounding.
TEXAS EDUCATION AGENCY2015-2016 PEIMS Actual Financial Data, Organized by Campus
Note: Some amounts may not total due to rounding.
TEXAS EDUCATION AGENCY2015-2016 PEIMS Actual Financial Data, Organized by Campus
School Campus:Int District:FORT STOCKTONISD County:Pecos CountyCampus Number:186902101 Total Membership: 384
GeneralFund %
PerStudent
AllFunds %
PerStudent
Expenditures by Object (Objects 6100-6600)
Total Expenditures 2,014,136 100.00 5,245 2,255,271 100.00 5,873
Operating-Payroll 1,734,315 86.11 4,516 1,928,429 85.51 5,022
Other Operating 279,821 13.89 729 326,842 14.49 851
Non-Operating(Equipt/Supplies) 0 0.00 0 0 0.00 0
Expenditures by Function (Objects 6100-6400 Only)
Total Operating Expenditures 2,014,136 100.00 5,245 2,255,271 100.00 5,873
Instruction (11,95) * 1,373,852 68.21 3,578 1,614,987 71.61 4,206
Instructional Res/Media (12) * 18,654 0.93 49 18,654 0.83 49
Curriculum/Staff Develop (13) * 40,023 1.99 104 40,023 1.77 104
Instructional Leadership (21) * 47,882 2.38 125 47,882 2.12 125
School Leadership (23) * 157,660 7.83 411 157,660 6.99 411
Guidance/Counseling Svcs (31) * 101,344 5.03 264 101,344 4.49 264
Social Work Services (32) * 0 0.00 0 0 0.00 0
Health Services (33) * 40,611 2.02 106 40,611 1.80 106
Food (35) ** 0 0.00 0 0 0.00 0
Extracurricular (36) * 0 0.00 0 0 0.00 0
Plant Maint/Operation (51) * ** 233,150 11.58 607 233,150 10.34 607
Security/Monitoring (52) * ** 960 0.05 3 960 0.04 3
Data Processing Svcs (53)* ** 0 0.00 0 0 0.00 0
Program expenditures by Program (Objects 6100-6400 only)
Total Operating Expenditures 1,780,026 100.00 4,635 2,021,161 100.00 5,263
Regular 1,249,984 70.22 3,255 1,297,005 64.17 3,378
Gifted & Talented 0 0.00 0 0 0.00 0
Career & Technical 0 0.00 0 0 0.00 0
Students with Disabilities 251,599 14.13 655 337,777 16.71 880
Accelerated Education 9,674 0.54 25 9,674 0.48 25
Bilingual 86 0.00 0 86 0.00 0
Nondisc Alted-AEP Basic Serv 0 0.00 0 0 0.00 0
Disc Alted-DAEP Basic Serv 0 0.00 0 0 0.00 0
Disc Alted-DAEP Supplemental 0 0.00 0 0 0.00 0
*Please refer to Sections 1.4.13-1.4.13.2 in the Financial Accountability System Resource Guide for information concerning requirements foraccounting for expenditures by campus.**Please note that, in many instances, expenditures under function codes 34-99 are not directly attributable to a specific campus. It isrecommended that district-level data(http://tea.texas.gov/financialstandardreports/) be used for the analysis of costs reported by comparable school districts.

Note: Some amounts may not total due to rounding.
TEXAS EDUCATION AGENCY2015-2016 PEIMS Actual Financial Data, Organized by Campus
School Campus:Int District:FORT STOCKTONISD County:Pecos CountyCampus Number:186902101 Total Membership: 384
GeneralFund %
PerStudent
AllFunds %
PerStudent
T1 A Schoolwide-St Comp >=40% 268,683 15.09 700 376,619 18.63 981
Athletic Programming 0 0.00 0 0 0.00 0
High School Allotment 0 0.00 0 0 0.00 0
Prekindergarten 0 0.00 0 0 0.00 0
*Please refer to Sections 1.4.13-1.4.13.2 in the Financial Accountability System Resource Guide for information concerning requirements foraccounting for expenditures by campus.**Please note that, in many instances, expenditures under function codes 34-99 are not directly attributable to a specific campus. It isrecommended that district-level data(http://tea.texas.gov/financialstandardreports/) be used for the analysis of costs reported by comparable school districts.

11/27/2017 Texas Education Agency - 2016 - 2017 Accreditation Statuses
http://tea4avcastro.tea.state.tx.us/accountability/accreditation/2016_2017_accreditation_statuses.html 1/1
Home / Student Testing and Accountability / Accountability / Accreditation Status
2016-2017 Accreditation StatusesThe Texas Education Agency awards an accreditation status to each public school district and charter school. The accreditation status isbased on the academic accountability rating and financial ratings from the Financial Integrity Rating System of Texas. A district orcharter must be accredited by the state to operate as a public school.
The district accreditation statuses for 2016-2017 are listed below:
Show/Hide columns: CDN | Name | ESC | District Type | 2012 FIRST Rating | 2012 Accountability Rating | 2013 FIRST Rating | 2013 Accountability Rating |2014 FIRST Rating | 2014 Accountability Rating | 2015 FIRST Rating | 2015 Accountability Rating | 2016 FIRST Rating | 2016Accountability Rating | 2016-2017 Accreditation Status | Reason For Status | Notes
Show 100 entries Search: 186902
Showing 1 to 1 of 1 entries (filtered from 1,199 total entries) Previous 1 Next
CDN Name ESC2016
FIRSTRating
2016Accountability
Rating
2016-2017Accreditation
Status
ReasonFor
StatusNotes
186902 FORT STOCKTON ISD 18 A -Superior Met Standard ACCREDITED

Campus Improvement Plans (CIP) Each campus has developed and is implementing a CIP, as required by TEC
§11.253
Each CIP includes performance objectives based on data analysis and needs assessments (including data reported in the 2015-16 TAPR)
Each campus periodically measures progress toward its performance objectives
Campus Performance Objectives are approved by the Board
Campus CIPs are posted on the district’s website and are available for review at the district’s central office or on each campus
Campus Performance Objectives

High School Middle School INT School Alamo
ElementaryApache
Elementary
186902001 186902041 186902101 186902102 186902104
11 Used, exhibited, possessed firearm 0 0 0 0 012 Used, exhibited possessed illegal knife 0 0 0 0 013 Used, exhibited, possessed illegal club 0 0 0 0 0
14 Used, exhibited, possessed prohibited weapon 0 0 0 0 0
16 Arson 0 0 0 0 0
17 Murder, capital murder, criminal attempt to commit murder/capital murder 0 0 0 0 0
18 Indecency with a child 0 0 0 0 019 Aggravated kidnapping 0 0 0 0 0
29 Aggravated assault against school district employee/volunteer 0 0 0 0 0
30 Aggravated assault against non-employee/volunteer 0 0 0 0 0
31 Sexual assault/aggravated sexual assault against school district employee/volunteer 0 0 0 0 0
32 Sexual assault/aggravated sexual assault against non-employee/volunteer 0 0 0 0 0
36 Felony controlled substance violation 0 0 0 0 037 Felony alcohol violation 0 0 0 0 046 Aggravated robbery 0 0 0 0 047 Manslaughter 0 0 0 0 048 Criminally negligent homicide 0 0 0 0 0
0 0 0 0 0
659 578 372 495 320
0.0% 0.0% 0.0% 0.0% 0.0%
For information concerning school violence prevention and violence intervention policies that the district is using to protect students, please refer to the District's Student Code of Conduct and School Board Policies (both of which are available on the Distict's webpage and at all campuses and at the District's Central Administrative Offices).
Report on Violent or Criminal IncidentsStudent Disciplinary Action Incident Counts by Reason Code
2016-17 School Year
Disciplinary Action Reason Codes 11, 12, 13, 14, 16, 17, 18, 19, 29, 30, 31, 32, 36, 37, 46, 47 and 48 are the Codes used by TEA in identifying a "Persistently Dangerous School" under No Child Left Behind.
ReasonCode Description
Total Incidents Student Enrollment (Fall 2016 PEIMS Snapshot)
Incident Rate

Texas High School Graduates from FY2015
Enrolled in Texas Public or Independent Higher Education in FY 2016
GPA for 1st Year in Public Higher Education in Texas
Total 2.0- 2.5- 3.0-County District Graduates <2.0 2.49 2.99 3.49 >3.5 Unk
PECOS FORT STOCKTON ISD
186902001 FORT STOCKTON H S Four-Year Public University 26 6 6 5 8 1 0 Two-Year Public Colleges 33 14 4 3 7 5 0 Independent Colleges & Universities 0 Not Trackable 1 Not Found 69 Total High School Graduates 129
Source: Texas Higher Education Coordinating Board and Texas Education Agency
"Not found" graduates have standard ID numbers that were not found in the specified year at Texas higher education institutions. "Not trackable" graduates have non-standard ID numbers that will not find a match at Texas higher education institutions. Includes high schools with more than 25 graduates. If enrolllment in public higher education less than 5, the GPA data is omitted.

Glossary October 2017
2016–17 Texas Academic Performance Report
Texas Education Agency | Academics | Performance Reporting 1 of 32
Accountability Rating: The labels assigned to districts and campuses by the state academic accountability system that indicate acceptable and unacceptable performance or that a district or campus is not rated. Possible ratings are as follows:
• Met Standard
• Met Alternative Standard
• Improvement Required
• Not Rated
• Not Rated: Data Integrity Issues
For a detailed explanation of this year’s accountability system, see the 2017 Accountability Manual, available at http://tea.texas.gov/2017accountabilitymanual.aspx.
Accountability Subset: The collection of STAAR assessment results that are used to determine district and campus accountability ratings.
Campus-level accountability subset: Campuses are held accountable for the performance of only those students enrolled in the campus on both the snapshot date (the last Friday in October) and the testing date. For example, if a student was enrolled at one campus on October 28, 2016* then moved to another campus before the testing date, that student’s performance is not included in the accountability results for either campus.
District-level accountability subset: A district is held accountable for the performance of only those students enrolled in the district on both the snapshot date (the last Friday in October) and the testing date. For example, if a student was enrolled in one district on October 28, 2016* then moved to another district before the testing date, that student’s performance is not included in the accountability results for either district. If that student had moved from one campus to another in the same district, however, his or her performance would have been included in the district’s results, even though it was not included in the results for either campus. This can cause district performance results to vary from the aggregate of its campuses’ results.
*In the case of STAAR End-of-Course exams administered in July 2016, the accountability subset date is for the prior year, October 30, 2015.
Advanced/Dual-Credit Course Completion: The percentage of students who complete and receive credit for at least one advanced or dual-credit course. TAPR includes separate completion percentages for grades 9–12 and grades 11–12. Decisions about awarding high school credit for college courses are described in Texas Administrative Code §74.25.
Appendix B lists all courses identified as advanced courses. Courses for which a student can earn dual credit are not listed because they vary from campus to campus.
Course completion information is reported by districts through the Texas Student Data System/Public Education Information Management System (TSDS PEIMS) after the close of the school year. For example, the values, expressed as percentages for grades 11–12, are calculated as follows:

2016–17 TAPR Glossary October 2017
Texas Education Agency | Academics | Performance Reporting 2 of 32
Any Subject
number of students in grades 11 and 12 in 2015–16 who received credit for at least one advanced/dual-credit course
number of students in grades 11–12 who received credit for least one course in 2015–16
English Language Arts
number of students in grades 11 and 12 in 2015–16 who received credit for at least one advanced/dual-credit course in ELA
number of students in grades 11–12 who received credit for least one course in ELA in 2015–16
Mathematics
number of students in grades 11 and 12 in 2015–16 who received credit for at least one advanced/dual-credit course in mathematics
number of students in grades 11–12 who received credit for least one course in mathematics in 2015–16
Science
number of students in grades 11 and 12 in 2015–16 who received credit for at least one advanced/dual-credit course in science
number of students in grades 11–12 who received credit for least one course in science in 2015–16
Social Studies
number of students in grades 11 and 12 in 2015–16 who received credit for at least one advanced/dual-credit course in social studies
number of students in grades 11–12 who received credit for least one course in social studies in 2015–16
This indicator was used in awarding distinction designations to high schools in 2017. For a detailed explanation of distinction designations, see Chapter 5 of the 2017 Accountability Manual. (Source of data: PEIMS; Record 415, Course Completion Data – Student; Submission 3).
Advanced Placement Examinations: Please see AP/IB Results.
Annual Dropout Rate: The percentage of students who drop out of school during a school year. Annual dropout rates are shown for districts and campuses that serve grades 7–8 and/or 9–12. State law prohibits including a student who meets any of the following criteria from campus and district annual dropout rate calculations:
• Is ordered by a court to attend a high school equivalency certificate program but has not earned a high school equivalency certificate
• Was previously reported to the state as a dropout

2016–17 TAPR Glossary October 2017
Texas Education Agency | Academics | Performance Reporting 3 of 32
• Was in attendance but not in membership for purposes of average daily attendance (i.e., students for whom school districts are not receiving state Foundation School Program [FSP] funds)
• Was initially enrolled in a school in the United States in any grade 7 through 12 as an unschooled refugee or asylee as defined by TEC §39.027(a-1)
• Attends a district exclusively as a function of having been detained at a county detention facility and is not otherwise a student of the district in which the facility is located
• Is incarcerated in a state jail or federal penitentiary as an adult or as a person certified to stand trial as an adult
• Is a student in a Texas Juvenile Justice Department facility or residential treatment facility served by a Texas public school district
• Is at least 18 years of age as of September 1 and has satisfied the credit requirements for high school graduation; has not completed his or her individualized education program (IEP); and is enrolled and receiving IEP services
Annual Dropout Rate (Gr 7–8). This includes only grades 7 and 8. It is calculated as follows: number of dropouts in grades 7 and 8 during the 2015–16 school year
number of students in grades 7 and 8 in attendance at any time during the 2015–16 school year
Annual Dropout Rate (Gr 9–12). This includes grades 9 through 12. It is calculated as follows:
number of dropouts in grades 9 through 12 during the 2015–16 school year
number of students in grades 9–12 in attendance at any time during the 2015–16 school year
Both annual rates appear on campus, district, region, and state TAPRs. The state and region annual dropout rates that are reported on district and campus TAPRs, however, are calculated without the exclusions required for campus and district calculations.
Note that with all annual dropout rate calculations, a cumulative count of students is used in the denominator. This method for calculating the dropout rate neutralizes the effect of mobility by including in the denominator every student ever reported in attendance at the district or campus throughout the school year, regardless of length of enrollment. For a more complete description of dropout rates and exclusions, see the Secondary School Completion and Dropouts in Texas Public Schools, 2015–16 reports, available on the TEA website at http://tea.texas.gov/acctres/dropcomp_index.html.
For detailed information on data sources, see Appendix K in the 2017 Accountability Manual. See also Dropout and Leaver Record. (Source of data: PEIMS; Record 400, Student – Basic Attendance; Record 500, Student – Flexible Attendance Data, Submissions 1, 3, and 4)
Annual Graduates: The count of students who graduate from a district or campus in a school year regardless of cohort. This is separate from, and may include different students than, the longitudinal graduation rates. (Source of data: PEIMS; Record 203, Student – School Leaver; Submissions 1 and 3)

2016–17 TAPR Glossary October 2017
Texas Education Agency | Academics | Performance Reporting 4 of 32
AP/IB Course Completion: The percentage of annual graduates who completed at least one Advanced Placement (AP) course and/or International Baccalaureate (IB) course in the 2012–13 to 2015–16 school years.
number of 2015–16 annual graduates who completed at least one AP or IB course in the 2012–13 to 2015–16 school years
Number of 2015–16 annual graduates
AP/IB Results (Participation): The percentage of students in grades 11 and 12 who took the College Board’s Advanced Placement (AP) examinations and/or the International Baccalaureate’s (IB) Diploma Program examinations.
All Subjects
number of 11th and 12th graders in the 2015–16 school year taking at least one AP or IB examination
total students enrolled in 11th and 12th grades
English Language Arts
number of 11th and 12th graders in the 2015–16 school year taking at least one AP or IB examination in ELA
total students enrolled in 11th and 12th grades
Mathematics
number of 11th and 12th graders in the 2015–16 school year taking at least one AP or IB examination in mathematics
total students enrolled in 11th and 12th grades
Science
number of 11th and 12th graders in the 2015–16 school year taking at least one AP or IB examination in science
total students enrolled in 11th and 12th grades
Social Studies
number of 11th and 12th graders in the 2015–16 school year taking at least one AP or IB examination in social studies
total students enrolled in 11th and 12th grades
AP/IB Results (Examinees >= Criterion): The percentage of students in grades 11 and 12 with at least one AP or IB score at or above the criterion score. High school students may take one or more of these examinations, ideally upon completion of AP or IB courses, and may receive advanced placement or credit, or both, upon entering college. Generally, colleges will award credit or advanced placement for scores of 3, 4, or 5 on AP examinations and scores of 4, 5, 6, or 7 on IB examinations. Requirements vary by college and by subject tested.
All Subjects
number of 11th and 12th graders with at least one AP or IB score at or above criterion
number of 11th and 12th graders with at least one AP or IB examination

2016–17 TAPR Glossary October 2017
Texas Education Agency | Academics | Performance Reporting 5 of 32
English Language Arts
number of 11th and 12th graders with at least one AP or IB score at or above criterion in ELA
number of 11th and 12th graders with at least one AP or IB examination in ELA
Mathematics
number of 11th and 12th graders with at least one AP or IB score at or above criterion in mathematics
number of 11th and 12th graders with at least one AP or IB examination in mathematics
Science
number of 11th and 12th graders with at least one AP or IB score at or above criterion in science
number of 11th and 12th graders with at least one AP or IB examination in science
Social Studies
number of 11th and 12th graders with at least one AP or IB score at or above criterion in social studies
number of 11th and 12th graders with at least one AP or IB examination in social studies
This indicator was used in determining the 2017 postsecondary readiness distinction designation for campuses and districts. For a detailed explanation of distinction designations, see Chapter 5 of the 2017 Accountability Manual. (Sources of data: The College Board, Nov. 2015, Nov. 2016; The International Baccalaureate Organization, Feb. 2016, Feb. 2017; and PEIMS; Record 101, Student – Demographic, Submission 1)
At-Risk: The count and percentage of students identified as being at risk of dropping out of school as defined by TEC §29.081(d) and (d-1).
number of students in the 2015–16 school year considered as at risk
total number of students
(Source of data: PEIMS; Record 110, Student – Enrollment, Submission 1)
Attendance Rate: The percentage of days that students were present in 2015–16 based on student attendance for the entire school year. Only students in grades 1–12 are included in the calculation. Attendance is calculated as follows:
total number of days that students in grade 1–12 were present in 2015–16
total number of days that students in grade 1–12 were in membership in 2015–16
This indicator was used in awarding distinction designations in 2017. For a detailed explanation of distinction designations, see Chapter 5 of the 2017 Accountability Manual. (Source of data: PEIMS; Record 400, Student – Basic Attendance, Submission 1)
Auxiliary Staff (not on campus profile): The count of full-time equivalent (FTE) staff reported in TSDS PEIMS employment and payroll records who are not reported in the TSDS PEIMS 090
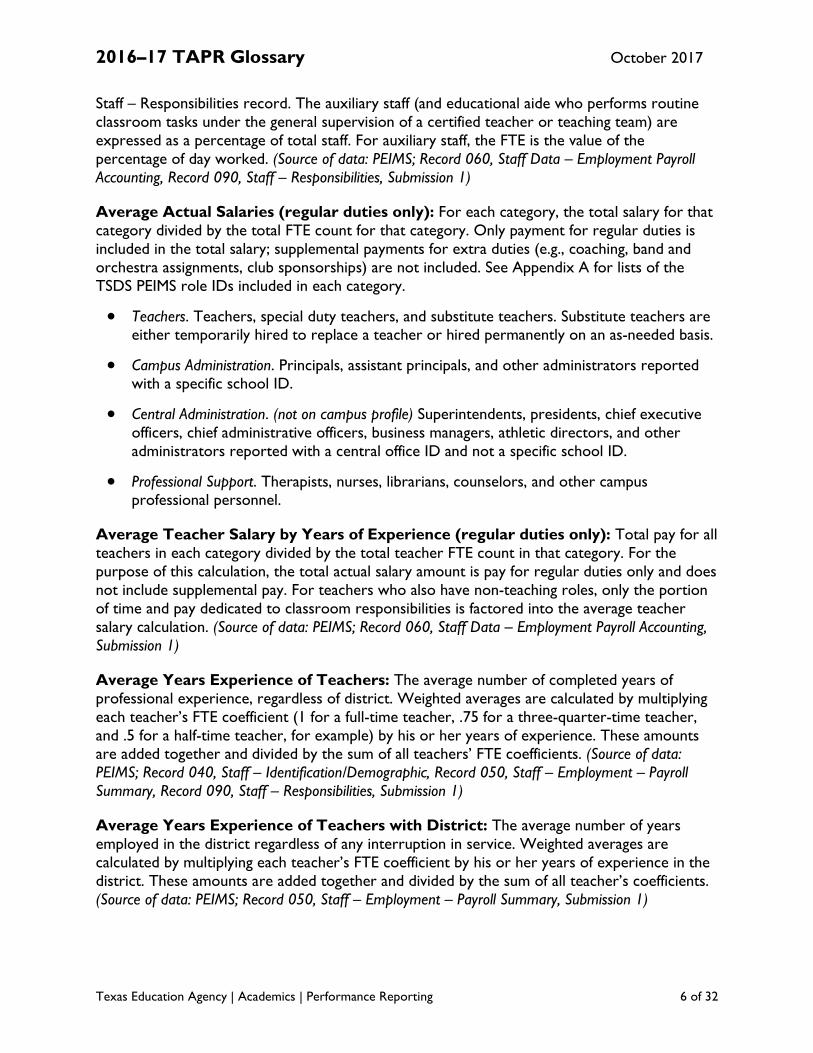
2016–17 TAPR Glossary October 2017
Texas Education Agency | Academics | Performance Reporting 6 of 32
Staff – Responsibilities record. The auxiliary staff (and educational aide who performs routine classroom tasks under the general supervision of a certified teacher or teaching team) are expressed as a percentage of total staff. For auxiliary staff, the FTE is the value of the percentage of day worked. (Source of data: PEIMS; Record 060, Staff Data – Employment Payroll Accounting, Record 090, Staff – Responsibilities, Submission 1)
Average Actual Salaries (regular duties only): For each category, the total salary for that category divided by the total FTE count for that category. Only payment for regular duties is included in the total salary; supplemental payments for extra duties (e.g., coaching, band and orchestra assignments, club sponsorships) are not included. See Appendix A for lists of the TSDS PEIMS role IDs included in each category.
• Teachers. Teachers, special duty teachers, and substitute teachers. Substitute teachers are either temporarily hired to replace a teacher or hired permanently on an as-needed basis.
• Campus Administration. Principals, assistant principals, and other administrators reported with a specific school ID.
• Central Administration. (not on campus profile) Superintendents, presidents, chief executive officers, chief administrative officers, business managers, athletic directors, and other administrators reported with a central office ID and not a specific school ID.
• Professional Support. Therapists, nurses, librarians, counselors, and other campus professional personnel.
Average Teacher Salary by Years of Experience (regular duties only): Total pay for all teachers in each category divided by the total teacher FTE count in that category. For the purpose of this calculation, the total actual salary amount is pay for regular duties only and does not include supplemental pay. For teachers who also have non-teaching roles, only the portion of time and pay dedicated to classroom responsibilities is factored into the average teacher salary calculation. (Source of data: PEIMS; Record 060, Staff Data – Employment Payroll Accounting, Submission 1)
Average Years Experience of Teachers: The average number of completed years of professional experience, regardless of district. Weighted averages are calculated by multiplying each teacher’s FTE coefficient (1 for a full-time teacher, .75 for a three-quarter-time teacher, and .5 for a half-time teacher, for example) by his or her years of experience. These amounts are added together and divided by the sum of all teachers’ FTE coefficients. (Source of data: PEIMS; Record 040, Staff – Identification/Demographic, Record 050, Staff – Employment – Payroll Summary, Record 090, Staff – Responsibilities, Submission 1)
Average Years Experience of Teachers with District: The average number of years employed in the district regardless of any interruption in service. Weighted averages are calculated by multiplying each teacher’s FTE coefficient by his or her years of experience in the district. These amounts are added together and divided by the sum of all teacher’s coefficients. (Source of data: PEIMS; Record 050, Staff – Employment – Payroll Summary, Submission 1)

2016–17 TAPR Glossary October 2017
Texas Education Agency | Academics | Performance Reporting 7 of 32
Bilingual Education (BE) Dual-language program that enables English language learners to become competent in listening, speaking, reading, and writing in English through the development of literacy and academic skills in both the primary language and English. This category includes the transitional bilingual/early exit, the transitional bilingual/late exit, the dual language immersion/one-way, and the dual language immersion/two-way instructional models.
Bilingual Education/English as a Second Language Reports: The performance for selected indicators disaggregated by bilingual and English as a second language (ESL) instructional models. The TAPR shows the statutorily-required performance indicators disaggregated by eleven columns for students identified as limited English proficient (LEP) in the current school year.
For definitions of the BE/ESL instructional programs, see the Texas Education Data Standards, available at http://www.texasstudentdatasystem.org/TSDS/TEDS/TEDS_Latest_Release/.
Campus Number: A unique nine-digit number assigned to every public school. It is comprised of a three-digit county number (assigned alphabetically from 001 to 254), followed by a three-digit district number (9XX is used primarily for traditional campuses, 8XX for charter campuses), and ending with a three-digit campus number (typically 00X_ for high schools, 04Xfor middle schools, and 1XX for elementary schools).
Class Size Averages by Grade and Subject: The average class size by grade (elementary) or selected subjects (secondary classes).
For secondary classes, averages are determined by totaling the number of students served (in a subject at the campus) and dividing that sum by the count of classes for that subject.
For elementary classes, how the average is determined depends on the instructional model. If an elementary teacher teaches all subjects to the same group of fourth graders all day, the class size average is simply the number of fourth grade students served by that teacher. If an elementary teacher teaches a single subject to five different sections of fourth graders each day, however, the average is calculated the same way as for secondary subjects. For example, one fourth grade science teacher teaches five science classes each day with 18, 20, 19, 21, and 22 students in each class. The total of 100 students divided by the five classes produces an average class size of 20 students for that teacher.
The following rules apply to the average class sizes:
• Classes identified as serving regular, compensatory/remedial, gifted and talented, career and technical, and honors students are included in the calculation.
• Subjects in the areas of English language arts (ELA), mathematics, science, social studies, languages other than English, computer science, and career and technical education are included in the calculation, as are self-contained classrooms.
• Classes where the number of students served is reported as zero are not included.
• Service codes with the “SR” prefix are not included.
• Teacher roles coded as “teacher” and/or “substitute teacher” are included.
• Only class settings coded as “regular class” are included.

2016–17 TAPR Glossary October 2017
Texas Education Agency | Academics | Performance Reporting 8 of 32
• Missing partial FTE counts are not included.
• Elementary classes in which the number of students exceeds 100 are not included.
• Mixed grade-level class averages are not included.
(Source of data: PEIMS; Record 090, Staff Data – Responsibilities, Submission 1)
Cohort: A group of students who begin grade 9 for the first time in the same school year plus any students who, in the next three school years, enter the Texas public school system in the grade level expected for the cohort.
A cohort is formed when a group of students begins ninth grade, regardless of whether the school that they attend has students in any other grades.
• A student transfers into a campus, district, or state cohort when he or she moves into the cohort from another high school in Texas, from another district in Texas, or from out of state.
• A student transfers out of a campus or district cohort when he or she moves to another public high school in Texas or moves to another district in Texas. Note that these students are transferred into the cohort of the high school or district to which they moved. There are also students who move out of state or out of the country and students who transfer to private schools or who are home-schooled. These types of transfer students cannot be tracked and are not included in longitudinal rate calculations.
• A student does not change cohorts if he or she repeats or skips a grade. A student who begins with the 2012–13 ninth-grade cohort remains with that cohort. A student who started the ninth grade in 2012–13 but takes 5 years to graduate (i.e., graduates in May 2017) is still part of the 2016 cohort; he or she is not switched to the 2017 cohort. This student would be considered a continuing student and counted as part of the Continued HS number for the class of 2016. This is also true for the five-year and six-year extended longitudinal cohorts.
College Admissions Tests: Please see SAT/ACT Results.
College-Ready Graduates: The percentage of annual graduates that meet or exceed the college-ready criteria on the Texas Success Initiative Assessment (TSIA), the SAT test, or the ACT test. The criteria for each are as follows:
Subject TSIA SAT * ACT
ELA at least 351 on Reading OR
at least 500 on Critical Reading AND
at least 1070 Total
OR at least 19 on English
AND at least 23 Composite
Mathematics at least 350 on Mathematics OR at least 500 on Mathematics
AND at least 1070 Total
OR at least 19 on Mathematics
AND at least 23 Composite
* For the small percentage of students who took the redesigned SAT examination, their scores were converted to the equivalent scores on the previous SAT using College Board concordance tables.

2016–17 TAPR Glossary October 2017
Texas Education Agency | Academics | Performance Reporting 9 of 32
Performance is shown for school years 2014-15 and 2015-16. The percentages are calculated as follows:
English Language Arts.
number of graduates who scored at or above the college-ready criterion for ELA in 2015–16
number of 2015–16 annual graduates with ELA results to evaluate
Mathematics.
number of graduates who scored at or above the college-ready criterion for mathematics in 2015–16
number of 2015–16 annual graduates with ELA results to evaluate
Both Subjects.
number of graduates who scored at or above the college-ready criteria on both ELA & mathematics in 2015–16
number of 2015–16 annual graduates with results in both subjects to evaluate
Either Subject.
number of graduates who scored at or above the college-ready criteria on either ELA or mathematics in 2015–16
number of 2015–16 annual graduates with results in either subject to evaluate
(Sources of data: The Texas Higher Education Coordinating Board (THECB), The College Board, Aug. 2015, Aug. 2016, ACT, Inc. Oct. 2015, Oct. 2016)
College and Career Ready Graduates: The number of 2015–16 annual graduates who demonstrate preparedness for postsecondary success in one of three ways:
• Meeting the TSI criteria in both ELA/reading and mathematics, as described above for College-Ready Graduates
• Completing and earning credit for at least two advanced/dual-credit courses in the 2014–15 or 2015–16 school year
• Enrolling in a coherent sequence of career and technical education (CTE) courses as part of a four-year plan of study to take two or more CTE courses for three or more credits during the 2015–16 school year (This includes the CTE Tech Prep Program)
(Sources of data: consolidated accountability file [CAF], THECB, College Board, and ACT)
Completion of Two or More Advanced/Dual-Credit Courses in Current and/or Prior Year: The percentage of annual graduates who complete two or more advanced or dual-credit courses.
number of 2015–16 annual graduates who completed 2 or more advanced/dual-credit courses in the current and/or prior school year
Number of 2015–16 annual graduates
(Source of data: PEIMS; Record 415, Course Completion Data – Student; Submission 3 and Record 203, Student – School Leaver, Submissions 1 and 3)

2016–17 TAPR Glossary October 2017
Texas Education Agency | Academics | Performance Reporting 10 of 32
Completion of Twelve or More Hours of Postsecondary Credit: The percentage of annual graduates who earn at least 12 hours of postsecondary credit in the 2012–13 to 2015–16 school years.
number of 2015–16 annual graduates who completed 12 or more hours of postsecondary credit in the 2012–13 to 2015–16 school years
Number of 2015–16 annual graduates
(Source of data: PEIMS; Record 415, Course Completion Data – Student; Submission 3 and Record 203, Student – School Leaver, Submissions 1 and 3)
Completion Rate: Please see Longitudinal Rates.
County District Number (CDN): Please see District Number.
County District Campus Number (CDCN): Please see Campus Number.
CTE-Coherent Sequence Graduate: The percentage of annual graduates enrolled in a coherent sequence of career and technical education (CTE) courses as part of a four-year plan of study.
number of 2015–16 annual graduates who were enrolled in a CTE-coherent sequence of courses as part of a four-year plan of study to take two or more CTE courses for three or more credits *
number of 2015–16 annual graduates
* This includes the CTE Tech Prep Program.
(Source of data: PEIMS; Record 101, Student – Demographic, Submission 1; Record 203, Student – School Leaver, Submissions 1 and 3; Record 400, Student – Basic Attendance, Submission 1)
Data Quality (not on campus profile): The percentage of errors made by district in the TSDS PEIMS Student Leaver Data.
Percent of Underreported Students. Underreported students are 7th–12th graders who were enrolled at any time during the prior year, who are not accounted for through district records or TEA processing in the current year, and for whom the district did not submit a leaver record. A district is required to submit a leaver record for any student served in grades 7–12 the previous year unless the student received a GED certificate by August 31, is a previous Texas public school graduate, moved to and enrolled in another Texas public school district, or returned to the district by the end of the school start window. (For 2015–16, the end of the school-start window was September 30, 2016.) (For a more complete definition of leavers, see Leaver Records.)
number of underreported students
number of students in grades 7–12 who were served in the district in the 2015–16 school year
(Source of data: General Educational Development Information File; PEIMS; Record 101, Student – Demographic, Submission 1; Record 110, Student – Enrollment, Submission 1; Record 400, Student – Basic Attendance, Submission 3; Record 500, Student – Flexible Attendance Data, Submission 3)

2016–17 TAPR Glossary October 2017
Texas Education Agency | Academics | Performance Reporting 11 of 32
Distinction Designations: Recognitions for outstanding achievement in the following academic areas:
• Academic Achievement in English Language Arts/Reading (campus only)
• Academic Achievement in Mathematics (campus only)
• Academic Achievement in Science (campus only)
• Academic Achievement in Social Studies (campus only)
• Top 25 Percent: Student Progress (campus only)
• Top 25 Percent: Closing Performance Gaps (campus only)
• Postsecondary Readiness (district and campus)
The 2016–17 TAPR provides the Distinction Designations for eligible districts and campuses on the cover page of the report. Only those districts and campuses that receive a Met Standard rating are eligible for distinction designations. Charter districts and alternative education campuses evaluated by alternative education accountability (AEA) provisions are not eligible for distinction designations. See Chapter 5 of the 2017 Accountability Manual for more information.
Distinguished Achievement Program: Please see RHSP/DAP Graduates.
District Number: A unique six-digit number assigned to every public school district. It is comprised of a three-digit county number (assigned alphabetically from 001 to 254) followed by a three-digit district number (9XX for traditional districts, 8XX for charter operators).
Dropout: A student who was enrolled in public school in grade 7–12 during the previous year, did not return to public school in current year, was not expelled, and did not graduate, receive a high school equivalency certificate, continue school outside the public school system, begin college, or die. Dropout counts are obtained from TSDS PEIMS records. For more information, see Annual Dropout Rate. (Source of data: PEIMS; Record 203, Student – School Leaver, Submissions 1, 3)
Dropout Rate: Please see Annual Dropout Rate.
Economically Disadvantaged: The count and percentage of students eligible for free or reduced-price lunch or eligible for other public assistance.
number of students eligible for free or reduced-price lunch or other public assistance total number of students
See also Total Students. (Source of data: PEIMS; Record 101, Student – Demographic, Submission 1; and TEA Student Assessment Division)
Educational Aides: The count and percentage of paraprofessional staff who are reported with a role of 033 (Educational Aide) or 036 (Certified Interpreter). The FTE counts of

2016–17 TAPR Glossary October 2017
Texas Education Agency | Academics | Performance Reporting 12 of 32
educational aides are expressed as a percentage of the total staff FTEs. See Appendix A for all TSDS PEIMS Role IDs. (Source of data: PEIMS; Record 090, Staff Data – Responsibilities, Submission 1)
English as a Second Language (ESL): An intensive program designed to develop proficiency in listening, speaking, reading, and writing in the English language. This category includes both ESL content and ESL pull-out instructional models.
English Language Learners (ELLs): The count and percentage of students whose primary language is other than English and who are in the process of acquiring English. The terms “English Language Learner,” “English Learner,” and “Limited English Proficient” (LEP) are used interchangeably.
Inclusion and exclusion of ELL performance varies by indicator:
• ELL performance of students who are in their first year in U.S. schools is excluded from all STAAR indicators. Exclusion of other ELL performance varies, depending on the indicator. For detailed information on the inclusion and exclusion of ELL performance, see Appendix I in the 2017 Accountability Manual.
• ELL performance is included in all other non-STAAR indicators, regardless of years in U.S. schools.
In the Profile section of the reports, the percentage of ELLs is calculated by dividing the number of ELLs by the total number of students in the district or campus. Not all students identified as ELLs receive bilingual or English as a second language instruction. (Source of data: PEIMS; Record 110, Student – Enrollment, Submission 1)
Enrollment: Please see Total Students.
Ethnic Distribution: The number and percentage of students and staff who are identified as belonging to one of the following groups: African American, Hispanic, White, American Indian, Asian, Pacific Islander, and Two or More Races. (Source of data: PEIMS; Record 101, Student – Demographic, Record 040, Staff – Identification/Demographic, Record 050, Staff – Employment – Payroll Summary, Record 090, Staff – Responsibilities, Submission 1; The College Board; ACT Inc.; The International Baccalaureate Organization; and TEA Student Assessment Division)
Expenditure Information: Information available on the PEIMS Financial Standard Reports at http://tea.texas.gov/financialstandardreports/.
Experience of Campus Leadership: The average years of experience for principals and assistant principals.
• Average Years as Principal: The average number of completed years of professional experience, regardless of district. Weighted averages are calculated by multiplying each principal’s FTE coefficient (1 for a full-time principal, .75 for a three-quarter-time principal, and .5 for a half-time principal, for example) by his or her years of experience. These amounts are added together and divided by the sum of all principals’ FTE coefficients.

2016–17 TAPR Glossary October 2017
Texas Education Agency | Academics | Performance Reporting 13 of 32
• Average Years as Principal with District: The average number of years employed in the district regardless of any interruption in service. Weighted averages are calculated by multiplying each principal’s FTE coefficient by his or her years of experience in the district. These amounts are added together and divided by the sum of all principal’s coefficients.
• Average Years as Assistant Principal: The average number of completed years of professional experience, regardless of district. Weighted averages are calculated by multiplying each principal’s FTE coefficient by his or her years of experience. These amounts are added together and divided by the sum of all assistant principals’ FTE coefficients.
• Average Years as Assistant Principal with District: The average number of years employed in the district regardless of any interruption in service. Weighted averages are calculated by multiplying each assistant principal’s FTE coefficient by his or her years of experience in the district. These amounts are added together and divided by the sum of all assistant principal’s coefficients.
(Source of data: PEIMS; Record 050, Staff – Employment – Payroll Summary, Submission 1)
Foundation High School Program (FHSP): Please see Graduation Plan.
Full Time Equivalent (FTE): A measure of the extent to which a person (or responsibility) occupies a full-time position; it is calculated for each staff member reported in TSDS PEIMS. FTE values are used in various staff reports as well as input to the Budget and Actual financial allocation process.
An employee who works half time and has a reported actual salary of $30,000 has a full-time equivalent salary of $60,000. All average salaries are expressed in full-time equivalent form by dividing the sum of the actual salaries earned by the total FTE count. (Source of data: PEIMS; Record 050, Staff – Employment – Payroll Summary, Record 060, Staff Data – Employment Payroll Accounting, Record 090, Staff – Responsibilities, Submission 1)
Fund Balance Information: Information is available on the PEIMS Financial Standard Reports at http://tea.texas.gov/financialstandardreports/.
Graduates: The count and percentage of students who graduate at some time during the school year. It includes summer graduates and is reported by districts in the fall of the following school year. It includes all students in grade 12 who graduated, as well as graduates from other grades. Students served by special education who graduate are included in the totals. Counts of students graduating under the following graduation types in 2015–16 are also shown:
• Minimum High School Program (MHSP)
• Recommended High School Program (RHSP)
• Distinguished Achievement Program (DAP)
• Foundation High School Plan (FHSP)
See also College-Ready Graduates, Longitudinal Rate, RHSP/DAP Graduates, RHSP/DAP/FHSP-E/FHSP-DLA Graduates. (Source of data: PEIMS; Record 203, Student – School Leaver; Submissions 1 and 3)

2016–17 TAPR Glossary October 2017
Texas Education Agency | Academics | Performance Reporting 14 of 32
Graduation Plan: The percentage of students who graduated under one of the following:
• FHSP-DLA Graduates (Longitudinal Rate) (Class of 2016) The percentage of graduates who, after four years, satisfied the course requirements for the Foundation High School Program at the distinguished level of achievement.
number of graduates in the Class of 2016 who complete a 4-year FHSP-DLA
number of graduates in the Class of 2016 with reported FHSP graduation plans
• FHSP-E Graduates (Longitudinal Rate) (Class of 2016) The percentage of graduates who, after four years, satisfied the course requirements for the Foundation High School Program with an endorsement.
number of graduates in the Class of 2016 who complete a 4-year FHSP-E
number of graduates in the Class of 2016 with reported FHSP graduation plans
• RHSP/DAP Graduates (Longitudinal Rate) (Class of 2016) The percentage of graduates who, after four years, satisfied the course requirements for the Recommended High School Program or Distinguished Achievement Program.
number of graduates in the Class of 2016 who complete a 4-year RHSP or DAP
number of graduates in the Class of 2016 with reported graduation plans (excludes graduates with FHSP degree plans)
• RHSP/DAP/FHSP-E/FHSP-DLA Graduates (Longitudinal Rate) (Class of 2016) The percentage of graduates who, after four years, satisfied the course requirements for the Recommended High School Program, Distinguished Achievement Program, or the Foundation High School Program with an endorsement or at the distinguished level of achievement.
number of graduates from the Class of 2016 who complete a 4-year RHSP or DAP or FHSP-E or FHSP-DLA
number of graduates in the Class of 2016 with reported graduation plans
• FHSP-DLA Graduates (Annual Rate) (2015–16) The percentage of graduates in 2016 who satisfied the course requirements for the Foundation High School Program at the distinguished level of achievement.
number of graduates in SY 2015–16 who earn an FHSP-DLA
number of graduates in school year (SY) 2015-16 with reported FHSP graduation plans

2016–17 TAPR Glossary October 2017
Texas Education Agency | Academics | Performance Reporting 15 of 32
• FHSP-E Graduates (Annual Rate) (2015–16) The percentage of graduates in 2016 who satisfied the course requirements for the Foundation High School Program with an endorsement.
number of graduates in SY 2015–16 who earn an FHSP-E
number of graduates in SY 2015–16 with reported FHSP graduation plans
• RHSP/DAP Graduates (Annual Rate) (2015–16) The percentage of graduates in 2016 who satisfied the course requirements for the Recommended High School Program or Distinguished Achievement Program.
number of graduates in SY 2015–16 reported with graduation codes for RHSP or DAP
number of graduates in SY 2015–16 with reported graduation plans (excludes graduates with FHSP degree plans)
• RHSP/DAP/FHSP-E/FHSP-DLA Graduates (Annual Rate) (2015–16) The percentage of graduates in 2016 who satisfied the course requirements for the Recommended High School Program, Distinguished Achievement Program, or at the Foundation High School Program with an endorsement or the distinguished level of achievement.
number of graduates in SY 2015–16 reported with graduation codes for RHSP or DAP or FHSP-E or FHSP-DLA
number of graduates in SY 2015–16 with reported graduation plans
RHSP graduates have graduation type codes of 19, 22, 25, 28, or 31; DAP graduates have graduation type codes of 20, 23, 26, 29, or 32; FHSP graduates are students with graduation type codes of 34, 54, 55, 56, or 57. FHSP graduates with code type 35 are ineligible for endorsements and are excluded. See the Texas Education Data Standards for more information. Results are shown for the Class of 2015 and the Class of 2016. See also Graduates. (Source of data: PEIMS; Record 203, Student – School Leaver and Graduation Program, Submissions 1 and 3)
For additional information about graduation programs please see http://tea.texas.gov/graduation.aspx
Graduates Enrolled in Texas Institution of Higher Education (TX IHE): The percentage of students who enroll and begin instruction at an institution of higher education in Texas for the school year following high school graduation.
number of graduates during the 2014–15 school year who attended a public or independent college or university in Texas in the 2015–16 academic year
number of graduates during the 2014–15 school year
Students who enrolled in out-of-state colleges or universities or any non-public career school are not included. Students who attend public community colleges in Texas are included. (Source of data: Texas Higher Education Coordinating Board)

2016–17 TAPR Glossary October 2017
Texas Education Agency | Academics | Performance Reporting 16 of 32
Graduates in TX IHE Completing One Year Without Remediation: The percentage of students who enrolled and began instruction at an institution of higher education in Texas for the school year following high school graduation and did not require a developmental education course.
number of graduates during the 2014–15 school year who enrolled in a public college or university in Texas for the school year following the year they graduated
and met the Texas Success Initiative requirement in all subject areas (reading, writing, and
mathematics)
number of graduates during the 2014–15 school year who enrolled in a public college or university in Texas for the school year following the year they graduated
Students who attended Texas public two- or four-year institutions of higher education are included.
Students who enrolled in independent colleges or universities in Texas, out-of-state colleges or universities, or any non-public career school are not included.
Additional reports showing students enrolled in Texas public colleges and universities are available on the Texas Higher Education Coordinating Board (THECB) site at http://www.txhighereddata.org/generatelinks.cfm?Section=HS2Col.
For more information on the data used in this indicator, contact the Texas Higher Education Coordinating Board at (512) 427-6153. (Source of data: Texas Higher Education Coordinating Board, Fall 2017)
Graduation Rate: Please see Longitudinal Rates.
Instructional Expenditure Ratio (2015–16): This information is available on the PEIMS Financial Standard Reports at http://tea.texas.gov/financialstandardreports/.
Instructional Staff Percent (district profile only): The percentage of the district's FTEs whose job function was to provide classroom instruction directly to students during the 2015–16 school year. The instructional staff percent is a district-level measure and is calculated as follows:
total number of hours for district staff who were reported under expenditure object codes 6112, 6119, and 6129, and function codes 11, 12, 13, and 31
total number of hours worked by all district employees
Contact the Division of Financial Compliance at (512) 463-9095 for further details about this measure. (Source of data: PEIMS; Record 040, Staff – Identification/Demographic, Record 050, Staff – Employment – Payroll Summary, Record 090, Staff – Responsibilities, Submission 1)
International Baccalaureate (IB) Results: See AP/IB Results.
Leaver Record: The TSDS PEIMS record that reports the status of prior year grade 7–12 students who are no longer enrolled at a Texas public school. Districts are required to submit

2016–17 TAPR Glossary October 2017
Texas Education Agency | Academics | Performance Reporting 17 of 32
a leaver record for each student who graduated, enrolled in school in another state, returned to his or her home country, died, or dropped out.
See Data Quality. (Source of data: PEIMS; Record 203, Student – School Leaver; Submissions 1 and 3); Secondary School Completion and Dropouts in Texas Public Schools, 2015–16, Texas Education Agency)
LEP (Limited English Proficient): Please see English Language Learner.
Longitudinal Rates: The status of a group (cohort) of students after four years in high school (4-Year Longitudinal Rate), after five years in high school (5-Year Extended Longitudinal Rate), or after six years in high school (6-Year Extended Longitudinal Rate).
For the 4-Year Longitudinal Rate, the cohort consists of students who first attended ninth grade in 2012–13. They are followed through their expected graduation with the class of 2016.
For the 5-Year Extended Longitudinal Rate, the cohort consists of students who first attended ninth grade in 2011–12. They are followed for five years and included if they graduated within a year after their expected graduation with the class of 2015.
For the 6-Year Extended Longitudinal Rate, the cohort consists of students who first attended ninth grade in 2010–11. They are followed for six years, and included if they graduated within two years after their expected graduation with the class of 2014.
Additional Information on Cohorts:
• A student transfers into a campus, district, or state cohort when he or she moves into the cohort from another high school in Texas, from another district in Texas, or from out of state.
• A student transfers out of a campus or district cohort when he or she moves to another public high school in Texas or moves to another district in Texas. Note that these students are transferred into the cohort of the high school or district to which they moved. There are also students who move out of state or out of the country and students who transfer to private schools or who are home-schooled. These types of transfer students cannot be tracked and are not included in longitudinal rate calculations.
• A student does not change cohorts if he or she repeats or skips a grade. A student who begins with the 2012–13 ninth-grade cohort remains with that cohort. A student who started the ninth grade in 2012–13 but takes 5 years to graduate (i.e., graduates in May 2017) is still part of the 2016 cohort; he or she is not switched to the 2017 cohort. This student would be considered a continuing student and counted as part of the Continued HS number for the class of 2016. This is also true for the five-year and six-year extended longitudinal cohorts.

2016–17 TAPR Glossary October 2017
Texas Education Agency | Academics | Performance Reporting 18 of 32
There are four student outcomes used in computing each longitudinal rate:
4-Year Longitudinal Rate
(1) Graduated: The percentage who received their high school diploma in four years or fewer by August 31, 2016 for the 2016 cohort.
number of students from the cohort who received a high school diploma by August 31, 2016
number of students in the 2016 cohort*
(2) Received GED: For the 2016 cohort, the percentage who received a General Educational Development (GED) certificate by August 31, 2016. It is calculated as follows:
number of students from the cohort who received a GED by August 31, 2016
number of students in the 2016 cohort*
(3) Continued High School: The percentage of the 2016 cohort still enrolled as students in the fall of the 2016–17 school year. It is calculated as follows:
number of students from the cohort who were enrolled in the fall of the 2016–17 school year
number of students in the 2016 cohort*
(4) Dropped Out: The percentage of the 2016 cohort who dropped out and did not return by the fall of the 2016–17 school year. It is calculated as follows:
number of students from the cohort who dropped out before fall of the 2016–17 school year
number of students in the 2016 cohort*
(5) Graduates & GED: The percentage of graduates and GED recipients in the 2016 cohort. It is calculated as follows:
number of students from the 2016 cohort who received a high school diploma by August 31, 2016 plus number of students from the cohort who received a GED by August 31, 2016
number of students in the 2016 cohort*
(6) Graduates, GED & Cont: The percentage of graduates, GED recipients, and continuers in the 2016 cohort. It is calculated as follows:
number of students from the cohort who received a high school diploma by August 31, 2016 plus number of students from the cohort who received a GED by August 31, 2016 plus
number of students from the cohort who were enrolled in the fall of the 2016–17 school year
number of students in the 2016 cohort*

2016–17 TAPR Glossary October 2017
Texas Education Agency | Academics | Performance Reporting 19 of 32
5-Year Extended Longitudinal Rate
(1) Graduated: The percentage who received their high school diploma by August 31, 2016, for the 2015 cohort. It is calculated as follows:
number of students from the cohort who received a high school diploma by August 31, 2016
number of students in the 2015 cohort*
(2) Received GED: For the 2015 cohort, the percentage who received a GED certificate by August 31, 2016. It is calculated as follows:
number of students from the cohort who received a GED by August 31, 2016
number of students in the 2015 cohort*
(3) Continued High School: The percentage of the 2015 cohort still enrolled as students in the fall of the 2016–17 school year. It is calculated as follows:
number of students from the cohort who were enrolled in the fall of the 2016–17 school year
number of students in the 2015 cohort*
(4) Dropped Out: The percentage of the 2015 cohort who dropped out and did not return by the fall of the 2016–17 school year. It is calculated as follows:
number of students from the cohort who dropped out before fall of the 2016–17 school year
number of students in the 2015 cohort*
(5) Graduates & GED: The percentage of graduates and GED recipients in the 2015 cohort. It is calculated as follows:
number of students from the cohort who received a high school diploma by August 31, 2016 plus number of students from the cohort who received a GED by August 31, 2016
number of students in the 2015 cohort*
(6) Graduates, GED & Cont: The percentage of graduates, GED recipients, and continuers in the 2015 cohort. It is calculated as follows:
number of students from the cohort who received a high school diploma by August 31, 2016 plus number of students from the cohort who received a GED by August 31, 2016
plus number of students from the cohort who were enrolled in the fall of the 2016–17 school year
number of students in the 2015 cohort*
6-year Extended Longitudinal Rate
(1) Graduated: The percentage who received their high school diploma by August 31, 2016, for the 2014 cohort. It is calculated as follows:
number of students from the cohort who received a high school diploma by August 31, 2016
number of students in the 2014 cohort*

2016–17 TAPR Glossary October 2017
Texas Education Agency | Academics | Performance Reporting 20 of 32
(2) Received GED: For the 2014 cohort, the percentage who received a GED certificate by August 31, 2016. It is calculated as follows:
number of students from the cohort who received a GED by August 31, 2016
number of students in the 2014 cohort*
(3) Continued High School: The percentage of the 2014 cohort still enrolled as students in the fall of the 2016–17 school year. It is calculated as follows:
number of students from the cohort who were enrolled in the fall of the 2016–17 school year
number of students in the 2014 cohort*
(4) Dropped Out: The percentage of the 2014 cohort who dropped out and did not return by the fall of the2016–17 school year. It is calculated as follows:
number of students from the cohort who dropped out before fall of the 2016–17 school year
number of students in the 2014 cohort*
(5) Graduates & GED. The percentage of graduates and GED recipients in the 2014 cohort. It is calculated as follows:
number of students from the cohort who received a high school diploma by August 31, 2016 plus number of students from the cohort who received a GED by August 31, 2016
number of students in the 2014 cohort*
(6) Graduates, GED & Cont. The percentage of graduates, GED recipients, and continuers in the 2014 cohort. It is calculated as follows:
number of students from the cohort who received a high school diploma by August 31, 2016 plus number of students from the cohort who received a GED by August 31, 2016
plus number of students from the cohort who were enrolled in the fall of the 2016–17 school year
number of students in the 2014 cohort*
* The cohort in the denominator of the formulas shown above includes those students who graduated, continued in school, received a GED, or dropped out. It does not include data errors or leavers with the leaver reason codes 03, 16, 24, 60, 66, 78, 81, 82, 83, 85, 86, 87, 88, 89 or 90. See Annual Dropout Rate for a list of all the exclusions mandated by state statute for districts and campuses.
The graduation, continuation, GED recipient, and dropout rates sum to 100% (some totals may not equal exactly 100% due to rounding). Students served through special education who graduate with an individualized education program (IEP) are included as graduates.
Additional Information about Federal Graduation Rates
In addition to the detailed breakdown of the four-, five- and six-year longitudinal rates, the district and campus TAPRs show federal graduation rates for the following:

2016–17 TAPR Glossary October 2017
Texas Education Agency | Academics | Performance Reporting 21 of 32
(1) 4-Year Federal Graduation Rate. Cohort of students who first attended ninth grade in 2012–13. They are followed through their expected graduation with the class of 2016. It is calculated as follows:
number of students from the cohort who received a high school diploma by August 31, 2016
number of students in the 2016 cohort **
(2) 5-Year Extended Federal Graduation Rate. Cohort of students who first attended ninth grade in 2011–12. They are followed for five years to see if they graduated within a year after their expected graduation with the class of 2015. It is calculated as follows:
number of students from the cohort who received a high school diploma by August 31, 2016
number of students in the 2015 cohort**
(3) 6-Year Extended Federal Graduation Rate. Cohort of students who first attended ninth grade in 2010–11. They are followed for six years to see if they graduated within two years after their expected graduation with the class of 2014. It is calculated as follows:
number of students from the cohort who received a high school diploma by August 31, 2016
number of students in the 2014 cohort**
** The cohort in the denominator above includes those students who graduated, continued in school, received a GED, or dropped out. It does not include data errors or leavers with leaver reason codes 03, 16, 24, 60, 66, 78, 81, 82, 83, 85, 86, 87, or 90. Students with leaver codes 88 and 89 are included in the federal rates.
A student in a Texas Juvenile Justice Department facility or residential treatment facility served by a Texas public school district is excluded from district and campus graduation rates calculated for federal accountability purposes. Students served by special education who graduate with an individualized education program (IEP) are included as graduates.
For further information on these rates, see the report Secondary School Completion and Dropouts in Texas Public Schools, 2015–16. (Sources: PEIMS; Record 203, Student – School Leaver; Submissions 1 and 3 and General Educational Development Information File)
Masking: Concealing the performance results of small groups of students to comply with the Federal Educational Rights and Privacy Act (FERPA)
Please see Special Symbols for additional information.
Membership: The count of enrolled students that does not include those students who are served for less than two hours per day. For example, the count of Total Students excludes students who attend a nonpublic school but receive some services, such as speech therapy—for less than two hours per day—from their local public school district. (Source of data: PEIMS; Record 110, Student Data – Demographic, Submission 1)

2016–17 TAPR Glossary October 2017
Texas Education Agency | Academics | Performance Reporting 22 of 32
Mobility (campus profile only): The count and percentage of students who have been in membership at a school for less than 83% of the school year (i.e., missed six or more weeks).
number of mobile students in 2015–16
number of students who were in membership at any time during the 2015–16 school year
This rate is calculated at the campus level and disaggregated by race/ethnicity. The mobility rate shown in the “district” column is based on the count of mobile students identified at the campus level. The district mobility rate reflects school-to-school mobility within the same district or from outside the district. (Source of data: PEIMS; Record 400, Student – Basic Attendance, Submission 1)
Non-Educationally Disadvantaged: Those students not eligible to participate in free or reduced-price lunch or to receive any other public assistance. This is the complementary count and percentage to Economically Disadvantaged.
Number of Students per Teacher: The total number of students divided by the total teacher FTE count. (Source of data: PEIMS; Record 040, Staff – Identification/Demographic, Record 050, Staff – Employment – Payroll Summary, Record 090, Staff – Responsibilities, Submission 1)
Paired Schools: Two campuses that are combined virtually for the purpose of assigning accountability ratings. All campuses serving prekindergarten (PK) through grade 12 must receive an accountability rating. A campus that does not serve grade levels at which STAAR is administered is paired with another campus in the same district for accountability purposes. For example, Travis Primary (K–2) feeds students into Navarro Elementary (3–5). The district pairs these two campuses for accountability purposes. This means that the performance index outcome of Navarro Elementary is also used as the rating Travis Primary. For more information about paring, please see Chapter 6 in the 2017 Accountability Manual.
Professional Staff: The full-time equivalent (FTE) count of teachers, professional support staff, campus administrators, and on the district profile, central office administrators. Staff are grouped according to roles as reported in TSDS PEIMS. Each type of professional staff is shown as a percentage of the total staff FTE. See also Appendix A. (Source of data: PEIMS; Record 040, Staff – Identification/Demographic, Record 050, Staff – Employment – Payroll Summary, Record 090, Staff – Responsibilities, Submission 1)
Progress of Prior-Year Non-Proficient Students (Percentage of students who did not reach the satisfactory standard on at least one STAAR assessment in the previous year): The percentage of students in grades 4–8 who did not reach the satisfactory standard on STAAR (including STAAR Alternate 2 and STAAR A) in the prior year but passed the corresponding assessment in the current year. For 2017, rates for ELA/reading and mathematics are calculated as follows:
number of matched students who did not reach the satisfactory standard in 2016 but passed in 2017
number of matched students who did not reach the satisfactory standard in 2016

2016–17 TAPR Glossary October 2017
Texas Education Agency | Academics | Performance Reporting 23 of 32
For 2017, students in grades 4–8 included in these measures are those who
• took the spring 2017 STAAR (with or without accommodations) or STAAR Alternate 2 in ELA/reading and/or mathematics. This indicator does not include grade 3 test takers because that is the first STAAR test;
• are part of the 2017 accountability subset;
• can be matched to the spring 2016 STAAR administration—anywhere in the state—to find their prior year score for ELA/reading and/or mathematics; and
• did not reach the satisfactory standard on the 2016 STAAR administration of ELA/reading and/or mathematics.
Note this item does not apply to mathematics in 2016, because grade 3–8 mathematics was not included in 2015 accountability.
(Source of data: TEA Student Assessment Division)
Recommended High School Program: Please see Graduation Plan.
Retention Rates by Grade (not on campus profile): The percentage of students in Texas public schools who enrolled in fall 2016 in the same grade in which they were reported for the last six-week period of the prior school year (2015–16).
the number of students enrolled in the same grade from one school year to the next
the number of students enrolled from one school year who return the next year or who graduate
Special education retention rates are calculated and reported separately because local retention practices differ for students served by special education.
The TAPR shows retention rates only for grades K–8. Retention rates for all grades can be found in Grade-Level Retention in Texas Public Schools, 2015–16, available from TEA. (Source of data: PEIMS; Record 110, Student Data – Enrollment, Submission 1)
Revenue Information: Please see the PEIMS Financial Standard Reports at http://tea.texas.gov/financialstandardreports/.
SAT/ACT Results: Participation and performance of graduating seniors from all Texas public schools on the College Board’s SAT and ACT, Inc.’s ACT assessment. Only one record is sent per student. If a student takes an ACT and/or SAT test more than once, the agency receives the record for the most recent examination taken.
Nine values are calculated for this indicator:
(1) Tested: The percentage of graduates who took either college admissions test:
number of graduates who took either the SAT or the ACT
Total number of graduates reported

2016–17 TAPR Glossary October 2017
Texas Education Agency | Academics | Performance Reporting 24 of 32
(2) At/Above Criterion: The percentage of examinees who scored at or above the criterion score on either test (1110 on the SAT critical reading and mathematics sections combined, or 24 on the ACT composite):
number of graduating examinees who scored at or above the criterion score on either the SAT or the ACT
number of graduating examinees taking either the SAT or the ACT
(3) Average SAT Score (All Subjects): The average score for the SAT critical reading, writing, and mathematics combined. The maximum score is 2400. It is calculated as follows:
sum of total scores (critical reading + writing + mathematics) of all students who took the SAT
number of students who took the SAT
(4) Average SAT Score (English Language Arts): The average score for the SAT critical reading and writing combined. The maximum score is 1600. It is calculated as follows:
sum of total scores (critical reading + writing) of all students who took the SAT
number of students who took the SAT
(5) Average SAT Score (Mathematics): The average score for the SAT mathematics. The maximum score is 800. It is calculated as follows:
sum of total scores (mathematics) of all students who took the SAT
number of students who took the SAT
(6) Average ACT Score (All Subjects): The average score for the ACT composite. The maximum score is 36. It is calculated as follows:
sum of total composite scores of all students who took the ACT
number of students who took the ACT
(7) Average ACT Score (English Language Arts): The average score for the ELA ACT. The maximum score is 36. It is calculated as follows:
sum of total composite ELA scores of all students who took the ACT
number of students who took the ACT
(8) Average ACT Score (Mathematics): The average score for the mathematics ACT. The maximum score is 36. It is calculated as follows:
sum of total composite mathematics scores of all students who took the ACT
number of students who took the ACT
(9) Average ACT Score (Science): The average score for the science ACT. The maximum score is 36. It is calculated as follows:
sum of total composite science scores of all students who took the ACT
number of students who took the ACT

2016–17 TAPR Glossary October 2017
Texas Education Agency | Academics | Performance Reporting 25 of 32
Note: For the small percentage of students who took the redesigned SAT examination, their scores were converted to the equivalent scores on the previous SAT using College Board concordance tables.
See also Criterion Score. (Sources: The College Board, Aug. 2015, Sep. 2016; ACT, Inc. (ACT) Jul. 2015, Jul. 2016; and PEIMS; Record 203, Student – School Leaver and Graduation Program, Submission 1)
School Type: A specific label given to a campus for the purposes of determining its index targets. How it is labeled—elementary, middle, elementary/secondary, or high—is determined by the grades served by the campus as reported in the fall TSDS PEIMS enrollment snapshot. For more information about school types and how they are used in accountability, see Chapter 2 of the 2017 Accountability Manual.
Snapshot Date: The first submission of data to TSDS PEIMS of a new school year. Enrollment information submitted for this date is used for accountability. It is the last Friday of October. October 28, 2016, is the TSDS PEIMS snapshot date for the 2016–17 school year.
Special Education: The population of students served by special education programs. Assessment decisions for students in special education programs are made by their admission, review, and dismissal (ARD) committees. In the 2016–17 school year, a student in special education may have been administered the STAAR (with or without accommodations) or STAAR Alternate 2.
Other indicators that include the performance of students served by special education are advanced course/dual-credit course completion, attendance rate, annual dropout rates, college-ready graduates, longitudinal rates, and RHSP/DAP/FHSP rates. Information that would allow the separation of performance of students in special education on college admissions tests and on Advanced Placement and International Baccalaureate examinations is not available. Note that the Profile section of the report has student counts and percentages disaggregated by primary disability type. Also, in the Profile section retention rates (district profile only) for students receiving special education services are shown separately. See STAAR Special Education Assessments and STAAR Participation. (Source of data: PEIMS; Record 163, Student – Special Education Program, Submission 1)
Special Education Determination Status (district TAPR only): The 2016–17 TAPR provides the 2016–17 special education integrated intervention stage/determination status for each district on the cover page of the report. This label represents an integrated determination status based on an evaluation of each district’s Performance-Based Monitoring Analysis (PBMAS) indicators in the special education program area; the State Performance Plan (SPP) compliance indicators 9, 10, 11, 12, and 13; data integrity; uncorrected noncompliance; and audit findings. Districts receive one of four special education determination statuses:
• Meets Requirements
• Needs Assistance
• Needs Intervention
• Needs Substantial Intervention

2016–17 TAPR Glossary October 2017
Texas Education Agency | Academics | Performance Reporting 26 of 32
For more information, see the special education intervention guidance and resources documents at the following link:
http://tea.texas.gov/Student_Testing_and_Accountability/Monitoring_and_Interventions/Program_Monitoring_and_Interventions/Special_Education_Intervention_Guidance_and_Resources/.
Additional resources include the PBMAS Manual and the State Performance Plan at the following links:
http://tea.texas.gov/pbm/PBMASManuals.aspx
http://tea.texas.gov/Reports_and_Data/Data_Submission/State_Performance_Plan/State_Performance_Plan_and_Annual_Performance_Report_and_Requirements/
Special Symbols: Characters used to indicate certain, specific circumstances. The 2016–17 TAPR uses special symbols in the following circumstances:
• '^' Indicates that ELL rates at met or exceeded standard and exceeded standard include current and monitored students.
• An asterisk (*) is used to mask small numbers to comply with the federal Family Educational Rights and Privacy Act (FERPA).
• '**' Indicates that when only one group is masked, then the second smallest group is masked (regardless of size).
• '-' Indicates zero observations reported for this group.
• n/a indicates that the data are not available or not applicable.
• '***' Indicates that rates for Reading and Mathematics are based on the cumulative results from the first and second administrations of STAAR.
• A question mark (?) indicates data that are statistically improbable or were reported outside of a reasonable range.
For more information, see the Explanation of Masking at https://rptsvr1.tea.texas.gov/perfreport/tapr/2017/masking.html.
STAAR (State of Texas Assessments of Academic Readiness): A comprehensive testing program for public school students in grades 3–8 or high school courses with end-of-course (EOC) assessments. The STAAR program is designed to measure to what extent a student has learned, understood, and is able to apply the concepts and skills expected at each grade level or after completing each course for which an EOC assessment exists. Each STAAR test is linked directly to the Texas Essential Knowledge and Skills (TEKS). The TEKS are the state-mandated content standards that describe what a student should know and be able to do upon completion of a course. For more information on the TEKS, see the Texas Essential Knowledge and Skills website at http://tea.texas.gov/curriculum/teks/.
The performance section of the TAPR shows STAAR performance in different ways:
• By Grade and Subject: Grade 3 – reading and mathematics Grade 4 – reading, mathematics, and writing

2016–17 TAPR Glossary October 2017
Texas Education Agency | Academics | Performance Reporting 27 of 32
Grade 5 – reading, mathematics (1st and 2nd administration cumulative), and science Grade 6 – reading and mathematics Grade 7 – reading, mathematics, and writing Grade 8 – reading, mathematics (1st and 2nd administration cumulative), science, and
social studies
• By End-of-Course (EOC) Subject: English I English II Algebra I U.S. History Biology
• All Grades: STAAR Percentage at Approaches Grade Level Standard or Above (All Grades). The
accountability indicator used to determine the scores for Indices 1 and 3. The first measure under this indicator, All Subjects, combines all subjects and all grades.
STAAR Percentage at Meets Grade Level Standard. The percentage of students who are determined to be sufficiently prepared for postsecondary success by achieving the Meets Grade Level performance standard on two or more assessments. The measure Two or More Subjects includes the performance of 1) students who took only one assessment and scored at the Meets Grade Level Standard or better and 2) students who scored at the Meets Grade Level Standard or better on two or more assessments. A student who took more than one assessment and scored at the Meets Grade Level Standard on only one of them is not included in the count of postsecondary-ready students. This measure is part of determining the score for Index 4.
STAAR Percentage at Masters Grade Level Standard. The percentage of tests that met the Masters Grade Level performance standard. This indicator was part of determining the score for Index 3.
STAAR Percentage Met or Exceeded Progress. The percentage of tests that met or exceeded the STAAR or ELL progress measure expectations. See Chapter 4 of the 2017 Accountability Manual for more information. This indicator was used in determining the score for Index 2.
STAAR Percentage Exceeded Progress. The percentage of tests that exceeded the progress measure expectations. This indicator was used in determining the score for Index 2.
Other Important Information
• The Texas English Language Learner Progress Measure. Often referred to simply as the ELL progress measure, it provides year-to-year performance expectations on the STAAR content-area assessments for ELL students. The progress measure is based on a student’s level of English language proficiency and the amount of time he or she has attended school in the United States. Year-to-year performance expectations for the STAAR content-area tests identify ELL progress as meeting or exceeding an individual year-to-year expectation plan. An ELL’s plan is determined by the number of years the

2016–17 TAPR Glossary October 2017
Texas Education Agency | Academics | Performance Reporting 28 of 32
student has been enrolled in U.S. schools and the student’s Texas English Language Proficiency Assessment System (TELPAS) composite proficiency level. For detailed information regarding inclusion and exclusion of ELL performance, see Appendix I in the 2017 Accountability Manual.
• Substitute Assessments. Certain, specific assessments that students may take in place of an EOC assessment. Performance on the substitute assessments is used in calculating Index 1 and Index 4. For more information, see the Texas Administrative Code, §101.4002, at http://ritter.tea.state.tx.us/rules/tac/chapter101/ch101dd.html.
• Special Education. STAAR (with and without accommodations) and STAAR Alternate 2 results are included in all indices.
• Spanish STAAR. All STAAR tests in grades 3, 4, and 5 are available in both English and Spanish. The TAPR performance includes performance on the Spanish STAAR tests.
• Rounding of STAAR results. STAAR performance shown on the TAPR is rounded to whole numbers. For example, 49.877% is rounded to 50%; 49.4999% is rounded to 49%; and 59.5% is rounded to 60%.
• Masking. STAAR performance rates are masked when necessary to comply with FERPA. For more information, see the Explanation of Masking at https://rptsvr1.tea.texas.gov/perfreport/account/2017/masking.html. See STAAR Participation and Student Success Initiative. (Source of data: TEA Student Assessment Division)
STAAR Participation: The percentage of students who were administered a STAAR assessment. Includes STAAR (with and without accommodations), STAAR Alternate 2, and TELPAS. The details on the participation categories are as follows:
• Test Participant: 1) answer documents [STAAR (with and without accommodations), STAAR Alternate 2, TELPAS] with a score code of “S”, 2) STAAR Alternate 2 testers with a score code of “N”, 3) STAAR (with and without accommodations), STAAR Alternate 2 reading testers with a score code of “A” or “O” who also have a scored TELPAS assessment, and 4) year 1–5 asylee/refugees and SIFE mathematics testers with a scored TELPAS assessment. Included in Accountability: scored answer documents used in determining the
district or campus accountability rating, including substitute assessments with a score code of O
Not included in Accountability: answer documents counted as participants, but not used in determining the district or campus accountability rating ♦ Mobile: answer documents were excluded because the students enrolled in
the district or campus after the fall TSDS PEIMS submission dates (October 28, 2016, or October 30, 2015 for summer 2016 EOCs)
♦ Other Exclusions. The following answer documents were excluded from the rating determination: Answer documents for students who were tested only on the TELPAS or
TELPAS plus STAAR tests with score codes of A or O.

2016–17 TAPR Glossary October 2017
Texas Education Agency | Academics | Performance Reporting 29 of 32
Answer documents of students who are either an ELL who has been is school in the U.S. for less than two years or an asylee, refugee, or SIFE student who has been in school in the U.S. for less than six years.
Answer documents of ELL students who have been in U.S. schools for two to four years, took the STAAR in English, and for whom an ELL progress measure was not calculated for reasons other than parental denial of services or the student having exceeded the ELL progress measure plan.
Answer documents of STAAR Alternate 2 testers with a score code of N.
• Not Tested: answer documents with score codes A or O Absent: answer documents with a score code A Other: answer documents with score codes O, except for substitute assessments.
The denominator for participation is the sum of these five categories: Included in Acct, Mobile, Other Exclusions, and Not Tested (Absent and Other). STAAR Participation Rate is rounded to whole numbers. For example, 94.49% is rounded to 94%. Small values may show as zero: 0.4% is rounded to 0%, and 0.6% is rounded to 1%. (Source of data: TEA Student Assessment Division)
Staff Exclusions (not on campus profile): The counts of individuals who serve public school students but are not included in the FTE totals for any of the other employee statistics. There are two types of these entries: individuals participating in a shared services arrangement and individuals on contract with the district to provide instructional services. Shared Services Arrangement (SSA) Staff are staff who work in schools located in districts other than their employing district or whose assigned organization (in TSDS PEIMS) shows a code of 751, indicating that they are employed by the fiscal agent of an SSA. Only the portion of a person’s total FTE amount associated with the school in another district (or with the 751 organization code) is counted as SSA. SSA staff are grouped into three categories: Professional Staff (which includes teachers, administrators, and professional support); Educational Aides; and Auxiliary Staff. Note that SSA Auxiliary Staff are identified by the type of fund from which they are paid. Contracted Instructional Staff (District and Campus Profiles) refers to counts of instructors for whom the district has entered into a contractual agreement with some outside organization. Through the contract, the outside organization has committed to supplying instructional staff for the district. They are never employees of the reporting school district. (Source of data: PEIMS; Record 055, District Finance Data – Contracted Instructional Staff, Record 060 – Staff Data – Employment Payroll Accounting, Submission 1)
Student Enrollment by Program: The count and percentage of students served in programs and/or courses for special education, career and technical education, bilingual/ESL education, or gifted and talented education. The percentages do not total to 100 because students may participate in more than one of these programs. (Source of data: PEIMS; Record 110 – Student – Enrollment, Record 163 – Student – Special Education Program, Record 169 – Student – Career and Technical Education Program, Submission 1)

2016–17 TAPR Glossary October 2017
Texas Education Agency | Academics | Performance Reporting 30 of 32
Student Success Initiative (SSI): Grade-advancement requirements enacted by the 76th Legislature in 1999 that requires students to demonstrate proficiency on the mathematics and reading assessments at grades 5 and 8.
For 2017, the TAPR shows the following for each SSI grade:
(1) Students Meeting Approaches Grade Level Standard on First STAAR Administration: The percentage of students who met Approaches Grade Level during the first administration. It is calculated as follows:
number of students who met Approaches Grade Level in the first administration
number of students tested in the first administration
(2) Students Requiring Accelerated Instruction: The percentage of students who did not pass the first administration of the STAAR. It is calculated as follows:
number of students who did not meet the standard in the first administration
number of students in the first administration
(3) STAAR Cumulative Met Standard: The cumulative (and unduplicated) percentage of students who took and passed the tests in the first and second administrations combined. It is calculated as follows:
number of students who passed the test in either of the first two administrations cumulative number of students who took the test in either of the first two
administrations
The SSI grade-advancement requirement was suspended for the 2015–16 school year, and the June administrations of STARR for grade 5 and grade 8 were cancelled. As a result, Information on prior-year non-proficient students is unavailable.
For more information, see TEA’s Student Assessment Division SSI site at http://tea.texas.gov/student.assessment/ssi/
(Source of data: TEA Student Assessment Division)
Students by Grade: The count of students in each grade divided by the total number of students. (Source of data: PEIMS; Record 110, Student Data – Enrollment, Submission 1)
Students with Disabilities by Type of Primary Disability: The count of students disaggregated by primary disability. The TAPR uses five categories of primary disability: Students with Intellectual Disabilities (TSDS PEIMS disability codes 06, 08, 12, 13), Students with Physical Disabilities (TSDS PEIMS disability codes 01, 03, 04, 05, 09), Students with Autism (TSDS PEIMS disability code 10), Students with Behavioral Disabilities (TSDS PEIMS disability codes 02 and 07), and Students with Non-Categorical Early Childhood (TSDS PEIMS disability code 14). (Source of data: PEIMS; Record 163, Student – Special Education Program)
Students with Disciplinary Placements: The count and percentage of students placed in alternative education programs under Chapter 37 of the Texas Education Code (Discipline; Law and Order). Districts report the disciplinary actions taken toward students who are removed

2016–17 TAPR Glossary October 2017
Texas Education Agency | Academics | Performance Reporting 31 of 32
from the classroom for at least one day. Although students can have multiple removals throughout the year, this measure counts students only once and includes only those whose removal results in a placement in a disciplinary alternative education program or juvenile justice alternative education program. It is calculated as follows:
number of students with one or more disciplinary placements
number of students who were in attendance at any time during the school year
For 2016–17, the following 19 action codes on the PEIMS 425 record are included as disciplinary placements: 02, 03, 04, 07, 08, 10, 12, 13, 14, 15, 51, 52, 53, 54, 55, 57, 59, 60, and 61. (Source of data: PEIMS; Record 425, Disciplinary Action Data, Submission 3)
Superintendent: The educational leader and administrative manager of the district or charter operator. It includes other titles that may apply to charter operators, such as chief executive officer, president, and chief administrative officer.
Tax Information: This information, including tax rates and assessed district property values, is available on the PEIMS Financial Standard Reports at http://tea.texas.gov/financialstandardreports/.
Teachers by Ethnicity and Sex: The counts of teacher FTEs by ethnic group and by sex. Counts are also expressed as a percentage of the total teacher FTEs. (Source of data: PEIMS; Record 040, Staff – Identification/Demographic, Record 050, Staff – Employment – Payroll Summary, Record 090, Staff – Responsibilities, Submission 1)
Teachers by Highest Degree Held: The distribution of degrees held by teachers. The FTE counts of teachers with no degree, a bachelor’s degree, a master’s degree, or a doctorate are expressed as a percentage of the total teacher FTEs. (Source of data: PEIMS; Record 040, Staff – Identification/Demographic, Record 050, Staff – Employment – Payroll Summary, Record 090, Staff – Responsibilities, Submission 1)
Teachers by Program (population served) (district profile only): The FTE count of teachers categorized by the type of student populations served: regular, special, compensatory, career and technical, bilingual/ESL, gifted and talented education students, and other populations. Teacher FTE values are allocated across population types for teachers who serve multiple population types. Percentages are expressed as a percentage of total teacher FTEs. (Source of data: PEIMS; Record 040, Staff – Identification/Demographic, Record 050, Staff – Employment – Payroll Summary, Record 090, Staff – Responsibilities, Submission 1)
Teachers by Years of Experience: The FTE count of teachers by total years of experience for the individual, not necessarily years of experience in the reporting district or campus. Teacher counts within each range of experience are expressed as a percentage of total teacher FTEs. A beginning teacher is a teacher reported with zero years of experience. (Source of data: PEIMS; Record 040, Staff – Identification/Demographic, Record 050, Staff – Employment – Payroll Summary, Record 090, Staff – Responsibilities, Submission 1)

2016–17 TAPR Glossary October 2017
Texas Education Agency | Academics | Performance Reporting 32 of 32
Texas Success Initiative Assessment (TSIA): The percentage of annual graduates who met the TSI criteria on the TSIA
Percentages are calculated and shown for English and mathematics separately.
number of 2015–16 annual graduates who met the TSI criteria on the TSIA number of 2015–16 annual graduates
(Source of data: THECB [applicable scores from June 2011 through October 2016] and Record 203, Student – School Leaver, Submissions 1 and 3)
Total Staff: The total count of staff which includes professional staff (teachers, professional support, administrators), educational aides, and (on the district profile) auxiliary staff. Minority staff is the sum of the FTE counts for all non-white staff groups (African American, Hispanic, American Indian, Asian, Pacific Islander, and Two or More Races). The minority staff FTE count is expressed as a percentage of the total staff FTE. (Source of data: PEIMS; Record 040, Staff – Identification/Demographic, Record 050, Staff – Employment – Payroll Summary, Record 090, Staff – Responsibilities, Submission 1)
Total Students: The total number of public school students who were reported in membership on October 28, 2016, at any grade from early childhood education through grade 12. Membership differs from enrollment because it does not include those students who are served in the district for less than two hours per day. For example, the count of Total Students excludes students who attend a nonpublic school but receive some services, such as speech therapy—for less than two hours per day—from their local public school district. (Source of data: PEIMS; Record 110, Student Data – Demographic, Submission 1)
Turnover Rate for Teachers (not on campus profile): The percentage of teachers from the fall of 2015–16 who were not employed in the district in the fall of 2016–17. It is calculated as the total FTE count of teachers from the fall of 2015–16 who were not employed in the district in the fall of 2016–17, divided by the total teacher FTE count for the fall of 2015–16. Staff who remained employed in the district but not as teachers also count toward teacher turnover. (Source of data: PEIMS; Record 050, Staff – Employment – Payroll Summary, Record 090, Staff Data – Responsibilities, Submission 1)

Texas Education Agency | Academics | Performance Reporting
Who to Call Information about the calculation of all Texas Academic Performance Report (TAPR) data elements is provided in this Glossary. If, after reading the Glossary you have questions about the calculation of TAPR indicators, contact Performance Reporting at (512) 463-9704.
Questions related to programs and policies for the following subjects should be directed to the contacts listed below.
Subject Contact Number Accountability Ratings (methodology) Performance Reporting ................................................. (512) 463-9704 Advanced Courses Curriculum ....................................................................... (512) 463-9581 Charter Schools Charter Schools .............................................................. (512) 463-9575 College Admissions Tests: SAT College Board .................................................................. (512) 721-1800 ACT ACT Regional Office ...................................................... (512) 320-1850 Copies of TAPR reports https://rptsvr1.tea.texas.gov/perfreport/tapr/index.html DAEP (Disciplinary Alternative Education Program) Discipline, Law, and Order........................................... (512) 463-9286 Distinguished Achievement Program Curriculum ....................................................................... (512) 463-9581 Distinction Designations Performance Reporting ................................................. (512) 463-9704 Dropouts Accountability Research ................................................ (512) 475-3523 English Language Learners Testing Issues Student Assessment ....................................................... (512) 463-9536 Other Issues Special Populations ......................................................... (512) 463-9414 Financial Standard Reports State Funding ................................................................... (512) 463-9238 General Inquiry General Inquiries ............................................................ (512) 463-9290 Graduates Accountability Research ................................................ (512) 475-3523 Graduates Enrolled in Texas IHE Texas Higher Education Coordinating Board .......... (512) 427-6101 JJAEP (Juvenile Justice Alternative Education Program) Discipline, Law, and Order........................................... (512) 463-9286 Federal Accountability Federal and State Education Policy ............................. (512) 463-9414 PBM Special Education Monitoring Results Status School Improvement .................................................... (512) 463-5226 PEIMS (TSDS PEIMS) PEIMS HelpLine ............................................................... (512) 463-9229 Recommended High School Program Curriculum ....................................................................... (512) 463-9581 Retention Policy Curriculum ....................................................................... (512) 463-9581 School Finance State Funding ................................................................... (512) 463-9238 School Governance School Governance ........................................................ (512) 463-9623 School Report Card Performance Reporting ................................................. (512) 463-9704 Special Education Testing Issues Student Assessment ....................................................... (512) 463-9536 Other Issues Special Populations ......................................................... (512) 463-9414 STAAR (all assessments) Student Assessment ....................................................... (512) 463-9536 STAAR Testing Contractor ETS .................................................................................... (855) 333-7770 Pearson ............................................................................. (800) 328-5999 Austin Operational Center .......................................... (512) 989-5300 Statutory (Legal) Issues Legal Services ................................................................... (512) 463-9720 TAIS Texas Accountability Intervention System ............... (512) 463-9414 TELPAS Student Assessment ....................................................... (512) 463-9536
Information on the Internet: http://tea.texas.gov/accountability/


Appendix B
Texas Education Agency | Academics | Performance Reporting
Advanced Academic Courses 2016–17 Texas Academic Performance Reports
• All courses shown were for the 2015–16 school year.
• An “A” prefix indicates a College Board Advanced Placement course.
• An “I” prefix indicates an International Baccalaureate course.
• Dual-credit courses are not specifically shown on this list.
English Language Arts 03221100 Research/Technical Writing 03221200 Creative Writing 03221500 Literary Genres 03221600 Humanities (First Time Taken) 03221800 Independent Study In English (First Time Taken) 03231000 Independent Study In Journalism (First Time Taken) 03231902 Advanced Broadcast Journalism III 03240400 Oral Interpretation III 03240800 Debate III 03241100 Public Speaking III 03241200 Independent Study In Speech (First Time Taken) A3220100 AP English Language and Composition A3220200 AP English Literature and Composition I3220300 IB English III I3220400 IB English IV
Mathematics 03101100 Pre Calculus 03102500 Independent Study In Mathematics (1st Time Taken) 03102501 Independent Study In Mathematics (Second Time Taken) A3100101 AP Calculus AB A3100102 AP Calculus BC A3100200 AP Statistics I3100100 IB Mathematical Studies, Standard Level I3100200 IB Mathematics, Standard Level I3100300 IB Mathematics, Higher Level I3100400 IB Further Mathematics, Standard Level

Appendix B
Texas Education Agency | Academics | Performance Reporting
Technology Applications 03580200 Computer Science I 03580300 Computer Science II A3580100 AP Computer Science A I3580200 IB Computer Science I, Standard Level I3580300 IB Computer Science II, Higher Level I3580400 IB Information Technology In A Global Society SL
Fine Arts 03150400 Music IV Band 03150800 Music IV Orchestra 03151200 Music IV Choir 03151600 Music IV Jazz Band 03152000 Music IV Instrumental Ensemble 03152400 Music IV Vocal Ensemble 03250400 Theatre Arts IV 03251000 Theatre Production IV 03251200 Technical Theatre IV 03502300 Art IV Drawing 03502400 Art IV Painting 03502500 Art IV Printmaking 03502600 Art IV Fibers 03502700 Art IV Ceramics 03502800 Art IV Sculpture 03502900 Art IV Jewelry 03503100 Art IV Photography 03830400 Dance IV A3150200 AP Music Theory A3500100 AP History Of Art A3500300 AP Art/Drawing A3500400 AP Art/Two-Dimensional Design Portfolio A3500500 AP Art/Three-Dimensional Design Portfolio I3250200 IB Music SL I3250300 IB Music HL I3600100 IB Art/Design HL I3600200 IB Art/Design SL-A I3750200 IB Theatre Arts SL I3750300 IB Theatre Arts HL I3830200 IB Dance - HL

Appendix B
Texas Education Agency | Academics | Performance Reporting
Science A3010200 AP Biology A3020000 AP Environmental Science A3040000 AP Chemistry A3050002 AP Physics C I3020000 IB Environmental Systems and Societies I3030001 IB Design Technology SL I3030002 IB Design Technology HL
Social Studies/History 03310301 Economics Advanced Studies (First Time Taken) 03380001 Social Studies Advanced Studies (First Time Taken) A3310100 AP Microeconomics A3310200 AP Macroeconomics A3330100 AP United States Government and Politics A3330200 AP Comparative Government and Politics A3340100 AP United States History A3340200 AP European History A3350100 AP Psychology A3360100 AP Human Geography A3370100 AP World History I3301100 IB History I3301200 IB History: Africa I3301300 IB History: Americas I3301400 IB History: East and Southeast Asia I3301500 IB History: Europe I3302100 IB Geography, Standard Level I3302200 IB Geography, Higher Level I3303100 IB Economics, Standard Level I3303200 IB Economics, Higher Level I3303300 IB Business and Management I I3303400 IB Business and Management II I3304100 IB Psychology, Standard Level I3304200 IB Psychology, Higher Level I3366010 IB Philosophy

Appendix B
Texas Education Agency | Academics | Performance Reporting
Advanced Languages (Modern or Classical) 03110400 Arabic IV 03110500 Arabic V 03110600 Arabic VI 03110700 Arabic VII 03120400 Japanese IV 03120500 Japanese V 03120600 Japanese VI 03120700 Japanese VII 03400400 Italian IV 03400500 Italian V 03400600 Italian VI 03400700 Italian VII 03410400 French IV 03410500 French V 03410600 French VI 03410700 French VII 03420400 German IV 03420500 German V 03420600 German VI 03420700 German VII 03430400 Latin IV 03430500 Latin V 03430600 Latin VI 03430700 Latin VII 03440400 Spanish IV 03440440 Spanish For Spanish Speakers IV 03440500 Spanish V 03440550 Spanish For Spanish Speakers V 03440600 Spanish VI 03440660 Spanish For Spanish Speakers VI 03440700 Spanish VII 03440770 Spanish For Spanish Speakers VII 03450400 Russian IV 03450500 Russian V 03450600 Russian VI 03450700 Russian VII 03460400 Czech IV 03460500 Czech V 03460600 Czech VI 03460700 Czech VII

Appendix B
Texas Education Agency | Academics | Performance Reporting
Advanced Languages (cont.) 03470400 Portuguese IV 03470500 Portuguese V 03470600 Portuguese VI 03470700 Portuguese VII 03480400 Hebrew IV 03480500 Hebrew V 03480600 Hebrew VI 03480700 Hebrew VII 03490400 Chinese IV 03490500 Chinese V 03490600 Chinese VI 03490700 Chinese VII 03510400 Vietnamese IV 03510500 Vietnamese V 03510600 Vietnamese VI 03510700 Vietnamese VII 03520400 Hindi IV 03520500 Hindi V 03520600 Hindi VI 03520700 Hindi VII 03980400 American Sign Language IV 03980500 American Sign Language V 03980600 American Sign Language VI 03980700 American Sign Language VII 03996000 Other Foreign Languages Level IV 03996100 Other Foreign Languages Level V 03996200 Other Foreign Languages Level VI 03996300 Other Foreign Languages Level VII A3120400 AP Japanese IV A3410100 AP French IV A3420100 AP German IV A3430100 AP Latin IV A3440100 AP Spanish IV A3440200 AP Spanish V A3490400 AP Chinese IV I3110400 IB Arabic IV I3110500 IB Arabic V I3120400 IB Japanese IV I3120500 IB Japanese V I3410400 IB French IV I3410500 IB French V I3420400 IB German IV

Appendix B
Texas Education Agency | Academics | Performance Reporting
Advanced Languages (cont.) I3420500 IB German V I3430400 IB Latin IV I3430500 IB Latin V I3440400 IB Spanish IV I3440500 IB Spanish V I3440600 IB Spanish VI I3440700 IB Spanish VII I3450400 IB Russian IV I3450500 IB Russian V I3480400 IB Hebrew IV I3480500 IB Hebrew V I3490400 IB Chinese IV I3490500 IB Chinese V I3490600 IB Chinese VI I3490700 IB Chinese VII I3520400 IB Hindi IV I3520500 IB Hindi V I3663600 IB Languages Other Than English Level VI - Other I3663700 IB Languages Other Than English Level VII - Other I3996000 IB Languages Other Than English Level IV - Other I3996100 IB Languages Other Than English Level V - Other
Other I3000100 IB Theory Of Knowledge I3305100 IB World Religions A I3366100 IB World Religions B N1290317 GT Independent Study Mentorship III N1290318 GT Independent Study Mentorship IV


![2013-14 Texas Academic Performance Report (TAPR) [insert district name] [insert district logo above]](https://static.fdocuments.us/doc/165x107/56649d985503460f94a831bf/2013-14-texas-academic-performance-report-tapr-insert-district-name-insert.jpg)