TEA Expedited Waivers Texas Academic Performance Report ...
21
TEA Expedited Waivers Texas Academic Performance Report Drop Out Prevention February 6, 2014 KISD – an exceptional district in which to learn, work and live. KISD – an exceptional district in which to learn, work and live.
Transcript of TEA Expedited Waivers Texas Academic Performance Report ...

TEA Expedited Waivers
Texas Academic Performance Report
Drop Out Prevention
February 6, 2014
KISD – an exceptional district in which to learn, work and live. KISD – an exceptional district in which to learn, work and live.

TEA EXPEDITED WAIVERS
• Early Release
• Foreign Exchange Student
• Modified Schedule State Assessment Testing
• Staff Development
• Teacher Data Portal of the Texas Assessment Management System
• Timeline for Accelerated Instruction
STAAR Content Area Exams by Grade Level Reading Writing Math Science S. Studies
3-8 4 and 7 3-8 5 and 8 8
12 STAAR End of Course Exams
English I English II English III
Algebra I
Geometry Algebra II
Biology Chemistry
Physics
W. Geography W. History
U.S. History
TAKS (Texas Assessment of Knowledge and Skills)
English Language Arts Math Science S. Studies
State Assessments Included in TAPR

STAAR Content Area Exams by Grade Level Reading Writing Math Science S. Studies
3-8 4 and 7 3-8 5 and 8 8
5 STAAR End of Course Exams (Class of 2015 and beyond)
English I English II English III
Algebra I
Geometry Algebra II
Biology Chemistry
Physics
W. Geography W. History
U.S. History
TAKS (Texas Assessment of Knowledge and Skills) (Class of 2014)
English Language Arts Math Science S. Studies
State Assessments Included in TAPR

STAAR Performance Standards
Phase I 2011-2012 2012-2013 2013-2014
Phase 2
Final
Level 1: Unsatisfactory
Level II: Satisfactory
Level III: Advanced Academics
Not Passing Passing

KISD State Region
ELA Reading 92% 80% 83%
ELA Writing 79% 63% 66%
Mathematics 88% 79% 81%
Science 91% 82% 84%
Social Studies 87% 76% 80%
2012-2013 STAAR/EOC District Performance Phase-in 1: Level II or Above
Sum of All Grades Tested
KISD – an exceptional district in which to learn, work and live.

STAAR Progress Measure
KISD – an exceptional district in which to learn, work and live.
Contents Grades/Courses KISD State Region
Reading Grades 4-English II 68% 62% 63%
Writing English II 45% 45% 44%
Mathematics Grades 4-Algebra I 62% 59% 59%
• Measures year to year progress
• Progress measure categories: Did Not Meet, Met, or Exceeded

College Readiness
AP SAT PSAT ACT Graduation Rate
High School Allotment
KISD – an exceptional district in which to learn, work and live.

KISD AP Participation- 3 Year Overview
KISD – an exceptional district in which to learn, work and live.
2011
# of Test Takers
2012
# of Test Takers
2013
# of Test Takers
2013
Change over 3 years
KISD Total 1592 1743 2086 +494
Female 906 969 1156
Male 686 774 930
American Indian 15 8 11
Asian 209 224 279
Black 73 85 116
Hispanic overall 205 234 320
Mexican American 102 111 161
Puerto Rican 19 23 29
Other Hispanic 84 100 130
White 1011 1087 1298
Other 19 24 50
Data Source: College Board Integrated Summary Report, pg. 20

KISD – an exceptional district in which to learn, work and live.
21.5
27.3 26.9 31.3
0
10
20
30
40
2010 2011 2012 2013
CHS AP Equity in Excellence
20 16.7
23.2 23.2
0
5
10
15
20
25
30
2010 2011 2012 2013
FRHS AP Equity in Excellence
34.8 33.7 35.8 37.7
0
10
20
30
40
2010 2011 2012 2013
KHS AP Equity in Excellence
21.4 24.1
0
10
20
30
2012 2013
TCHS AP Equity in Excellence
AP Equity in Excellence Report - Spring 2013
Data Source : 2013 College Board AP Online Reporting

KISD – an exceptional district in which to learn, work and live.
College Board Integrated Summary Report
St: 46% Ntl: 57%
Data Source: College Board Integrated Summary Report, pg. 24

KISD – an exceptional district in which to learn, work and live.
College Board recognized KISD as one of 12 districts in Texas, for a growing AP program
Fossil Ridge High School received STEM Grant (science, technology, engineering, and mathematics)
KISD Recognitions
KISD – an exceptional district in which to learn, work and live.
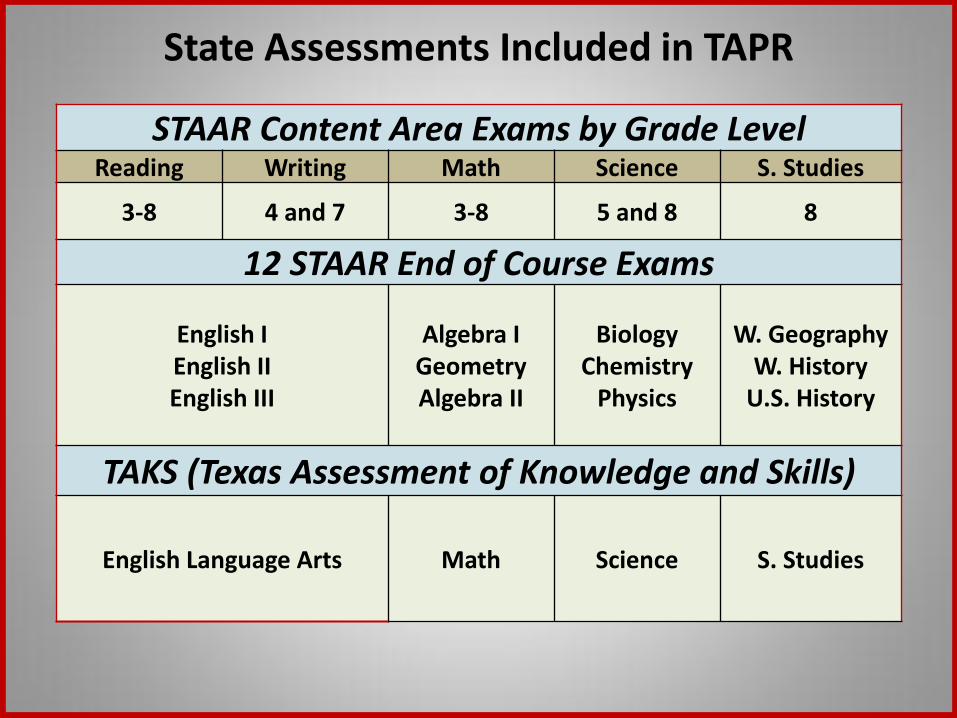
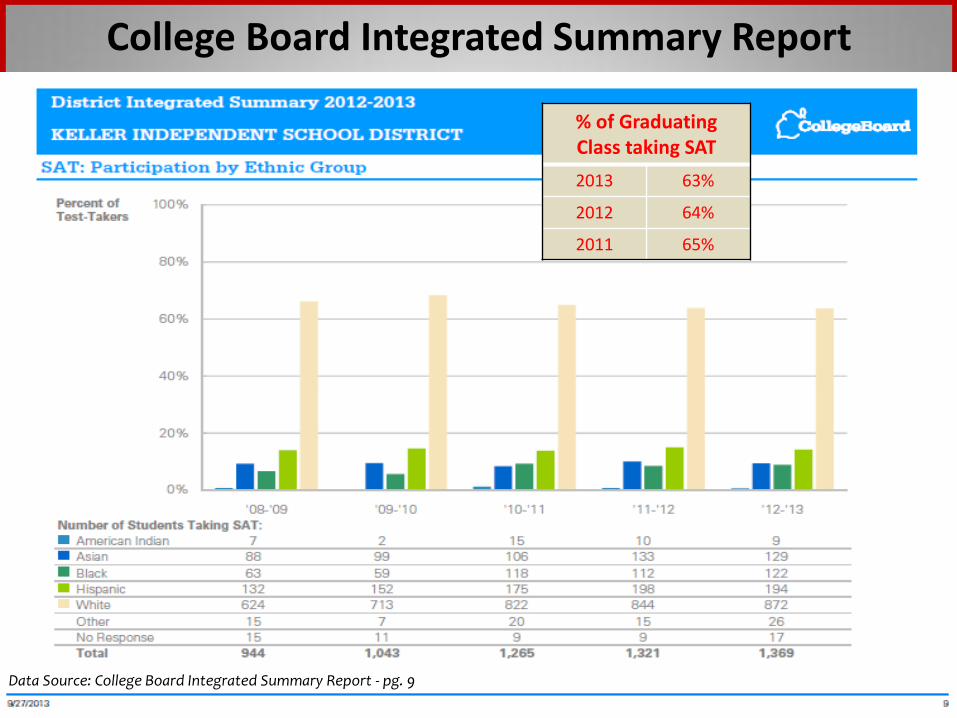
College Board Integrated Summary Report
% of Graduating Class taking SAT
2013 63%
2012 64%
2011 65%
Data Source: College Board Integrated Summary Report - pg. 9

KISD – an exceptional district in which to learn, work and live.
College Board Integrated Summary Report
534 534
530
533
531
2009 2010 2011 2012 2013
SAT Math State 471 Nat. 491
Data Source: College Board Integrated Summary Report, pgs. 7-8
519
512
514
517 517
2009 2010 2011 2012 2013
SAT Reading State 471
Nat. 491
503
494 493
496 496
2009 2010 2011 2012 2013
SAT Writing State 456
Nat. 480
State 496
Nat. 503

KISD – an exceptional district in which to learn, work and live.
2010-2011 2011-2012 2012-2013
520 521 521
466 472 469
Reading SAT Performance
PSAT
Non PSAT
2010-2011 2011-2012 2012-2013
536 537 535
480 480 475
Math SAT Performance
PSAT
Non PSAT
2010-2011 2011-2012 2012-2013
498 501 499
444 449 451
Writing SAT Performance
PSAT
Non PSAT
College Board Integrated Summary Report
Data Source: College Board Integrated Summary Report, pg. 13

KISD – an exceptional district in which to learn, work and live.
21.6
22 21.9
22.1 22.1
2009 2010 2011 2012 2013
ACT English State: 19.8 Nat: 20.2
ACT 5 Year Trends – Average ACT Scores
22.6
23.3
23.1 23.2
23.1
2009 2010 2011 2012 2013
ACT Math State: 21.5 Nat: 20.9
22.9 23
22.6
23.1 23
2009 2010 2011 2012 2013
ACT Reading State: 21.0 Nat: 21.1
22.1
22.7
22.5 22.6 22.6
2009 2010 2011 2012 2013
ACT Science State: 20.9 Nat: 20.7
22.4
22.9
22.7
22.9 22.8
2009 2010 2011 2012 2013
ACT Composite State: 20.9 Nat: 20.9
Data Source: ACT Profile Report 2013
KISD – an exceptional district in which to learn, work and live.
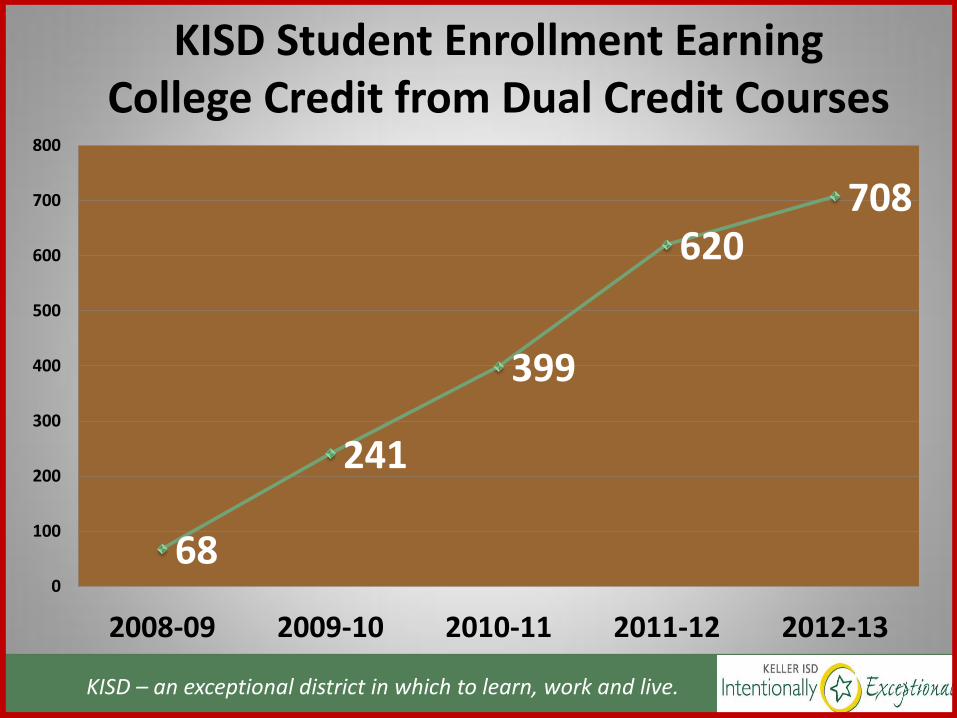
KISD Student Enrollment Earning College Credit from Dual Credit Courses
68
241
399
620 708
0
100
200
300
400
500
600
700
800
2008-09 2009-10 2010-11 2011-12 2012-13

KISD – an exceptional district in which to learn, work and live.
Advanced Course/Dual Enrollment Completion Comparisons
26.80%
33.50% 33.70%
40%
46% 49%
10%
15%
20%
25%
30%
35%
40%
45%
50%
55%
Birdville ISD Keller ISD Denton ISD Mansfield ISD Grapevine-ColleyvilleISD
Carroll ISD

KISD – an exceptional district in which to learn, work and live. Data Source : AEIS District Data Report – Multi-Year History Report KISD – an exceptional district in which to learn, work and live.
SAT Student Participation
ACT Student Participation
PSAT and ReadiStep
KISD – College Readiness 2009-2012
+400
+230
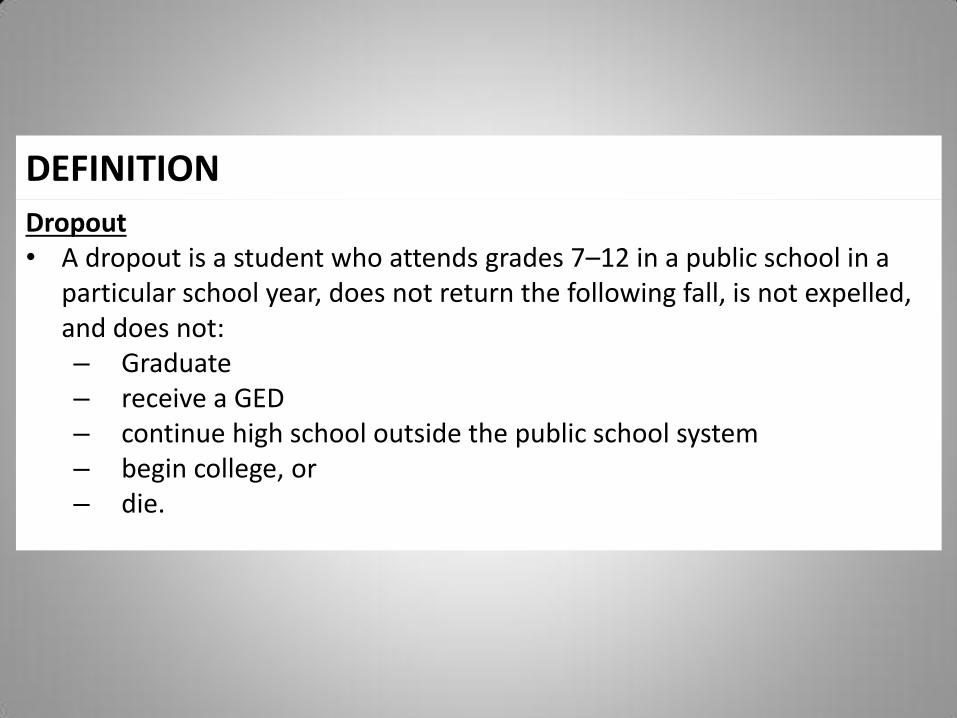
DEFINITION
Dropout • A dropout is a student who attends grades 7–12 in a public school in a
particular school year, does not return the following fall, is not expelled, and does not: – Graduate – receive a GED – continue high school outside the public school system – begin college, or – die.

Annual Dropout Rates
Class of 2008
Class of 2009
Class of 2010
Class of 2011
Class of 2012
*Grades 7-8 0.0% 0.1% 0.0% 0.1% 0.1%
Grades 9-12 1.4% 1.3% 0.7% 0.6% 1.0%
* Standard Accountability Indicator