2015-16 Texas Academic Performance Report · 2015-16 Texas Academic Performance Report District...
224
2015-16 Texas Academic Performance Report 2015-16 Texas Academic Performance Report District Name: MANOR ISD District Number: 227907 2016 Accountability Rating: Met Standard 2016 Special Education Determination Status: Needs Intervention
Transcript of 2015-16 Texas Academic Performance Report · 2015-16 Texas Academic Performance Report District...
2015-16 Texas Academic Performance Report2015-16 Texas Academic Performance Report
District Name: MANOR ISD
District Number: 227907
2016 Accountability Rating: Met Standard
2016 Special Education Determination Status:
Needs Intervention

This page intentionally left blank.
TEA Division of Performance Reporting Page 1
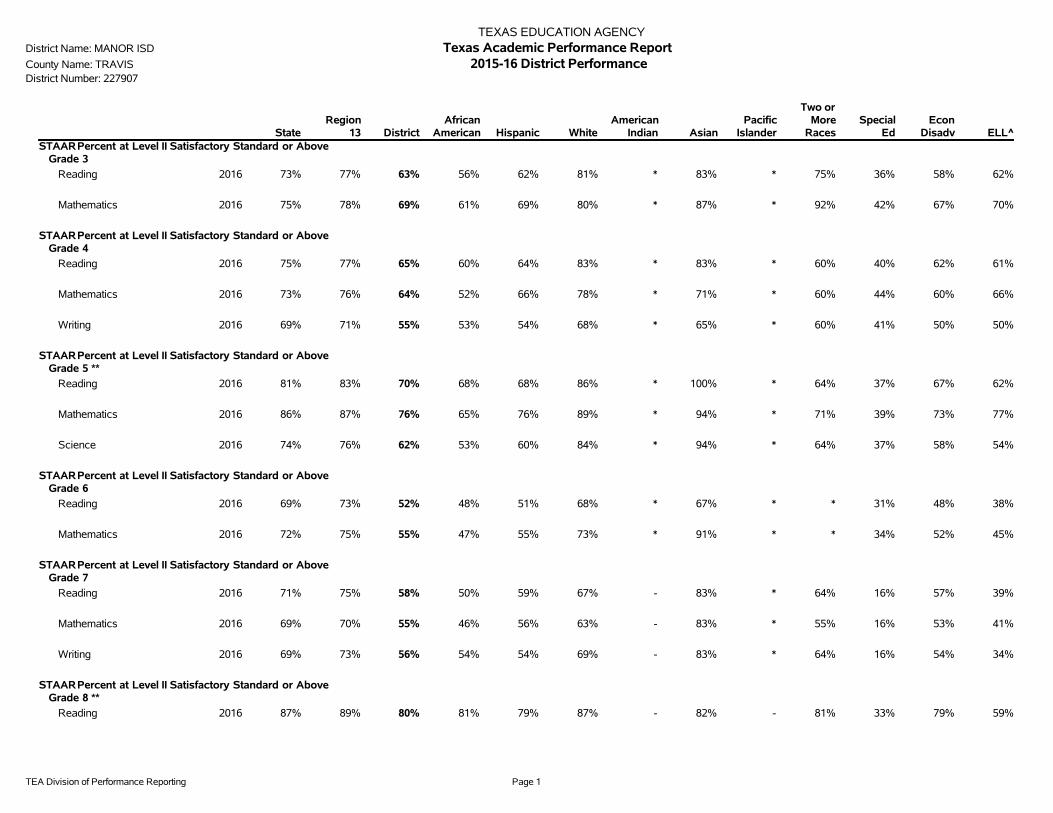
TEXAS EDUCATION AGENCYDistrict Name: MANOR ISD Texas Academic Performance ReportCounty Name: TRAVIS 2015-16 District PerformanceDistrict Number: 227907
StateRegion
13 DistrictAfrican
American Hispanic WhiteAmerican
Indian AsianPacific
Islander
Two orMore
RacesSpecial
EdEcon
Disadv ELL^STAARPercent at Level II Satisfactory Standard or Above
Grade 3
Reading 2016 73% 77% 63% 56% 62% 81% * 83% * 75% 36% 58% 62%
Mathematics 2016 75% 78% 69% 61% 69% 80% * 87% * 92% 42% 67% 70%
STAARPercent at Level II Satisfactory Standard or AboveGrade 4
Reading 2016 75% 77% 65% 60% 64% 83% * 83% * 60% 40% 62% 61%
Mathematics 2016 73% 76% 64% 52% 66% 78% * 71% * 60% 44% 60% 66%
Writing 2016 69% 71% 55% 53% 54% 68% * 65% * 60% 41% 50% 50%
STAARPercent at Level II Satisfactory Standard or AboveGrade 5 **
Reading 2016 81% 83% 70% 68% 68% 86% * 100% * 64% 37% 67% 62%
Mathematics 2016 86% 87% 76% 65% 76% 89% * 94% * 71% 39% 73% 77%
Science 2016 74% 76% 62% 53% 60% 84% * 94% * 64% 37% 58% 54%
STAARPercent at Level II Satisfactory Standard or AboveGrade 6
Reading 2016 69% 73% 52% 48% 51% 68% * 67% * * 31% 48% 38%
Mathematics 2016 72% 75% 55% 47% 55% 73% * 91% * * 34% 52% 45%
STAARPercent at Level II Satisfactory Standard or AboveGrade 7
Reading 2016 71% 75% 58% 50% 59% 67% - 83% * 64% 16% 57% 39%
Mathematics 2016 69% 70% 55% 46% 56% 63% - 83% * 55% 16% 53% 41%
Writing 2016 69% 73% 56% 54% 54% 69% - 83% * 64% 16% 54% 34%
STAARPercent at Level II Satisfactory Standard or AboveGrade 8 **
Reading 2016 87% 89% 80% 81% 79% 87% - 82% - 81% 33% 79% 59%
TEA Division of Performance Reporting Page 2
TEXAS EDUCATION AGENCYDistrict Name: MANOR ISD Texas Academic Performance ReportCounty Name: TRAVIS 2015-16 District PerformanceDistrict Number: 227907
StateRegion
13 DistrictAfrican
American Hispanic WhiteAmerican
Indian AsianPacific
Islander
Two orMore
RacesSpecial
EdEcon
Disadv ELL^STAARPercent at Level II Satisfactory Standard or Above
Grade 8 **
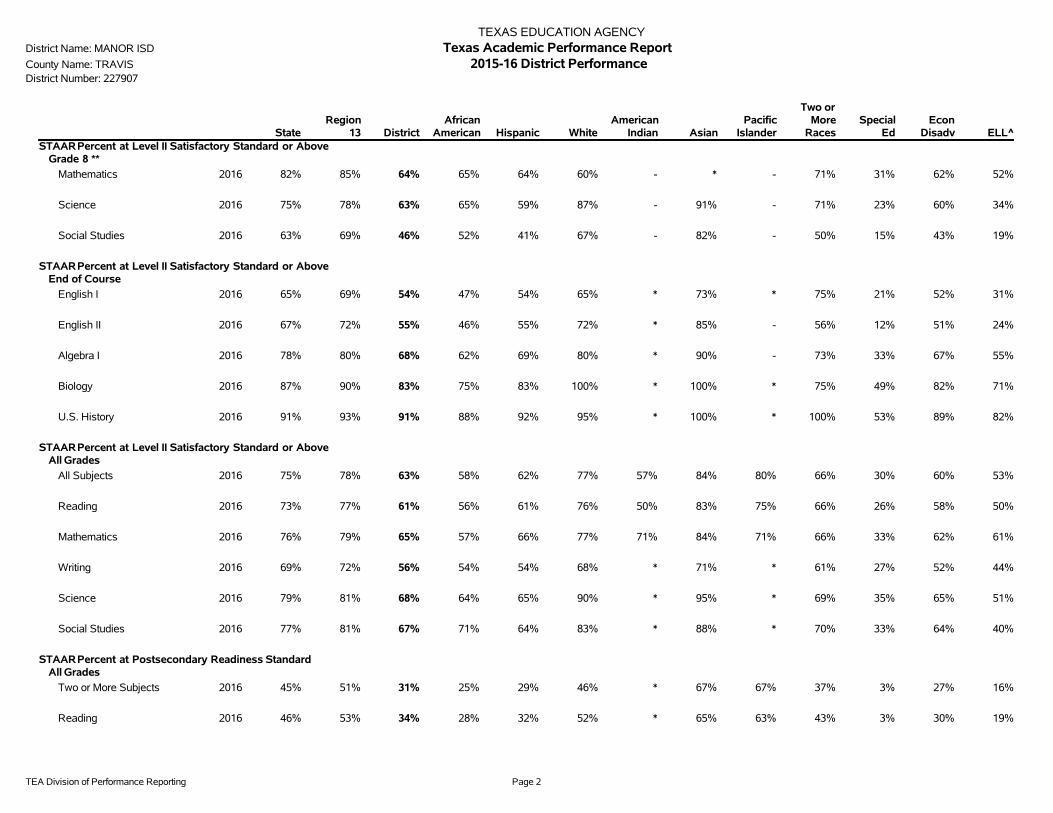
Mathematics 2016 82% 85% 64% 65% 64% 60% - * - 71% 31% 62% 52%
Science 2016 75% 78% 63% 65% 59% 87% - 91% - 71% 23% 60% 34%
Social Studies 2016 63% 69% 46% 52% 41% 67% - 82% - 50% 15% 43% 19%
STAARPercent at Level II Satisfactory Standard or AboveEnd of Course
English I 2016 65% 69% 54% 47% 54% 65% * 73% * 75% 21% 52% 31%
English II 2016 67% 72% 55% 46% 55% 72% * 85% - 56% 12% 51% 24%
Algebra I 2016 78% 80% 68% 62% 69% 80% * 90% - 73% 33% 67% 55%
Biology 2016 87% 90% 83% 75% 83% 100% * 100% * 75% 49% 82% 71%
U.S. History 2016 91% 93% 91% 88% 92% 95% * 100% * 100% 53% 89% 82%
STAARPercent at Level II Satisfactory Standard or AboveAll Grades
All Subjects 2016 75% 78% 63% 58% 62% 77% 57% 84% 80% 66% 30% 60% 53%
Reading 2016 73% 77% 61% 56% 61% 76% 50% 83% 75% 66% 26% 58% 50%
Mathematics 2016 76% 79% 65% 57% 66% 77% 71% 84% 71% 66% 33% 62% 61%
Writing 2016 69% 72% 56% 54% 54% 68% * 71% * 61% 27% 52% 44%
Science 2016 79% 81% 68% 64% 65% 90% * 95% * 69% 35% 65% 51%
Social Studies 2016 77% 81% 67% 71% 64% 83% * 88% * 70% 33% 64% 40%
STAARPercent at Postsecondary Readiness StandardAll Grades
Two or More Subjects 2016 45% 51% 31% 25% 29% 46% * 67% 67% 37% 3% 27% 16%
Reading 2016 46% 53% 34% 28% 32% 52% * 65% 63% 43% 3% 30% 19%
TEA Division of Performance Reporting Page 3
TEXAS EDUCATION AGENCYDistrict Name: MANOR ISD Texas Academic Performance ReportCounty Name: TRAVIS 2015-16 District PerformanceDistrict Number: 227907
StateRegion
13 DistrictAfrican
American Hispanic WhiteAmerican
Indian AsianPacific
Islander
Two orMore
RacesSpecial
EdEcon
Disadv ELL^STAARPercent at Postsecondary Readiness Standard
All Grades
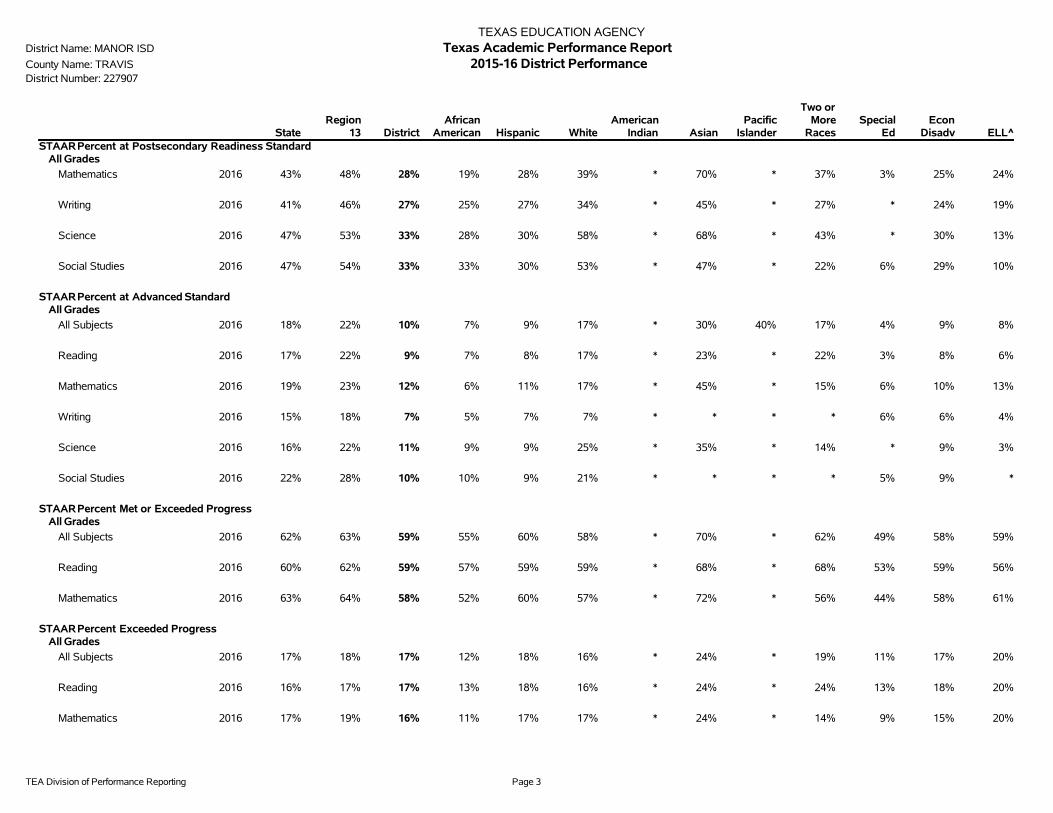
Mathematics 2016 43% 48% 28% 19% 28% 39% * 70% * 37% 3% 25% 24%
Writing 2016 41% 46% 27% 25% 27% 34% * 45% * 27% * 24% 19%
Science 2016 47% 53% 33% 28% 30% 58% * 68% * 43% * 30% 13%
Social Studies 2016 47% 54% 33% 33% 30% 53% * 47% * 22% 6% 29% 10%
STAARPercent at Advanced StandardAll Grades
All Subjects 2016 18% 22% 10% 7% 9% 17% * 30% 40% 17% 4% 9% 8%
Reading 2016 17% 22% 9% 7% 8% 17% * 23% * 22% 3% 8% 6%
Mathematics 2016 19% 23% 12% 6% 11% 17% * 45% * 15% 6% 10% 13%
Writing 2016 15% 18% 7% 5% 7% 7% * * * * 6% 6% 4%
Science 2016 16% 22% 11% 9% 9% 25% * 35% * 14% * 9% 3%
Social Studies 2016 22% 28% 10% 10% 9% 21% * * * * 5% 9% *
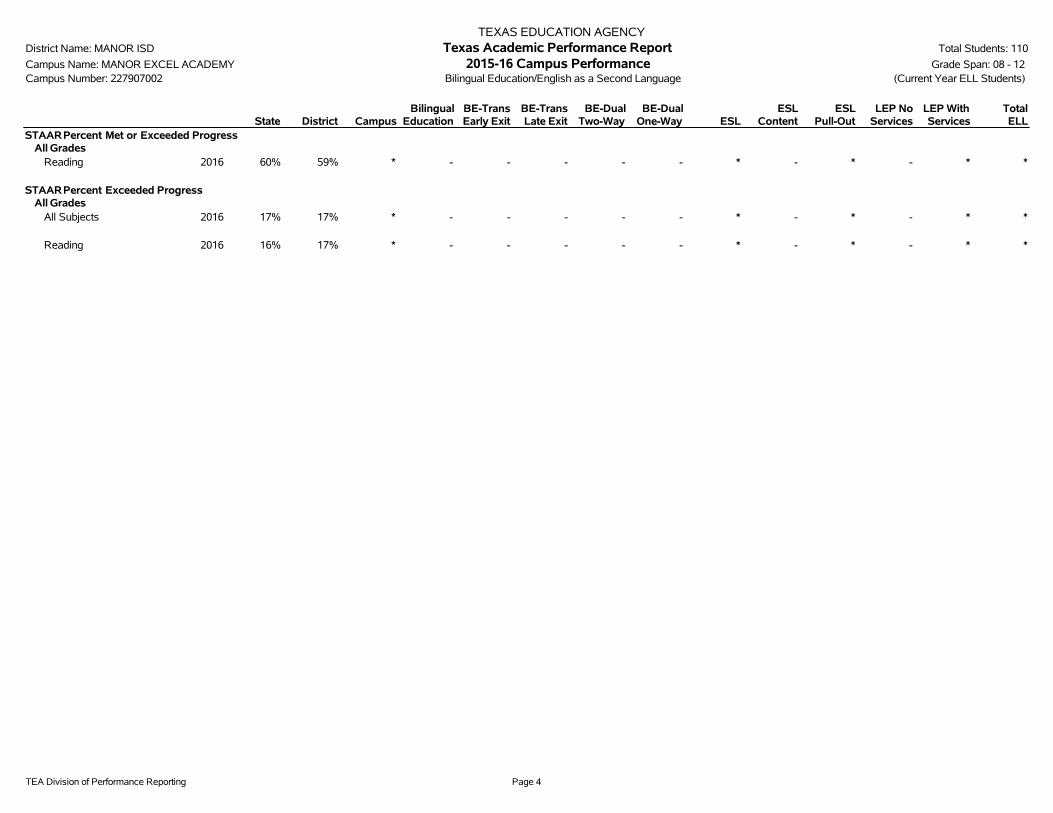
STAARPercent Met or Exceeded ProgressAll Grades
All Subjects 2016 62% 63% 59% 55% 60% 58% * 70% * 62% 49% 58% 59%
Reading 2016 60% 62% 59% 57% 59% 59% * 68% * 68% 53% 59% 56%
Mathematics 2016 63% 64% 58% 52% 60% 57% * 72% * 56% 44% 58% 61%
STAARPercent Exceeded ProgressAll Grades
All Subjects 2016 17% 18% 17% 12% 18% 16% * 24% * 19% 11% 17% 20%
Reading 2016 16% 17% 17% 13% 18% 16% * 24% * 24% 13% 18% 20%
Mathematics 2016 17% 19% 16% 11% 17% 17% * 24% * 14% 9% 15% 20%
TEA Division of Performance Reporting Page 4
TEXAS EDUCATION AGENCYDistrict Name: MANOR ISD Texas Academic Performance ReportCounty Name: TRAVIS 2015-16 District PerformanceDistrict Number: 227907
StateRegion
13 DistrictAfrican
American Hispanic WhiteAmerican
Indian AsianPacific
Islander
Two orMore
RacesSpecial
EdEcon
Disadv ELL^Progress of Prior-Year Non-Proficient Students
Sum of Grades 4-8
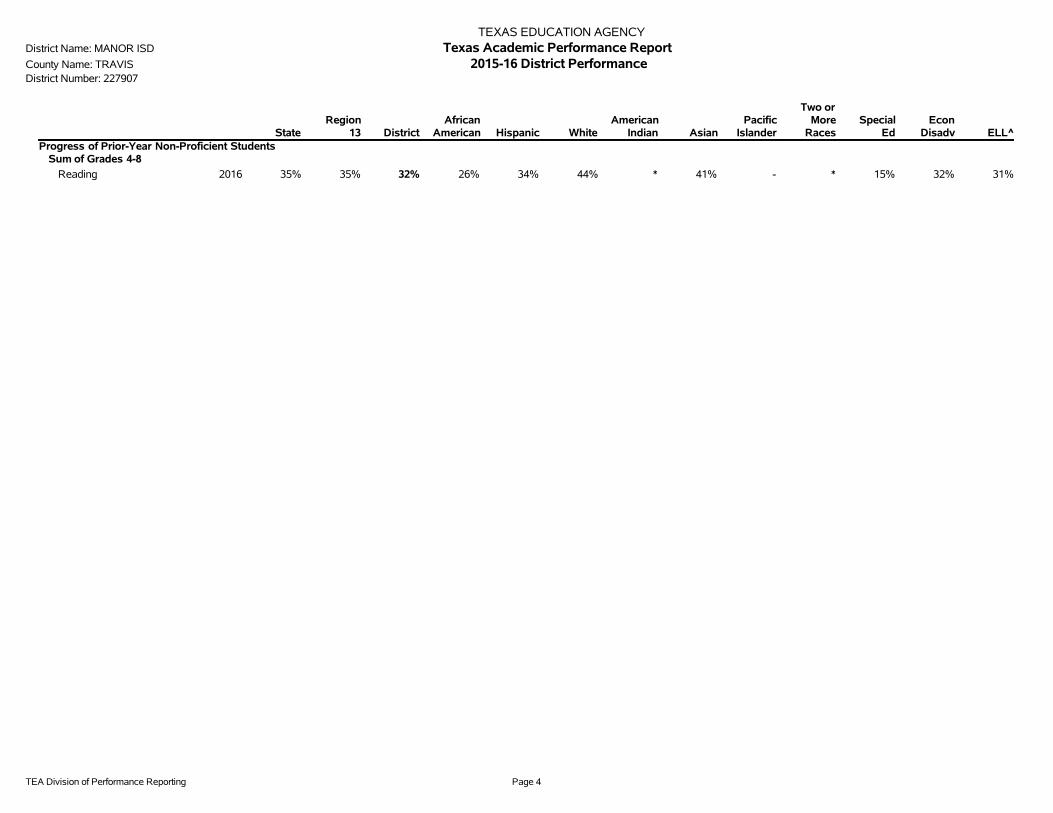
Reading 2016 35% 35% 32% 26% 34% 44% * 41% - * 15% 32% 31%
TEA Division of Performance Reporting Page 5
TEXAS EDUCATION AGENCYDistrict Name: MANOR ISD Texas Academic Performance ReportCounty Name: TRAVIS 2015-16 District PerformanceDistrict Number: 227907
StateRegion
13 DistrictAfrican
American Hispanic WhiteAmerican
Indian AsianPacific
Islander
Two orMore
RacesSpecial
EdEcon
Disadv ELLStudent Success Initiative
Grade 5 Reading
Students Meeting Level II Standard on First STAARAdministration
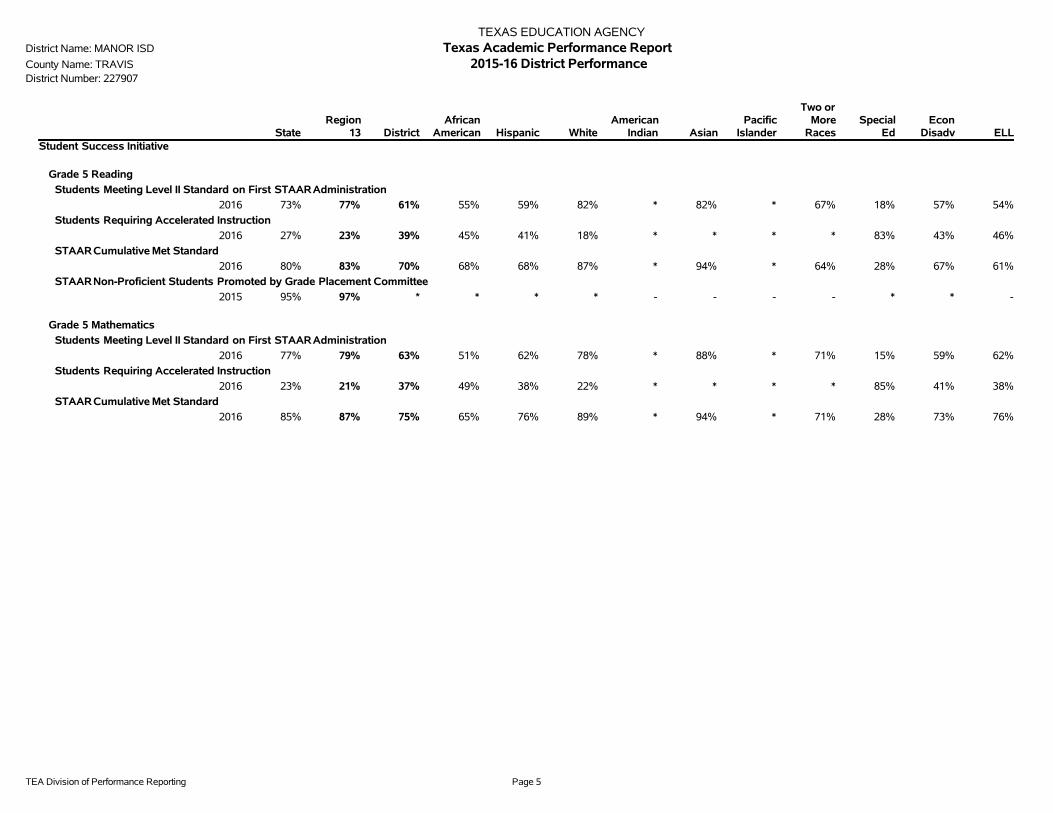
2016 73% 77% 61% 55% 59% 82% * 82% * 67% 18% 57% 54%
Students Requiring Accelerated Instruction
2016 27% 23% 39% 45% 41% 18% * * * * 83% 43% 46%
STAARCumulative Met Standard
2016 80% 83% 70% 68% 68% 87% * 94% * 64% 28% 67% 61%
STAARNon-Proficient Students Promoted by Grade Placement Committee
2015 95% 97% * * * * - - - - * * -
Grade 5 Mathematics
Students Meeting Level II Standard on First STAARAdministration
2016 77% 79% 63% 51% 62% 78% * 88% * 71% 15% 59% 62%
Students Requiring Accelerated Instruction
2016 23% 21% 37% 49% 38% 22% * * * * 85% 41% 38%
STAARCumulative Met Standard
2016 85% 87% 75% 65% 76% 89% * 94% * 71% 28% 73% 76%

TEA Division of Performance Reporting Page 6
TEXAS EDUCATION AGENCYDistrict Name: MANOR ISD Texas Academic Performance ReportCounty Name: TRAVIS 2015-16 District PerformanceDistrict Number: 227907
StateRegion
13 DistrictAfrican
American Hispanic WhiteAmerican
Indian AsianPacific
Islander
Two orMore
RacesSpecial
EdEcon
Disadv ELLStudent Success Initiative
Grade 8 Reading
Students Meeting Level II Standard on First STAARAdministration
2016 80% 83% 71% 71% 70% 84% - 73% - 81% 17% 69% 43%
Students Requiring Accelerated Instruction
2016 20% 17% 29% 29% 30% 16% - * - * 83% 31% 57%
STAARCumulative Met Standard
2016 86% 88% 79% 81% 78% 87% - 82% - 81% 27% 78% 58%
STAARNon-Proficient Students Promoted by Grade Placement Committee
2015 97% 99% * * * - - - - - * * *
Grade 8 Mathematics
Students Meeting Level II Standard on First STAARAdministration
2016 71% 76% 47% 48% 46% 53% - * - 71% 15% 44% 34%
Students Requiring Accelerated Instruction
2016 29% 24% 53% 52% 54% 47% - * - * 85% 56% 66%
STAARCumulative Met Standard
2016 81% 85% 63% 64% 63% 60% - * - 71% 24% 61% 52%
TEA Division of Performance Reporting Page 7
TEXAS EDUCATION AGENCYDistrict Name: MANOR ISD Texas Academic Performance ReportCounty Name: TRAVIS 2015-16 District PerformanceDistrict Number: 227907 Bilingual Education/English as a Second Language (Current Year ELL Students)
StateRegion
13 DistrictBilingual
EducationBE-TransEarly Exit
BE-TransLate Exit
BE-DualTwo-Way
BE-DualOne-Way ESL
ESLContent
ESLPull-Out
LEP NoServices
LEP WithServices
TotalELL
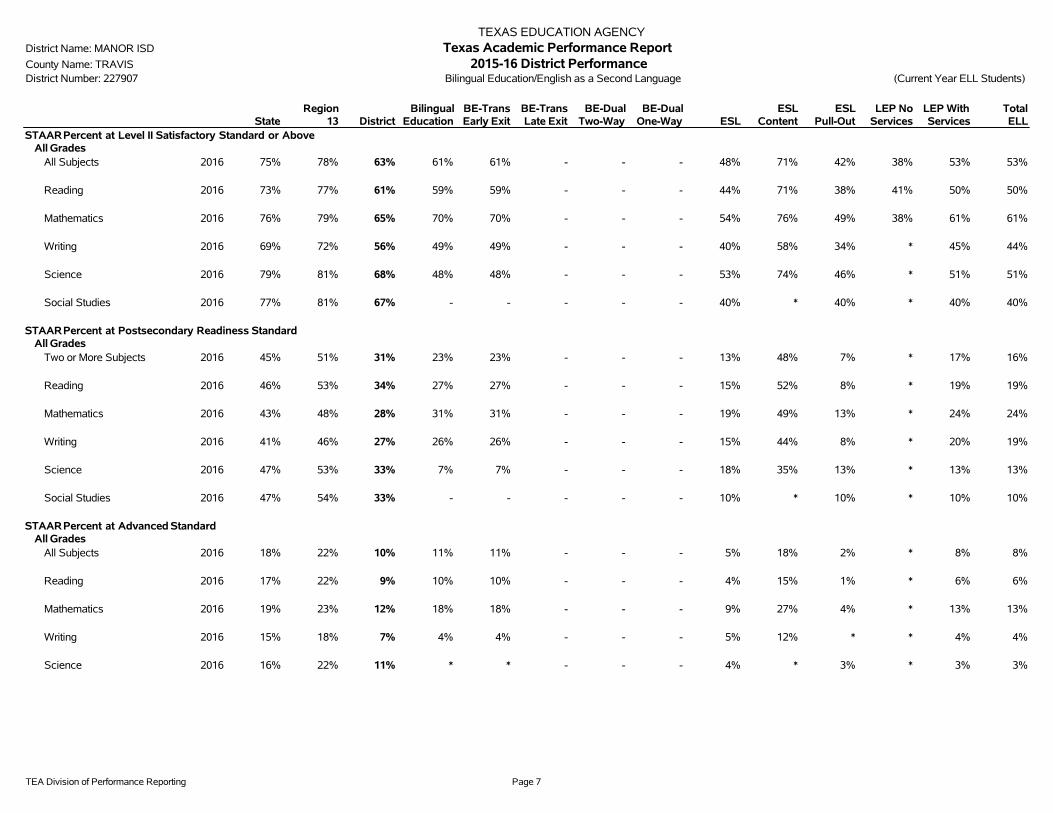
STAARPercent at Level II Satisfactory Standard or AboveAll Grades
All Subjects 2016 75% 78% 63% 61% 61% - - - 48% 71% 42% 38% 53% 53%
Reading 2016 73% 77% 61% 59% 59% - - - 44% 71% 38% 41% 50% 50%
Mathematics 2016 76% 79% 65% 70% 70% - - - 54% 76% 49% 38% 61% 61%
Writing 2016 69% 72% 56% 49% 49% - - - 40% 58% 34% * 45% 44%
Science 2016 79% 81% 68% 48% 48% - - - 53% 74% 46% * 51% 51%
Social Studies 2016 77% 81% 67% - - - - - 40% * 40% * 40% 40%
STAARPercent at Postsecondary Readiness StandardAll Grades
Two or More Subjects 2016 45% 51% 31% 23% 23% - - - 13% 48% 7% * 17% 16%
Reading 2016 46% 53% 34% 27% 27% - - - 15% 52% 8% * 19% 19%
Mathematics 2016 43% 48% 28% 31% 31% - - - 19% 49% 13% * 24% 24%
Writing 2016 41% 46% 27% 26% 26% - - - 15% 44% 8% * 20% 19%
Science 2016 47% 53% 33% 7% 7% - - - 18% 35% 13% * 13% 13%
Social Studies 2016 47% 54% 33% - - - - - 10% * 10% * 10% 10%
STAARPercent at Advanced StandardAll Grades
All Subjects 2016 18% 22% 10% 11% 11% - - - 5% 18% 2% * 8% 8%
Reading 2016 17% 22% 9% 10% 10% - - - 4% 15% 1% * 6% 6%
Mathematics 2016 19% 23% 12% 18% 18% - - - 9% 27% 4% * 13% 13%
Writing 2016 15% 18% 7% 4% 4% - - - 5% 12% * * 4% 4%
Science 2016 16% 22% 11% * * - - - 4% * 3% * 3% 3%
TEA Division of Performance Reporting Page 8
TEXAS EDUCATION AGENCYDistrict Name: MANOR ISD Texas Academic Performance ReportCounty Name: TRAVIS 2015-16 District PerformanceDistrict Number: 227907 Bilingual Education/English as a Second Language (Current Year ELL Students)
StateRegion
13 DistrictBilingual
EducationBE-TransEarly Exit
BE-TransLate Exit
BE-DualTwo-Way
BE-DualOne-Way ESL
ESLContent
ESLPull-Out
LEP NoServices
LEP WithServices
TotalELL
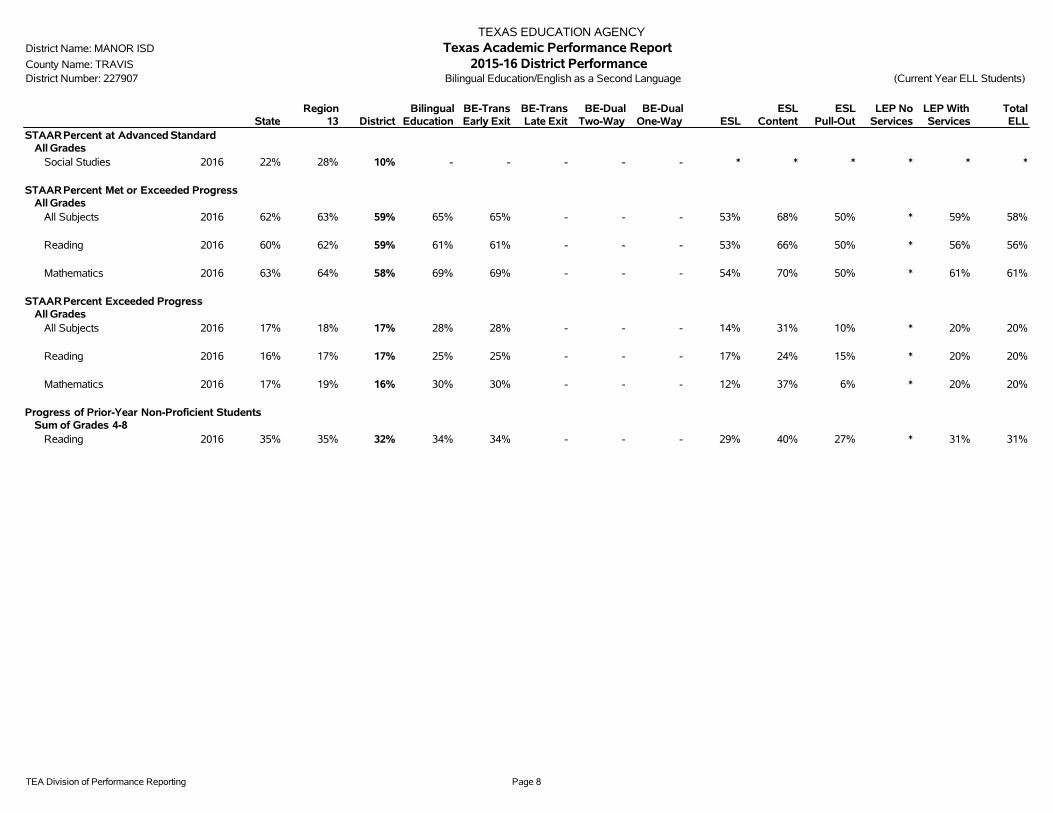
STAARPercent at Advanced StandardAll Grades
Social Studies 2016 22% 28% 10% - - - - - * * * * * *
STAARPercent Met or Exceeded ProgressAll Grades
All Subjects 2016 62% 63% 59% 65% 65% - - - 53% 68% 50% * 59% 58%
Reading 2016 60% 62% 59% 61% 61% - - - 53% 66% 50% * 56% 56%
Mathematics 2016 63% 64% 58% 69% 69% - - - 54% 70% 50% * 61% 61%
STAARPercent Exceeded ProgressAll Grades
All Subjects 2016 17% 18% 17% 28% 28% - - - 14% 31% 10% * 20% 20%
Reading 2016 16% 17% 17% 25% 25% - - - 17% 24% 15% * 20% 20%
Mathematics 2016 17% 19% 16% 30% 30% - - - 12% 37% 6% * 20% 20%
Progress of Prior-Year Non-Proficient StudentsSum of Grades 4-8
Reading 2016 35% 35% 32% 34% 34% - - - 29% 40% 27% * 31% 31%
TEA Division of Performance Reporting Page 9
TEXAS EDUCATION AGENCYDistrict Name: MANOR ISD Texas Academic Performance ReportCounty Name: TRAVIS 2015-16 District ParticipationDistrict Number: 227907
StateRegion
13 DistrictAfrican
American Hispanic WhiteAmerican
Indian AsianPacific
Islander
Two orMoreRaces
SpecialEd
EconDisadv ELL
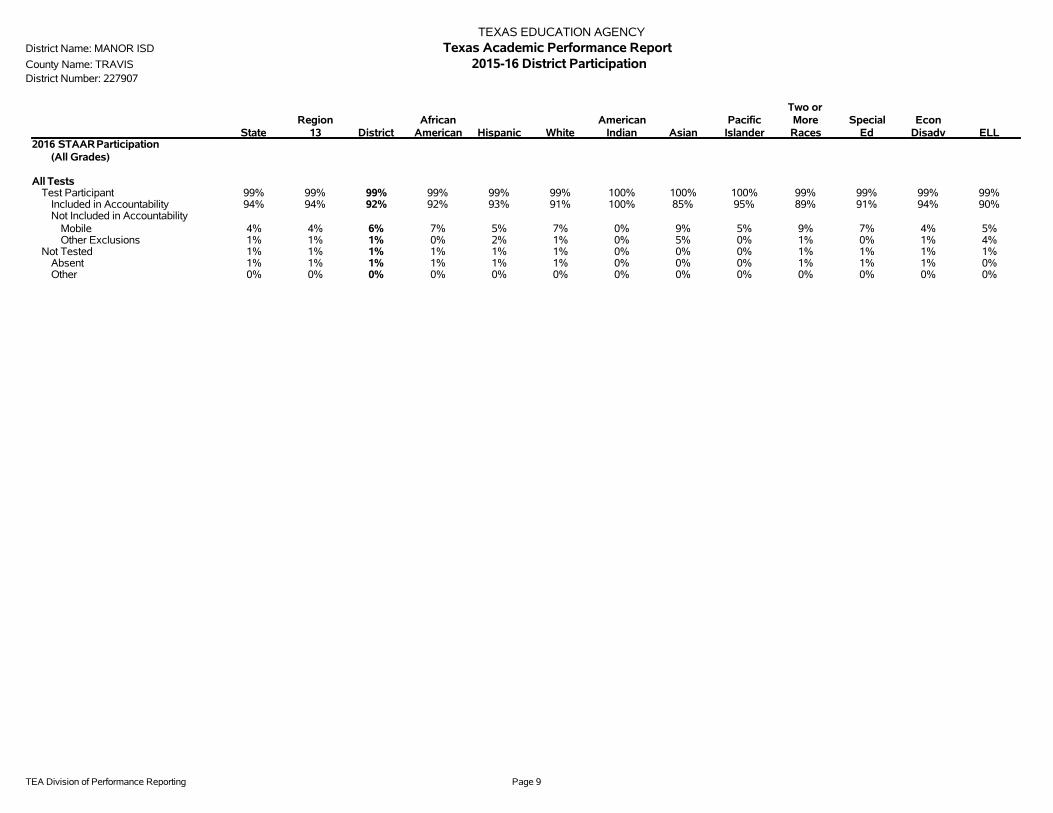
2016 STAARParticipation(All Grades)
All TestsTest Participant 99% 99% 99% 99% 99% 99% 100% 100% 100% 99% 99% 99% 99%
Included in Accountability 94% 94% 92% 92% 93% 91% 100% 85% 95% 89% 91% 94% 90%Not Included in Accountability
Mobile 4% 4% 6% 7% 5% 7% 0% 9% 5% 9% 7% 4% 5%Other Exclusions 1% 1% 1% 0% 2% 1% 0% 5% 0% 1% 0% 1% 4%
Not Tested 1% 1% 1% 1% 1% 1% 0% 0% 0% 1% 1% 1% 1%Absent 1% 1% 1% 1% 1% 1% 0% 0% 0% 1% 1% 1% 0%Other 0% 0% 0% 0% 0% 0% 0% 0% 0% 0% 0% 0% 0%
TEA Division of Performance Reporting Page 10
TEXAS EDUCATION AGENCYDistrict Name: MANOR ISD Texas Academic Performance ReportCounty Name: TRAVIS 2015-16 District Attendance and Postsecondary ReadinessDistrict Number: 227907
State Region 13 DistrictAfrican
American Hispanic WhiteAmerican
Indian AsianPacific
IslanderTwo or
More RacesSpecial
EdEcon
Disadv ELL
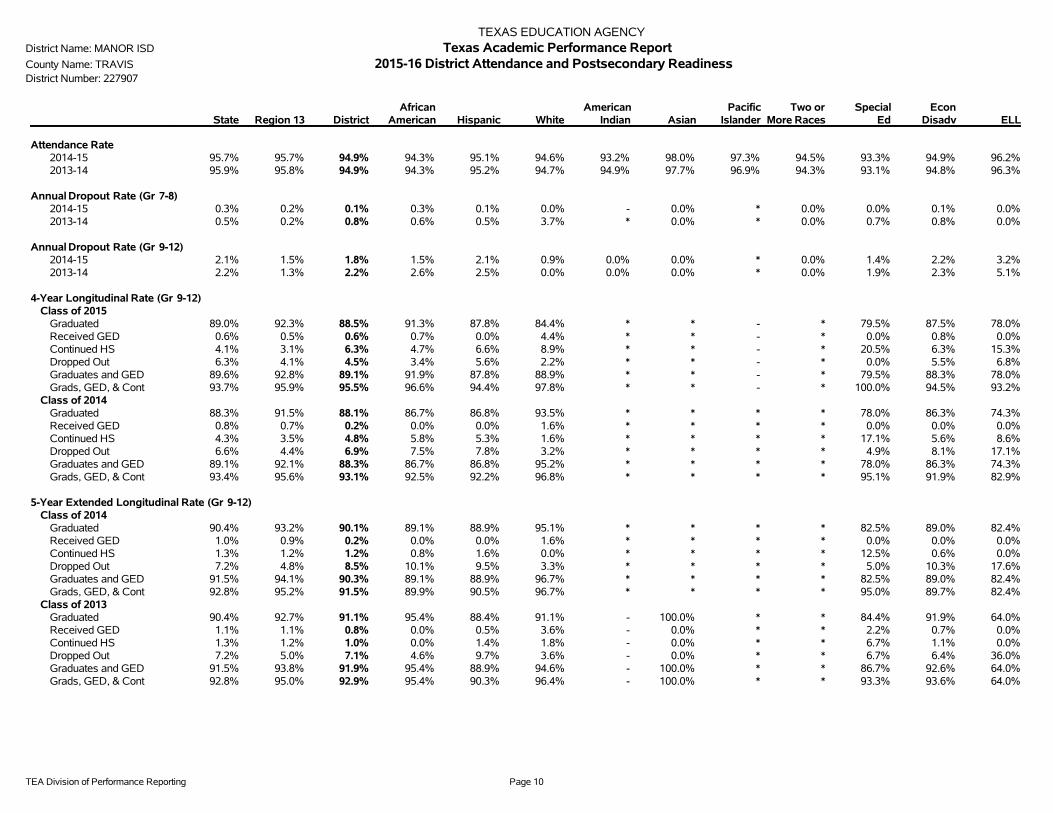
Attendance Rate2014-15 95.7% 95.7% 94.9% 94.3% 95.1% 94.6% 93.2% 98.0% 97.3% 94.5% 93.3% 94.9% 96.2%2013-14 95.9% 95.8% 94.9% 94.3% 95.2% 94.7% 94.9% 97.7% 96.9% 94.3% 93.1% 94.8% 96.3%
Annual Dropout Rate (Gr 7-8)2014-15 0.3% 0.2% 0.1% 0.3% 0.1% 0.0% - 0.0% * 0.0% 0.0% 0.1% 0.0%2013-14 0.5% 0.2% 0.8% 0.6% 0.5% 3.7% * 0.0% * 0.0% 0.7% 0.8% 0.0%
Annual Dropout Rate (Gr 9-12)2014-15 2.1% 1.5% 1.8% 1.5% 2.1% 0.9% 0.0% 0.0% * 0.0% 1.4% 2.2% 3.2%2013-14 2.2% 1.3% 2.2% 2.6% 2.5% 0.0% 0.0% 0.0% * 0.0% 1.9% 2.3% 5.1%
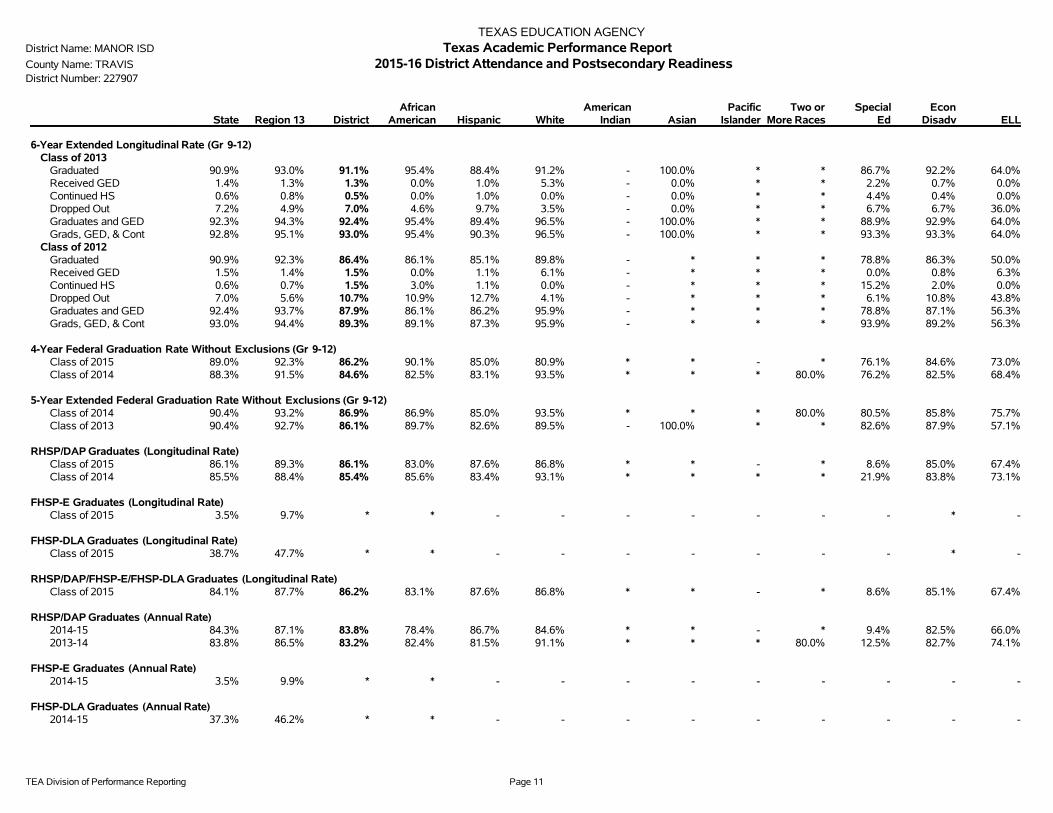
4-Year Longitudinal Rate (Gr 9-12)Class of 2015
Graduated 89.0% 92.3% 88.5% 91.3% 87.8% 84.4% * * - * 79.5% 87.5% 78.0%Received GED 0.6% 0.5% 0.6% 0.7% 0.0% 4.4% * * - * 0.0% 0.8% 0.0%Continued HS 4.1% 3.1% 6.3% 4.7% 6.6% 8.9% * * - * 20.5% 6.3% 15.3%Dropped Out 6.3% 4.1% 4.5% 3.4% 5.6% 2.2% * * - * 0.0% 5.5% 6.8%Graduates and GED 89.6% 92.8% 89.1% 91.9% 87.8% 88.9% * * - * 79.5% 88.3% 78.0%Grads, GED, & Cont 93.7% 95.9% 95.5% 96.6% 94.4% 97.8% * * - * 100.0% 94.5% 93.2%
Class of 2014Graduated 88.3% 91.5% 88.1% 86.7% 86.8% 93.5% * * * * 78.0% 86.3% 74.3%Received GED 0.8% 0.7% 0.2% 0.0% 0.0% 1.6% * * * * 0.0% 0.0% 0.0%Continued HS 4.3% 3.5% 4.8% 5.8% 5.3% 1.6% * * * * 17.1% 5.6% 8.6%Dropped Out 6.6% 4.4% 6.9% 7.5% 7.8% 3.2% * * * * 4.9% 8.1% 17.1%Graduates and GED 89.1% 92.1% 88.3% 86.7% 86.8% 95.2% * * * * 78.0% 86.3% 74.3%Grads, GED, & Cont 93.4% 95.6% 93.1% 92.5% 92.2% 96.8% * * * * 95.1% 91.9% 82.9%
5-Year Extended Longitudinal Rate (Gr 9-12)Class of 2014
Graduated 90.4% 93.2% 90.1% 89.1% 88.9% 95.1% * * * * 82.5% 89.0% 82.4%Received GED 1.0% 0.9% 0.2% 0.0% 0.0% 1.6% * * * * 0.0% 0.0% 0.0%Continued HS 1.3% 1.2% 1.2% 0.8% 1.6% 0.0% * * * * 12.5% 0.6% 0.0%Dropped Out 7.2% 4.8% 8.5% 10.1% 9.5% 3.3% * * * * 5.0% 10.3% 17.6%Graduates and GED 91.5% 94.1% 90.3% 89.1% 88.9% 96.7% * * * * 82.5% 89.0% 82.4%Grads, GED, & Cont 92.8% 95.2% 91.5% 89.9% 90.5% 96.7% * * * * 95.0% 89.7% 82.4%
Class of 2013Graduated 90.4% 92.7% 91.1% 95.4% 88.4% 91.1% - 100.0% * * 84.4% 91.9% 64.0%Received GED 1.1% 1.1% 0.8% 0.0% 0.5% 3.6% - 0.0% * * 2.2% 0.7% 0.0%Continued HS 1.3% 1.2% 1.0% 0.0% 1.4% 1.8% - 0.0% * * 6.7% 1.1% 0.0%Dropped Out 7.2% 5.0% 7.1% 4.6% 9.7% 3.6% - 0.0% * * 6.7% 6.4% 36.0%Graduates and GED 91.5% 93.8% 91.9% 95.4% 88.9% 94.6% - 100.0% * * 86.7% 92.6% 64.0%Grads, GED, & Cont 92.8% 95.0% 92.9% 95.4% 90.3% 96.4% - 100.0% * * 93.3% 93.6% 64.0%
TEA Division of Performance Reporting Page 11
TEXAS EDUCATION AGENCYDistrict Name: MANOR ISD Texas Academic Performance ReportCounty Name: TRAVIS 2015-16 District Attendance and Postsecondary ReadinessDistrict Number: 227907
State Region 13 DistrictAfrican
American Hispanic WhiteAmerican
Indian AsianPacific
IslanderTwo or
More RacesSpecial
EdEcon
Disadv ELL
6-Year Extended Longitudinal Rate (Gr 9-12)Class of 2013
Graduated 90.9% 93.0% 91.1% 95.4% 88.4% 91.2% - 100.0% * * 86.7% 92.2% 64.0%Received GED 1.4% 1.3% 1.3% 0.0% 1.0% 5.3% - 0.0% * * 2.2% 0.7% 0.0%Continued HS 0.6% 0.8% 0.5% 0.0% 1.0% 0.0% - 0.0% * * 4.4% 0.4% 0.0%Dropped Out 7.2% 4.9% 7.0% 4.6% 9.7% 3.5% - 0.0% * * 6.7% 6.7% 36.0%Graduates and GED 92.3% 94.3% 92.4% 95.4% 89.4% 96.5% - 100.0% * * 88.9% 92.9% 64.0%Grads, GED, & Cont 92.8% 95.1% 93.0% 95.4% 90.3% 96.5% - 100.0% * * 93.3% 93.3% 64.0%
Class of 2012Graduated 90.9% 92.3% 86.4% 86.1% 85.1% 89.8% - * * * 78.8% 86.3% 50.0%Received GED 1.5% 1.4% 1.5% 0.0% 1.1% 6.1% - * * * 0.0% 0.8% 6.3%Continued HS 0.6% 0.7% 1.5% 3.0% 1.1% 0.0% - * * * 15.2% 2.0% 0.0%Dropped Out 7.0% 5.6% 10.7% 10.9% 12.7% 4.1% - * * * 6.1% 10.8% 43.8%Graduates and GED 92.4% 93.7% 87.9% 86.1% 86.2% 95.9% - * * * 78.8% 87.1% 56.3%Grads, GED, & Cont 93.0% 94.4% 89.3% 89.1% 87.3% 95.9% - * * * 93.9% 89.2% 56.3%
4-Year Federal Graduation Rate Without Exclusions (Gr 9-12)Class of 2015 89.0% 92.3% 86.2% 90.1% 85.0% 80.9% * * - * 76.1% 84.6% 73.0%Class of 2014 88.3% 91.5% 84.6% 82.5% 83.1% 93.5% * * * 80.0% 76.2% 82.5% 68.4%
5-Year Extended Federal Graduation Rate Without Exclusions (Gr 9-12)Class of 2014 90.4% 93.2% 86.9% 86.9% 85.0% 93.5% * * * 80.0% 80.5% 85.8% 75.7%Class of 2013 90.4% 92.7% 86.1% 89.7% 82.6% 89.5% - 100.0% * * 82.6% 87.9% 57.1%
RHSP/DAP Graduates (Longitudinal Rate)Class of 2015 86.1% 89.3% 86.1% 83.0% 87.6% 86.8% * * - * 8.6% 85.0% 67.4%Class of 2014 85.5% 88.4% 85.4% 85.6% 83.4% 93.1% * * * * 21.9% 83.8% 73.1%
FHSP-E Graduates (Longitudinal Rate)Class of 2015 3.5% 9.7% * * - - - - - - - * -
FHSP-DLA Graduates (Longitudinal Rate)Class of 2015 38.7% 47.7% * * - - - - - - - * -
RHSP/DAP/FHSP-E/FHSP-DLA Graduates (Longitudinal Rate)Class of 2015 84.1% 87.7% 86.2% 83.1% 87.6% 86.8% * * - * 8.6% 85.1% 67.4%
RHSP/DAP Graduates (Annual Rate)2014-15 84.3% 87.1% 83.8% 78.4% 86.7% 84.6% * * - * 9.4% 82.5% 66.0%2013-14 83.8% 86.5% 83.2% 82.4% 81.5% 91.1% * * * 80.0% 12.5% 82.7% 74.1%
FHSP-E Graduates (Annual Rate)2014-15 3.5% 9.9% * * - - - - - - - - -
FHSP-DLA Graduates (Annual Rate)2014-15 37.3% 46.2% * * - - - - - - - - -

TEA Division of Performance Reporting Page 12
TEXAS EDUCATION AGENCYDistrict Name: MANOR ISD Texas Academic Performance ReportCounty Name: TRAVIS 2015-16 District Attendance and Postsecondary ReadinessDistrict Number: 227907
State Region 13 DistrictAfrican
American Hispanic WhiteAmerican
Indian AsianPacific
IslanderTwo or
More RacesSpecial
EdEcon
Disadv ELL
RHSP/DAP/FHSP-E/FHSP-DLA Graduates (Annual Rate)2014-15 82.2% 85.4% 83.9% 78.5% 86.7% 84.6% * * - * 9.4% 82.5% 66.0%
Advanced Course/Dual Credit Course Completion (Grades 11-12)Any Subject
2014-15 54.5% 58.7% 49.0% 44.4% 48.5% 60.6% * 71.4% - 78.6% 5.7% 45.5% 15.7%2013-14 53.2% 57.0% 50.2% 49.8% 47.3% 63.0% * 75.0% * 57.1% 6.6% 47.3% 18.0%
English Language Arts2014-15 29.0% 35.1% 38.2% 36.8% 35.6% 53.5% * 57.1% - 57.1% 2.6% 33.4% 4.3%2013-14 28.9% 35.1% 39.0% 39.2% 35.1% 56.7% * 50.0% * 40.0% 1.1% 35.1% 10.3%
Mathematics2014-15 43.8% 47.8% 34.5% 34.3% 33.5% 39.1% * 50.0% - 30.8% 1.9% 32.5% 12.9%2013-14 42.4% 45.4% 32.1% 30.1% 29.4% 48.2% * 50.0% * 33.3% 4.9% 30.9% 8.7%
Science2014-15 12.7% 14.5% 0.9% 0.6% 1.2% 0.0% * * - 0.0% 0.0% 0.6% 0.0%2013-14 13.4% 16.2% 0.0% 0.0% 0.0% 0.0% * 0.0% - * 0.0% 0.0% 0.0%
Social Studies2014-15 28.4% 32.9% 23.9% 26.0% 24.5% 14.8% * 0.0% - 28.6% 0.0% 23.4% 5.1%2013-14 27.8% 32.1% 27.1% 29.6% 26.5% 22.8% * 0.0% * 66.7% 2.3% 27.8% 11.5%
Advanced Course/Dual Credit Course Completion (Grades 9-12)Any Subject
2014-15 34.6% 36.8% 29.0% 26.8% 29.5% 31.5% 33.3% 23.8% * 41.9% 5.3% 28.5% 14.2%2013-14 33.1% 35.4% 26.1% 24.6% 25.3% 34.2% 28.6% 33.3% * 18.5% 3.7% 24.1% 12.1%
English Language Arts2014-15 15.7% 17.5% 22.1% 22.0% 21.2% 26.9% 40.0% 19.0% * 30.0% 3.5% 20.9% 9.8%2013-14 15.4% 18.0% 17.7% 17.5% 15.9% 27.1% 28.6% 22.2% * 9.1% 0.5% 15.6% 4.4%
Mathematics2014-15 19.4% 21.5% 13.8% 13.8% 13.2% 16.8% * 15.0% * 13.3% 0.7% 12.4% 4.0%2013-14 18.8% 20.5% 13.8% 12.9% 12.7% 21.8% 28.6% 22.2% * 8.0% 2.0% 12.9% 3.5%
Science2014-15 5.2% 5.8% 0.3% 0.2% 0.4% 0.0% * 0.0% * 0.0% 0.0% 0.2% 0.0%2013-14 5.6% 6.6% 0.0% 0.0% 0.0% 0.0% 0.0% 0.0% * 0.0% 0.0% 0.0% 0.0%
Social Studies2014-15 19.5% 23.2% 12.5% 13.8% 12.5% 8.9% 16.7% 0.0% * 16.7% 0.0% 12.3% 2.2%2013-14 18.3% 21.5% 14.5% 15.2% 14.2% 14.2% 16.7% 0.0% * 20.8% 1.1% 14.0% 6.3%
College-Ready GraduatesEnglish Language Arts
2014-15 42.0% 56.0% 25.0% 21.0% 22.0% 50.0% * * - - 17.0% 18.0% 13.0%Mathematics
2014-15 38.0% 51.0% 18.0% 13.0% 18.0% 33.0% * * - - 0.0% 15.0% 13.0%Both Subjects
2014-15 35.0% 49.0% 16.0% 7.0% 16.0% 33.0% * * - - 0.0% 11.0% 13.0%Either Subject
2014-15 45.0% 58.0% 28.0% 26.0% 24.0% 50.0% * * - - 17.0% 22.0% 13.0%
TEA Division of Performance Reporting Page 13
TEXAS EDUCATION AGENCYDistrict Name: MANOR ISD Texas Academic Performance ReportCounty Name: TRAVIS 2015-16 District Attendance and Postsecondary ReadinessDistrict Number: 227907
State Region 13 DistrictAfrican
American Hispanic WhiteAmerican
Indian AsianPacific
IslanderTwo or
More RacesSpecial
EdEcon
Disadv ELL
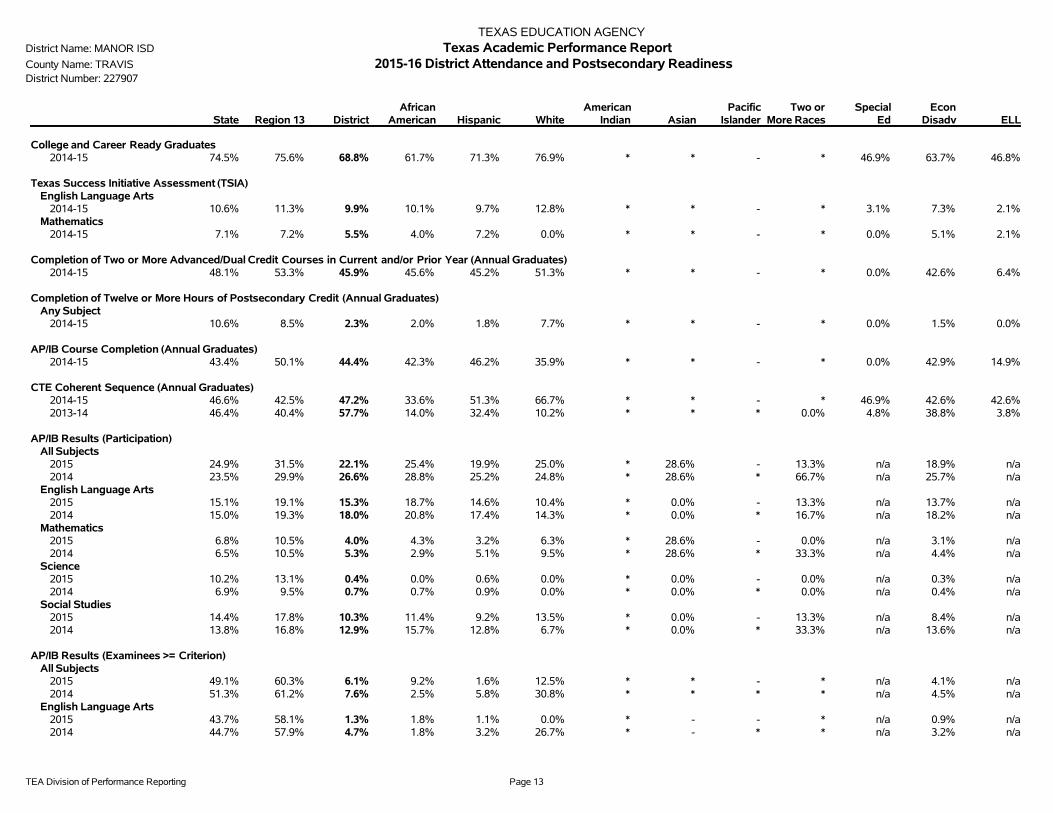
College and Career Ready Graduates2014-15 74.5% 75.6% 68.8% 61.7% 71.3% 76.9% * * - * 46.9% 63.7% 46.8%
Texas Success Initiative Assessment (TSIA)English Language Arts
2014-15 10.6% 11.3% 9.9% 10.1% 9.7% 12.8% * * - * 3.1% 7.3% 2.1%Mathematics
2014-15 7.1% 7.2% 5.5% 4.0% 7.2% 0.0% * * - * 0.0% 5.1% 2.1%
Completion of Two or More Advanced/Dual Credit Courses in Current and/or Prior Year (Annual Graduates)2014-15 48.1% 53.3% 45.9% 45.6% 45.2% 51.3% * * - * 0.0% 42.6% 6.4%
Completion of Twelve or More Hours of Postsecondary Credit (Annual Graduates)Any Subject
2014-15 10.6% 8.5% 2.3% 2.0% 1.8% 7.7% * * - * 0.0% 1.5% 0.0%
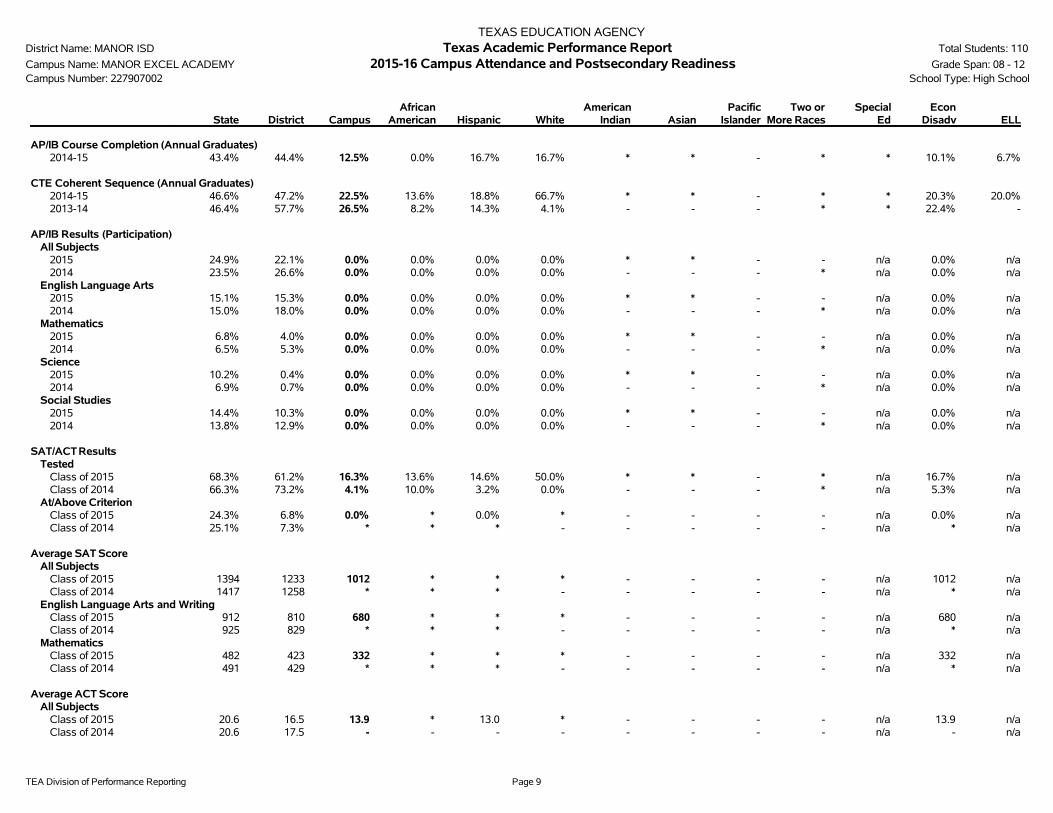
AP/IB Course Completion (Annual Graduates)2014-15 43.4% 50.1% 44.4% 42.3% 46.2% 35.9% * * - * 0.0% 42.9% 14.9%
CTE Coherent Sequence (Annual Graduates)2014-15 46.6% 42.5% 47.2% 33.6% 51.3% 66.7% * * - * 46.9% 42.6% 42.6%2013-14 46.4% 40.4% 57.7% 14.0% 32.4% 10.2% * * * 0.0% 4.8% 38.8% 3.8%
AP/IB Results (Participation)All Subjects
2015 24.9% 31.5% 22.1% 25.4% 19.9% 25.0% * 28.6% - 13.3% n/a 18.9% n/a2014 23.5% 29.9% 26.6% 28.8% 25.2% 24.8% * 28.6% * 66.7% n/a 25.7% n/a
English Language Arts2015 15.1% 19.1% 15.3% 18.7% 14.6% 10.4% * 0.0% - 13.3% n/a 13.7% n/a2014 15.0% 19.3% 18.0% 20.8% 17.4% 14.3% * 0.0% * 16.7% n/a 18.2% n/a
Mathematics2015 6.8% 10.5% 4.0% 4.3% 3.2% 6.3% * 28.6% - 0.0% n/a 3.1% n/a2014 6.5% 10.5% 5.3% 2.9% 5.1% 9.5% * 28.6% * 33.3% n/a 4.4% n/a
Science2015 10.2% 13.1% 0.4% 0.0% 0.6% 0.0% * 0.0% - 0.0% n/a 0.3% n/a2014 6.9% 9.5% 0.7% 0.7% 0.9% 0.0% * 0.0% * 0.0% n/a 0.4% n/a
Social Studies2015 14.4% 17.8% 10.3% 11.4% 9.2% 13.5% * 0.0% - 13.3% n/a 8.4% n/a2014 13.8% 16.8% 12.9% 15.7% 12.8% 6.7% * 0.0% * 33.3% n/a 13.6% n/a
AP/IB Results (Examinees >= Criterion)All Subjects
2015 49.1% 60.3% 6.1% 9.2% 1.6% 12.5% * * - * n/a 4.1% n/a2014 51.3% 61.2% 7.6% 2.5% 5.8% 30.8% * * * * n/a 4.5% n/a
English Language Arts2015 43.7% 58.1% 1.3% 1.8% 1.1% 0.0% * - - * n/a 0.9% n/a2014 44.7% 57.9% 4.7% 1.8% 3.2% 26.7% * - * * n/a 3.2% n/a
TEA Division of Performance Reporting Page 14
TEXAS EDUCATION AGENCYDistrict Name: MANOR ISD Texas Academic Performance ReportCounty Name: TRAVIS 2015-16 District Attendance and Postsecondary ReadinessDistrict Number: 227907
State Region 13 DistrictAfrican
American Hispanic WhiteAmerican
Indian AsianPacific
IslanderTwo or
More RacesSpecial
EdEcon
Disadv ELL
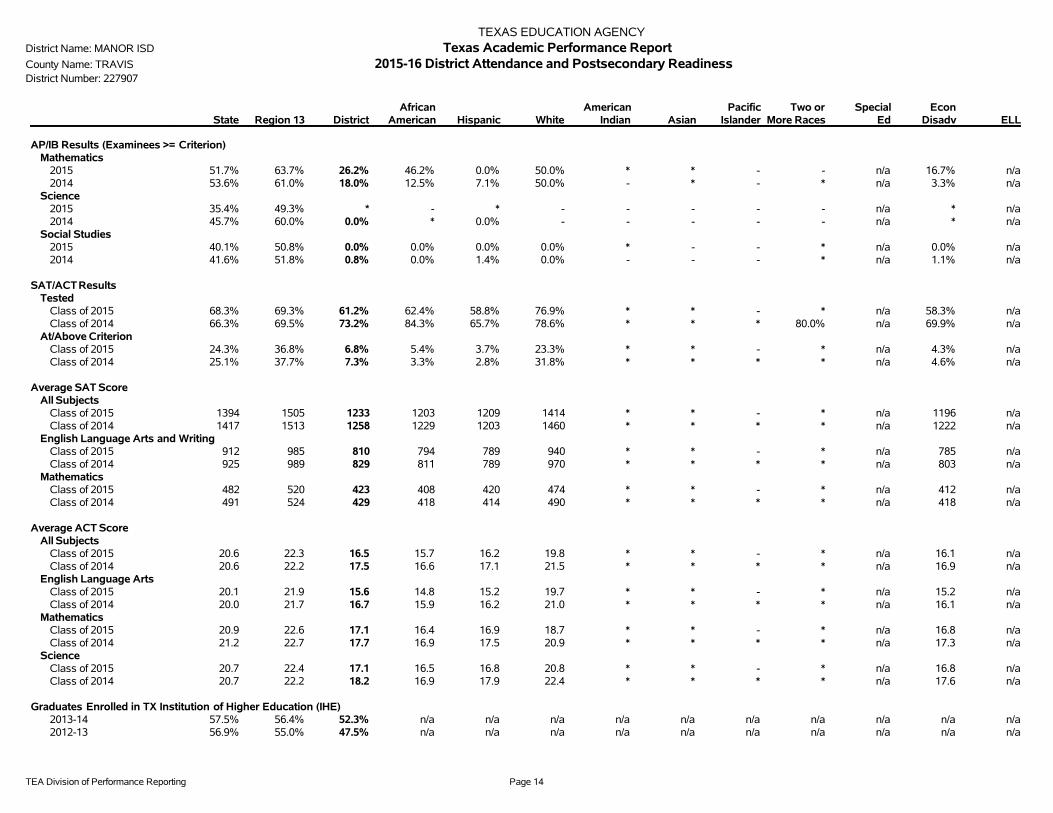
AP/IB Results (Examinees >= Criterion)Mathematics
2015 51.7% 63.7% 26.2% 46.2% 0.0% 50.0% * * - - n/a 16.7% n/a2014 53.6% 61.0% 18.0% 12.5% 7.1% 50.0% - * - * n/a 3.3% n/a
Science2015 35.4% 49.3% * - * - - - - - n/a * n/a2014 45.7% 60.0% 0.0% * 0.0% - - - - - n/a * n/a
Social Studies2015 40.1% 50.8% 0.0% 0.0% 0.0% 0.0% * - - * n/a 0.0% n/a2014 41.6% 51.8% 0.8% 0.0% 1.4% 0.0% - - - * n/a 1.1% n/a
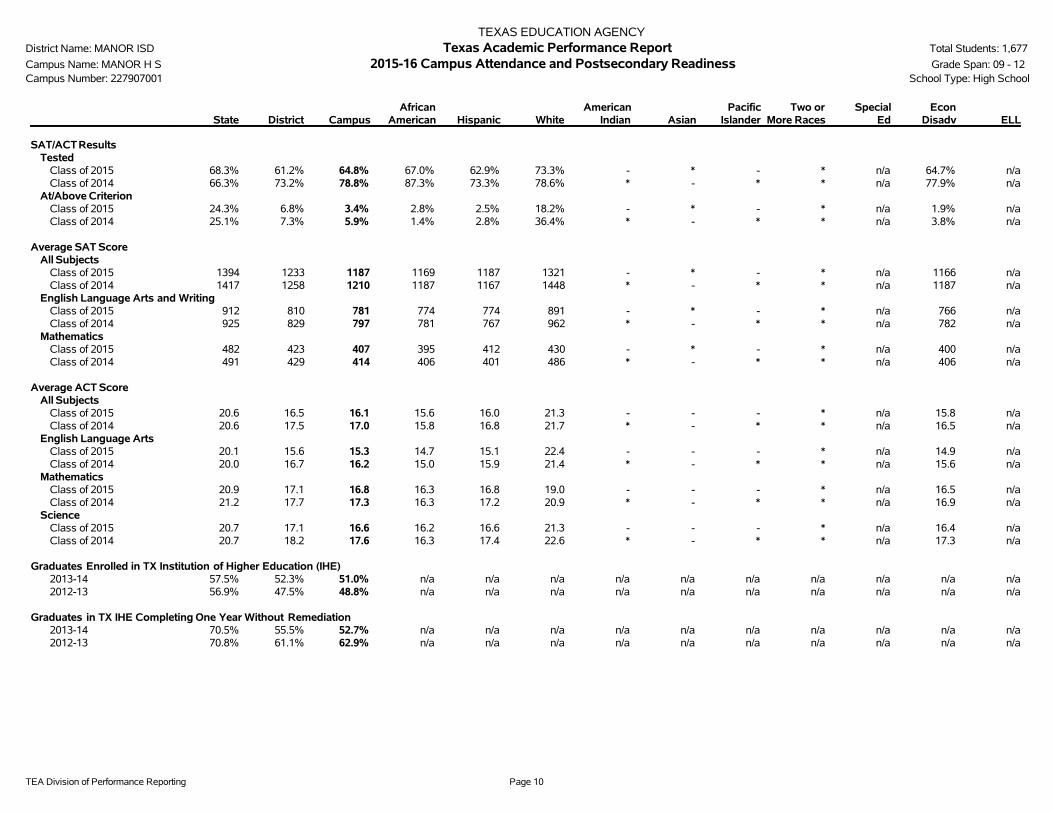
SAT/ACT ResultsTested
Class of 2015 68.3% 69.3% 61.2% 62.4% 58.8% 76.9% * * - * n/a 58.3% n/aClass of 2014 66.3% 69.5% 73.2% 84.3% 65.7% 78.6% * * * 80.0% n/a 69.9% n/a
At/Above CriterionClass of 2015 24.3% 36.8% 6.8% 5.4% 3.7% 23.3% * * - * n/a 4.3% n/aClass of 2014 25.1% 37.7% 7.3% 3.3% 2.8% 31.8% * * * * n/a 4.6% n/a
Average SAT ScoreAll Subjects
Class of 2015 1394 1505 1233 1203 1209 1414 * * - * n/a 1196 n/aClass of 2014 1417 1513 1258 1229 1203 1460 * * * * n/a 1222 n/a
English Language Arts and WritingClass of 2015 912 985 810 794 789 940 * * - * n/a 785 n/aClass of 2014 925 989 829 811 789 970 * * * * n/a 803 n/a
MathematicsClass of 2015 482 520 423 408 420 474 * * - * n/a 412 n/aClass of 2014 491 524 429 418 414 490 * * * * n/a 418 n/a
Average ACT ScoreAll Subjects
Class of 2015 20.6 22.3 16.5 15.7 16.2 19.8 * * - * n/a 16.1 n/aClass of 2014 20.6 22.2 17.5 16.6 17.1 21.5 * * * * n/a 16.9 n/a
English Language ArtsClass of 2015 20.1 21.9 15.6 14.8 15.2 19.7 * * - * n/a 15.2 n/aClass of 2014 20.0 21.7 16.7 15.9 16.2 21.0 * * * * n/a 16.1 n/a
MathematicsClass of 2015 20.9 22.6 17.1 16.4 16.9 18.7 * * - * n/a 16.8 n/aClass of 2014 21.2 22.7 17.7 16.9 17.5 20.9 * * * * n/a 17.3 n/a
ScienceClass of 2015 20.7 22.4 17.1 16.5 16.8 20.8 * * - * n/a 16.8 n/aClass of 2014 20.7 22.2 18.2 16.9 17.9 22.4 * * * * n/a 17.6 n/a
Graduates Enrolled in TX Institution of Higher Education (IHE)2013-14 57.5% 56.4% 52.3% n/a n/a n/a n/a n/a n/a n/a n/a n/a n/a2012-13 56.9% 55.0% 47.5% n/a n/a n/a n/a n/a n/a n/a n/a n/a n/a
TEA Division of Performance Reporting Page 15
TEXAS EDUCATION AGENCYDistrict Name: MANOR ISD Texas Academic Performance ReportCounty Name: TRAVIS 2015-16 District Attendance and Postsecondary ReadinessDistrict Number: 227907
State Region 13 DistrictAfrican
American Hispanic WhiteAmerican
Indian AsianPacific
IslanderTwo or
More RacesSpecial
EdEcon
Disadv ELL
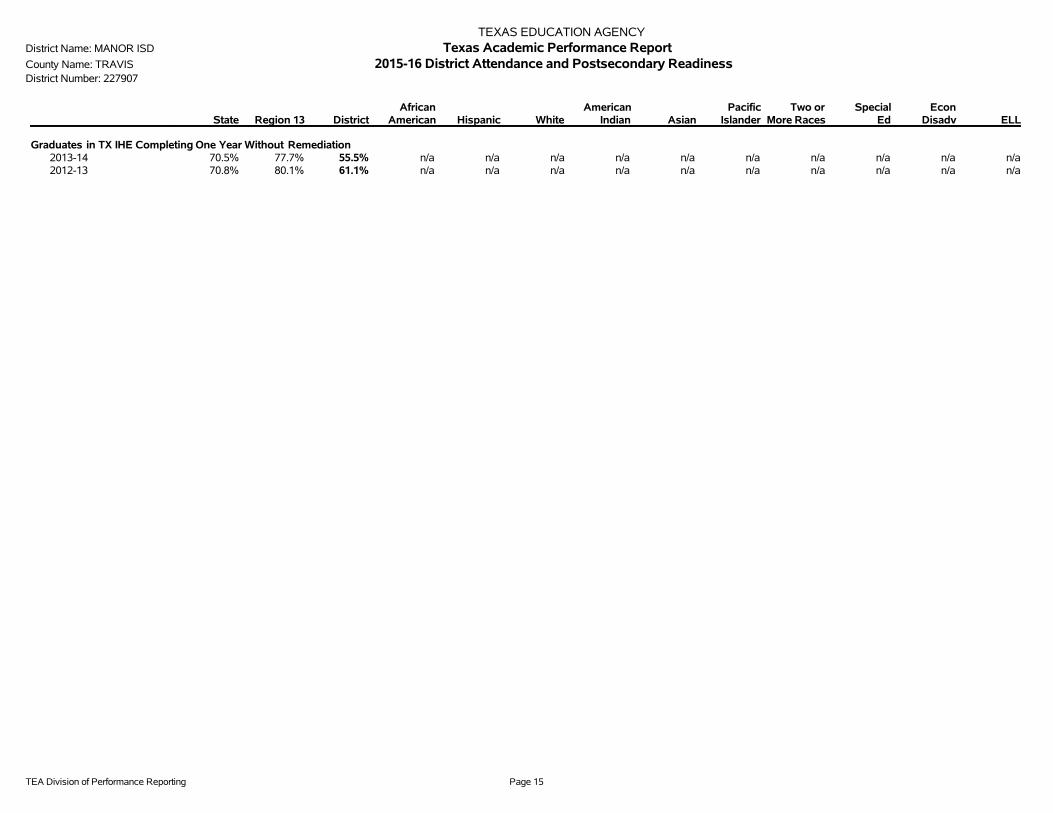
Graduates in TX IHE Completing One Year Without Remediation2013-14 70.5% 77.7% 55.5% n/a n/a n/a n/a n/a n/a n/a n/a n/a n/a2012-13 70.8% 80.1% 61.1% n/a n/a n/a n/a n/a n/a n/a n/a n/a n/a
TEA Division of Performance Reporting Page 16
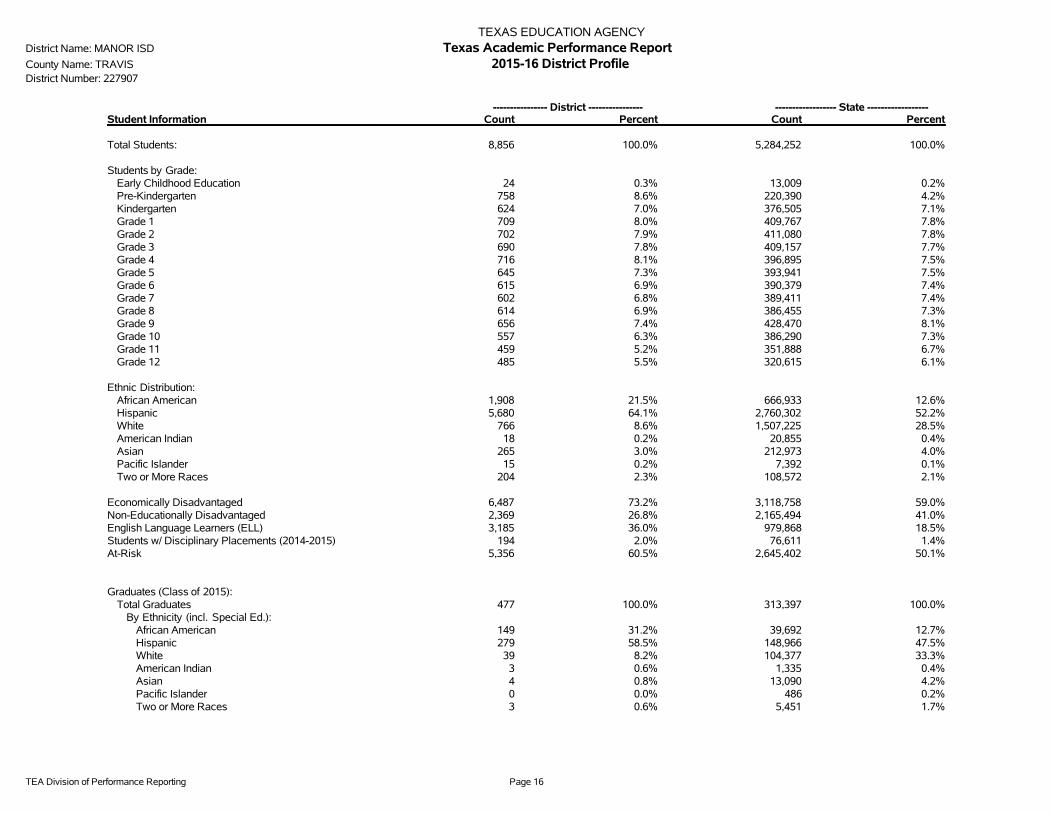
TEXAS EDUCATION AGENCYDistrict Name: MANOR ISD Texas Academic Performance ReportCounty Name: TRAVIS 2015-16 District ProfileDistrict Number: 227907
---------------- District ---------------- ------------------ State ------------------Student Information Count Percent Count Percent
Total Students: 8,856 100.0% 5,284,252 100.0%
Students by Grade:Early Childhood Education 24 0.3% 13,009 0.2%Pre-Kindergarten 758 8.6% 220,390 4.2%Kindergarten 624 7.0% 376,505 7.1%Grade 1 709 8.0% 409,767 7.8%Grade 2 702 7.9% 411,080 7.8%Grade 3 690 7.8% 409,157 7.7%Grade 4 716 8.1% 396,895 7.5%Grade 5 645 7.3% 393,941 7.5%Grade 6 615 6.9% 390,379 7.4%Grade 7 602 6.8% 389,411 7.4%Grade 8 614 6.9% 386,455 7.3%Grade 9 656 7.4% 428,470 8.1%Grade 10 557 6.3% 386,290 7.3%Grade 11 459 5.2% 351,888 6.7%Grade 12 485 5.5% 320,615 6.1%
Ethnic Distribution:African American 1,908 21.5% 666,933 12.6%Hispanic 5,680 64.1% 2,760,302 52.2%White 766 8.6% 1,507,225 28.5%American Indian 18 0.2% 20,855 0.4%Asian 265 3.0% 212,973 4.0%Pacific Islander 15 0.2% 7,392 0.1%Two or More Races 204 2.3% 108,572 2.1%
Economically Disadvantaged 6,487 73.2% 3,118,758 59.0%Non-Educationally Disadvantaged 2,369 26.8% 2,165,494 41.0%English Language Learners (ELL) 3,185 36.0% 979,868 18.5%Students w/ Disciplinary Placements (2014-2015) 194 2.0% 76,611 1.4%At-Risk 5,356 60.5% 2,645,402 50.1%
Graduates (Class of 2015):Total Graduates 477 100.0% 313,397 100.0%
By Ethnicity (incl. Special Ed.):African American 149 31.2% 39,692 12.7%Hispanic 279 58.5% 148,966 47.5%White 39 8.2% 104,377 33.3%American Indian 3 0.6% 1,335 0.4%Asian 4 0.8% 13,090 4.2%Pacific Islander 0 0.0% 486 0.2%Two or More Races 3 0.6% 5,451 1.7%
TEA Division of Performance Reporting Page 17
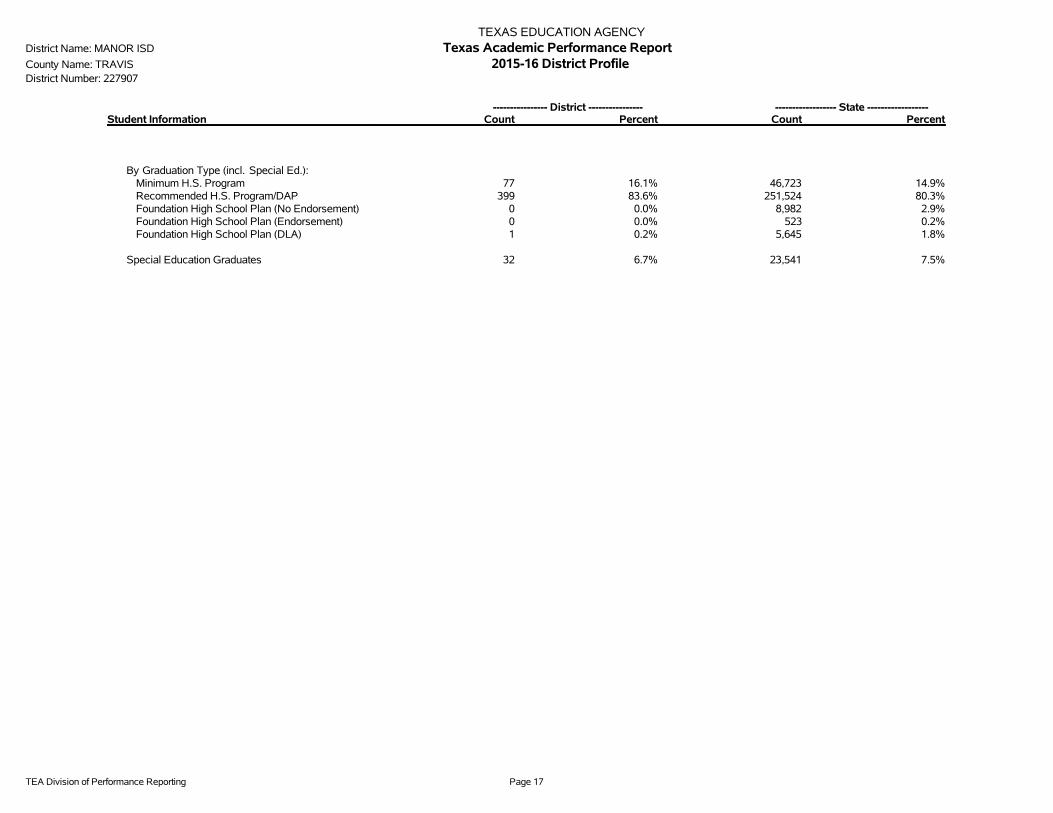
TEXAS EDUCATION AGENCYDistrict Name: MANOR ISD Texas Academic Performance ReportCounty Name: TRAVIS 2015-16 District ProfileDistrict Number: 227907
---------------- District ---------------- ------------------ State ------------------Student Information Count Percent Count Percent
By Graduation Type (incl. Special Ed.):Minimum H.S. Program 77 16.1% 46,723 14.9%Recommended H.S. Program/DAP 399 83.6% 251,524 80.3%Foundation High School Plan (No Endorsement) 0 0.0% 8,982 2.9%Foundation High School Plan (Endorsement) 0 0.0% 523 0.2%Foundation High School Plan (DLA) 1 0.2% 5,645 1.8%
Special Education Graduates 32 6.7% 23,541 7.5%
TEA Division of Performance Reporting Page 18
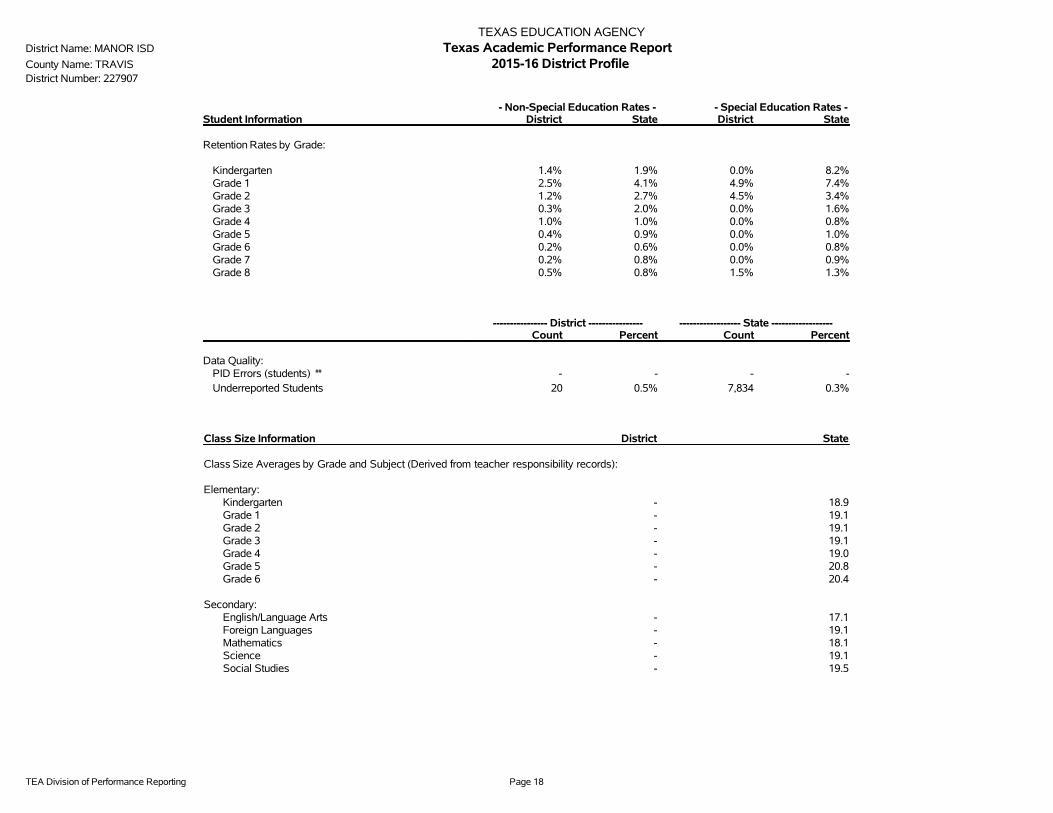
TEXAS EDUCATION AGENCYDistrict Name: MANOR ISD Texas Academic Performance ReportCounty Name: TRAVIS 2015-16 District ProfileDistrict Number: 227907
- Non-Special Education Rates - - Special Education Rates -Student Information District State District State
Retention Rates by Grade:
Kindergarten 1.4% 1.9% 0.0% 8.2%Grade 1 2.5% 4.1% 4.9% 7.4%Grade 2 1.2% 2.7% 4.5% 3.4%Grade 3 0.3% 2.0% 0.0% 1.6%Grade 4 1.0% 1.0% 0.0% 0.8%Grade 5 0.4% 0.9% 0.0% 1.0%Grade 6 0.2% 0.6% 0.0% 0.8%Grade 7 0.2% 0.8% 0.0% 0.9%Grade 8 0.5% 0.8% 1.5% 1.3%
---------------- District ---------------- ------------------ State ------------------Count Percent Count Percent
Data Quality:PID Errors (students) ## - - - -Underreported Students 20 0.5% 7,834 0.3%
Class Size Information District State
Class Size Averages by Grade and Subject (Derived from teacher responsibility records):
Elementary:Kindergarten - 18.9Grade 1 - 19.1Grade 2 - 19.1Grade 3 - 19.1Grade 4 - 19.0Grade 5 - 20.8Grade 6 - 20.4
Secondary:English/Language Arts - 17.1Foreign Languages - 19.1Mathematics - 18.1Science - 19.1Social Studies - 19.5
TEA Division of Performance Reporting Page 19
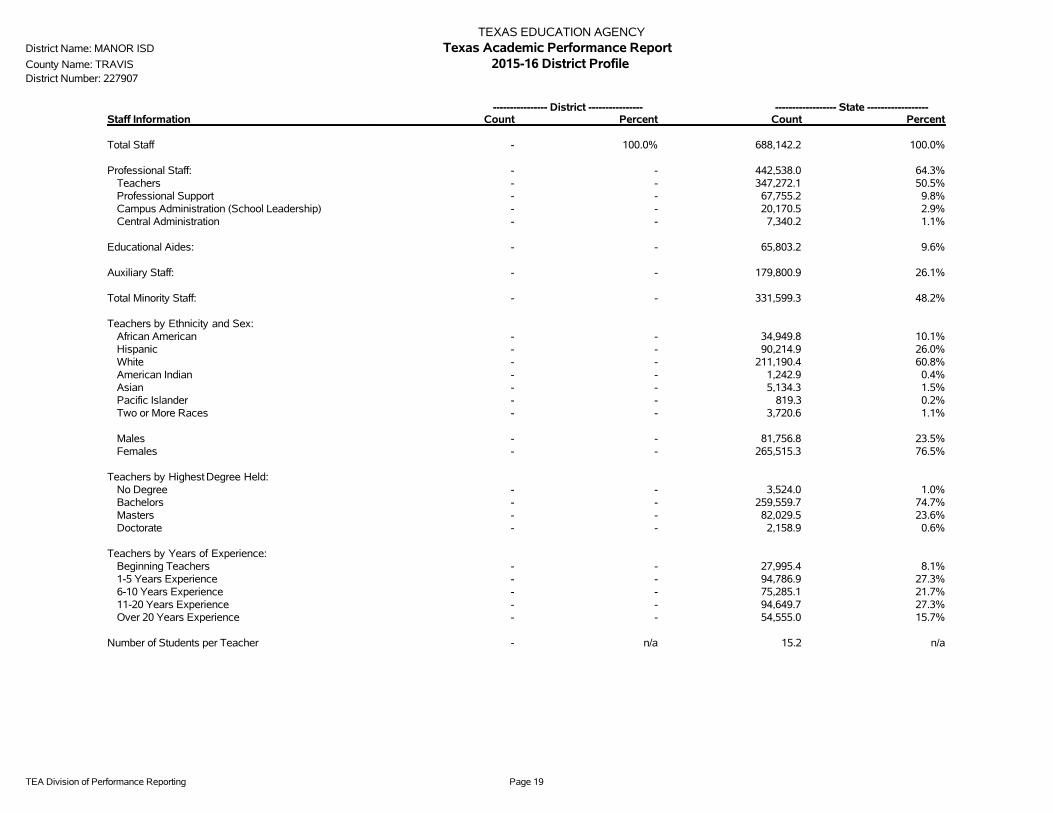
TEXAS EDUCATION AGENCYDistrict Name: MANOR ISD Texas Academic Performance ReportCounty Name: TRAVIS 2015-16 District ProfileDistrict Number: 227907
---------------- District ---------------- ------------------ State ------------------Staff Information Count Percent Count Percent
Total Staff - 100.0% 688,142.2 100.0%
Professional Staff: - - 442,538.0 64.3%Teachers - - 347,272.1 50.5%Professional Support - - 67,755.2 9.8%Campus Administration (School Leadership) - - 20,170.5 2.9%Central Administration - - 7,340.2 1.1%
Educational Aides: - - 65,803.2 9.6%
Auxiliary Staff: - - 179,800.9 26.1%
Total Minority Staff: - - 331,599.3 48.2%
Teachers by Ethnicity and Sex:African American - - 34,949.8 10.1%Hispanic - - 90,214.9 26.0%White - - 211,190.4 60.8%American Indian - - 1,242.9 0.4%Asian - - 5,134.3 1.5%Pacific Islander - - 819.3 0.2%Two or More Races - - 3,720.6 1.1%
Males - - 81,756.8 23.5%Females - - 265,515.3 76.5%
Teachers by Highest Degree Held:No Degree - - 3,524.0 1.0%Bachelors - - 259,559.7 74.7%Masters - - 82,029.5 23.6%Doctorate - - 2,158.9 0.6%
Teachers by Years of Experience:Beginning Teachers - - 27,995.4 8.1%1-5 Years Experience - - 94,786.9 27.3%6-10 Years Experience - - 75,285.1 21.7%11-20 Years Experience - - 94,649.7 27.3%Over 20 Years Experience - - 54,555.0 15.7%
Number of Students per Teacher - n/a 15.2 n/a

TEA Division of Performance Reporting Page 20
TEXAS EDUCATION AGENCYDistrict Name: MANOR ISD Texas Academic Performance ReportCounty Name: TRAVIS 2015-16 District ProfileDistrict Number: 227907
Staff Information District State
Average Years Experience of Teachers: - 10.9Average Years Experience of Teachers with District: - 7.3
Average Teacher Salary by Years of Experience (regular duties only):Beginning Teachers - $45,5071-5 Years Experience - $47,9966-10 Years Experience - $50,45911-20 Years Experience - $53,794Over 20 Years Experience - $60,613
Average Actual Salaries (regular duties only):Teachers - $51,891Professional Support - $61,145Campus Administration (School Leadership) - $75,654Central Administration - $99,111
Instructional Staff Percent: - 64.5
Turnover Rate for Teachers: - 16.5
Staff Exclusions:Shared Services Arrangement Staff:
Professional Staff - 1,116.6Educational Aides - 230.6Auxiliary Staff - 493.6
Contracted Instructional Staff: - 1,914.4
TEA Division of Performance Reporting Page 21
TEXAS EDUCATION AGENCYDistrict Name: MANOR ISD Texas Academic Performance ReportCounty Name: TRAVIS 2015-16 District ProfileDistrict Number: 227907
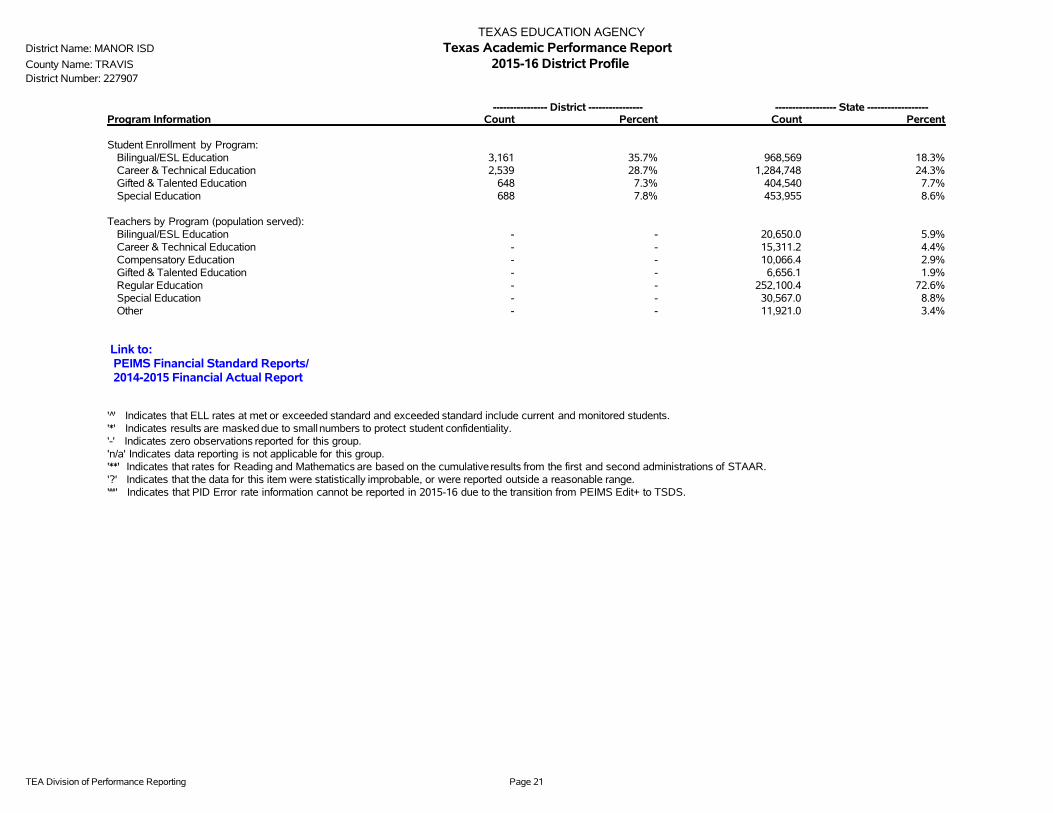
---------------- District ---------------- ------------------ State ------------------Program Information Count Percent Count Percent
Student Enrollment by Program:Bilingual/ESL Education 3,161 35.7% 968,569 18.3%Career & Technical Education 2,539 28.7% 1,284,748 24.3%Gifted & Talented Education 648 7.3% 404,540 7.7%Special Education 688 7.8% 453,955 8.6%
Teachers by Program (population served):Bilingual/ESL Education - - 20,650.0 5.9%Career & Technical Education - - 15,311.2 4.4%Compensatory Education - - 10,066.4 2.9%Gifted & Talented Education - - 6,656.1 1.9%Regular Education - - 252,100.4 72.6%Special Education - - 30,567.0 8.8%Other - - 11,921.0 3.4%
Link to: PEIMS Financial Standard Reports/ 2014-2015 Financial Actual Report
' '̂ Indicates that ELL rates at met or exceeded standard and exceeded standard include current and monitored students.'*' Indicates results are masked due to small numbers to protect student confidentiality.'-' Indicates zero observations reported for this group.'n/a' Indicates data reporting is not applicable for this group.'**' Indicates that rates for Reading and Mathematics are based on the cumulative results from the first and second administrations of STAAR.'?' Indicates that the data for this item were statistically improbable, or were reported outside a reasonable range.'##' Indicates that PID Error rate information cannot be reported in 2015-16 due to the transition from PEIMS Edit+ to TSDS.

This page intentionally left blank.

2015-16 Texas Academic Performance Report2015-16 Texas Academic Performance Report
District Name: MANOR ISD
Campus Name: MANOR H S
Campus Number: 227907001
2016 Accountability Rating: Met Standard

This page intentionally left blank.
TEA Division of Performance Reporting Page 1
TEXAS EDUCATION AGENCYDistrict Name: MANOR ISD Texas Academic Performance Report Total Students: 1,677
Campus Name: MANOR H S 2015-16 Campus Performance Grade Span: 09 - 12Campus Number: 227907001 School Type: High School
State District CampusAfrican
American Hispanic WhiteAmerican
Indian AsianPacific
Islander
Two orMore
RacesSpecial
EdEcon
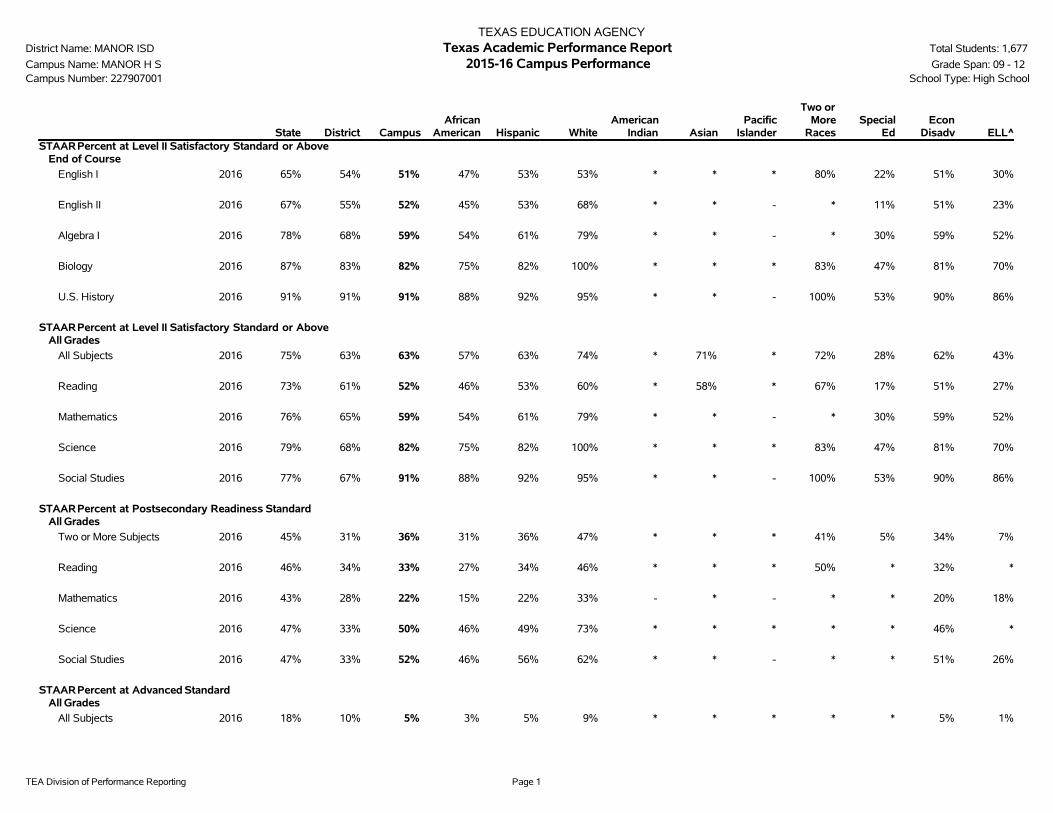
Disadv ELL^STAARPercent at Level II Satisfactory Standard or Above
End of Course
English I 2016 65% 54% 51% 47% 53% 53% * * * 80% 22% 51% 30%
English II 2016 67% 55% 52% 45% 53% 68% * * - * 11% 51% 23%
Algebra I 2016 78% 68% 59% 54% 61% 79% * * - * 30% 59% 52%
Biology 2016 87% 83% 82% 75% 82% 100% * * * 83% 47% 81% 70%
U.S. History 2016 91% 91% 91% 88% 92% 95% * * - 100% 53% 90% 86%
STAARPercent at Level II Satisfactory Standard or AboveAll Grades
All Subjects 2016 75% 63% 63% 57% 63% 74% * 71% * 72% 28% 62% 43%
Reading 2016 73% 61% 52% 46% 53% 60% * 58% * 67% 17% 51% 27%
Mathematics 2016 76% 65% 59% 54% 61% 79% * * - * 30% 59% 52%
Science 2016 79% 68% 82% 75% 82% 100% * * * 83% 47% 81% 70%
Social Studies 2016 77% 67% 91% 88% 92% 95% * * - 100% 53% 90% 86%
STAARPercent at Postsecondary Readiness StandardAll Grades
Two or More Subjects 2016 45% 31% 36% 31% 36% 47% * * * 41% 5% 34% 7%
Reading 2016 46% 34% 33% 27% 34% 46% * * * 50% * 32% *
Mathematics 2016 43% 28% 22% 15% 22% 33% - * - * * 20% 18%
Science 2016 47% 33% 50% 46% 49% 73% * * * * * 46% *
Social Studies 2016 47% 33% 52% 46% 56% 62% * * - * * 51% 26%
STAARPercent at Advanced StandardAll Grades
All Subjects 2016 18% 10% 5% 3% 5% 9% * * * * * 5% 1%

TEA Division of Performance Reporting Page 2
TEXAS EDUCATION AGENCYDistrict Name: MANOR ISD Texas Academic Performance Report Total Students: 1,677
Campus Name: MANOR H S 2015-16 Campus Performance Grade Span: 09 - 12Campus Number: 227907001 School Type: High School
State District CampusAfrican
American Hispanic WhiteAmerican
Indian AsianPacific
Islander
Two orMore
RacesSpecial
EdEcon
Disadv ELL^STAARPercent at Advanced Standard
All Grades
Reading 2016 17% 9% 2% 1% 2% * * * * * * 2% *
Mathematics 2016 19% 12% 3% * 3% * * * - * * 3% *
Science 2016 16% 11% 14% 12% 13% * * * * * * 13% *
Social Studies 2016 22% 10% 13% 9% 15% 24% * * - * * 13% *
STAARPercent Met or Exceeded ProgressAll Grades
All Subjects 2016 62% 59% 43% * 45% * * * - * * 42% 35%
Reading 2016 60% 59% * * * * * * - * * * *
Mathematics 2016 63% 58% 32% * 35% * - * - * * 31% 32%
STAARPercent Exceeded ProgressAll Grades
All Subjects 2016 17% 17% 2% * 3% * * * - * * 2% 3%
Reading 2016 16% 17% * * * * * * - * * * *
Mathematics 2016 17% 16% 5% * 5% * - * - * * 5% 7%
TEA Division of Performance Reporting Page 3
TEXAS EDUCATION AGENCYDistrict Name: MANOR ISD Texas Academic Performance Report Total Students: 1,677
Campus Name: MANOR H S 2015-16 Campus Performance Grade Span: 09 - 12Campus Number: 227907001 Bilingual Education/English as a Second Language (Current Year ELL Students)
State District CampusBilingual
EducationBE-TransEarly Exit
BE-TransLate Exit
BE-DualTwo-Way
BE-DualOne-Way ESL
ESLContent
ESLPull-Out
LEP NoServices
LEP WithServices
TotalELL
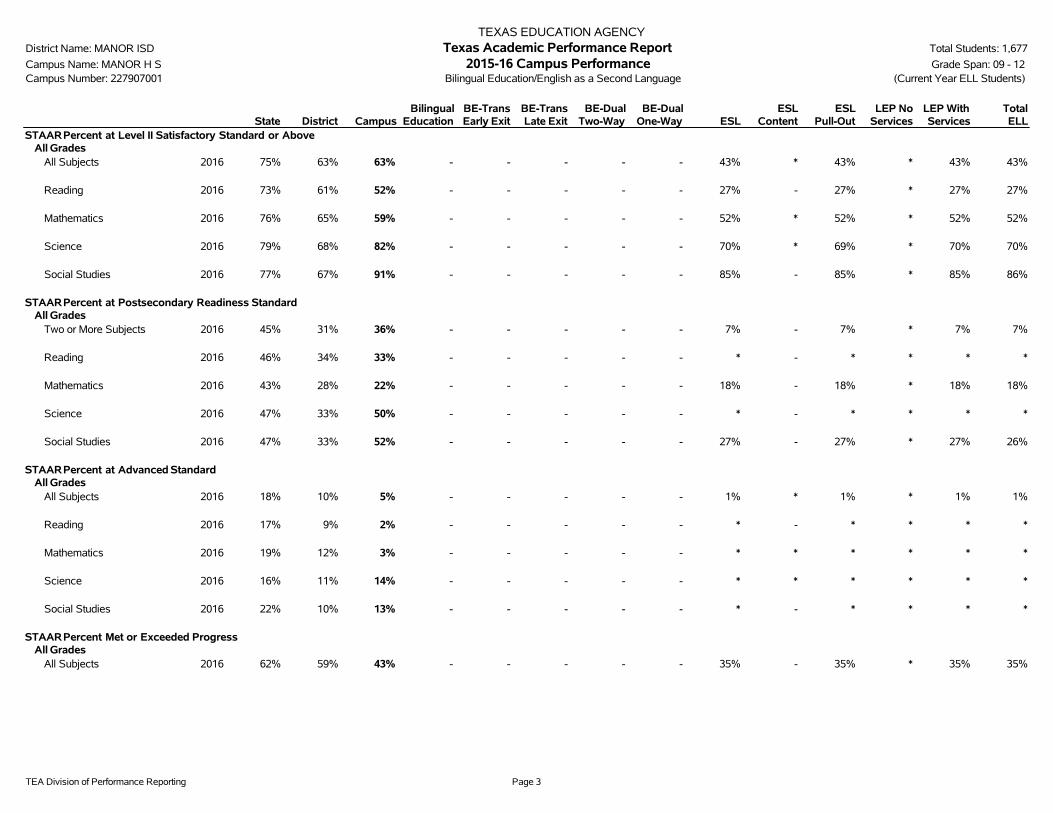
STAARPercent at Level II Satisfactory Standard or AboveAll Grades
All Subjects 2016 75% 63% 63% - - - - - 43% * 43% * 43% 43%
Reading 2016 73% 61% 52% - - - - - 27% - 27% * 27% 27%
Mathematics 2016 76% 65% 59% - - - - - 52% * 52% * 52% 52%
Science 2016 79% 68% 82% - - - - - 70% * 69% * 70% 70%
Social Studies 2016 77% 67% 91% - - - - - 85% - 85% * 85% 86%
STAARPercent at Postsecondary Readiness StandardAll Grades
Two or More Subjects 2016 45% 31% 36% - - - - - 7% - 7% * 7% 7%
Reading 2016 46% 34% 33% - - - - - * - * * * *
Mathematics 2016 43% 28% 22% - - - - - 18% - 18% * 18% 18%
Science 2016 47% 33% 50% - - - - - * - * * * *
Social Studies 2016 47% 33% 52% - - - - - 27% - 27% * 27% 26%
STAARPercent at Advanced StandardAll Grades
All Subjects 2016 18% 10% 5% - - - - - 1% * 1% * 1% 1%
Reading 2016 17% 9% 2% - - - - - * - * * * *
Mathematics 2016 19% 12% 3% - - - - - * * * * * *
Science 2016 16% 11% 14% - - - - - * * * * * *
Social Studies 2016 22% 10% 13% - - - - - * - * * * *
STAARPercent Met or Exceeded ProgressAll Grades
All Subjects 2016 62% 59% 43% - - - - - 35% - 35% * 35% 35%
TEA Division of Performance Reporting Page 4
TEXAS EDUCATION AGENCYDistrict Name: MANOR ISD Texas Academic Performance Report Total Students: 1,677
Campus Name: MANOR H S 2015-16 Campus Performance Grade Span: 09 - 12Campus Number: 227907001 Bilingual Education/English as a Second Language (Current Year ELL Students)
State District CampusBilingual
EducationBE-TransEarly Exit
BE-TransLate Exit
BE-DualTwo-Way
BE-DualOne-Way ESL
ESLContent
ESLPull-Out
LEP NoServices
LEP WithServices
TotalELL
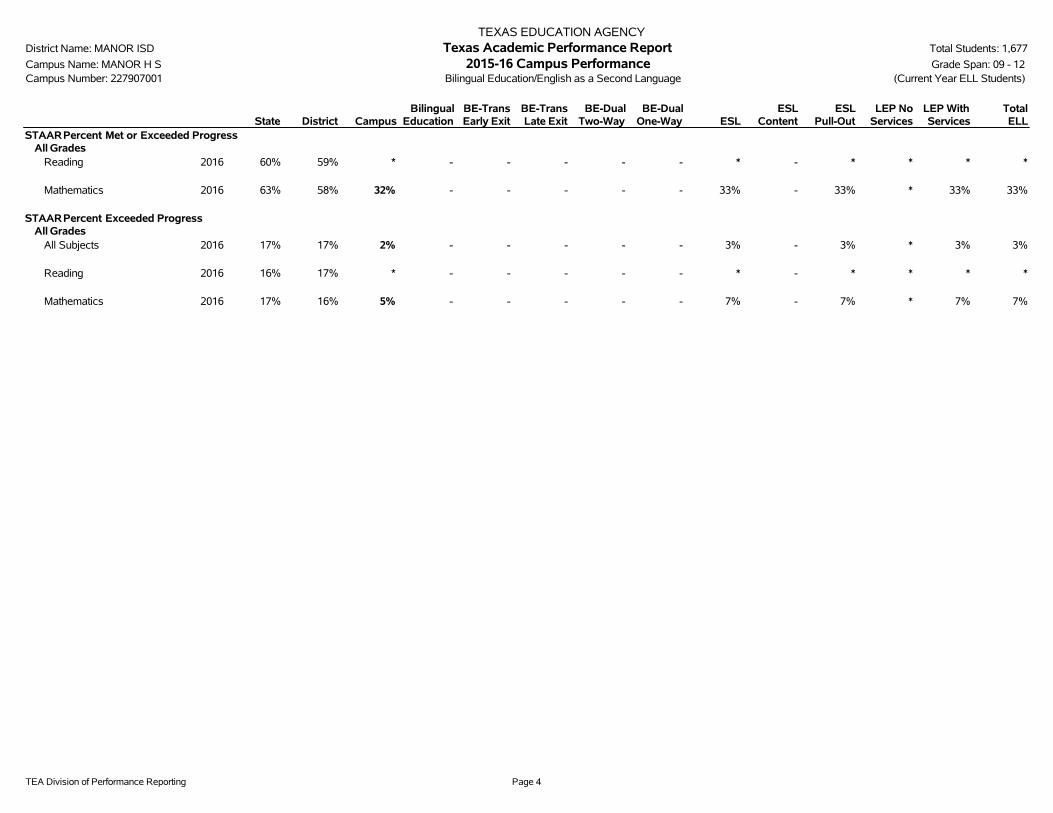
STAARPercent Met or Exceeded ProgressAll Grades
Reading 2016 60% 59% * - - - - - * - * * * *
Mathematics 2016 63% 58% 32% - - - - - 33% - 33% * 33% 33%
STAARPercent Exceeded ProgressAll Grades
All Subjects 2016 17% 17% 2% - - - - - 3% - 3% * 3% 3%
Reading 2016 16% 17% * - - - - - * - * * * *
Mathematics 2016 17% 16% 5% - - - - - 7% - 7% * 7% 7%

TEA Division of Performance Reporting Page 5
TEXAS EDUCATION AGENCYDistrict Name: MANOR ISD Texas Academic Performance Report Total Students: 1,677
Campus Name: MANOR H S 2015-16 Campus Participation Grade Span: 09 - 12Campus Number: 227907001 School Type: High School
State District CampusAfrican
American Hispanic WhiteAmerican
Indian AsianPacific
Islander
Two orMoreRaces
SpecialEd
EconDisadv ELL
2016 STAARParticipation(All Grades)
All TestsTest Participant 99% 99% 99% 99% 99% 100% 100% 100% * 100% 100% 99% 100%
Included in Accountability 94% 92% 91% 89% 91% 95% 100% 72% * 88% 91% 94% 85%Not Included in Accountability
Mobile 4% 6% 7% 9% 6% 5% 0% 17% * 2% 8% 4% 7%Other Exclusions 1% 1% 2% 0% 2% 0% 0% 10% * 10% 1% 2% 8%
Not Tested 1% 1% 1% 1% 1% 0% 0% 0% * 0% 0% 1% 0%Absent 1% 1% 1% 1% 1% 0% 0% 0% * 0% 0% 1% 0%Other 0% 0% 0% 0% 0% 0% 0% 0% * 0% 0% 0% 0%
TEA Division of Performance Reporting Page 6
TEXAS EDUCATION AGENCYDistrict Name: MANOR ISD Texas Academic Performance Report Total Students: 1,677
Campus Name: MANOR H S 2015-16 Campus Attendance and Postsecondary Readiness Grade Span: 09 - 12Campus Number: 227907001 School Type: High School
State District CampusAfrican
American Hispanic WhiteAmerican
Indian AsianPacific
IslanderTwo or
More RacesSpecial
EdEcon
Disadv ELL
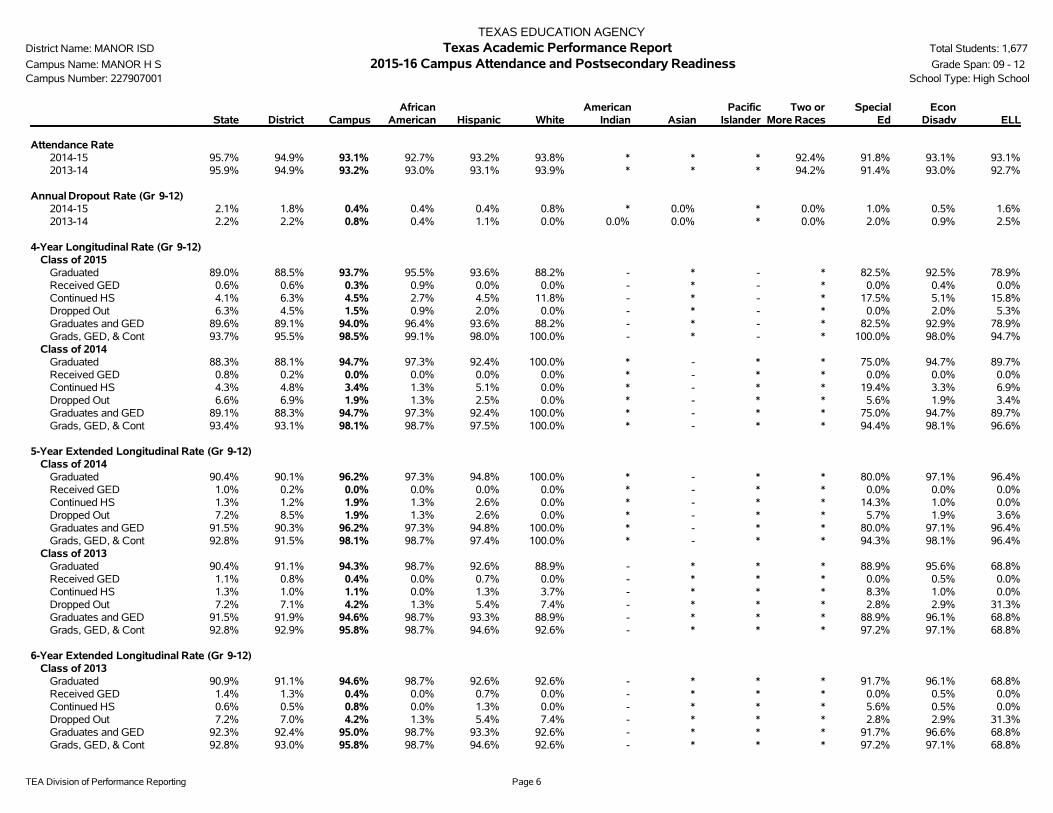
Attendance Rate2014-15 95.7% 94.9% 93.1% 92.7% 93.2% 93.8% * * * 92.4% 91.8% 93.1% 93.1%2013-14 95.9% 94.9% 93.2% 93.0% 93.1% 93.9% * * * 94.2% 91.4% 93.0% 92.7%
Annual Dropout Rate (Gr 9-12)2014-15 2.1% 1.8% 0.4% 0.4% 0.4% 0.8% * 0.0% * 0.0% 1.0% 0.5% 1.6%2013-14 2.2% 2.2% 0.8% 0.4% 1.1% 0.0% 0.0% 0.0% * 0.0% 2.0% 0.9% 2.5%
4-Year Longitudinal Rate (Gr 9-12)Class of 2015
Graduated 89.0% 88.5% 93.7% 95.5% 93.6% 88.2% - * - * 82.5% 92.5% 78.9%Received GED 0.6% 0.6% 0.3% 0.9% 0.0% 0.0% - * - * 0.0% 0.4% 0.0%Continued HS 4.1% 6.3% 4.5% 2.7% 4.5% 11.8% - * - * 17.5% 5.1% 15.8%Dropped Out 6.3% 4.5% 1.5% 0.9% 2.0% 0.0% - * - * 0.0% 2.0% 5.3%Graduates and GED 89.6% 89.1% 94.0% 96.4% 93.6% 88.2% - * - * 82.5% 92.9% 78.9%Grads, GED, & Cont 93.7% 95.5% 98.5% 99.1% 98.0% 100.0% - * - * 100.0% 98.0% 94.7%
Class of 2014Graduated 88.3% 88.1% 94.7% 97.3% 92.4% 100.0% * - * * 75.0% 94.7% 89.7%Received GED 0.8% 0.2% 0.0% 0.0% 0.0% 0.0% * - * * 0.0% 0.0% 0.0%Continued HS 4.3% 4.8% 3.4% 1.3% 5.1% 0.0% * - * * 19.4% 3.3% 6.9%Dropped Out 6.6% 6.9% 1.9% 1.3% 2.5% 0.0% * - * * 5.6% 1.9% 3.4%Graduates and GED 89.1% 88.3% 94.7% 97.3% 92.4% 100.0% * - * * 75.0% 94.7% 89.7%Grads, GED, & Cont 93.4% 93.1% 98.1% 98.7% 97.5% 100.0% * - * * 94.4% 98.1% 96.6%
5-Year Extended Longitudinal Rate (Gr 9-12)Class of 2014
Graduated 90.4% 90.1% 96.2% 97.3% 94.8% 100.0% * - * * 80.0% 97.1% 96.4%Received GED 1.0% 0.2% 0.0% 0.0% 0.0% 0.0% * - * * 0.0% 0.0% 0.0%Continued HS 1.3% 1.2% 1.9% 1.3% 2.6% 0.0% * - * * 14.3% 1.0% 0.0%Dropped Out 7.2% 8.5% 1.9% 1.3% 2.6% 0.0% * - * * 5.7% 1.9% 3.6%Graduates and GED 91.5% 90.3% 96.2% 97.3% 94.8% 100.0% * - * * 80.0% 97.1% 96.4%Grads, GED, & Cont 92.8% 91.5% 98.1% 98.7% 97.4% 100.0% * - * * 94.3% 98.1% 96.4%
Class of 2013Graduated 90.4% 91.1% 94.3% 98.7% 92.6% 88.9% - * * * 88.9% 95.6% 68.8%Received GED 1.1% 0.8% 0.4% 0.0% 0.7% 0.0% - * * * 0.0% 0.5% 0.0%Continued HS 1.3% 1.0% 1.1% 0.0% 1.3% 3.7% - * * * 8.3% 1.0% 0.0%Dropped Out 7.2% 7.1% 4.2% 1.3% 5.4% 7.4% - * * * 2.8% 2.9% 31.3%Graduates and GED 91.5% 91.9% 94.6% 98.7% 93.3% 88.9% - * * * 88.9% 96.1% 68.8%Grads, GED, & Cont 92.8% 92.9% 95.8% 98.7% 94.6% 92.6% - * * * 97.2% 97.1% 68.8%
6-Year Extended Longitudinal Rate (Gr 9-12)Class of 2013
Graduated 90.9% 91.1% 94.6% 98.7% 92.6% 92.6% - * * * 91.7% 96.1% 68.8%Received GED 1.4% 1.3% 0.4% 0.0% 0.7% 0.0% - * * * 0.0% 0.5% 0.0%Continued HS 0.6% 0.5% 0.8% 0.0% 1.3% 0.0% - * * * 5.6% 0.5% 0.0%Dropped Out 7.2% 7.0% 4.2% 1.3% 5.4% 7.4% - * * * 2.8% 2.9% 31.3%Graduates and GED 92.3% 92.4% 95.0% 98.7% 93.3% 92.6% - * * * 91.7% 96.6% 68.8%Grads, GED, & Cont 92.8% 93.0% 95.8% 98.7% 94.6% 92.6% - * * * 97.2% 97.1% 68.8%
TEA Division of Performance Reporting Page 7
TEXAS EDUCATION AGENCYDistrict Name: MANOR ISD Texas Academic Performance Report Total Students: 1,677
Campus Name: MANOR H S 2015-16 Campus Attendance and Postsecondary Readiness Grade Span: 09 - 12Campus Number: 227907001 School Type: High School
State District CampusAfrican
American Hispanic WhiteAmerican
Indian AsianPacific
IslanderTwo or
More RacesSpecial
EdEcon
Disadv ELL
6-Year Extended Longitudinal Rate (Gr 9-12)Class of 2012
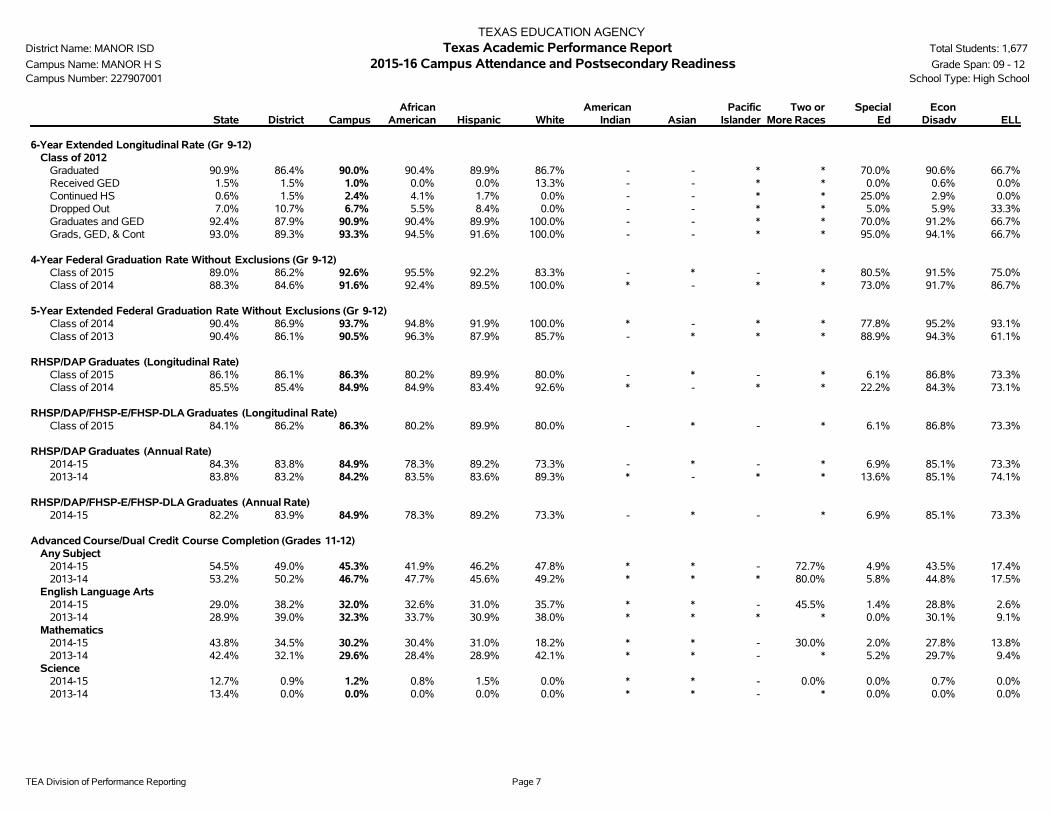
Graduated 90.9% 86.4% 90.0% 90.4% 89.9% 86.7% - - * * 70.0% 90.6% 66.7%Received GED 1.5% 1.5% 1.0% 0.0% 0.0% 13.3% - - * * 0.0% 0.6% 0.0%Continued HS 0.6% 1.5% 2.4% 4.1% 1.7% 0.0% - - * * 25.0% 2.9% 0.0%Dropped Out 7.0% 10.7% 6.7% 5.5% 8.4% 0.0% - - * * 5.0% 5.9% 33.3%Graduates and GED 92.4% 87.9% 90.9% 90.4% 89.9% 100.0% - - * * 70.0% 91.2% 66.7%Grads, GED, & Cont 93.0% 89.3% 93.3% 94.5% 91.6% 100.0% - - * * 95.0% 94.1% 66.7%
4-Year Federal Graduation Rate Without Exclusions (Gr 9-12)Class of 2015 89.0% 86.2% 92.6% 95.5% 92.2% 83.3% - * - * 80.5% 91.5% 75.0%Class of 2014 88.3% 84.6% 91.6% 92.4% 89.5% 100.0% * - * * 73.0% 91.7% 86.7%
5-Year Extended Federal Graduation Rate Without Exclusions (Gr 9-12)Class of 2014 90.4% 86.9% 93.7% 94.8% 91.9% 100.0% * - * * 77.8% 95.2% 93.1%Class of 2013 90.4% 86.1% 90.5% 96.3% 87.9% 85.7% - * * * 88.9% 94.3% 61.1%
RHSP/DAP Graduates (Longitudinal Rate)Class of 2015 86.1% 86.1% 86.3% 80.2% 89.9% 80.0% - * - * 6.1% 86.8% 73.3%Class of 2014 85.5% 85.4% 84.9% 84.9% 83.4% 92.6% * - * * 22.2% 84.3% 73.1%
RHSP/DAP/FHSP-E/FHSP-DLA Graduates (Longitudinal Rate)Class of 2015 84.1% 86.2% 86.3% 80.2% 89.9% 80.0% - * - * 6.1% 86.8% 73.3%
RHSP/DAP Graduates (Annual Rate)2014-15 84.3% 83.8% 84.9% 78.3% 89.2% 73.3% - * - * 6.9% 85.1% 73.3%2013-14 83.8% 83.2% 84.2% 83.5% 83.6% 89.3% * - * * 13.6% 85.1% 74.1%
RHSP/DAP/FHSP-E/FHSP-DLA Graduates (Annual Rate)2014-15 82.2% 83.9% 84.9% 78.3% 89.2% 73.3% - * - * 6.9% 85.1% 73.3%
Advanced Course/Dual Credit Course Completion (Grades 11-12)Any Subject
2014-15 54.5% 49.0% 45.3% 41.9% 46.2% 47.8% * * - 72.7% 4.9% 43.5% 17.4%2013-14 53.2% 50.2% 46.7% 47.7% 45.6% 49.2% * * * 80.0% 5.8% 44.8% 17.5%
English Language Arts2014-15 29.0% 38.2% 32.0% 32.6% 31.0% 35.7% * * - 45.5% 1.4% 28.8% 2.6%2013-14 28.9% 39.0% 32.3% 33.7% 30.9% 38.0% * * * * 0.0% 30.1% 9.1%
Mathematics2014-15 43.8% 34.5% 30.2% 30.4% 31.0% 18.2% * * - 30.0% 2.0% 27.8% 13.8%2013-14 42.4% 32.1% 29.6% 28.4% 28.9% 42.1% * * - * 5.2% 29.7% 9.4%
Science2014-15 12.7% 0.9% 1.2% 0.8% 1.5% 0.0% * * - 0.0% 0.0% 0.7% 0.0%2013-14 13.4% 0.0% 0.0% 0.0% 0.0% 0.0% * * - * 0.0% 0.0% 0.0%
TEA Division of Performance Reporting Page 8
TEXAS EDUCATION AGENCYDistrict Name: MANOR ISD Texas Academic Performance Report Total Students: 1,677
Campus Name: MANOR H S 2015-16 Campus Attendance and Postsecondary Readiness Grade Span: 09 - 12Campus Number: 227907001 School Type: High School
State District CampusAfrican
American Hispanic WhiteAmerican
Indian AsianPacific
IslanderTwo or
More RacesSpecial
EdEcon
Disadv ELL
Advanced Course/Dual Credit Course Completion (Grades 11-12)Social Studies
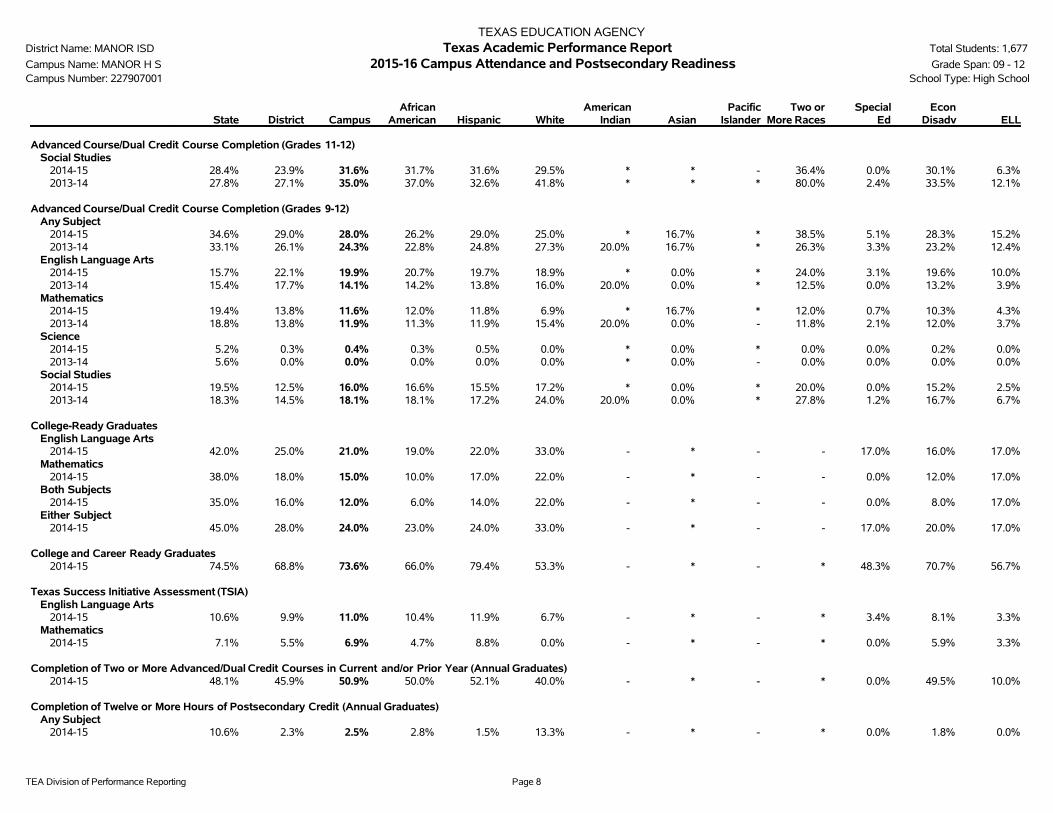
2014-15 28.4% 23.9% 31.6% 31.7% 31.6% 29.5% * * - 36.4% 0.0% 30.1% 6.3%2013-14 27.8% 27.1% 35.0% 37.0% 32.6% 41.8% * * * 80.0% 2.4% 33.5% 12.1%
Advanced Course/Dual Credit Course Completion (Grades 9-12)Any Subject
2014-15 34.6% 29.0% 28.0% 26.2% 29.0% 25.0% * 16.7% * 38.5% 5.1% 28.3% 15.2%2013-14 33.1% 26.1% 24.3% 22.8% 24.8% 27.3% 20.0% 16.7% * 26.3% 3.3% 23.2% 12.4%
English Language Arts2014-15 15.7% 22.1% 19.9% 20.7% 19.7% 18.9% * 0.0% * 24.0% 3.1% 19.6% 10.0%2013-14 15.4% 17.7% 14.1% 14.2% 13.8% 16.0% 20.0% 0.0% * 12.5% 0.0% 13.2% 3.9%
Mathematics2014-15 19.4% 13.8% 11.6% 12.0% 11.8% 6.9% * 16.7% * 12.0% 0.7% 10.3% 4.3%2013-14 18.8% 13.8% 11.9% 11.3% 11.9% 15.4% 20.0% 0.0% - 11.8% 2.1% 12.0% 3.7%
Science2014-15 5.2% 0.3% 0.4% 0.3% 0.5% 0.0% * 0.0% * 0.0% 0.0% 0.2% 0.0%2013-14 5.6% 0.0% 0.0% 0.0% 0.0% 0.0% * 0.0% - 0.0% 0.0% 0.0% 0.0%
Social Studies2014-15 19.5% 12.5% 16.0% 16.6% 15.5% 17.2% * 0.0% * 20.0% 0.0% 15.2% 2.5%2013-14 18.3% 14.5% 18.1% 18.1% 17.2% 24.0% 20.0% 0.0% * 27.8% 1.2% 16.7% 6.7%
College-Ready GraduatesEnglish Language Arts
2014-15 42.0% 25.0% 21.0% 19.0% 22.0% 33.0% - * - - 17.0% 16.0% 17.0%Mathematics
2014-15 38.0% 18.0% 15.0% 10.0% 17.0% 22.0% - * - - 0.0% 12.0% 17.0%Both Subjects
2014-15 35.0% 16.0% 12.0% 6.0% 14.0% 22.0% - * - - 0.0% 8.0% 17.0%Either Subject
2014-15 45.0% 28.0% 24.0% 23.0% 24.0% 33.0% - * - - 17.0% 20.0% 17.0%
College and Career Ready Graduates2014-15 74.5% 68.8% 73.6% 66.0% 79.4% 53.3% - * - * 48.3% 70.7% 56.7%
Texas Success Initiative Assessment (TSIA)English Language Arts
2014-15 10.6% 9.9% 11.0% 10.4% 11.9% 6.7% - * - * 3.4% 8.1% 3.3%Mathematics
2014-15 7.1% 5.5% 6.9% 4.7% 8.8% 0.0% - * - * 0.0% 5.9% 3.3%
Completion of Two or More Advanced/Dual Credit Courses in Current and/or Prior Year (Annual Graduates)2014-15 48.1% 45.9% 50.9% 50.0% 52.1% 40.0% - * - * 0.0% 49.5% 10.0%
Completion of Twelve or More Hours of Postsecondary Credit (Annual Graduates)Any Subject
2014-15 10.6% 2.3% 2.5% 2.8% 1.5% 13.3% - * - * 0.0% 1.8% 0.0%
TEA Division of Performance Reporting Page 9
TEXAS EDUCATION AGENCYDistrict Name: MANOR ISD Texas Academic Performance Report Total Students: 1,677
Campus Name: MANOR H S 2015-16 Campus Attendance and Postsecondary Readiness Grade Span: 09 - 12Campus Number: 227907001 School Type: High School
State District CampusAfrican
American Hispanic WhiteAmerican
Indian AsianPacific
IslanderTwo or
More RacesSpecial
EdEcon
Disadv ELL
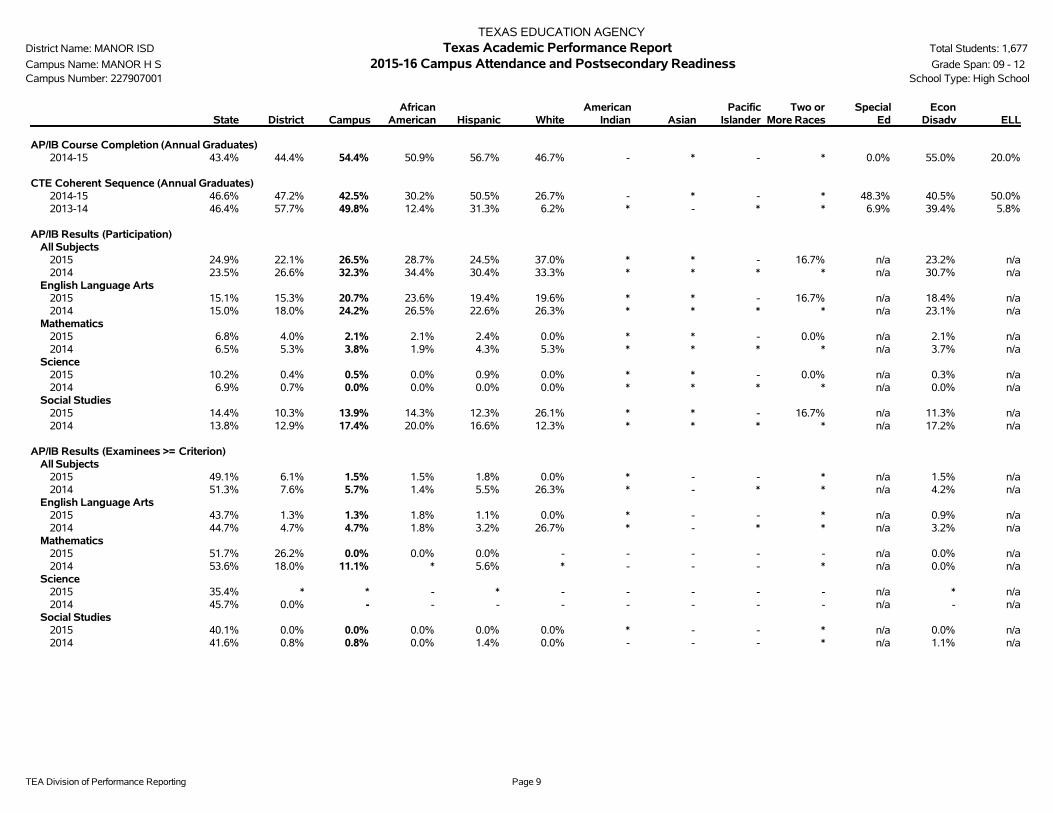
AP/IB Course Completion (Annual Graduates)2014-15 43.4% 44.4% 54.4% 50.9% 56.7% 46.7% - * - * 0.0% 55.0% 20.0%
CTE Coherent Sequence (Annual Graduates)2014-15 46.6% 47.2% 42.5% 30.2% 50.5% 26.7% - * - * 48.3% 40.5% 50.0%2013-14 46.4% 57.7% 49.8% 12.4% 31.3% 6.2% * - * * 6.9% 39.4% 5.8%
AP/IB Results (Participation)All Subjects
2015 24.9% 22.1% 26.5% 28.7% 24.5% 37.0% * * - 16.7% n/a 23.2% n/a2014 23.5% 26.6% 32.3% 34.4% 30.4% 33.3% * * * * n/a 30.7% n/a
English Language Arts2015 15.1% 15.3% 20.7% 23.6% 19.4% 19.6% * * - 16.7% n/a 18.4% n/a2014 15.0% 18.0% 24.2% 26.5% 22.6% 26.3% * * * * n/a 23.1% n/a
Mathematics2015 6.8% 4.0% 2.1% 2.1% 2.4% 0.0% * * - 0.0% n/a 2.1% n/a2014 6.5% 5.3% 3.8% 1.9% 4.3% 5.3% * * * * n/a 3.7% n/a
Science2015 10.2% 0.4% 0.5% 0.0% 0.9% 0.0% * * - 0.0% n/a 0.3% n/a2014 6.9% 0.7% 0.0% 0.0% 0.0% 0.0% * * * * n/a 0.0% n/a
Social Studies2015 14.4% 10.3% 13.9% 14.3% 12.3% 26.1% * * - 16.7% n/a 11.3% n/a2014 13.8% 12.9% 17.4% 20.0% 16.6% 12.3% * * * * n/a 17.2% n/a
AP/IB Results (Examinees >= Criterion)All Subjects
2015 49.1% 6.1% 1.5% 1.5% 1.8% 0.0% * - - * n/a 1.5% n/a2014 51.3% 7.6% 5.7% 1.4% 5.5% 26.3% * - * * n/a 4.2% n/a
English Language Arts2015 43.7% 1.3% 1.3% 1.8% 1.1% 0.0% * - - * n/a 0.9% n/a2014 44.7% 4.7% 4.7% 1.8% 3.2% 26.7% * - * * n/a 3.2% n/a
Mathematics2015 51.7% 26.2% 0.0% 0.0% 0.0% - - - - - n/a 0.0% n/a2014 53.6% 18.0% 11.1% * 5.6% * - - - * n/a 0.0% n/a
Science2015 35.4% * * - * - - - - - n/a * n/a2014 45.7% 0.0% - - - - - - - - n/a - n/a
Social Studies2015 40.1% 0.0% 0.0% 0.0% 0.0% 0.0% * - - * n/a 0.0% n/a2014 41.6% 0.8% 0.8% 0.0% 1.4% 0.0% - - - * n/a 1.1% n/a
TEA Division of Performance Reporting Page 10
TEXAS EDUCATION AGENCYDistrict Name: MANOR ISD Texas Academic Performance Report Total Students: 1,677
Campus Name: MANOR H S 2015-16 Campus Attendance and Postsecondary Readiness Grade Span: 09 - 12Campus Number: 227907001 School Type: High School
State District CampusAfrican
American Hispanic WhiteAmerican
Indian AsianPacific
IslanderTwo or
More RacesSpecial
EdEcon
Disadv ELL
SAT/ACT ResultsTested
Class of 2015 68.3% 61.2% 64.8% 67.0% 62.9% 73.3% - * - * n/a 64.7% n/aClass of 2014 66.3% 73.2% 78.8% 87.3% 73.3% 78.6% * - * * n/a 77.9% n/a
At/Above CriterionClass of 2015 24.3% 6.8% 3.4% 2.8% 2.5% 18.2% - * - * n/a 1.9% n/aClass of 2014 25.1% 7.3% 5.9% 1.4% 2.8% 36.4% * - * * n/a 3.8% n/a
Average SAT ScoreAll Subjects
Class of 2015 1394 1233 1187 1169 1187 1321 - * - * n/a 1166 n/aClass of 2014 1417 1258 1210 1187 1167 1448 * - * * n/a 1187 n/a
English Language Arts and WritingClass of 2015 912 810 781 774 774 891 - * - * n/a 766 n/aClass of 2014 925 829 797 781 767 962 * - * * n/a 782 n/a
MathematicsClass of 2015 482 423 407 395 412 430 - * - * n/a 400 n/aClass of 2014 491 429 414 406 401 486 * - * * n/a 406 n/a
Average ACT ScoreAll Subjects
Class of 2015 20.6 16.5 16.1 15.6 16.0 21.3 - - - * n/a 15.8 n/aClass of 2014 20.6 17.5 17.0 15.8 16.8 21.7 * - * * n/a 16.5 n/a
English Language ArtsClass of 2015 20.1 15.6 15.3 14.7 15.1 22.4 - - - * n/a 14.9 n/aClass of 2014 20.0 16.7 16.2 15.0 15.9 21.4 * - * * n/a 15.6 n/a
MathematicsClass of 2015 20.9 17.1 16.8 16.3 16.8 19.0 - - - * n/a 16.5 n/aClass of 2014 21.2 17.7 17.3 16.3 17.2 20.9 * - * * n/a 16.9 n/a
ScienceClass of 2015 20.7 17.1 16.6 16.2 16.6 21.3 - - - * n/a 16.4 n/aClass of 2014 20.7 18.2 17.6 16.3 17.4 22.6 * - * * n/a 17.3 n/a
Graduates Enrolled in TX Institution of Higher Education (IHE)2013-14 57.5% 52.3% 51.0% n/a n/a n/a n/a n/a n/a n/a n/a n/a n/a2012-13 56.9% 47.5% 48.8% n/a n/a n/a n/a n/a n/a n/a n/a n/a n/a
Graduates in TX IHE Completing One Year Without Remediation2013-14 70.5% 55.5% 52.7% n/a n/a n/a n/a n/a n/a n/a n/a n/a n/a2012-13 70.8% 61.1% 62.9% n/a n/a n/a n/a n/a n/a n/a n/a n/a n/a
TEA Division of Performance Reporting Page 11
TEXAS EDUCATION AGENCYDistrict Name: MANOR ISD Texas Academic Performance Report Total Students: 1,677
Campus Name: MANOR H S 2015-16 Campus Profile Grade Span: 09 - 12Campus Number: 227907001 School Type: High School
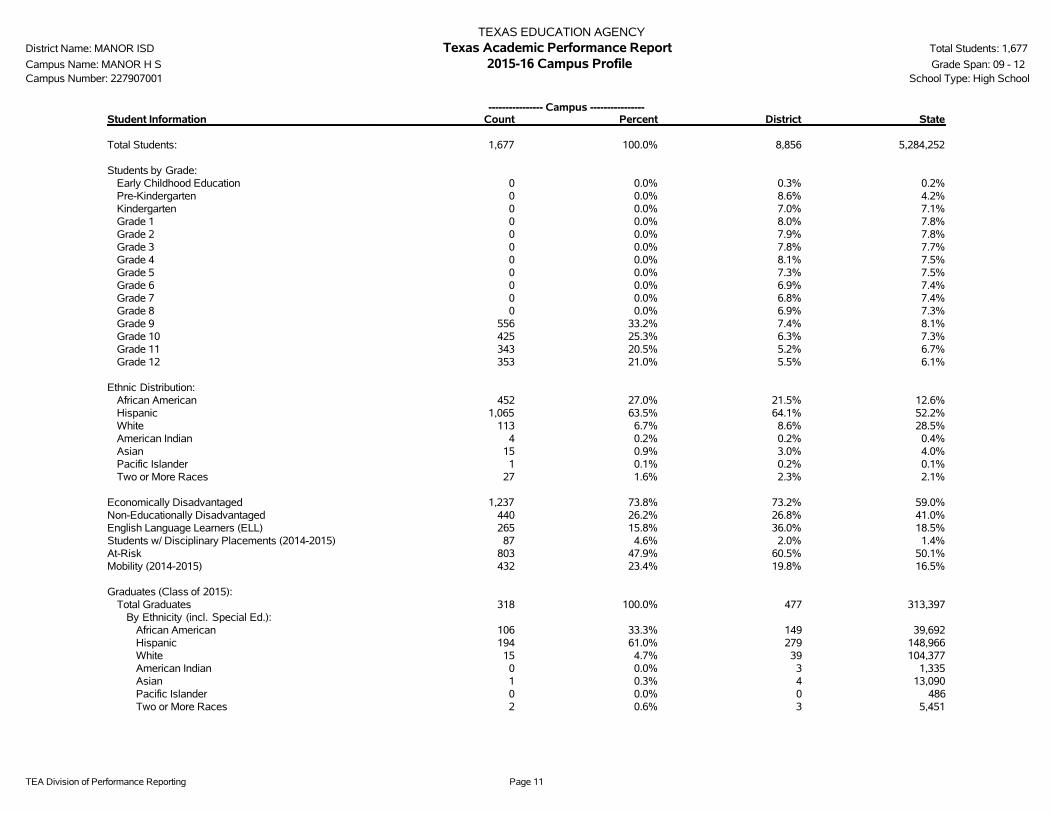
---------------- Campus ----------------Student Information Count Percent District State
Total Students: 1,677 100.0% 8,856 5,284,252
Students by Grade:Early Childhood Education 0 0.0% 0.3% 0.2%Pre-Kindergarten 0 0.0% 8.6% 4.2%Kindergarten 0 0.0% 7.0% 7.1%Grade 1 0 0.0% 8.0% 7.8%Grade 2 0 0.0% 7.9% 7.8%Grade 3 0 0.0% 7.8% 7.7%Grade 4 0 0.0% 8.1% 7.5%Grade 5 0 0.0% 7.3% 7.5%Grade 6 0 0.0% 6.9% 7.4%Grade 7 0 0.0% 6.8% 7.4%Grade 8 0 0.0% 6.9% 7.3%Grade 9 556 33.2% 7.4% 8.1%Grade 10 425 25.3% 6.3% 7.3%Grade 11 343 20.5% 5.2% 6.7%Grade 12 353 21.0% 5.5% 6.1%
Ethnic Distribution:African American 452 27.0% 21.5% 12.6%Hispanic 1,065 63.5% 64.1% 52.2%White 113 6.7% 8.6% 28.5%American Indian 4 0.2% 0.2% 0.4%Asian 15 0.9% 3.0% 4.0%Pacific Islander 1 0.1% 0.2% 0.1%Two or More Races 27 1.6% 2.3% 2.1%
Economically Disadvantaged 1,237 73.8% 73.2% 59.0%Non-Educationally Disadvantaged 440 26.2% 26.8% 41.0%English Language Learners (ELL) 265 15.8% 36.0% 18.5%Students w/ Disciplinary Placements (2014-2015) 87 4.6% 2.0% 1.4%At-Risk 803 47.9% 60.5% 50.1%Mobility (2014-2015) 432 23.4% 19.8% 16.5%
Graduates (Class of 2015):Total Graduates 318 100.0% 477 313,397
By Ethnicity (incl. Special Ed.):African American 106 33.3% 149 39,692Hispanic 194 61.0% 279 148,966White 15 4.7% 39 104,377American Indian 0 0.0% 3 1,335Asian 1 0.3% 4 13,090Pacific Islander 0 0.0% 0 486Two or More Races 2 0.6% 3 5,451
TEA Division of Performance Reporting Page 12
TEXAS EDUCATION AGENCYDistrict Name: MANOR ISD Texas Academic Performance Report Total Students: 1,677
Campus Name: MANOR H S 2015-16 Campus Profile Grade Span: 09 - 12Campus Number: 227907001 School Type: High School
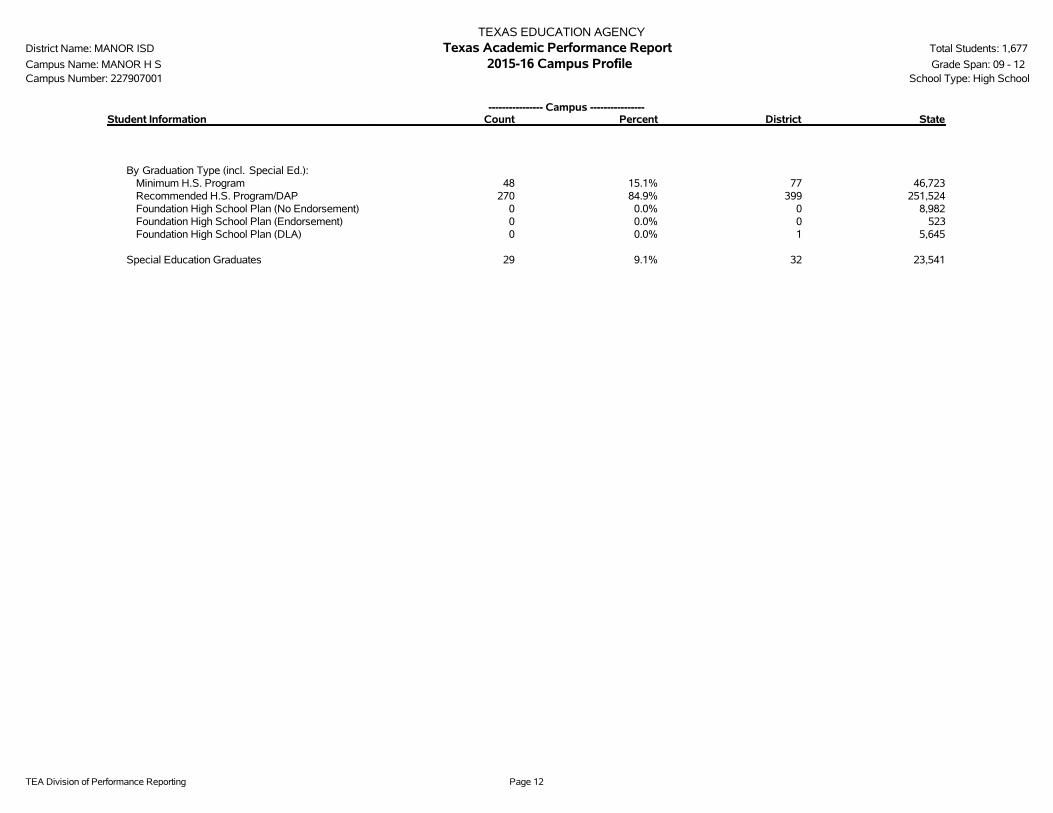
---------------- Campus ----------------Student Information Count Percent District State
By Graduation Type (incl. Special Ed.):Minimum H.S. Program 48 15.1% 77 46,723Recommended H.S. Program/DAP 270 84.9% 399 251,524Foundation High School Plan (No Endorsement) 0 0.0% 0 8,982Foundation High School Plan (Endorsement) 0 0.0% 0 523Foundation High School Plan (DLA) 0 0.0% 1 5,645
Special Education Graduates 29 9.1% 32 23,541
TEA Division of Performance Reporting Page 13
TEXAS EDUCATION AGENCYDistrict Name: MANOR ISD Texas Academic Performance Report Total Students: 1,677
Campus Name: MANOR H S 2015-16 Campus Profile Grade Span: 09 - 12Campus Number: 227907001 School Type: High School
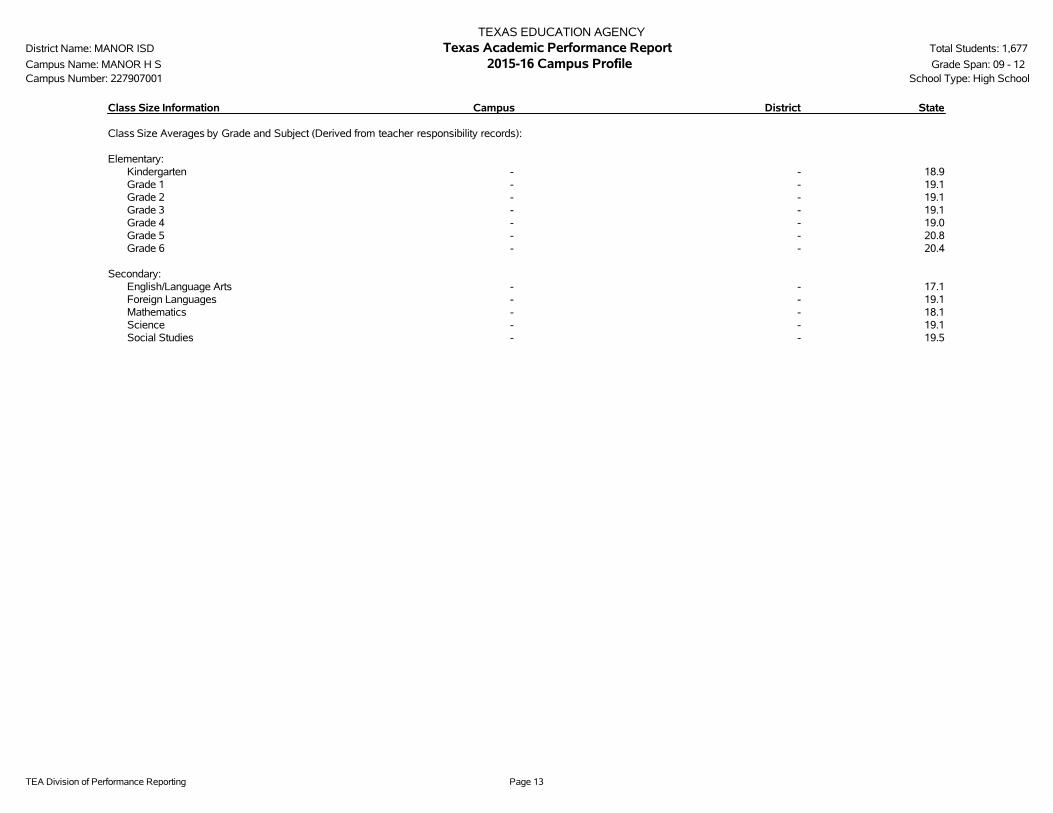
Class Size Information Campus District State
Class Size Averages by Grade and Subject (Derived from teacher responsibility records):
Elementary:Kindergarten - - 18.9Grade 1 - - 19.1Grade 2 - - 19.1Grade 3 - - 19.1Grade 4 - - 19.0Grade 5 - - 20.8Grade 6 - - 20.4
Secondary:English/Language Arts - - 17.1Foreign Languages - - 19.1Mathematics - - 18.1Science - - 19.1Social Studies - - 19.5

TEA Division of Performance Reporting Page 14
TEXAS EDUCATION AGENCYDistrict Name: MANOR ISD Texas Academic Performance Report Total Students: 1,677
Campus Name: MANOR H S 2015-16 Campus Profile Grade Span: 09 - 12Campus Number: 227907001 School Type: High School
---------------- Campus ----------------Staff Information Count/Average Percent District State
Total Staff - 100.0% 100.0% 100.0%
Professional Staff: - - - 64.3%Teachers - - - 50.5%Professional Support - - - 9.8%Campus Administration (School Leadership) - - - 2.9%
Educational Aides: - - - 9.6%
Total Minority Staff: - - - 48.2%
Teachers by Ethnicity and Sex:African American - - - 10.1%Hispanic - - - 26.0%White - - - 60.8%American Indian - - - 0.4%Asian - - - 1.5%Pacific Islander - - - 0.2%Two or More Races - - - 1.1%
Males - - - 23.5%Females - - - 76.5%
Teachers by Highest Degree Held:No Degree - - - 1.0%Bachelors - - - 74.7%Masters - - - 23.6%Doctorate - - - 0.6%
Teachers by Years of Experience:Beginning Teachers - - - 8.1%1-5 Years Experience - - - 27.3%6-10 Years Experience - - - 21.7%11-20 Years Experience - - - 27.3%Over 20 Years Experience - - - 15.7%
Number of Students per Teacher - n/a - 15.2
TEA Division of Performance Reporting Page 15
TEXAS EDUCATION AGENCYDistrict Name: MANOR ISD Texas Academic Performance Report Total Students: 1,677
Campus Name: MANOR H S 2015-16 Campus Profile Grade Span: 09 - 12Campus Number: 227907001 School Type: High School
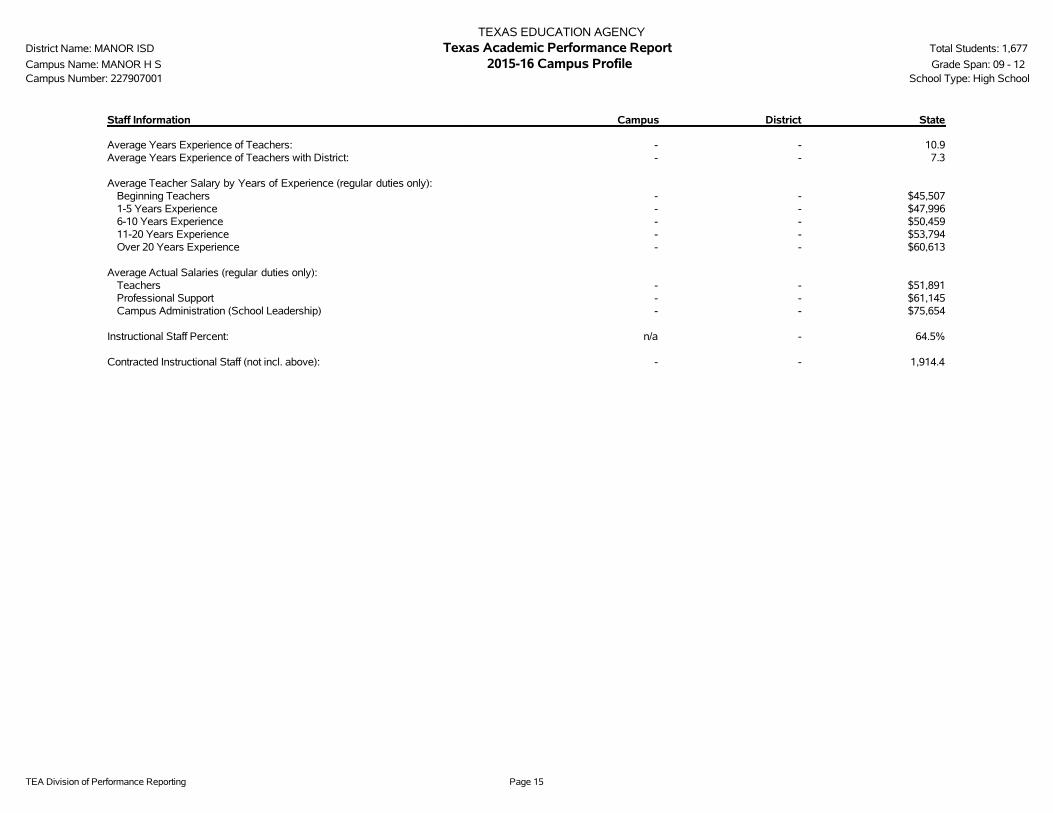
Staff Information Campus District State
Average Years Experience of Teachers: - - 10.9Average Years Experience of Teachers with District: - - 7.3
Average Teacher Salary by Years of Experience (regular duties only):Beginning Teachers - - $45,5071-5 Years Experience - - $47,9966-10 Years Experience - - $50,45911-20 Years Experience - - $53,794Over 20 Years Experience - - $60,613
Average Actual Salaries (regular duties only):Teachers - - $51,891Professional Support - - $61,145Campus Administration (School Leadership) - - $75,654
Instructional Staff Percent: n/a - 64.5%
Contracted Instructional Staff (not incl. above): - - 1,914.4

TEA Division of Performance Reporting Page 16
TEXAS EDUCATION AGENCYDistrict Name: MANOR ISD Texas Academic Performance Report Total Students: 1,677
Campus Name: MANOR H S 2015-16 Campus Profile Grade Span: 09 - 12Campus Number: 227907001 School Type: High School
---------------- Campus ----------------Program Information Count Percent District State
Student Enrollment by Program:Bilingual/ESL Education 261 15.6% 35.7% 18.3%Career & Technical Education 1,492 89.0% 28.7% 24.3%Gifted & Talented Education 83 4.9% 7.3% 7.7%Special Education 182 10.9% 7.8% 8.6%
Teachers by Program (population served):Bilingual/ESL Education - - - 5.9%Career & Technical Education - - - 4.4%Compensatory Education - - - 2.9%Gifted & Talented Education - - - 1.9%Regular Education - - - 72.6%Special Education - - - 8.8%Other - - - 3.4%
Link to: PEIMS Financial Standard Reports/ 2014-2015 Financial Actual Report
' '̂ Indicates that ELL rates at met or exceeded standard and exceeded standard include current and monitored students.'*' Indicates results are masked due to small numbers to protect student confidentiality.'-' Indicates zero observations reported for this group.'n/a' Indicates data reporting is not applicable for this group.'**' Indicates that rates for Reading and Mathematics are based on the cumulative results from the first and second administrations of STAAR.'?' Indicates that the data for this item were statistically improbable, or were reported outside a reasonable range.'##' Indicates that PID Error rate information cannot be reported in 2015-16 due to the transition from PEIMS Edit+ to TSDS.

2015-16 Texas Academic Performance Report
District Name: MANOR ISD
Campus Name: MANOR EXCEL ACADEMY
Campus Number: 227907002
2016 Accountability Rating: Improvement Required

This page intentionally left blank.
TEA Division of Performance Reporting Page 1
TEXAS EDUCATION AGENCYDistrict Name: MANOR ISD Texas Academic Performance Report Total Students: 110
Campus Name: MANOR EXCEL ACADEMY 2015-16 Campus Performance Grade Span: 08 - 12Campus Number: 227907002 School Type: High School
State District CampusAfrican
American Hispanic WhiteAmerican
Indian AsianPacific
Islander
Two orMore
RacesSpecial
EdEcon
Disadv ELL^STAARPercent at Level II Satisfactory Standard or Above
End of Course
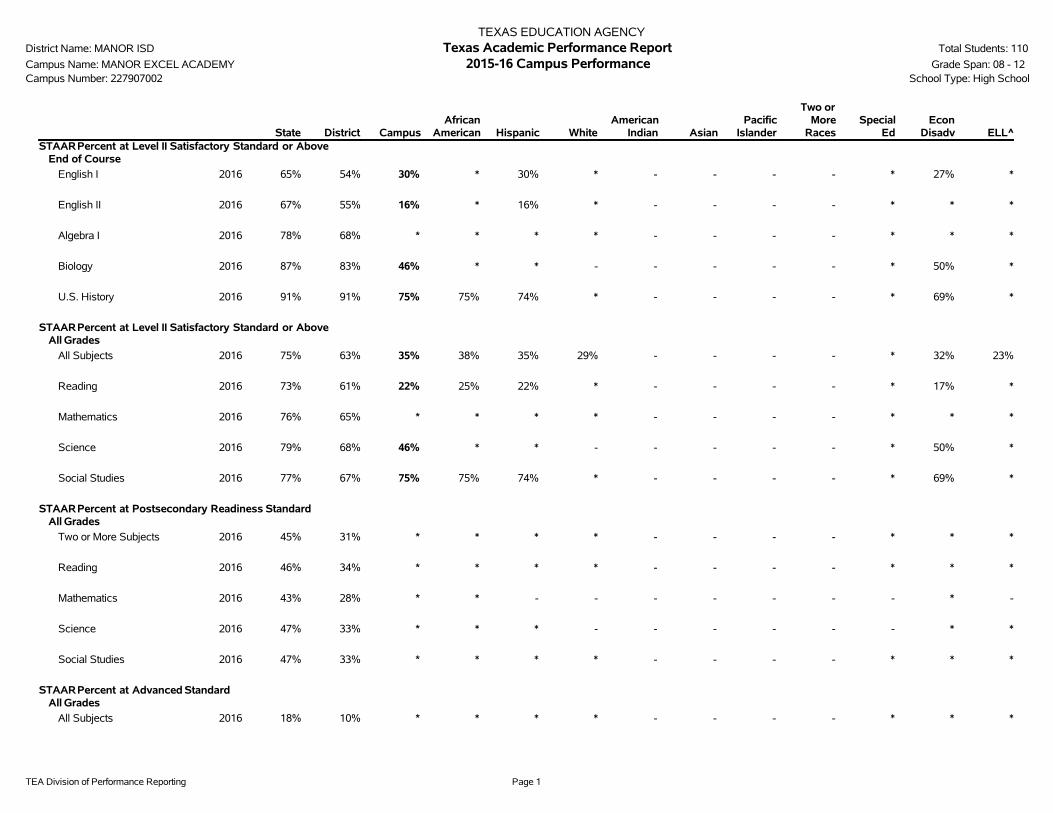
English I 2016 65% 54% 30% * 30% * - - - - * 27% *
English II 2016 67% 55% 16% * 16% * - - - - * * *
Algebra I 2016 78% 68% * * * * - - - - * * *
Biology 2016 87% 83% 46% * * - - - - - * 50% *
U.S. History 2016 91% 91% 75% 75% 74% * - - - - * 69% *
STAARPercent at Level II Satisfactory Standard or AboveAll Grades
All Subjects 2016 75% 63% 35% 38% 35% 29% - - - - * 32% 23%
Reading 2016 73% 61% 22% 25% 22% * - - - - * 17% *
Mathematics 2016 76% 65% * * * * - - - - * * *
Science 2016 79% 68% 46% * * - - - - - * 50% *
Social Studies 2016 77% 67% 75% 75% 74% * - - - - * 69% *
STAARPercent at Postsecondary Readiness StandardAll Grades
Two or More Subjects 2016 45% 31% * * * * - - - - * * *
Reading 2016 46% 34% * * * * - - - - * * *
Mathematics 2016 43% 28% * * - - - - - - - * -
Science 2016 47% 33% * * * - - - - - - * *
Social Studies 2016 47% 33% * * * * - - - - * * *
STAARPercent at Advanced StandardAll Grades
All Subjects 2016 18% 10% * * * * - - - - * * *
TEA Division of Performance Reporting Page 2
TEXAS EDUCATION AGENCYDistrict Name: MANOR ISD Texas Academic Performance Report Total Students: 110
Campus Name: MANOR EXCEL ACADEMY 2015-16 Campus Performance Grade Span: 08 - 12Campus Number: 227907002 School Type: High School
State District CampusAfrican
American Hispanic WhiteAmerican
Indian AsianPacific
Islander
Two orMore
RacesSpecial
EdEcon
Disadv ELL^STAARPercent at Advanced Standard
All Grades
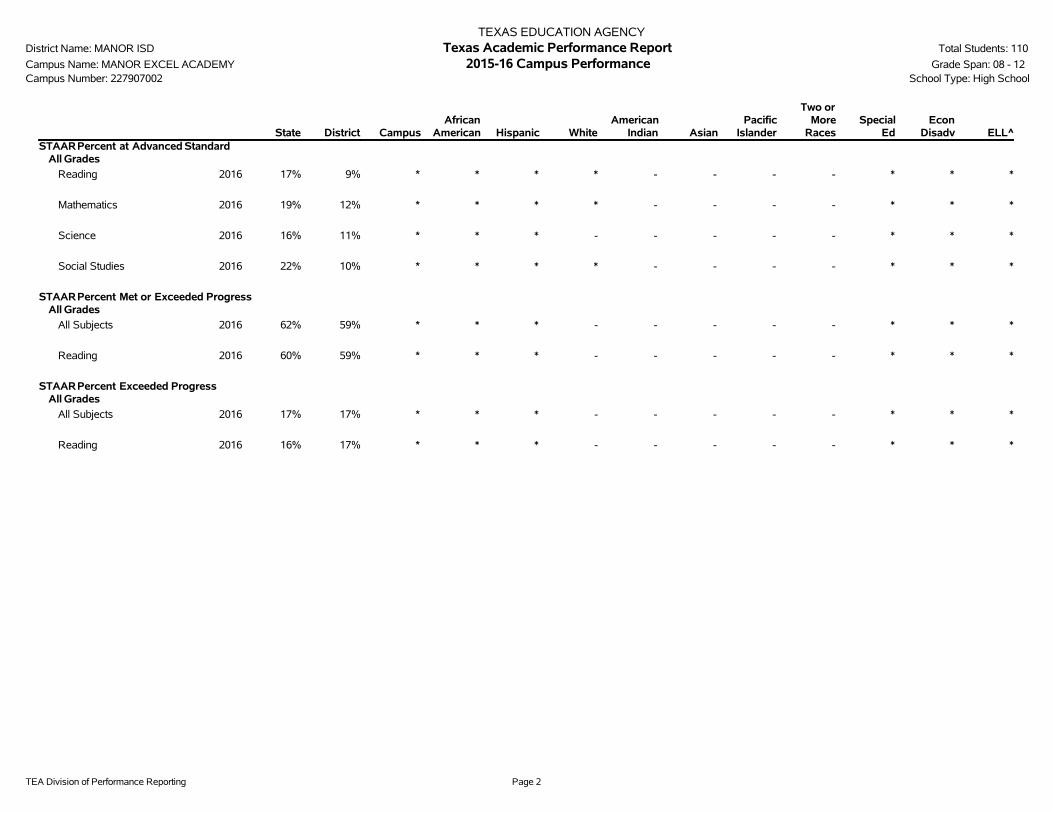
Reading 2016 17% 9% * * * * - - - - * * *
Mathematics 2016 19% 12% * * * * - - - - * * *
Science 2016 16% 11% * * * - - - - - * * *
Social Studies 2016 22% 10% * * * * - - - - * * *
STAARPercent Met or Exceeded ProgressAll Grades
All Subjects 2016 62% 59% * * * - - - - - * * *
Reading 2016 60% 59% * * * - - - - - * * *
STAARPercent Exceeded ProgressAll Grades
All Subjects 2016 17% 17% * * * - - - - - * * *
Reading 2016 16% 17% * * * - - - - - * * *
TEA Division of Performance Reporting Page 3
TEXAS EDUCATION AGENCYDistrict Name: MANOR ISD Texas Academic Performance Report Total Students: 110
Campus Name: MANOR EXCEL ACADEMY 2015-16 Campus Performance Grade Span: 08 - 12Campus Number: 227907002 Bilingual Education/English as a Second Language (Current Year ELL Students)
State District CampusBilingual
EducationBE-TransEarly Exit
BE-TransLate Exit
BE-DualTwo-Way
BE-DualOne-Way ESL
ESLContent
ESLPull-Out
LEP NoServices
LEP WithServices
TotalELL
STAARPercent at Level II Satisfactory Standard or AboveAll Grades
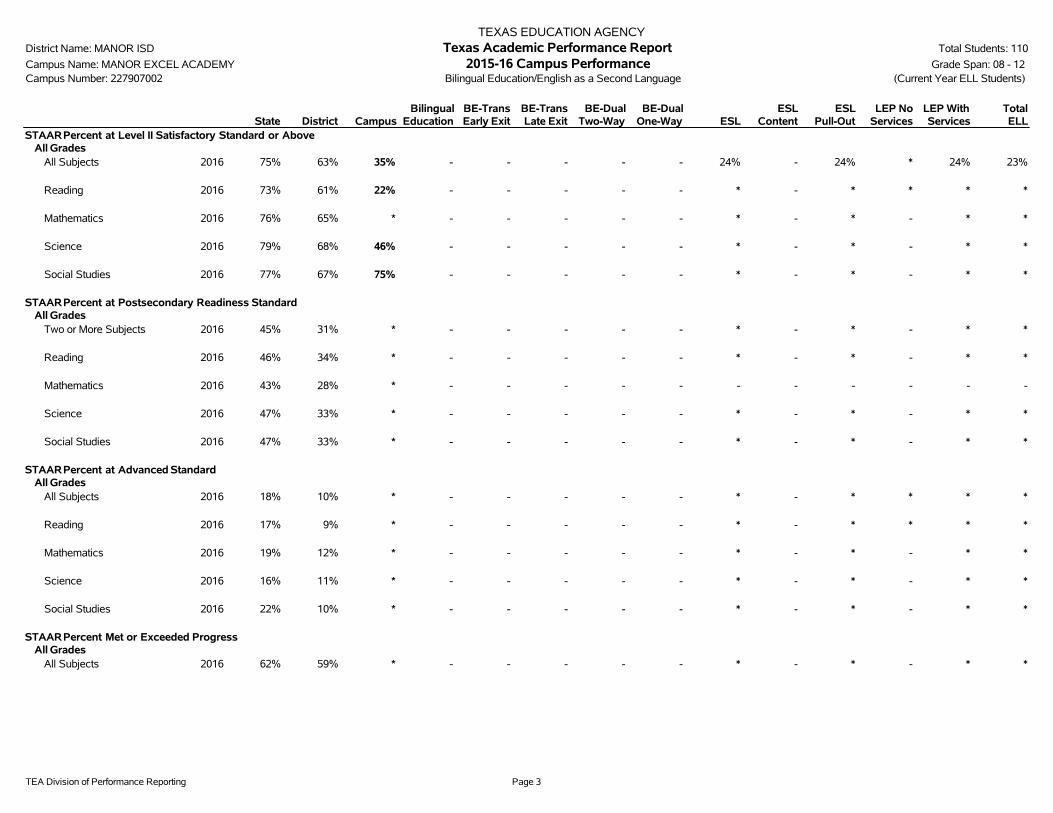
All Subjects 2016 75% 63% 35% - - - - - 24% - 24% * 24% 23%
Reading 2016 73% 61% 22% - - - - - * - * * * *
Mathematics 2016 76% 65% * - - - - - * - * - * *
Science 2016 79% 68% 46% - - - - - * - * - * *
Social Studies 2016 77% 67% 75% - - - - - * - * - * *
STAARPercent at Postsecondary Readiness StandardAll Grades
Two or More Subjects 2016 45% 31% * - - - - - * - * - * *
Reading 2016 46% 34% * - - - - - * - * - * *
Mathematics 2016 43% 28% * - - - - - - - - - - -
Science 2016 47% 33% * - - - - - * - * - * *
Social Studies 2016 47% 33% * - - - - - * - * - * *
STAARPercent at Advanced StandardAll Grades
All Subjects 2016 18% 10% * - - - - - * - * * * *
Reading 2016 17% 9% * - - - - - * - * * * *
Mathematics 2016 19% 12% * - - - - - * - * - * *
Science 2016 16% 11% * - - - - - * - * - * *
Social Studies 2016 22% 10% * - - - - - * - * - * *
STAARPercent Met or Exceeded ProgressAll Grades
All Subjects 2016 62% 59% * - - - - - * - * - * *
TEA Division of Performance Reporting Page 4
TEXAS EDUCATION AGENCYDistrict Name: MANOR ISD Texas Academic Performance Report Total Students: 110
Campus Name: MANOR EXCEL ACADEMY 2015-16 Campus Performance Grade Span: 08 - 12Campus Number: 227907002 Bilingual Education/English as a Second Language (Current Year ELL Students)
State District CampusBilingual
EducationBE-TransEarly Exit
BE-TransLate Exit
BE-DualTwo-Way
BE-DualOne-Way ESL
ESLContent
ESLPull-Out
LEP NoServices
LEP WithServices
TotalELL
STAARPercent Met or Exceeded ProgressAll Grades
Reading 2016 60% 59% * - - - - - * - * - * *
STAARPercent Exceeded ProgressAll Grades
All Subjects 2016 17% 17% * - - - - - * - * - * *
Reading 2016 16% 17% * - - - - - * - * - * *

TEA Division of Performance Reporting Page 5
TEXAS EDUCATION AGENCYDistrict Name: MANOR ISD Texas Academic Performance Report Total Students: 110
Campus Name: MANOR EXCEL ACADEMY 2015-16 Campus Participation Grade Span: 08 - 12Campus Number: 227907002 School Type: High School
State District CampusAfrican
American Hispanic WhiteAmerican
Indian AsianPacific
Islander
Two orMoreRaces
SpecialEd
EconDisadv ELL
2016 STAARParticipation(All Grades)
All TestsTest Participant 99% 99% 90% 88% 90% 96% - - - * 91% 90% 88%
Included in Accountability 94% 92% 67% 61% 71% 74% - - - * 52% 69% 69%Not Included in Accountability
Mobile 4% 6% 23% 27% 20% 17% - - - * 39% 20% 18%Other Exclusions 1% 1% 0% 0% 0% 4% - - - * 0% 1% 2%
Not Tested 1% 1% 10% 12% 10% 4% - - - * 9% 10% 12%Absent 1% 1% 10% 12% 10% 4% - - - * 9% 10% 12%Other 0% 0% 0% 0% 0% 0% - - - * 0% 0% 0%
TEA Division of Performance Reporting Page 6
TEXAS EDUCATION AGENCYDistrict Name: MANOR ISD Texas Academic Performance Report Total Students: 110
Campus Name: MANOR EXCEL ACADEMY 2015-16 Campus Attendance and Postsecondary Readiness Grade Span: 08 - 12Campus Number: 227907002 School Type: High School
State District CampusAfrican
American Hispanic WhiteAmerican
Indian AsianPacific
IslanderTwo or
More RacesSpecial
EdEcon
Disadv ELL
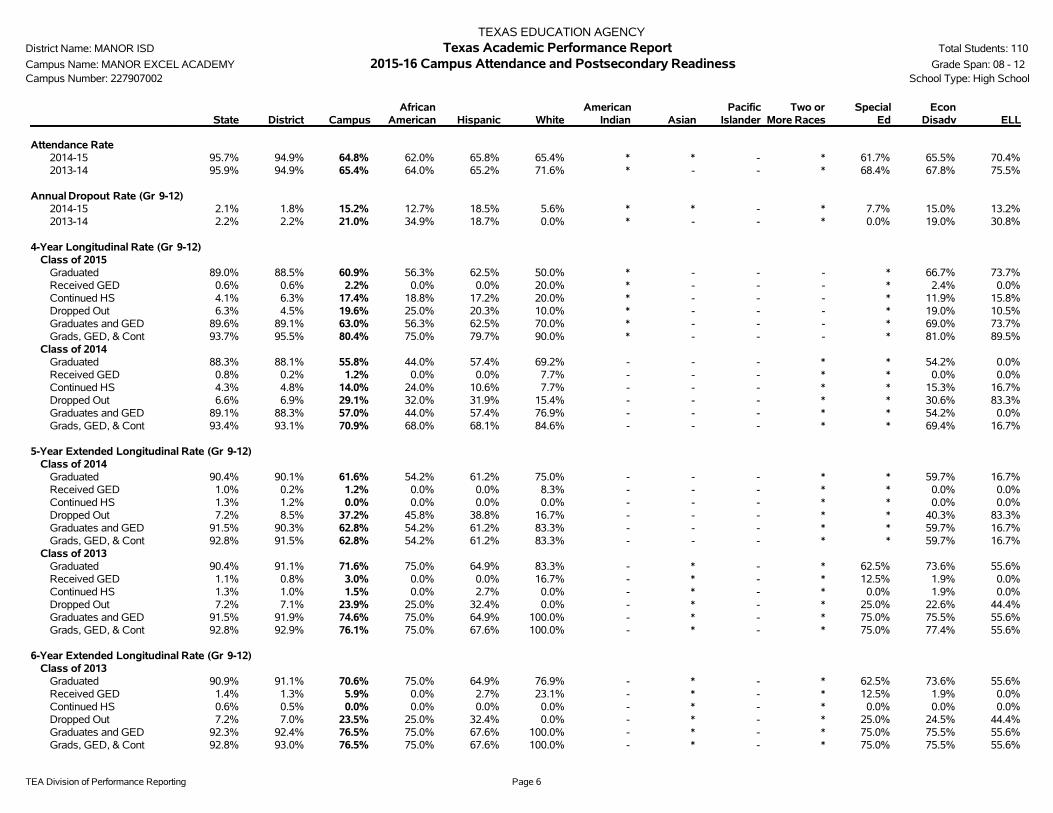
Attendance Rate2014-15 95.7% 94.9% 64.8% 62.0% 65.8% 65.4% * * - * 61.7% 65.5% 70.4%2013-14 95.9% 94.9% 65.4% 64.0% 65.2% 71.6% * - - * 68.4% 67.8% 75.5%
Annual Dropout Rate (Gr 9-12)2014-15 2.1% 1.8% 15.2% 12.7% 18.5% 5.6% * * - * 7.7% 15.0% 13.2%2013-14 2.2% 2.2% 21.0% 34.9% 18.7% 0.0% * - - * 0.0% 19.0% 30.8%
4-Year Longitudinal Rate (Gr 9-12)Class of 2015
Graduated 89.0% 88.5% 60.9% 56.3% 62.5% 50.0% * - - - * 66.7% 73.7%Received GED 0.6% 0.6% 2.2% 0.0% 0.0% 20.0% * - - - * 2.4% 0.0%Continued HS 4.1% 6.3% 17.4% 18.8% 17.2% 20.0% * - - - * 11.9% 15.8%Dropped Out 6.3% 4.5% 19.6% 25.0% 20.3% 10.0% * - - - * 19.0% 10.5%Graduates and GED 89.6% 89.1% 63.0% 56.3% 62.5% 70.0% * - - - * 69.0% 73.7%Grads, GED, & Cont 93.7% 95.5% 80.4% 75.0% 79.7% 90.0% * - - - * 81.0% 89.5%
Class of 2014Graduated 88.3% 88.1% 55.8% 44.0% 57.4% 69.2% - - - * * 54.2% 0.0%Received GED 0.8% 0.2% 1.2% 0.0% 0.0% 7.7% - - - * * 0.0% 0.0%Continued HS 4.3% 4.8% 14.0% 24.0% 10.6% 7.7% - - - * * 15.3% 16.7%Dropped Out 6.6% 6.9% 29.1% 32.0% 31.9% 15.4% - - - * * 30.6% 83.3%Graduates and GED 89.1% 88.3% 57.0% 44.0% 57.4% 76.9% - - - * * 54.2% 0.0%Grads, GED, & Cont 93.4% 93.1% 70.9% 68.0% 68.1% 84.6% - - - * * 69.4% 16.7%
5-Year Extended Longitudinal Rate (Gr 9-12)Class of 2014
Graduated 90.4% 90.1% 61.6% 54.2% 61.2% 75.0% - - - * * 59.7% 16.7%Received GED 1.0% 0.2% 1.2% 0.0% 0.0% 8.3% - - - * * 0.0% 0.0%Continued HS 1.3% 1.2% 0.0% 0.0% 0.0% 0.0% - - - * * 0.0% 0.0%Dropped Out 7.2% 8.5% 37.2% 45.8% 38.8% 16.7% - - - * * 40.3% 83.3%Graduates and GED 91.5% 90.3% 62.8% 54.2% 61.2% 83.3% - - - * * 59.7% 16.7%Grads, GED, & Cont 92.8% 91.5% 62.8% 54.2% 61.2% 83.3% - - - * * 59.7% 16.7%
Class of 2013Graduated 90.4% 91.1% 71.6% 75.0% 64.9% 83.3% - * - * 62.5% 73.6% 55.6%Received GED 1.1% 0.8% 3.0% 0.0% 0.0% 16.7% - * - * 12.5% 1.9% 0.0%Continued HS 1.3% 1.0% 1.5% 0.0% 2.7% 0.0% - * - * 0.0% 1.9% 0.0%Dropped Out 7.2% 7.1% 23.9% 25.0% 32.4% 0.0% - * - * 25.0% 22.6% 44.4%Graduates and GED 91.5% 91.9% 74.6% 75.0% 64.9% 100.0% - * - * 75.0% 75.5% 55.6%Grads, GED, & Cont 92.8% 92.9% 76.1% 75.0% 67.6% 100.0% - * - * 75.0% 77.4% 55.6%
6-Year Extended Longitudinal Rate (Gr 9-12)Class of 2013
Graduated 90.9% 91.1% 70.6% 75.0% 64.9% 76.9% - * - * 62.5% 73.6% 55.6%Received GED 1.4% 1.3% 5.9% 0.0% 2.7% 23.1% - * - * 12.5% 1.9% 0.0%Continued HS 0.6% 0.5% 0.0% 0.0% 0.0% 0.0% - * - * 0.0% 0.0% 0.0%Dropped Out 7.2% 7.0% 23.5% 25.0% 32.4% 0.0% - * - * 25.0% 24.5% 44.4%Graduates and GED 92.3% 92.4% 76.5% 75.0% 67.6% 100.0% - * - * 75.0% 75.5% 55.6%Grads, GED, & Cont 92.8% 93.0% 76.5% 75.0% 67.6% 100.0% - * - * 75.0% 75.5% 55.6%
TEA Division of Performance Reporting Page 7
TEXAS EDUCATION AGENCYDistrict Name: MANOR ISD Texas Academic Performance Report Total Students: 110
Campus Name: MANOR EXCEL ACADEMY 2015-16 Campus Attendance and Postsecondary Readiness Grade Span: 08 - 12Campus Number: 227907002 School Type: High School
State District CampusAfrican
American Hispanic WhiteAmerican
Indian AsianPacific
IslanderTwo or
More RacesSpecial
EdEcon
Disadv ELL
6-Year Extended Longitudinal Rate (Gr 9-12)Class of 2012
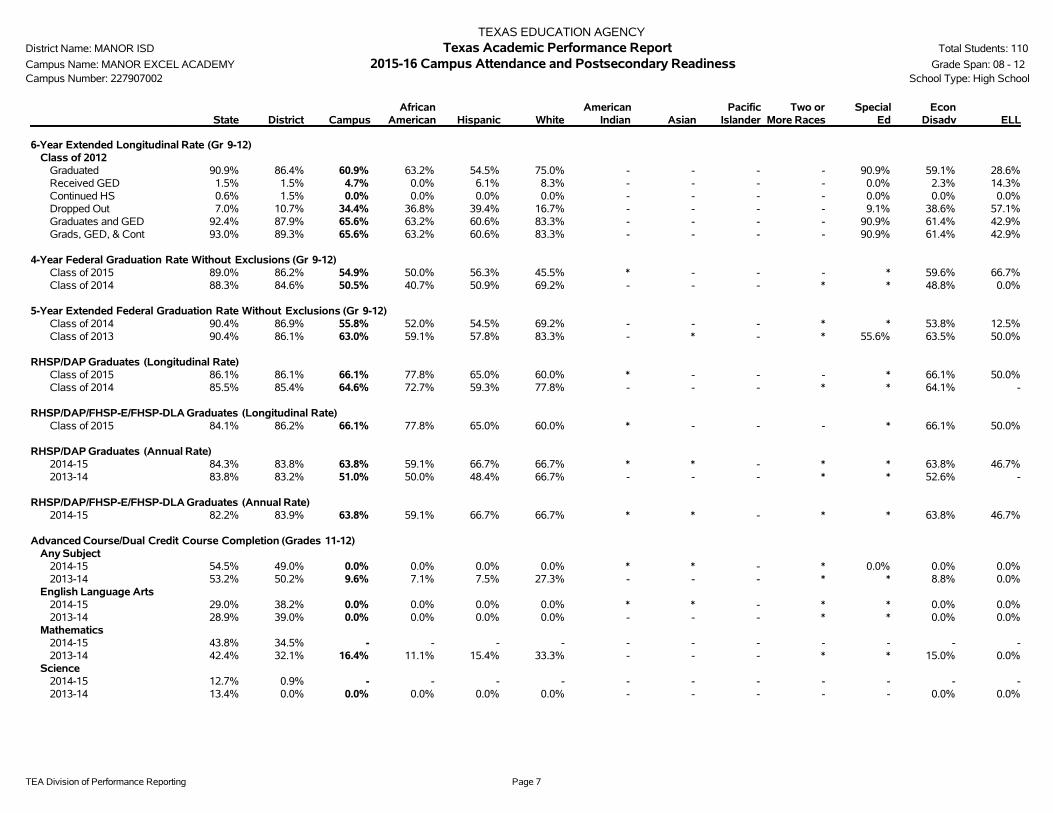
Graduated 90.9% 86.4% 60.9% 63.2% 54.5% 75.0% - - - - 90.9% 59.1% 28.6%Received GED 1.5% 1.5% 4.7% 0.0% 6.1% 8.3% - - - - 0.0% 2.3% 14.3%Continued HS 0.6% 1.5% 0.0% 0.0% 0.0% 0.0% - - - - 0.0% 0.0% 0.0%Dropped Out 7.0% 10.7% 34.4% 36.8% 39.4% 16.7% - - - - 9.1% 38.6% 57.1%Graduates and GED 92.4% 87.9% 65.6% 63.2% 60.6% 83.3% - - - - 90.9% 61.4% 42.9%Grads, GED, & Cont 93.0% 89.3% 65.6% 63.2% 60.6% 83.3% - - - - 90.9% 61.4% 42.9%
4-Year Federal Graduation Rate Without Exclusions (Gr 9-12)Class of 2015 89.0% 86.2% 54.9% 50.0% 56.3% 45.5% * - - - * 59.6% 66.7%Class of 2014 88.3% 84.6% 50.5% 40.7% 50.9% 69.2% - - - * * 48.8% 0.0%
5-Year Extended Federal Graduation Rate Without Exclusions (Gr 9-12)Class of 2014 90.4% 86.9% 55.8% 52.0% 54.5% 69.2% - - - * * 53.8% 12.5%Class of 2013 90.4% 86.1% 63.0% 59.1% 57.8% 83.3% - * - * 55.6% 63.5% 50.0%
RHSP/DAP Graduates (Longitudinal Rate)Class of 2015 86.1% 86.1% 66.1% 77.8% 65.0% 60.0% * - - - * 66.1% 50.0%Class of 2014 85.5% 85.4% 64.6% 72.7% 59.3% 77.8% - - - * * 64.1% -
RHSP/DAP/FHSP-E/FHSP-DLA Graduates (Longitudinal Rate)Class of 2015 84.1% 86.2% 66.1% 77.8% 65.0% 60.0% * - - - * 66.1% 50.0%
RHSP/DAP Graduates (Annual Rate)2014-15 84.3% 83.8% 63.8% 59.1% 66.7% 66.7% * * - * * 63.8% 46.7%2013-14 83.8% 83.2% 51.0% 50.0% 48.4% 66.7% - - - * * 52.6% -
RHSP/DAP/FHSP-E/FHSP-DLA Graduates (Annual Rate)2014-15 82.2% 83.9% 63.8% 59.1% 66.7% 66.7% * * - * * 63.8% 46.7%
Advanced Course/Dual Credit Course Completion (Grades 11-12)Any Subject
2014-15 54.5% 49.0% 0.0% 0.0% 0.0% 0.0% * * - * 0.0% 0.0% 0.0%2013-14 53.2% 50.2% 9.6% 7.1% 7.5% 27.3% - - - * * 8.8% 0.0%
English Language Arts2014-15 29.0% 38.2% 0.0% 0.0% 0.0% 0.0% * * - * * 0.0% 0.0%2013-14 28.9% 39.0% 0.0% 0.0% 0.0% 0.0% - - - * * 0.0% 0.0%
Mathematics2014-15 43.8% 34.5% - - - - - - - - - - -2013-14 42.4% 32.1% 16.4% 11.1% 15.4% 33.3% - - - * * 15.0% 0.0%
Science2014-15 12.7% 0.9% - - - - - - - - - - -2013-14 13.4% 0.0% 0.0% 0.0% 0.0% 0.0% - - - - - 0.0% 0.0%
TEA Division of Performance Reporting Page 8
TEXAS EDUCATION AGENCYDistrict Name: MANOR ISD Texas Academic Performance Report Total Students: 110
Campus Name: MANOR EXCEL ACADEMY 2015-16 Campus Attendance and Postsecondary Readiness Grade Span: 08 - 12Campus Number: 227907002 School Type: High School
State District CampusAfrican
American Hispanic WhiteAmerican
Indian AsianPacific
IslanderTwo or
More RacesSpecial
EdEcon
Disadv ELL
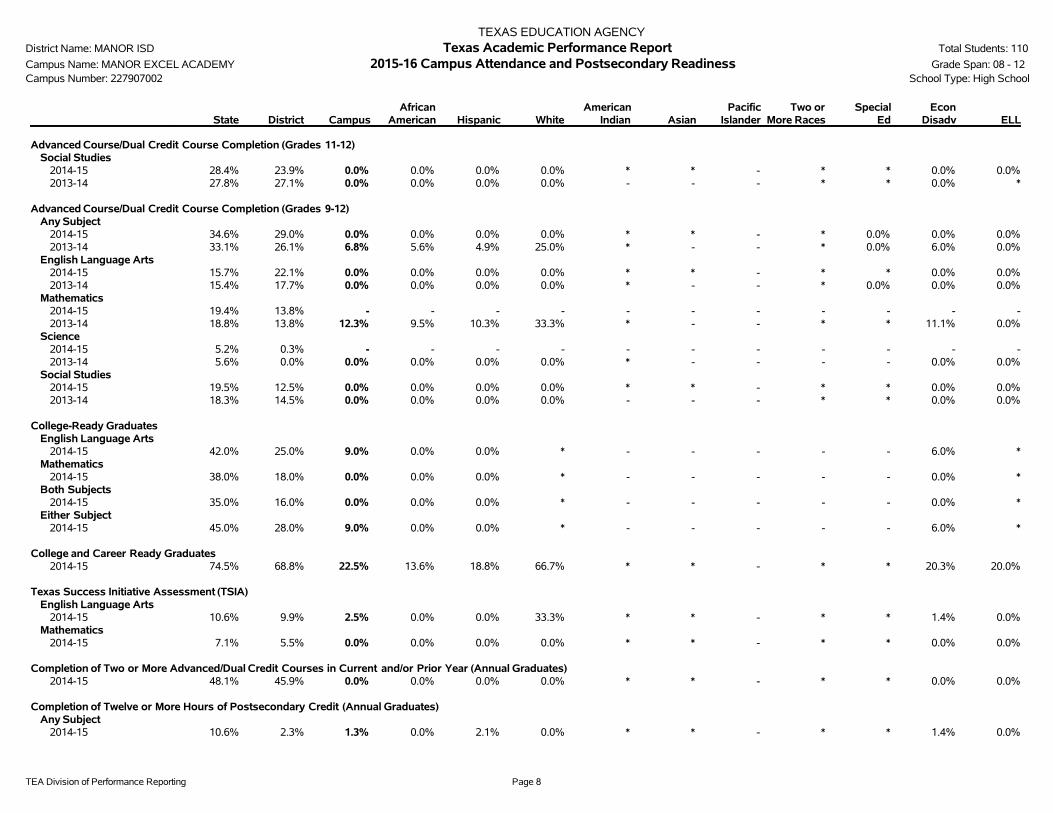
Advanced Course/Dual Credit Course Completion (Grades 11-12)Social Studies
2014-15 28.4% 23.9% 0.0% 0.0% 0.0% 0.0% * * - * * 0.0% 0.0%2013-14 27.8% 27.1% 0.0% 0.0% 0.0% 0.0% - - - * * 0.0% *
Advanced Course/Dual Credit Course Completion (Grades 9-12)Any Subject
2014-15 34.6% 29.0% 0.0% 0.0% 0.0% 0.0% * * - * 0.0% 0.0% 0.0%2013-14 33.1% 26.1% 6.8% 5.6% 4.9% 25.0% * - - * 0.0% 6.0% 0.0%
English Language Arts2014-15 15.7% 22.1% 0.0% 0.0% 0.0% 0.0% * * - * * 0.0% 0.0%2013-14 15.4% 17.7% 0.0% 0.0% 0.0% 0.0% * - - * 0.0% 0.0% 0.0%
Mathematics2014-15 19.4% 13.8% - - - - - - - - - - -2013-14 18.8% 13.8% 12.3% 9.5% 10.3% 33.3% * - - * * 11.1% 0.0%
Science2014-15 5.2% 0.3% - - - - - - - - - - -2013-14 5.6% 0.0% 0.0% 0.0% 0.0% 0.0% * - - - - 0.0% 0.0%
Social Studies2014-15 19.5% 12.5% 0.0% 0.0% 0.0% 0.0% * * - * * 0.0% 0.0%2013-14 18.3% 14.5% 0.0% 0.0% 0.0% 0.0% - - - * * 0.0% 0.0%
College-Ready GraduatesEnglish Language Arts
2014-15 42.0% 25.0% 9.0% 0.0% 0.0% * - - - - - 6.0% *Mathematics
2014-15 38.0% 18.0% 0.0% 0.0% 0.0% * - - - - - 0.0% *Both Subjects
2014-15 35.0% 16.0% 0.0% 0.0% 0.0% * - - - - - 0.0% *Either Subject
2014-15 45.0% 28.0% 9.0% 0.0% 0.0% * - - - - - 6.0% *
College and Career Ready Graduates2014-15 74.5% 68.8% 22.5% 13.6% 18.8% 66.7% * * - * * 20.3% 20.0%
Texas Success Initiative Assessment (TSIA)English Language Arts
2014-15 10.6% 9.9% 2.5% 0.0% 0.0% 33.3% * * - * * 1.4% 0.0%Mathematics
2014-15 7.1% 5.5% 0.0% 0.0% 0.0% 0.0% * * - * * 0.0% 0.0%
Completion of Two or More Advanced/Dual Credit Courses in Current and/or Prior Year (Annual Graduates)2014-15 48.1% 45.9% 0.0% 0.0% 0.0% 0.0% * * - * * 0.0% 0.0%
Completion of Twelve or More Hours of Postsecondary Credit (Annual Graduates)Any Subject
2014-15 10.6% 2.3% 1.3% 0.0% 2.1% 0.0% * * - * * 1.4% 0.0%
TEA Division of Performance Reporting Page 9
TEXAS EDUCATION AGENCYDistrict Name: MANOR ISD Texas Academic Performance Report Total Students: 110
Campus Name: MANOR EXCEL ACADEMY 2015-16 Campus Attendance and Postsecondary Readiness Grade Span: 08 - 12Campus Number: 227907002 School Type: High School
State District CampusAfrican
American Hispanic WhiteAmerican
Indian AsianPacific
IslanderTwo or
More RacesSpecial
EdEcon
Disadv ELL
AP/IB Course Completion (Annual Graduates)2014-15 43.4% 44.4% 12.5% 0.0% 16.7% 16.7% * * - * * 10.1% 6.7%
CTE Coherent Sequence (Annual Graduates)2014-15 46.6% 47.2% 22.5% 13.6% 18.8% 66.7% * * - * * 20.3% 20.0%2013-14 46.4% 57.7% 26.5% 8.2% 14.3% 4.1% - - - * * 22.4% -
AP/IB Results (Participation)All Subjects
2015 24.9% 22.1% 0.0% 0.0% 0.0% 0.0% * * - - n/a 0.0% n/a2014 23.5% 26.6% 0.0% 0.0% 0.0% 0.0% - - - * n/a 0.0% n/a
English Language Arts2015 15.1% 15.3% 0.0% 0.0% 0.0% 0.0% * * - - n/a 0.0% n/a2014 15.0% 18.0% 0.0% 0.0% 0.0% 0.0% - - - * n/a 0.0% n/a
Mathematics2015 6.8% 4.0% 0.0% 0.0% 0.0% 0.0% * * - - n/a 0.0% n/a2014 6.5% 5.3% 0.0% 0.0% 0.0% 0.0% - - - * n/a 0.0% n/a
Science2015 10.2% 0.4% 0.0% 0.0% 0.0% 0.0% * * - - n/a 0.0% n/a2014 6.9% 0.7% 0.0% 0.0% 0.0% 0.0% - - - * n/a 0.0% n/a
Social Studies2015 14.4% 10.3% 0.0% 0.0% 0.0% 0.0% * * - - n/a 0.0% n/a2014 13.8% 12.9% 0.0% 0.0% 0.0% 0.0% - - - * n/a 0.0% n/a
SAT/ACT ResultsTested
Class of 2015 68.3% 61.2% 16.3% 13.6% 14.6% 50.0% * * - * n/a 16.7% n/aClass of 2014 66.3% 73.2% 4.1% 10.0% 3.2% 0.0% - - - * n/a 5.3% n/a
At/Above CriterionClass of 2015 24.3% 6.8% 0.0% * 0.0% * - - - - n/a 0.0% n/aClass of 2014 25.1% 7.3% * * * - - - - - n/a * n/a
Average SAT ScoreAll Subjects
Class of 2015 1394 1233 1012 * * * - - - - n/a 1012 n/aClass of 2014 1417 1258 * * * - - - - - n/a * n/a
English Language Arts and WritingClass of 2015 912 810 680 * * * - - - - n/a 680 n/aClass of 2014 925 829 * * * - - - - - n/a * n/a
MathematicsClass of 2015 482 423 332 * * * - - - - n/a 332 n/aClass of 2014 491 429 * * * - - - - - n/a * n/a
Average ACT ScoreAll Subjects
Class of 2015 20.6 16.5 13.9 * 13.0 * - - - - n/a 13.9 n/aClass of 2014 20.6 17.5 - - - - - - - - n/a - n/a
TEA Division of Performance Reporting Page 10
TEXAS EDUCATION AGENCYDistrict Name: MANOR ISD Texas Academic Performance Report Total Students: 110
Campus Name: MANOR EXCEL ACADEMY 2015-16 Campus Attendance and Postsecondary Readiness Grade Span: 08 - 12Campus Number: 227907002 School Type: High School
State District CampusAfrican
American Hispanic WhiteAmerican
Indian AsianPacific
IslanderTwo or
More RacesSpecial
EdEcon
Disadv ELL
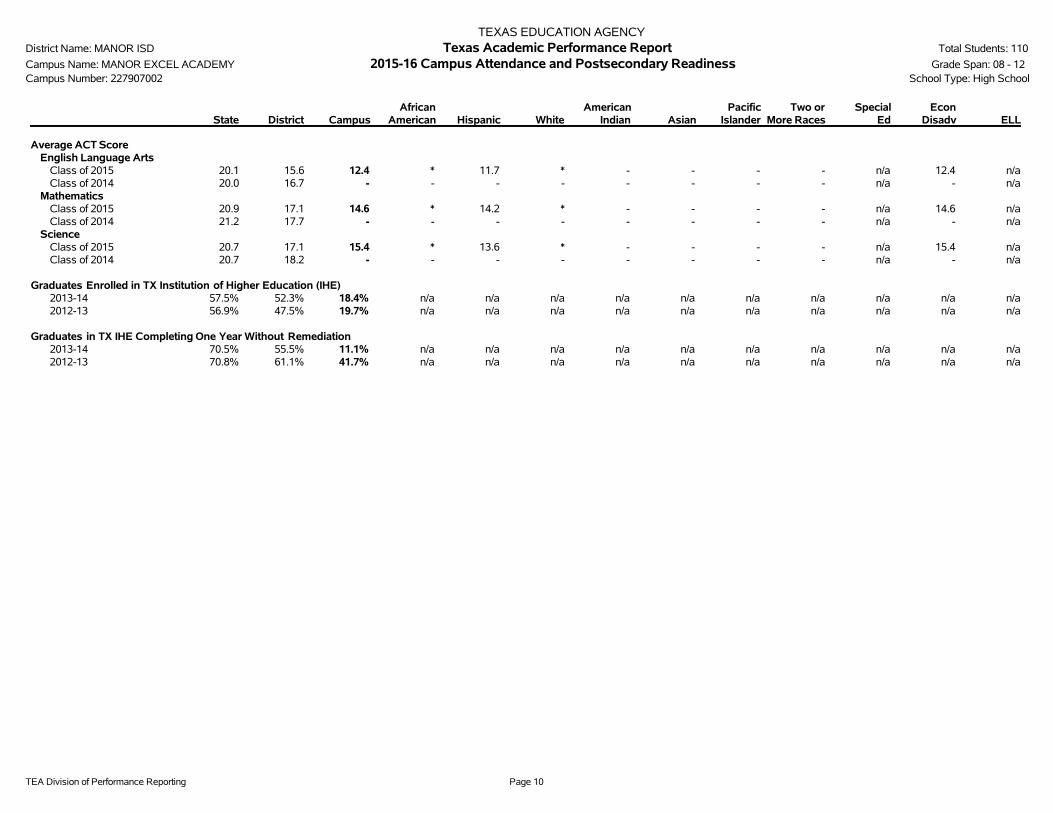
Average ACT ScoreEnglish Language Arts
Class of 2015 20.1 15.6 12.4 * 11.7 * - - - - n/a 12.4 n/aClass of 2014 20.0 16.7 - - - - - - - - n/a - n/a
MathematicsClass of 2015 20.9 17.1 14.6 * 14.2 * - - - - n/a 14.6 n/aClass of 2014 21.2 17.7 - - - - - - - - n/a - n/a
ScienceClass of 2015 20.7 17.1 15.4 * 13.6 * - - - - n/a 15.4 n/aClass of 2014 20.7 18.2 - - - - - - - - n/a - n/a
Graduates Enrolled in TX Institution of Higher Education (IHE)2013-14 57.5% 52.3% 18.4% n/a n/a n/a n/a n/a n/a n/a n/a n/a n/a2012-13 56.9% 47.5% 19.7% n/a n/a n/a n/a n/a n/a n/a n/a n/a n/a
Graduates in TX IHE Completing One Year Without Remediation2013-14 70.5% 55.5% 11.1% n/a n/a n/a n/a n/a n/a n/a n/a n/a n/a2012-13 70.8% 61.1% 41.7% n/a n/a n/a n/a n/a n/a n/a n/a n/a n/a
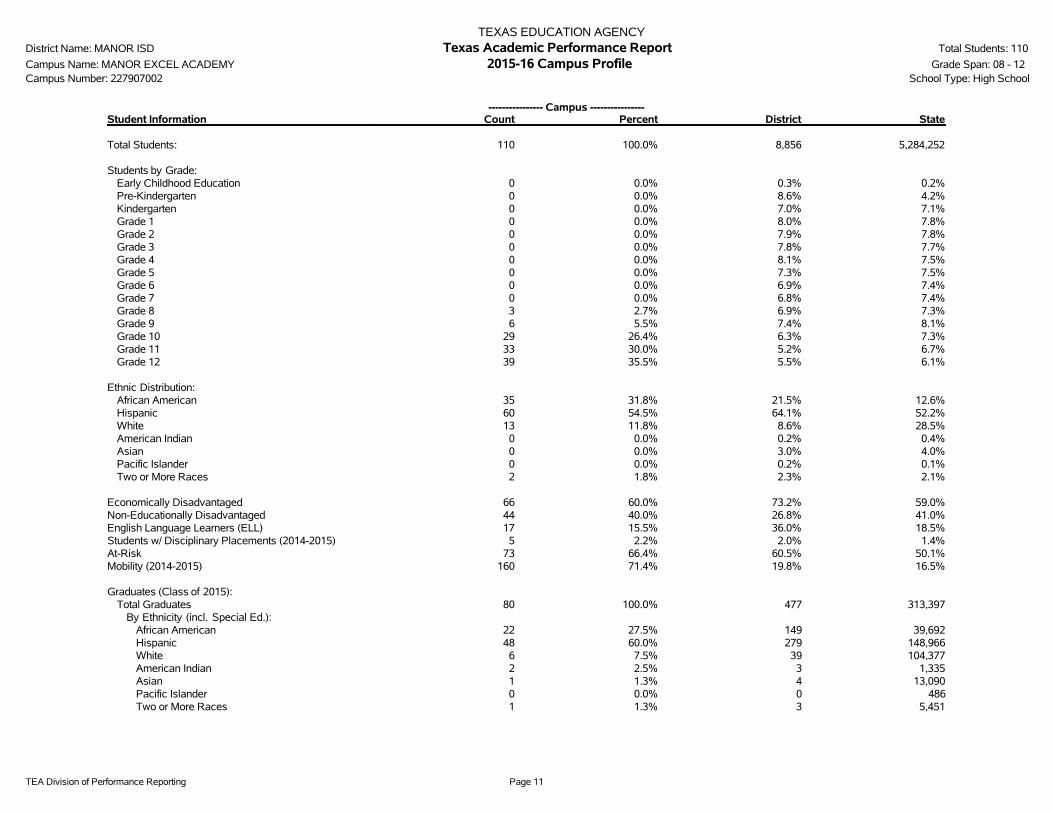
TEA Division of Performance Reporting Page 11
TEXAS EDUCATION AGENCYDistrict Name: MANOR ISD Texas Academic Performance Report Total Students: 110
Campus Name: MANOR EXCEL ACADEMY 2015-16 Campus Profile Grade Span: 08 - 12Campus Number: 227907002 School Type: High School
---------------- Campus ----------------Student Information Count Percent District State
Total Students: 110 100.0% 8,856 5,284,252
Students by Grade:Early Childhood Education 0 0.0% 0.3% 0.2%Pre-Kindergarten 0 0.0% 8.6% 4.2%Kindergarten 0 0.0% 7.0% 7.1%Grade 1 0 0.0% 8.0% 7.8%Grade 2 0 0.0% 7.9% 7.8%Grade 3 0 0.0% 7.8% 7.7%Grade 4 0 0.0% 8.1% 7.5%Grade 5 0 0.0% 7.3% 7.5%Grade 6 0 0.0% 6.9% 7.4%Grade 7 0 0.0% 6.8% 7.4%Grade 8 3 2.7% 6.9% 7.3%Grade 9 6 5.5% 7.4% 8.1%Grade 10 29 26.4% 6.3% 7.3%Grade 11 33 30.0% 5.2% 6.7%Grade 12 39 35.5% 5.5% 6.1%
Ethnic Distribution:African American 35 31.8% 21.5% 12.6%Hispanic 60 54.5% 64.1% 52.2%White 13 11.8% 8.6% 28.5%American Indian 0 0.0% 0.2% 0.4%Asian 0 0.0% 3.0% 4.0%Pacific Islander 0 0.0% 0.2% 0.1%Two or More Races 2 1.8% 2.3% 2.1%
Economically Disadvantaged 66 60.0% 73.2% 59.0%Non-Educationally Disadvantaged 44 40.0% 26.8% 41.0%English Language Learners (ELL) 17 15.5% 36.0% 18.5%Students w/ Disciplinary Placements (2014-2015) 5 2.2% 2.0% 1.4%At-Risk 73 66.4% 60.5% 50.1%Mobility (2014-2015) 160 71.4% 19.8% 16.5%
Graduates (Class of 2015):Total Graduates 80 100.0% 477 313,397
By Ethnicity (incl. Special Ed.):African American 22 27.5% 149 39,692Hispanic 48 60.0% 279 148,966White 6 7.5% 39 104,377American Indian 2 2.5% 3 1,335Asian 1 1.3% 4 13,090Pacific Islander 0 0.0% 0 486Two or More Races 1 1.3% 3 5,451
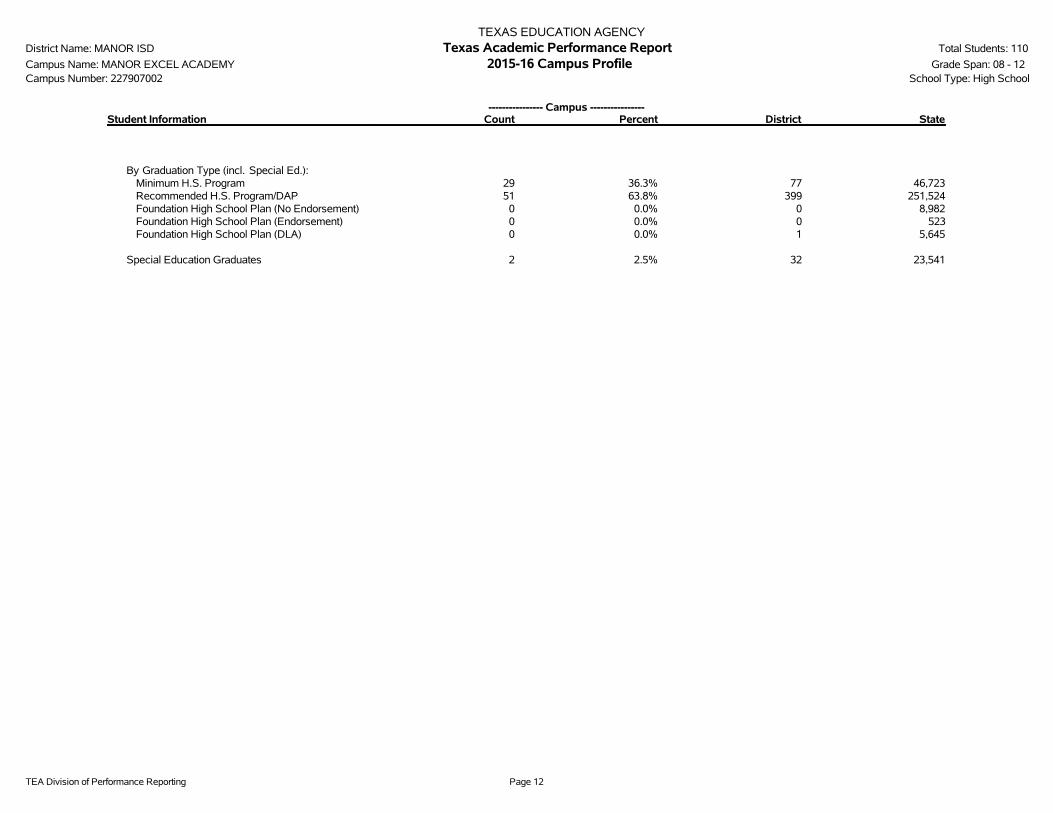
TEA Division of Performance Reporting Page 12
TEXAS EDUCATION AGENCYDistrict Name: MANOR ISD Texas Academic Performance Report Total Students: 110
Campus Name: MANOR EXCEL ACADEMY 2015-16 Campus Profile Grade Span: 08 - 12Campus Number: 227907002 School Type: High School
---------------- Campus ----------------Student Information Count Percent District State
By Graduation Type (incl. Special Ed.):Minimum H.S. Program 29 36.3% 77 46,723Recommended H.S. Program/DAP 51 63.8% 399 251,524Foundation High School Plan (No Endorsement) 0 0.0% 0 8,982Foundation High School Plan (Endorsement) 0 0.0% 0 523Foundation High School Plan (DLA) 0 0.0% 1 5,645
Special Education Graduates 2 2.5% 32 23,541

TEA Division of Performance Reporting Page 13
TEXAS EDUCATION AGENCYDistrict Name: MANOR ISD Texas Academic Performance Report Total Students: 110
Campus Name: MANOR EXCEL ACADEMY 2015-16 Campus Profile Grade Span: 08 - 12Campus Number: 227907002 School Type: High School
Class Size Information Campus District State
Class Size Averages by Grade and Subject (Derived from teacher responsibility records):
Elementary:Kindergarten - - 18.9Grade 1 - - 19.1Grade 2 - - 19.1Grade 3 - - 19.1Grade 4 - - 19.0Grade 5 - - 20.8Grade 6 - - 20.4
Secondary:English/Language Arts - - 17.1Foreign Languages - - 19.1Mathematics - - 18.1Science - - 19.1Social Studies - - 19.5
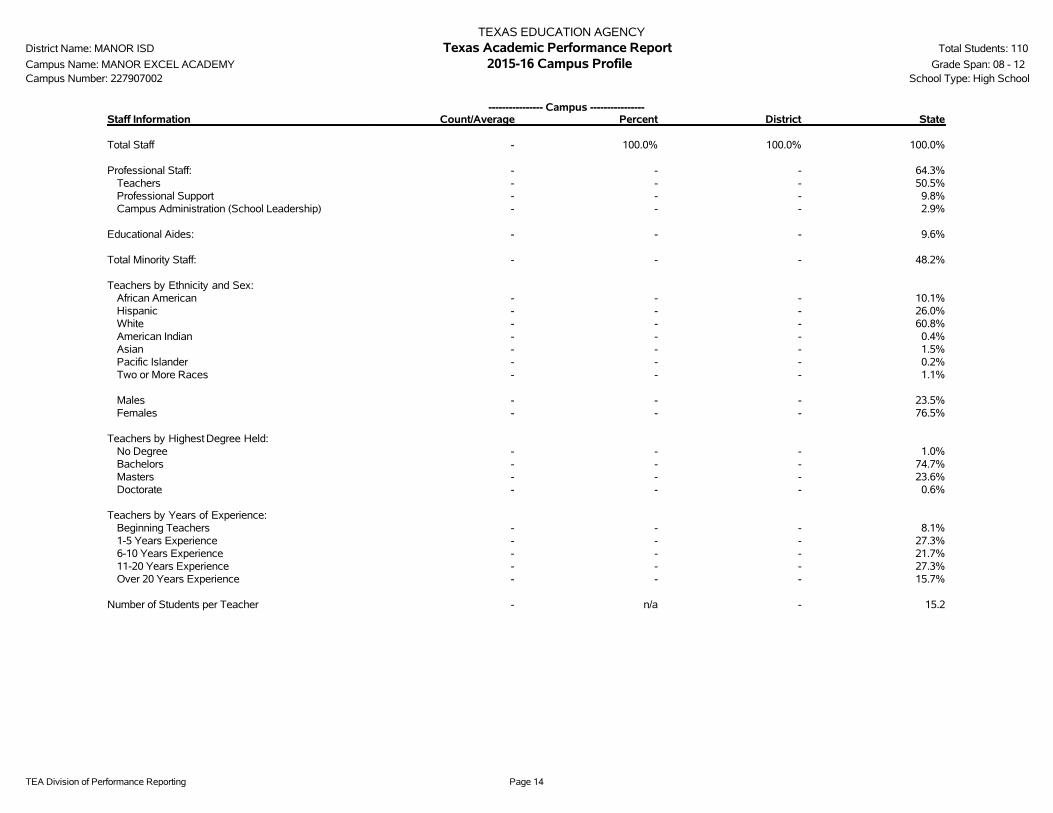
TEA Division of Performance Reporting Page 14
TEXAS EDUCATION AGENCYDistrict Name: MANOR ISD Texas Academic Performance Report Total Students: 110
Campus Name: MANOR EXCEL ACADEMY 2015-16 Campus Profile Grade Span: 08 - 12Campus Number: 227907002 School Type: High School
---------------- Campus ----------------Staff Information Count/Average Percent District State
Total Staff - 100.0% 100.0% 100.0%
Professional Staff: - - - 64.3%Teachers - - - 50.5%Professional Support - - - 9.8%Campus Administration (School Leadership) - - - 2.9%
Educational Aides: - - - 9.6%
Total Minority Staff: - - - 48.2%
Teachers by Ethnicity and Sex:African American - - - 10.1%Hispanic - - - 26.0%White - - - 60.8%American Indian - - - 0.4%Asian - - - 1.5%Pacific Islander - - - 0.2%Two or More Races - - - 1.1%
Males - - - 23.5%Females - - - 76.5%
Teachers by Highest Degree Held:No Degree - - - 1.0%Bachelors - - - 74.7%Masters - - - 23.6%Doctorate - - - 0.6%
Teachers by Years of Experience:Beginning Teachers - - - 8.1%1-5 Years Experience - - - 27.3%6-10 Years Experience - - - 21.7%11-20 Years Experience - - - 27.3%Over 20 Years Experience - - - 15.7%
Number of Students per Teacher - n/a - 15.2

TEA Division of Performance Reporting Page 15
TEXAS EDUCATION AGENCYDistrict Name: MANOR ISD Texas Academic Performance Report Total Students: 110
Campus Name: MANOR EXCEL ACADEMY 2015-16 Campus Profile Grade Span: 08 - 12Campus Number: 227907002 School Type: High School
Staff Information Campus District State
Average Years Experience of Teachers: - - 10.9Average Years Experience of Teachers with District: - - 7.3
Average Teacher Salary by Years of Experience (regular duties only):Beginning Teachers - - $45,5071-5 Years Experience - - $47,9966-10 Years Experience - - $50,45911-20 Years Experience - - $53,794Over 20 Years Experience - - $60,613
Average Actual Salaries (regular duties only):Teachers - - $51,891Professional Support - - $61,145Campus Administration (School Leadership) - - $75,654
Instructional Staff Percent: n/a - 64.5%
Contracted Instructional Staff (not incl. above): - - 1,914.4

TEA Division of Performance Reporting Page 16
TEXAS EDUCATION AGENCYDistrict Name: MANOR ISD Texas Academic Performance Report Total Students: 110
Campus Name: MANOR EXCEL ACADEMY 2015-16 Campus Profile Grade Span: 08 - 12Campus Number: 227907002 School Type: High School
---------------- Campus ----------------Program Information Count Percent District State
Student Enrollment by Program:Bilingual/ESL Education 17 15.5% 35.7% 18.3%Career & Technical Education 56 50.9% 28.7% 24.3%Gifted & Talented Education 0 0.0% 7.3% 7.7%Special Education 13 11.8% 7.8% 8.6%
Teachers by Program (population served):Bilingual/ESL Education - - - 5.9%Career & Technical Education - - - 4.4%Compensatory Education - - - 2.9%Gifted & Talented Education - - - 1.9%Regular Education - - - 72.6%Special Education - - - 8.8%Other - - - 3.4%
Link to: PEIMS Financial Standard Reports/ 2014-2015 Financial Actual Report
' '̂ Indicates that ELL rates at met or exceeded standard and exceeded standard include current and monitored students.'*' Indicates results are masked due to small numbers to protect student confidentiality.'-' Indicates zero observations reported for this group.'n/a' Indicates data reporting is not applicable for this group.'**' Indicates that rates for Reading and Mathematics are based on the cumulative results from the first and second administrations of STAAR.'?' Indicates that the data for this item were statistically improbable, or were reported outside a reasonable range.'##' Indicates that PID Error rate information cannot be reported in 2015-16 due to the transition from PEIMS Edit+ to TSDS.
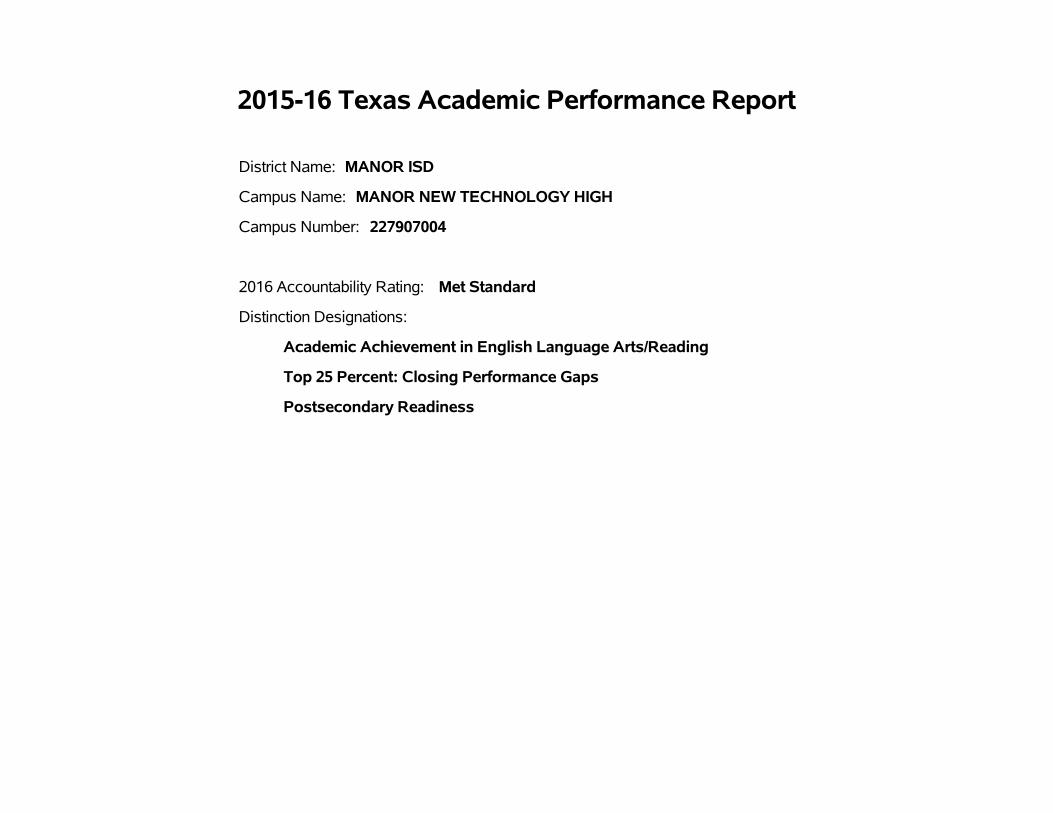
2015-16 Texas Academic Performance Report
District Name: MANOR ISD
Campus Name: MANOR NEW TECHNOLOGY HIGH
Campus Number: 227907004
2016 Accountability Rating: Met Standard
Distinction Designations:
Academic Achievement in English Language Arts/Reading
Top 25 Percent: Closing Performance Gaps
Postsecondary Readiness

This page intentionally left blank.
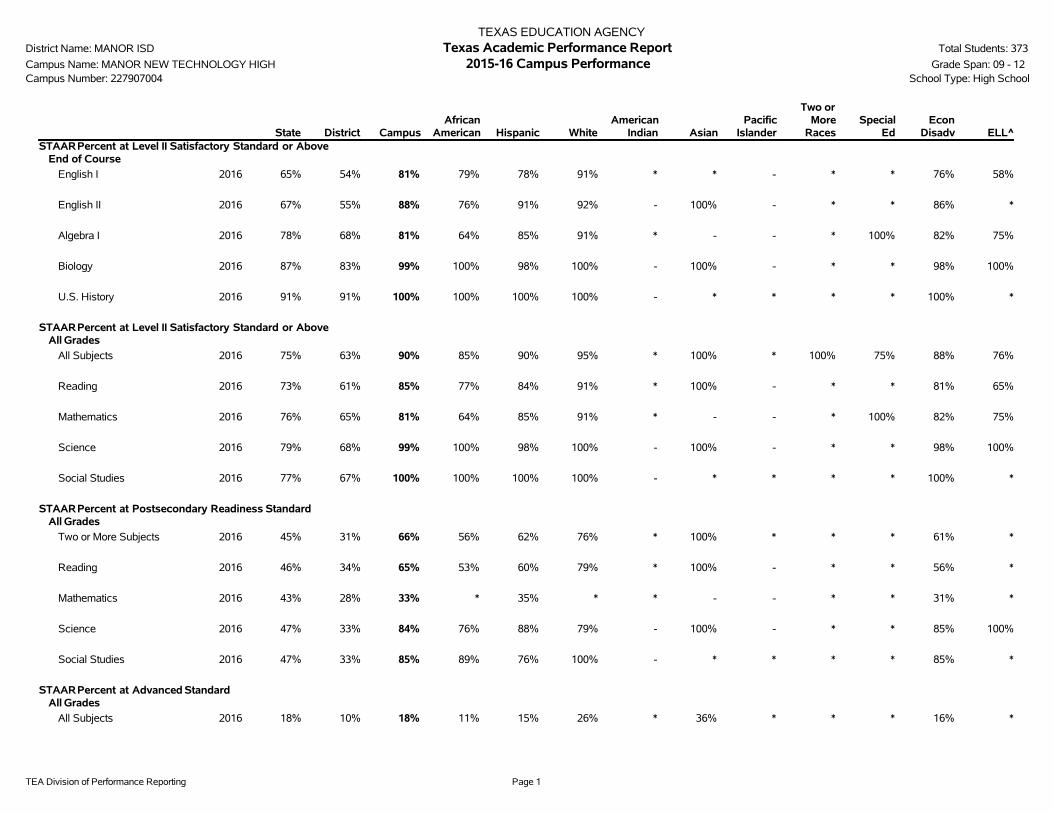
TEA Division of Performance Reporting Page 1
TEXAS EDUCATION AGENCYDistrict Name: MANOR ISD Texas Academic Performance Report Total Students: 373
Campus Name: MANOR NEW TECHNOLOGY HIGH 2015-16 Campus Performance Grade Span: 09 - 12Campus Number: 227907004 School Type: High School
State District CampusAfrican
American Hispanic WhiteAmerican
Indian AsianPacific
Islander
Two orMore
RacesSpecial
EdEcon
Disadv ELL^STAARPercent at Level II Satisfactory Standard or Above
End of Course
English I 2016 65% 54% 81% 79% 78% 91% * * - * * 76% 58%
English II 2016 67% 55% 88% 76% 91% 92% - 100% - * * 86% *
Algebra I 2016 78% 68% 81% 64% 85% 91% * - - * 100% 82% 75%
Biology 2016 87% 83% 99% 100% 98% 100% - 100% - * * 98% 100%
U.S. History 2016 91% 91% 100% 100% 100% 100% - * * * * 100% *
STAARPercent at Level II Satisfactory Standard or AboveAll Grades
All Subjects 2016 75% 63% 90% 85% 90% 95% * 100% * 100% 75% 88% 76%
Reading 2016 73% 61% 85% 77% 84% 91% * 100% - * * 81% 65%
Mathematics 2016 76% 65% 81% 64% 85% 91% * - - * 100% 82% 75%
Science 2016 79% 68% 99% 100% 98% 100% - 100% - * * 98% 100%
Social Studies 2016 77% 67% 100% 100% 100% 100% - * * * * 100% *
STAARPercent at Postsecondary Readiness StandardAll Grades
Two or More Subjects 2016 45% 31% 66% 56% 62% 76% * 100% * * * 61% *
Reading 2016 46% 34% 65% 53% 60% 79% * 100% - * * 56% *
Mathematics 2016 43% 28% 33% * 35% * * - - * * 31% *
Science 2016 47% 33% 84% 76% 88% 79% - 100% - * * 85% 100%
Social Studies 2016 47% 33% 85% 89% 76% 100% - * * * * 85% *
STAARPercent at Advanced StandardAll Grades
All Subjects 2016 18% 10% 18% 11% 15% 26% * 36% * * * 16% *
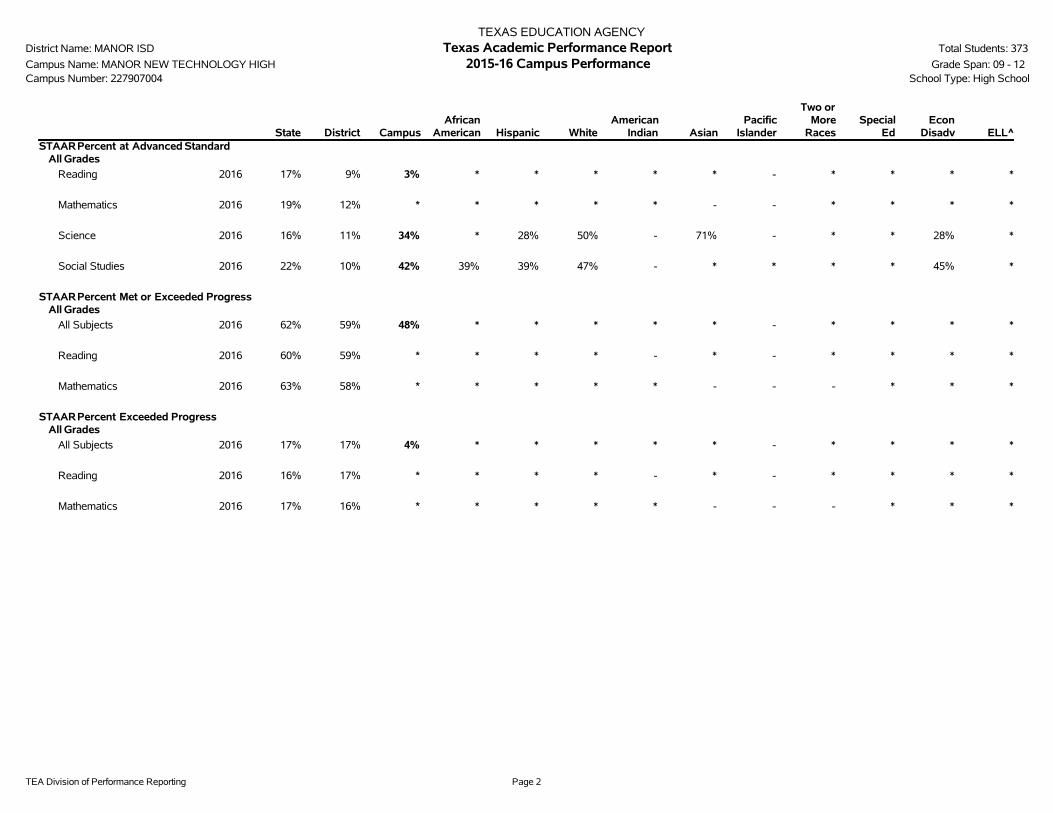
TEA Division of Performance Reporting Page 2
TEXAS EDUCATION AGENCYDistrict Name: MANOR ISD Texas Academic Performance Report Total Students: 373
Campus Name: MANOR NEW TECHNOLOGY HIGH 2015-16 Campus Performance Grade Span: 09 - 12Campus Number: 227907004 School Type: High School
State District CampusAfrican
American Hispanic WhiteAmerican
Indian AsianPacific
Islander
Two orMore
RacesSpecial
EdEcon
Disadv ELL^STAARPercent at Advanced Standard
All Grades
Reading 2016 17% 9% 3% * * * * * - * * * *
Mathematics 2016 19% 12% * * * * * - - * * * *
Science 2016 16% 11% 34% * 28% 50% - 71% - * * 28% *
Social Studies 2016 22% 10% 42% 39% 39% 47% - * * * * 45% *
STAARPercent Met or Exceeded ProgressAll Grades
All Subjects 2016 62% 59% 48% * * * * * - * * * *
Reading 2016 60% 59% * * * * - * - * * * *
Mathematics 2016 63% 58% * * * * * - - - * * *
STAARPercent Exceeded ProgressAll Grades
All Subjects 2016 17% 17% 4% * * * * * - * * * *
Reading 2016 16% 17% * * * * - * - * * * *
Mathematics 2016 17% 16% * * * * * - - - * * *
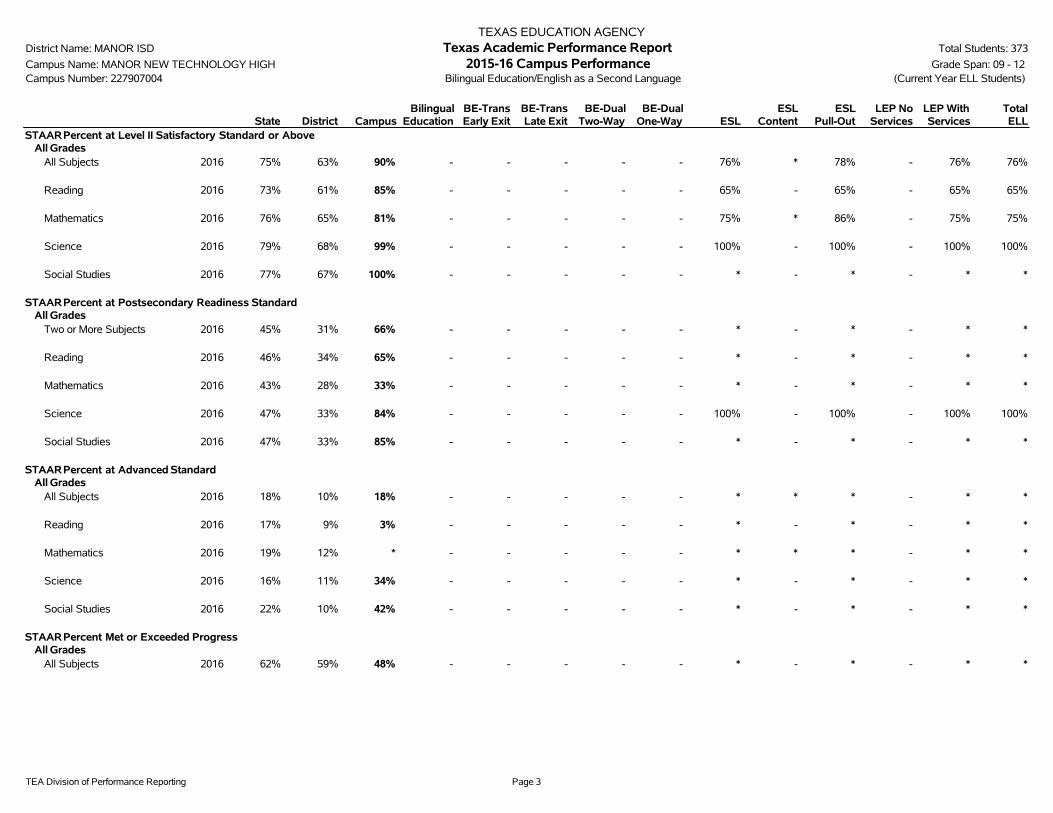
TEA Division of Performance Reporting Page 3
TEXAS EDUCATION AGENCYDistrict Name: MANOR ISD Texas Academic Performance Report Total Students: 373
Campus Name: MANOR NEW TECHNOLOGY HIGH 2015-16 Campus Performance Grade Span: 09 - 12Campus Number: 227907004 Bilingual Education/English as a Second Language (Current Year ELL Students)
State District CampusBilingual
EducationBE-TransEarly Exit
BE-TransLate Exit
BE-DualTwo-Way
BE-DualOne-Way ESL
ESLContent
ESLPull-Out
LEP NoServices
LEP WithServices
TotalELL
STAARPercent at Level II Satisfactory Standard or AboveAll Grades
All Subjects 2016 75% 63% 90% - - - - - 76% * 78% - 76% 76%
Reading 2016 73% 61% 85% - - - - - 65% - 65% - 65% 65%
Mathematics 2016 76% 65% 81% - - - - - 75% * 86% - 75% 75%
Science 2016 79% 68% 99% - - - - - 100% - 100% - 100% 100%
Social Studies 2016 77% 67% 100% - - - - - * - * - * *
STAARPercent at Postsecondary Readiness StandardAll Grades
Two or More Subjects 2016 45% 31% 66% - - - - - * - * - * *
Reading 2016 46% 34% 65% - - - - - * - * - * *
Mathematics 2016 43% 28% 33% - - - - - * - * - * *
Science 2016 47% 33% 84% - - - - - 100% - 100% - 100% 100%
Social Studies 2016 47% 33% 85% - - - - - * - * - * *
STAARPercent at Advanced StandardAll Grades
All Subjects 2016 18% 10% 18% - - - - - * * * - * *
Reading 2016 17% 9% 3% - - - - - * - * - * *
Mathematics 2016 19% 12% * - - - - - * * * - * *
Science 2016 16% 11% 34% - - - - - * - * - * *
Social Studies 2016 22% 10% 42% - - - - - * - * - * *
STAARPercent Met or Exceeded ProgressAll Grades
All Subjects 2016 62% 59% 48% - - - - - * - * - * *
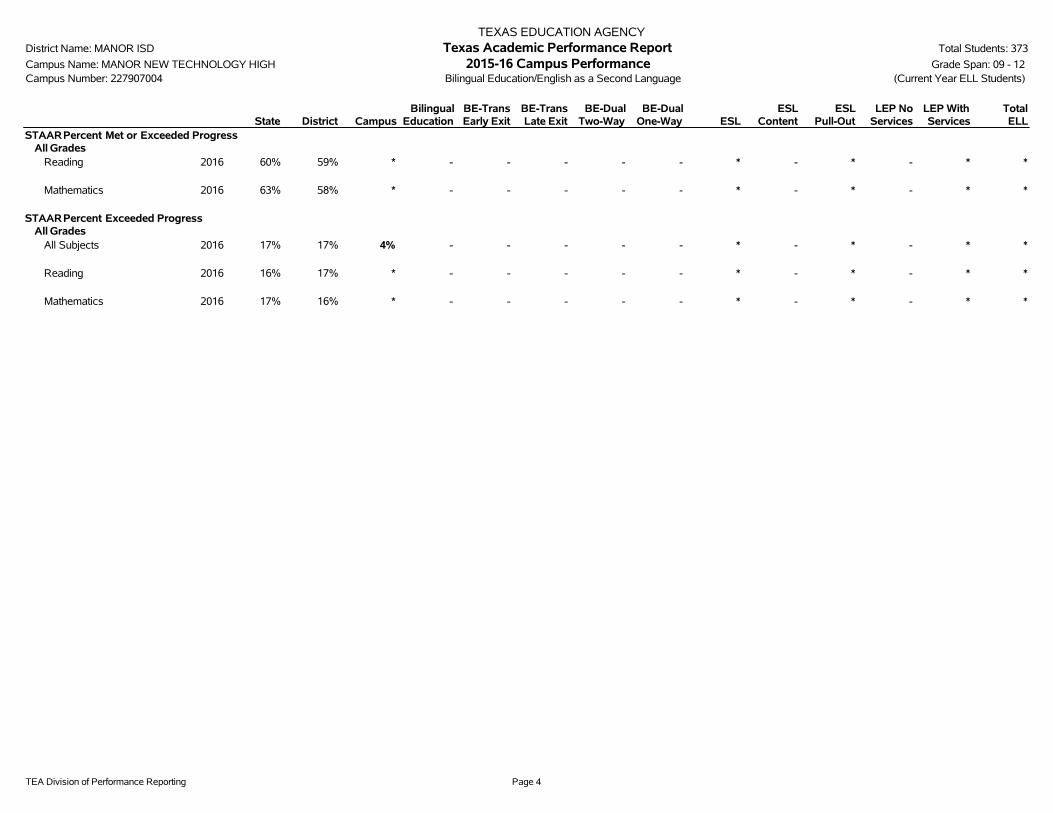
TEA Division of Performance Reporting Page 4
TEXAS EDUCATION AGENCYDistrict Name: MANOR ISD Texas Academic Performance Report Total Students: 373
Campus Name: MANOR NEW TECHNOLOGY HIGH 2015-16 Campus Performance Grade Span: 09 - 12Campus Number: 227907004 Bilingual Education/English as a Second Language (Current Year ELL Students)
State District CampusBilingual
EducationBE-TransEarly Exit
BE-TransLate Exit
BE-DualTwo-Way
BE-DualOne-Way ESL
ESLContent
ESLPull-Out
LEP NoServices
LEP WithServices
TotalELL
STAARPercent Met or Exceeded ProgressAll Grades
Reading 2016 60% 59% * - - - - - * - * - * *
Mathematics 2016 63% 58% * - - - - - * - * - * *
STAARPercent Exceeded ProgressAll Grades
All Subjects 2016 17% 17% 4% - - - - - * - * - * *
Reading 2016 16% 17% * - - - - - * - * - * *
Mathematics 2016 17% 16% * - - - - - * - * - * *
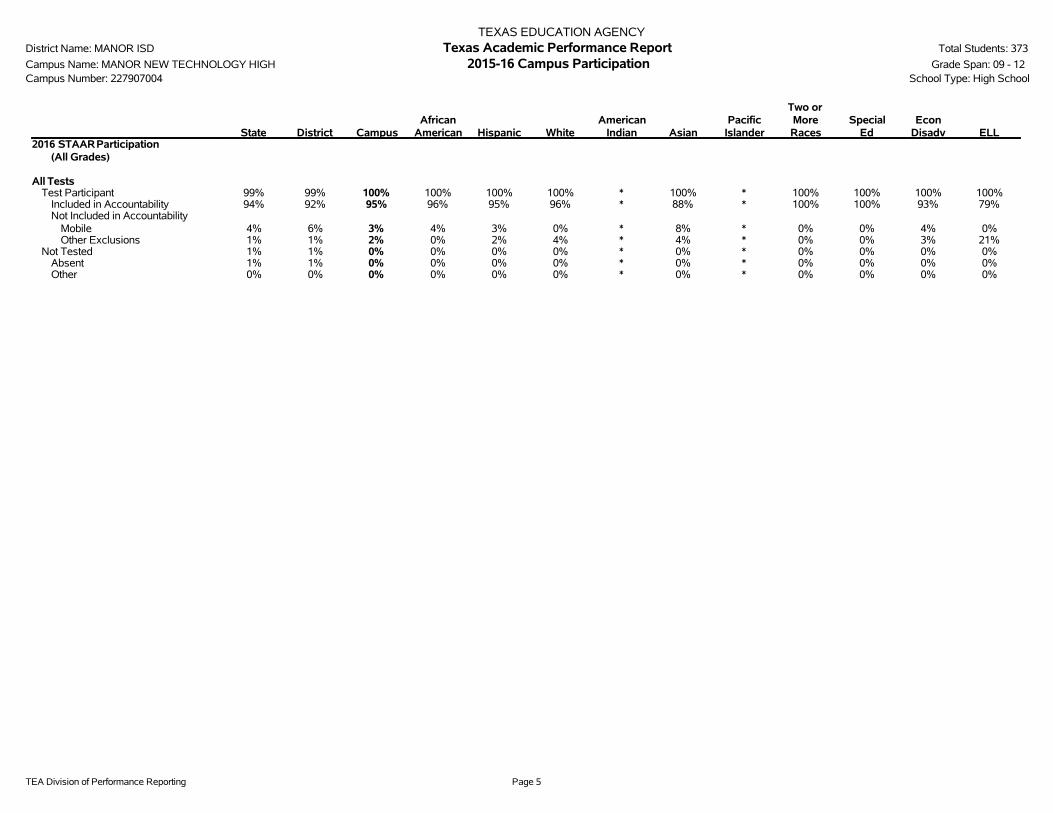
TEA Division of Performance Reporting Page 5
TEXAS EDUCATION AGENCYDistrict Name: MANOR ISD Texas Academic Performance Report Total Students: 373
Campus Name: MANOR NEW TECHNOLOGY HIGH 2015-16 Campus Participation Grade Span: 09 - 12Campus Number: 227907004 School Type: High School
State District CampusAfrican
American Hispanic WhiteAmerican
Indian AsianPacific
Islander
Two orMoreRaces
SpecialEd
EconDisadv ELL
2016 STAARParticipation(All Grades)
All TestsTest Participant 99% 99% 100% 100% 100% 100% * 100% * 100% 100% 100% 100%
Included in Accountability 94% 92% 95% 96% 95% 96% * 88% * 100% 100% 93% 79%Not Included in Accountability
Mobile 4% 6% 3% 4% 3% 0% * 8% * 0% 0% 4% 0%Other Exclusions 1% 1% 2% 0% 2% 4% * 4% * 0% 0% 3% 21%
Not Tested 1% 1% 0% 0% 0% 0% * 0% * 0% 0% 0% 0%Absent 1% 1% 0% 0% 0% 0% * 0% * 0% 0% 0% 0%Other 0% 0% 0% 0% 0% 0% * 0% * 0% 0% 0% 0%
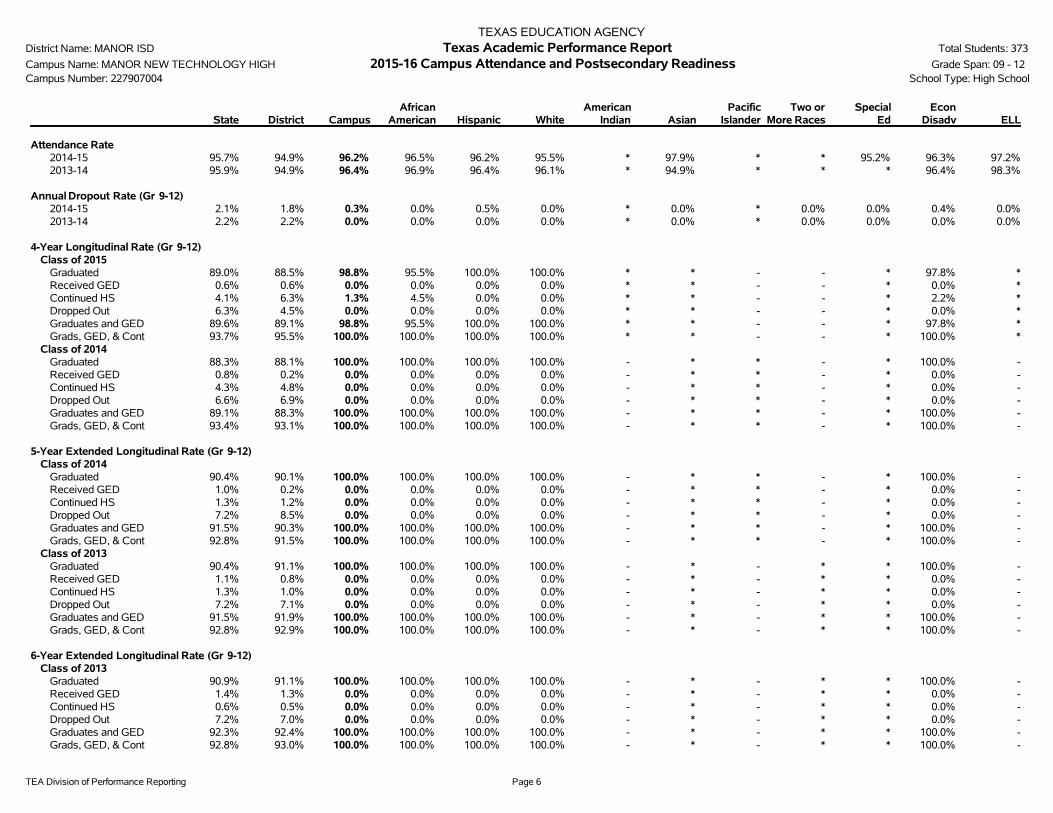
TEA Division of Performance Reporting Page 6
TEXAS EDUCATION AGENCYDistrict Name: MANOR ISD Texas Academic Performance Report Total Students: 373
Campus Name: MANOR NEW TECHNOLOGY HIGH 2015-16 Campus Attendance and Postsecondary Readiness Grade Span: 09 - 12Campus Number: 227907004 School Type: High School
State District CampusAfrican
American Hispanic WhiteAmerican
Indian AsianPacific
IslanderTwo or
More RacesSpecial
EdEcon
Disadv ELL
Attendance Rate2014-15 95.7% 94.9% 96.2% 96.5% 96.2% 95.5% * 97.9% * * 95.2% 96.3% 97.2%2013-14 95.9% 94.9% 96.4% 96.9% 96.4% 96.1% * 94.9% * * * 96.4% 98.3%
Annual Dropout Rate (Gr 9-12)2014-15 2.1% 1.8% 0.3% 0.0% 0.5% 0.0% * 0.0% * 0.0% 0.0% 0.4% 0.0%2013-14 2.2% 2.2% 0.0% 0.0% 0.0% 0.0% * 0.0% * 0.0% 0.0% 0.0% 0.0%
4-Year Longitudinal Rate (Gr 9-12)Class of 2015
Graduated 89.0% 88.5% 98.8% 95.5% 100.0% 100.0% * * - - * 97.8% *Received GED 0.6% 0.6% 0.0% 0.0% 0.0% 0.0% * * - - * 0.0% *Continued HS 4.1% 6.3% 1.3% 4.5% 0.0% 0.0% * * - - * 2.2% *Dropped Out 6.3% 4.5% 0.0% 0.0% 0.0% 0.0% * * - - * 0.0% *Graduates and GED 89.6% 89.1% 98.8% 95.5% 100.0% 100.0% * * - - * 97.8% *Grads, GED, & Cont 93.7% 95.5% 100.0% 100.0% 100.0% 100.0% * * - - * 100.0% *
Class of 2014Graduated 88.3% 88.1% 100.0% 100.0% 100.0% 100.0% - * * - * 100.0% -Received GED 0.8% 0.2% 0.0% 0.0% 0.0% 0.0% - * * - * 0.0% -Continued HS 4.3% 4.8% 0.0% 0.0% 0.0% 0.0% - * * - * 0.0% -Dropped Out 6.6% 6.9% 0.0% 0.0% 0.0% 0.0% - * * - * 0.0% -Graduates and GED 89.1% 88.3% 100.0% 100.0% 100.0% 100.0% - * * - * 100.0% -Grads, GED, & Cont 93.4% 93.1% 100.0% 100.0% 100.0% 100.0% - * * - * 100.0% -
5-Year Extended Longitudinal Rate (Gr 9-12)Class of 2014
Graduated 90.4% 90.1% 100.0% 100.0% 100.0% 100.0% - * * - * 100.0% -Received GED 1.0% 0.2% 0.0% 0.0% 0.0% 0.0% - * * - * 0.0% -Continued HS 1.3% 1.2% 0.0% 0.0% 0.0% 0.0% - * * - * 0.0% -Dropped Out 7.2% 8.5% 0.0% 0.0% 0.0% 0.0% - * * - * 0.0% -Graduates and GED 91.5% 90.3% 100.0% 100.0% 100.0% 100.0% - * * - * 100.0% -Grads, GED, & Cont 92.8% 91.5% 100.0% 100.0% 100.0% 100.0% - * * - * 100.0% -
Class of 2013Graduated 90.4% 91.1% 100.0% 100.0% 100.0% 100.0% - * - * * 100.0% -Received GED 1.1% 0.8% 0.0% 0.0% 0.0% 0.0% - * - * * 0.0% -Continued HS 1.3% 1.0% 0.0% 0.0% 0.0% 0.0% - * - * * 0.0% -Dropped Out 7.2% 7.1% 0.0% 0.0% 0.0% 0.0% - * - * * 0.0% -Graduates and GED 91.5% 91.9% 100.0% 100.0% 100.0% 100.0% - * - * * 100.0% -Grads, GED, & Cont 92.8% 92.9% 100.0% 100.0% 100.0% 100.0% - * - * * 100.0% -
6-Year Extended Longitudinal Rate (Gr 9-12)Class of 2013
Graduated 90.9% 91.1% 100.0% 100.0% 100.0% 100.0% - * - * * 100.0% -Received GED 1.4% 1.3% 0.0% 0.0% 0.0% 0.0% - * - * * 0.0% -Continued HS 0.6% 0.5% 0.0% 0.0% 0.0% 0.0% - * - * * 0.0% -Dropped Out 7.2% 7.0% 0.0% 0.0% 0.0% 0.0% - * - * * 0.0% -Graduates and GED 92.3% 92.4% 100.0% 100.0% 100.0% 100.0% - * - * * 100.0% -Grads, GED, & Cont 92.8% 93.0% 100.0% 100.0% 100.0% 100.0% - * - * * 100.0% -
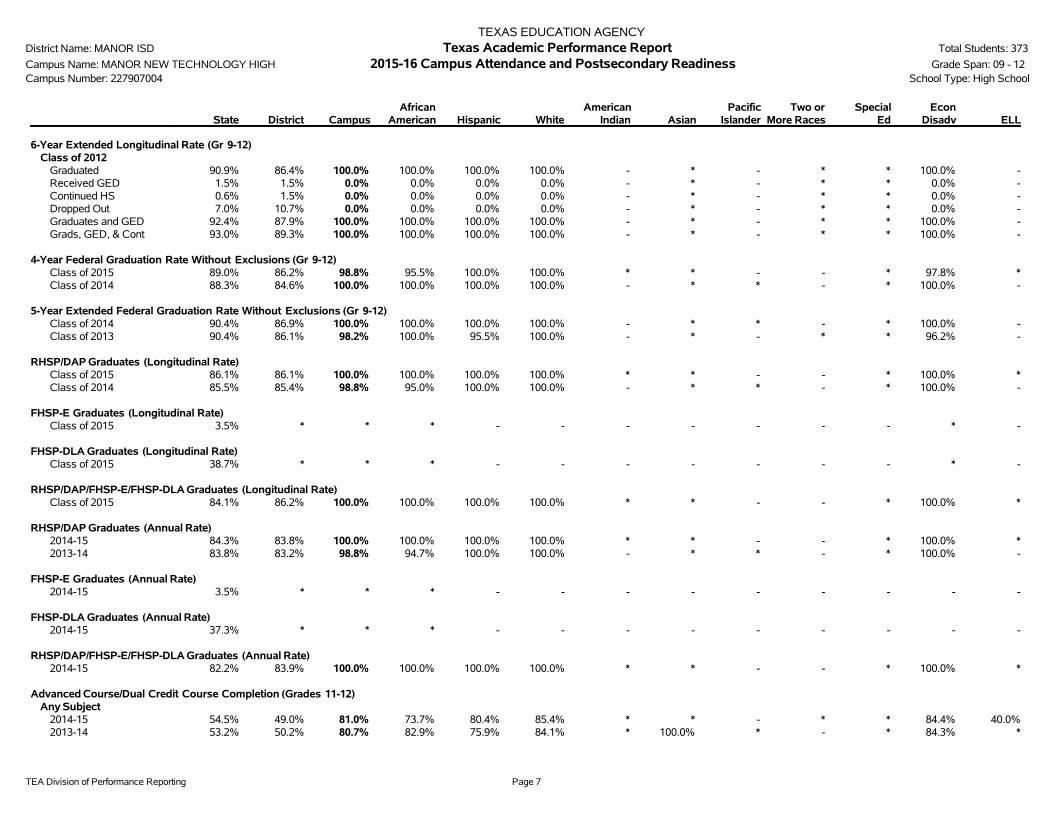
TEA Division of Performance Reporting Page 7
TEXAS EDUCATION AGENCYDistrict Name: MANOR ISD Texas Academic Performance Report Total Students: 373
Campus Name: MANOR NEW TECHNOLOGY HIGH 2015-16 Campus Attendance and Postsecondary Readiness Grade Span: 09 - 12Campus Number: 227907004 School Type: High School
State District CampusAfrican
American Hispanic WhiteAmerican
Indian AsianPacific
IslanderTwo or
More RacesSpecial
EdEcon
Disadv ELL
6-Year Extended Longitudinal Rate (Gr 9-12)Class of 2012
Graduated 90.9% 86.4% 100.0% 100.0% 100.0% 100.0% - * - * * 100.0% -Received GED 1.5% 1.5% 0.0% 0.0% 0.0% 0.0% - * - * * 0.0% -Continued HS 0.6% 1.5% 0.0% 0.0% 0.0% 0.0% - * - * * 0.0% -Dropped Out 7.0% 10.7% 0.0% 0.0% 0.0% 0.0% - * - * * 0.0% -Graduates and GED 92.4% 87.9% 100.0% 100.0% 100.0% 100.0% - * - * * 100.0% -Grads, GED, & Cont 93.0% 89.3% 100.0% 100.0% 100.0% 100.0% - * - * * 100.0% -
4-Year Federal Graduation Rate Without Exclusions (Gr 9-12)Class of 2015 89.0% 86.2% 98.8% 95.5% 100.0% 100.0% * * - - * 97.8% *Class of 2014 88.3% 84.6% 100.0% 100.0% 100.0% 100.0% - * * - * 100.0% -
5-Year Extended Federal Graduation Rate Without Exclusions (Gr 9-12)Class of 2014 90.4% 86.9% 100.0% 100.0% 100.0% 100.0% - * * - * 100.0% -Class of 2013 90.4% 86.1% 98.2% 100.0% 95.5% 100.0% - * - * * 96.2% -
RHSP/DAP Graduates (Longitudinal Rate)Class of 2015 86.1% 86.1% 100.0% 100.0% 100.0% 100.0% * * - - * 100.0% *Class of 2014 85.5% 85.4% 98.8% 95.0% 100.0% 100.0% - * * - * 100.0% -
FHSP-E Graduates (Longitudinal Rate)Class of 2015 3.5% * * * - - - - - - - * -
FHSP-DLA Graduates (Longitudinal Rate)Class of 2015 38.7% * * * - - - - - - - * -
RHSP/DAP/FHSP-E/FHSP-DLA Graduates (Longitudinal Rate)Class of 2015 84.1% 86.2% 100.0% 100.0% 100.0% 100.0% * * - - * 100.0% *
RHSP/DAP Graduates (Annual Rate)2014-15 84.3% 83.8% 100.0% 100.0% 100.0% 100.0% * * - - * 100.0% *2013-14 83.8% 83.2% 98.8% 94.7% 100.0% 100.0% - * * - * 100.0% -
FHSP-E Graduates (Annual Rate)2014-15 3.5% * * * - - - - - - - - -
FHSP-DLA Graduates (Annual Rate)2014-15 37.3% * * * - - - - - - - - -
RHSP/DAP/FHSP-E/FHSP-DLA Graduates (Annual Rate)2014-15 82.2% 83.9% 100.0% 100.0% 100.0% 100.0% * * - - * 100.0% *
Advanced Course/Dual Credit Course Completion (Grades 11-12)Any Subject
2014-15 54.5% 49.0% 81.0% 73.7% 80.4% 85.4% * * - * * 84.4% 40.0%2013-14 53.2% 50.2% 80.7% 82.9% 75.9% 84.1% * 100.0% * - * 84.3% *

TEA Division of Performance Reporting Page 8
TEXAS EDUCATION AGENCYDistrict Name: MANOR ISD Texas Academic Performance Report Total Students: 373
Campus Name: MANOR NEW TECHNOLOGY HIGH 2015-16 Campus Attendance and Postsecondary Readiness Grade Span: 09 - 12Campus Number: 227907004 School Type: High School
State District CampusAfrican
American Hispanic WhiteAmerican
Indian AsianPacific
IslanderTwo or
More RacesSpecial
EdEcon
Disadv ELL
Advanced Course/Dual Credit Course Completion (Grades 11-12)English Language Arts
2014-15 29.0% 38.2% 73.3% 71.1% 70.0% 77.5% * * - * * 73.3% 40.0%2013-14 28.9% 39.0% 75.1% 80.5% 66.7% 83.7% * 80.0% * - * 77.1% *
Mathematics2014-15 43.8% 34.5% 49.4% 52.8% 44.0% 58.3% * * - * * 52.4% *2013-14 42.4% 32.1% 45.5% 43.9% 37.7% 54.8% * 80.0% * - * 43.9% *
Science2014-15 12.7% 0.9% 0.0% 0.0% 0.0% 0.0% - * - * * 0.0% 0.0%2013-14 13.4% 0.0% 0.0% 0.0% 0.0% 0.0% * * - - * 0.0% *
Social Studies2014-15 28.4% 23.9% 0.0% 0.0% 0.0% 0.0% * * - * * 0.0% 0.0%2013-14 27.8% 27.1% 0.0% 0.0% 0.0% 0.0% * 0.0% * - * 0.0% *
Advanced Course/Dual Credit Course Completion (Grades 9-12)Any Subject
2014-15 34.6% 29.0% 38.1% 32.9% 38.7% 42.4% * 28.6% * 50.0% 11.1% 37.0% 16.7%2013-14 33.1% 26.1% 39.7% 43.6% 35.9% 45.1% * 41.7% * 0.0% 20.0% 36.6% 28.6%
English Language Arts2014-15 15.7% 22.1% 34.2% 31.8% 33.5% 37.3% * 28.6% * 60.0% 12.5% 32.4% 16.7%2013-14 15.4% 17.7% 36.5% 42.3% 30.8% 44.4% * 33.3% * 0.0% 20.0% 33.5% 28.6%
Mathematics2014-15 19.4% 13.8% 22.2% 22.9% 20.1% 27.5% * 14.3% * 16.7% 0.0% 22.4% 0.0%2013-14 18.8% 13.8% 22.5% 23.4% 18.1% 29.1% * 33.3% * 0.0% 0.0% 19.4% 0.0%
Science2014-15 5.2% 0.3% 0.0% 0.0% 0.0% 0.0% - 0.0% * 0.0% 0.0% 0.0% 0.0%2013-14 5.6% 0.0% 0.0% 0.0% 0.0% 0.0% * 0.0% * 0.0% 0.0% 0.0% 0.0%
Social Studies2014-15 19.5% 12.5% 0.0% 0.0% 0.0% 0.0% * 0.0% * 0.0% 0.0% 0.0% 0.0%2013-14 18.3% 14.5% 0.0% 0.0% 0.0% 0.0% * 0.0% * 0.0% 0.0% 0.0% 0.0%
College-Ready GraduatesEnglish Language Arts
2014-15 42.0% 25.0% 41.0% 35.0% 33.0% 59.0% * * - - - 31.0% *Mathematics
2014-15 38.0% 18.0% 34.0% 25.0% 30.0% 47.0% * * - - - 31.0% *Both Subjects
2014-15 35.0% 16.0% 32.0% 15.0% 30.0% 47.0% * * - - - 26.0% *Either Subject
2014-15 45.0% 28.0% 44.0% 45.0% 33.0% 59.0% * * - - - 36.0% *
College and Career Ready Graduates2014-15 74.5% 68.8% 96.2% 90.5% 97.3% 100.0% * * - - * 100.0% *
Texas Success Initiative Assessment (TSIA)English Language Arts
2014-15 10.6% 9.9% 12.7% 19.0% 10.8% 11.1% * * - - * 12.5% *
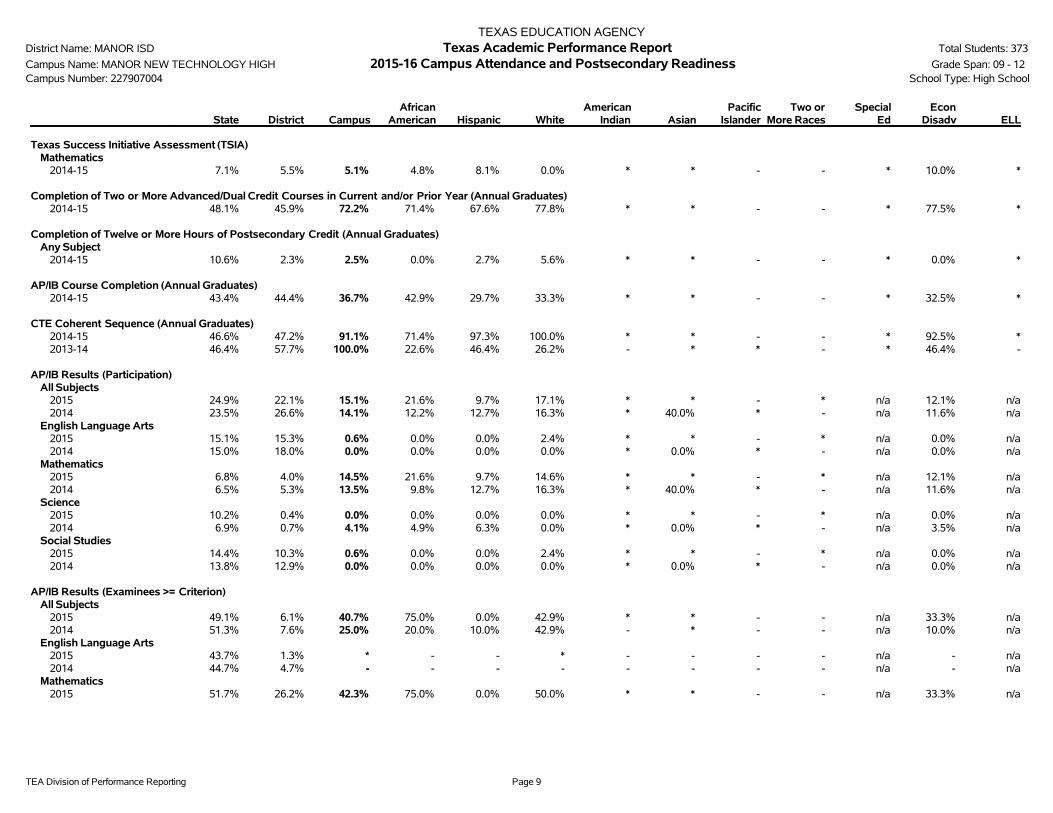
TEA Division of Performance Reporting Page 9
TEXAS EDUCATION AGENCYDistrict Name: MANOR ISD Texas Academic Performance Report Total Students: 373
Campus Name: MANOR NEW TECHNOLOGY HIGH 2015-16 Campus Attendance and Postsecondary Readiness Grade Span: 09 - 12Campus Number: 227907004 School Type: High School
State District CampusAfrican
American Hispanic WhiteAmerican
Indian AsianPacific
IslanderTwo or
More RacesSpecial
EdEcon
Disadv ELL
Texas Success Initiative Assessment (TSIA)Mathematics
2014-15 7.1% 5.5% 5.1% 4.8% 8.1% 0.0% * * - - * 10.0% *
Completion of Two or More Advanced/Dual Credit Courses in Current and/or Prior Year (Annual Graduates)2014-15 48.1% 45.9% 72.2% 71.4% 67.6% 77.8% * * - - * 77.5% *
Completion of Twelve or More Hours of Postsecondary Credit (Annual Graduates)Any Subject
2014-15 10.6% 2.3% 2.5% 0.0% 2.7% 5.6% * * - - * 0.0% *
AP/IB Course Completion (Annual Graduates)2014-15 43.4% 44.4% 36.7% 42.9% 29.7% 33.3% * * - - * 32.5% *
CTE Coherent Sequence (Annual Graduates)2014-15 46.6% 47.2% 91.1% 71.4% 97.3% 100.0% * * - - * 92.5% *2013-14 46.4% 57.7% 100.0% 22.6% 46.4% 26.2% - * * - * 46.4% -
AP/IB Results (Participation)All Subjects
2015 24.9% 22.1% 15.1% 21.6% 9.7% 17.1% * * - * n/a 12.1% n/a2014 23.5% 26.6% 14.1% 12.2% 12.7% 16.3% * 40.0% * - n/a 11.6% n/a
English Language Arts2015 15.1% 15.3% 0.6% 0.0% 0.0% 2.4% * * - * n/a 0.0% n/a2014 15.0% 18.0% 0.0% 0.0% 0.0% 0.0% * 0.0% * - n/a 0.0% n/a
Mathematics2015 6.8% 4.0% 14.5% 21.6% 9.7% 14.6% * * - * n/a 12.1% n/a2014 6.5% 5.3% 13.5% 9.8% 12.7% 16.3% * 40.0% * - n/a 11.6% n/a
Science2015 10.2% 0.4% 0.0% 0.0% 0.0% 0.0% * * - * n/a 0.0% n/a2014 6.9% 0.7% 4.1% 4.9% 6.3% 0.0% * 0.0% * - n/a 3.5% n/a
Social Studies2015 14.4% 10.3% 0.6% 0.0% 0.0% 2.4% * * - * n/a 0.0% n/a2014 13.8% 12.9% 0.0% 0.0% 0.0% 0.0% * 0.0% * - n/a 0.0% n/a
AP/IB Results (Examinees >= Criterion)All Subjects
2015 49.1% 6.1% 40.7% 75.0% 0.0% 42.9% * * - - n/a 33.3% n/a2014 51.3% 7.6% 25.0% 20.0% 10.0% 42.9% - * - - n/a 10.0% n/a
English Language Arts2015 43.7% 1.3% * - - * - - - - n/a - n/a2014 44.7% 4.7% - - - - - - - - n/a - n/a
Mathematics2015 51.7% 26.2% 42.3% 75.0% 0.0% 50.0% * * - - n/a 33.3% n/a
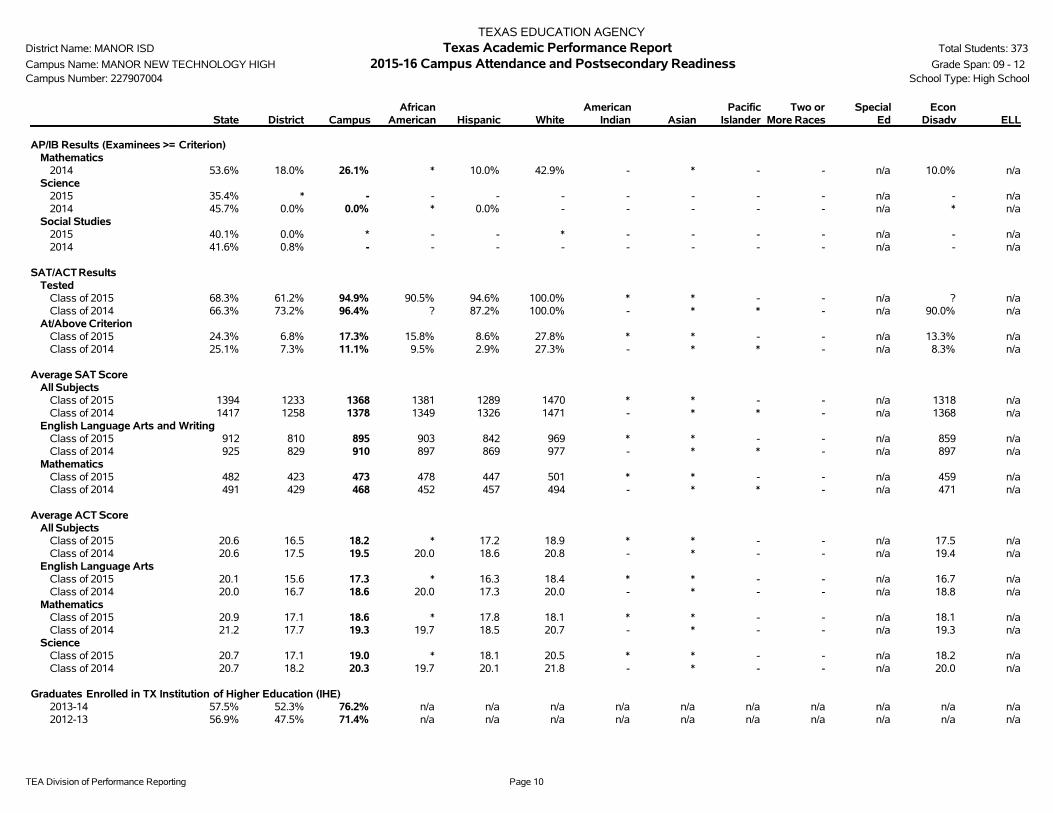
TEA Division of Performance Reporting Page 10
TEXAS EDUCATION AGENCYDistrict Name: MANOR ISD Texas Academic Performance Report Total Students: 373
Campus Name: MANOR NEW TECHNOLOGY HIGH 2015-16 Campus Attendance and Postsecondary Readiness Grade Span: 09 - 12Campus Number: 227907004 School Type: High School
State District CampusAfrican
American Hispanic WhiteAmerican
Indian AsianPacific
IslanderTwo or
More RacesSpecial
EdEcon
Disadv ELL
AP/IB Results (Examinees >= Criterion)Mathematics
2014 53.6% 18.0% 26.1% * 10.0% 42.9% - * - - n/a 10.0% n/aScience
2015 35.4% * - - - - - - - - n/a - n/a2014 45.7% 0.0% 0.0% * 0.0% - - - - - n/a * n/a
Social Studies2015 40.1% 0.0% * - - * - - - - n/a - n/a2014 41.6% 0.8% - - - - - - - - n/a - n/a
SAT/ACT ResultsTested
Class of 2015 68.3% 61.2% 94.9% 90.5% 94.6% 100.0% * * - - n/a ? n/aClass of 2014 66.3% 73.2% 96.4% ? 87.2% 100.0% - * * - n/a 90.0% n/a
At/Above CriterionClass of 2015 24.3% 6.8% 17.3% 15.8% 8.6% 27.8% * * - - n/a 13.3% n/aClass of 2014 25.1% 7.3% 11.1% 9.5% 2.9% 27.3% - * * - n/a 8.3% n/a
Average SAT ScoreAll Subjects
Class of 2015 1394 1233 1368 1381 1289 1470 * * - - n/a 1318 n/aClass of 2014 1417 1258 1378 1349 1326 1471 - * * - n/a 1368 n/a
English Language Arts and WritingClass of 2015 912 810 895 903 842 969 * * - - n/a 859 n/aClass of 2014 925 829 910 897 869 977 - * * - n/a 897 n/a
MathematicsClass of 2015 482 423 473 478 447 501 * * - - n/a 459 n/aClass of 2014 491 429 468 452 457 494 - * * - n/a 471 n/a
Average ACT ScoreAll Subjects
Class of 2015 20.6 16.5 18.2 * 17.2 18.9 * * - - n/a 17.5 n/aClass of 2014 20.6 17.5 19.5 20.0 18.6 20.8 - * - - n/a 19.4 n/a
English Language ArtsClass of 2015 20.1 15.6 17.3 * 16.3 18.4 * * - - n/a 16.7 n/aClass of 2014 20.0 16.7 18.6 20.0 17.3 20.0 - * - - n/a 18.8 n/a
MathematicsClass of 2015 20.9 17.1 18.6 * 17.8 18.1 * * - - n/a 18.1 n/aClass of 2014 21.2 17.7 19.3 19.7 18.5 20.7 - * - - n/a 19.3 n/a
ScienceClass of 2015 20.7 17.1 19.0 * 18.1 20.5 * * - - n/a 18.2 n/aClass of 2014 20.7 18.2 20.3 19.7 20.1 21.8 - * - - n/a 20.0 n/a
Graduates Enrolled in TX Institution of Higher Education (IHE)2013-14 57.5% 52.3% 76.2% n/a n/a n/a n/a n/a n/a n/a n/a n/a n/a2012-13 56.9% 47.5% 71.4% n/a n/a n/a n/a n/a n/a n/a n/a n/a n/a
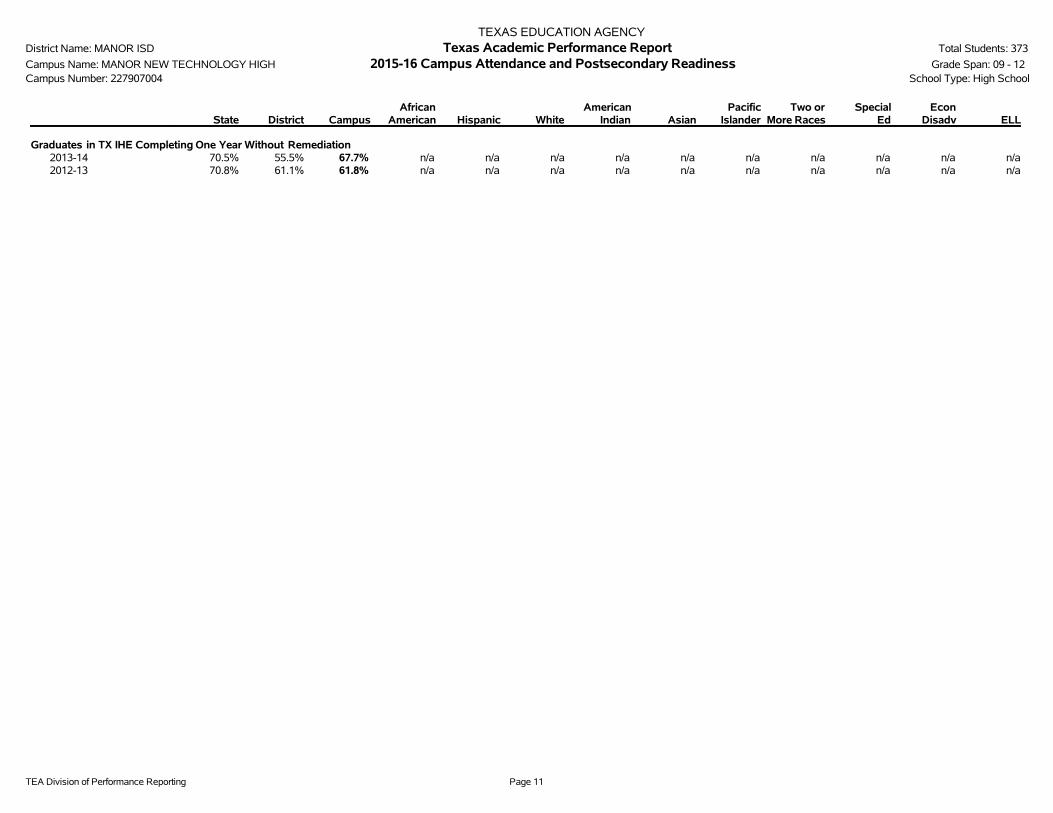
TEA Division of Performance Reporting Page 11
TEXAS EDUCATION AGENCYDistrict Name: MANOR ISD Texas Academic Performance Report Total Students: 373
Campus Name: MANOR NEW TECHNOLOGY HIGH 2015-16 Campus Attendance and Postsecondary Readiness Grade Span: 09 - 12Campus Number: 227907004 School Type: High School
State District CampusAfrican
American Hispanic WhiteAmerican
Indian AsianPacific
IslanderTwo or
More RacesSpecial
EdEcon
Disadv ELL
Graduates in TX IHE Completing One Year Without Remediation2013-14 70.5% 55.5% 67.7% n/a n/a n/a n/a n/a n/a n/a n/a n/a n/a2012-13 70.8% 61.1% 61.8% n/a n/a n/a n/a n/a n/a n/a n/a n/a n/a
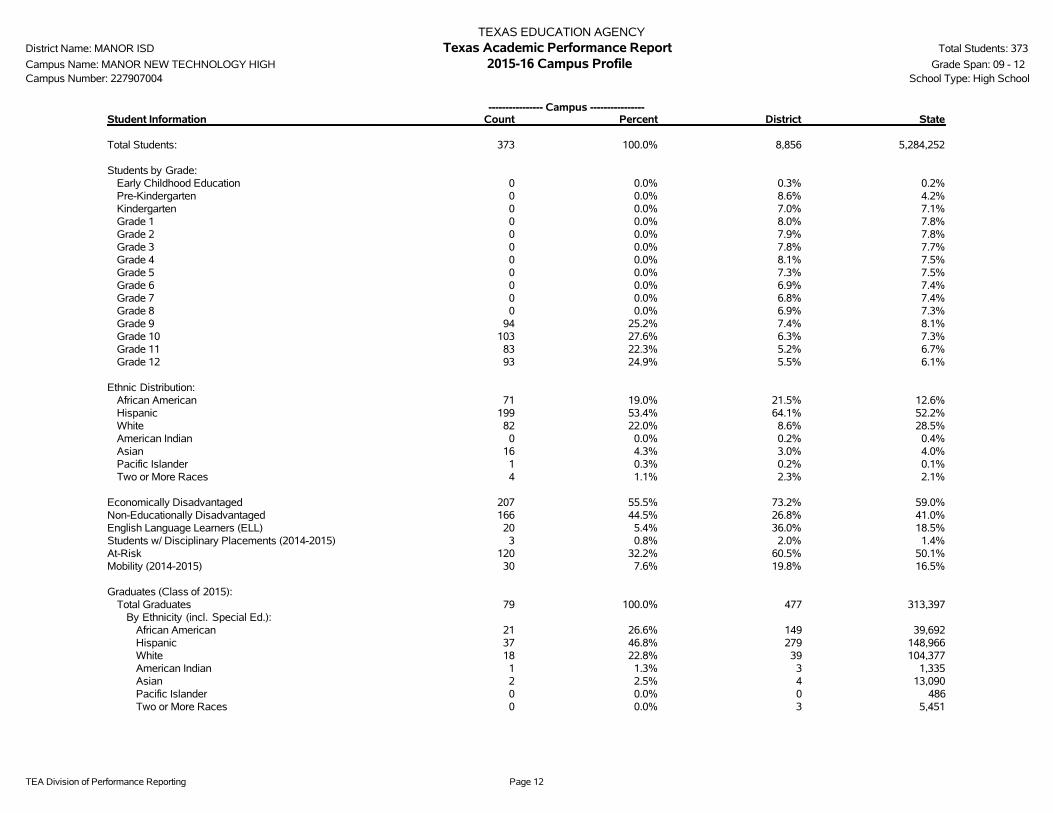
TEA Division of Performance Reporting Page 12
TEXAS EDUCATION AGENCYDistrict Name: MANOR ISD Texas Academic Performance Report Total Students: 373
Campus Name: MANOR NEW TECHNOLOGY HIGH 2015-16 Campus Profile Grade Span: 09 - 12Campus Number: 227907004 School Type: High School
---------------- Campus ----------------Student Information Count Percent District State
Total Students: 373 100.0% 8,856 5,284,252
Students by Grade:Early Childhood Education 0 0.0% 0.3% 0.2%Pre-Kindergarten 0 0.0% 8.6% 4.2%Kindergarten 0 0.0% 7.0% 7.1%Grade 1 0 0.0% 8.0% 7.8%Grade 2 0 0.0% 7.9% 7.8%Grade 3 0 0.0% 7.8% 7.7%Grade 4 0 0.0% 8.1% 7.5%Grade 5 0 0.0% 7.3% 7.5%Grade 6 0 0.0% 6.9% 7.4%Grade 7 0 0.0% 6.8% 7.4%Grade 8 0 0.0% 6.9% 7.3%Grade 9 94 25.2% 7.4% 8.1%Grade 10 103 27.6% 6.3% 7.3%Grade 11 83 22.3% 5.2% 6.7%Grade 12 93 24.9% 5.5% 6.1%
Ethnic Distribution:African American 71 19.0% 21.5% 12.6%Hispanic 199 53.4% 64.1% 52.2%White 82 22.0% 8.6% 28.5%American Indian 0 0.0% 0.2% 0.4%Asian 16 4.3% 3.0% 4.0%Pacific Islander 1 0.3% 0.2% 0.1%Two or More Races 4 1.1% 2.3% 2.1%
Economically Disadvantaged 207 55.5% 73.2% 59.0%Non-Educationally Disadvantaged 166 44.5% 26.8% 41.0%English Language Learners (ELL) 20 5.4% 36.0% 18.5%Students w/ Disciplinary Placements (2014-2015) 3 0.8% 2.0% 1.4%At-Risk 120 32.2% 60.5% 50.1%Mobility (2014-2015) 30 7.6% 19.8% 16.5%
Graduates (Class of 2015):Total Graduates 79 100.0% 477 313,397
By Ethnicity (incl. Special Ed.):African American 21 26.6% 149 39,692Hispanic 37 46.8% 279 148,966White 18 22.8% 39 104,377American Indian 1 1.3% 3 1,335Asian 2 2.5% 4 13,090Pacific Islander 0 0.0% 0 486Two or More Races 0 0.0% 3 5,451
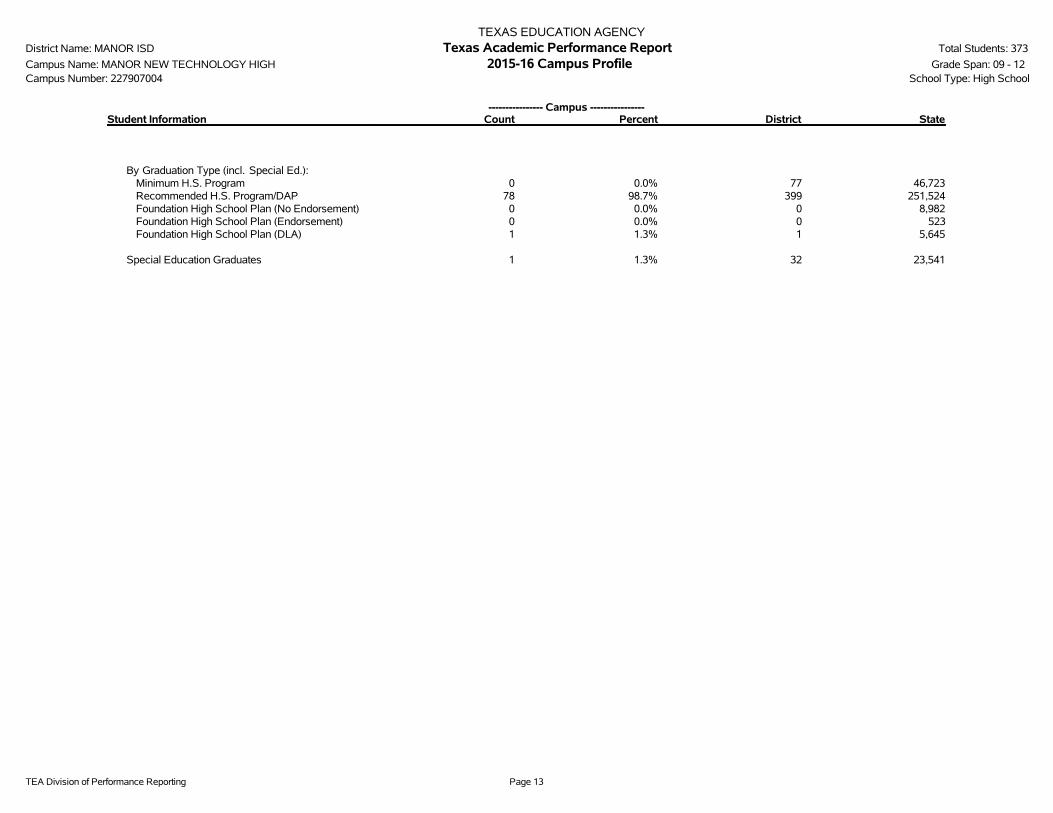
TEA Division of Performance Reporting Page 13
TEXAS EDUCATION AGENCYDistrict Name: MANOR ISD Texas Academic Performance Report Total Students: 373
Campus Name: MANOR NEW TECHNOLOGY HIGH 2015-16 Campus Profile Grade Span: 09 - 12Campus Number: 227907004 School Type: High School
---------------- Campus ----------------Student Information Count Percent District State
By Graduation Type (incl. Special Ed.):Minimum H.S. Program 0 0.0% 77 46,723Recommended H.S. Program/DAP 78 98.7% 399 251,524Foundation High School Plan (No Endorsement) 0 0.0% 0 8,982Foundation High School Plan (Endorsement) 0 0.0% 0 523Foundation High School Plan (DLA) 1 1.3% 1 5,645
Special Education Graduates 1 1.3% 32 23,541

TEA Division of Performance Reporting Page 14
TEXAS EDUCATION AGENCYDistrict Name: MANOR ISD Texas Academic Performance Report Total Students: 373
Campus Name: MANOR NEW TECHNOLOGY HIGH 2015-16 Campus Profile Grade Span: 09 - 12Campus Number: 227907004 School Type: High School
Class Size Information Campus District State
Class Size Averages by Grade and Subject (Derived from teacher responsibility records):
Elementary:Kindergarten - - 18.9Grade 1 - - 19.1Grade 2 - - 19.1Grade 3 - - 19.1Grade 4 - - 19.0Grade 5 - - 20.8Grade 6 - - 20.4
Secondary:English/Language Arts - - 17.1Foreign Languages - - 19.1Mathematics - - 18.1Science - - 19.1Social Studies - - 19.5
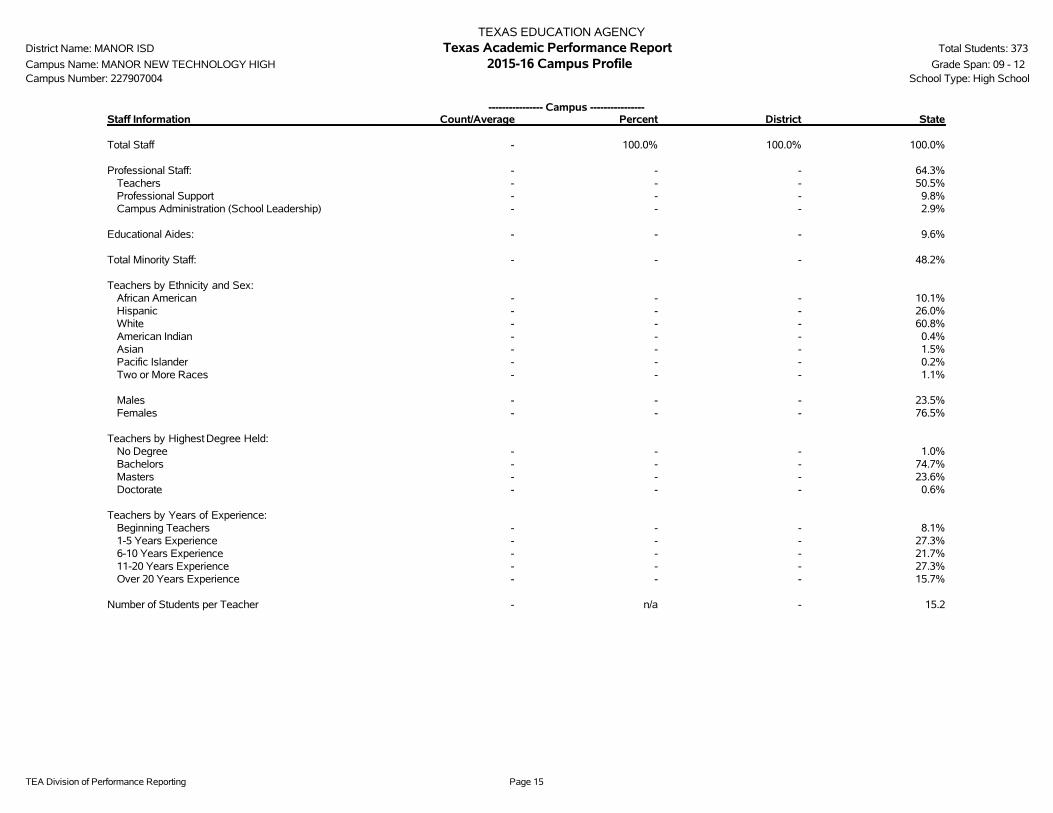
TEA Division of Performance Reporting Page 15
TEXAS EDUCATION AGENCYDistrict Name: MANOR ISD Texas Academic Performance Report Total Students: 373
Campus Name: MANOR NEW TECHNOLOGY HIGH 2015-16 Campus Profile Grade Span: 09 - 12Campus Number: 227907004 School Type: High School
---------------- Campus ----------------Staff Information Count/Average Percent District State
Total Staff - 100.0% 100.0% 100.0%
Professional Staff: - - - 64.3%Teachers - - - 50.5%Professional Support - - - 9.8%Campus Administration (School Leadership) - - - 2.9%
Educational Aides: - - - 9.6%
Total Minority Staff: - - - 48.2%
Teachers by Ethnicity and Sex:African American - - - 10.1%Hispanic - - - 26.0%White - - - 60.8%American Indian - - - 0.4%Asian - - - 1.5%Pacific Islander - - - 0.2%Two or More Races - - - 1.1%
Males - - - 23.5%Females - - - 76.5%
Teachers by Highest Degree Held:No Degree - - - 1.0%Bachelors - - - 74.7%Masters - - - 23.6%Doctorate - - - 0.6%
Teachers by Years of Experience:Beginning Teachers - - - 8.1%1-5 Years Experience - - - 27.3%6-10 Years Experience - - - 21.7%11-20 Years Experience - - - 27.3%Over 20 Years Experience - - - 15.7%
Number of Students per Teacher - n/a - 15.2

TEA Division of Performance Reporting Page 16
TEXAS EDUCATION AGENCYDistrict Name: MANOR ISD Texas Academic Performance Report Total Students: 373
Campus Name: MANOR NEW TECHNOLOGY HIGH 2015-16 Campus Profile Grade Span: 09 - 12Campus Number: 227907004 School Type: High School
Staff Information Campus District State
Average Years Experience of Teachers: - - 10.9Average Years Experience of Teachers with District: - - 7.3
Average Teacher Salary by Years of Experience (regular duties only):Beginning Teachers - - $45,5071-5 Years Experience - - $47,9966-10 Years Experience - - $50,45911-20 Years Experience - - $53,794Over 20 Years Experience - - $60,613
Average Actual Salaries (regular duties only):Teachers - - $51,891Professional Support - - $61,145Campus Administration (School Leadership) - - $75,654
Instructional Staff Percent: n/a - 64.5%
Contracted Instructional Staff (not incl. above): - - 1,914.4

TEA Division of Performance Reporting Page 17
TEXAS EDUCATION AGENCYDistrict Name: MANOR ISD Texas Academic Performance Report Total Students: 373
Campus Name: MANOR NEW TECHNOLOGY HIGH 2015-16 Campus Profile Grade Span: 09 - 12Campus Number: 227907004 School Type: High School
---------------- Campus ----------------Program Information Count Percent District State
Student Enrollment by Program:Bilingual/ESL Education 20 5.4% 35.7% 18.3%Career & Technical Education 357 95.7% 28.7% 24.3%Gifted & Talented Education 71 19.0% 7.3% 7.7%Special Education 9 2.4% 7.8% 8.6%
Teachers by Program (population served):Bilingual/ESL Education - - - 5.9%Career & Technical Education - - - 4.4%Compensatory Education - - - 2.9%Gifted & Talented Education - - - 1.9%Regular Education - - - 72.6%Special Education - - - 8.8%Other - - - 3.4%
Link to: PEIMS Financial Standard Reports/ 2014-2015 Financial Actual Report
' '̂ Indicates that ELL rates at met or exceeded standard and exceeded standard include current and monitored students.'*' Indicates results are masked due to small numbers to protect student confidentiality.'-' Indicates zero observations reported for this group.'n/a' Indicates data reporting is not applicable for this group.'**' Indicates that rates for Reading and Mathematics are based on the cumulative results from the first and second administrations of STAAR.'?' Indicates that the data for this item were statistically improbable, or were reported outside a reasonable range.'##' Indicates that PID Error rate information cannot be reported in 2015-16 due to the transition from PEIMS Edit+ to TSDS.

This page intentionally left blank.
2015-16 Texas Academic Performance Report
District Name: MANOR ISD
Campus Name: MANOR MIDDLE
Campus Number: 227907041
2016 Accountability Rating: Met Standard

This page intentionally left blank.
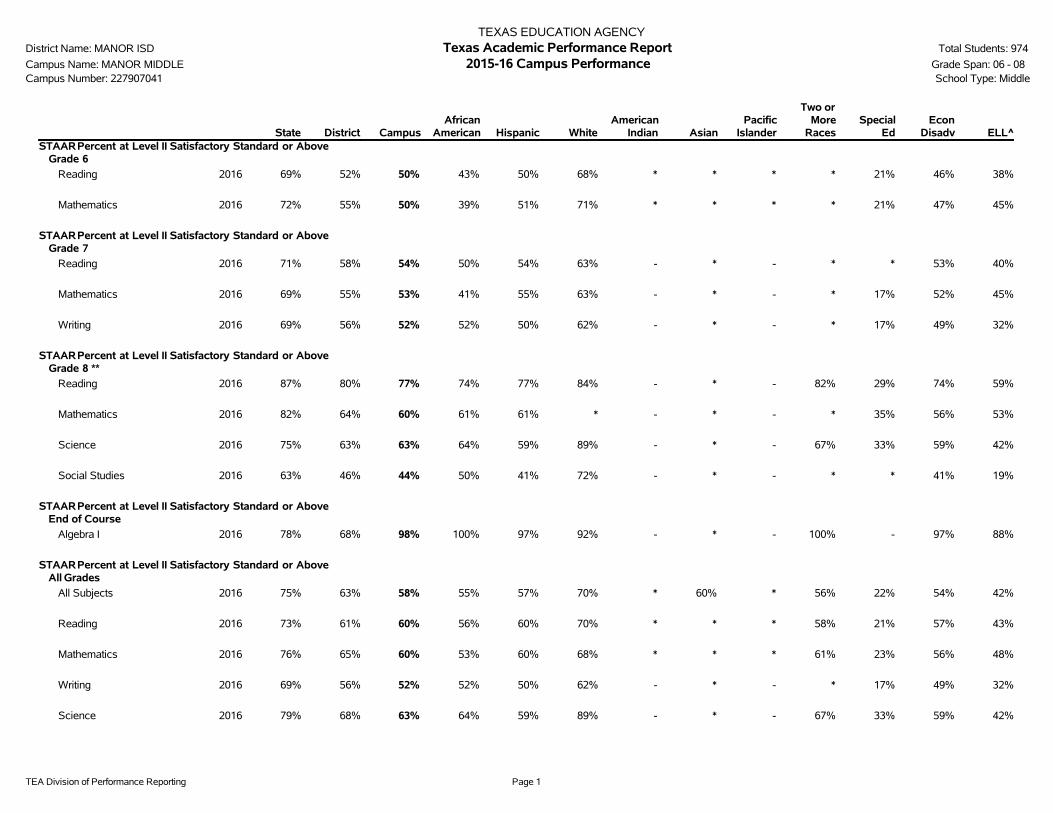
TEA Division of Performance Reporting Page 1
TEXAS EDUCATION AGENCYDistrict Name: MANOR ISD Texas Academic Performance Report Total Students: 974
Campus Name: MANOR MIDDLE 2015-16 Campus Performance Grade Span: 06 - 08Campus Number: 227907041 School Type: Middle
State District CampusAfrican
American Hispanic WhiteAmerican
Indian AsianPacific
Islander
Two orMore
RacesSpecial
EdEcon
Disadv ELL^STAARPercent at Level II Satisfactory Standard or Above
Grade 6
Reading 2016 69% 52% 50% 43% 50% 68% * * * * 21% 46% 38%
Mathematics 2016 72% 55% 50% 39% 51% 71% * * * * 21% 47% 45%
STAARPercent at Level II Satisfactory Standard or AboveGrade 7
Reading 2016 71% 58% 54% 50% 54% 63% - * - * * 53% 40%
Mathematics 2016 69% 55% 53% 41% 55% 63% - * - * 17% 52% 45%
Writing 2016 69% 56% 52% 52% 50% 62% - * - * 17% 49% 32%
STAARPercent at Level II Satisfactory Standard or AboveGrade 8 **
Reading 2016 87% 80% 77% 74% 77% 84% - * - 82% 29% 74% 59%
Mathematics 2016 82% 64% 60% 61% 61% * - * - * 35% 56% 53%
Science 2016 75% 63% 63% 64% 59% 89% - * - 67% 33% 59% 42%
Social Studies 2016 63% 46% 44% 50% 41% 72% - * - * * 41% 19%
STAARPercent at Level II Satisfactory Standard or AboveEnd of Course
Algebra I 2016 78% 68% 98% 100% 97% 92% - * - 100% - 97% 88%
STAARPercent at Level II Satisfactory Standard or AboveAll Grades
All Subjects 2016 75% 63% 58% 55% 57% 70% * 60% * 56% 22% 54% 42%
Reading 2016 73% 61% 60% 56% 60% 70% * * * 58% 21% 57% 43%
Mathematics 2016 76% 65% 60% 53% 60% 68% * * * 61% 23% 56% 48%
Writing 2016 69% 56% 52% 52% 50% 62% - * - * 17% 49% 32%
Science 2016 79% 68% 63% 64% 59% 89% - * - 67% 33% 59% 42%
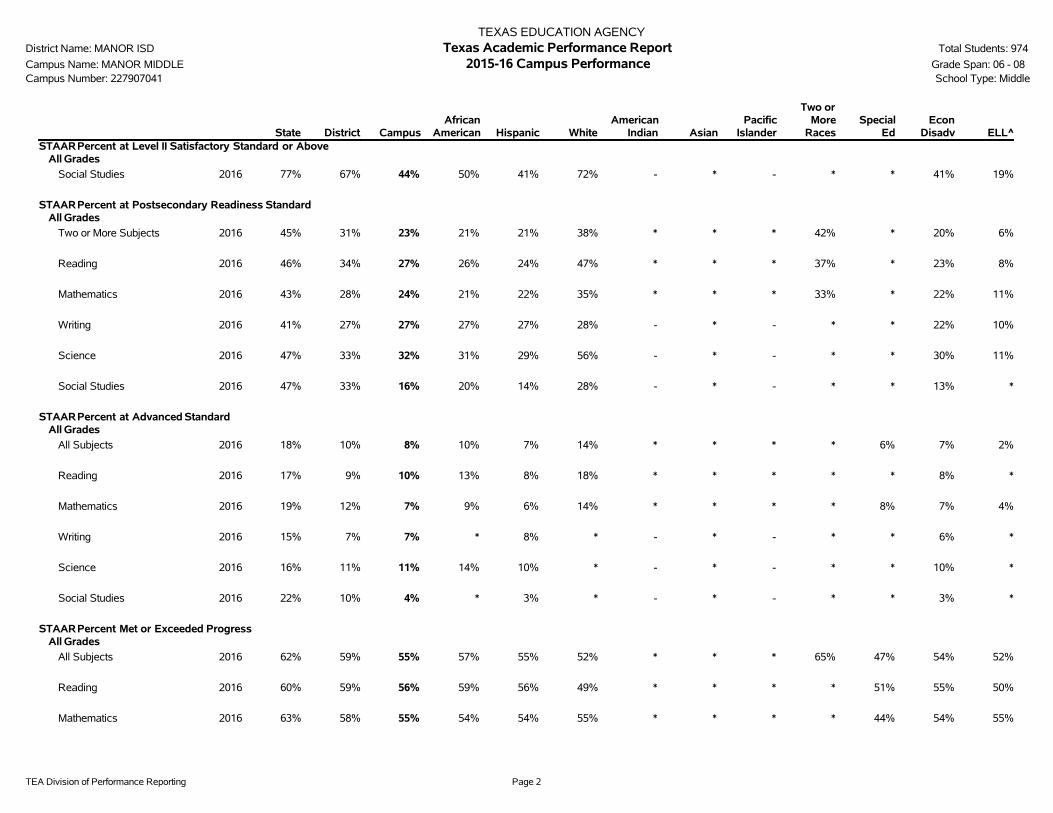
TEA Division of Performance Reporting Page 2
TEXAS EDUCATION AGENCYDistrict Name: MANOR ISD Texas Academic Performance Report Total Students: 974
Campus Name: MANOR MIDDLE 2015-16 Campus Performance Grade Span: 06 - 08Campus Number: 227907041 School Type: Middle
State District CampusAfrican
American Hispanic WhiteAmerican
Indian AsianPacific
Islander
Two orMore
RacesSpecial
EdEcon
Disadv ELL^STAARPercent at Level II Satisfactory Standard or Above
All Grades
Social Studies 2016 77% 67% 44% 50% 41% 72% - * - * * 41% 19%
STAARPercent at Postsecondary Readiness StandardAll Grades
Two or More Subjects 2016 45% 31% 23% 21% 21% 38% * * * 42% * 20% 6%
Reading 2016 46% 34% 27% 26% 24% 47% * * * 37% * 23% 8%
Mathematics 2016 43% 28% 24% 21% 22% 35% * * * 33% * 22% 11%
Writing 2016 41% 27% 27% 27% 27% 28% - * - * * 22% 10%
Science 2016 47% 33% 32% 31% 29% 56% - * - * * 30% 11%
Social Studies 2016 47% 33% 16% 20% 14% 28% - * - * * 13% *
STAARPercent at Advanced StandardAll Grades
All Subjects 2016 18% 10% 8% 10% 7% 14% * * * * 6% 7% 2%
Reading 2016 17% 9% 10% 13% 8% 18% * * * * * 8% *
Mathematics 2016 19% 12% 7% 9% 6% 14% * * * * 8% 7% 4%
Writing 2016 15% 7% 7% * 8% * - * - * * 6% *
Science 2016 16% 11% 11% 14% 10% * - * - * * 10% *
Social Studies 2016 22% 10% 4% * 3% * - * - * * 3% *
STAARPercent Met or Exceeded ProgressAll Grades
All Subjects 2016 62% 59% 55% 57% 55% 52% * * * 65% 47% 54% 52%
Reading 2016 60% 59% 56% 59% 56% 49% * * * * 51% 55% 50%
Mathematics 2016 63% 58% 55% 54% 54% 55% * * * * 44% 54% 55%
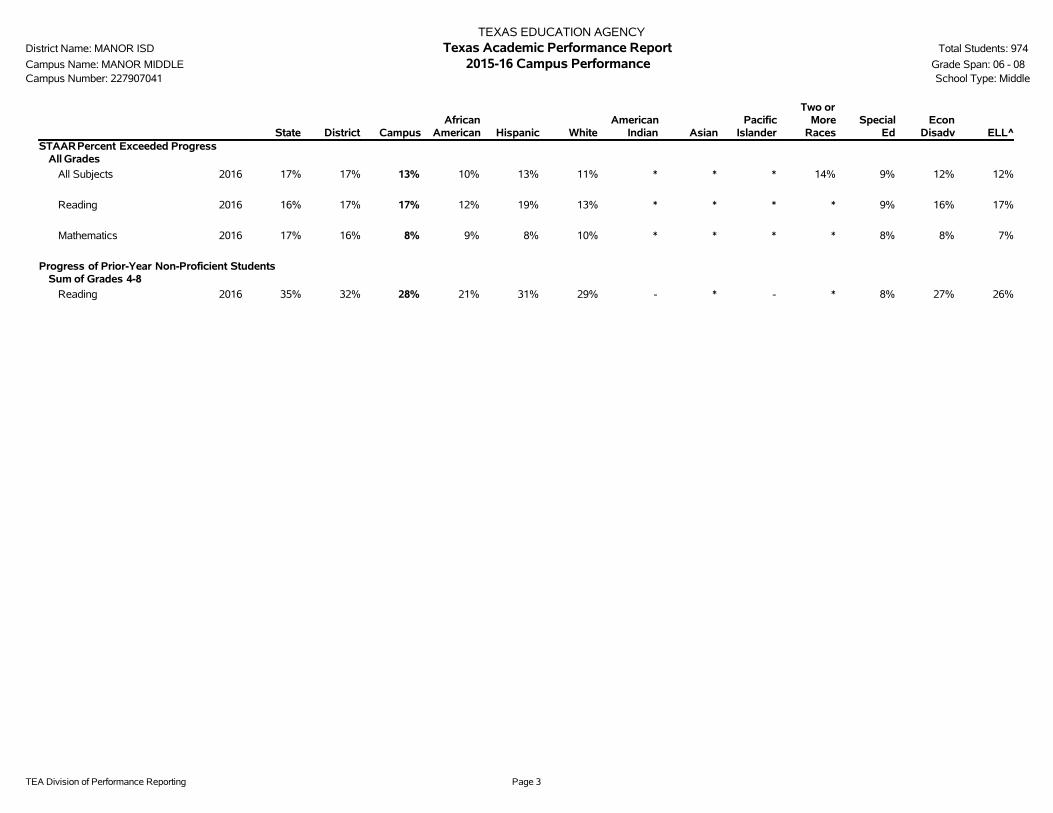
TEA Division of Performance Reporting Page 3
TEXAS EDUCATION AGENCYDistrict Name: MANOR ISD Texas Academic Performance Report Total Students: 974
Campus Name: MANOR MIDDLE 2015-16 Campus Performance Grade Span: 06 - 08Campus Number: 227907041 School Type: Middle
State District CampusAfrican
American Hispanic WhiteAmerican
Indian AsianPacific
Islander
Two orMore
RacesSpecial
EdEcon
Disadv ELL^STAARPercent Exceeded Progress
All Grades
All Subjects 2016 17% 17% 13% 10% 13% 11% * * * 14% 9% 12% 12%
Reading 2016 16% 17% 17% 12% 19% 13% * * * * 9% 16% 17%
Mathematics 2016 17% 16% 8% 9% 8% 10% * * * * 8% 8% 7%
Progress of Prior-Year Non-Proficient StudentsSum of Grades 4-8
Reading 2016 35% 32% 28% 21% 31% 29% - * - * 8% 27% 26%
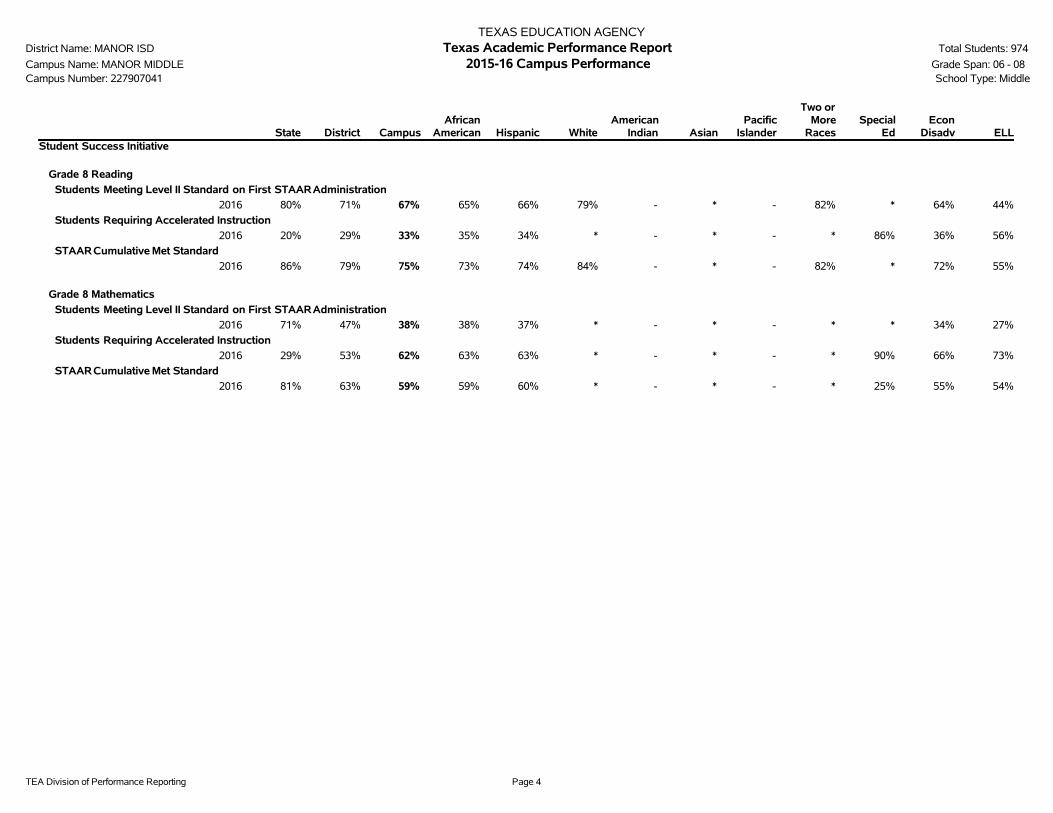
TEA Division of Performance Reporting Page 4
TEXAS EDUCATION AGENCYDistrict Name: MANOR ISD Texas Academic Performance Report Total Students: 974
Campus Name: MANOR MIDDLE 2015-16 Campus Performance Grade Span: 06 - 08Campus Number: 227907041 School Type: Middle
State District CampusAfrican
American Hispanic WhiteAmerican
Indian AsianPacific
Islander
Two orMore
RacesSpecial
EdEcon
Disadv ELLStudent Success Initiative
Grade 8 Reading
Students Meeting Level II Standard on First STAARAdministration
2016 80% 71% 67% 65% 66% 79% - * - 82% * 64% 44%
Students Requiring Accelerated Instruction
2016 20% 29% 33% 35% 34% * - * - * 86% 36% 56%
STAARCumulative Met Standard
2016 86% 79% 75% 73% 74% 84% - * - 82% * 72% 55%
Grade 8 Mathematics
Students Meeting Level II Standard on First STAARAdministration
2016 71% 47% 38% 38% 37% * - * - * * 34% 27%
Students Requiring Accelerated Instruction
2016 29% 53% 62% 63% 63% * - * - * 90% 66% 73%
STAARCumulative Met Standard
2016 81% 63% 59% 59% 60% * - * - * 25% 55% 54%
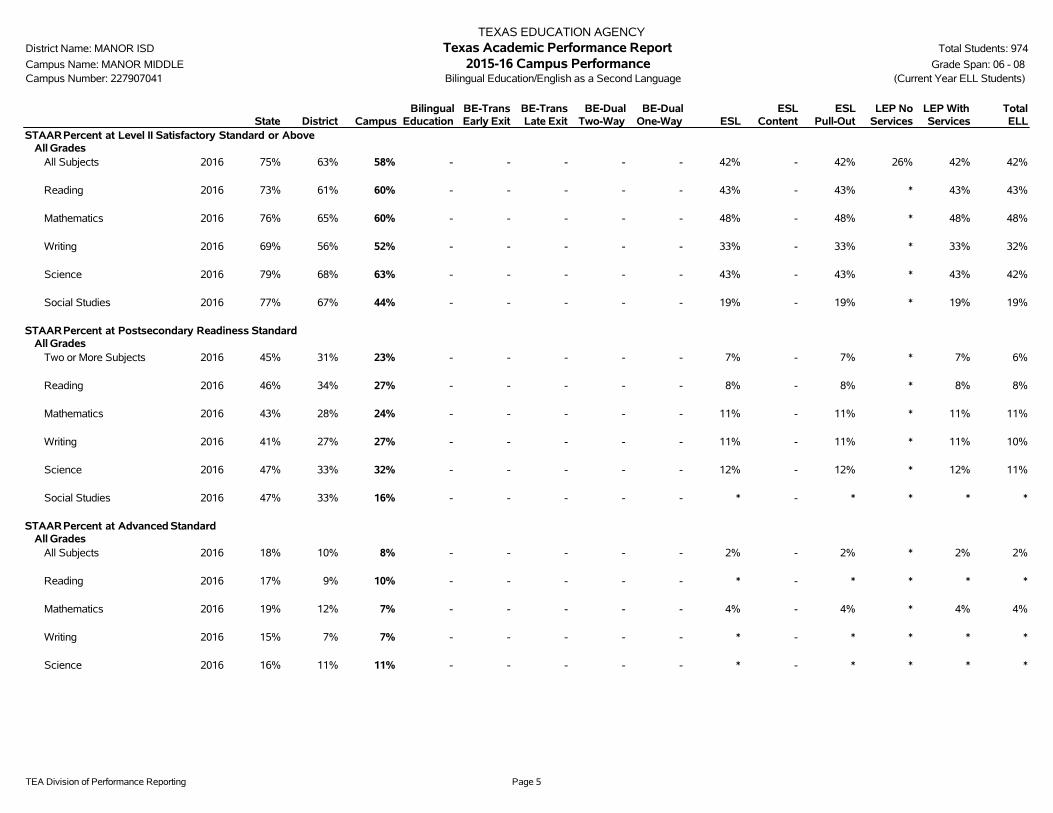
TEA Division of Performance Reporting Page 5
TEXAS EDUCATION AGENCYDistrict Name: MANOR ISD Texas Academic Performance Report Total Students: 974
Campus Name: MANOR MIDDLE 2015-16 Campus Performance Grade Span: 06 - 08Campus Number: 227907041 Bilingual Education/English as a Second Language (Current Year ELL Students)
State District CampusBilingual
EducationBE-TransEarly Exit
BE-TransLate Exit
BE-DualTwo-Way
BE-DualOne-Way ESL
ESLContent
ESLPull-Out
LEP NoServices
LEP WithServices
TotalELL
STAARPercent at Level II Satisfactory Standard or AboveAll Grades
All Subjects 2016 75% 63% 58% - - - - - 42% - 42% 26% 42% 42%
Reading 2016 73% 61% 60% - - - - - 43% - 43% * 43% 43%
Mathematics 2016 76% 65% 60% - - - - - 48% - 48% * 48% 48%
Writing 2016 69% 56% 52% - - - - - 33% - 33% * 33% 32%
Science 2016 79% 68% 63% - - - - - 43% - 43% * 43% 42%
Social Studies 2016 77% 67% 44% - - - - - 19% - 19% * 19% 19%
STAARPercent at Postsecondary Readiness StandardAll Grades
Two or More Subjects 2016 45% 31% 23% - - - - - 7% - 7% * 7% 6%
Reading 2016 46% 34% 27% - - - - - 8% - 8% * 8% 8%
Mathematics 2016 43% 28% 24% - - - - - 11% - 11% * 11% 11%
Writing 2016 41% 27% 27% - - - - - 11% - 11% * 11% 10%
Science 2016 47% 33% 32% - - - - - 12% - 12% * 12% 11%
Social Studies 2016 47% 33% 16% - - - - - * - * * * *
STAARPercent at Advanced StandardAll Grades
All Subjects 2016 18% 10% 8% - - - - - 2% - 2% * 2% 2%
Reading 2016 17% 9% 10% - - - - - * - * * * *
Mathematics 2016 19% 12% 7% - - - - - 4% - 4% * 4% 4%
Writing 2016 15% 7% 7% - - - - - * - * * * *
Science 2016 16% 11% 11% - - - - - * - * * * *
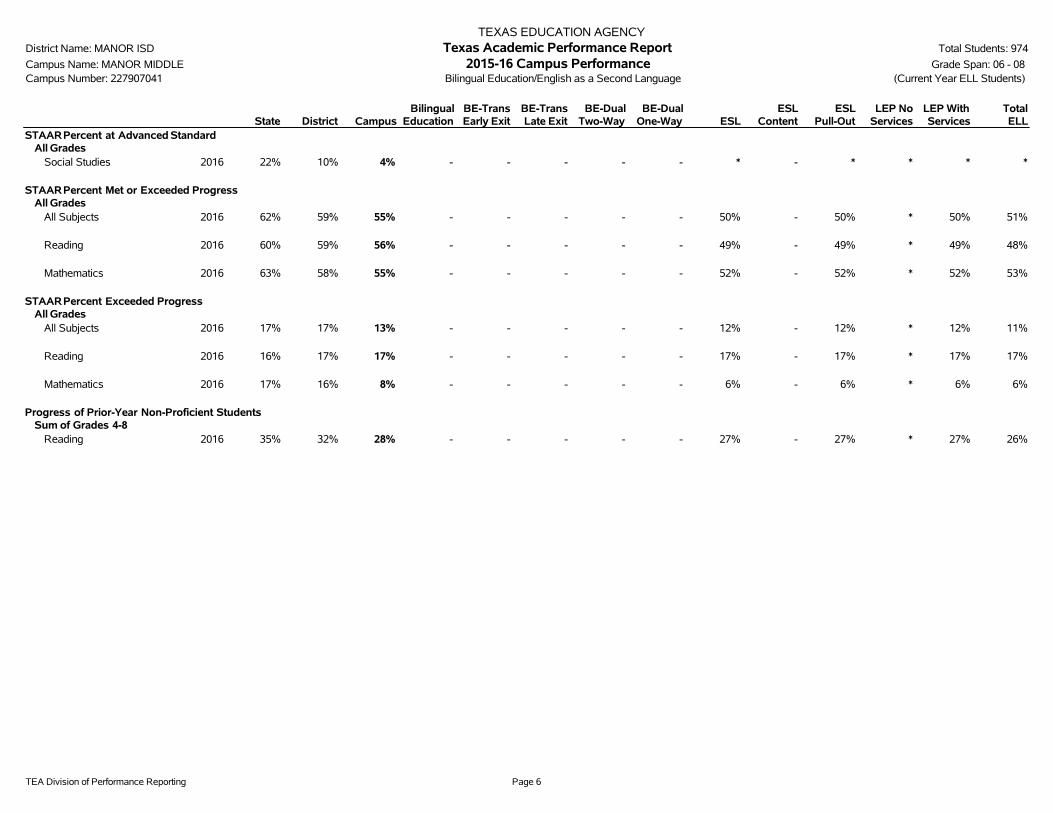
TEA Division of Performance Reporting Page 6
TEXAS EDUCATION AGENCYDistrict Name: MANOR ISD Texas Academic Performance Report Total Students: 974
Campus Name: MANOR MIDDLE 2015-16 Campus Performance Grade Span: 06 - 08Campus Number: 227907041 Bilingual Education/English as a Second Language (Current Year ELL Students)
State District CampusBilingual
EducationBE-TransEarly Exit
BE-TransLate Exit
BE-DualTwo-Way
BE-DualOne-Way ESL
ESLContent
ESLPull-Out
LEP NoServices
LEP WithServices
TotalELL
STAARPercent at Advanced StandardAll Grades
Social Studies 2016 22% 10% 4% - - - - - * - * * * *
STAARPercent Met or Exceeded ProgressAll Grades
All Subjects 2016 62% 59% 55% - - - - - 50% - 50% * 50% 51%
Reading 2016 60% 59% 56% - - - - - 49% - 49% * 49% 48%
Mathematics 2016 63% 58% 55% - - - - - 52% - 52% * 52% 53%
STAARPercent Exceeded ProgressAll Grades
All Subjects 2016 17% 17% 13% - - - - - 12% - 12% * 12% 11%
Reading 2016 16% 17% 17% - - - - - 17% - 17% * 17% 17%
Mathematics 2016 17% 16% 8% - - - - - 6% - 6% * 6% 6%
Progress of Prior-Year Non-Proficient StudentsSum of Grades 4-8
Reading 2016 35% 32% 28% - - - - - 27% - 27% * 27% 26%
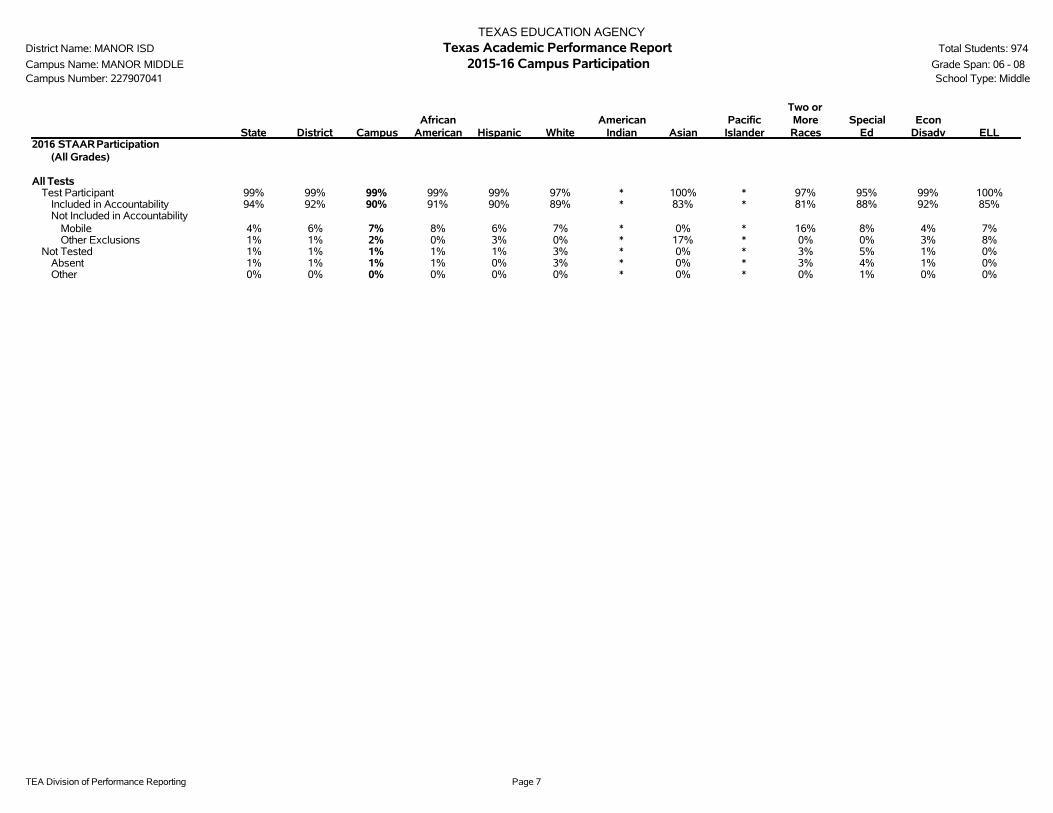
TEA Division of Performance Reporting Page 7
TEXAS EDUCATION AGENCYDistrict Name: MANOR ISD Texas Academic Performance Report Total Students: 974
Campus Name: MANOR MIDDLE 2015-16 Campus Participation Grade Span: 06 - 08Campus Number: 227907041 School Type: Middle
State District CampusAfrican
American Hispanic WhiteAmerican
Indian AsianPacific
Islander
Two orMoreRaces
SpecialEd
EconDisadv ELL
2016 STAARParticipation(All Grades)
All TestsTest Participant 99% 99% 99% 99% 99% 97% * 100% * 97% 95% 99% 100%
Included in Accountability 94% 92% 90% 91% 90% 89% * 83% * 81% 88% 92% 85%Not Included in Accountability
Mobile 4% 6% 7% 8% 6% 7% * 0% * 16% 8% 4% 7%Other Exclusions 1% 1% 2% 0% 3% 0% * 17% * 0% 0% 3% 8%
Not Tested 1% 1% 1% 1% 1% 3% * 0% * 3% 5% 1% 0%Absent 1% 1% 1% 1% 0% 3% * 0% * 3% 4% 1% 0%Other 0% 0% 0% 0% 0% 0% * 0% * 0% 1% 0% 0%
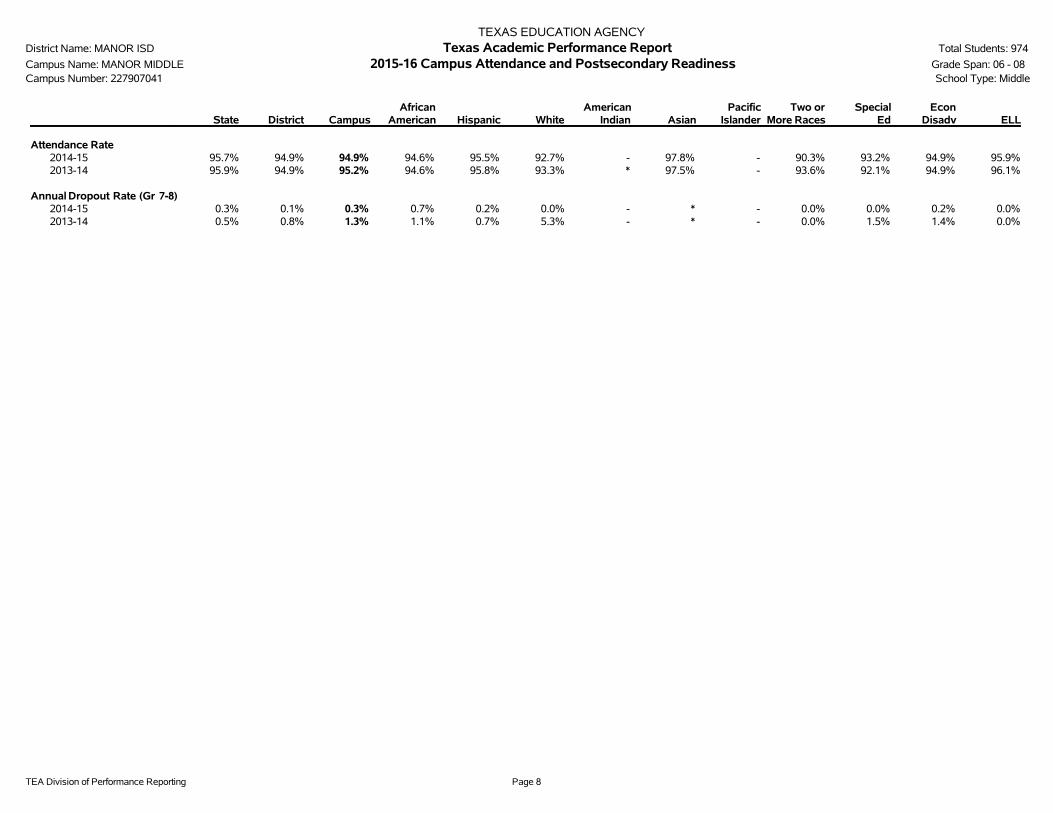
TEA Division of Performance Reporting Page 8
TEXAS EDUCATION AGENCYDistrict Name: MANOR ISD Texas Academic Performance Report Total Students: 974
Campus Name: MANOR MIDDLE 2015-16 Campus Attendance and Postsecondary Readiness Grade Span: 06 - 08Campus Number: 227907041 School Type: Middle
State District CampusAfrican
American Hispanic WhiteAmerican
Indian AsianPacific
IslanderTwo or
More RacesSpecial
EdEcon
Disadv ELL
Attendance Rate2014-15 95.7% 94.9% 94.9% 94.6% 95.5% 92.7% - 97.8% - 90.3% 93.2% 94.9% 95.9%2013-14 95.9% 94.9% 95.2% 94.6% 95.8% 93.3% * 97.5% - 93.6% 92.1% 94.9% 96.1%
Annual Dropout Rate (Gr 7-8)2014-15 0.3% 0.1% 0.3% 0.7% 0.2% 0.0% - * - 0.0% 0.0% 0.2% 0.0%2013-14 0.5% 0.8% 1.3% 1.1% 0.7% 5.3% - * - 0.0% 1.5% 1.4% 0.0%

TEA Division of Performance Reporting Page 9
TEXAS EDUCATION AGENCYDistrict Name: MANOR ISD Texas Academic Performance Report Total Students: 974
Campus Name: MANOR MIDDLE 2015-16 Campus Profile Grade Span: 06 - 08Campus Number: 227907041 School Type: Middle
---------------- Campus ----------------Student Information Count Percent District State
Total Students: 974 100.0% 8,856 5,284,252
Students by Grade:Early Childhood Education 0 0.0% 0.3% 0.2%Pre-Kindergarten 0 0.0% 8.6% 4.2%Kindergarten 0 0.0% 7.0% 7.1%Grade 1 0 0.0% 8.0% 7.8%Grade 2 0 0.0% 7.9% 7.8%Grade 3 0 0.0% 7.8% 7.7%Grade 4 0 0.0% 8.1% 7.5%Grade 5 0 0.0% 7.3% 7.5%Grade 6 325 33.4% 6.9% 7.4%Grade 7 323 33.2% 6.8% 7.4%Grade 8 326 33.5% 6.9% 7.3%Grade 9 0 0.0% 7.4% 8.1%Grade 10 0 0.0% 6.3% 7.3%Grade 11 0 0.0% 5.2% 6.7%Grade 12 0 0.0% 5.5% 6.1%
Ethnic Distribution:African American 186 19.1% 21.5% 12.6%Hispanic 668 68.6% 64.1% 52.2%White 92 9.4% 8.6% 28.5%American Indian 2 0.2% 0.2% 0.4%Asian 6 0.6% 3.0% 4.0%Pacific Islander 1 0.1% 0.2% 0.1%Two or More Races 19 2.0% 2.3% 2.1%
Economically Disadvantaged 781 80.2% 73.2% 59.0%Non-Educationally Disadvantaged 193 19.8% 26.8% 41.0%English Language Learners (ELL) 272 27.9% 36.0% 18.5%Students w/ Disciplinary Placements (2014-2015) 56 5.4% 2.0% 1.4%At-Risk 570 58.5% 60.5% 50.1%Mobility (2014-2015) 147 14.3% 19.8% 16.5%
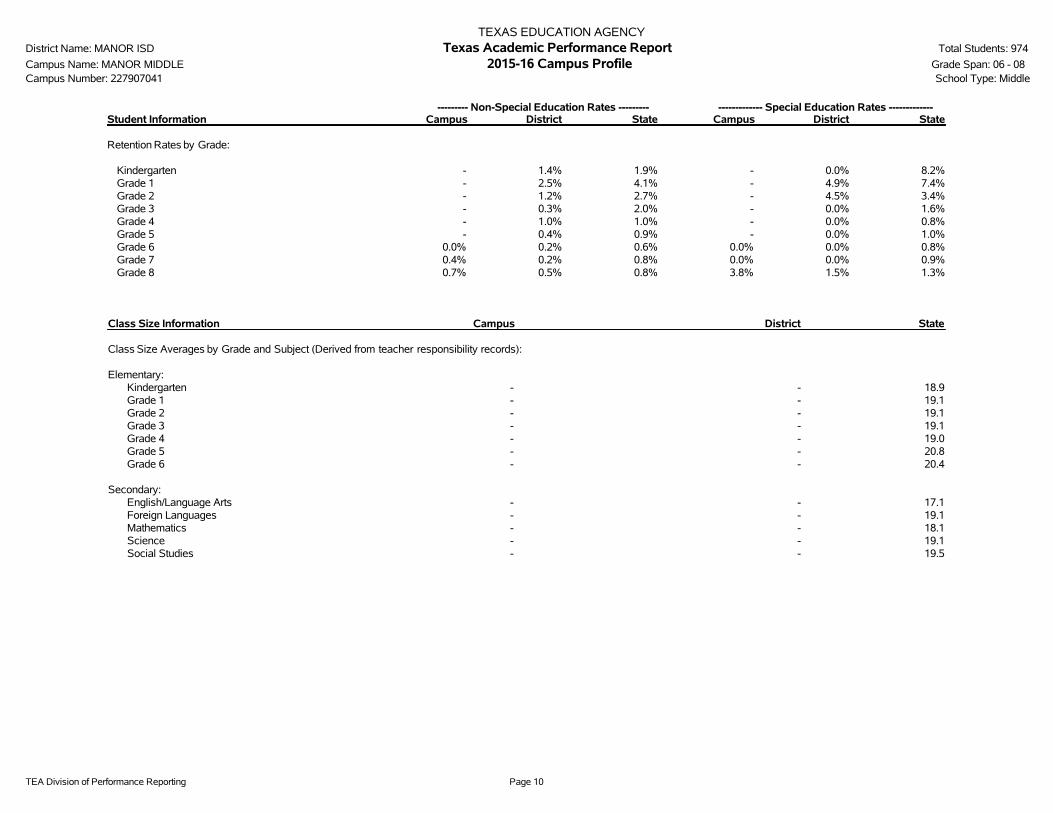
TEA Division of Performance Reporting Page 10
TEXAS EDUCATION AGENCYDistrict Name: MANOR ISD Texas Academic Performance Report Total Students: 974
Campus Name: MANOR MIDDLE 2015-16 Campus Profile Grade Span: 06 - 08Campus Number: 227907041 School Type: Middle
--------- Non-Special Education Rates --------- ------------- Special Education Rates -------------Student Information Campus District State Campus District State
Retention Rates by Grade:
Kindergarten - 1.4% 1.9% - 0.0% 8.2%Grade 1 - 2.5% 4.1% - 4.9% 7.4%Grade 2 - 1.2% 2.7% - 4.5% 3.4%Grade 3 - 0.3% 2.0% - 0.0% 1.6%Grade 4 - 1.0% 1.0% - 0.0% 0.8%Grade 5 - 0.4% 0.9% - 0.0% 1.0%Grade 6 0.0% 0.2% 0.6% 0.0% 0.0% 0.8%Grade 7 0.4% 0.2% 0.8% 0.0% 0.0% 0.9%Grade 8 0.7% 0.5% 0.8% 3.8% 1.5% 1.3%
Class Size Information Campus District State
Class Size Averages by Grade and Subject (Derived from teacher responsibility records):
Elementary:Kindergarten - - 18.9Grade 1 - - 19.1Grade 2 - - 19.1Grade 3 - - 19.1Grade 4 - - 19.0Grade 5 - - 20.8Grade 6 - - 20.4
Secondary:English/Language Arts - - 17.1Foreign Languages - - 19.1Mathematics - - 18.1Science - - 19.1Social Studies - - 19.5
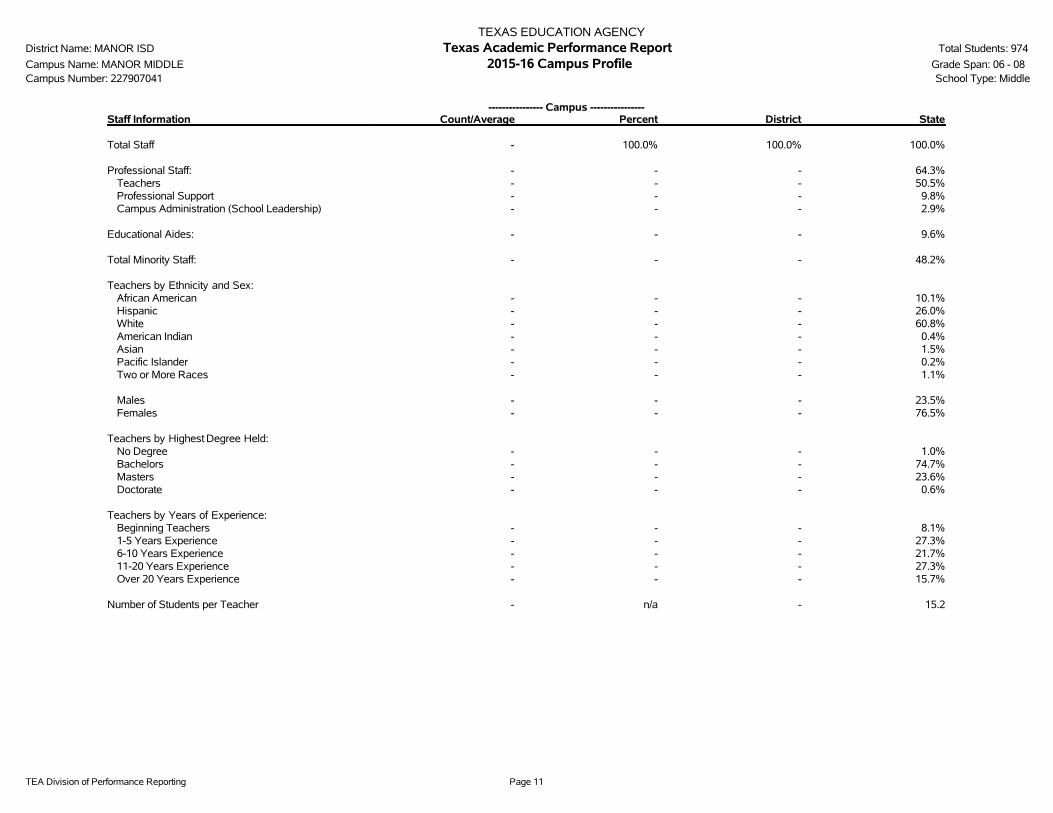
TEA Division of Performance Reporting Page 11
TEXAS EDUCATION AGENCYDistrict Name: MANOR ISD Texas Academic Performance Report Total Students: 974
Campus Name: MANOR MIDDLE 2015-16 Campus Profile Grade Span: 06 - 08Campus Number: 227907041 School Type: Middle
---------------- Campus ----------------Staff Information Count/Average Percent District State
Total Staff - 100.0% 100.0% 100.0%
Professional Staff: - - - 64.3%Teachers - - - 50.5%Professional Support - - - 9.8%Campus Administration (School Leadership) - - - 2.9%
Educational Aides: - - - 9.6%
Total Minority Staff: - - - 48.2%
Teachers by Ethnicity and Sex:African American - - - 10.1%Hispanic - - - 26.0%White - - - 60.8%American Indian - - - 0.4%Asian - - - 1.5%Pacific Islander - - - 0.2%Two or More Races - - - 1.1%
Males - - - 23.5%Females - - - 76.5%
Teachers by Highest Degree Held:No Degree - - - 1.0%Bachelors - - - 74.7%Masters - - - 23.6%Doctorate - - - 0.6%
Teachers by Years of Experience:Beginning Teachers - - - 8.1%1-5 Years Experience - - - 27.3%6-10 Years Experience - - - 21.7%11-20 Years Experience - - - 27.3%Over 20 Years Experience - - - 15.7%
Number of Students per Teacher - n/a - 15.2
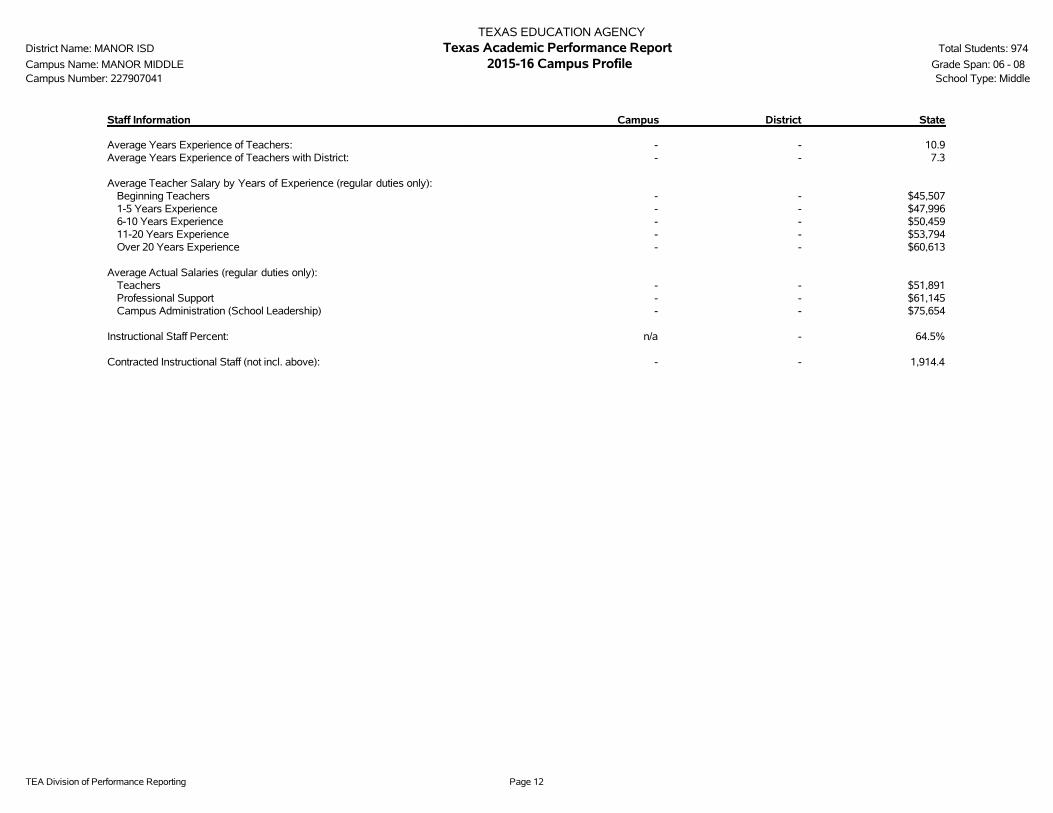
TEA Division of Performance Reporting Page 12
TEXAS EDUCATION AGENCYDistrict Name: MANOR ISD Texas Academic Performance Report Total Students: 974
Campus Name: MANOR MIDDLE 2015-16 Campus Profile Grade Span: 06 - 08Campus Number: 227907041 School Type: Middle
Staff Information Campus District State
Average Years Experience of Teachers: - - 10.9Average Years Experience of Teachers with District: - - 7.3
Average Teacher Salary by Years of Experience (regular duties only):Beginning Teachers - - $45,5071-5 Years Experience - - $47,9966-10 Years Experience - - $50,45911-20 Years Experience - - $53,794Over 20 Years Experience - - $60,613
Average Actual Salaries (regular duties only):Teachers - - $51,891Professional Support - - $61,145Campus Administration (School Leadership) - - $75,654
Instructional Staff Percent: n/a - 64.5%
Contracted Instructional Staff (not incl. above): - - 1,914.4
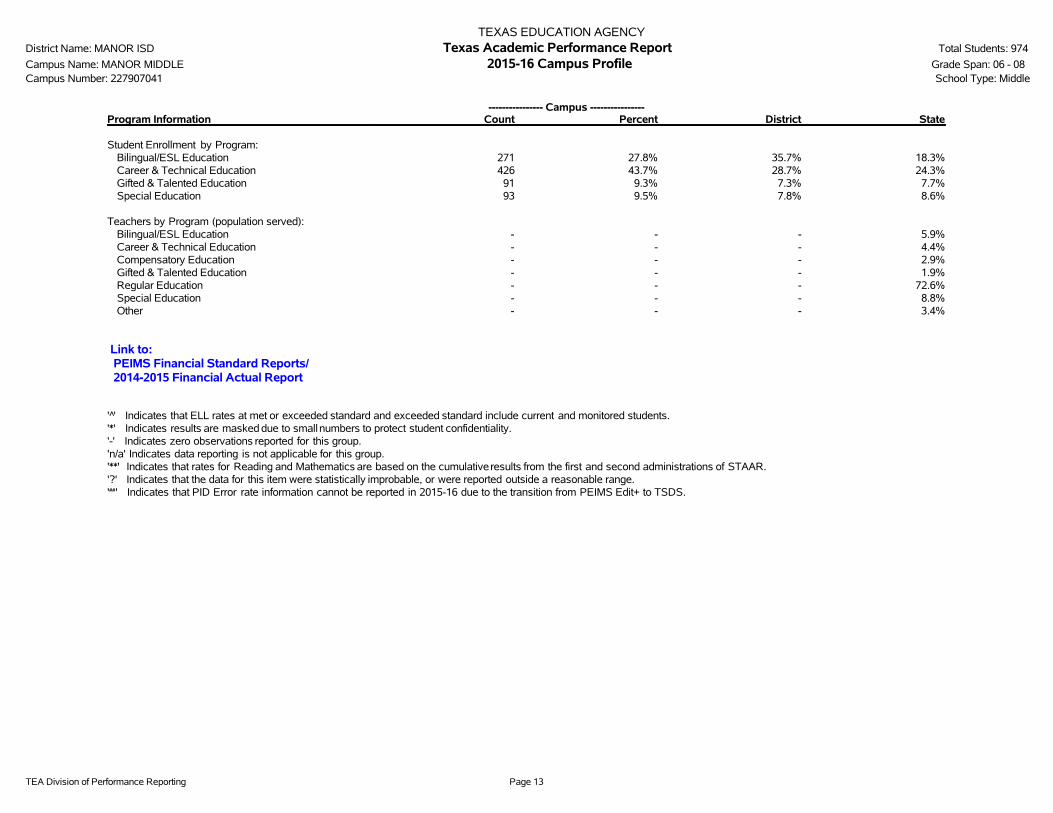
TEA Division of Performance Reporting Page 13
TEXAS EDUCATION AGENCYDistrict Name: MANOR ISD Texas Academic Performance Report Total Students: 974
Campus Name: MANOR MIDDLE 2015-16 Campus Profile Grade Span: 06 - 08Campus Number: 227907041 School Type: Middle
---------------- Campus ----------------Program Information Count Percent District State
Student Enrollment by Program:Bilingual/ESL Education 271 27.8% 35.7% 18.3%Career & Technical Education 426 43.7% 28.7% 24.3%Gifted & Talented Education 91 9.3% 7.3% 7.7%Special Education 93 9.5% 7.8% 8.6%
Teachers by Program (population served):Bilingual/ESL Education - - - 5.9%Career & Technical Education - - - 4.4%Compensatory Education - - - 2.9%Gifted & Talented Education - - - 1.9%Regular Education - - - 72.6%Special Education - - - 8.8%Other - - - 3.4%
Link to: PEIMS Financial Standard Reports/ 2014-2015 Financial Actual Report
' '̂ Indicates that ELL rates at met or exceeded standard and exceeded standard include current and monitored students.'*' Indicates results are masked due to small numbers to protect student confidentiality.'-' Indicates zero observations reported for this group.'n/a' Indicates data reporting is not applicable for this group.'**' Indicates that rates for Reading and Mathematics are based on the cumulative results from the first and second administrations of STAAR.'?' Indicates that the data for this item were statistically improbable, or were reported outside a reasonable range.'##' Indicates that PID Error rate information cannot be reported in 2015-16 due to the transition from PEIMS Edit+ to TSDS.

This page intentionally left blank.
2015-16 Texas Academic Performance Report
District Name: MANOR ISD
Campus Name: DECKER MIDDLE
Campus Number: 227907042
2016 Accountability Rating: Met Standard
Distinction Designations:
Academic Achievement in English Language Arts/Reading
Top 25 Percent: Student Progress

This page intentionally left blank.
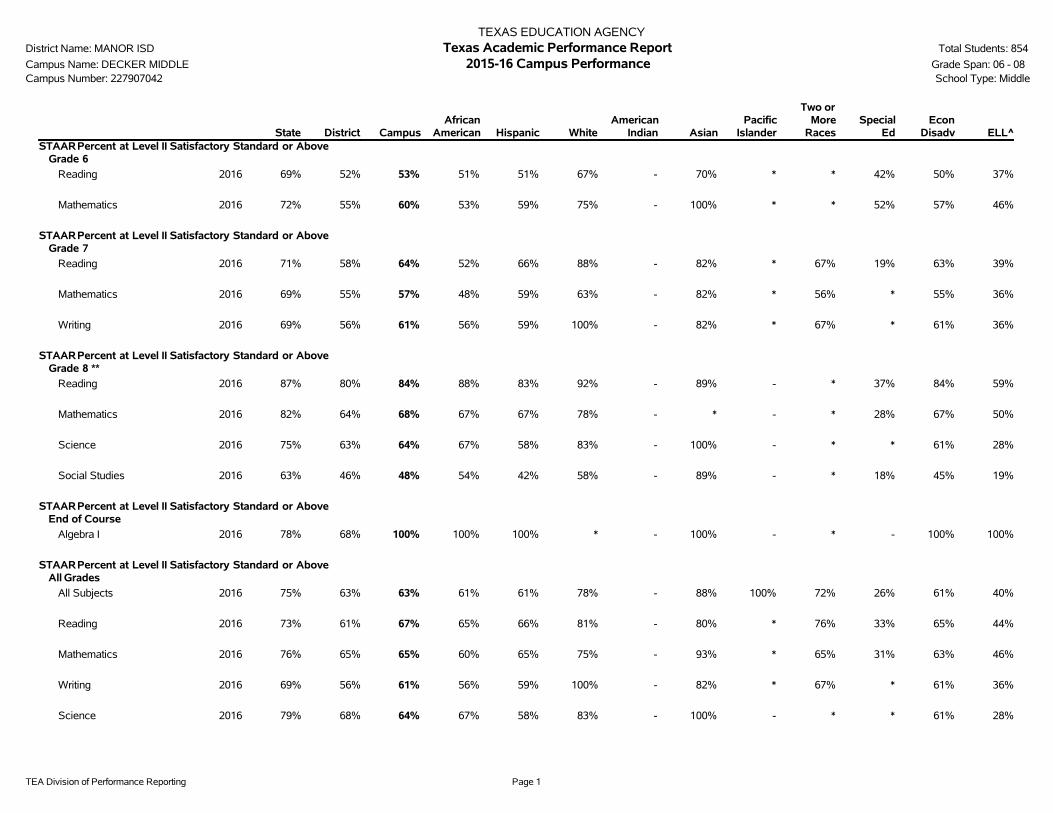
TEA Division of Performance Reporting Page 1
TEXAS EDUCATION AGENCYDistrict Name: MANOR ISD Texas Academic Performance Report Total Students: 854
Campus Name: DECKER MIDDLE 2015-16 Campus Performance Grade Span: 06 - 08Campus Number: 227907042 School Type: Middle
State District CampusAfrican
American Hispanic WhiteAmerican
Indian AsianPacific
Islander
Two orMore
RacesSpecial
EdEcon
Disadv ELL^STAARPercent at Level II Satisfactory Standard or Above
Grade 6
Reading 2016 69% 52% 53% 51% 51% 67% - 70% * * 42% 50% 37%
Mathematics 2016 72% 55% 60% 53% 59% 75% - 100% * * 52% 57% 46%
STAARPercent at Level II Satisfactory Standard or AboveGrade 7
Reading 2016 71% 58% 64% 52% 66% 88% - 82% * 67% 19% 63% 39%
Mathematics 2016 69% 55% 57% 48% 59% 63% - 82% * 56% * 55% 36%
Writing 2016 69% 56% 61% 56% 59% 100% - 82% * 67% * 61% 36%
STAARPercent at Level II Satisfactory Standard or AboveGrade 8 **
Reading 2016 87% 80% 84% 88% 83% 92% - 89% - * 37% 84% 59%
Mathematics 2016 82% 64% 68% 67% 67% 78% - * - * 28% 67% 50%
Science 2016 75% 63% 64% 67% 58% 83% - 100% - * * 61% 28%
Social Studies 2016 63% 46% 48% 54% 42% 58% - 89% - * 18% 45% 19%
STAARPercent at Level II Satisfactory Standard or AboveEnd of Course
Algebra I 2016 78% 68% 100% 100% 100% * - 100% - * - 100% 100%
STAARPercent at Level II Satisfactory Standard or AboveAll Grades
All Subjects 2016 75% 63% 63% 61% 61% 78% - 88% 100% 72% 26% 61% 40%
Reading 2016 73% 61% 67% 65% 66% 81% - 80% * 76% 33% 65% 44%
Mathematics 2016 76% 65% 65% 60% 65% 75% - 93% * 65% 31% 63% 46%
Writing 2016 69% 56% 61% 56% 59% 100% - 82% * 67% * 61% 36%
Science 2016 79% 68% 64% 67% 58% 83% - 100% - * * 61% 28%
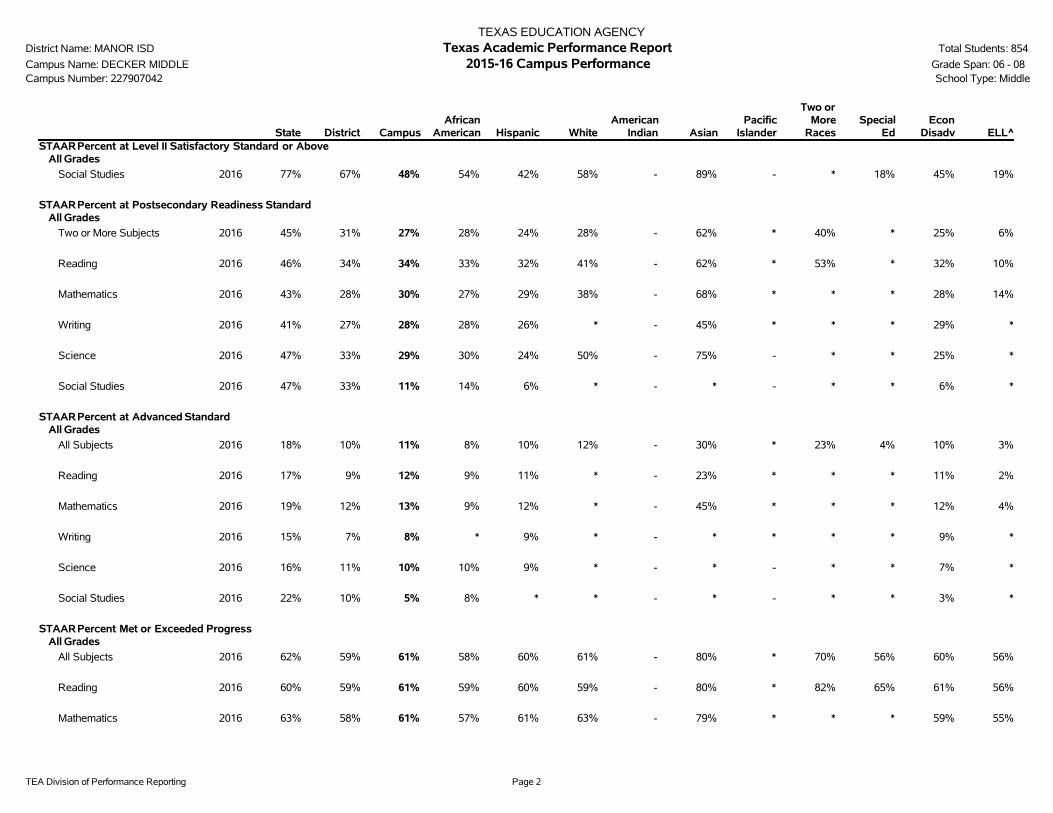
TEA Division of Performance Reporting Page 2
TEXAS EDUCATION AGENCYDistrict Name: MANOR ISD Texas Academic Performance Report Total Students: 854
Campus Name: DECKER MIDDLE 2015-16 Campus Performance Grade Span: 06 - 08Campus Number: 227907042 School Type: Middle
State District CampusAfrican
American Hispanic WhiteAmerican
Indian AsianPacific
Islander
Two orMore
RacesSpecial
EdEcon
Disadv ELL^STAARPercent at Level II Satisfactory Standard or Above
All Grades
Social Studies 2016 77% 67% 48% 54% 42% 58% - 89% - * 18% 45% 19%
STAARPercent at Postsecondary Readiness StandardAll Grades
Two or More Subjects 2016 45% 31% 27% 28% 24% 28% - 62% * 40% * 25% 6%
Reading 2016 46% 34% 34% 33% 32% 41% - 62% * 53% * 32% 10%
Mathematics 2016 43% 28% 30% 27% 29% 38% - 68% * * * 28% 14%
Writing 2016 41% 27% 28% 28% 26% * - 45% * * * 29% *
Science 2016 47% 33% 29% 30% 24% 50% - 75% - * * 25% *
Social Studies 2016 47% 33% 11% 14% 6% * - * - * * 6% *
STAARPercent at Advanced StandardAll Grades
All Subjects 2016 18% 10% 11% 8% 10% 12% - 30% * 23% 4% 10% 3%
Reading 2016 17% 9% 12% 9% 11% * - 23% * * * 11% 2%
Mathematics 2016 19% 12% 13% 9% 12% * - 45% * * * 12% 4%
Writing 2016 15% 7% 8% * 9% * - * * * * 9% *
Science 2016 16% 11% 10% 10% 9% * - * - * * 7% *
Social Studies 2016 22% 10% 5% 8% * * - * - * * 3% *
STAARPercent Met or Exceeded ProgressAll Grades
All Subjects 2016 62% 59% 61% 58% 60% 61% - 80% * 70% 56% 60% 56%
Reading 2016 60% 59% 61% 59% 60% 59% - 80% * 82% 65% 61% 56%
Mathematics 2016 63% 58% 61% 57% 61% 63% - 79% * * * 59% 55%
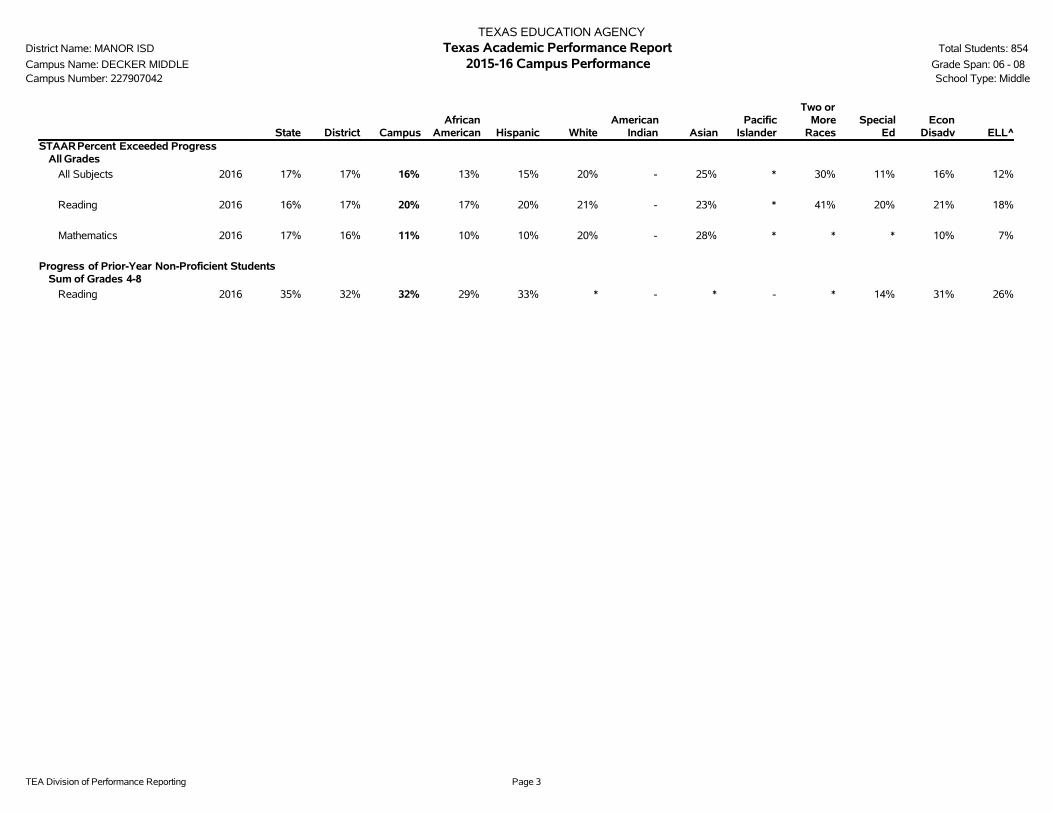
TEA Division of Performance Reporting Page 3
TEXAS EDUCATION AGENCYDistrict Name: MANOR ISD Texas Academic Performance Report Total Students: 854
Campus Name: DECKER MIDDLE 2015-16 Campus Performance Grade Span: 06 - 08Campus Number: 227907042 School Type: Middle
State District CampusAfrican
American Hispanic WhiteAmerican
Indian AsianPacific
Islander
Two orMore
RacesSpecial
EdEcon
Disadv ELL^STAARPercent Exceeded Progress
All Grades
All Subjects 2016 17% 17% 16% 13% 15% 20% - 25% * 30% 11% 16% 12%
Reading 2016 16% 17% 20% 17% 20% 21% - 23% * 41% 20% 21% 18%
Mathematics 2016 17% 16% 11% 10% 10% 20% - 28% * * * 10% 7%
Progress of Prior-Year Non-Proficient StudentsSum of Grades 4-8
Reading 2016 35% 32% 32% 29% 33% * - * - * 14% 31% 26%

TEA Division of Performance Reporting Page 4
TEXAS EDUCATION AGENCYDistrict Name: MANOR ISD Texas Academic Performance Report Total Students: 854
Campus Name: DECKER MIDDLE 2015-16 Campus Performance Grade Span: 06 - 08Campus Number: 227907042 School Type: Middle
State District CampusAfrican
American Hispanic WhiteAmerican
Indian AsianPacific
Islander
Two orMore
RacesSpecial
EdEcon
Disadv ELLStudent Success Initiative
Grade 8 Reading
Students Meeting Level II Standard on First STAARAdministration
2016 80% 71% 76% 76% 75% 92% - 78% - * 19% 74% 43%
Students Requiring Accelerated Instruction
2016 20% 29% 24% 24% 25% * - * - * 81% 26% 57%
STAARCumulative Met Standard
2016 86% 79% 84% 87% 83% 92% - 89% - * 33% 84% 59%
STAARNon-Proficient Students Promoted by Grade Placement Committee
2015 97% * * * * - - - - - * * *
Grade 8 Mathematics
Students Meeting Level II Standard on First STAARAdministration
2016 71% 47% 57% 56% 57% 67% - * - * 19% 55% 41%
Students Requiring Accelerated Instruction
2016 29% 53% 43% 44% 43% * - * - * 81% 45% 59%
STAARCumulative Met Standard
2016 81% 63% 68% 66% 67% 78% - * - * 23% 67% 50%
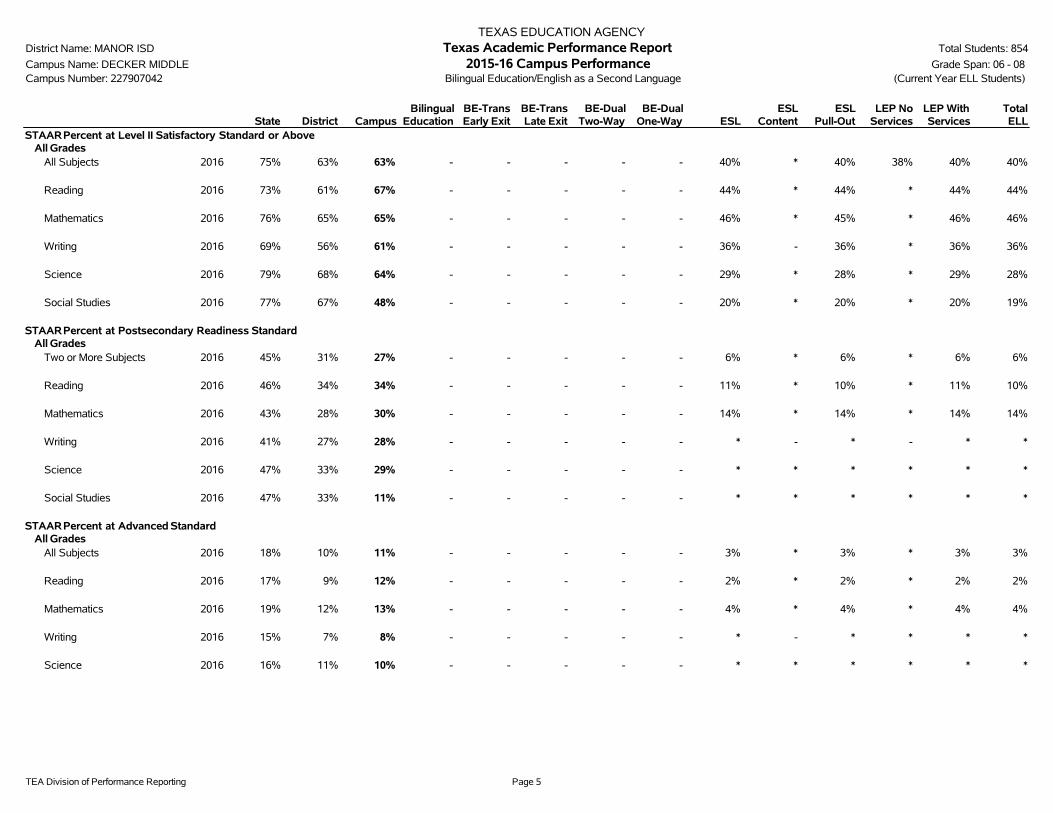
TEA Division of Performance Reporting Page 5
TEXAS EDUCATION AGENCYDistrict Name: MANOR ISD Texas Academic Performance Report Total Students: 854
Campus Name: DECKER MIDDLE 2015-16 Campus Performance Grade Span: 06 - 08Campus Number: 227907042 Bilingual Education/English as a Second Language (Current Year ELL Students)
State District CampusBilingual
EducationBE-TransEarly Exit
BE-TransLate Exit
BE-DualTwo-Way
BE-DualOne-Way ESL
ESLContent
ESLPull-Out
LEP NoServices
LEP WithServices
TotalELL
STAARPercent at Level II Satisfactory Standard or AboveAll Grades
All Subjects 2016 75% 63% 63% - - - - - 40% * 40% 38% 40% 40%
Reading 2016 73% 61% 67% - - - - - 44% * 44% * 44% 44%
Mathematics 2016 76% 65% 65% - - - - - 46% * 45% * 46% 46%
Writing 2016 69% 56% 61% - - - - - 36% - 36% * 36% 36%
Science 2016 79% 68% 64% - - - - - 29% * 28% * 29% 28%
Social Studies 2016 77% 67% 48% - - - - - 20% * 20% * 20% 19%
STAARPercent at Postsecondary Readiness StandardAll Grades
Two or More Subjects 2016 45% 31% 27% - - - - - 6% * 6% * 6% 6%
Reading 2016 46% 34% 34% - - - - - 11% * 10% * 11% 10%
Mathematics 2016 43% 28% 30% - - - - - 14% * 14% * 14% 14%
Writing 2016 41% 27% 28% - - - - - * - * - * *
Science 2016 47% 33% 29% - - - - - * * * * * *
Social Studies 2016 47% 33% 11% - - - - - * * * * * *
STAARPercent at Advanced StandardAll Grades
All Subjects 2016 18% 10% 11% - - - - - 3% * 3% * 3% 3%
Reading 2016 17% 9% 12% - - - - - 2% * 2% * 2% 2%
Mathematics 2016 19% 12% 13% - - - - - 4% * 4% * 4% 4%
Writing 2016 15% 7% 8% - - - - - * - * * * *
Science 2016 16% 11% 10% - - - - - * * * * * *

TEA Division of Performance Reporting Page 6
TEXAS EDUCATION AGENCYDistrict Name: MANOR ISD Texas Academic Performance Report Total Students: 854
Campus Name: DECKER MIDDLE 2015-16 Campus Performance Grade Span: 06 - 08Campus Number: 227907042 Bilingual Education/English as a Second Language (Current Year ELL Students)
State District CampusBilingual
EducationBE-TransEarly Exit
BE-TransLate Exit
BE-DualTwo-Way
BE-DualOne-Way ESL
ESLContent
ESLPull-Out
LEP NoServices
LEP WithServices
TotalELL
STAARPercent at Advanced StandardAll Grades
Social Studies 2016 22% 10% 5% - - - - - * * * * * *
STAARPercent Met or Exceeded ProgressAll Grades
All Subjects 2016 62% 59% 61% - - - - - 54% * 54% * 54% 54%
Reading 2016 60% 59% 61% - - - - - 55% * 55% * 55% 54%
Mathematics 2016 63% 58% 61% - - - - - 54% * 54% * 54% 53%
STAARPercent Exceeded ProgressAll Grades
All Subjects 2016 17% 17% 16% - - - - - 12% * 12% * 12% 12%
Reading 2016 16% 17% 20% - - - - - 19% * 19% * 19% 18%
Mathematics 2016 17% 16% 11% - - - - - 5% * 5% * 5% 5%
Progress of Prior-Year Non-Proficient StudentsSum of Grades 4-8
Reading 2016 35% 32% 32% - - - - - 26% - 26% * 26% 26%
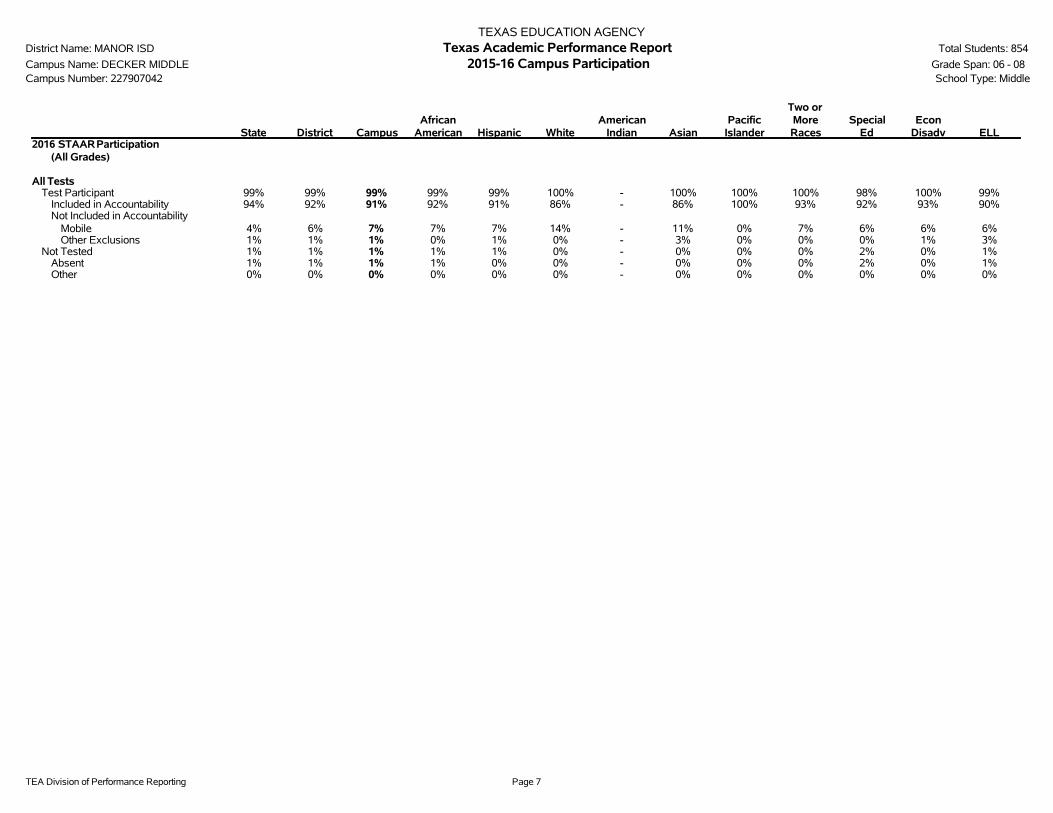
TEA Division of Performance Reporting Page 7
TEXAS EDUCATION AGENCYDistrict Name: MANOR ISD Texas Academic Performance Report Total Students: 854
Campus Name: DECKER MIDDLE 2015-16 Campus Participation Grade Span: 06 - 08Campus Number: 227907042 School Type: Middle
State District CampusAfrican
American Hispanic WhiteAmerican
Indian AsianPacific
Islander
Two orMoreRaces
SpecialEd
EconDisadv ELL
2016 STAARParticipation(All Grades)
All TestsTest Participant 99% 99% 99% 99% 99% 100% - 100% 100% 100% 98% 100% 99%
Included in Accountability 94% 92% 91% 92% 91% 86% - 86% 100% 93% 92% 93% 90%Not Included in Accountability
Mobile 4% 6% 7% 7% 7% 14% - 11% 0% 7% 6% 6% 6%Other Exclusions 1% 1% 1% 0% 1% 0% - 3% 0% 0% 0% 1% 3%
Not Tested 1% 1% 1% 1% 1% 0% - 0% 0% 0% 2% 0% 1%Absent 1% 1% 1% 1% 0% 0% - 0% 0% 0% 2% 0% 1%Other 0% 0% 0% 0% 0% 0% - 0% 0% 0% 0% 0% 0%
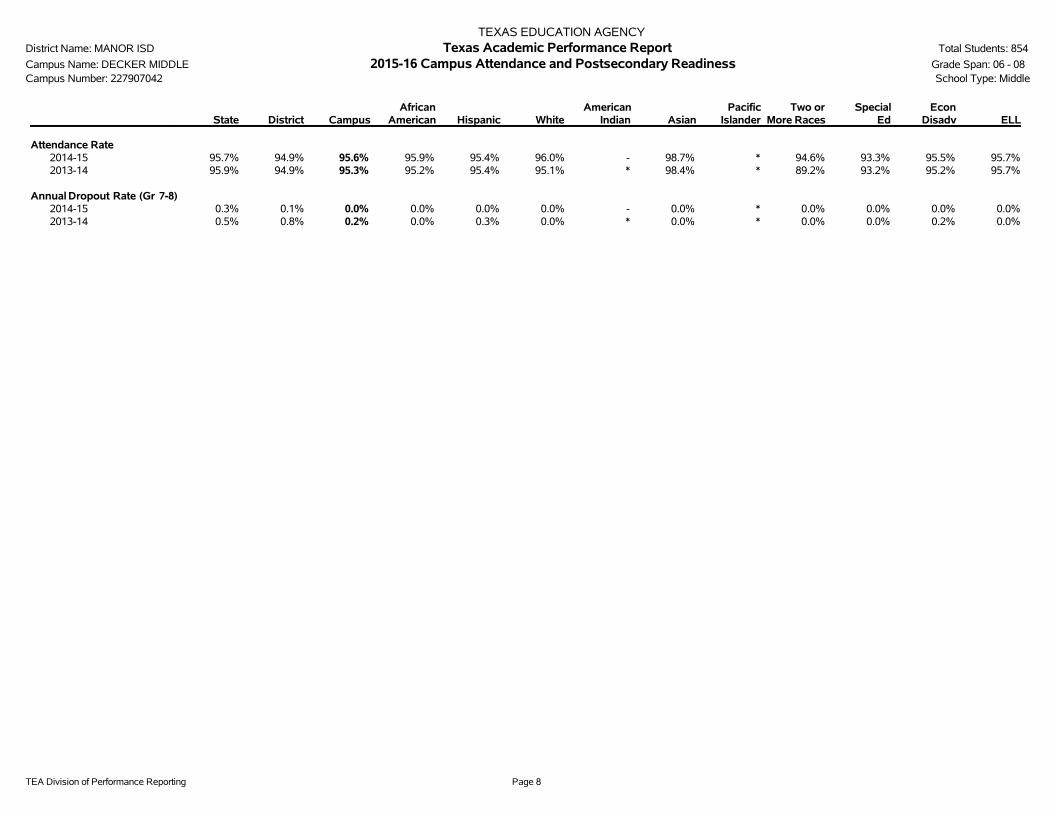
TEA Division of Performance Reporting Page 8
TEXAS EDUCATION AGENCYDistrict Name: MANOR ISD Texas Academic Performance Report Total Students: 854
Campus Name: DECKER MIDDLE 2015-16 Campus Attendance and Postsecondary Readiness Grade Span: 06 - 08Campus Number: 227907042 School Type: Middle
State District CampusAfrican
American Hispanic WhiteAmerican
Indian AsianPacific
IslanderTwo or
More RacesSpecial
EdEcon
Disadv ELL
Attendance Rate2014-15 95.7% 94.9% 95.6% 95.9% 95.4% 96.0% - 98.7% * 94.6% 93.3% 95.5% 95.7%2013-14 95.9% 94.9% 95.3% 95.2% 95.4% 95.1% * 98.4% * 89.2% 93.2% 95.2% 95.7%
Annual Dropout Rate (Gr 7-8)2014-15 0.3% 0.1% 0.0% 0.0% 0.0% 0.0% - 0.0% * 0.0% 0.0% 0.0% 0.0%2013-14 0.5% 0.8% 0.2% 0.0% 0.3% 0.0% * 0.0% * 0.0% 0.0% 0.2% 0.0%
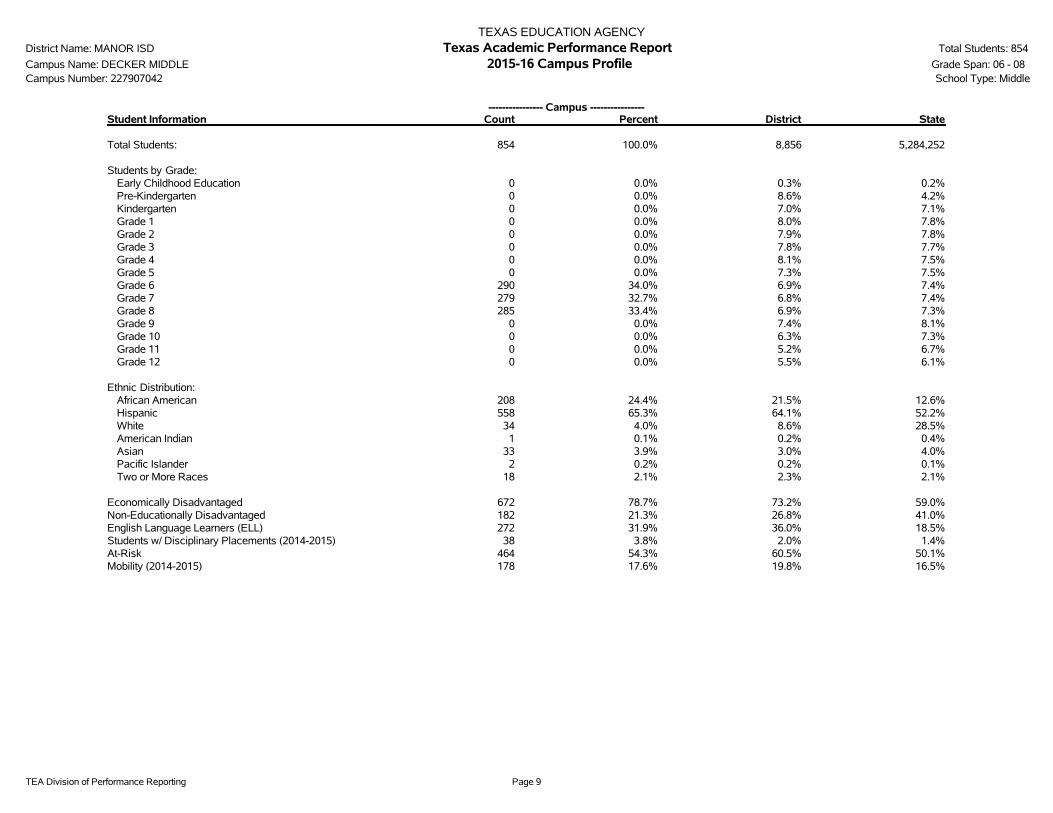
TEA Division of Performance Reporting Page 9
TEXAS EDUCATION AGENCYDistrict Name: MANOR ISD Texas Academic Performance Report Total Students: 854
Campus Name: DECKER MIDDLE 2015-16 Campus Profile Grade Span: 06 - 08Campus Number: 227907042 School Type: Middle
---------------- Campus ----------------Student Information Count Percent District State
Total Students: 854 100.0% 8,856 5,284,252
Students by Grade:Early Childhood Education 0 0.0% 0.3% 0.2%Pre-Kindergarten 0 0.0% 8.6% 4.2%Kindergarten 0 0.0% 7.0% 7.1%Grade 1 0 0.0% 8.0% 7.8%Grade 2 0 0.0% 7.9% 7.8%Grade 3 0 0.0% 7.8% 7.7%Grade 4 0 0.0% 8.1% 7.5%Grade 5 0 0.0% 7.3% 7.5%Grade 6 290 34.0% 6.9% 7.4%Grade 7 279 32.7% 6.8% 7.4%Grade 8 285 33.4% 6.9% 7.3%Grade 9 0 0.0% 7.4% 8.1%Grade 10 0 0.0% 6.3% 7.3%Grade 11 0 0.0% 5.2% 6.7%Grade 12 0 0.0% 5.5% 6.1%
Ethnic Distribution:African American 208 24.4% 21.5% 12.6%Hispanic 558 65.3% 64.1% 52.2%White 34 4.0% 8.6% 28.5%American Indian 1 0.1% 0.2% 0.4%Asian 33 3.9% 3.0% 4.0%Pacific Islander 2 0.2% 0.2% 0.1%Two or More Races 18 2.1% 2.3% 2.1%
Economically Disadvantaged 672 78.7% 73.2% 59.0%Non-Educationally Disadvantaged 182 21.3% 26.8% 41.0%English Language Learners (ELL) 272 31.9% 36.0% 18.5%Students w/ Disciplinary Placements (2014-2015) 38 3.8% 2.0% 1.4%At-Risk 464 54.3% 60.5% 50.1%Mobility (2014-2015) 178 17.6% 19.8% 16.5%

TEA Division of Performance Reporting Page 10
TEXAS EDUCATION AGENCYDistrict Name: MANOR ISD Texas Academic Performance Report Total Students: 854
Campus Name: DECKER MIDDLE 2015-16 Campus Profile Grade Span: 06 - 08Campus Number: 227907042 School Type: Middle
--------- Non-Special Education Rates --------- ------------- Special Education Rates -------------Student Information Campus District State Campus District State
Retention Rates by Grade:
Kindergarten - 1.4% 1.9% - 0.0% 8.2%Grade 1 - 2.5% 4.1% - 4.9% 7.4%Grade 2 - 1.2% 2.7% - 4.5% 3.4%Grade 3 - 0.3% 2.0% - 0.0% 1.6%Grade 4 - 1.0% 1.0% - 0.0% 0.8%Grade 5 - 0.4% 0.9% - 0.0% 1.0%Grade 6 0.4% 0.2% 0.6% 0.0% 0.0% 0.8%Grade 7 0.0% 0.2% 0.8% 0.0% 0.0% 0.9%Grade 8 0.4% 0.5% 0.8% 0.0% 1.5% 1.3%
Class Size Information Campus District State
Class Size Averages by Grade and Subject (Derived from teacher responsibility records):
Elementary:Kindergarten - - 18.9Grade 1 - - 19.1Grade 2 - - 19.1Grade 3 - - 19.1Grade 4 - - 19.0Grade 5 - - 20.8Grade 6 - - 20.4
Secondary:English/Language Arts - - 17.1Foreign Languages - - 19.1Mathematics - - 18.1Science - - 19.1Social Studies - - 19.5
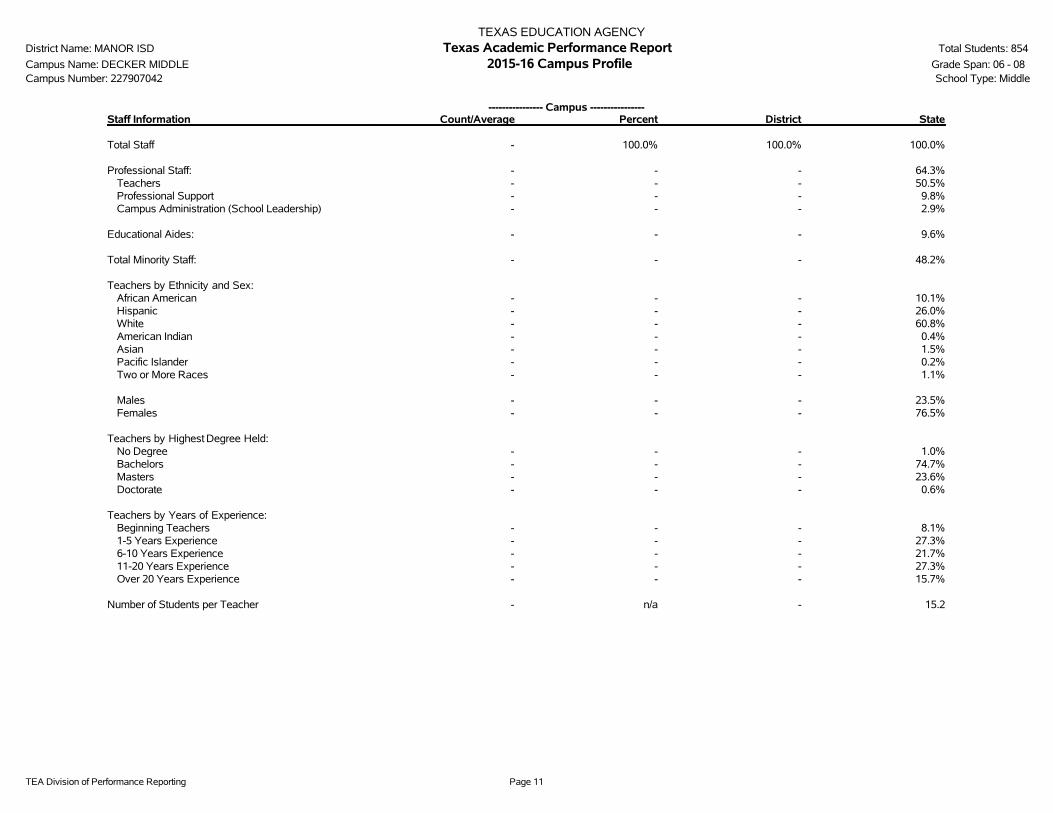
TEA Division of Performance Reporting Page 11
TEXAS EDUCATION AGENCYDistrict Name: MANOR ISD Texas Academic Performance Report Total Students: 854
Campus Name: DECKER MIDDLE 2015-16 Campus Profile Grade Span: 06 - 08Campus Number: 227907042 School Type: Middle
---------------- Campus ----------------Staff Information Count/Average Percent District State
Total Staff - 100.0% 100.0% 100.0%
Professional Staff: - - - 64.3%Teachers - - - 50.5%Professional Support - - - 9.8%Campus Administration (School Leadership) - - - 2.9%
Educational Aides: - - - 9.6%
Total Minority Staff: - - - 48.2%
Teachers by Ethnicity and Sex:African American - - - 10.1%Hispanic - - - 26.0%White - - - 60.8%American Indian - - - 0.4%Asian - - - 1.5%Pacific Islander - - - 0.2%Two or More Races - - - 1.1%
Males - - - 23.5%Females - - - 76.5%
Teachers by Highest Degree Held:No Degree - - - 1.0%Bachelors - - - 74.7%Masters - - - 23.6%Doctorate - - - 0.6%
Teachers by Years of Experience:Beginning Teachers - - - 8.1%1-5 Years Experience - - - 27.3%6-10 Years Experience - - - 21.7%11-20 Years Experience - - - 27.3%Over 20 Years Experience - - - 15.7%
Number of Students per Teacher - n/a - 15.2

TEA Division of Performance Reporting Page 12
TEXAS EDUCATION AGENCYDistrict Name: MANOR ISD Texas Academic Performance Report Total Students: 854
Campus Name: DECKER MIDDLE 2015-16 Campus Profile Grade Span: 06 - 08Campus Number: 227907042 School Type: Middle
Staff Information Campus District State
Average Years Experience of Teachers: - - 10.9Average Years Experience of Teachers with District: - - 7.3
Average Teacher Salary by Years of Experience (regular duties only):Beginning Teachers - - $45,5071-5 Years Experience - - $47,9966-10 Years Experience - - $50,45911-20 Years Experience - - $53,794Over 20 Years Experience - - $60,613
Average Actual Salaries (regular duties only):Teachers - - $51,891Professional Support - - $61,145Campus Administration (School Leadership) - - $75,654
Instructional Staff Percent: n/a - 64.5%
Contracted Instructional Staff (not incl. above): - - 1,914.4

TEA Division of Performance Reporting Page 13
TEXAS EDUCATION AGENCYDistrict Name: MANOR ISD Texas Academic Performance Report Total Students: 854
Campus Name: DECKER MIDDLE 2015-16 Campus Profile Grade Span: 06 - 08Campus Number: 227907042 School Type: Middle
---------------- Campus ----------------Program Information Count Percent District State
Student Enrollment by Program:Bilingual/ESL Education 269 31.5% 35.7% 18.3%Career & Technical Education 208 24.4% 28.7% 24.3%Gifted & Talented Education 100 11.7% 7.3% 7.7%Special Education 82 9.6% 7.8% 8.6%
Teachers by Program (population served):Bilingual/ESL Education - - - 5.9%Career & Technical Education - - - 4.4%Compensatory Education - - - 2.9%Gifted & Talented Education - - - 1.9%Regular Education - - - 72.6%Special Education - - - 8.8%Other - - - 3.4%
Link to: PEIMS Financial Standard Reports/ 2014-2015 Financial Actual Report
' '̂ Indicates that ELL rates at met or exceeded standard and exceeded standard include current and monitored students.'*' Indicates results are masked due to small numbers to protect student confidentiality.'-' Indicates zero observations reported for this group.'n/a' Indicates data reporting is not applicable for this group.'**' Indicates that rates for Reading and Mathematics are based on the cumulative results from the first and second administrations of STAAR.'?' Indicates that the data for this item were statistically improbable, or were reported outside a reasonable range.'##' Indicates that PID Error rate information cannot be reported in 2015-16 due to the transition from PEIMS Edit+ to TSDS.

This page intentionally left blank.
2015-16 Texas Academic Performance Report
District Name: MANOR ISD
Campus Name: MANOR EL
Campus Number: 227907101
2016 Accountability Rating: Met Standard

This page intentionally left blank.
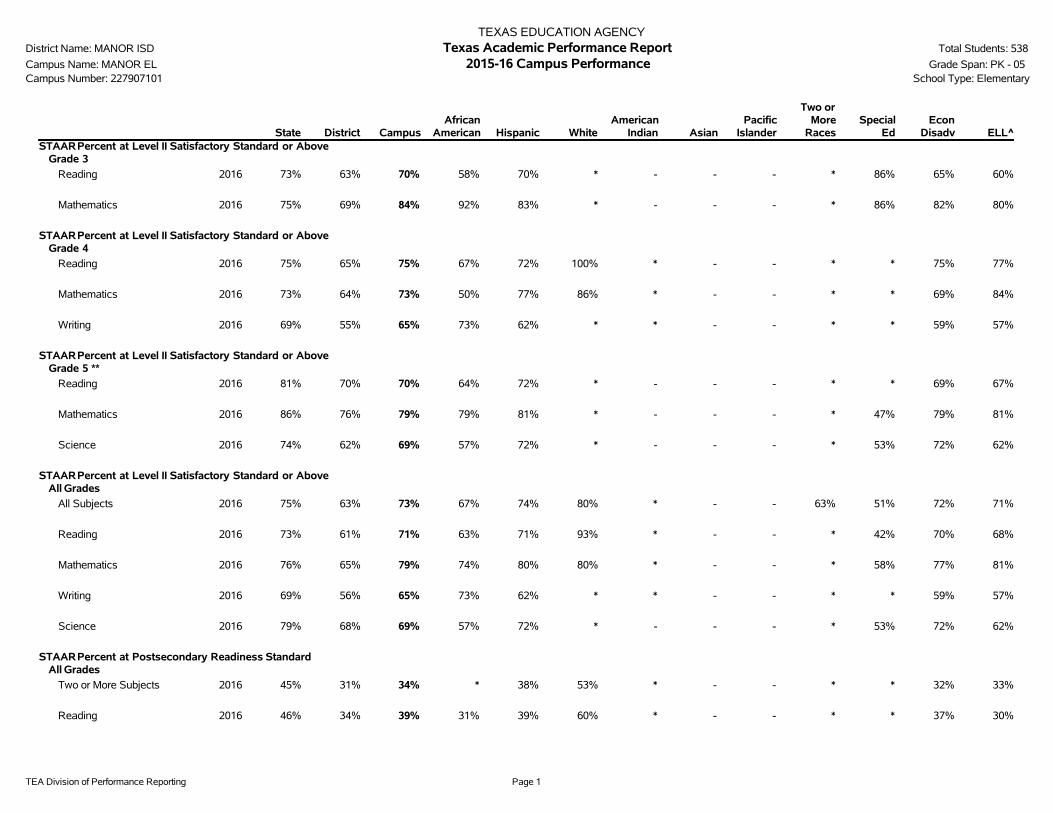
TEA Division of Performance Reporting Page 1
TEXAS EDUCATION AGENCYDistrict Name: MANOR ISD Texas Academic Performance Report Total Students: 538
Campus Name: MANOR EL 2015-16 Campus Performance Grade Span: PK - 05Campus Number: 227907101 School Type: Elementary
State District CampusAfrican
American Hispanic WhiteAmerican
Indian AsianPacific
Islander
Two orMore
RacesSpecial
EdEcon
Disadv ELL^STAARPercent at Level II Satisfactory Standard or Above
Grade 3
Reading 2016 73% 63% 70% 58% 70% * - - - * 86% 65% 60%
Mathematics 2016 75% 69% 84% 92% 83% * - - - * 86% 82% 80%
STAARPercent at Level II Satisfactory Standard or AboveGrade 4
Reading 2016 75% 65% 75% 67% 72% 100% * - - * * 75% 77%
Mathematics 2016 73% 64% 73% 50% 77% 86% * - - * * 69% 84%
Writing 2016 69% 55% 65% 73% 62% * * - - * * 59% 57%
STAARPercent at Level II Satisfactory Standard or AboveGrade 5 **
Reading 2016 81% 70% 70% 64% 72% * - - - * * 69% 67%
Mathematics 2016 86% 76% 79% 79% 81% * - - - * 47% 79% 81%
Science 2016 74% 62% 69% 57% 72% * - - - * 53% 72% 62%
STAARPercent at Level II Satisfactory Standard or AboveAll Grades
All Subjects 2016 75% 63% 73% 67% 74% 80% * - - 63% 51% 72% 71%
Reading 2016 73% 61% 71% 63% 71% 93% * - - * 42% 70% 68%
Mathematics 2016 76% 65% 79% 74% 80% 80% * - - * 58% 77% 81%
Writing 2016 69% 56% 65% 73% 62% * * - - * * 59% 57%
Science 2016 79% 68% 69% 57% 72% * - - - * 53% 72% 62%
STAARPercent at Postsecondary Readiness StandardAll Grades
Two or More Subjects 2016 45% 31% 34% * 38% 53% * - - * * 32% 33%
Reading 2016 46% 34% 39% 31% 39% 60% * - - * * 37% 30%

TEA Division of Performance Reporting Page 2
TEXAS EDUCATION AGENCYDistrict Name: MANOR ISD Texas Academic Performance Report Total Students: 538
Campus Name: MANOR EL 2015-16 Campus Performance Grade Span: PK - 05Campus Number: 227907101 School Type: Elementary
State District CampusAfrican
American Hispanic WhiteAmerican
Indian AsianPacific
Islander
Two orMore
RacesSpecial
EdEcon
Disadv ELL^STAARPercent at Postsecondary Readiness Standard
All Grades
Mathematics 2016 43% 28% 40% 17% 46% 47% * - - * * 38% 42%
Writing 2016 41% 27% 29% * 31% * * - - * * 28% 35%
Science 2016 47% 33% 29% * 34% * - - - * * 29% 33%
STAARPercent at Advanced StandardAll Grades
All Subjects 2016 18% 10% 16% 8% 17% 29% * - - * * 14% 12%
Reading 2016 17% 9% 18% * 17% 33% * - - * * 15% 8%
Mathematics 2016 19% 12% 20% * 22% 33% * - - * * 19% 20%
Writing 2016 15% 7% 10% * * * * - - * * * *
Science 2016 16% 11% 8% * 9% * - - - * * 8% *
STAARPercent Met or Exceeded ProgressAll Grades
All Subjects 2016 62% 59% 73% 58% 77% * * - - * 57% 73% 78%
Reading 2016 60% 59% 69% * 72% * * - - * * 68% 71%
Mathematics 2016 63% 58% 77% * 82% * * - - * * 79% 85%
STAARPercent Exceeded ProgressAll Grades
All Subjects 2016 17% 17% 28% 14% 32% * * - - * 17% 28% 33%
Reading 2016 16% 17% 23% * 25% * * - - * * 25% 27%
Mathematics 2016 17% 16% 32% * 38% * * - - * * 32% 40%
Progress of Prior-Year Non-Proficient StudentsSum of Grades 4-8
Reading 2016 35% 32% 41% * 42% * - - - * * 44% 48%

TEA Division of Performance Reporting Page 3
TEXAS EDUCATION AGENCYDistrict Name: MANOR ISD Texas Academic Performance Report Total Students: 538
Campus Name: MANOR EL 2015-16 Campus Performance Grade Span: PK - 05Campus Number: 227907101 School Type: Elementary
State District CampusAfrican
American Hispanic WhiteAmerican
Indian AsianPacific
Islander
Two orMore
RacesSpecial
EdEcon
Disadv ELLStudent Success Initiative
Grade 5 Reading
Students Meeting Level II Standard on First STAARAdministration
2016 73% 61% 68% 57% 70% * - - - - * 69% 64%
Students Requiring Accelerated Instruction
2016 27% 39% 32% 43% 30% * - - - - 85% 31% 36%
STAARCumulative Met Standard
2016 80% 70% 71% 64% 73% * - - - * * 70% 69%
Grade 5 Mathematics
Students Meeting Level II Standard on First STAARAdministration
2016 77% 63% 70% 57% 73% * - - - * * 69% 71%
Students Requiring Accelerated Instruction
2016 23% 37% 30% 43% 27% * - - - * 85% 31% 29%
STAARCumulative Met Standard
2016 85% 75% 79% 79% 80% * - - - * 38% 79% 81%
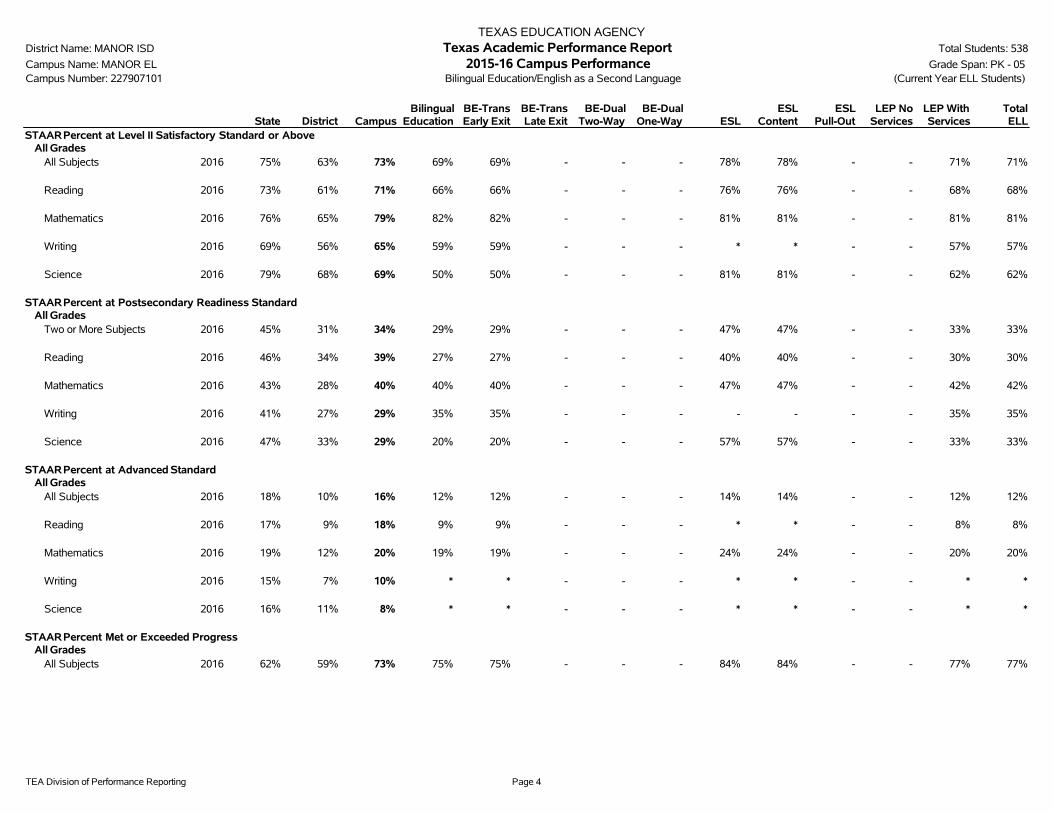
TEA Division of Performance Reporting Page 4
TEXAS EDUCATION AGENCYDistrict Name: MANOR ISD Texas Academic Performance Report Total Students: 538
Campus Name: MANOR EL 2015-16 Campus Performance Grade Span: PK - 05Campus Number: 227907101 Bilingual Education/English as a Second Language (Current Year ELL Students)
State District CampusBilingual
EducationBE-TransEarly Exit
BE-TransLate Exit
BE-DualTwo-Way
BE-DualOne-Way ESL
ESLContent
ESLPull-Out
LEP NoServices
LEP WithServices
TotalELL
STAARPercent at Level II Satisfactory Standard or AboveAll Grades
All Subjects 2016 75% 63% 73% 69% 69% - - - 78% 78% - - 71% 71%
Reading 2016 73% 61% 71% 66% 66% - - - 76% 76% - - 68% 68%
Mathematics 2016 76% 65% 79% 82% 82% - - - 81% 81% - - 81% 81%
Writing 2016 69% 56% 65% 59% 59% - - - * * - - 57% 57%
Science 2016 79% 68% 69% 50% 50% - - - 81% 81% - - 62% 62%
STAARPercent at Postsecondary Readiness StandardAll Grades
Two or More Subjects 2016 45% 31% 34% 29% 29% - - - 47% 47% - - 33% 33%
Reading 2016 46% 34% 39% 27% 27% - - - 40% 40% - - 30% 30%
Mathematics 2016 43% 28% 40% 40% 40% - - - 47% 47% - - 42% 42%
Writing 2016 41% 27% 29% 35% 35% - - - - - - - 35% 35%
Science 2016 47% 33% 29% 20% 20% - - - 57% 57% - - 33% 33%
STAARPercent at Advanced StandardAll Grades
All Subjects 2016 18% 10% 16% 12% 12% - - - 14% 14% - - 12% 12%
Reading 2016 17% 9% 18% 9% 9% - - - * * - - 8% 8%
Mathematics 2016 19% 12% 20% 19% 19% - - - 24% 24% - - 20% 20%
Writing 2016 15% 7% 10% * * - - - * * - - * *
Science 2016 16% 11% 8% * * - - - * * - - * *
STAARPercent Met or Exceeded ProgressAll Grades
All Subjects 2016 62% 59% 73% 75% 75% - - - 84% 84% - - 77% 77%
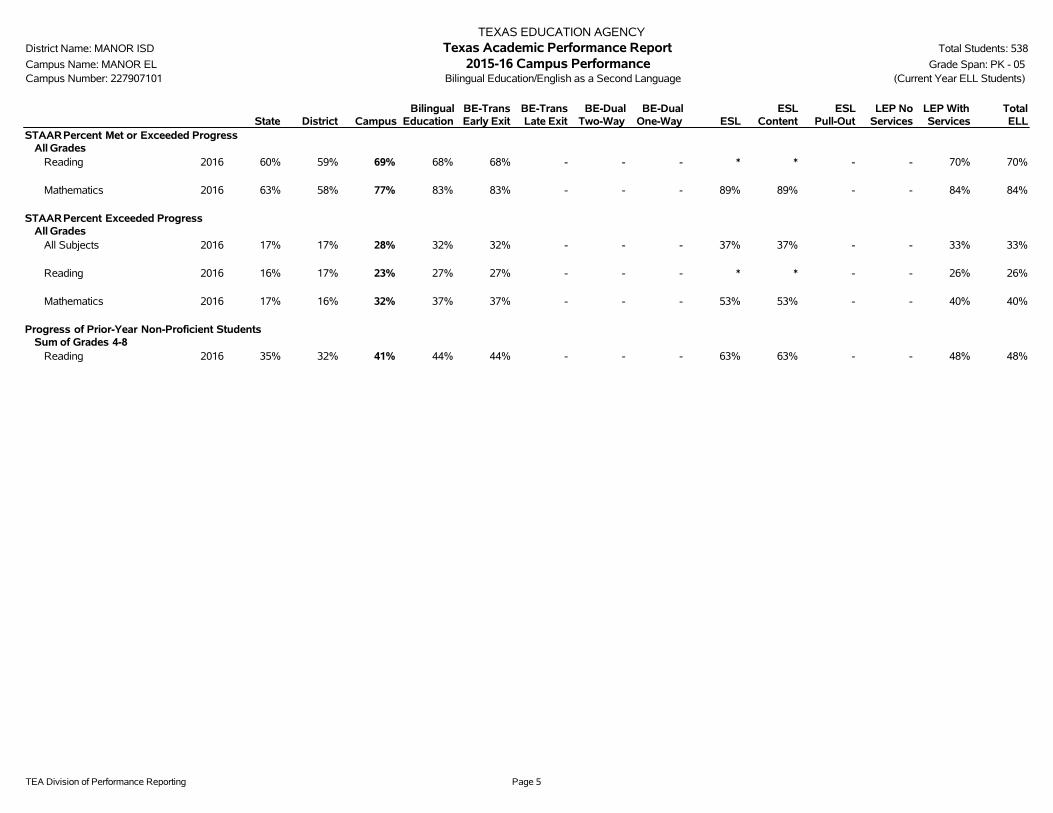
TEA Division of Performance Reporting Page 5
TEXAS EDUCATION AGENCYDistrict Name: MANOR ISD Texas Academic Performance Report Total Students: 538
Campus Name: MANOR EL 2015-16 Campus Performance Grade Span: PK - 05Campus Number: 227907101 Bilingual Education/English as a Second Language (Current Year ELL Students)
State District CampusBilingual
EducationBE-TransEarly Exit
BE-TransLate Exit
BE-DualTwo-Way
BE-DualOne-Way ESL
ESLContent
ESLPull-Out
LEP NoServices
LEP WithServices
TotalELL
STAARPercent Met or Exceeded ProgressAll Grades
Reading 2016 60% 59% 69% 68% 68% - - - * * - - 70% 70%
Mathematics 2016 63% 58% 77% 83% 83% - - - 89% 89% - - 84% 84%
STAARPercent Exceeded ProgressAll Grades
All Subjects 2016 17% 17% 28% 32% 32% - - - 37% 37% - - 33% 33%
Reading 2016 16% 17% 23% 27% 27% - - - * * - - 26% 26%
Mathematics 2016 17% 16% 32% 37% 37% - - - 53% 53% - - 40% 40%
Progress of Prior-Year Non-Proficient StudentsSum of Grades 4-8
Reading 2016 35% 32% 41% 44% 44% - - - 63% 63% - - 48% 48%
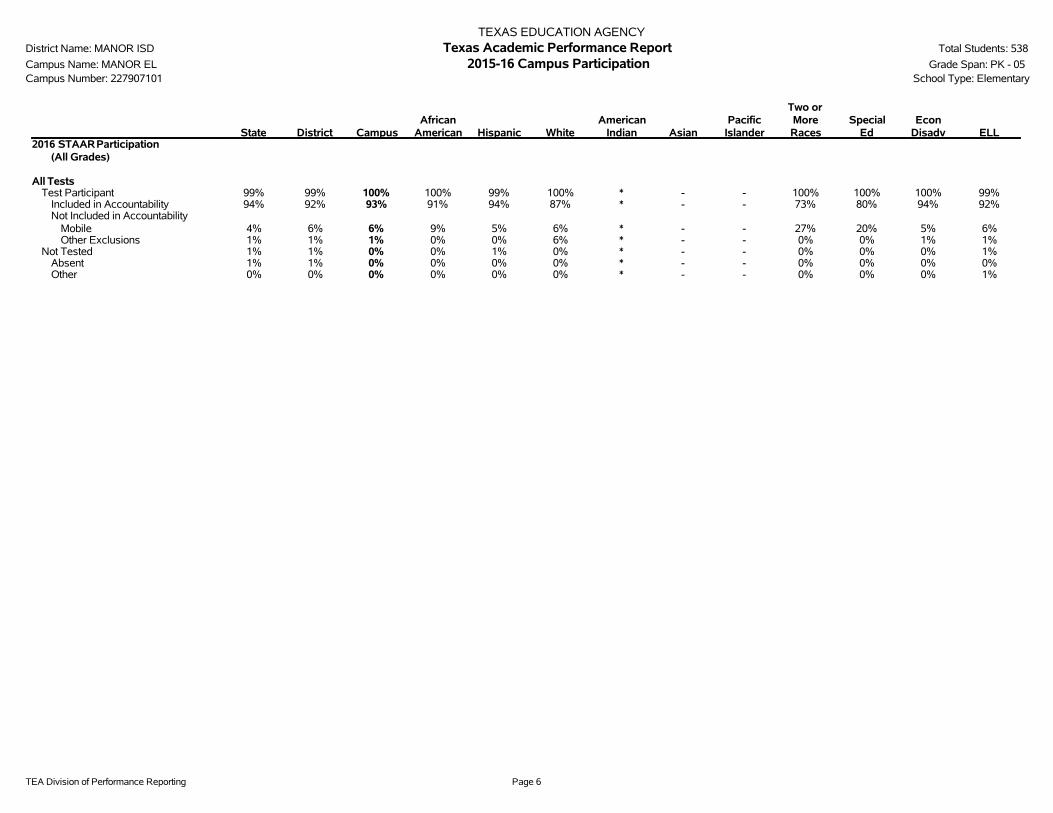
TEA Division of Performance Reporting Page 6
TEXAS EDUCATION AGENCYDistrict Name: MANOR ISD Texas Academic Performance Report Total Students: 538
Campus Name: MANOR EL 2015-16 Campus Participation Grade Span: PK - 05Campus Number: 227907101 School Type: Elementary
State District CampusAfrican
American Hispanic WhiteAmerican
Indian AsianPacific
Islander
Two orMoreRaces
SpecialEd
EconDisadv ELL
2016 STAARParticipation(All Grades)
All TestsTest Participant 99% 99% 100% 100% 99% 100% * - - 100% 100% 100% 99%
Included in Accountability 94% 92% 93% 91% 94% 87% * - - 73% 80% 94% 92%Not Included in Accountability
Mobile 4% 6% 6% 9% 5% 6% * - - 27% 20% 5% 6%Other Exclusions 1% 1% 1% 0% 0% 6% * - - 0% 0% 1% 1%
Not Tested 1% 1% 0% 0% 1% 0% * - - 0% 0% 0% 1%Absent 1% 1% 0% 0% 0% 0% * - - 0% 0% 0% 0%Other 0% 0% 0% 0% 0% 0% * - - 0% 0% 0% 1%
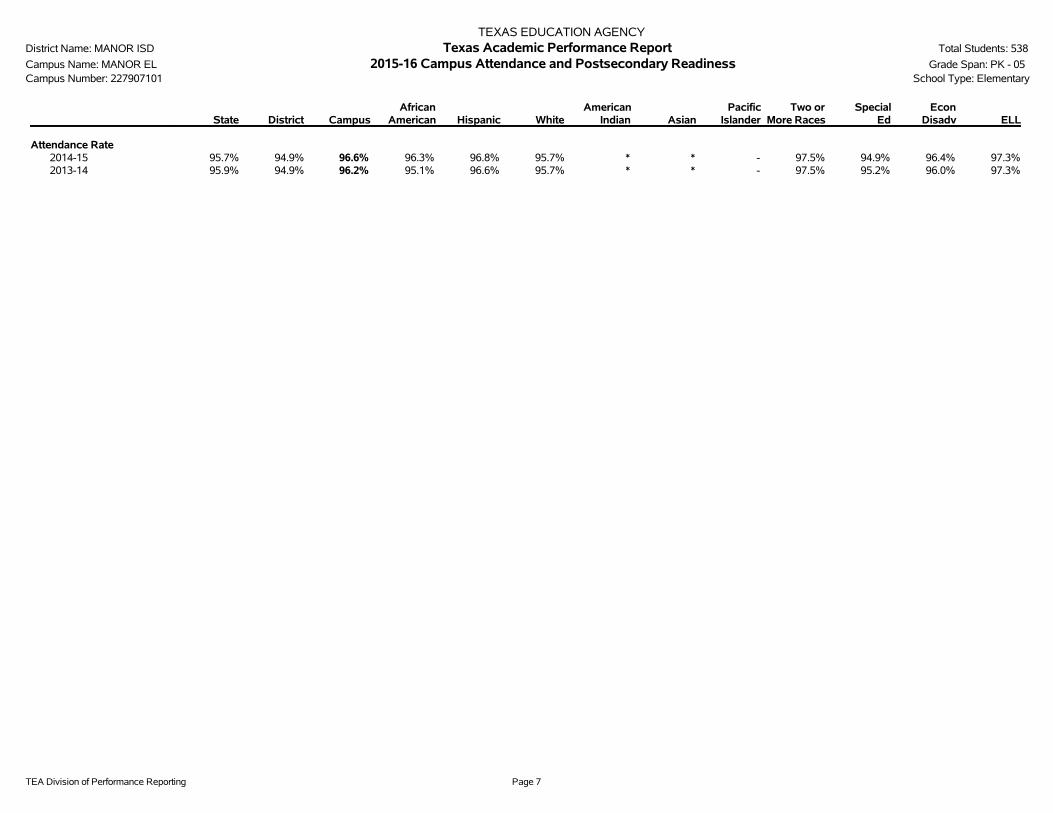
TEA Division of Performance Reporting Page 7
TEXAS EDUCATION AGENCYDistrict Name: MANOR ISD Texas Academic Performance Report Total Students: 538
Campus Name: MANOR EL 2015-16 Campus Attendance and Postsecondary Readiness Grade Span: PK - 05Campus Number: 227907101 School Type: Elementary
State District CampusAfrican
American Hispanic WhiteAmerican
Indian AsianPacific
IslanderTwo or
More RacesSpecial
EdEcon
Disadv ELL
Attendance Rate2014-15 95.7% 94.9% 96.6% 96.3% 96.8% 95.7% * * - 97.5% 94.9% 96.4% 97.3%2013-14 95.9% 94.9% 96.2% 95.1% 96.6% 95.7% * * - 97.5% 95.2% 96.0% 97.3%
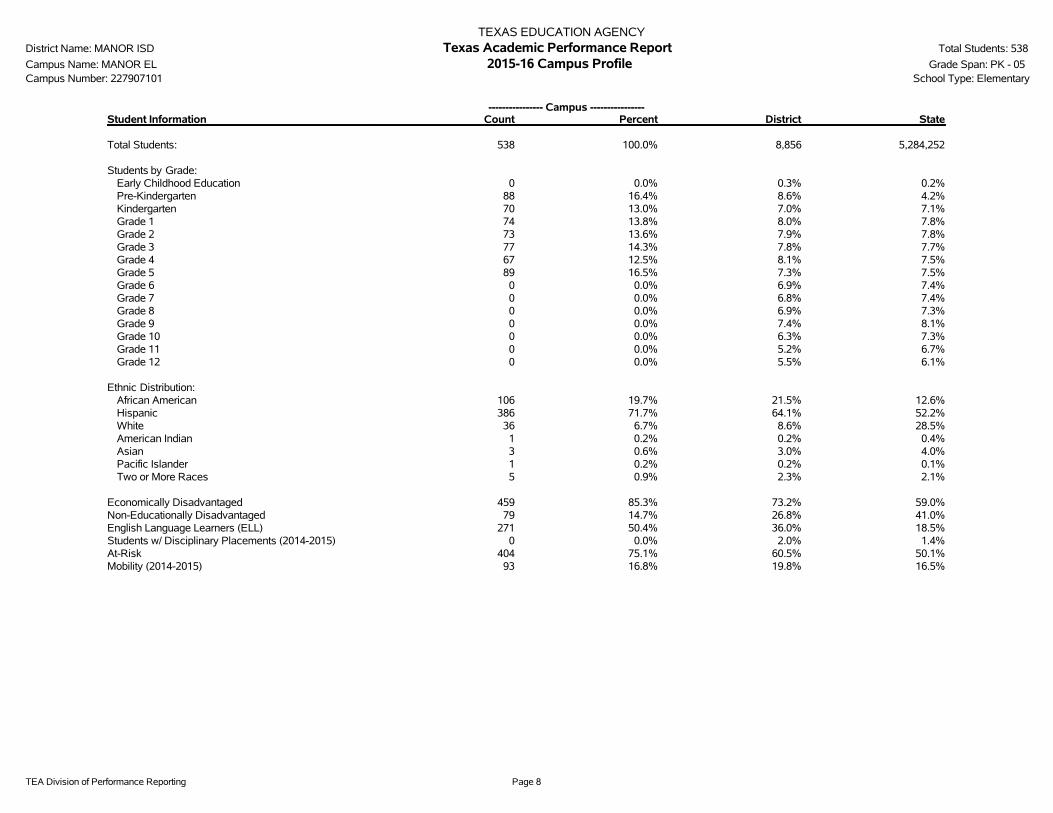
TEA Division of Performance Reporting Page 8
TEXAS EDUCATION AGENCYDistrict Name: MANOR ISD Texas Academic Performance Report Total Students: 538
Campus Name: MANOR EL 2015-16 Campus Profile Grade Span: PK - 05Campus Number: 227907101 School Type: Elementary
---------------- Campus ----------------Student Information Count Percent District State
Total Students: 538 100.0% 8,856 5,284,252
Students by Grade:Early Childhood Education 0 0.0% 0.3% 0.2%Pre-Kindergarten 88 16.4% 8.6% 4.2%Kindergarten 70 13.0% 7.0% 7.1%Grade 1 74 13.8% 8.0% 7.8%Grade 2 73 13.6% 7.9% 7.8%Grade 3 77 14.3% 7.8% 7.7%Grade 4 67 12.5% 8.1% 7.5%Grade 5 89 16.5% 7.3% 7.5%Grade 6 0 0.0% 6.9% 7.4%Grade 7 0 0.0% 6.8% 7.4%Grade 8 0 0.0% 6.9% 7.3%Grade 9 0 0.0% 7.4% 8.1%Grade 10 0 0.0% 6.3% 7.3%Grade 11 0 0.0% 5.2% 6.7%Grade 12 0 0.0% 5.5% 6.1%
Ethnic Distribution:African American 106 19.7% 21.5% 12.6%Hispanic 386 71.7% 64.1% 52.2%White 36 6.7% 8.6% 28.5%American Indian 1 0.2% 0.2% 0.4%Asian 3 0.6% 3.0% 4.0%Pacific Islander 1 0.2% 0.2% 0.1%Two or More Races 5 0.9% 2.3% 2.1%
Economically Disadvantaged 459 85.3% 73.2% 59.0%Non-Educationally Disadvantaged 79 14.7% 26.8% 41.0%English Language Learners (ELL) 271 50.4% 36.0% 18.5%Students w/ Disciplinary Placements (2014-2015) 0 0.0% 2.0% 1.4%At-Risk 404 75.1% 60.5% 50.1%Mobility (2014-2015) 93 16.8% 19.8% 16.5%

TEA Division of Performance Reporting Page 9
TEXAS EDUCATION AGENCYDistrict Name: MANOR ISD Texas Academic Performance Report Total Students: 538
Campus Name: MANOR EL 2015-16 Campus Profile Grade Span: PK - 05Campus Number: 227907101 School Type: Elementary
--------- Non-Special Education Rates --------- ------------- Special Education Rates -------------Student Information Campus District State Campus District State
Retention Rates by Grade:
Kindergarten 0.0% 1.4% 1.9% 0.0% 0.0% 8.2%Grade 1 3.4% 2.5% 4.1% 9.1% 4.9% 7.4%Grade 2 0.0% 1.2% 2.7% 25.0% 4.5% 3.4%Grade 3 1.1% 0.3% 2.0% 0.0% 0.0% 1.6%Grade 4 0.0% 1.0% 1.0% 0.0% 0.0% 0.8%Grade 5 0.0% 0.4% 0.9% 0.0% 0.0% 1.0%Grade 6 - 0.2% 0.6% - 0.0% 0.8%Grade 7 - 0.2% 0.8% - 0.0% 0.9%Grade 8 - 0.5% 0.8% - 1.5% 1.3%
Class Size Information Campus District State
Class Size Averages by Grade and Subject (Derived from teacher responsibility records):
Elementary:Kindergarten - - 18.9Grade 1 - - 19.1Grade 2 - - 19.1Grade 3 - - 19.1Grade 4 - - 19.0Grade 5 - - 20.8Grade 6 - - 20.4
Secondary:English/Language Arts - - 17.1Foreign Languages - - 19.1Mathematics - - 18.1Science - - 19.1Social Studies - - 19.5
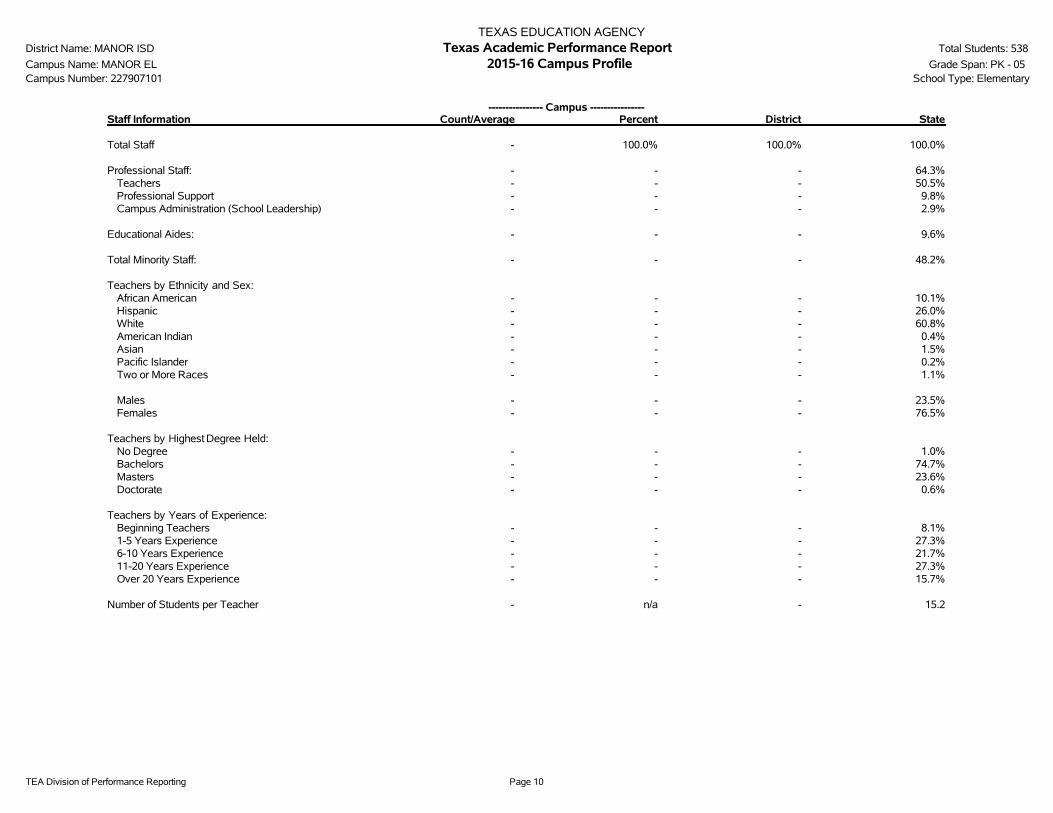
TEA Division of Performance Reporting Page 10
TEXAS EDUCATION AGENCYDistrict Name: MANOR ISD Texas Academic Performance Report Total Students: 538
Campus Name: MANOR EL 2015-16 Campus Profile Grade Span: PK - 05Campus Number: 227907101 School Type: Elementary
---------------- Campus ----------------Staff Information Count/Average Percent District State
Total Staff - 100.0% 100.0% 100.0%
Professional Staff: - - - 64.3%Teachers - - - 50.5%Professional Support - - - 9.8%Campus Administration (School Leadership) - - - 2.9%
Educational Aides: - - - 9.6%
Total Minority Staff: - - - 48.2%
Teachers by Ethnicity and Sex:African American - - - 10.1%Hispanic - - - 26.0%White - - - 60.8%American Indian - - - 0.4%Asian - - - 1.5%Pacific Islander - - - 0.2%Two or More Races - - - 1.1%
Males - - - 23.5%Females - - - 76.5%
Teachers by Highest Degree Held:No Degree - - - 1.0%Bachelors - - - 74.7%Masters - - - 23.6%Doctorate - - - 0.6%
Teachers by Years of Experience:Beginning Teachers - - - 8.1%1-5 Years Experience - - - 27.3%6-10 Years Experience - - - 21.7%11-20 Years Experience - - - 27.3%Over 20 Years Experience - - - 15.7%
Number of Students per Teacher - n/a - 15.2

TEA Division of Performance Reporting Page 11
TEXAS EDUCATION AGENCYDistrict Name: MANOR ISD Texas Academic Performance Report Total Students: 538
Campus Name: MANOR EL 2015-16 Campus Profile Grade Span: PK - 05Campus Number: 227907101 School Type: Elementary
Staff Information Campus District State
Average Years Experience of Teachers: - - 10.9Average Years Experience of Teachers with District: - - 7.3
Average Teacher Salary by Years of Experience (regular duties only):Beginning Teachers - - $45,5071-5 Years Experience - - $47,9966-10 Years Experience - - $50,45911-20 Years Experience - - $53,794Over 20 Years Experience - - $60,613
Average Actual Salaries (regular duties only):Teachers - - $51,891Professional Support - - $61,145Campus Administration (School Leadership) - - $75,654
Instructional Staff Percent: n/a - 64.5%
Contracted Instructional Staff (not incl. above): - - 1,914.4

TEA Division of Performance Reporting Page 12
TEXAS EDUCATION AGENCYDistrict Name: MANOR ISD Texas Academic Performance Report Total Students: 538
Campus Name: MANOR EL 2015-16 Campus Profile Grade Span: PK - 05Campus Number: 227907101 School Type: Elementary
---------------- Campus ----------------Program Information Count Percent District State
Student Enrollment by Program:Bilingual/ESL Education 276 51.3% 35.7% 18.3%Career & Technical Education 0 0.0% 28.7% 24.3%Gifted & Talented Education 34 6.3% 7.3% 7.7%Special Education 41 7.6% 7.8% 8.6%
Teachers by Program (population served):Bilingual/ESL Education - - - 5.9%Career & Technical Education - - - 4.4%Compensatory Education - - - 2.9%Gifted & Talented Education - - - 1.9%Regular Education - - - 72.6%Special Education - - - 8.8%Other - - - 3.4%
Link to: PEIMS Financial Standard Reports/ 2014-2015 Financial Actual Report
' '̂ Indicates that ELL rates at met or exceeded standard and exceeded standard include current and monitored students.'*' Indicates results are masked due to small numbers to protect student confidentiality.'-' Indicates zero observations reported for this group.'n/a' Indicates data reporting is not applicable for this group.'**' Indicates that rates for Reading and Mathematics are based on the cumulative results from the first and second administrations of STAAR.'?' Indicates that the data for this item were statistically improbable, or were reported outside a reasonable range.'##' Indicates that PID Error rate information cannot be reported in 2015-16 due to the transition from PEIMS Edit+ to TSDS.
2015-16 Texas Academic Performance Report
District Name: MANOR ISD
Campus Name: BLUEBONNET TRAIL EL
Campus Number: 227907102
2016 Accountability Rating: Met Standard

This page intentionally left blank.
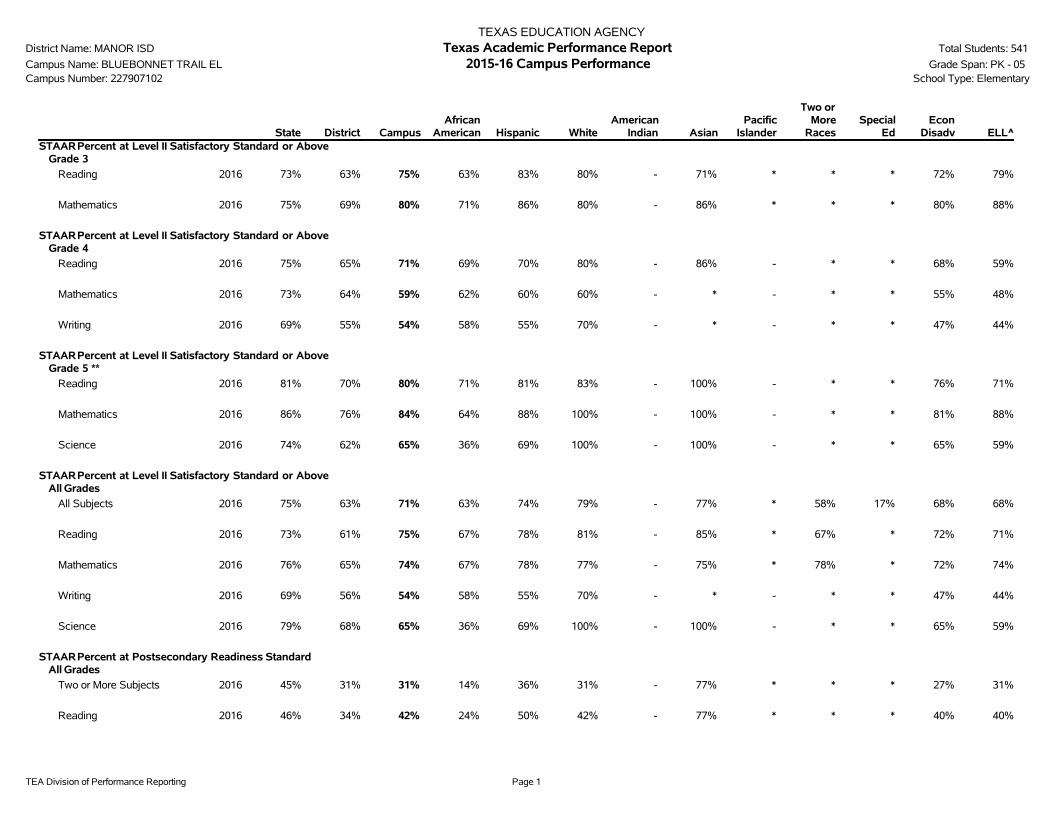
TEA Division of Performance Reporting Page 1
TEXAS EDUCATION AGENCYDistrict Name: MANOR ISD Texas Academic Performance Report Total Students: 541
Campus Name: BLUEBONNET TRAIL EL 2015-16 Campus Performance Grade Span: PK - 05Campus Number: 227907102 School Type: Elementary
State District CampusAfrican
American Hispanic WhiteAmerican
Indian AsianPacific
Islander
Two orMore
RacesSpecial
EdEcon
Disadv ELL^STAARPercent at Level II Satisfactory Standard or Above
Grade 3
Reading 2016 73% 63% 75% 63% 83% 80% - 71% * * * 72% 79%
Mathematics 2016 75% 69% 80% 71% 86% 80% - 86% * * * 80% 88%
STAARPercent at Level II Satisfactory Standard or AboveGrade 4
Reading 2016 75% 65% 71% 69% 70% 80% - 86% - * * 68% 59%
Mathematics 2016 73% 64% 59% 62% 60% 60% - * - * * 55% 48%
Writing 2016 69% 55% 54% 58% 55% 70% - * - * * 47% 44%
STAARPercent at Level II Satisfactory Standard or AboveGrade 5 **
Reading 2016 81% 70% 80% 71% 81% 83% - 100% - * * 76% 71%
Mathematics 2016 86% 76% 84% 64% 88% 100% - 100% - * * 81% 88%
Science 2016 74% 62% 65% 36% 69% 100% - 100% - * * 65% 59%
STAARPercent at Level II Satisfactory Standard or AboveAll Grades
All Subjects 2016 75% 63% 71% 63% 74% 79% - 77% * 58% 17% 68% 68%
Reading 2016 73% 61% 75% 67% 78% 81% - 85% * 67% * 72% 71%
Mathematics 2016 76% 65% 74% 67% 78% 77% - 75% * 78% * 72% 74%
Writing 2016 69% 56% 54% 58% 55% 70% - * - * * 47% 44%
Science 2016 79% 68% 65% 36% 69% 100% - 100% - * * 65% 59%
STAARPercent at Postsecondary Readiness StandardAll Grades
Two or More Subjects 2016 45% 31% 31% 14% 36% 31% - 77% * * * 27% 31%
Reading 2016 46% 34% 42% 24% 50% 42% - 77% * * * 40% 40%
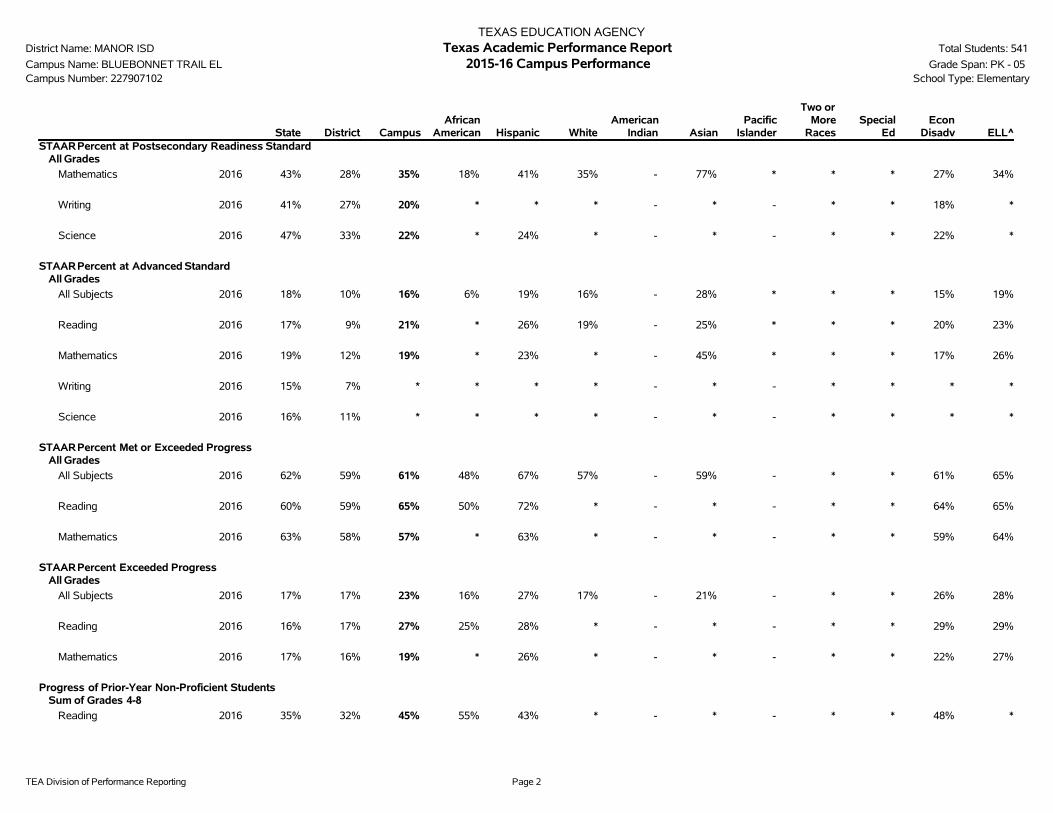
TEA Division of Performance Reporting Page 2
TEXAS EDUCATION AGENCYDistrict Name: MANOR ISD Texas Academic Performance Report Total Students: 541
Campus Name: BLUEBONNET TRAIL EL 2015-16 Campus Performance Grade Span: PK - 05Campus Number: 227907102 School Type: Elementary
State District CampusAfrican
American Hispanic WhiteAmerican
Indian AsianPacific
Islander
Two orMore
RacesSpecial
EdEcon
Disadv ELL^STAARPercent at Postsecondary Readiness Standard
All Grades
Mathematics 2016 43% 28% 35% 18% 41% 35% - 77% * * * 27% 34%
Writing 2016 41% 27% 20% * * * - * - * * 18% *
Science 2016 47% 33% 22% * 24% * - * - * * 22% *
STAARPercent at Advanced StandardAll Grades
All Subjects 2016 18% 10% 16% 6% 19% 16% - 28% * * * 15% 19%
Reading 2016 17% 9% 21% * 26% 19% - 25% * * * 20% 23%
Mathematics 2016 19% 12% 19% * 23% * - 45% * * * 17% 26%
Writing 2016 15% 7% * * * * - * - * * * *
Science 2016 16% 11% * * * * - * - * * * *
STAARPercent Met or Exceeded ProgressAll Grades
All Subjects 2016 62% 59% 61% 48% 67% 57% - 59% - * * 61% 65%
Reading 2016 60% 59% 65% 50% 72% * - * - * * 64% 65%
Mathematics 2016 63% 58% 57% * 63% * - * - * * 59% 64%
STAARPercent Exceeded ProgressAll Grades
All Subjects 2016 17% 17% 23% 16% 27% 17% - 21% - * * 26% 28%
Reading 2016 16% 17% 27% 25% 28% * - * - * * 29% 29%
Mathematics 2016 17% 16% 19% * 26% * - * - * * 22% 27%
Progress of Prior-Year Non-Proficient StudentsSum of Grades 4-8
Reading 2016 35% 32% 45% 55% 43% * - * - * * 48% *
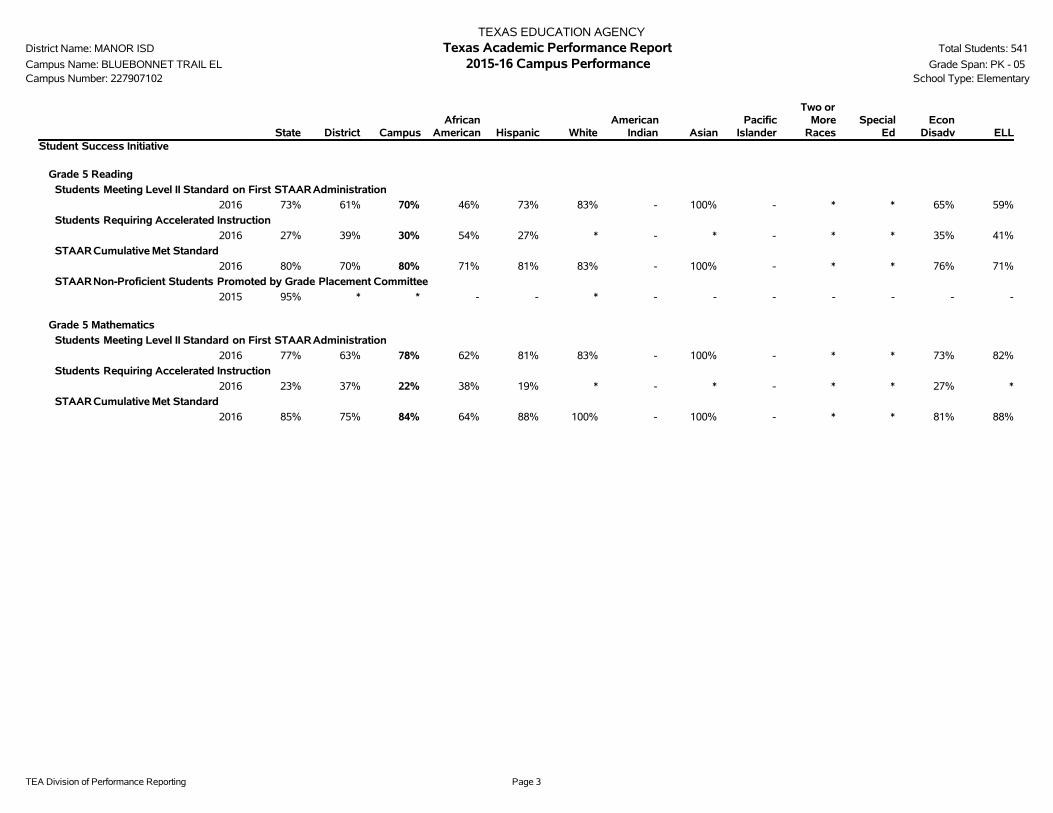
TEA Division of Performance Reporting Page 3
TEXAS EDUCATION AGENCYDistrict Name: MANOR ISD Texas Academic Performance Report Total Students: 541
Campus Name: BLUEBONNET TRAIL EL 2015-16 Campus Performance Grade Span: PK - 05Campus Number: 227907102 School Type: Elementary
State District CampusAfrican
American Hispanic WhiteAmerican
Indian AsianPacific
Islander
Two orMore
RacesSpecial
EdEcon
Disadv ELLStudent Success Initiative
Grade 5 Reading
Students Meeting Level II Standard on First STAARAdministration
2016 73% 61% 70% 46% 73% 83% - 100% - * * 65% 59%
Students Requiring Accelerated Instruction
2016 27% 39% 30% 54% 27% * - * - * * 35% 41%
STAARCumulative Met Standard
2016 80% 70% 80% 71% 81% 83% - 100% - * * 76% 71%
STAARNon-Proficient Students Promoted by Grade Placement Committee
2015 95% * * - - * - - - - - - -
Grade 5 Mathematics
Students Meeting Level II Standard on First STAARAdministration
2016 77% 63% 78% 62% 81% 83% - 100% - * * 73% 82%
Students Requiring Accelerated Instruction
2016 23% 37% 22% 38% 19% * - * - * * 27% *
STAARCumulative Met Standard
2016 85% 75% 84% 64% 88% 100% - 100% - * * 81% 88%
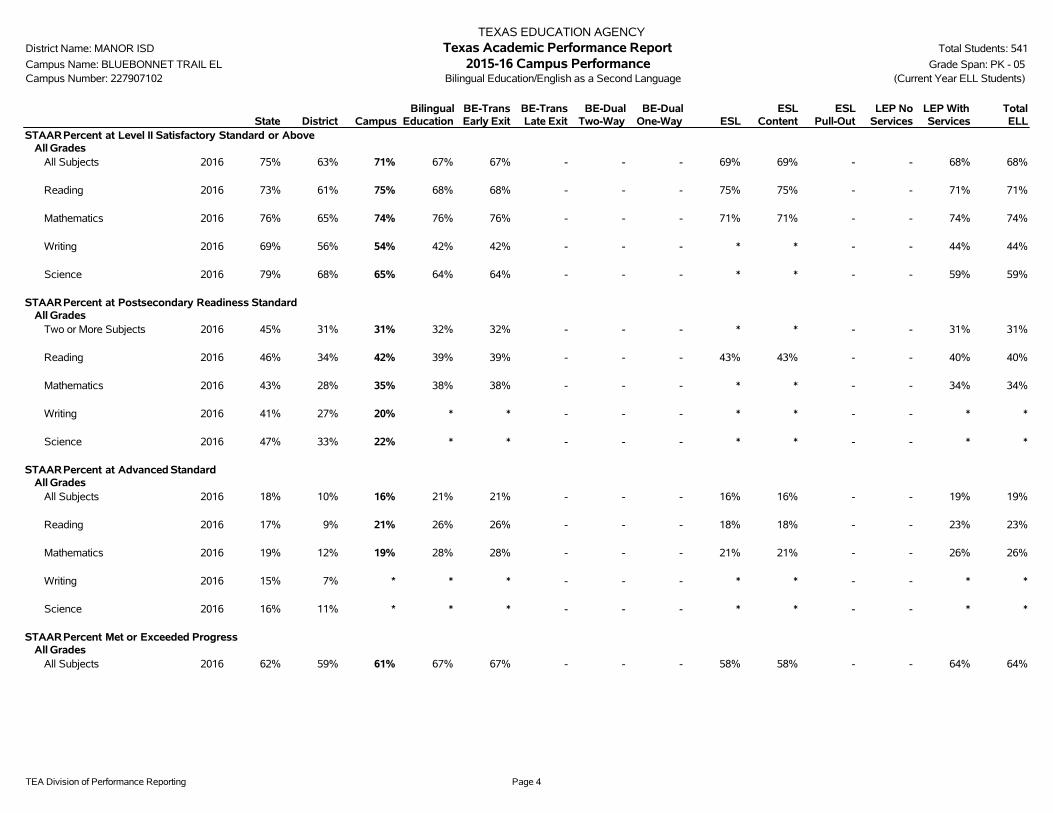
TEA Division of Performance Reporting Page 4
TEXAS EDUCATION AGENCYDistrict Name: MANOR ISD Texas Academic Performance Report Total Students: 541
Campus Name: BLUEBONNET TRAIL EL 2015-16 Campus Performance Grade Span: PK - 05Campus Number: 227907102 Bilingual Education/English as a Second Language (Current Year ELL Students)
State District CampusBilingual
EducationBE-TransEarly Exit
BE-TransLate Exit
BE-DualTwo-Way
BE-DualOne-Way ESL
ESLContent
ESLPull-Out
LEP NoServices
LEP WithServices
TotalELL
STAARPercent at Level II Satisfactory Standard or AboveAll Grades
All Subjects 2016 75% 63% 71% 67% 67% - - - 69% 69% - - 68% 68%
Reading 2016 73% 61% 75% 68% 68% - - - 75% 75% - - 71% 71%
Mathematics 2016 76% 65% 74% 76% 76% - - - 71% 71% - - 74% 74%
Writing 2016 69% 56% 54% 42% 42% - - - * * - - 44% 44%
Science 2016 79% 68% 65% 64% 64% - - - * * - - 59% 59%
STAARPercent at Postsecondary Readiness StandardAll Grades
Two or More Subjects 2016 45% 31% 31% 32% 32% - - - * * - - 31% 31%
Reading 2016 46% 34% 42% 39% 39% - - - 43% 43% - - 40% 40%
Mathematics 2016 43% 28% 35% 38% 38% - - - * * - - 34% 34%
Writing 2016 41% 27% 20% * * - - - * * - - * *
Science 2016 47% 33% 22% * * - - - * * - - * *
STAARPercent at Advanced StandardAll Grades
All Subjects 2016 18% 10% 16% 21% 21% - - - 16% 16% - - 19% 19%
Reading 2016 17% 9% 21% 26% 26% - - - 18% 18% - - 23% 23%
Mathematics 2016 19% 12% 19% 28% 28% - - - 21% 21% - - 26% 26%
Writing 2016 15% 7% * * * - - - * * - - * *
Science 2016 16% 11% * * * - - - * * - - * *
STAARPercent Met or Exceeded ProgressAll Grades
All Subjects 2016 62% 59% 61% 67% 67% - - - 58% 58% - - 64% 64%

TEA Division of Performance Reporting Page 5
TEXAS EDUCATION AGENCYDistrict Name: MANOR ISD Texas Academic Performance Report Total Students: 541
Campus Name: BLUEBONNET TRAIL EL 2015-16 Campus Performance Grade Span: PK - 05Campus Number: 227907102 Bilingual Education/English as a Second Language (Current Year ELL Students)
State District CampusBilingual
EducationBE-TransEarly Exit
BE-TransLate Exit
BE-DualTwo-Way
BE-DualOne-Way ESL
ESLContent
ESLPull-Out
LEP NoServices
LEP WithServices
TotalELL
STAARPercent Met or Exceeded ProgressAll Grades
Reading 2016 60% 59% 65% 67% 67% - - - 63% 63% - - 65% 65%
Mathematics 2016 63% 58% 57% 67% 67% - - - 54% 54% - - 63% 63%
STAARPercent Exceeded ProgressAll Grades
All Subjects 2016 17% 17% 23% 33% 33% - - - 25% 25% - - 30% 30%
Reading 2016 16% 17% 27% 33% 33% - - - 29% 29% - - 32% 32%
Mathematics 2016 17% 16% 19% 33% 33% - - - 21% 21% - - 29% 29%
Progress of Prior-Year Non-Proficient StudentsSum of Grades 4-8
Reading 2016 35% 32% 45% * * - - - * * - - * *

TEA Division of Performance Reporting Page 6
TEXAS EDUCATION AGENCYDistrict Name: MANOR ISD Texas Academic Performance Report Total Students: 541
Campus Name: BLUEBONNET TRAIL EL 2015-16 Campus Participation Grade Span: PK - 05Campus Number: 227907102 School Type: Elementary
State District CampusAfrican
American Hispanic WhiteAmerican
Indian AsianPacific
Islander
Two orMoreRaces
SpecialEd
EconDisadv ELL
2016 STAARParticipation(All Grades)
All TestsTest Participant 99% 99% 100% 99% 100% 100% - 100% * 100% 100% 100% 100%
Included in Accountability 94% 92% 93% 91% 95% 92% - 85% * 100% 100% 95% 93%Not Included in Accountability
Mobile 4% 6% 7% 9% 5% 8% - 13% * 0% 0% 4% 7%Other Exclusions 1% 1% 0% 0% 0% 0% - 2% * 0% 0% 0% 0%
Not Tested 1% 1% 0% 1% 0% 0% - 0% * 0% 0% 0% 0%Absent 1% 1% 0% 1% 0% 0% - 0% * 0% 0% 0% 0%Other 0% 0% 0% 0% 0% 0% - 0% * 0% 0% 0% 0%

TEA Division of Performance Reporting Page 7
TEXAS EDUCATION AGENCYDistrict Name: MANOR ISD Texas Academic Performance Report Total Students: 541
Campus Name: BLUEBONNET TRAIL EL 2015-16 Campus Attendance and Postsecondary Readiness Grade Span: PK - 05Campus Number: 227907102 School Type: Elementary
State District CampusAfrican
American Hispanic WhiteAmerican
Indian AsianPacific
IslanderTwo or
More RacesSpecial
EdEcon
Disadv ELL
Attendance Rate2014-15 95.7% 94.9% 97.4% 98.0% 97.3% 96.5% - 98.0% * 97.6% 96.8% 97.4% 97.7%2013-14 95.9% 94.9% 97.1% 97.6% 96.9% 96.0% * 98.2% * 97.0% 96.5% 97.0% 97.2%
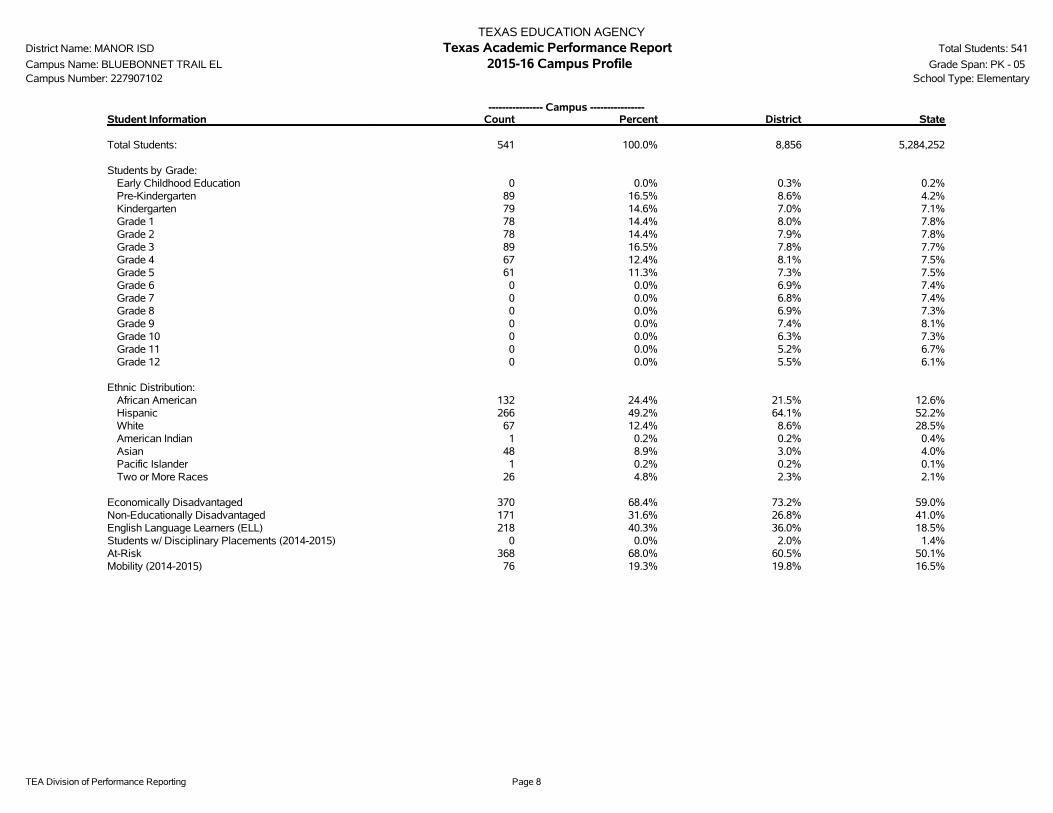
TEA Division of Performance Reporting Page 8
TEXAS EDUCATION AGENCYDistrict Name: MANOR ISD Texas Academic Performance Report Total Students: 541
Campus Name: BLUEBONNET TRAIL EL 2015-16 Campus Profile Grade Span: PK - 05Campus Number: 227907102 School Type: Elementary
---------------- Campus ----------------Student Information Count Percent District State
Total Students: 541 100.0% 8,856 5,284,252
Students by Grade:Early Childhood Education 0 0.0% 0.3% 0.2%Pre-Kindergarten 89 16.5% 8.6% 4.2%Kindergarten 79 14.6% 7.0% 7.1%Grade 1 78 14.4% 8.0% 7.8%Grade 2 78 14.4% 7.9% 7.8%Grade 3 89 16.5% 7.8% 7.7%Grade 4 67 12.4% 8.1% 7.5%Grade 5 61 11.3% 7.3% 7.5%Grade 6 0 0.0% 6.9% 7.4%Grade 7 0 0.0% 6.8% 7.4%Grade 8 0 0.0% 6.9% 7.3%Grade 9 0 0.0% 7.4% 8.1%Grade 10 0 0.0% 6.3% 7.3%Grade 11 0 0.0% 5.2% 6.7%Grade 12 0 0.0% 5.5% 6.1%
Ethnic Distribution:African American 132 24.4% 21.5% 12.6%Hispanic 266 49.2% 64.1% 52.2%White 67 12.4% 8.6% 28.5%American Indian 1 0.2% 0.2% 0.4%Asian 48 8.9% 3.0% 4.0%Pacific Islander 1 0.2% 0.2% 0.1%Two or More Races 26 4.8% 2.3% 2.1%
Economically Disadvantaged 370 68.4% 73.2% 59.0%Non-Educationally Disadvantaged 171 31.6% 26.8% 41.0%English Language Learners (ELL) 218 40.3% 36.0% 18.5%Students w/ Disciplinary Placements (2014-2015) 0 0.0% 2.0% 1.4%At-Risk 368 68.0% 60.5% 50.1%Mobility (2014-2015) 76 19.3% 19.8% 16.5%
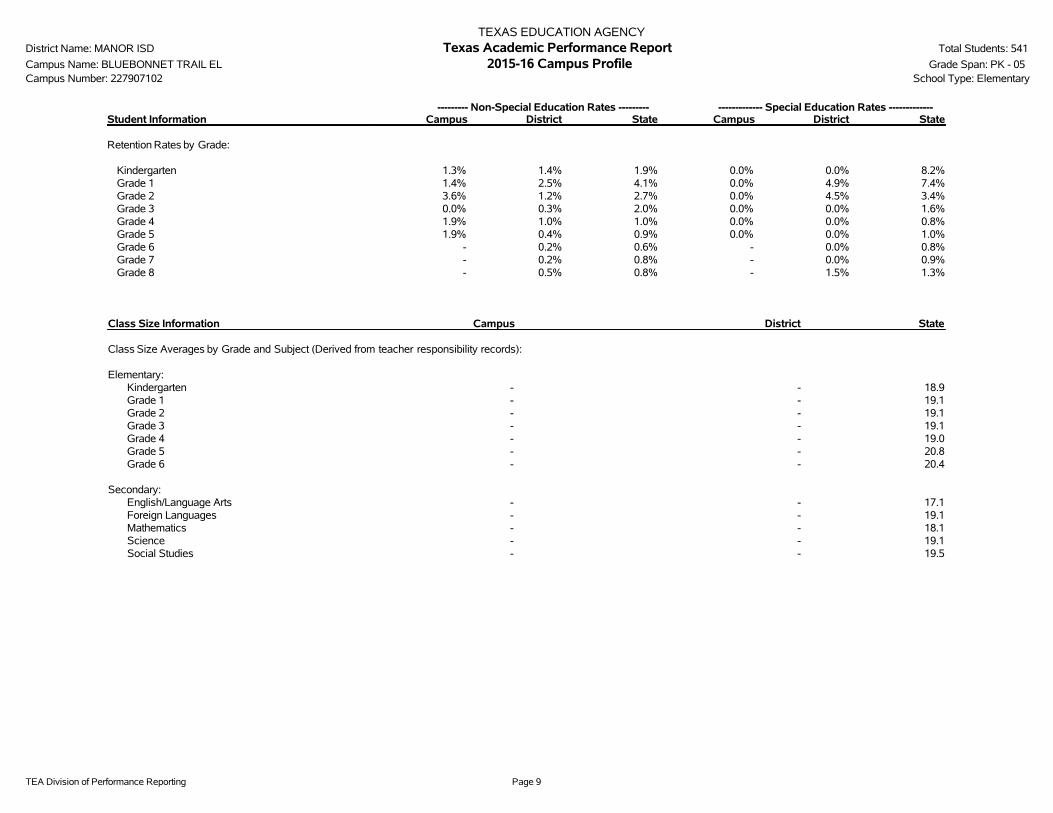
TEA Division of Performance Reporting Page 9
TEXAS EDUCATION AGENCYDistrict Name: MANOR ISD Texas Academic Performance Report Total Students: 541
Campus Name: BLUEBONNET TRAIL EL 2015-16 Campus Profile Grade Span: PK - 05Campus Number: 227907102 School Type: Elementary
--------- Non-Special Education Rates --------- ------------- Special Education Rates -------------Student Information Campus District State Campus District State
Retention Rates by Grade:
Kindergarten 1.3% 1.4% 1.9% 0.0% 0.0% 8.2%Grade 1 1.4% 2.5% 4.1% 0.0% 4.9% 7.4%Grade 2 3.6% 1.2% 2.7% 0.0% 4.5% 3.4%Grade 3 0.0% 0.3% 2.0% 0.0% 0.0% 1.6%Grade 4 1.9% 1.0% 1.0% 0.0% 0.0% 0.8%Grade 5 1.9% 0.4% 0.9% 0.0% 0.0% 1.0%Grade 6 - 0.2% 0.6% - 0.0% 0.8%Grade 7 - 0.2% 0.8% - 0.0% 0.9%Grade 8 - 0.5% 0.8% - 1.5% 1.3%
Class Size Information Campus District State
Class Size Averages by Grade and Subject (Derived from teacher responsibility records):
Elementary:Kindergarten - - 18.9Grade 1 - - 19.1Grade 2 - - 19.1Grade 3 - - 19.1Grade 4 - - 19.0Grade 5 - - 20.8Grade 6 - - 20.4
Secondary:English/Language Arts - - 17.1Foreign Languages - - 19.1Mathematics - - 18.1Science - - 19.1Social Studies - - 19.5

TEA Division of Performance Reporting Page 10
TEXAS EDUCATION AGENCYDistrict Name: MANOR ISD Texas Academic Performance Report Total Students: 541
Campus Name: BLUEBONNET TRAIL EL 2015-16 Campus Profile Grade Span: PK - 05Campus Number: 227907102 School Type: Elementary
---------------- Campus ----------------Staff Information Count/Average Percent District State
Total Staff - 100.0% 100.0% 100.0%
Professional Staff: - - - 64.3%Teachers - - - 50.5%Professional Support - - - 9.8%Campus Administration (School Leadership) - - - 2.9%
Educational Aides: - - - 9.6%
Total Minority Staff: - - - 48.2%
Teachers by Ethnicity and Sex:African American - - - 10.1%Hispanic - - - 26.0%White - - - 60.8%American Indian - - - 0.4%Asian - - - 1.5%Pacific Islander - - - 0.2%Two or More Races - - - 1.1%
Males - - - 23.5%Females - - - 76.5%
Teachers by Highest Degree Held:No Degree - - - 1.0%Bachelors - - - 74.7%Masters - - - 23.6%Doctorate - - - 0.6%
Teachers by Years of Experience:Beginning Teachers - - - 8.1%1-5 Years Experience - - - 27.3%6-10 Years Experience - - - 21.7%11-20 Years Experience - - - 27.3%Over 20 Years Experience - - - 15.7%
Number of Students per Teacher - n/a - 15.2

TEA Division of Performance Reporting Page 11
TEXAS EDUCATION AGENCYDistrict Name: MANOR ISD Texas Academic Performance Report Total Students: 541
Campus Name: BLUEBONNET TRAIL EL 2015-16 Campus Profile Grade Span: PK - 05Campus Number: 227907102 School Type: Elementary
Staff Information Campus District State
Average Years Experience of Teachers: - - 10.9Average Years Experience of Teachers with District: - - 7.3
Average Teacher Salary by Years of Experience (regular duties only):Beginning Teachers - - $45,5071-5 Years Experience - - $47,9966-10 Years Experience - - $50,45911-20 Years Experience - - $53,794Over 20 Years Experience - - $60,613
Average Actual Salaries (regular duties only):Teachers - - $51,891Professional Support - - $61,145Campus Administration (School Leadership) - - $75,654
Instructional Staff Percent: n/a - 64.5%
Contracted Instructional Staff (not incl. above): - - 1,914.4

TEA Division of Performance Reporting Page 12
TEXAS EDUCATION AGENCYDistrict Name: MANOR ISD Texas Academic Performance Report Total Students: 541
Campus Name: BLUEBONNET TRAIL EL 2015-16 Campus Profile Grade Span: PK - 05Campus Number: 227907102 School Type: Elementary
---------------- Campus ----------------Program Information Count Percent District State
Student Enrollment by Program:Bilingual/ESL Education 218 40.3% 35.7% 18.3%Career & Technical Education 0 0.0% 28.7% 24.3%Gifted & Talented Education 32 5.9% 7.3% 7.7%Special Education 26 4.8% 7.8% 8.6%
Teachers by Program (population served):Bilingual/ESL Education - - - 5.9%Career & Technical Education - - - 4.4%Compensatory Education - - - 2.9%Gifted & Talented Education - - - 1.9%Regular Education - - - 72.6%Special Education - - - 8.8%Other - - - 3.4%
Link to: PEIMS Financial Standard Reports/ 2014-2015 Financial Actual Report
' '̂ Indicates that ELL rates at met or exceeded standard and exceeded standard include current and monitored students.'*' Indicates results are masked due to small numbers to protect student confidentiality.'-' Indicates zero observations reported for this group.'n/a' Indicates data reporting is not applicable for this group.'**' Indicates that rates for Reading and Mathematics are based on the cumulative results from the first and second administrations of STAAR.'?' Indicates that the data for this item were statistically improbable, or were reported outside a reasonable range.'##' Indicates that PID Error rate information cannot be reported in 2015-16 due to the transition from PEIMS Edit+ to TSDS.

2015-16 Texas Academic Performance Report
District Name: MANOR ISD
Campus Name: DECKER EL
Campus Number: 227907104
2016 Accountability Rating: Met Standard
Distinction Designations:
Top 25 Percent: Student Progress

This page intentionally left blank.
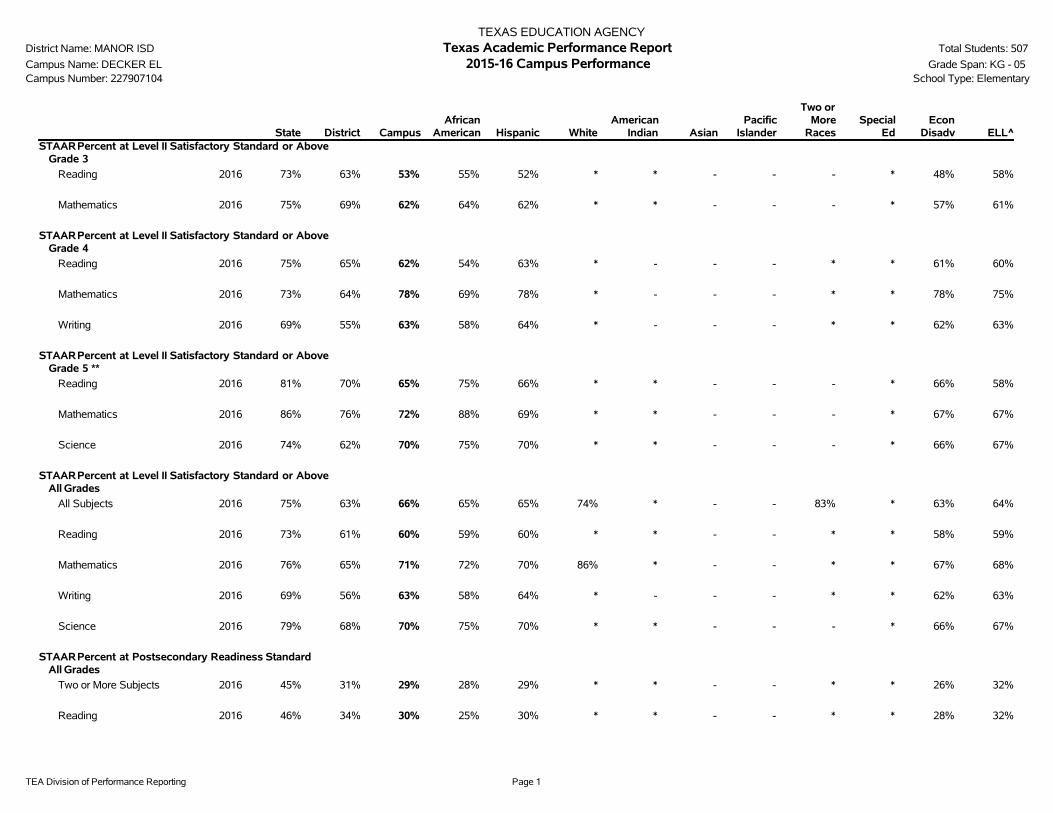
TEA Division of Performance Reporting Page 1
TEXAS EDUCATION AGENCYDistrict Name: MANOR ISD Texas Academic Performance Report Total Students: 507
Campus Name: DECKER EL 2015-16 Campus Performance Grade Span: KG - 05Campus Number: 227907104 School Type: Elementary
State District CampusAfrican
American Hispanic WhiteAmerican
Indian AsianPacific
Islander
Two orMore
RacesSpecial
EdEcon
Disadv ELL^STAARPercent at Level II Satisfactory Standard or Above
Grade 3
Reading 2016 73% 63% 53% 55% 52% * * - - - * 48% 58%
Mathematics 2016 75% 69% 62% 64% 62% * * - - - * 57% 61%
STAARPercent at Level II Satisfactory Standard or AboveGrade 4
Reading 2016 75% 65% 62% 54% 63% * - - - * * 61% 60%
Mathematics 2016 73% 64% 78% 69% 78% * - - - * * 78% 75%
Writing 2016 69% 55% 63% 58% 64% * - - - * * 62% 63%
STAARPercent at Level II Satisfactory Standard or AboveGrade 5 **
Reading 2016 81% 70% 65% 75% 66% * * - - - * 66% 58%
Mathematics 2016 86% 76% 72% 88% 69% * * - - - * 67% 67%
Science 2016 74% 62% 70% 75% 70% * * - - - * 66% 67%
STAARPercent at Level II Satisfactory Standard or AboveAll Grades
All Subjects 2016 75% 63% 66% 65% 65% 74% * - - 83% * 63% 64%
Reading 2016 73% 61% 60% 59% 60% * * - - * * 58% 59%
Mathematics 2016 76% 65% 71% 72% 70% 86% * - - * * 67% 68%
Writing 2016 69% 56% 63% 58% 64% * - - - * * 62% 63%
Science 2016 79% 68% 70% 75% 70% * * - - - * 66% 67%
STAARPercent at Postsecondary Readiness StandardAll Grades
Two or More Subjects 2016 45% 31% 29% 28% 29% * * - - * * 26% 32%
Reading 2016 46% 34% 30% 25% 30% * * - - * * 28% 32%

TEA Division of Performance Reporting Page 2
TEXAS EDUCATION AGENCYDistrict Name: MANOR ISD Texas Academic Performance Report Total Students: 507
Campus Name: DECKER EL 2015-16 Campus Performance Grade Span: KG - 05Campus Number: 227907104 School Type: Elementary
State District CampusAfrican
American Hispanic WhiteAmerican
Indian AsianPacific
Islander
Two orMore
RacesSpecial
EdEcon
Disadv ELL^STAARPercent at Postsecondary Readiness Standard
All Grades
Mathematics 2016 43% 28% 37% 34% 37% * * - - * * 32% 36%
Writing 2016 41% 27% 34% * 37% * - - - * * 33% 48%
Science 2016 47% 33% 21% * 20% * * - - - * 22% 17%
STAARPercent at Advanced StandardAll Grades
All Subjects 2016 18% 10% 12% 6% 12% 37% * - - * * 11% 12%
Reading 2016 17% 9% 7% * 6% * * - - * * 7% 6%
Mathematics 2016 19% 12% 20% * 22% * * - - * * 18% 23%
Writing 2016 15% 7% 11% * 11% * - - - * * 13% 9%
Science 2016 16% 11% * * * * * - - - * * *
STAARPercent Met or Exceeded ProgressAll Grades
All Subjects 2016 62% 59% 77% 88% 75% 90% * - - * 60% 76% 72%
Reading 2016 60% 59% 68% * 67% * * - - * * 67% 63%
Mathematics 2016 63% 58% 86% 100% 83% 100% * - - * * 85% 81%
STAARPercent Exceeded ProgressAll Grades
All Subjects 2016 17% 17% 38% 30% 38% 80% * - - * 40% 39% 35%
Reading 2016 16% 17% 26% * 27% * * - - * * 30% 23%
Mathematics 2016 17% 16% 50% 50% 47% 100% * - - * * 48% 46%
Progress of Prior-Year Non-Proficient StudentsSum of Grades 4-8
Reading 2016 35% 32% 39% * 41% * * - - * * 39% 33%
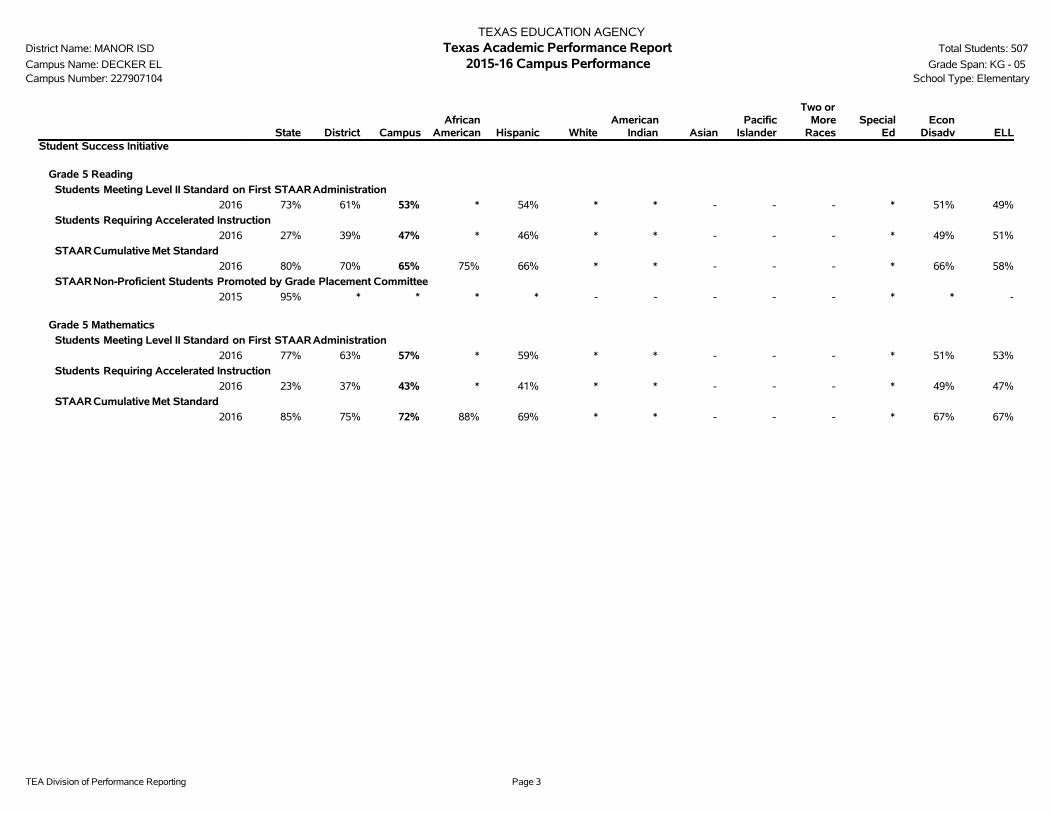
TEA Division of Performance Reporting Page 3
TEXAS EDUCATION AGENCYDistrict Name: MANOR ISD Texas Academic Performance Report Total Students: 507
Campus Name: DECKER EL 2015-16 Campus Performance Grade Span: KG - 05Campus Number: 227907104 School Type: Elementary
State District CampusAfrican
American Hispanic WhiteAmerican
Indian AsianPacific
Islander
Two orMore
RacesSpecial
EdEcon
Disadv ELLStudent Success Initiative
Grade 5 Reading
Students Meeting Level II Standard on First STAARAdministration
2016 73% 61% 53% * 54% * * - - - * 51% 49%
Students Requiring Accelerated Instruction
2016 27% 39% 47% * 46% * * - - - * 49% 51%
STAARCumulative Met Standard
2016 80% 70% 65% 75% 66% * * - - - * 66% 58%
STAARNon-Proficient Students Promoted by Grade Placement Committee
2015 95% * * * * - - - - - * * -
Grade 5 Mathematics
Students Meeting Level II Standard on First STAARAdministration
2016 77% 63% 57% * 59% * * - - - * 51% 53%
Students Requiring Accelerated Instruction
2016 23% 37% 43% * 41% * * - - - * 49% 47%
STAARCumulative Met Standard
2016 85% 75% 72% 88% 69% * * - - - * 67% 67%
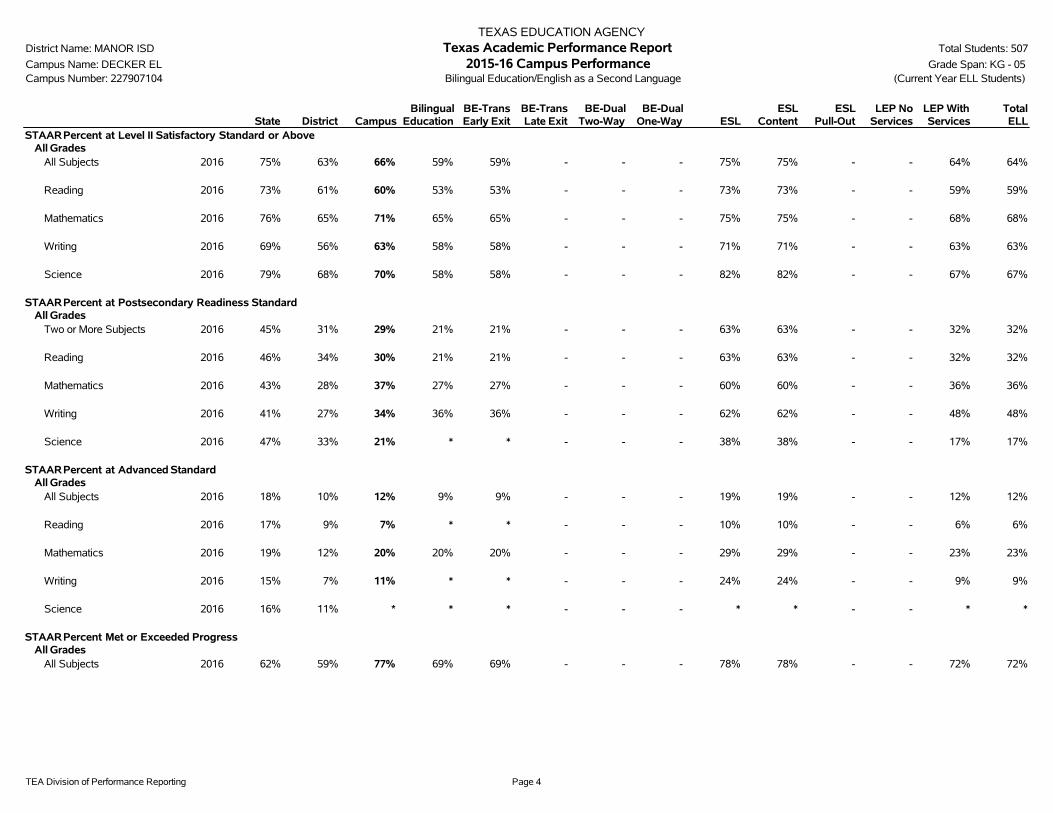
TEA Division of Performance Reporting Page 4
TEXAS EDUCATION AGENCYDistrict Name: MANOR ISD Texas Academic Performance Report Total Students: 507
Campus Name: DECKER EL 2015-16 Campus Performance Grade Span: KG - 05Campus Number: 227907104 Bilingual Education/English as a Second Language (Current Year ELL Students)
State District CampusBilingual
EducationBE-TransEarly Exit
BE-TransLate Exit
BE-DualTwo-Way
BE-DualOne-Way ESL
ESLContent
ESLPull-Out
LEP NoServices
LEP WithServices
TotalELL
STAARPercent at Level II Satisfactory Standard or AboveAll Grades
All Subjects 2016 75% 63% 66% 59% 59% - - - 75% 75% - - 64% 64%
Reading 2016 73% 61% 60% 53% 53% - - - 73% 73% - - 59% 59%
Mathematics 2016 76% 65% 71% 65% 65% - - - 75% 75% - - 68% 68%
Writing 2016 69% 56% 63% 58% 58% - - - 71% 71% - - 63% 63%
Science 2016 79% 68% 70% 58% 58% - - - 82% 82% - - 67% 67%
STAARPercent at Postsecondary Readiness StandardAll Grades
Two or More Subjects 2016 45% 31% 29% 21% 21% - - - 63% 63% - - 32% 32%
Reading 2016 46% 34% 30% 21% 21% - - - 63% 63% - - 32% 32%
Mathematics 2016 43% 28% 37% 27% 27% - - - 60% 60% - - 36% 36%
Writing 2016 41% 27% 34% 36% 36% - - - 62% 62% - - 48% 48%
Science 2016 47% 33% 21% * * - - - 38% 38% - - 17% 17%
STAARPercent at Advanced StandardAll Grades
All Subjects 2016 18% 10% 12% 9% 9% - - - 19% 19% - - 12% 12%
Reading 2016 17% 9% 7% * * - - - 10% 10% - - 6% 6%
Mathematics 2016 19% 12% 20% 20% 20% - - - 29% 29% - - 23% 23%
Writing 2016 15% 7% 11% * * - - - 24% 24% - - 9% 9%
Science 2016 16% 11% * * * - - - * * - - * *
STAARPercent Met or Exceeded ProgressAll Grades
All Subjects 2016 62% 59% 77% 69% 69% - - - 78% 78% - - 72% 72%
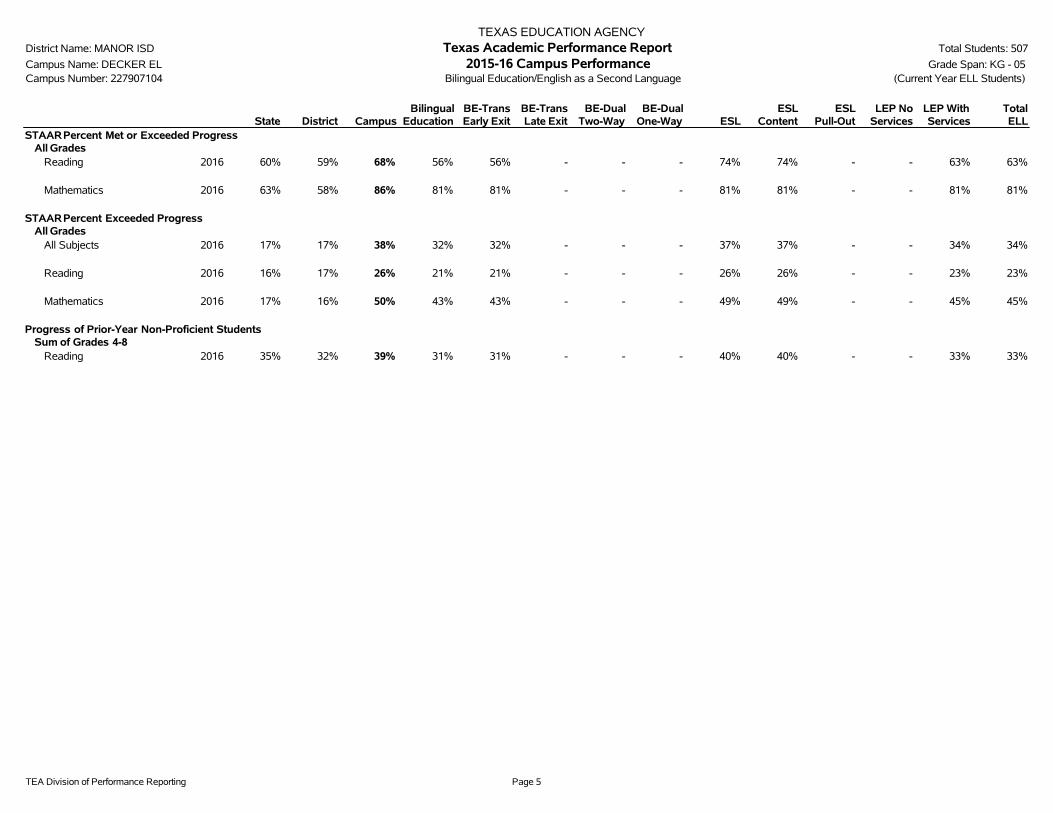
TEA Division of Performance Reporting Page 5
TEXAS EDUCATION AGENCYDistrict Name: MANOR ISD Texas Academic Performance Report Total Students: 507
Campus Name: DECKER EL 2015-16 Campus Performance Grade Span: KG - 05Campus Number: 227907104 Bilingual Education/English as a Second Language (Current Year ELL Students)
State District CampusBilingual
EducationBE-TransEarly Exit
BE-TransLate Exit
BE-DualTwo-Way
BE-DualOne-Way ESL
ESLContent
ESLPull-Out
LEP NoServices
LEP WithServices
TotalELL
STAARPercent Met or Exceeded ProgressAll Grades
Reading 2016 60% 59% 68% 56% 56% - - - 74% 74% - - 63% 63%
Mathematics 2016 63% 58% 86% 81% 81% - - - 81% 81% - - 81% 81%
STAARPercent Exceeded ProgressAll Grades
All Subjects 2016 17% 17% 38% 32% 32% - - - 37% 37% - - 34% 34%
Reading 2016 16% 17% 26% 21% 21% - - - 26% 26% - - 23% 23%
Mathematics 2016 17% 16% 50% 43% 43% - - - 49% 49% - - 45% 45%
Progress of Prior-Year Non-Proficient StudentsSum of Grades 4-8
Reading 2016 35% 32% 39% 31% 31% - - - 40% 40% - - 33% 33%
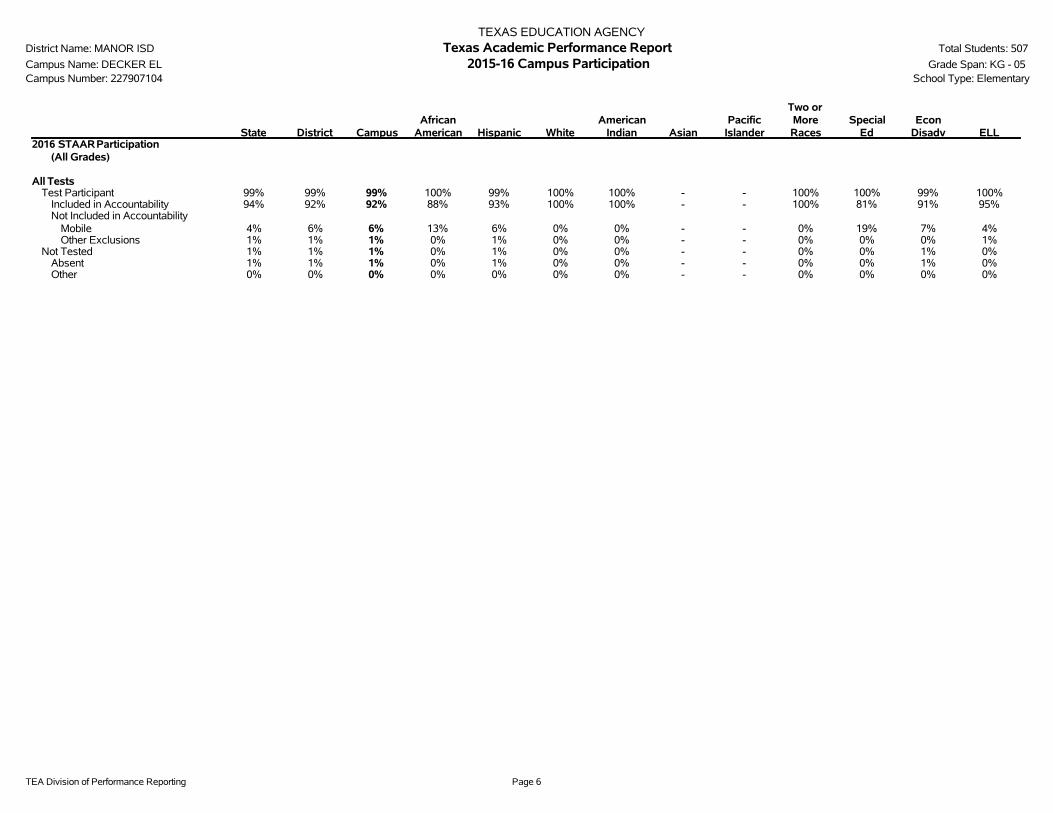
TEA Division of Performance Reporting Page 6
TEXAS EDUCATION AGENCYDistrict Name: MANOR ISD Texas Academic Performance Report Total Students: 507
Campus Name: DECKER EL 2015-16 Campus Participation Grade Span: KG - 05Campus Number: 227907104 School Type: Elementary
State District CampusAfrican
American Hispanic WhiteAmerican
Indian AsianPacific
Islander
Two orMoreRaces
SpecialEd
EconDisadv ELL
2016 STAARParticipation(All Grades)
All TestsTest Participant 99% 99% 99% 100% 99% 100% 100% - - 100% 100% 99% 100%
Included in Accountability 94% 92% 92% 88% 93% 100% 100% - - 100% 81% 91% 95%Not Included in Accountability
Mobile 4% 6% 6% 13% 6% 0% 0% - - 0% 19% 7% 4%Other Exclusions 1% 1% 1% 0% 1% 0% 0% - - 0% 0% 0% 1%
Not Tested 1% 1% 1% 0% 1% 0% 0% - - 0% 0% 1% 0%Absent 1% 1% 1% 0% 1% 0% 0% - - 0% 0% 1% 0%Other 0% 0% 0% 0% 0% 0% 0% - - 0% 0% 0% 0%

TEA Division of Performance Reporting Page 7
TEXAS EDUCATION AGENCYDistrict Name: MANOR ISD Texas Academic Performance Report Total Students: 507
Campus Name: DECKER EL 2015-16 Campus Attendance and Postsecondary Readiness Grade Span: KG - 05Campus Number: 227907104 School Type: Elementary
State District CampusAfrican
American Hispanic WhiteAmerican
Indian AsianPacific
IslanderTwo or
More RacesSpecial
EdEcon
Disadv ELL
Attendance Rate2014-15 95.7% 94.9% 95.9% 96.1% 95.9% 96.4% * * - * 95.4% 96.0% 96.5%2013-14 95.9% 94.9% 96.1% 95.4% 96.4% 95.2% * * - 92.2% 95.0% 96.1% 96.7%

TEA Division of Performance Reporting Page 8
TEXAS EDUCATION AGENCYDistrict Name: MANOR ISD Texas Academic Performance Report Total Students: 507
Campus Name: DECKER EL 2015-16 Campus Profile Grade Span: KG - 05Campus Number: 227907104 School Type: Elementary
---------------- Campus ----------------Student Information Count Percent District State
Total Students: 507 100.0% 8,856 5,284,252
Students by Grade:Early Childhood Education 0 0.0% 0.3% 0.2%Pre-Kindergarten 0 0.0% 8.6% 4.2%Kindergarten 76 15.0% 7.0% 7.1%Grade 1 77 15.2% 8.0% 7.8%Grade 2 82 16.2% 7.9% 7.8%Grade 3 89 17.6% 7.8% 7.7%Grade 4 97 19.1% 8.1% 7.5%Grade 5 86 17.0% 7.3% 7.5%Grade 6 0 0.0% 6.9% 7.4%Grade 7 0 0.0% 6.8% 7.4%Grade 8 0 0.0% 6.9% 7.3%Grade 9 0 0.0% 7.4% 8.1%Grade 10 0 0.0% 6.3% 7.3%Grade 11 0 0.0% 5.2% 6.7%Grade 12 0 0.0% 5.5% 6.1%
Ethnic Distribution:African American 63 12.4% 21.5% 12.6%Hispanic 422 83.2% 64.1% 52.2%White 15 3.0% 8.6% 28.5%American Indian 3 0.6% 0.2% 0.4%Asian 0 0.0% 3.0% 4.0%Pacific Islander 0 0.0% 0.2% 0.1%Two or More Races 4 0.8% 2.3% 2.1%
Economically Disadvantaged 320 63.1% 73.2% 59.0%Non-Educationally Disadvantaged 187 36.9% 26.8% 41.0%English Language Learners (ELL) 335 66.1% 36.0% 18.5%Students w/ Disciplinary Placements (2014-2015) 0 0.0% 2.0% 1.4%At-Risk 421 83.0% 60.5% 50.1%Mobility (2014-2015) 125 20.8% 19.8% 16.5%
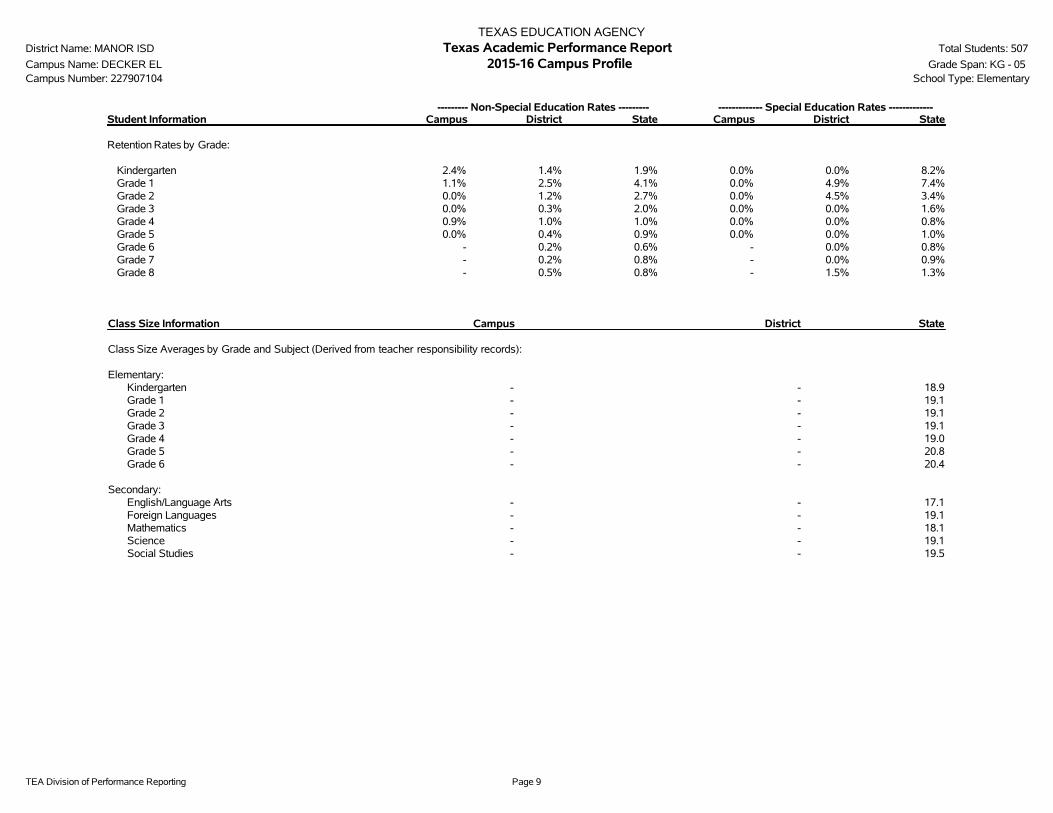
TEA Division of Performance Reporting Page 9
TEXAS EDUCATION AGENCYDistrict Name: MANOR ISD Texas Academic Performance Report Total Students: 507
Campus Name: DECKER EL 2015-16 Campus Profile Grade Span: KG - 05Campus Number: 227907104 School Type: Elementary
--------- Non-Special Education Rates --------- ------------- Special Education Rates -------------Student Information Campus District State Campus District State
Retention Rates by Grade:
Kindergarten 2.4% 1.4% 1.9% 0.0% 0.0% 8.2%Grade 1 1.1% 2.5% 4.1% 0.0% 4.9% 7.4%Grade 2 0.0% 1.2% 2.7% 0.0% 4.5% 3.4%Grade 3 0.0% 0.3% 2.0% 0.0% 0.0% 1.6%Grade 4 0.9% 1.0% 1.0% 0.0% 0.0% 0.8%Grade 5 0.0% 0.4% 0.9% 0.0% 0.0% 1.0%Grade 6 - 0.2% 0.6% - 0.0% 0.8%Grade 7 - 0.2% 0.8% - 0.0% 0.9%Grade 8 - 0.5% 0.8% - 1.5% 1.3%
Class Size Information Campus District State
Class Size Averages by Grade and Subject (Derived from teacher responsibility records):
Elementary:Kindergarten - - 18.9Grade 1 - - 19.1Grade 2 - - 19.1Grade 3 - - 19.1Grade 4 - - 19.0Grade 5 - - 20.8Grade 6 - - 20.4
Secondary:English/Language Arts - - 17.1Foreign Languages - - 19.1Mathematics - - 18.1Science - - 19.1Social Studies - - 19.5

TEA Division of Performance Reporting Page 10
TEXAS EDUCATION AGENCYDistrict Name: MANOR ISD Texas Academic Performance Report Total Students: 507
Campus Name: DECKER EL 2015-16 Campus Profile Grade Span: KG - 05Campus Number: 227907104 School Type: Elementary
---------------- Campus ----------------Staff Information Count/Average Percent District State
Total Staff - 100.0% 100.0% 100.0%
Professional Staff: - - - 64.3%Teachers - - - 50.5%Professional Support - - - 9.8%Campus Administration (School Leadership) - - - 2.9%
Educational Aides: - - - 9.6%
Total Minority Staff: - - - 48.2%
Teachers by Ethnicity and Sex:African American - - - 10.1%Hispanic - - - 26.0%White - - - 60.8%American Indian - - - 0.4%Asian - - - 1.5%Pacific Islander - - - 0.2%Two or More Races - - - 1.1%
Males - - - 23.5%Females - - - 76.5%
Teachers by Highest Degree Held:No Degree - - - 1.0%Bachelors - - - 74.7%Masters - - - 23.6%Doctorate - - - 0.6%
Teachers by Years of Experience:Beginning Teachers - - - 8.1%1-5 Years Experience - - - 27.3%6-10 Years Experience - - - 21.7%11-20 Years Experience - - - 27.3%Over 20 Years Experience - - - 15.7%
Number of Students per Teacher - n/a - 15.2

TEA Division of Performance Reporting Page 11
TEXAS EDUCATION AGENCYDistrict Name: MANOR ISD Texas Academic Performance Report Total Students: 507
Campus Name: DECKER EL 2015-16 Campus Profile Grade Span: KG - 05Campus Number: 227907104 School Type: Elementary
Staff Information Campus District State
Average Years Experience of Teachers: - - 10.9Average Years Experience of Teachers with District: - - 7.3
Average Teacher Salary by Years of Experience (regular duties only):Beginning Teachers - - $45,5071-5 Years Experience - - $47,9966-10 Years Experience - - $50,45911-20 Years Experience - - $53,794Over 20 Years Experience - - $60,613
Average Actual Salaries (regular duties only):Teachers - - $51,891Professional Support - - $61,145Campus Administration (School Leadership) - - $75,654
Instructional Staff Percent: n/a - 64.5%
Contracted Instructional Staff (not incl. above): - - 1,914.4

TEA Division of Performance Reporting Page 12
TEXAS EDUCATION AGENCYDistrict Name: MANOR ISD Texas Academic Performance Report Total Students: 507
Campus Name: DECKER EL 2015-16 Campus Profile Grade Span: KG - 05Campus Number: 227907104 School Type: Elementary
---------------- Campus ----------------Program Information Count Percent District State
Student Enrollment by Program:Bilingual/ESL Education 335 66.1% 35.7% 18.3%Career & Technical Education 0 0.0% 28.7% 24.3%Gifted & Talented Education 37 7.3% 7.3% 7.7%Special Education 19 3.7% 7.8% 8.6%
Teachers by Program (population served):Bilingual/ESL Education - - - 5.9%Career & Technical Education - - - 4.4%Compensatory Education - - - 2.9%Gifted & Talented Education - - - 1.9%Regular Education - - - 72.6%Special Education - - - 8.8%Other - - - 3.4%
Link to: PEIMS Financial Standard Reports/ 2014-2015 Financial Actual Report
' '̂ Indicates that ELL rates at met or exceeded standard and exceeded standard include current and monitored students.'*' Indicates results are masked due to small numbers to protect student confidentiality.'-' Indicates zero observations reported for this group.'n/a' Indicates data reporting is not applicable for this group.'**' Indicates that rates for Reading and Mathematics are based on the cumulative results from the first and second administrations of STAAR.'?' Indicates that the data for this item were statistically improbable, or were reported outside a reasonable range.'##' Indicates that PID Error rate information cannot be reported in 2015-16 due to the transition from PEIMS Edit+ to TSDS.

2015-16 Texas Academic Performance Report
District Name: MANOR ISD
Campus Name: BLAKE MANOR EL
Campus Number: 227907105
2016 Accountability Rating: Met Standard

This page intentionally left blank.
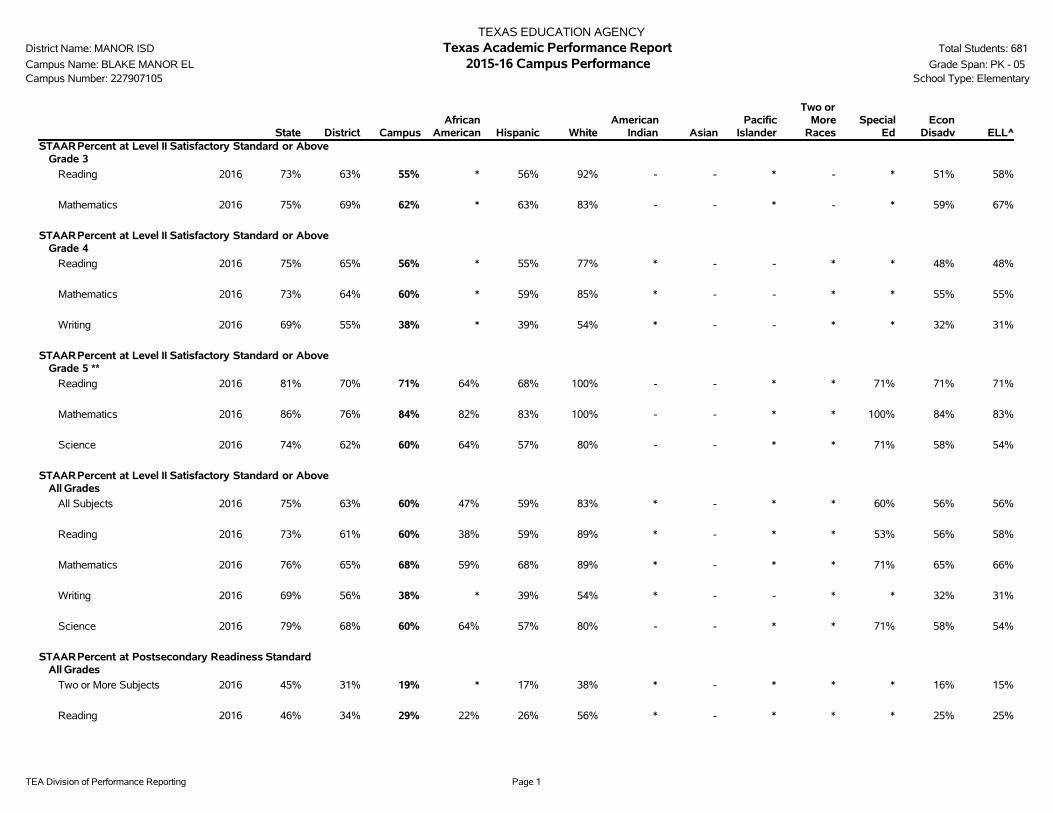
TEA Division of Performance Reporting Page 1
TEXAS EDUCATION AGENCYDistrict Name: MANOR ISD Texas Academic Performance Report Total Students: 681
Campus Name: BLAKE MANOR EL 2015-16 Campus Performance Grade Span: PK - 05Campus Number: 227907105 School Type: Elementary
State District CampusAfrican
American Hispanic WhiteAmerican
Indian AsianPacific
Islander
Two orMore
RacesSpecial
EdEcon
Disadv ELL^STAARPercent at Level II Satisfactory Standard or Above
Grade 3
Reading 2016 73% 63% 55% * 56% 92% - - * - * 51% 58%
Mathematics 2016 75% 69% 62% * 63% 83% - - * - * 59% 67%
STAARPercent at Level II Satisfactory Standard or AboveGrade 4
Reading 2016 75% 65% 56% * 55% 77% * - - * * 48% 48%
Mathematics 2016 73% 64% 60% * 59% 85% * - - * * 55% 55%
Writing 2016 69% 55% 38% * 39% 54% * - - * * 32% 31%
STAARPercent at Level II Satisfactory Standard or AboveGrade 5 **
Reading 2016 81% 70% 71% 64% 68% 100% - - * * 71% 71% 71%
Mathematics 2016 86% 76% 84% 82% 83% 100% - - * * 100% 84% 83%
Science 2016 74% 62% 60% 64% 57% 80% - - * * 71% 58% 54%
STAARPercent at Level II Satisfactory Standard or AboveAll Grades
All Subjects 2016 75% 63% 60% 47% 59% 83% * - * * 60% 56% 56%
Reading 2016 73% 61% 60% 38% 59% 89% * - * * 53% 56% 58%
Mathematics 2016 76% 65% 68% 59% 68% 89% * - * * 71% 65% 66%
Writing 2016 69% 56% 38% * 39% 54% * - - * * 32% 31%
Science 2016 79% 68% 60% 64% 57% 80% - - * * 71% 58% 54%
STAARPercent at Postsecondary Readiness StandardAll Grades
Two or More Subjects 2016 45% 31% 19% * 17% 38% * - * * * 16% 15%
Reading 2016 46% 34% 29% 22% 26% 56% * - * * * 25% 25%

TEA Division of Performance Reporting Page 2
TEXAS EDUCATION AGENCYDistrict Name: MANOR ISD Texas Academic Performance Report Total Students: 681
Campus Name: BLAKE MANOR EL 2015-16 Campus Performance Grade Span: PK - 05Campus Number: 227907105 School Type: Elementary
State District CampusAfrican
American Hispanic WhiteAmerican
Indian AsianPacific
Islander
Two orMore
RacesSpecial
EdEcon
Disadv ELL^STAARPercent at Postsecondary Readiness Standard
All Grades
Mathematics 2016 43% 28% 22% * 22% 35% * - * * * 20% 23%
Writing 2016 41% 27% 13% * 10% * * - - * - 9% *
Science 2016 47% 33% 8% * * * - - * * * 9% *
STAARPercent at Advanced StandardAll Grades
All Subjects 2016 18% 10% 10% * 10% 18% * - * * * 9% 11%
Reading 2016 17% 9% 14% * 12% 31% * - * * * 12% 12%
Mathematics 2016 19% 12% 10% * 12% * * - * * * 10% 15%
Writing 2016 15% 7% * * * * * - - * * * *
Science 2016 16% 11% * * * * - - * * * * *
STAARPercent Met or Exceeded ProgressAll Grades
All Subjects 2016 62% 59% 62% 78% 61% 68% - - * * 65% 62% 58%
Reading 2016 60% 59% 60% 72% 58% 73% - - * * * 60% 56%
Mathematics 2016 63% 58% 64% 83% 63% 64% - - * * * 64% 61%
STAARPercent Exceeded ProgressAll Grades
All Subjects 2016 17% 17% 25% 39% 24% 23% - - * * 23% 25% 23%
Reading 2016 16% 17% 21% 28% 21% 23% - - * * * 22% 22%
Mathematics 2016 17% 16% 28% 50% 27% 23% - - * * * 28% 25%
Progress of Prior-Year Non-Proficient StudentsSum of Grades 4-8
Reading 2016 35% 32% 29% * 29% * - - - * * 29% 29%

TEA Division of Performance Reporting Page 3
TEXAS EDUCATION AGENCYDistrict Name: MANOR ISD Texas Academic Performance Report Total Students: 681
Campus Name: BLAKE MANOR EL 2015-16 Campus Performance Grade Span: PK - 05Campus Number: 227907105 School Type: Elementary
State District CampusAfrican
American Hispanic WhiteAmerican
Indian AsianPacific
Islander
Two orMore
RacesSpecial
EdEcon
Disadv ELLStudent Success Initiative
Grade 5 Reading
Students Meeting Level II Standard on First STAARAdministration
2016 73% 61% 62% 50% 58% 100% - - * * * 62% 63%
Students Requiring Accelerated Instruction
2016 27% 39% 38% 50% 42% * - - * * * 38% 37%
STAARCumulative Met Standard
2016 80% 70% 71% 70% 68% 100% - - * * * 72% 71%
Grade 5 Mathematics
Students Meeting Level II Standard on First STAARAdministration
2016 77% 63% 67% 60% 65% 90% - - * * * 65% 68%
Students Requiring Accelerated Instruction
2016 23% 37% 33% * 35% * - - * * * 35% 32%
STAARCumulative Met Standard
2016 85% 75% 83% 80% 82% 100% - - * * * 82% 80%
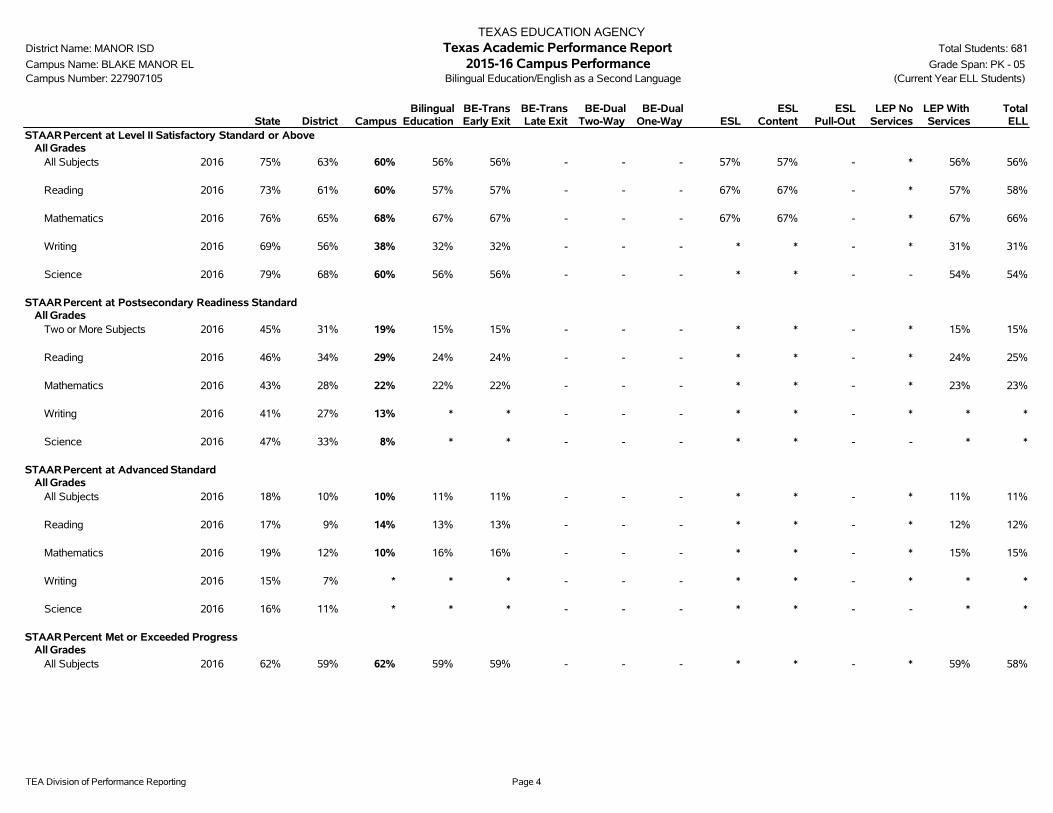
TEA Division of Performance Reporting Page 4
TEXAS EDUCATION AGENCYDistrict Name: MANOR ISD Texas Academic Performance Report Total Students: 681
Campus Name: BLAKE MANOR EL 2015-16 Campus Performance Grade Span: PK - 05Campus Number: 227907105 Bilingual Education/English as a Second Language (Current Year ELL Students)
State District CampusBilingual
EducationBE-TransEarly Exit
BE-TransLate Exit
BE-DualTwo-Way
BE-DualOne-Way ESL
ESLContent
ESLPull-Out
LEP NoServices
LEP WithServices
TotalELL
STAARPercent at Level II Satisfactory Standard or AboveAll Grades
All Subjects 2016 75% 63% 60% 56% 56% - - - 57% 57% - * 56% 56%
Reading 2016 73% 61% 60% 57% 57% - - - 67% 67% - * 57% 58%
Mathematics 2016 76% 65% 68% 67% 67% - - - 67% 67% - * 67% 66%
Writing 2016 69% 56% 38% 32% 32% - - - * * - * 31% 31%
Science 2016 79% 68% 60% 56% 56% - - - * * - - 54% 54%
STAARPercent at Postsecondary Readiness StandardAll Grades
Two or More Subjects 2016 45% 31% 19% 15% 15% - - - * * - * 15% 15%
Reading 2016 46% 34% 29% 24% 24% - - - * * - * 24% 25%
Mathematics 2016 43% 28% 22% 22% 22% - - - * * - * 23% 23%
Writing 2016 41% 27% 13% * * - - - * * - * * *
Science 2016 47% 33% 8% * * - - - * * - - * *
STAARPercent at Advanced StandardAll Grades
All Subjects 2016 18% 10% 10% 11% 11% - - - * * - * 11% 11%
Reading 2016 17% 9% 14% 13% 13% - - - * * - * 12% 12%
Mathematics 2016 19% 12% 10% 16% 16% - - - * * - * 15% 15%
Writing 2016 15% 7% * * * - - - * * - * * *
Science 2016 16% 11% * * * - - - * * - - * *
STAARPercent Met or Exceeded ProgressAll Grades
All Subjects 2016 62% 59% 62% 59% 59% - - - * * - * 59% 58%
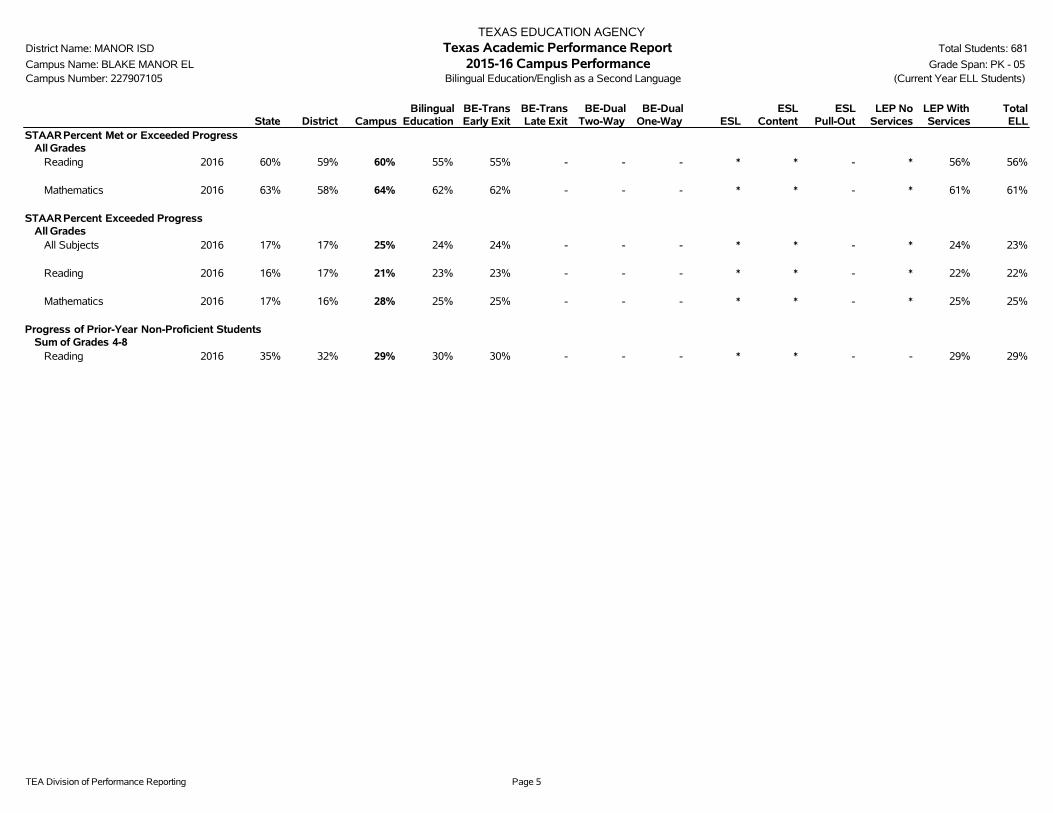
TEA Division of Performance Reporting Page 5
TEXAS EDUCATION AGENCYDistrict Name: MANOR ISD Texas Academic Performance Report Total Students: 681
Campus Name: BLAKE MANOR EL 2015-16 Campus Performance Grade Span: PK - 05Campus Number: 227907105 Bilingual Education/English as a Second Language (Current Year ELL Students)
State District CampusBilingual
EducationBE-TransEarly Exit
BE-TransLate Exit
BE-DualTwo-Way
BE-DualOne-Way ESL
ESLContent
ESLPull-Out
LEP NoServices
LEP WithServices
TotalELL
STAARPercent Met or Exceeded ProgressAll Grades
Reading 2016 60% 59% 60% 55% 55% - - - * * - * 56% 56%
Mathematics 2016 63% 58% 64% 62% 62% - - - * * - * 61% 61%
STAARPercent Exceeded ProgressAll Grades
All Subjects 2016 17% 17% 25% 24% 24% - - - * * - * 24% 23%
Reading 2016 16% 17% 21% 23% 23% - - - * * - * 22% 22%
Mathematics 2016 17% 16% 28% 25% 25% - - - * * - * 25% 25%
Progress of Prior-Year Non-Proficient StudentsSum of Grades 4-8
Reading 2016 35% 32% 29% 30% 30% - - - * * - - 29% 29%
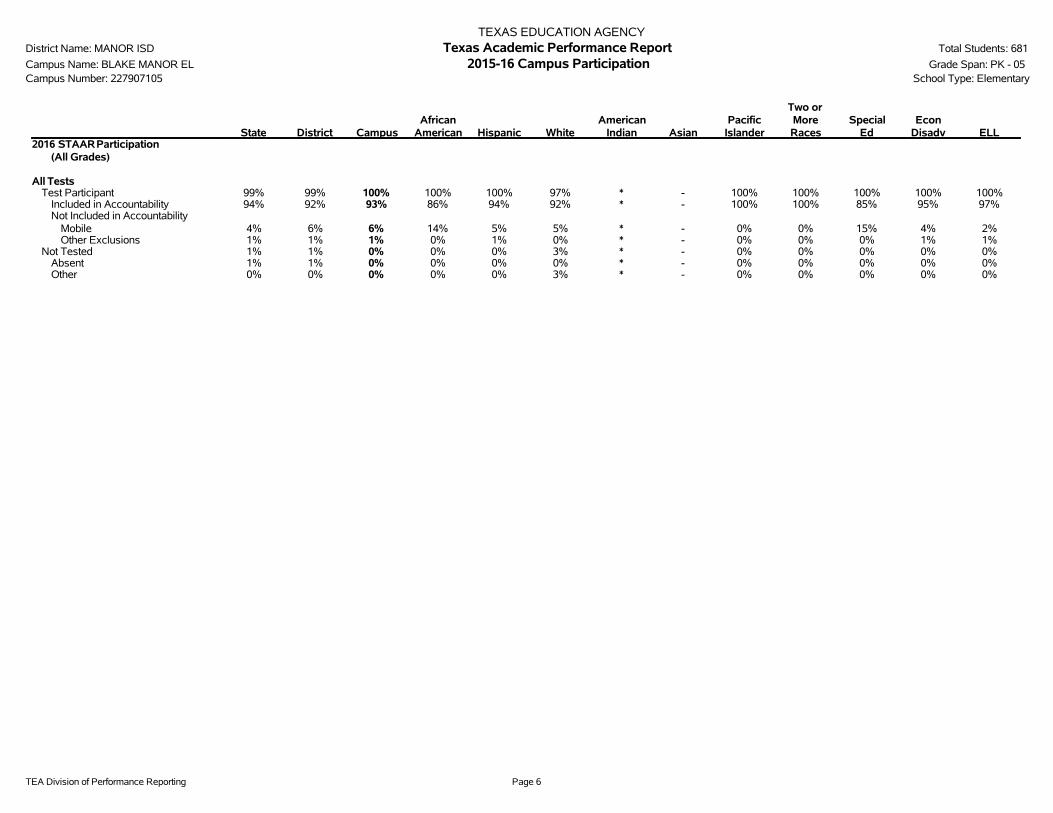
TEA Division of Performance Reporting Page 6
TEXAS EDUCATION AGENCYDistrict Name: MANOR ISD Texas Academic Performance Report Total Students: 681
Campus Name: BLAKE MANOR EL 2015-16 Campus Participation Grade Span: PK - 05Campus Number: 227907105 School Type: Elementary
State District CampusAfrican
American Hispanic WhiteAmerican
Indian AsianPacific
Islander
Two orMoreRaces
SpecialEd
EconDisadv ELL
2016 STAARParticipation(All Grades)
All TestsTest Participant 99% 99% 100% 100% 100% 97% * - 100% 100% 100% 100% 100%
Included in Accountability 94% 92% 93% 86% 94% 92% * - 100% 100% 85% 95% 97%Not Included in Accountability
Mobile 4% 6% 6% 14% 5% 5% * - 0% 0% 15% 4% 2%Other Exclusions 1% 1% 1% 0% 1% 0% * - 0% 0% 0% 1% 1%
Not Tested 1% 1% 0% 0% 0% 3% * - 0% 0% 0% 0% 0%Absent 1% 1% 0% 0% 0% 0% * - 0% 0% 0% 0% 0%Other 0% 0% 0% 0% 0% 3% * - 0% 0% 0% 0% 0%
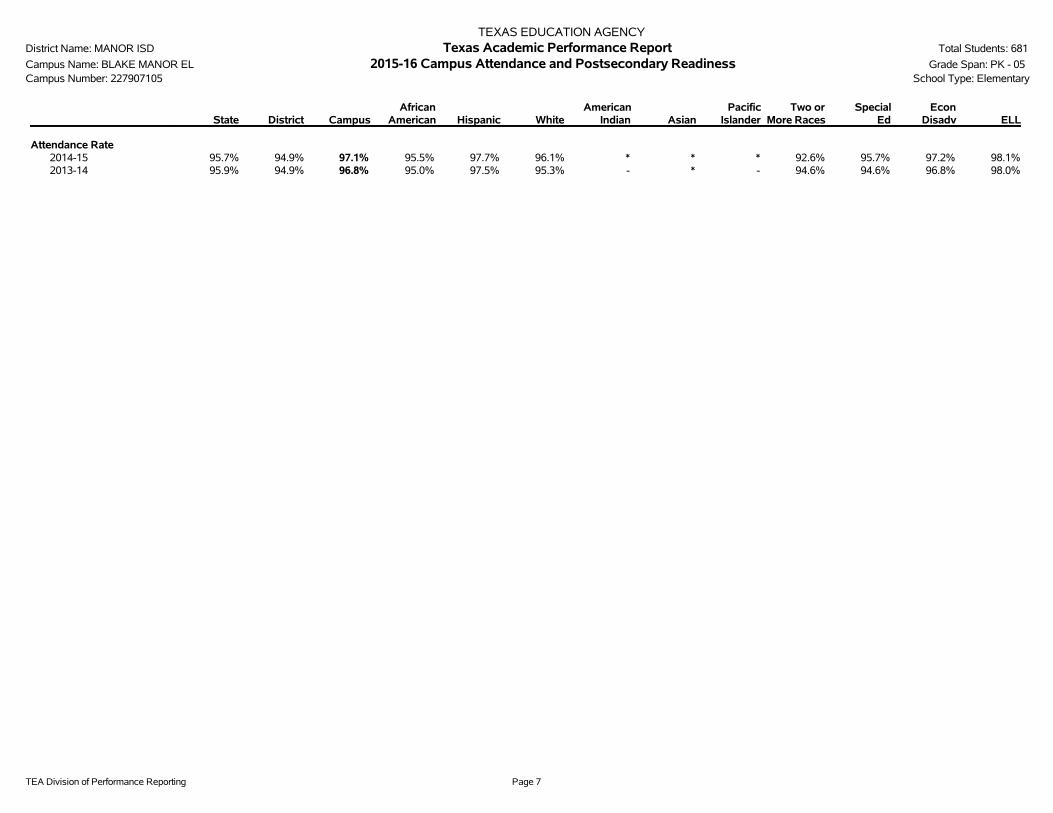
TEA Division of Performance Reporting Page 7
TEXAS EDUCATION AGENCYDistrict Name: MANOR ISD Texas Academic Performance Report Total Students: 681
Campus Name: BLAKE MANOR EL 2015-16 Campus Attendance and Postsecondary Readiness Grade Span: PK - 05Campus Number: 227907105 School Type: Elementary
State District CampusAfrican
American Hispanic WhiteAmerican
Indian AsianPacific
IslanderTwo or
More RacesSpecial
EdEcon
Disadv ELL
Attendance Rate2014-15 95.7% 94.9% 97.1% 95.5% 97.7% 96.1% * * * 92.6% 95.7% 97.2% 98.1%2013-14 95.9% 94.9% 96.8% 95.0% 97.5% 95.3% - * - 94.6% 94.6% 96.8% 98.0%

TEA Division of Performance Reporting Page 8
TEXAS EDUCATION AGENCYDistrict Name: MANOR ISD Texas Academic Performance Report Total Students: 681
Campus Name: BLAKE MANOR EL 2015-16 Campus Profile Grade Span: PK - 05Campus Number: 227907105 School Type: Elementary
---------------- Campus ----------------Student Information Count Percent District State
Total Students: 681 100.0% 8,856 5,284,252
Students by Grade:Early Childhood Education 0 0.0% 0.3% 0.2%Pre-Kindergarten 93 13.7% 8.6% 4.2%Kindergarten 79 11.6% 7.0% 7.1%Grade 1 106 15.6% 8.0% 7.8%Grade 2 97 14.2% 7.9% 7.8%Grade 3 100 14.7% 7.8% 7.7%Grade 4 111 16.3% 8.1% 7.5%Grade 5 95 14.0% 7.3% 7.5%Grade 6 0 0.0% 6.9% 7.4%Grade 7 0 0.0% 6.8% 7.4%Grade 8 0 0.0% 6.9% 7.3%Grade 9 0 0.0% 7.4% 8.1%Grade 10 0 0.0% 6.3% 7.3%Grade 11 0 0.0% 5.2% 6.7%Grade 12 0 0.0% 5.5% 6.1%
Ethnic Distribution:African American 71 10.4% 21.5% 12.6%Hispanic 511 75.0% 64.1% 52.2%White 80 11.7% 8.6% 28.5%American Indian 4 0.6% 0.2% 0.4%Asian 1 0.1% 3.0% 4.0%Pacific Islander 2 0.3% 0.2% 0.1%Two or More Races 12 1.8% 2.3% 2.1%
Economically Disadvantaged 575 84.4% 73.2% 59.0%Non-Educationally Disadvantaged 106 15.6% 26.8% 41.0%English Language Learners (ELL) 373 54.8% 36.0% 18.5%Students w/ Disciplinary Placements (2014-2015) 4 0.5% 2.0% 1.4%At-Risk 491 72.1% 60.5% 50.1%Mobility (2014-2015) 108 18.2% 19.8% 16.5%

TEA Division of Performance Reporting Page 9
TEXAS EDUCATION AGENCYDistrict Name: MANOR ISD Texas Academic Performance Report Total Students: 681
Campus Name: BLAKE MANOR EL 2015-16 Campus Profile Grade Span: PK - 05Campus Number: 227907105 School Type: Elementary
--------- Non-Special Education Rates --------- ------------- Special Education Rates -------------Student Information Campus District State Campus District State
Retention Rates by Grade:
Kindergarten 1.0% 1.4% 1.9% 0.0% 0.0% 8.2%Grade 1 5.1% 2.5% 4.1% 20.0% 4.9% 7.4%Grade 2 2.0% 1.2% 2.7% 0.0% 4.5% 3.4%Grade 3 0.0% 0.3% 2.0% 0.0% 0.0% 1.6%Grade 4 1.0% 1.0% 1.0% 0.0% 0.0% 0.8%Grade 5 0.0% 0.4% 0.9% 0.0% 0.0% 1.0%Grade 6 - 0.2% 0.6% - 0.0% 0.8%Grade 7 - 0.2% 0.8% - 0.0% 0.9%Grade 8 - 0.5% 0.8% - 1.5% 1.3%
Class Size Information Campus District State
Class Size Averages by Grade and Subject (Derived from teacher responsibility records):
Elementary:Kindergarten - - 18.9Grade 1 - - 19.1Grade 2 - - 19.1Grade 3 - - 19.1Grade 4 - - 19.0Grade 5 - - 20.8Grade 6 - - 20.4
Secondary:English/Language Arts - - 17.1Foreign Languages - - 19.1Mathematics - - 18.1Science - - 19.1Social Studies - - 19.5

TEA Division of Performance Reporting Page 10
TEXAS EDUCATION AGENCYDistrict Name: MANOR ISD Texas Academic Performance Report Total Students: 681
Campus Name: BLAKE MANOR EL 2015-16 Campus Profile Grade Span: PK - 05Campus Number: 227907105 School Type: Elementary
---------------- Campus ----------------Staff Information Count/Average Percent District State
Total Staff - 100.0% 100.0% 100.0%
Professional Staff: - - - 64.3%Teachers - - - 50.5%Professional Support - - - 9.8%Campus Administration (School Leadership) - - - 2.9%
Educational Aides: - - - 9.6%
Total Minority Staff: - - - 48.2%
Teachers by Ethnicity and Sex:African American - - - 10.1%Hispanic - - - 26.0%White - - - 60.8%American Indian - - - 0.4%Asian - - - 1.5%Pacific Islander - - - 0.2%Two or More Races - - - 1.1%
Males - - - 23.5%Females - - - 76.5%
Teachers by Highest Degree Held:No Degree - - - 1.0%Bachelors - - - 74.7%Masters - - - 23.6%Doctorate - - - 0.6%
Teachers by Years of Experience:Beginning Teachers - - - 8.1%1-5 Years Experience - - - 27.3%6-10 Years Experience - - - 21.7%11-20 Years Experience - - - 27.3%Over 20 Years Experience - - - 15.7%
Number of Students per Teacher - n/a - 15.2

TEA Division of Performance Reporting Page 11
TEXAS EDUCATION AGENCYDistrict Name: MANOR ISD Texas Academic Performance Report Total Students: 681
Campus Name: BLAKE MANOR EL 2015-16 Campus Profile Grade Span: PK - 05Campus Number: 227907105 School Type: Elementary
Staff Information Campus District State
Average Years Experience of Teachers: - - 10.9Average Years Experience of Teachers with District: - - 7.3
Average Teacher Salary by Years of Experience (regular duties only):Beginning Teachers - - $45,5071-5 Years Experience - - $47,9966-10 Years Experience - - $50,45911-20 Years Experience - - $53,794Over 20 Years Experience - - $60,613
Average Actual Salaries (regular duties only):Teachers - - $51,891Professional Support - - $61,145Campus Administration (School Leadership) - - $75,654
Instructional Staff Percent: n/a - 64.5%
Contracted Instructional Staff (not incl. above): - - 1,914.4

TEA Division of Performance Reporting Page 12
TEXAS EDUCATION AGENCYDistrict Name: MANOR ISD Texas Academic Performance Report Total Students: 681
Campus Name: BLAKE MANOR EL 2015-16 Campus Profile Grade Span: PK - 05Campus Number: 227907105 School Type: Elementary
---------------- Campus ----------------Program Information Count Percent District State
Student Enrollment by Program:Bilingual/ESL Education 373 54.8% 35.7% 18.3%Career & Technical Education 0 0.0% 28.7% 24.3%Gifted & Talented Education 30 4.4% 7.3% 7.7%Special Education 37 5.4% 7.8% 8.6%
Teachers by Program (population served):Bilingual/ESL Education - - - 5.9%Career & Technical Education - - - 4.4%Compensatory Education - - - 2.9%Gifted & Talented Education - - - 1.9%Regular Education - - - 72.6%Special Education - - - 8.8%Other - - - 3.4%
Link to: PEIMS Financial Standard Reports/ 2014-2015 Financial Actual Report
' '̂ Indicates that ELL rates at met or exceeded standard and exceeded standard include current and monitored students.'*' Indicates results are masked due to small numbers to protect student confidentiality.'-' Indicates zero observations reported for this group.'n/a' Indicates data reporting is not applicable for this group.'**' Indicates that rates for Reading and Mathematics are based on the cumulative results from the first and second administrations of STAAR.'?' Indicates that the data for this item were statistically improbable, or were reported outside a reasonable range.'##' Indicates that PID Error rate information cannot be reported in 2015-16 due to the transition from PEIMS Edit+ to TSDS.
2015-16 Texas Academic Performance Report
District Name: MANOR ISD
Campus Name: PRESIDENTIAL MEADOWS EL
Campus Number: 227907106
2016 Accountability Rating: Met Standard

This page intentionally left blank.

TEA Division of Performance Reporting Page 1
TEXAS EDUCATION AGENCYDistrict Name: MANOR ISD Texas Academic Performance Report Total Students: 605
Campus Name: PRESIDENTIAL MEADOWS EL 2015-16 Campus Performance Grade Span: PK - 05Campus Number: 227907106 School Type: Elementary
State District CampusAfrican
American Hispanic WhiteAmerican
Indian AsianPacific
Islander
Two orMore
RacesSpecial
EdEcon
Disadv ELL^STAARPercent at Level II Satisfactory Standard or Above
Grade 3
Reading 2016 73% 63% 53% 53% 50% * - * - - * 46% 48%
Mathematics 2016 75% 69% 60% 47% 65% * - * - - * 58% 67%
STAARPercent at Level II Satisfactory Standard or AboveGrade 4
Reading 2016 75% 65% 59% 63% 55% * - * * * * 56% 54%
Mathematics 2016 73% 64% 56% 50% 60% * - * * * * 48% 63%
Writing 2016 69% 55% 48% 57% 38% * - - * * * 39% 37%
STAARPercent at Level II Satisfactory Standard or AboveGrade 5 **
Reading 2016 81% 70% 71% 64% 69% 100% - * - - * 68% 58%
Mathematics 2016 86% 76% 68% 55% 69% * - * - - * 68% 63%
Science 2016 74% 62% 57% 55% 54% * - * - - * 56% 46%
STAARPercent at Level II Satisfactory Standard or AboveAll Grades
All Subjects 2016 75% 63% 59% 55% 57% 76% - 71% * * 37% 54% 54%
Reading 2016 73% 61% 60% 60% 57% 85% - * * * * 56% 53%
Mathematics 2016 76% 65% 61% 50% 64% 62% - * * * 38% 57% 64%
Writing 2016 69% 56% 48% 57% 38% * - - * * * 39% 37%
Science 2016 79% 68% 57% 55% 54% * - * - - * 56% 46%
STAARPercent at Postsecondary Readiness StandardAll Grades
Two or More Subjects 2016 45% 31% 24% 15% 26% * - * * * * 21% 26%
Reading 2016 46% 34% 28% 23% 29% * - * * * * 23% 28%
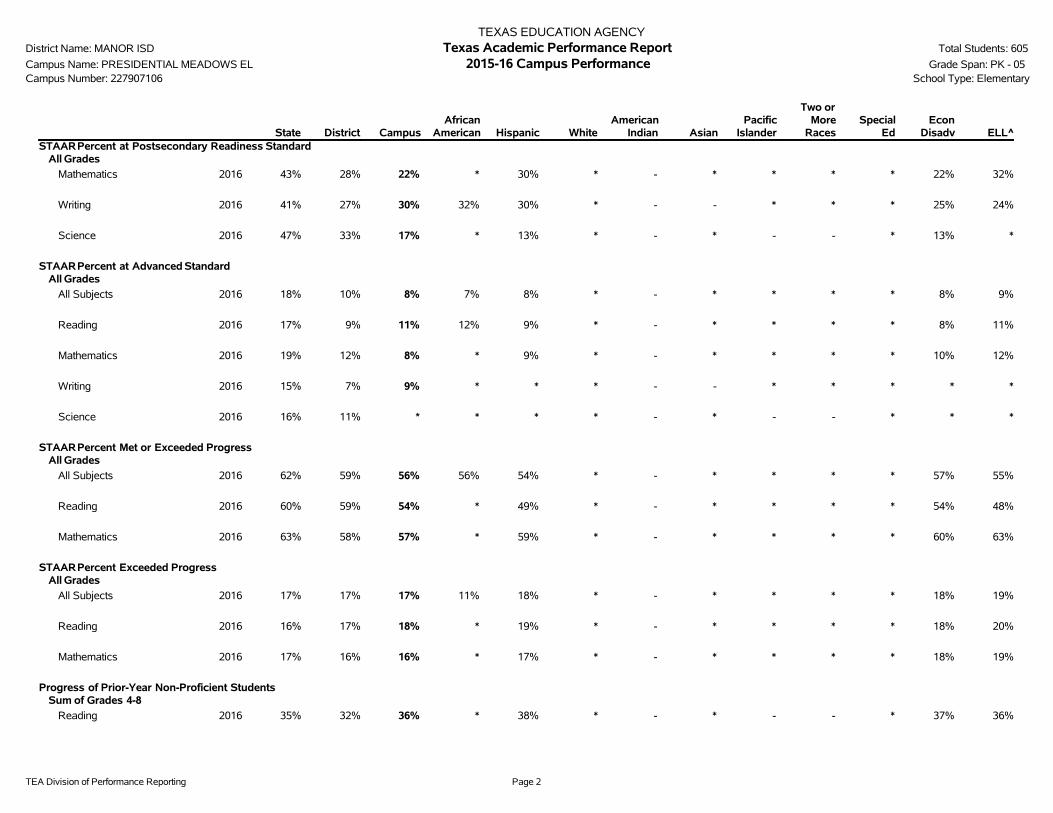
TEA Division of Performance Reporting Page 2
TEXAS EDUCATION AGENCYDistrict Name: MANOR ISD Texas Academic Performance Report Total Students: 605
Campus Name: PRESIDENTIAL MEADOWS EL 2015-16 Campus Performance Grade Span: PK - 05Campus Number: 227907106 School Type: Elementary
State District CampusAfrican
American Hispanic WhiteAmerican
Indian AsianPacific
Islander
Two orMore
RacesSpecial
EdEcon
Disadv ELL^STAARPercent at Postsecondary Readiness Standard
All Grades
Mathematics 2016 43% 28% 22% * 30% * - * * * * 22% 32%
Writing 2016 41% 27% 30% 32% 30% * - - * * * 25% 24%
Science 2016 47% 33% 17% * 13% * - * - - * 13% *
STAARPercent at Advanced StandardAll Grades
All Subjects 2016 18% 10% 8% 7% 8% * - * * * * 8% 9%
Reading 2016 17% 9% 11% 12% 9% * - * * * * 8% 11%
Mathematics 2016 19% 12% 8% * 9% * - * * * * 10% 12%
Writing 2016 15% 7% 9% * * * - - * * * * *
Science 2016 16% 11% * * * * - * - - * * *
STAARPercent Met or Exceeded ProgressAll Grades
All Subjects 2016 62% 59% 56% 56% 54% * - * * * * 57% 55%
Reading 2016 60% 59% 54% * 49% * - * * * * 54% 48%
Mathematics 2016 63% 58% 57% * 59% * - * * * * 60% 63%
STAARPercent Exceeded ProgressAll Grades
All Subjects 2016 17% 17% 17% 11% 18% * - * * * * 18% 19%
Reading 2016 16% 17% 18% * 19% * - * * * * 18% 20%
Mathematics 2016 17% 16% 16% * 17% * - * * * * 18% 19%
Progress of Prior-Year Non-Proficient StudentsSum of Grades 4-8
Reading 2016 35% 32% 36% * 38% * - * - - * 37% 36%
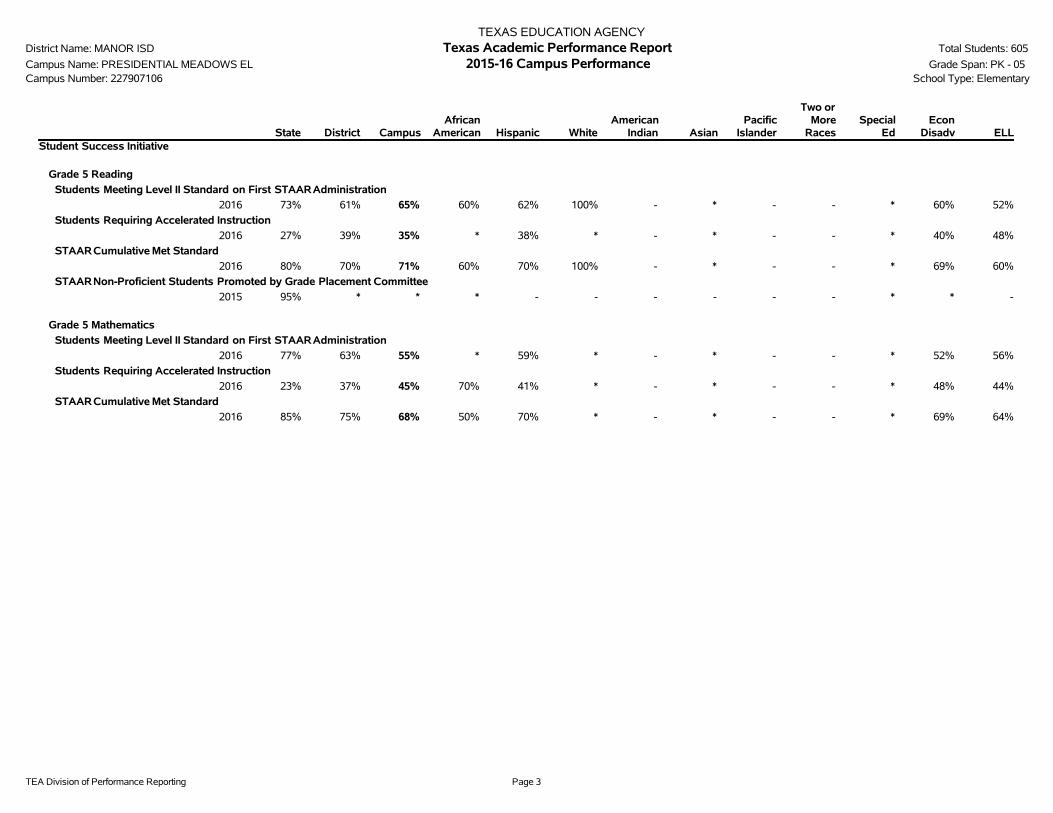
TEA Division of Performance Reporting Page 3
TEXAS EDUCATION AGENCYDistrict Name: MANOR ISD Texas Academic Performance Report Total Students: 605
Campus Name: PRESIDENTIAL MEADOWS EL 2015-16 Campus Performance Grade Span: PK - 05Campus Number: 227907106 School Type: Elementary
State District CampusAfrican
American Hispanic WhiteAmerican
Indian AsianPacific
Islander
Two orMore
RacesSpecial
EdEcon
Disadv ELLStudent Success Initiative
Grade 5 Reading
Students Meeting Level II Standard on First STAARAdministration
2016 73% 61% 65% 60% 62% 100% - * - - * 60% 52%
Students Requiring Accelerated Instruction
2016 27% 39% 35% * 38% * - * - - * 40% 48%
STAARCumulative Met Standard
2016 80% 70% 71% 60% 70% 100% - * - - * 69% 60%
STAARNon-Proficient Students Promoted by Grade Placement Committee
2015 95% * * * - - - - - - * * -
Grade 5 Mathematics
Students Meeting Level II Standard on First STAARAdministration
2016 77% 63% 55% * 59% * - * - - * 52% 56%
Students Requiring Accelerated Instruction
2016 23% 37% 45% 70% 41% * - * - - * 48% 44%
STAARCumulative Met Standard
2016 85% 75% 68% 50% 70% * - * - - * 69% 64%
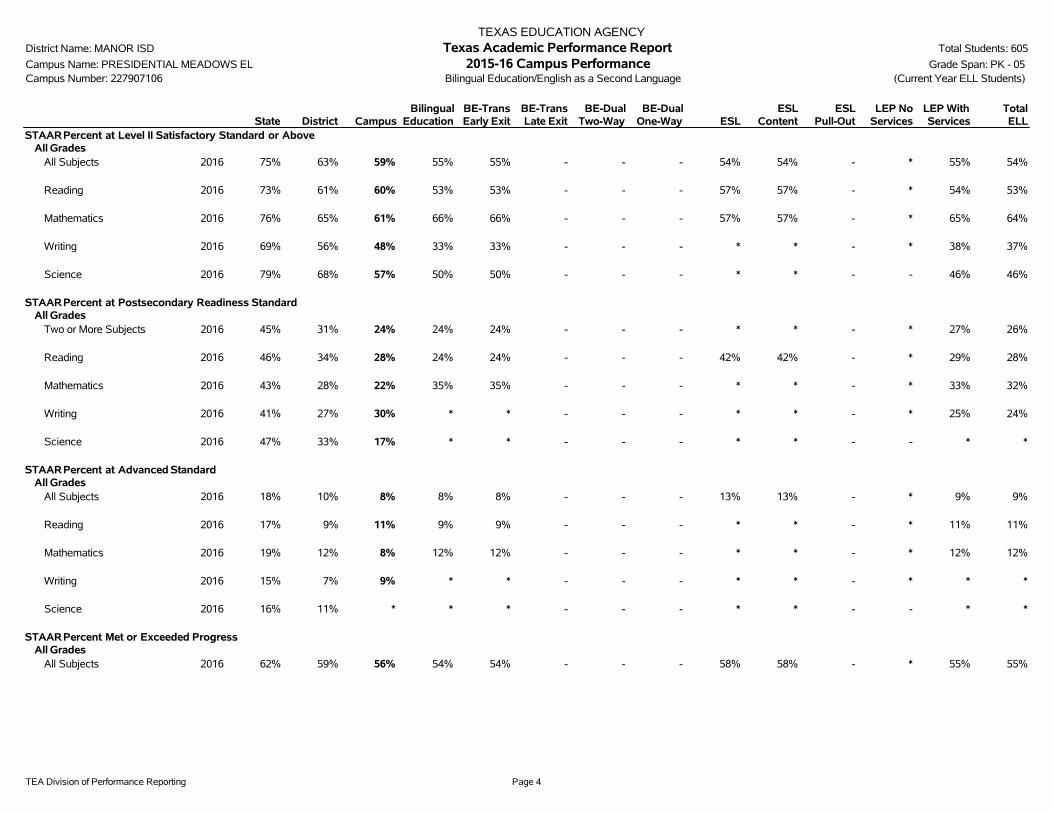
TEA Division of Performance Reporting Page 4
TEXAS EDUCATION AGENCYDistrict Name: MANOR ISD Texas Academic Performance Report Total Students: 605
Campus Name: PRESIDENTIAL MEADOWS EL 2015-16 Campus Performance Grade Span: PK - 05Campus Number: 227907106 Bilingual Education/English as a Second Language (Current Year ELL Students)
State District CampusBilingual
EducationBE-TransEarly Exit
BE-TransLate Exit
BE-DualTwo-Way
BE-DualOne-Way ESL
ESLContent
ESLPull-Out
LEP NoServices
LEP WithServices
TotalELL
STAARPercent at Level II Satisfactory Standard or AboveAll Grades
All Subjects 2016 75% 63% 59% 55% 55% - - - 54% 54% - * 55% 54%
Reading 2016 73% 61% 60% 53% 53% - - - 57% 57% - * 54% 53%
Mathematics 2016 76% 65% 61% 66% 66% - - - 57% 57% - * 65% 64%
Writing 2016 69% 56% 48% 33% 33% - - - * * - * 38% 37%
Science 2016 79% 68% 57% 50% 50% - - - * * - - 46% 46%
STAARPercent at Postsecondary Readiness StandardAll Grades
Two or More Subjects 2016 45% 31% 24% 24% 24% - - - * * - * 27% 26%
Reading 2016 46% 34% 28% 24% 24% - - - 42% 42% - * 29% 28%
Mathematics 2016 43% 28% 22% 35% 35% - - - * * - * 33% 32%
Writing 2016 41% 27% 30% * * - - - * * - * 25% 24%
Science 2016 47% 33% 17% * * - - - * * - - * *
STAARPercent at Advanced StandardAll Grades
All Subjects 2016 18% 10% 8% 8% 8% - - - 13% 13% - * 9% 9%
Reading 2016 17% 9% 11% 9% 9% - - - * * - * 11% 11%
Mathematics 2016 19% 12% 8% 12% 12% - - - * * - * 12% 12%
Writing 2016 15% 7% 9% * * - - - * * - * * *
Science 2016 16% 11% * * * - - - * * - - * *
STAARPercent Met or Exceeded ProgressAll Grades
All Subjects 2016 62% 59% 56% 54% 54% - - - 58% 58% - * 55% 55%

TEA Division of Performance Reporting Page 5
TEXAS EDUCATION AGENCYDistrict Name: MANOR ISD Texas Academic Performance Report Total Students: 605
Campus Name: PRESIDENTIAL MEADOWS EL 2015-16 Campus Performance Grade Span: PK - 05Campus Number: 227907106 Bilingual Education/English as a Second Language (Current Year ELL Students)
State District CampusBilingual
EducationBE-TransEarly Exit
BE-TransLate Exit
BE-DualTwo-Way
BE-DualOne-Way ESL
ESLContent
ESLPull-Out
LEP NoServices
LEP WithServices
TotalELL
STAARPercent Met or Exceeded ProgressAll Grades
Reading 2016 60% 59% 54% 44% 44% - - - * * - * 46% 47%
Mathematics 2016 63% 58% 57% 64% 64% - - - * * - * 63% 62%
STAARPercent Exceeded ProgressAll Grades
All Subjects 2016 17% 17% 17% 19% 19% - - - 21% 21% - * 20% 19%
Reading 2016 16% 17% 18% 19% 19% - - - * * - * 20% 20%
Mathematics 2016 17% 16% 16% 19% 19% - - - * * - * 19% 19%
Progress of Prior-Year Non-Proficient StudentsSum of Grades 4-8
Reading 2016 35% 32% 36% 40% 40% - - - * * - * 38% 36%

TEA Division of Performance Reporting Page 6
TEXAS EDUCATION AGENCYDistrict Name: MANOR ISD Texas Academic Performance Report Total Students: 605
Campus Name: PRESIDENTIAL MEADOWS EL 2015-16 Campus Participation Grade Span: PK - 05Campus Number: 227907106 School Type: Elementary
State District CampusAfrican
American Hispanic WhiteAmerican
Indian AsianPacific
Islander
Two orMoreRaces
SpecialEd
EconDisadv ELL
2016 STAARParticipation(All Grades)
All TestsTest Participant 99% 99% 100% 100% 100% 100% - 100% * 100% 100% 100% 100%
Included in Accountability 94% 92% 91% 94% 92% 80% - 70% * 38% 92% 93% 92%Not Included in Accountability
Mobile 4% 6% 9% 6% 7% 20% - 30% * 63% 8% 7% 6%Other Exclusions 1% 1% 1% 0% 1% 0% - 0% * 0% 0% 1% 1%
Not Tested 1% 1% 0% 0% 0% 0% - 0% * 0% 0% 0% 0%Absent 1% 1% 0% 0% 0% 0% - 0% * 0% 0% 0% 0%Other 0% 0% 0% 0% 0% 0% - 0% * 0% 0% 0% 0%

TEA Division of Performance Reporting Page 7
TEXAS EDUCATION AGENCYDistrict Name: MANOR ISD Texas Academic Performance Report Total Students: 605
Campus Name: PRESIDENTIAL MEADOWS EL 2015-16 Campus Attendance and Postsecondary Readiness Grade Span: PK - 05Campus Number: 227907106 School Type: Elementary
State District CampusAfrican
American Hispanic WhiteAmerican
Indian AsianPacific
IslanderTwo or
More RacesSpecial
EdEcon
Disadv ELL
Attendance Rate2014-15 95.7% 94.9% 96.4% 96.1% 96.7% 95.3% * 95.7% * 95.2% 94.7% 96.3% 97.2%2013-14 95.9% 94.9% 96.6% 96.6% 96.9% 95.0% * 97.5% * 95.5% 96.2% 96.6% 97.4%
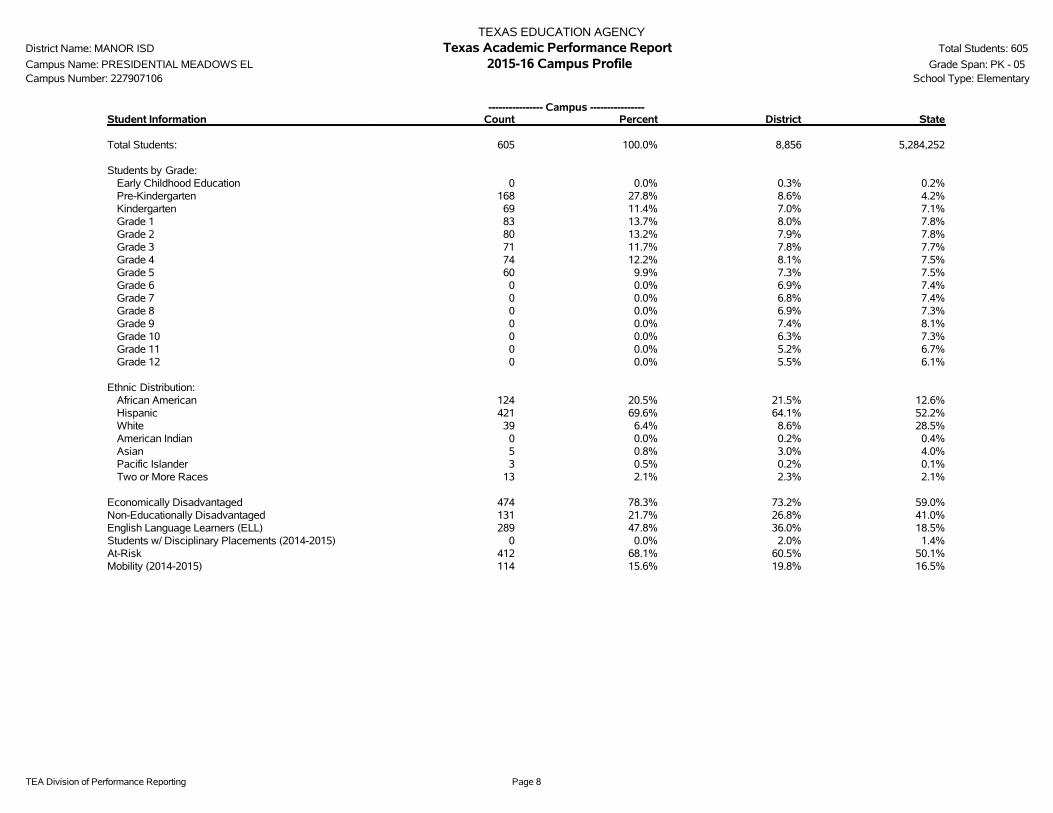
TEA Division of Performance Reporting Page 8
TEXAS EDUCATION AGENCYDistrict Name: MANOR ISD Texas Academic Performance Report Total Students: 605
Campus Name: PRESIDENTIAL MEADOWS EL 2015-16 Campus Profile Grade Span: PK - 05Campus Number: 227907106 School Type: Elementary
---------------- Campus ----------------Student Information Count Percent District State
Total Students: 605 100.0% 8,856 5,284,252
Students by Grade:Early Childhood Education 0 0.0% 0.3% 0.2%Pre-Kindergarten 168 27.8% 8.6% 4.2%Kindergarten 69 11.4% 7.0% 7.1%Grade 1 83 13.7% 8.0% 7.8%Grade 2 80 13.2% 7.9% 7.8%Grade 3 71 11.7% 7.8% 7.7%Grade 4 74 12.2% 8.1% 7.5%Grade 5 60 9.9% 7.3% 7.5%Grade 6 0 0.0% 6.9% 7.4%Grade 7 0 0.0% 6.8% 7.4%Grade 8 0 0.0% 6.9% 7.3%Grade 9 0 0.0% 7.4% 8.1%Grade 10 0 0.0% 6.3% 7.3%Grade 11 0 0.0% 5.2% 6.7%Grade 12 0 0.0% 5.5% 6.1%
Ethnic Distribution:African American 124 20.5% 21.5% 12.6%Hispanic 421 69.6% 64.1% 52.2%White 39 6.4% 8.6% 28.5%American Indian 0 0.0% 0.2% 0.4%Asian 5 0.8% 3.0% 4.0%Pacific Islander 3 0.5% 0.2% 0.1%Two or More Races 13 2.1% 2.3% 2.1%
Economically Disadvantaged 474 78.3% 73.2% 59.0%Non-Educationally Disadvantaged 131 21.7% 26.8% 41.0%English Language Learners (ELL) 289 47.8% 36.0% 18.5%Students w/ Disciplinary Placements (2014-2015) 0 0.0% 2.0% 1.4%At-Risk 412 68.1% 60.5% 50.1%Mobility (2014-2015) 114 15.6% 19.8% 16.5%

TEA Division of Performance Reporting Page 9
TEXAS EDUCATION AGENCYDistrict Name: MANOR ISD Texas Academic Performance Report Total Students: 605
Campus Name: PRESIDENTIAL MEADOWS EL 2015-16 Campus Profile Grade Span: PK - 05Campus Number: 227907106 School Type: Elementary
--------- Non-Special Education Rates --------- ------------- Special Education Rates -------------Student Information Campus District State Campus District State
Retention Rates by Grade:
Kindergarten 2.1% 1.4% 1.9% - 0.0% 8.2%Grade 1 3.8% 2.5% 4.1% 0.0% 4.9% 7.4%Grade 2 1.4% 1.2% 2.7% 16.7% 4.5% 3.4%Grade 3 0.8% 0.3% 2.0% 0.0% 0.0% 1.6%Grade 4 2.3% 1.0% 1.0% 0.0% 0.0% 0.8%Grade 5 0.0% 0.4% 0.9% 0.0% 0.0% 1.0%Grade 6 - 0.2% 0.6% - 0.0% 0.8%Grade 7 - 0.2% 0.8% - 0.0% 0.9%Grade 8 - 0.5% 0.8% - 1.5% 1.3%
Class Size Information Campus District State
Class Size Averages by Grade and Subject (Derived from teacher responsibility records):
Elementary:Kindergarten - - 18.9Grade 1 - - 19.1Grade 2 - - 19.1Grade 3 - - 19.1Grade 4 - - 19.0Grade 5 - - 20.8Grade 6 - - 20.4
Secondary:English/Language Arts - - 17.1Foreign Languages - - 19.1Mathematics - - 18.1Science - - 19.1Social Studies - - 19.5

TEA Division of Performance Reporting Page 10
TEXAS EDUCATION AGENCYDistrict Name: MANOR ISD Texas Academic Performance Report Total Students: 605
Campus Name: PRESIDENTIAL MEADOWS EL 2015-16 Campus Profile Grade Span: PK - 05Campus Number: 227907106 School Type: Elementary
---------------- Campus ----------------Staff Information Count/Average Percent District State
Total Staff - 100.0% 100.0% 100.0%
Professional Staff: - - - 64.3%Teachers - - - 50.5%Professional Support - - - 9.8%Campus Administration (School Leadership) - - - 2.9%
Educational Aides: - - - 9.6%
Total Minority Staff: - - - 48.2%
Teachers by Ethnicity and Sex:African American - - - 10.1%Hispanic - - - 26.0%White - - - 60.8%American Indian - - - 0.4%Asian - - - 1.5%Pacific Islander - - - 0.2%Two or More Races - - - 1.1%
Males - - - 23.5%Females - - - 76.5%
Teachers by Highest Degree Held:No Degree - - - 1.0%Bachelors - - - 74.7%Masters - - - 23.6%Doctorate - - - 0.6%
Teachers by Years of Experience:Beginning Teachers - - - 8.1%1-5 Years Experience - - - 27.3%6-10 Years Experience - - - 21.7%11-20 Years Experience - - - 27.3%Over 20 Years Experience - - - 15.7%
Number of Students per Teacher - n/a - 15.2

TEA Division of Performance Reporting Page 11
TEXAS EDUCATION AGENCYDistrict Name: MANOR ISD Texas Academic Performance Report Total Students: 605
Campus Name: PRESIDENTIAL MEADOWS EL 2015-16 Campus Profile Grade Span: PK - 05Campus Number: 227907106 School Type: Elementary
Staff Information Campus District State
Average Years Experience of Teachers: - - 10.9Average Years Experience of Teachers with District: - - 7.3
Average Teacher Salary by Years of Experience (regular duties only):Beginning Teachers - - $45,5071-5 Years Experience - - $47,9966-10 Years Experience - - $50,45911-20 Years Experience - - $53,794Over 20 Years Experience - - $60,613
Average Actual Salaries (regular duties only):Teachers - - $51,891Professional Support - - $61,145Campus Administration (School Leadership) - - $75,654
Instructional Staff Percent: n/a - 64.5%
Contracted Instructional Staff (not incl. above): - - 1,914.4

TEA Division of Performance Reporting Page 12
TEXAS EDUCATION AGENCYDistrict Name: MANOR ISD Texas Academic Performance Report Total Students: 605
Campus Name: PRESIDENTIAL MEADOWS EL 2015-16 Campus Profile Grade Span: PK - 05Campus Number: 227907106 School Type: Elementary
---------------- Campus ----------------Program Information Count Percent District State
Student Enrollment by Program:Bilingual/ESL Education 285 47.1% 35.7% 18.3%Career & Technical Education 0 0.0% 28.7% 24.3%Gifted & Talented Education 20 3.3% 7.3% 7.7%Special Education 39 6.4% 7.8% 8.6%
Teachers by Program (population served):Bilingual/ESL Education - - - 5.9%Career & Technical Education - - - 4.4%Compensatory Education - - - 2.9%Gifted & Talented Education - - - 1.9%Regular Education - - - 72.6%Special Education - - - 8.8%Other - - - 3.4%
Link to: PEIMS Financial Standard Reports/ 2014-2015 Financial Actual Report
' '̂ Indicates that ELL rates at met or exceeded standard and exceeded standard include current and monitored students.'*' Indicates results are masked due to small numbers to protect student confidentiality.'-' Indicates zero observations reported for this group.'n/a' Indicates data reporting is not applicable for this group.'**' Indicates that rates for Reading and Mathematics are based on the cumulative results from the first and second administrations of STAAR.'?' Indicates that the data for this item were statistically improbable, or were reported outside a reasonable range.'##' Indicates that PID Error rate information cannot be reported in 2015-16 due to the transition from PEIMS Edit+ to TSDS.

2015-16 Texas Academic Performance Report
District Name: MANOR ISD
Campus Name: OAK MEADOWS EL
Campus Number: 227907107
2016 Accountability Rating: Met Standard

This page intentionally left blank.
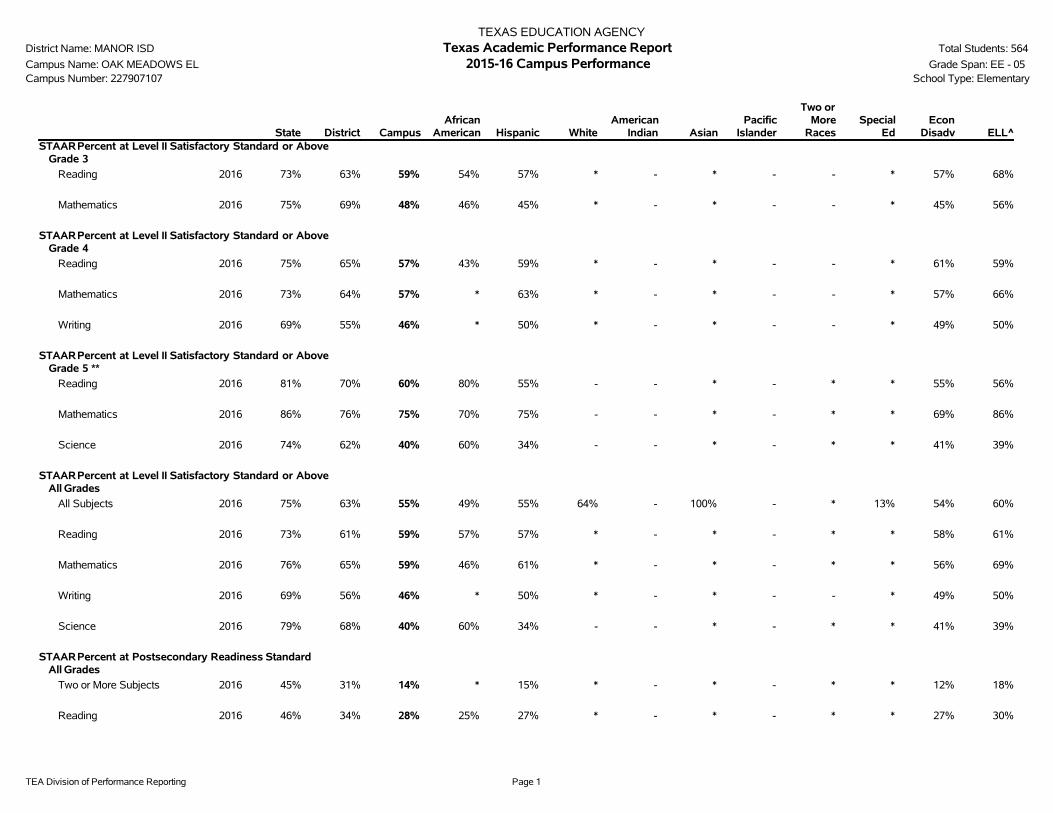
TEA Division of Performance Reporting Page 1
TEXAS EDUCATION AGENCYDistrict Name: MANOR ISD Texas Academic Performance Report Total Students: 564
Campus Name: OAK MEADOWS EL 2015-16 Campus Performance Grade Span: EE - 05Campus Number: 227907107 School Type: Elementary
State District CampusAfrican
American Hispanic WhiteAmerican
Indian AsianPacific
Islander
Two orMore
RacesSpecial
EdEcon
Disadv ELL^STAARPercent at Level II Satisfactory Standard or Above
Grade 3
Reading 2016 73% 63% 59% 54% 57% * - * - - * 57% 68%
Mathematics 2016 75% 69% 48% 46% 45% * - * - - * 45% 56%
STAARPercent at Level II Satisfactory Standard or AboveGrade 4
Reading 2016 75% 65% 57% 43% 59% * - * - - * 61% 59%
Mathematics 2016 73% 64% 57% * 63% * - * - - * 57% 66%
Writing 2016 69% 55% 46% * 50% * - * - - * 49% 50%
STAARPercent at Level II Satisfactory Standard or AboveGrade 5 **
Reading 2016 81% 70% 60% 80% 55% - - * - * * 55% 56%
Mathematics 2016 86% 76% 75% 70% 75% - - * - * * 69% 86%
Science 2016 74% 62% 40% 60% 34% - - * - * * 41% 39%
STAARPercent at Level II Satisfactory Standard or AboveAll Grades
All Subjects 2016 75% 63% 55% 49% 55% 64% - 100% - * 13% 54% 60%
Reading 2016 73% 61% 59% 57% 57% * - * - * * 58% 61%
Mathematics 2016 76% 65% 59% 46% 61% * - * - * * 56% 69%
Writing 2016 69% 56% 46% * 50% * - * - - * 49% 50%
Science 2016 79% 68% 40% 60% 34% - - * - * * 41% 39%
STAARPercent at Postsecondary Readiness StandardAll Grades
Two or More Subjects 2016 45% 31% 14% * 15% * - * - * * 12% 18%
Reading 2016 46% 34% 28% 25% 27% * - * - * * 27% 30%
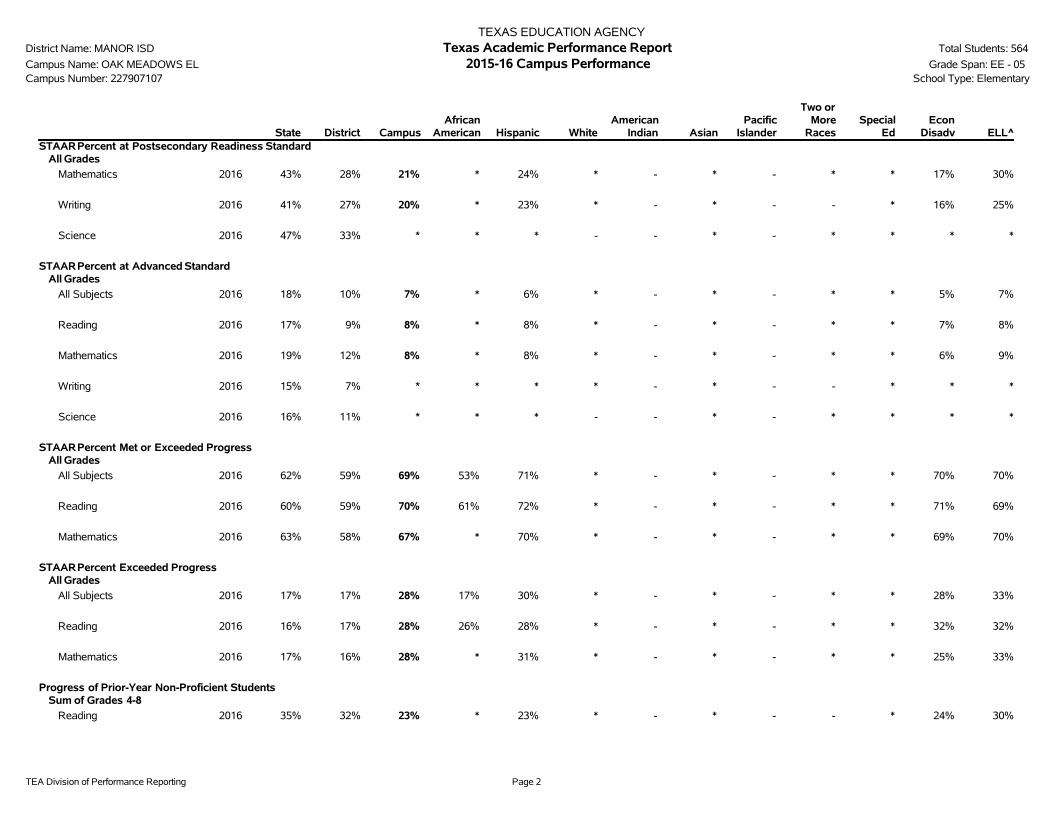
TEA Division of Performance Reporting Page 2
TEXAS EDUCATION AGENCYDistrict Name: MANOR ISD Texas Academic Performance Report Total Students: 564
Campus Name: OAK MEADOWS EL 2015-16 Campus Performance Grade Span: EE - 05Campus Number: 227907107 School Type: Elementary
State District CampusAfrican
American Hispanic WhiteAmerican
Indian AsianPacific
Islander
Two orMore
RacesSpecial
EdEcon
Disadv ELL^STAARPercent at Postsecondary Readiness Standard
All Grades
Mathematics 2016 43% 28% 21% * 24% * - * - * * 17% 30%
Writing 2016 41% 27% 20% * 23% * - * - - * 16% 25%
Science 2016 47% 33% * * * - - * - * * * *
STAARPercent at Advanced StandardAll Grades
All Subjects 2016 18% 10% 7% * 6% * - * - * * 5% 7%
Reading 2016 17% 9% 8% * 8% * - * - * * 7% 8%
Mathematics 2016 19% 12% 8% * 8% * - * - * * 6% 9%
Writing 2016 15% 7% * * * * - * - - * * *
Science 2016 16% 11% * * * - - * - * * * *
STAARPercent Met or Exceeded ProgressAll Grades
All Subjects 2016 62% 59% 69% 53% 71% * - * - * * 70% 70%
Reading 2016 60% 59% 70% 61% 72% * - * - * * 71% 69%
Mathematics 2016 63% 58% 67% * 70% * - * - * * 69% 70%
STAARPercent Exceeded ProgressAll Grades
All Subjects 2016 17% 17% 28% 17% 30% * - * - * * 28% 33%
Reading 2016 16% 17% 28% 26% 28% * - * - * * 32% 32%
Mathematics 2016 17% 16% 28% * 31% * - * - * * 25% 33%
Progress of Prior-Year Non-Proficient StudentsSum of Grades 4-8
Reading 2016 35% 32% 23% * 23% * - * - - * 24% 30%
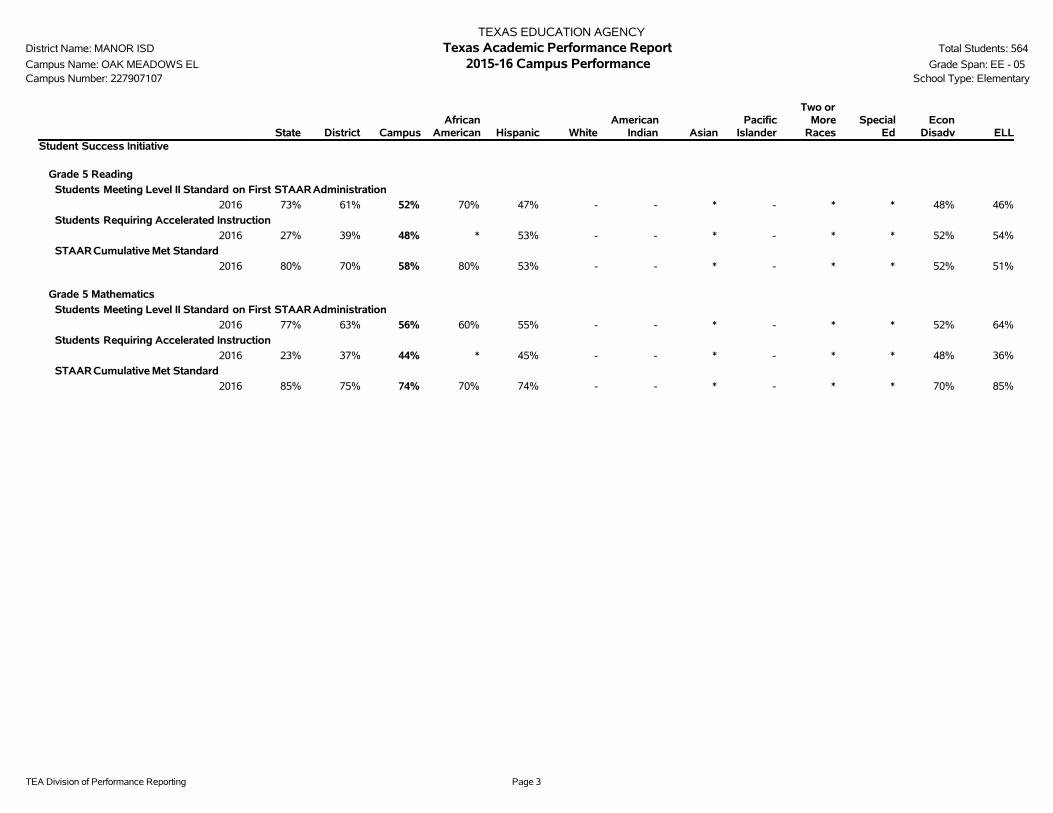
TEA Division of Performance Reporting Page 3
TEXAS EDUCATION AGENCYDistrict Name: MANOR ISD Texas Academic Performance Report Total Students: 564
Campus Name: OAK MEADOWS EL 2015-16 Campus Performance Grade Span: EE - 05Campus Number: 227907107 School Type: Elementary
State District CampusAfrican
American Hispanic WhiteAmerican
Indian AsianPacific
Islander
Two orMore
RacesSpecial
EdEcon
Disadv ELLStudent Success Initiative
Grade 5 Reading
Students Meeting Level II Standard on First STAARAdministration
2016 73% 61% 52% 70% 47% - - * - * * 48% 46%
Students Requiring Accelerated Instruction
2016 27% 39% 48% * 53% - - * - * * 52% 54%
STAARCumulative Met Standard
2016 80% 70% 58% 80% 53% - - * - * * 52% 51%
Grade 5 Mathematics
Students Meeting Level II Standard on First STAARAdministration
2016 77% 63% 56% 60% 55% - - * - * * 52% 64%
Students Requiring Accelerated Instruction
2016 23% 37% 44% * 45% - - * - * * 48% 36%
STAARCumulative Met Standard
2016 85% 75% 74% 70% 74% - - * - * * 70% 85%

TEA Division of Performance Reporting Page 4
TEXAS EDUCATION AGENCYDistrict Name: MANOR ISD Texas Academic Performance Report Total Students: 564
Campus Name: OAK MEADOWS EL 2015-16 Campus Performance Grade Span: EE - 05Campus Number: 227907107 Bilingual Education/English as a Second Language (Current Year ELL Students)
State District CampusBilingual
EducationBE-TransEarly Exit
BE-TransLate Exit
BE-DualTwo-Way
BE-DualOne-Way ESL
ESLContent
ESLPull-Out
LEP NoServices
LEP WithServices
TotalELL
STAARPercent at Level II Satisfactory Standard or AboveAll Grades
All Subjects 2016 75% 63% 55% 59% 59% - - - 62% 62% - * 59% 60%
Reading 2016 73% 61% 59% 61% 61% - - - 54% 54% - * 61% 61%
Mathematics 2016 76% 65% 59% 67% 67% - - - 77% 77% - * 68% 69%
Writing 2016 69% 56% 46% 53% 53% - - - * * - - 50% 50%
Science 2016 79% 68% 40% 32% 32% - - - * * - * 37% 39%
STAARPercent at Postsecondary Readiness StandardAll Grades
Two or More Subjects 2016 45% 31% 14% 20% 20% - - - * * - * 18% 18%
Reading 2016 46% 34% 28% 30% 30% - - - * * - * 31% 30%
Mathematics 2016 43% 28% 21% 34% 34% - - - * * - * 31% 30%
Writing 2016 41% 27% 20% 26% 26% - - - * * - - 25% 25%
Science 2016 47% 33% * * * - - - * * - * * *
STAARPercent at Advanced StandardAll Grades
All Subjects 2016 18% 10% 7% 7% 7% - - - * * - * 7% 7%
Reading 2016 17% 9% 8% 8% 8% - - - * * - * 8% 8%
Mathematics 2016 19% 12% 8% 9% 9% - - - * * - * 9% 9%
Writing 2016 15% 7% * * * - - - * * - - * *
Science 2016 16% 11% * * * - - - * * - * * *
STAARPercent Met or Exceeded ProgressAll Grades
All Subjects 2016 62% 59% 69% 70% 70% - - - 64% 64% - * 69% 69%

TEA Division of Performance Reporting Page 5
TEXAS EDUCATION AGENCYDistrict Name: MANOR ISD Texas Academic Performance Report Total Students: 564
Campus Name: OAK MEADOWS EL 2015-16 Campus Performance Grade Span: EE - 05Campus Number: 227907107 Bilingual Education/English as a Second Language (Current Year ELL Students)
State District CampusBilingual
EducationBE-TransEarly Exit
BE-TransLate Exit
BE-DualTwo-Way
BE-DualOne-Way ESL
ESLContent
ESLPull-Out
LEP NoServices
LEP WithServices
TotalELL
STAARPercent Met or Exceeded ProgressAll Grades
Reading 2016 60% 59% 70% 70% 70% - - - * * - * 68% 69%
Mathematics 2016 63% 58% 67% 69% 69% - - - * * - * 70% 70%
STAARPercent Exceeded ProgressAll Grades
All Subjects 2016 17% 17% 28% 32% 32% - - - 32% 32% - * 32% 32%
Reading 2016 16% 17% 28% 32% 32% - - - * * - * 32% 31%
Mathematics 2016 17% 16% 28% 33% 33% - - - * * - * 33% 33%
Progress of Prior-Year Non-Proficient StudentsSum of Grades 4-8
Reading 2016 35% 32% 23% 28% 28% - - - * * - * 29% 30%

TEA Division of Performance Reporting Page 6
TEXAS EDUCATION AGENCYDistrict Name: MANOR ISD Texas Academic Performance Report Total Students: 564
Campus Name: OAK MEADOWS EL 2015-16 Campus Participation Grade Span: EE - 05Campus Number: 227907107 School Type: Elementary
State District CampusAfrican
American Hispanic WhiteAmerican
Indian AsianPacific
Islander
Two orMoreRaces
SpecialEd
EconDisadv ELL
2016 STAARParticipation(All Grades)
All TestsTest Participant 99% 99% 100% 100% 100% 100% - 100% - * 100% 100% 100%
Included in Accountability 94% 92% 91% 98% 91% 100% - 45% - * 93% 94% 86%Not Included in Accountability
Mobile 4% 6% 4% 2% 4% 0% - 14% - * 7% 3% 5%Other Exclusions 1% 1% 5% 0% 5% 0% - 41% - * 0% 3% 9%
Not Tested 1% 1% 0% 0% 0% 0% - 0% - * 0% 0% 0%Absent 1% 1% 0% 0% 0% 0% - 0% - * 0% 0% 0%Other 0% 0% 0% 0% 0% 0% - 0% - * 0% 0% 0%
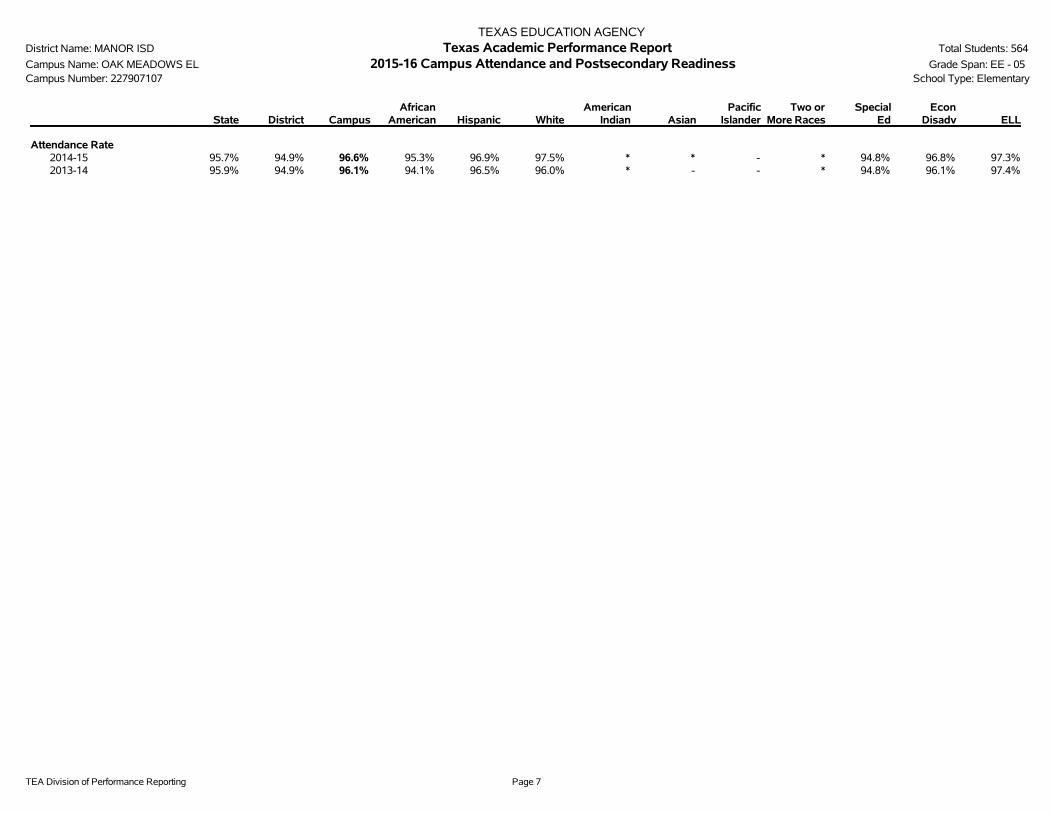
TEA Division of Performance Reporting Page 7
TEXAS EDUCATION AGENCYDistrict Name: MANOR ISD Texas Academic Performance Report Total Students: 564
Campus Name: OAK MEADOWS EL 2015-16 Campus Attendance and Postsecondary Readiness Grade Span: EE - 05Campus Number: 227907107 School Type: Elementary
State District CampusAfrican
American Hispanic WhiteAmerican
Indian AsianPacific
IslanderTwo or
More RacesSpecial
EdEcon
Disadv ELL
Attendance Rate2014-15 95.7% 94.9% 96.6% 95.3% 96.9% 97.5% * * - * 94.8% 96.8% 97.3%2013-14 95.9% 94.9% 96.1% 94.1% 96.5% 96.0% * - - * 94.8% 96.1% 97.4%

TEA Division of Performance Reporting Page 8
TEXAS EDUCATION AGENCYDistrict Name: MANOR ISD Texas Academic Performance Report Total Students: 564
Campus Name: OAK MEADOWS EL 2015-16 Campus Profile Grade Span: EE - 05Campus Number: 227907107 School Type: Elementary
---------------- Campus ----------------Student Information Count Percent District State
Total Students: 564 100.0% 8,856 5,284,252
Students by Grade:Early Childhood Education 9 1.6% 0.3% 0.2%Pre-Kindergarten 97 17.2% 8.6% 4.2%Kindergarten 65 11.5% 7.0% 7.1%Grade 1 77 13.7% 8.0% 7.8%Grade 2 82 14.5% 7.9% 7.8%Grade 3 80 14.2% 7.8% 7.7%Grade 4 83 14.7% 8.1% 7.5%Grade 5 71 12.6% 7.3% 7.5%Grade 6 0 0.0% 6.9% 7.4%Grade 7 0 0.0% 6.8% 7.4%Grade 8 0 0.0% 6.9% 7.3%Grade 9 0 0.0% 7.4% 8.1%Grade 10 0 0.0% 6.3% 7.3%Grade 11 0 0.0% 5.2% 6.7%Grade 12 0 0.0% 5.5% 6.1%
Ethnic Distribution:African American 95 16.8% 21.5% 12.6%Hispanic 430 76.2% 64.1% 52.2%White 16 2.8% 8.6% 28.5%American Indian 1 0.2% 0.2% 0.4%Asian 15 2.7% 3.0% 4.0%Pacific Islander 0 0.0% 0.2% 0.1%Two or More Races 7 1.2% 2.3% 2.1%
Economically Disadvantaged 363 64.4% 73.2% 59.0%Non-Educationally Disadvantaged 201 35.6% 26.8% 41.0%English Language Learners (ELL) 309 54.8% 36.0% 18.5%Students w/ Disciplinary Placements (2014-2015) 1 0.1% 2.0% 1.4%At-Risk 403 71.5% 60.5% 50.1%Mobility (2014-2015) 85 18.7% 19.8% 16.5%

TEA Division of Performance Reporting Page 9
TEXAS EDUCATION AGENCYDistrict Name: MANOR ISD Texas Academic Performance Report Total Students: 564
Campus Name: OAK MEADOWS EL 2015-16 Campus Profile Grade Span: EE - 05Campus Number: 227907107 School Type: Elementary
--------- Non-Special Education Rates --------- ------------- Special Education Rates -------------Student Information Campus District State Campus District State
Retention Rates by Grade:
Kindergarten 1.4% 1.4% 1.9% 0.0% 0.0% 8.2%Grade 1 1.3% 2.5% 4.1% 0.0% 4.9% 7.4%Grade 2 0.0% 1.2% 2.7% 0.0% 4.5% 3.4%Grade 3 0.0% 0.3% 2.0% 0.0% 0.0% 1.6%Grade 4 0.0% 1.0% 1.0% 0.0% 0.0% 0.8%Grade 5 1.4% 0.4% 0.9% 0.0% 0.0% 1.0%Grade 6 - 0.2% 0.6% - 0.0% 0.8%Grade 7 - 0.2% 0.8% - 0.0% 0.9%Grade 8 - 0.5% 0.8% - 1.5% 1.3%
Class Size Information Campus District State
Class Size Averages by Grade and Subject (Derived from teacher responsibility records):
Elementary:Kindergarten - - 18.9Grade 1 - - 19.1Grade 2 - - 19.1Grade 3 - - 19.1Grade 4 - - 19.0Grade 5 - - 20.8Grade 6 - - 20.4
Secondary:English/Language Arts - - 17.1Foreign Languages - - 19.1Mathematics - - 18.1Science - - 19.1Social Studies - - 19.5

TEA Division of Performance Reporting Page 10
TEXAS EDUCATION AGENCYDistrict Name: MANOR ISD Texas Academic Performance Report Total Students: 564
Campus Name: OAK MEADOWS EL 2015-16 Campus Profile Grade Span: EE - 05Campus Number: 227907107 School Type: Elementary
---------------- Campus ----------------Staff Information Count/Average Percent District State
Total Staff - 100.0% 100.0% 100.0%
Professional Staff: - - - 64.3%Teachers - - - 50.5%Professional Support - - - 9.8%Campus Administration (School Leadership) - - - 2.9%
Educational Aides: - - - 9.6%
Total Minority Staff: - - - 48.2%
Teachers by Ethnicity and Sex:African American - - - 10.1%Hispanic - - - 26.0%White - - - 60.8%American Indian - - - 0.4%Asian - - - 1.5%Pacific Islander - - - 0.2%Two or More Races - - - 1.1%
Males - - - 23.5%Females - - - 76.5%
Teachers by Highest Degree Held:No Degree - - - 1.0%Bachelors - - - 74.7%Masters - - - 23.6%Doctorate - - - 0.6%
Teachers by Years of Experience:Beginning Teachers - - - 8.1%1-5 Years Experience - - - 27.3%6-10 Years Experience - - - 21.7%11-20 Years Experience - - - 27.3%Over 20 Years Experience - - - 15.7%
Number of Students per Teacher - n/a - 15.2

TEA Division of Performance Reporting Page 11
TEXAS EDUCATION AGENCYDistrict Name: MANOR ISD Texas Academic Performance Report Total Students: 564
Campus Name: OAK MEADOWS EL 2015-16 Campus Profile Grade Span: EE - 05Campus Number: 227907107 School Type: Elementary
Staff Information Campus District State
Average Years Experience of Teachers: - - 10.9Average Years Experience of Teachers with District: - - 7.3
Average Teacher Salary by Years of Experience (regular duties only):Beginning Teachers - - $45,5071-5 Years Experience - - $47,9966-10 Years Experience - - $50,45911-20 Years Experience - - $53,794Over 20 Years Experience - - $60,613
Average Actual Salaries (regular duties only):Teachers - - $51,891Professional Support - - $61,145Campus Administration (School Leadership) - - $75,654
Instructional Staff Percent: n/a - 64.5%
Contracted Instructional Staff (not incl. above): - - 1,914.4

TEA Division of Performance Reporting Page 12
TEXAS EDUCATION AGENCYDistrict Name: MANOR ISD Texas Academic Performance Report Total Students: 564
Campus Name: OAK MEADOWS EL 2015-16 Campus Profile Grade Span: EE - 05Campus Number: 227907107 School Type: Elementary
---------------- Campus ----------------Program Information Count Percent District State
Student Enrollment by Program:Bilingual/ESL Education 299 53.0% 35.7% 18.3%Career & Technical Education 0 0.0% 28.7% 24.3%Gifted & Talented Education 21 3.7% 7.3% 7.7%Special Education 38 6.7% 7.8% 8.6%
Teachers by Program (population served):Bilingual/ESL Education - - - 5.9%Career & Technical Education - - - 4.4%Compensatory Education - - - 2.9%Gifted & Talented Education - - - 1.9%Regular Education - - - 72.6%Special Education - - - 8.8%Other - - - 3.4%
Link to: PEIMS Financial Standard Reports/ 2014-2015 Financial Actual Report
' '̂ Indicates that ELL rates at met or exceeded standard and exceeded standard include current and monitored students.'*' Indicates results are masked due to small numbers to protect student confidentiality.'-' Indicates zero observations reported for this group.'n/a' Indicates data reporting is not applicable for this group.'**' Indicates that rates for Reading and Mathematics are based on the cumulative results from the first and second administrations of STAAR.'?' Indicates that the data for this item were statistically improbable, or were reported outside a reasonable range.'##' Indicates that PID Error rate information cannot be reported in 2015-16 due to the transition from PEIMS Edit+ to TSDS.
2015-16 Texas Academic Performance Report
District Name: MANOR ISD
Campus Name: PIONEER CROSSING EL
Campus Number: 227907108
2016 Accountability Rating: Met Standard
Distinction Designations:
Academic Achievement in Science

This page intentionally left blank.
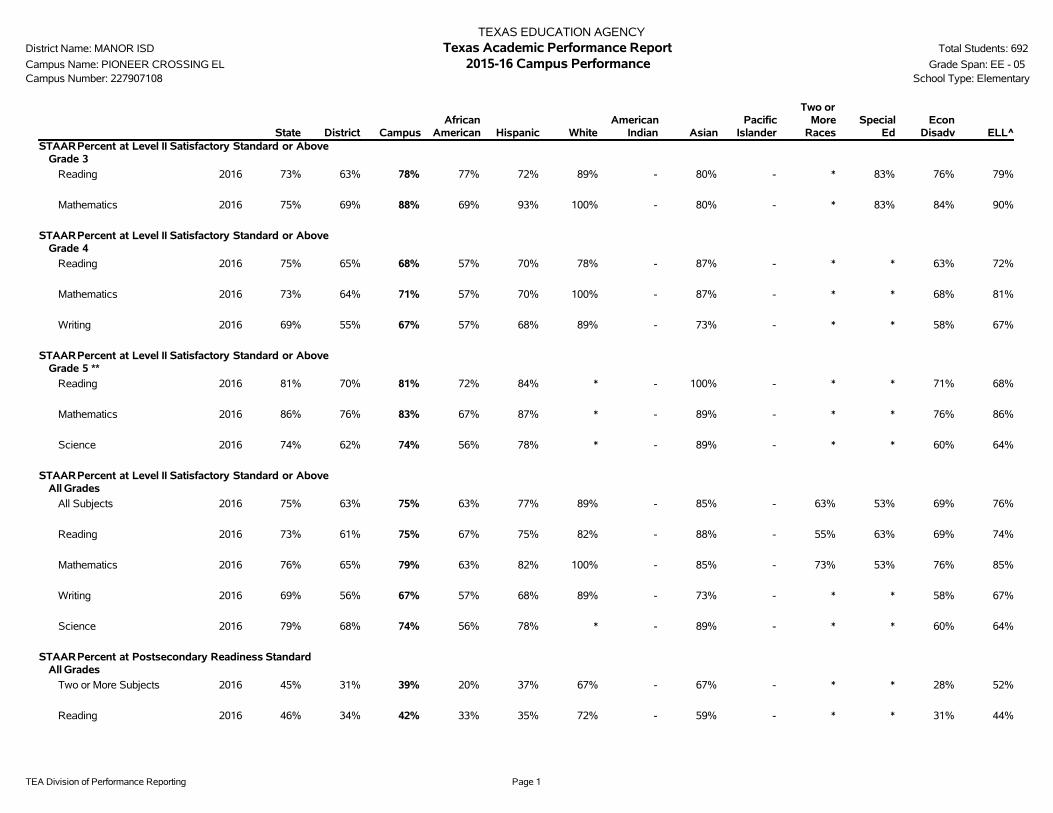
TEA Division of Performance Reporting Page 1
TEXAS EDUCATION AGENCYDistrict Name: MANOR ISD Texas Academic Performance Report Total Students: 692
Campus Name: PIONEER CROSSING EL 2015-16 Campus Performance Grade Span: EE - 05Campus Number: 227907108 School Type: Elementary
State District CampusAfrican
American Hispanic WhiteAmerican
Indian AsianPacific
Islander
Two orMore
RacesSpecial
EdEcon
Disadv ELL^STAARPercent at Level II Satisfactory Standard or Above
Grade 3
Reading 2016 73% 63% 78% 77% 72% 89% - 80% - * 83% 76% 79%
Mathematics 2016 75% 69% 88% 69% 93% 100% - 80% - * 83% 84% 90%
STAARPercent at Level II Satisfactory Standard or AboveGrade 4
Reading 2016 75% 65% 68% 57% 70% 78% - 87% - * * 63% 72%
Mathematics 2016 73% 64% 71% 57% 70% 100% - 87% - * * 68% 81%
Writing 2016 69% 55% 67% 57% 68% 89% - 73% - * * 58% 67%
STAARPercent at Level II Satisfactory Standard or AboveGrade 5 **
Reading 2016 81% 70% 81% 72% 84% * - 100% - * * 71% 68%
Mathematics 2016 86% 76% 83% 67% 87% * - 89% - * * 76% 86%
Science 2016 74% 62% 74% 56% 78% * - 89% - * * 60% 64%
STAARPercent at Level II Satisfactory Standard or AboveAll Grades
All Subjects 2016 75% 63% 75% 63% 77% 89% - 85% - 63% 53% 69% 76%
Reading 2016 73% 61% 75% 67% 75% 82% - 88% - 55% 63% 69% 74%
Mathematics 2016 76% 65% 79% 63% 82% 100% - 85% - 73% 53% 76% 85%
Writing 2016 69% 56% 67% 57% 68% 89% - 73% - * * 58% 67%
Science 2016 79% 68% 74% 56% 78% * - 89% - * * 60% 64%
STAARPercent at Postsecondary Readiness StandardAll Grades
Two or More Subjects 2016 45% 31% 39% 20% 37% 67% - 67% - * * 28% 52%
Reading 2016 46% 34% 42% 33% 35% 72% - 59% - * * 31% 44%
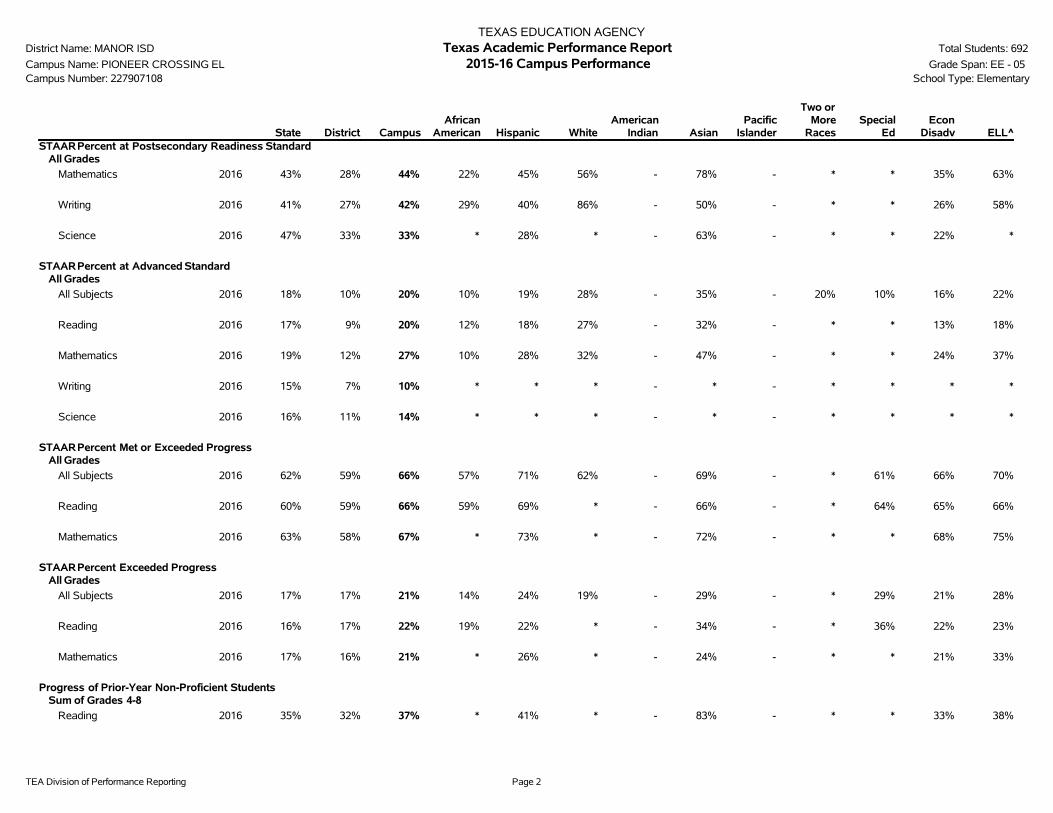
TEA Division of Performance Reporting Page 2
TEXAS EDUCATION AGENCYDistrict Name: MANOR ISD Texas Academic Performance Report Total Students: 692
Campus Name: PIONEER CROSSING EL 2015-16 Campus Performance Grade Span: EE - 05Campus Number: 227907108 School Type: Elementary
State District CampusAfrican
American Hispanic WhiteAmerican
Indian AsianPacific
Islander
Two orMore
RacesSpecial
EdEcon
Disadv ELL^STAARPercent at Postsecondary Readiness Standard
All Grades
Mathematics 2016 43% 28% 44% 22% 45% 56% - 78% - * * 35% 63%
Writing 2016 41% 27% 42% 29% 40% 86% - 50% - * * 26% 58%
Science 2016 47% 33% 33% * 28% * - 63% - * * 22% *
STAARPercent at Advanced StandardAll Grades
All Subjects 2016 18% 10% 20% 10% 19% 28% - 35% - 20% 10% 16% 22%
Reading 2016 17% 9% 20% 12% 18% 27% - 32% - * * 13% 18%
Mathematics 2016 19% 12% 27% 10% 28% 32% - 47% - * * 24% 37%
Writing 2016 15% 7% 10% * * * - * - * * * *
Science 2016 16% 11% 14% * * * - * - * * * *
STAARPercent Met or Exceeded ProgressAll Grades
All Subjects 2016 62% 59% 66% 57% 71% 62% - 69% - * 61% 66% 70%
Reading 2016 60% 59% 66% 59% 69% * - 66% - * 64% 65% 66%
Mathematics 2016 63% 58% 67% * 73% * - 72% - * * 68% 75%
STAARPercent Exceeded ProgressAll Grades
All Subjects 2016 17% 17% 21% 14% 24% 19% - 29% - * 29% 21% 28%
Reading 2016 16% 17% 22% 19% 22% * - 34% - * 36% 22% 23%
Mathematics 2016 17% 16% 21% * 26% * - 24% - * * 21% 33%
Progress of Prior-Year Non-Proficient StudentsSum of Grades 4-8
Reading 2016 35% 32% 37% * 41% * - 83% - * * 33% 38%
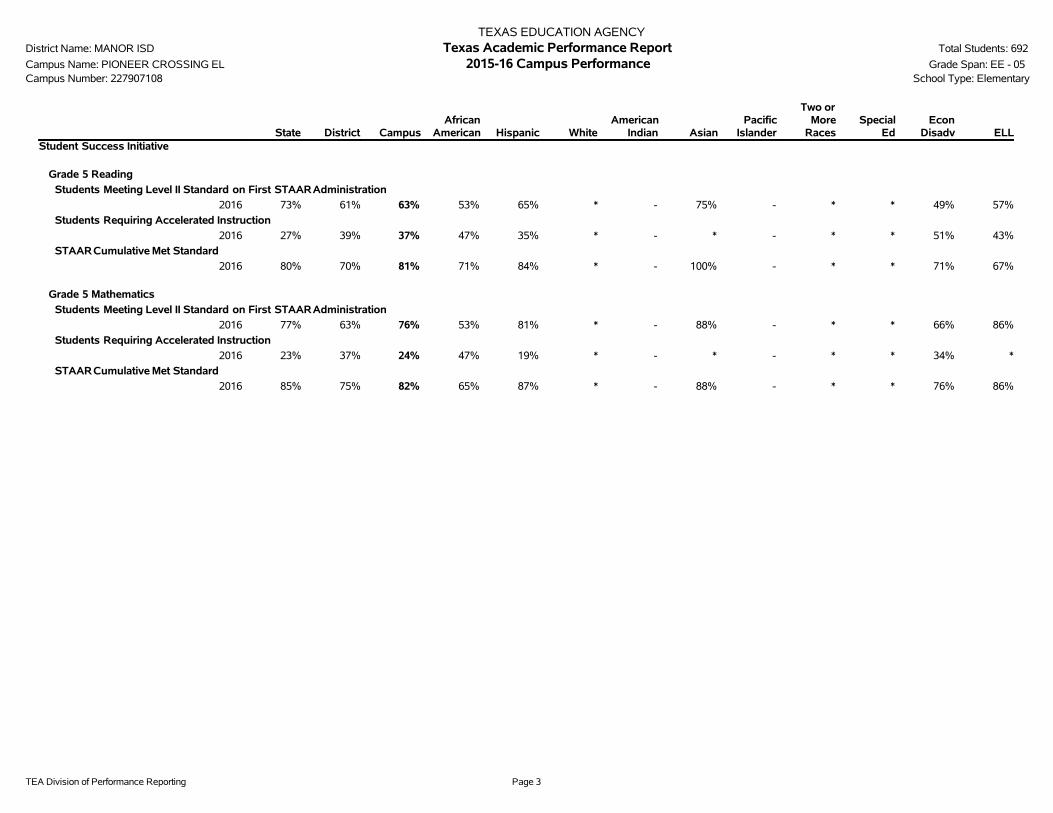
TEA Division of Performance Reporting Page 3
TEXAS EDUCATION AGENCYDistrict Name: MANOR ISD Texas Academic Performance Report Total Students: 692
Campus Name: PIONEER CROSSING EL 2015-16 Campus Performance Grade Span: EE - 05Campus Number: 227907108 School Type: Elementary
State District CampusAfrican
American Hispanic WhiteAmerican
Indian AsianPacific
Islander
Two orMore
RacesSpecial
EdEcon
Disadv ELLStudent Success Initiative
Grade 5 Reading
Students Meeting Level II Standard on First STAARAdministration
2016 73% 61% 63% 53% 65% * - 75% - * * 49% 57%
Students Requiring Accelerated Instruction
2016 27% 39% 37% 47% 35% * - * - * * 51% 43%
STAARCumulative Met Standard
2016 80% 70% 81% 71% 84% * - 100% - * * 71% 67%
Grade 5 Mathematics
Students Meeting Level II Standard on First STAARAdministration
2016 77% 63% 76% 53% 81% * - 88% - * * 66% 86%
Students Requiring Accelerated Instruction
2016 23% 37% 24% 47% 19% * - * - * * 34% *
STAARCumulative Met Standard
2016 85% 75% 82% 65% 87% * - 88% - * * 76% 86%

TEA Division of Performance Reporting Page 4
TEXAS EDUCATION AGENCYDistrict Name: MANOR ISD Texas Academic Performance Report Total Students: 692
Campus Name: PIONEER CROSSING EL 2015-16 Campus Performance Grade Span: EE - 05Campus Number: 227907108 Bilingual Education/English as a Second Language (Current Year ELL Students)
State District CampusBilingual
EducationBE-TransEarly Exit
BE-TransLate Exit
BE-DualTwo-Way
BE-DualOne-Way ESL
ESLContent
ESLPull-Out
LEP NoServices
LEP WithServices
TotalELL
STAARPercent at Level II Satisfactory Standard or AboveAll Grades
All Subjects 2016 75% 63% 75% 74% 74% - - - 78% 78% - * 76% 76%
Reading 2016 73% 61% 75% 72% 72% - - - 75% 75% - * 73% 74%
Mathematics 2016 76% 65% 79% 85% 85% - - - 84% 84% - * 85% 85%
Writing 2016 69% 56% 67% 71% 71% - - - 60% 60% - - 67% 67%
Science 2016 79% 68% 74% 47% 47% - - - 100% 100% - * 62% 64%
STAARPercent at Postsecondary Readiness StandardAll Grades
Two or More Subjects 2016 45% 31% 39% 40% 40% - - - 64% 64% - * 51% 52%
Reading 2016 46% 34% 42% 28% 28% - - - 59% 59% - * 43% 44%
Mathematics 2016 43% 28% 44% 52% 52% - - - 73% 73% - * 62% 63%
Writing 2016 41% 27% 42% 63% 63% - - - 55% 55% - - 58% 58%
Science 2016 47% 33% 33% * * - - - * * - * * *
STAARPercent at Advanced StandardAll Grades
All Subjects 2016 18% 10% 20% 19% 19% - - - 27% 27% - * 22% 22%
Reading 2016 17% 9% 20% 13% 13% - - - 25% 25% - * 17% 18%
Mathematics 2016 19% 12% 27% 33% 33% - - - 41% 41% - * 36% 37%
Writing 2016 15% 7% 10% * * - - - * * - - * *
Science 2016 16% 11% 14% * * - - - * * - * * *
STAARPercent Met or Exceeded ProgressAll Grades
All Subjects 2016 62% 59% 66% 77% 77% - - - 56% 56% - * 70% 70%

TEA Division of Performance Reporting Page 5
TEXAS EDUCATION AGENCYDistrict Name: MANOR ISD Texas Academic Performance Report Total Students: 692
Campus Name: PIONEER CROSSING EL 2015-16 Campus Performance Grade Span: EE - 05Campus Number: 227907108 Bilingual Education/English as a Second Language (Current Year ELL Students)
State District CampusBilingual
EducationBE-TransEarly Exit
BE-TransLate Exit
BE-DualTwo-Way
BE-DualOne-Way ESL
ESLContent
ESLPull-Out
LEP NoServices
LEP WithServices
TotalELL
STAARPercent Met or Exceeded ProgressAll Grades
Reading 2016 60% 59% 66% 71% 71% - - - 54% 54% - * 65% 66%
Mathematics 2016 63% 58% 67% 83% 83% - - - 58% 58% - * 75% 75%
STAARPercent Exceeded ProgressAll Grades
All Subjects 2016 17% 17% 21% 28% 28% - - - 27% 27% - * 27% 28%
Reading 2016 16% 17% 22% 23% 23% - - - 23% 23% - * 23% 23%
Mathematics 2016 17% 16% 21% 32% 32% - - - 31% 31% - * 32% 33%
Progress of Prior-Year Non-Proficient StudentsSum of Grades 4-8
Reading 2016 35% 32% 37% * * - - - * * - - 38% 38%
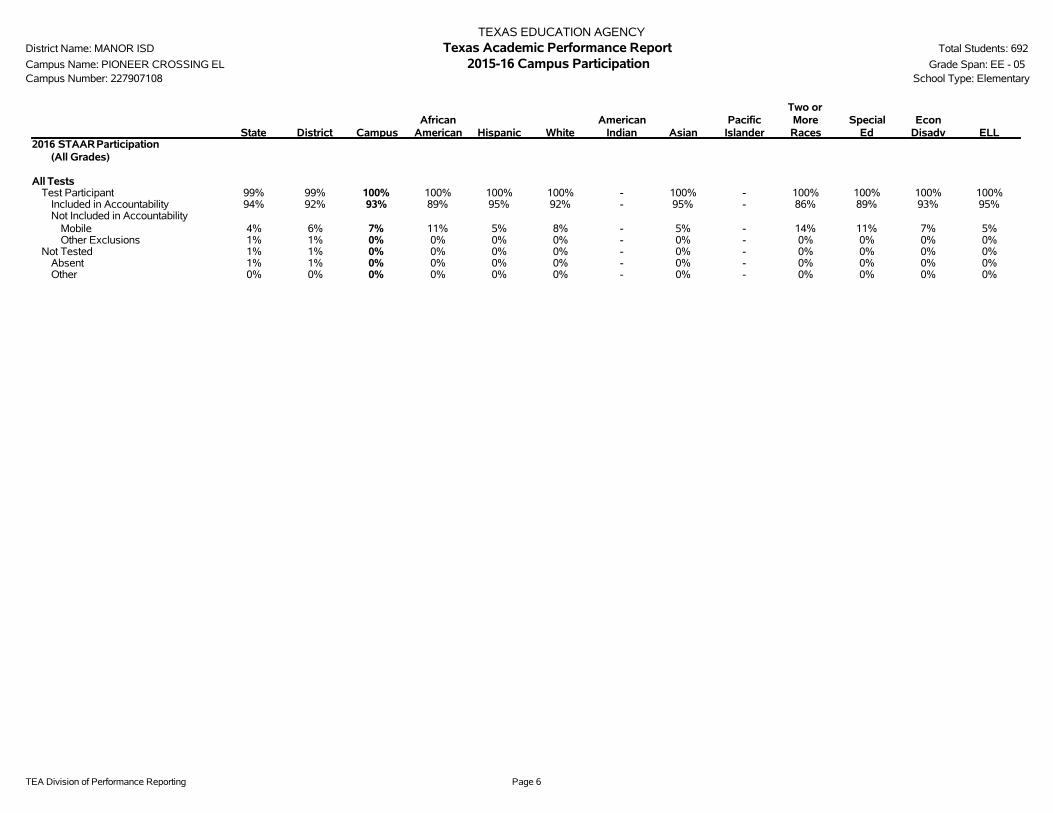
TEA Division of Performance Reporting Page 6
TEXAS EDUCATION AGENCYDistrict Name: MANOR ISD Texas Academic Performance Report Total Students: 692
Campus Name: PIONEER CROSSING EL 2015-16 Campus Participation Grade Span: EE - 05Campus Number: 227907108 School Type: Elementary
State District CampusAfrican
American Hispanic WhiteAmerican
Indian AsianPacific
Islander
Two orMoreRaces
SpecialEd
EconDisadv ELL
2016 STAARParticipation(All Grades)
All TestsTest Participant 99% 99% 100% 100% 100% 100% - 100% - 100% 100% 100% 100%
Included in Accountability 94% 92% 93% 89% 95% 92% - 95% - 86% 89% 93% 95%Not Included in Accountability
Mobile 4% 6% 7% 11% 5% 8% - 5% - 14% 11% 7% 5%Other Exclusions 1% 1% 0% 0% 0% 0% - 0% - 0% 0% 0% 0%
Not Tested 1% 1% 0% 0% 0% 0% - 0% - 0% 0% 0% 0%Absent 1% 1% 0% 0% 0% 0% - 0% - 0% 0% 0% 0%Other 0% 0% 0% 0% 0% 0% - 0% - 0% 0% 0% 0%

TEA Division of Performance Reporting Page 7
TEXAS EDUCATION AGENCYDistrict Name: MANOR ISD Texas Academic Performance Report Total Students: 692
Campus Name: PIONEER CROSSING EL 2015-16 Campus Attendance and Postsecondary Readiness Grade Span: EE - 05Campus Number: 227907108 School Type: Elementary
State District CampusAfrican
American Hispanic WhiteAmerican
Indian AsianPacific
IslanderTwo or
More RacesSpecial
EdEcon
Disadv ELL
Attendance Rate2014-15 95.7% 94.9% 96.5% 96.0% 96.2% 95.7% - 98.3% - 96.0% 95.5% 96.5% 96.9%2013-14 95.9% 94.9% 97.0% 96.8% 96.7% 96.8% - 98.4% * 96.8% 94.8% 96.8% 97.3%

TEA Division of Performance Reporting Page 8
TEXAS EDUCATION AGENCYDistrict Name: MANOR ISD Texas Academic Performance Report Total Students: 692
Campus Name: PIONEER CROSSING EL 2015-16 Campus Profile Grade Span: EE - 05Campus Number: 227907108 School Type: Elementary
---------------- Campus ----------------Student Information Count Percent District State
Total Students: 692 100.0% 8,856 5,284,252
Students by Grade:Early Childhood Education 7 1.0% 0.3% 0.2%Pre-Kindergarten 123 17.8% 8.6% 4.2%Kindergarten 98 14.2% 7.0% 7.1%Grade 1 106 15.3% 8.0% 7.8%Grade 2 109 15.8% 7.9% 7.8%Grade 3 75 10.8% 7.8% 7.7%Grade 4 98 14.2% 8.1% 7.5%Grade 5 76 11.0% 7.3% 7.5%Grade 6 0 0.0% 6.9% 7.4%Grade 7 0 0.0% 6.8% 7.4%Grade 8 0 0.0% 6.9% 7.3%Grade 9 0 0.0% 7.4% 8.1%Grade 10 0 0.0% 6.3% 7.3%Grade 11 0 0.0% 5.2% 6.7%Grade 12 0 0.0% 5.5% 6.1%
Ethnic Distribution:African American 168 24.3% 21.5% 12.6%Hispanic 302 43.6% 64.1% 52.2%White 64 9.2% 8.6% 28.5%American Indian 1 0.1% 0.2% 0.4%Asian 117 16.9% 3.0% 4.0%Pacific Islander 2 0.3% 0.2% 0.1%Two or More Races 38 5.5% 2.3% 2.1%
Economically Disadvantaged 448 64.7% 73.2% 59.0%Non-Educationally Disadvantaged 244 35.3% 26.8% 41.0%English Language Learners (ELL) 297 42.9% 36.0% 18.5%Students w/ Disciplinary Placements (2014-2015) 0 0.0% 2.0% 1.4%At-Risk 391 56.5% 60.5% 50.1%Mobility (2014-2015) 101 20.6% 19.8% 16.5%

TEA Division of Performance Reporting Page 9
TEXAS EDUCATION AGENCYDistrict Name: MANOR ISD Texas Academic Performance Report Total Students: 692
Campus Name: PIONEER CROSSING EL 2015-16 Campus Profile Grade Span: EE - 05Campus Number: 227907108 School Type: Elementary
--------- Non-Special Education Rates --------- ------------- Special Education Rates -------------Student Information Campus District State Campus District State
Retention Rates by Grade:
Kindergarten 1.0% 1.4% 1.9% 0.0% 0.0% 8.2%Grade 1 0.0% 2.5% 4.1% 0.0% 4.9% 7.4%Grade 2 1.3% 1.2% 2.7% 0.0% 4.5% 3.4%Grade 3 0.0% 0.3% 2.0% 0.0% 0.0% 1.6%Grade 4 0.0% 1.0% 1.0% 0.0% 0.0% 0.8%Grade 5 0.0% 0.4% 0.9% 0.0% 0.0% 1.0%Grade 6 - 0.2% 0.6% - 0.0% 0.8%Grade 7 - 0.2% 0.8% - 0.0% 0.9%Grade 8 - 0.5% 0.8% - 1.5% 1.3%
Class Size Information Campus District State
Class Size Averages by Grade and Subject (Derived from teacher responsibility records):
Elementary:Kindergarten - - 18.9Grade 1 - - 19.1Grade 2 - - 19.1Grade 3 - - 19.1Grade 4 - - 19.0Grade 5 - - 20.8Grade 6 - - 20.4
Secondary:English/Language Arts - - 17.1Foreign Languages - - 19.1Mathematics - - 18.1Science - - 19.1Social Studies - - 19.5

TEA Division of Performance Reporting Page 10
TEXAS EDUCATION AGENCYDistrict Name: MANOR ISD Texas Academic Performance Report Total Students: 692
Campus Name: PIONEER CROSSING EL 2015-16 Campus Profile Grade Span: EE - 05Campus Number: 227907108 School Type: Elementary
---------------- Campus ----------------Staff Information Count/Average Percent District State
Total Staff - 100.0% 100.0% 100.0%
Professional Staff: - - - 64.3%Teachers - - - 50.5%Professional Support - - - 9.8%Campus Administration (School Leadership) - - - 2.9%
Educational Aides: - - - 9.6%
Total Minority Staff: - - - 48.2%
Teachers by Ethnicity and Sex:African American - - - 10.1%Hispanic - - - 26.0%White - - - 60.8%American Indian - - - 0.4%Asian - - - 1.5%Pacific Islander - - - 0.2%Two or More Races - - - 1.1%
Males - - - 23.5%Females - - - 76.5%
Teachers by Highest Degree Held:No Degree - - - 1.0%Bachelors - - - 74.7%Masters - - - 23.6%Doctorate - - - 0.6%
Teachers by Years of Experience:Beginning Teachers - - - 8.1%1-5 Years Experience - - - 27.3%6-10 Years Experience - - - 21.7%11-20 Years Experience - - - 27.3%Over 20 Years Experience - - - 15.7%
Number of Students per Teacher - n/a - 15.2

TEA Division of Performance Reporting Page 11
TEXAS EDUCATION AGENCYDistrict Name: MANOR ISD Texas Academic Performance Report Total Students: 692
Campus Name: PIONEER CROSSING EL 2015-16 Campus Profile Grade Span: EE - 05Campus Number: 227907108 School Type: Elementary
Staff Information Campus District State
Average Years Experience of Teachers: - - 10.9Average Years Experience of Teachers with District: - - 7.3
Average Teacher Salary by Years of Experience (regular duties only):Beginning Teachers - - $45,5071-5 Years Experience - - $47,9966-10 Years Experience - - $50,45911-20 Years Experience - - $53,794Over 20 Years Experience - - $60,613
Average Actual Salaries (regular duties only):Teachers - - $51,891Professional Support - - $61,145Campus Administration (School Leadership) - - $75,654
Instructional Staff Percent: n/a - 64.5%
Contracted Instructional Staff (not incl. above): - - 1,914.4

TEA Division of Performance Reporting Page 12
TEXAS EDUCATION AGENCYDistrict Name: MANOR ISD Texas Academic Performance Report Total Students: 692
Campus Name: PIONEER CROSSING EL 2015-16 Campus Profile Grade Span: EE - 05Campus Number: 227907108 School Type: Elementary
---------------- Campus ----------------Program Information Count Percent District State
Student Enrollment by Program:Bilingual/ESL Education 295 42.6% 35.7% 18.3%Career & Technical Education 0 0.0% 28.7% 24.3%Gifted & Talented Education 76 11.0% 7.3% 7.7%Special Education 51 7.4% 7.8% 8.6%
Teachers by Program (population served):Bilingual/ESL Education - - - 5.9%Career & Technical Education - - - 4.4%Compensatory Education - - - 2.9%Gifted & Talented Education - - - 1.9%Regular Education - - - 72.6%Special Education - - - 8.8%Other - - - 3.4%
Link to: PEIMS Financial Standard Reports/ 2014-2015 Financial Actual Report
' '̂ Indicates that ELL rates at met or exceeded standard and exceeded standard include current and monitored students.'*' Indicates results are masked due to small numbers to protect student confidentiality.'-' Indicates zero observations reported for this group.'n/a' Indicates data reporting is not applicable for this group.'**' Indicates that rates for Reading and Mathematics are based on the cumulative results from the first and second administrations of STAAR.'?' Indicates that the data for this item were statistically improbable, or were reported outside a reasonable range.'##' Indicates that PID Error rate information cannot be reported in 2015-16 due to the transition from PEIMS Edit+ to TSDS.

2015-16 Texas Academic Performance Report
District Name: MANOR ISD
Campus Name: SHADOWGLEN EL
Campus Number: 227907109
2016 Accountability Rating: Met Standard

This page intentionally left blank.

TEA Division of Performance Reporting Page 1
TEXAS EDUCATION AGENCYDistrict Name: MANOR ISD Texas Academic Performance Report Total Students: 740
Campus Name: SHADOWGLEN EL 2015-16 Campus Performance Grade Span: EE - 05Campus Number: 227907109 School Type: Elementary
State District CampusAfrican
American Hispanic WhiteAmerican
Indian AsianPacific
Islander
Two orMore
RacesSpecial
EdEcon
Disadv ELL^STAARPercent at Level II Satisfactory Standard or Above
Grade 3
Reading 2016 73% 63% 67% 53% 69% 75% - * - * * 60% 50%
Mathematics 2016 75% 69% 74% 58% 75% 80% - * - * * 73% 68%
STAARPercent at Level II Satisfactory Standard or AboveGrade 4
Reading 2016 75% 65% 76% 73% 74% 91% - - - * * 72% 74%
Mathematics 2016 73% 64% 60% 51% 65% 64% - - - * * 55% 61%
Writing 2016 69% 55% 64% 59% 63% 73% - - - 100% * 63% 55%
STAARPercent at Level II Satisfactory Standard or AboveGrade 5 **
Reading 2016 81% 70% 68% 67% 64% 85% - - - * * 61% 50%
Mathematics 2016 86% 76% 66% 48% 69% 77% - - - * * 61% 67%
Science 2016 74% 62% 55% 45% 50% 85% - - - * * 46% 33%
STAARPercent at Level II Satisfactory Standard or AboveAll Grades
All Subjects 2016 75% 63% 66% 58% 66% 79% - 100% - 75% 39% 61% 57%
Reading 2016 73% 61% 70% 66% 69% 82% - * - 67% 43% 65% 58%
Mathematics 2016 76% 65% 66% 52% 69% 75% - * - 73% 33% 62% 65%
Writing 2016 69% 56% 64% 59% 63% 73% - - - 100% * 63% 55%
Science 2016 79% 68% 55% 45% 50% 85% - - - * * 46% 33%
STAARPercent at Postsecondary Readiness StandardAll Grades
Two or More Subjects 2016 45% 31% 29% 21% 27% 47% - * - * * 22% 25%
Reading 2016 46% 34% 36% 29% 35% 47% - * - 47% * 29% 36%

TEA Division of Performance Reporting Page 2
TEXAS EDUCATION AGENCYDistrict Name: MANOR ISD Texas Academic Performance Report Total Students: 740
Campus Name: SHADOWGLEN EL 2015-16 Campus Performance Grade Span: EE - 05Campus Number: 227907109 School Type: Elementary
State District CampusAfrican
American Hispanic WhiteAmerican
Indian AsianPacific
Islander
Two orMore
RacesSpecial
EdEcon
Disadv ELL^STAARPercent at Postsecondary Readiness Standard
All Grades
Mathematics 2016 43% 28% 30% 17% 30% 51% - * - 33% * 23% 26%
Writing 2016 41% 27% 30% 21% 38% * - - - * * 25% *
Science 2016 47% 33% 20% * 14% 46% - - - * * 15% *
STAARPercent at Advanced StandardAll Grades
All Subjects 2016 18% 10% 13% 8% 12% 21% - * - 30% 13% 10% 12%
Reading 2016 17% 9% 16% 11% 13% 23% - * - 47% * 13% 12%
Mathematics 2016 19% 12% 14% 6% 13% 23% - * - * * 11% 16%
Writing 2016 15% 7% 9% * 9% * - - - * * 8% *
Science 2016 16% 11% 7% * * * - - - * * * *
STAARPercent Met or Exceeded ProgressAll Grades
All Subjects 2016 62% 59% 57% 56% 57% 60% - - - * * 57% 59%
Reading 2016 60% 59% 57% 57% 55% 67% - - - * * 57% 58%
Mathematics 2016 63% 58% 56% 56% 58% * - - - * * 58% 60%
STAARPercent Exceeded ProgressAll Grades
All Subjects 2016 17% 17% 17% 15% 18% 21% - - - * * 16% 22%
Reading 2016 16% 17% 21% 20% 20% 29% - - - * * 18% 24%
Mathematics 2016 17% 16% 14% 10% 15% * - - - * * 14% 19%
Progress of Prior-Year Non-Proficient StudentsSum of Grades 4-8
Reading 2016 35% 32% 36% 28% 39% * - - - * * 33% 39%

TEA Division of Performance Reporting Page 3
TEXAS EDUCATION AGENCYDistrict Name: MANOR ISD Texas Academic Performance Report Total Students: 740
Campus Name: SHADOWGLEN EL 2015-16 Campus Performance Grade Span: EE - 05Campus Number: 227907109 School Type: Elementary
State District CampusAfrican
American Hispanic WhiteAmerican
Indian AsianPacific
Islander
Two orMore
RacesSpecial
EdEcon
Disadv ELLStudent Success Initiative
Grade 5 Reading
Students Meeting Level II Standard on First STAARAdministration
2016 73% 61% 57% 57% 52% 69% - - - * * 48% 47%
Students Requiring Accelerated Instruction
2016 27% 39% 43% 43% 48% * - - - * 100% 52% 53%
STAARCumulative Met Standard
2016 80% 70% 68% 65% 64% 85% - - - * * 61% 50%
Grade 5 Mathematics
Students Meeting Level II Standard on First STAARAdministration
2016 77% 63% 49% 43% 45% 69% - - - * * 45% 33%
Students Requiring Accelerated Instruction
2016 23% 37% 51% 57% 55% * - - - * 100% 55% 67%
STAARCumulative Met Standard
2016 85% 75% 66% 50% 69% 77% - - - * * 61% 67%
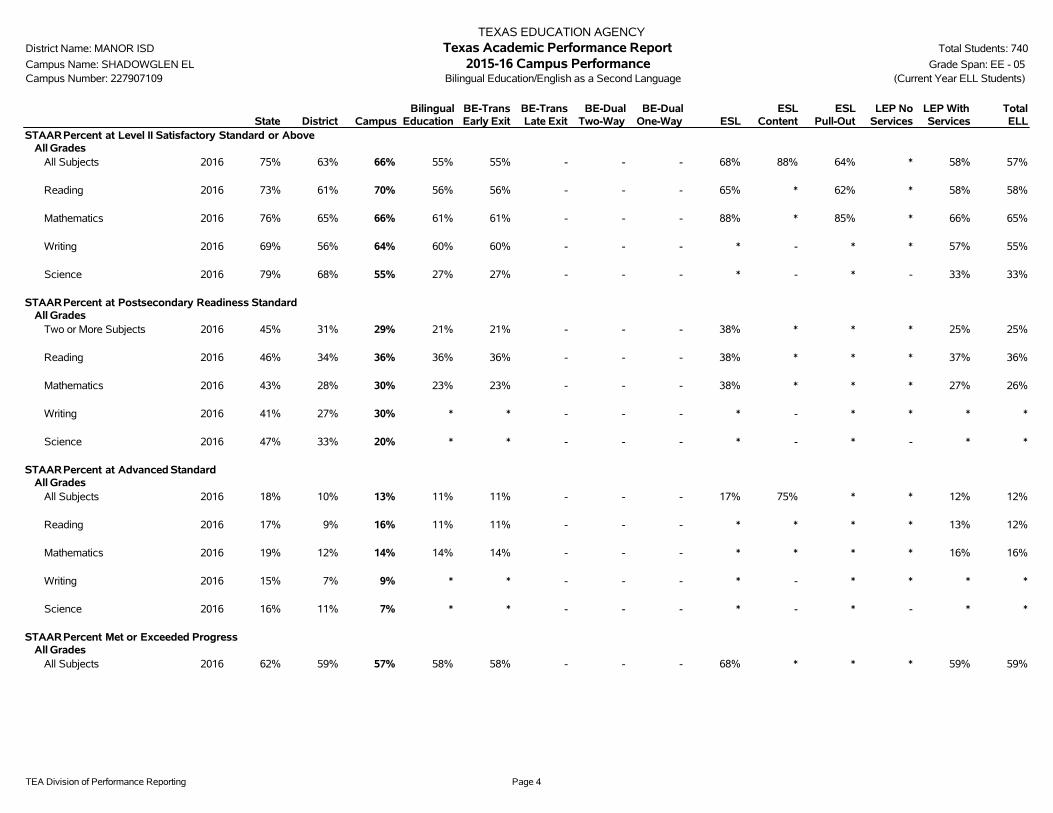
TEA Division of Performance Reporting Page 4
TEXAS EDUCATION AGENCYDistrict Name: MANOR ISD Texas Academic Performance Report Total Students: 740
Campus Name: SHADOWGLEN EL 2015-16 Campus Performance Grade Span: EE - 05Campus Number: 227907109 Bilingual Education/English as a Second Language (Current Year ELL Students)
State District CampusBilingual
EducationBE-TransEarly Exit
BE-TransLate Exit
BE-DualTwo-Way
BE-DualOne-Way ESL
ESLContent
ESLPull-Out
LEP NoServices
LEP WithServices
TotalELL
STAARPercent at Level II Satisfactory Standard or AboveAll Grades
All Subjects 2016 75% 63% 66% 55% 55% - - - 68% 88% 64% * 58% 57%
Reading 2016 73% 61% 70% 56% 56% - - - 65% * 62% * 58% 58%
Mathematics 2016 76% 65% 66% 61% 61% - - - 88% * 85% * 66% 65%
Writing 2016 69% 56% 64% 60% 60% - - - * - * * 57% 55%
Science 2016 79% 68% 55% 27% 27% - - - * - * - 33% 33%
STAARPercent at Postsecondary Readiness StandardAll Grades
Two or More Subjects 2016 45% 31% 29% 21% 21% - - - 38% * * * 25% 25%
Reading 2016 46% 34% 36% 36% 36% - - - 38% * * * 37% 36%
Mathematics 2016 43% 28% 30% 23% 23% - - - 38% * * * 27% 26%
Writing 2016 41% 27% 30% * * - - - * - * * * *
Science 2016 47% 33% 20% * * - - - * - * - * *
STAARPercent at Advanced StandardAll Grades
All Subjects 2016 18% 10% 13% 11% 11% - - - 17% 75% * * 12% 12%
Reading 2016 17% 9% 16% 11% 11% - - - * * * * 13% 12%
Mathematics 2016 19% 12% 14% 14% 14% - - - * * * * 16% 16%
Writing 2016 15% 7% 9% * * - - - * - * * * *
Science 2016 16% 11% 7% * * - - - * - * - * *
STAARPercent Met or Exceeded ProgressAll Grades
All Subjects 2016 62% 59% 57% 58% 58% - - - 68% * * * 59% 59%
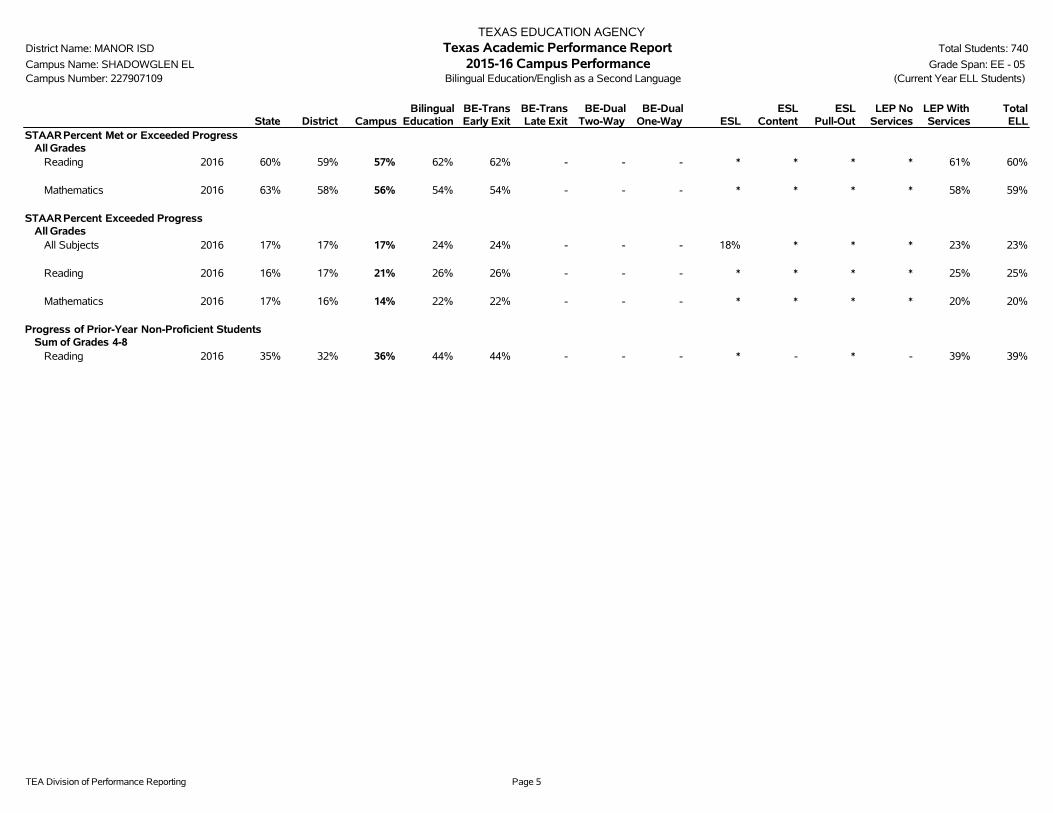
TEA Division of Performance Reporting Page 5
TEXAS EDUCATION AGENCYDistrict Name: MANOR ISD Texas Academic Performance Report Total Students: 740
Campus Name: SHADOWGLEN EL 2015-16 Campus Performance Grade Span: EE - 05Campus Number: 227907109 Bilingual Education/English as a Second Language (Current Year ELL Students)
State District CampusBilingual
EducationBE-TransEarly Exit
BE-TransLate Exit
BE-DualTwo-Way
BE-DualOne-Way ESL
ESLContent
ESLPull-Out
LEP NoServices
LEP WithServices
TotalELL
STAARPercent Met or Exceeded ProgressAll Grades
Reading 2016 60% 59% 57% 62% 62% - - - * * * * 61% 60%
Mathematics 2016 63% 58% 56% 54% 54% - - - * * * * 58% 59%
STAARPercent Exceeded ProgressAll Grades
All Subjects 2016 17% 17% 17% 24% 24% - - - 18% * * * 23% 23%
Reading 2016 16% 17% 21% 26% 26% - - - * * * * 25% 25%
Mathematics 2016 17% 16% 14% 22% 22% - - - * * * * 20% 20%
Progress of Prior-Year Non-Proficient StudentsSum of Grades 4-8
Reading 2016 35% 32% 36% 44% 44% - - - * - * - 39% 39%

TEA Division of Performance Reporting Page 6
TEXAS EDUCATION AGENCYDistrict Name: MANOR ISD Texas Academic Performance Report Total Students: 740
Campus Name: SHADOWGLEN EL 2015-16 Campus Participation Grade Span: EE - 05Campus Number: 227907109 School Type: Elementary
State District CampusAfrican
American Hispanic WhiteAmerican
Indian AsianPacific
Islander
Two orMoreRaces
SpecialEd
EconDisadv ELL
2016 STAARParticipation(All Grades)
All TestsTest Participant 99% 99% 100% 100% 100% 98% - 100% - 100% 100% 100% 100%
Included in Accountability 94% 92% 94% 92% 96% 89% - 100% - 93% 92% 95% 95%Not Included in Accountability
Mobile 4% 6% 6% 7% 4% 10% - 0% - 7% 8% 5% 4%Other Exclusions 1% 1% 0% 0% 0% 0% - 0% - 0% 0% 0% 1%
Not Tested 1% 1% 0% 0% 0% 2% - 0% - 0% 0% 0% 0%Absent 1% 1% 0% 0% 0% 1% - 0% - 0% 0% 0% 0%Other 0% 0% 0% 0% 0% 1% - 0% - 0% 0% 0% 0%
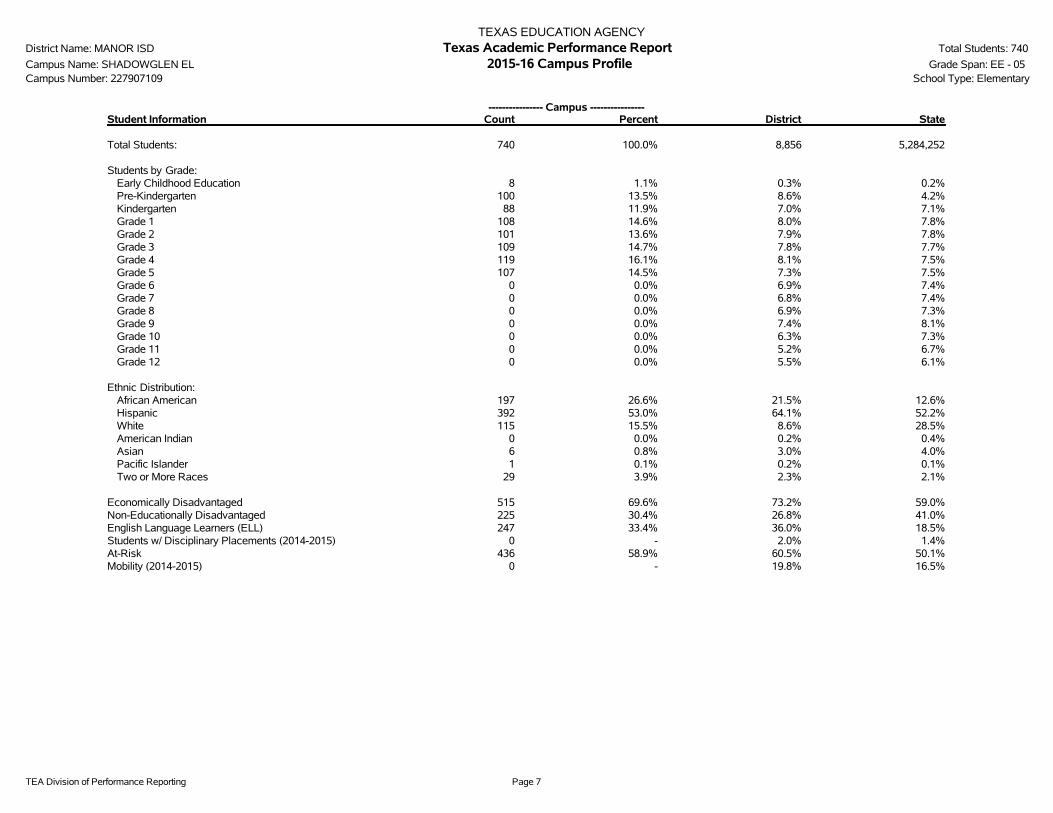
TEA Division of Performance Reporting Page 7
TEXAS EDUCATION AGENCYDistrict Name: MANOR ISD Texas Academic Performance Report Total Students: 740
Campus Name: SHADOWGLEN EL 2015-16 Campus Profile Grade Span: EE - 05Campus Number: 227907109 School Type: Elementary
---------------- Campus ----------------Student Information Count Percent District State
Total Students: 740 100.0% 8,856 5,284,252
Students by Grade:Early Childhood Education 8 1.1% 0.3% 0.2%Pre-Kindergarten 100 13.5% 8.6% 4.2%Kindergarten 88 11.9% 7.0% 7.1%Grade 1 108 14.6% 8.0% 7.8%Grade 2 101 13.6% 7.9% 7.8%Grade 3 109 14.7% 7.8% 7.7%Grade 4 119 16.1% 8.1% 7.5%Grade 5 107 14.5% 7.3% 7.5%Grade 6 0 0.0% 6.9% 7.4%Grade 7 0 0.0% 6.8% 7.4%Grade 8 0 0.0% 6.9% 7.3%Grade 9 0 0.0% 7.4% 8.1%Grade 10 0 0.0% 6.3% 7.3%Grade 11 0 0.0% 5.2% 6.7%Grade 12 0 0.0% 5.5% 6.1%
Ethnic Distribution:African American 197 26.6% 21.5% 12.6%Hispanic 392 53.0% 64.1% 52.2%White 115 15.5% 8.6% 28.5%American Indian 0 0.0% 0.2% 0.4%Asian 6 0.8% 3.0% 4.0%Pacific Islander 1 0.1% 0.2% 0.1%Two or More Races 29 3.9% 2.3% 2.1%
Economically Disadvantaged 515 69.6% 73.2% 59.0%Non-Educationally Disadvantaged 225 30.4% 26.8% 41.0%English Language Learners (ELL) 247 33.4% 36.0% 18.5%Students w/ Disciplinary Placements (2014-2015) 0 - 2.0% 1.4%At-Risk 436 58.9% 60.5% 50.1%Mobility (2014-2015) 0 - 19.8% 16.5%
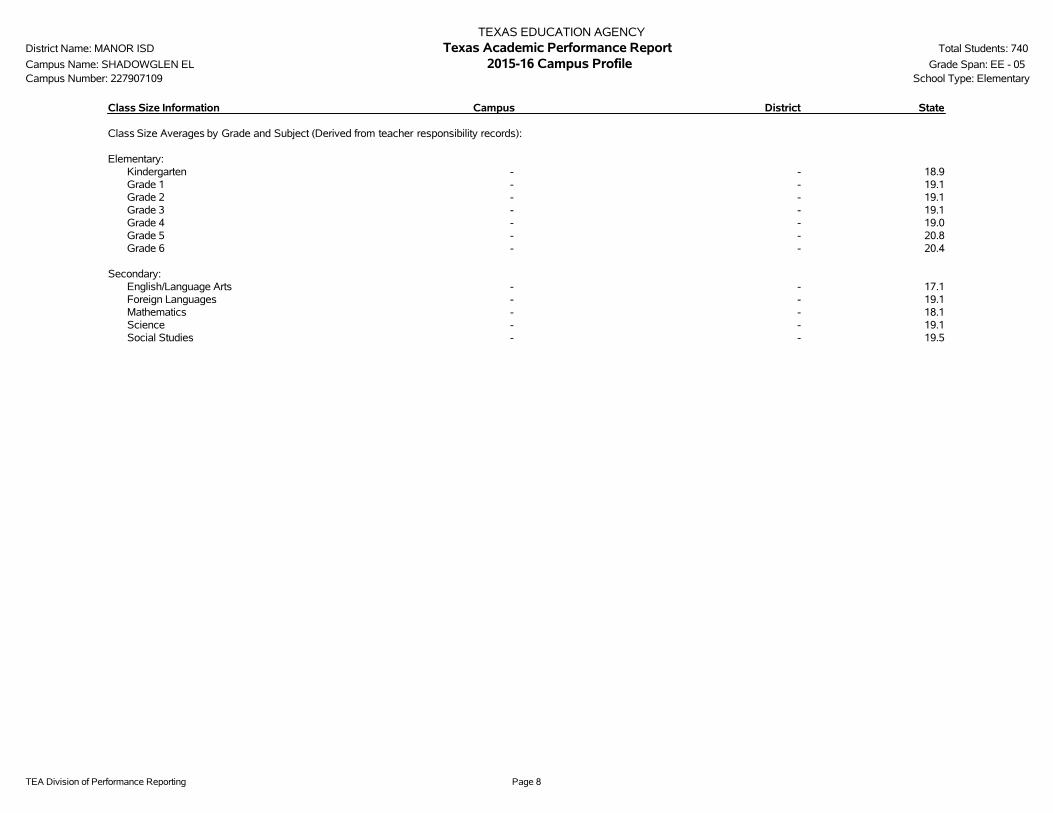
TEA Division of Performance Reporting Page 8
TEXAS EDUCATION AGENCYDistrict Name: MANOR ISD Texas Academic Performance Report Total Students: 740
Campus Name: SHADOWGLEN EL 2015-16 Campus Profile Grade Span: EE - 05Campus Number: 227907109 School Type: Elementary
Class Size Information Campus District State
Class Size Averages by Grade and Subject (Derived from teacher responsibility records):
Elementary:Kindergarten - - 18.9Grade 1 - - 19.1Grade 2 - - 19.1Grade 3 - - 19.1Grade 4 - - 19.0Grade 5 - - 20.8Grade 6 - - 20.4
Secondary:English/Language Arts - - 17.1Foreign Languages - - 19.1Mathematics - - 18.1Science - - 19.1Social Studies - - 19.5

TEA Division of Performance Reporting Page 9
TEXAS EDUCATION AGENCYDistrict Name: MANOR ISD Texas Academic Performance Report Total Students: 740
Campus Name: SHADOWGLEN EL 2015-16 Campus Profile Grade Span: EE - 05Campus Number: 227907109 School Type: Elementary
---------------- Campus ----------------Staff Information Count/Average Percent District State
Total Staff - 100.0% 100.0% 100.0%
Professional Staff: - - - 64.3%Teachers - - - 50.5%Professional Support - - - 9.8%Campus Administration (School Leadership) - - - 2.9%
Educational Aides: - - - 9.6%
Total Minority Staff: - - - 48.2%
Teachers by Ethnicity and Sex:African American - - - 10.1%Hispanic - - - 26.0%White - - - 60.8%American Indian - - - 0.4%Asian - - - 1.5%Pacific Islander - - - 0.2%Two or More Races - - - 1.1%
Males - - - 23.5%Females - - - 76.5%
Teachers by Highest Degree Held:No Degree - - - 1.0%Bachelors - - - 74.7%Masters - - - 23.6%Doctorate - - - 0.6%
Teachers by Years of Experience:Beginning Teachers - - - 8.1%1-5 Years Experience - - - 27.3%6-10 Years Experience - - - 21.7%11-20 Years Experience - - - 27.3%Over 20 Years Experience - - - 15.7%
Number of Students per Teacher - n/a - 15.2

TEA Division of Performance Reporting Page 10
TEXAS EDUCATION AGENCYDistrict Name: MANOR ISD Texas Academic Performance Report Total Students: 740
Campus Name: SHADOWGLEN EL 2015-16 Campus Profile Grade Span: EE - 05Campus Number: 227907109 School Type: Elementary
Staff Information Campus District State
Average Years Experience of Teachers: - - 10.9Average Years Experience of Teachers with District: - - 7.3
Average Teacher Salary by Years of Experience (regular duties only):Beginning Teachers - - $45,5071-5 Years Experience - - $47,9966-10 Years Experience - - $50,45911-20 Years Experience - - $53,794Over 20 Years Experience - - $60,613
Average Actual Salaries (regular duties only):Teachers - - $51,891Professional Support - - $61,145Campus Administration (School Leadership) - - $75,654
Instructional Staff Percent: n/a - 64.5%
Contracted Instructional Staff (not incl. above): - - 1,914.4

TEA Division of Performance Reporting Page 11
TEXAS EDUCATION AGENCYDistrict Name: MANOR ISD Texas Academic Performance Report Total Students: 740
Campus Name: SHADOWGLEN EL 2015-16 Campus Profile Grade Span: EE - 05Campus Number: 227907109 School Type: Elementary
---------------- Campus ----------------Program Information Count Percent District State
Student Enrollment by Program:Bilingual/ESL Education 242 32.7% 35.7% 18.3%Career & Technical Education 0 0.0% 28.7% 24.3%Gifted & Talented Education 53 7.2% 7.3% 7.7%Special Education 58 7.8% 7.8% 8.6%
Teachers by Program (population served):Bilingual/ESL Education - - - 5.9%Career & Technical Education - - - 4.4%Compensatory Education - - - 2.9%Gifted & Talented Education - - - 1.9%Regular Education - - - 72.6%Special Education - - - 8.8%Other - - - 3.4%
Link to: PEIMS Financial Standard Reports/ 2014-2015 Financial Actual Report
' '̂ Indicates that ELL rates at met or exceeded standard and exceeded standard include current and monitored students.'*' Indicates results are masked due to small numbers to protect student confidentiality.'-' Indicates zero observations reported for this group.'n/a' Indicates data reporting is not applicable for this group.'**' Indicates that rates for Reading and Mathematics are based on the cumulative results from the first and second administrations of STAAR.'?' Indicates that the data for this item were statistically improbable, or were reported outside a reasonable range.'##' Indicates that PID Error rate information cannot be reported in 2015-16 due to the transition from PEIMS Edit+ to TSDS.

This page intentionally left blank.