Texas Academic Performance Report Template
36
Texas Academic Performance Report (TAPR) 2013-14 Roosevelt ISD Presented to Board of Trustees on January 12, 2015
Transcript of Texas Academic Performance Report Template

Texas Academic Performance Report (TAPR) 2013-14
Roosevelt ISD
Presented to Board of Trustees on January 12, 2015

District Responsibilities for TAPR in Statute
Hearing for Public Discussion
Must be held within 90 calendar days after the
November 2014 TEASE release
TAPR must be disseminated within 2 weeks after the
hearing
Must publish performance and profile sections of district
and campus TAPR reports

Accessing the TAPR Report
http://tea.texas.gov/perfreport/tapr/index.html [Insert District Website Link] Determine Places for Hard Copy Dissemination?

Changes to the Year’s report
STAAR Grades 5 & 8: Reading and Math results will include
cumulative first and second administrations.
EOC: Will include the following:
English I/Reading I combined (2014 only)
English II/Reading II combined (2014 only)
Algebra I (2013 & 2014)
Biology (2013-2014)
U.S. History (2014 only)
TAKS reported for Class of 2014, last class tested under TAKS
SSI: Results are shown for one year only
TSI High Education Readiness Component is no longer reported

RISD AEIS Report
District/Campus Improvement Plans Performance Objectives 2014-15
Approved by Board of Trustees 12-15-14 and found on RISD website
#1 – Curriculum Alignment
#2 – Post Secondary Success
#3 – Health, Attendance, High School Completion, Safety
#4 - Technology
#5 - Professional Development
#6 – Career and Technology Education
#7 – Dyslexia and 504 Students
#8 – English as a Second Language (ESL)
#9 – Gifted and Talented
#10 – Migrant Students
#11 – Accelerated Instruction
#12 – Pre-Kindergarten
#13 – Special Education
#14 – Title I, Part A, Schoolwide
#15 – State Compensatory Education
#16 – Highly Qualified Teachers and Staff
Goal #1: To strengthen the academic program Pre-K through 12 in order to maximize success for all students.

RISD AEIS Report
District/Campus Improvement Plans Performance Objectives 2013-14
Goal #2: To strengthen Roosevelt’s tradition of
excellence based on pride, teamwork, and
professionalism among staff members.
PERFORMANCE OBJECTIVE #1: PRIDE
2.1 – To strengthen Roosevelt’s tradition of
school pride.
PERFORMANCE OBJECTIVE #2: TEAMWORK
& PROFESSIONALISM
2.2 – To strengthen Roosevelt’s tradition of
teamwork and professionalism among staff
members.

RISD AEIS Report
Goal #3: To promote Roosevelt’s tradition of excellence
to parents, alumni, and surrounding community.
District/Campus Improvement Plans Performance Objectives 2013-14
PERFORMANCE OBJECTIVE #1: Promoting
the District
3.1 To communicate the district’s activities and
successes to community stake holders.

District Profile -2013-14 Total Students: 1051 Students by Grade: Pre-Kinder – 38 Kinder – 81 1st Grade – 94 2nd Grade – 85 3rd Grade – 82 4th Grade – 72 5th Grade – 84 6th Grade – 74 7th Grade – 76 8th Grade – 86 9th Grade – 81 10th Grade – 70 11th Grade – 68 12th Grade – 60 Students in ESL Program – 38 Career & Tech Education – 272 Gifted/Talented Program – 40 Special Education - 104
Ethnic Distribution: African Amer – 47 Hispanic - 570 White – 408 American Indian – 6 Asian – 5 Pacific Islander – 2 Two or More Races – 13 Economically Disadvantaged – 792 Non-Educationally Disadvantaged – 259 English Language Learners (ELL) – 38 Students with Disciplinary Placements – 27 At – Risk Students – 678 Graduates (Class of 2013) – 61 SPED Graduates: 10

Accountability Ratings & Distinction Designations (DD)
• Roosevelt ISD – Met Standard • Roosevelt High School – Met Standard
– DD: Academic Achievement in Mathematics – Academic Achievement in Science – Academic Achievement in Social Studies – Top 25 Percent: Closing Performance Gaps
• Roosevelt Junior High – Met Standard – DD: Academic Achievement in Reading/ELA – Academic Achievement in Mathematics – Academic Achievement in Social Studies – Top 25 Percent: Student Progress – Top 25 Percent: Closing Performance Gaps – Postsecondary Readiness
• Roosevelt Elementary – Met Standard – DD: Academic Achievement in Reading/ELA – Academic Achievement in Science

0
20
40
60
80
100
120
3rd Grade 4th Grade 5th Grade 6th Grade 7th Grade 8th Grade
2013
2014
2013 vs. 2014 STAAR 3-8 Performance Reading

0
20
40
60
80
100
120
ENG I/Rdg I ENG II/Rdg II Algebra I Biology
2013
2014
2013 vs. 2014 STAAR Performance End-of-Course: End Of Course Exams

0
10
20
30
40
50
60
70
80
90
100
GR 3 GR 4 GR 5 GR 6 GR 7 GR 8
2013
2014
2013 vs. 2014 STAAR 3-8 Performance Mathematics
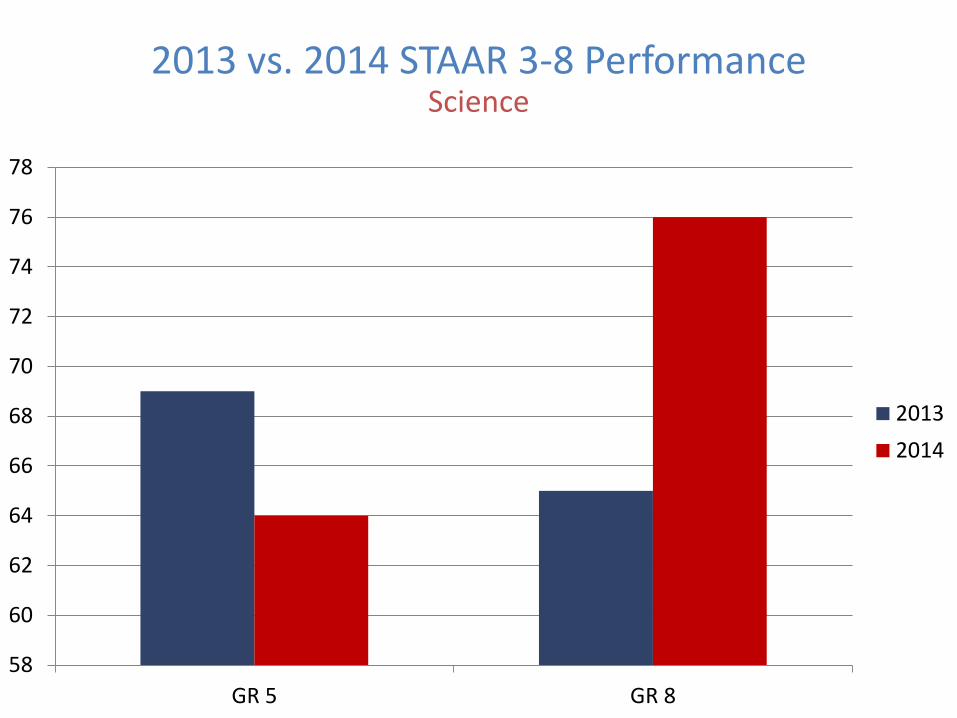
58
60
62
64
66
68
70
72
74
76
78
GR 5 GR 8
2013
2014
2013 vs. 2014 STAAR 3-8 Performance Science

0
20
40
60
80
100
120
2013 2014
All
Af Am
Hisp
White
Eco Dis
Sp Ed
2013 vs. 2014 STAAR 3-8 Performance Social Studies – 8th Grade only

0
20
40
60
80
100
120
World Geography -2013 World History -2013 US History - 2014
All
Af Am
Hisp
White
Eco Dis
Sp Ed
Two or More
ELL
2013 vs. 2014 STAAR Performance End-of-Course: Social Studies

0
10
20
30
40
50
60
70
80
90
4th Grade 7th Grade
2013
2014
2013 vs. 2014 STAAR 3-8 Performance Writing

0
10
20
30
40
50
60
70
80
90
100
2013 2014
State
Region
District
Afr. Am.
Hisp.
White
Amer Ind
Asian
Two or More
SPED
Eco Dis
ELL
STAAR Percent at Phase-in Satisfactory Standard or Above
All Grades, All Subjects
0
10
20
30
40
50
60
70
80
90
100
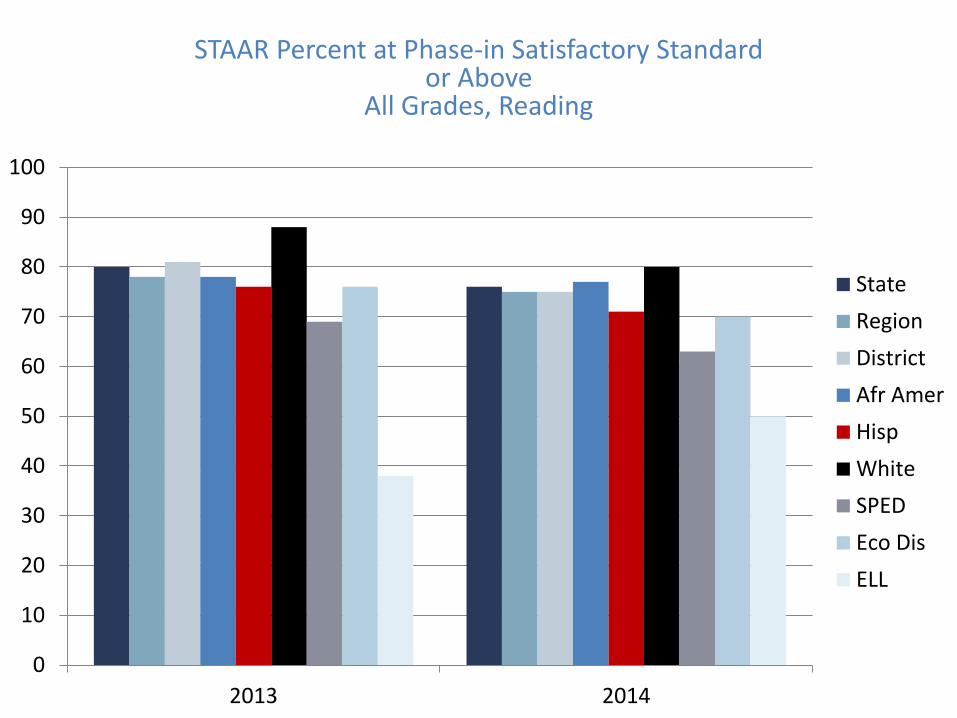
2013 2014
State
Region
District
Afr Amer
Hisp
White
SPED
Eco Dis
ELL
STAAR Percent at Phase-in Satisfactory Standard or Above
All Grades, Reading

0
10
20
30
40
50
60
70
80
90
100
2013 2014
State
Region
District
Afr Amer
Hisp
White
Two or More
SPED
Eco Dis
ELL
STAAR Percent at Phase-in Satisfactory Standard or Above
All Grades, Mathematics

0
10
20
30
40
50
60
70
80
90
100
2013 2014
State
Region
District
Afr. Amer
Hisp
White
SPED
Eco Dis
STAAR Percent at Phase-in Satisfactory Standard or Above
All Grades, Science

0
10
20
30
40
50
60
70
80
90
100
2013 2014
State
Region
District
Afr Amer
Hisp
White
SPED
Eco Dis
STAAR Percent at Phase-in Satisfactory Standard or Above
All Grades, Social Studies

0
10
20
30
40
50
60
70
80
90
100
2013 2014
State
Region
District
Afr Amer
Hisp
White
SPED
Eco Dis
STAAR Percent Met or Exceeded Progress All Grades, Reading

0
10
20
30
40
50
60
70
80
90
100
2013 2014
State
Region
District
Hisp
White
SPED
Eco Dis
STAAR Percent Met or Exceeded Progress All Grades, Mathematics

0
10
20
30
40
50
60
70
80
90
100
2013 2014
State
Region
District
Afr Amer
Hisp
White
SPED
Eco Dis
STAAR Percent Exceeded Progress All Grades, Reading
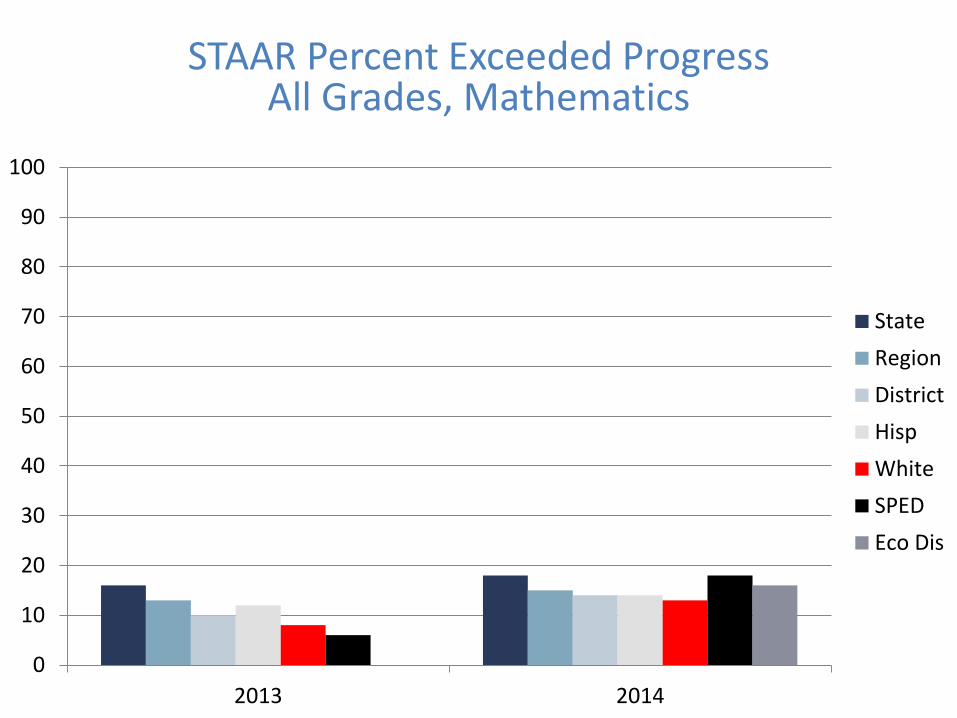
0
10
20
30
40
50
60
70
80
90
100
2013 2014
State
Region
District
Hisp
White
SPED
Eco Dis
STAAR Percent Exceeded Progress All Grades, Mathematics

Student Success Initiative 5th & 8th Reading
0
10
20
30
40
50
60
70
80
90
100
5th Reading 8th Reading 5th Math 8th Math
Students Meeting on FirstAdmin
Requiring Accelerated Instr
Cumulative Met Standard

0
10
20
30
40
50
60
70
80
90
100
District RHS RJH RES
All
Af Am
Hisp
White
Eco Dis
Sp Ed
Two or More
ELL
2013 - 2014 Attendance for the 2012-2013 School Year

0
0.05
0.1
0.15
0.2
0.25
0.3
0.35
District RJH State Region 17
All
Af Am
Hisp
White
Eco Dis
Sp Ed
Two or More
ELL
2014 Annual Dropout Rate (Grades 7-8) 2012-2013 School Year – 0%

0
0.5
1
1.5
2
2.5
3
2013 2014
All
Af Am
Hisp
White
Eco Dis
Sp Ed
ELL
2014 Annual Dropout Rate (Grades 9-12) 2012-2013 School Year

0
10
20
30
40
50
60
70
80
90
100
class of 2012 class of 2013
Graduate
Dropout
95.6 96.8
4.4 3.2
4-Year Longitudinal Graduation Rate (Grades 9-12) Class of 2013
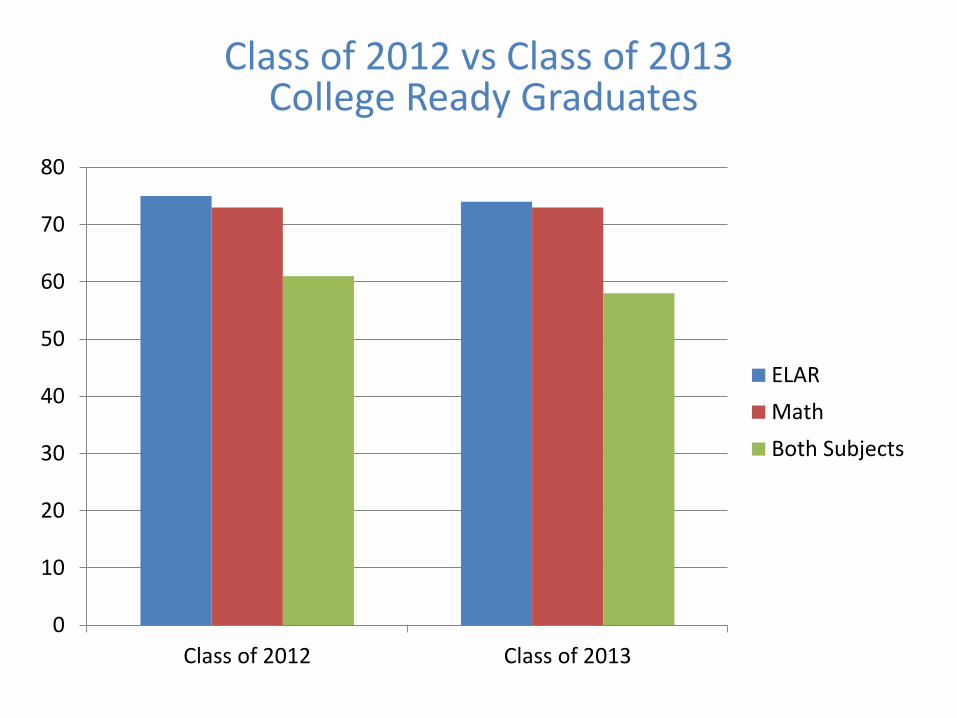
Class of 2012 vs Class of 2013 College Ready Graduates
0
10
20
30
40
50
60
70
80
Class of 2012 Class of 2013
ELAR
Math
Both Subjects

Violent and Criminal Incidents
• Texas statute (TEC 39.053) requires every district to publish an annual report on violent and criminal incidents at campuses in the district
• The report must include:
– Number, rate and type of incidents
– Information concerning school violence prevention and intervention policies and procedures used by the district
– Findings that result from Safe and Drug-Free Schools and Communities Act

0
0.1
0.2
0.3
0.4
0.5
0.6
0.7
0.8
0.9
1
2011-12 2012-13 2013-14
Felony
Misdemeanor
Firearms
Assault
Other Reported
Violent and Criminal Incidents ZERO Incidents
Texas Higher Education Coordinating Board
• Texas statute (TEC 51.403e) requires every district to include with its TAPR a report on student performance in postsecondary institutions during the first year enrolled after graduation from high school. The report includes:
– Number of Total Graduates, disaggregated by attendance in Institutes of Higher Education
– Number of Students within each GPA reporting band

High School Graduates from FY2012 Enrolled in Texas Public or Independent Higher Education in FY 2013
[Insert High School Name]
Total Graduates
GPA for 1st Year in Public Higher Education in Texas
< 2.0 2.0 – 2.49
2.5 – 2.99
3.0 – 3.49
> 3.5 Unknown
Four-Year Public University
9 0 1 2 3 3 0
Two-Year Public Colleges 19 6 2 2 7 0 2
Independent Colleges & Universities
3
Not Trackable 0
Not Found 36
Total High School Graduates
67

For more information, please contact:
Kayla Morrison Assistant Superintendent
[email protected] 806-842-3282 ext 102