This is author version post-print archived in the official...
50
1 Lower Soil Moisture Threshold for Transpiration Decline under Water Deficit Correlates with Lower Canopy Conductance and Higher Transpiration Efficiency in Drought Tolerant Cowpea Nouhoun BELKO A,D , Mainassara ZAMAN-ALLAH B , Ndiaga CISSE A , Ndeye Ndack DIOP A,C , Gerard ZOMBRE D , Jeffrey D. EHLERS C , Vincent VADEZ B,* DOI: http://dx.doi.org/10.1071/FP11282 This is author version post-print archived in the official Institutional Repository of ICRISAT www.icrisat.org Terminal drought tolerance implies that plants have enough water to fill grains. Water saving traits, measured in tolerant and sensitive cowpea lines, showed that tolerant lines have developed several constitutive mechanisms, closely related to one another, which reduces the rate of water use and delay drought effects. This opens the possibility to decipher their genetic basis towards the development of drought tolerant cowpea cultivars.
Transcript of This is author version post-print archived in the official...

1
Lower Soil Moisture Threshold for Transpiration Decline under Water Deficit Correlates with
Lower Canopy Conductance and Higher Transpiration Efficiency in Drought Tolerant
Cowpea
Nouhoun BELKOA,D
, Mainassara ZAMAN-ALLAHB, Ndiaga CISSE
A,
Ndeye Ndack DIOPA,C
, Gerard ZOMBRED, Jeffrey D. EHLERS
C, Vincent VADEZ
B,*
DOI: http://dx.doi.org/10.1071/FP11282
This is author version post-print archived in the official Institutional Repository of
ICRISAT www.icrisat.org
Terminal drought tolerance implies that plants have enough water to fill grains. Water saving
traits, measured in tolerant and sensitive cowpea lines, showed that tolerant lines have
developed several constitutive mechanisms, closely related to one another, which reduces the
rate of water use and delay drought effects. This opens the possibility to decipher their genetic
basis towards the development of drought tolerant cowpea cultivars.

2
Lower Soil Moisture Threshold for Transpiration Decline under Water
Deficit Correlates with Lower Canopy Conductance and Higher
Transpiration Efficiency in Drought Tolerant Cowpea
Nouhoun BELKOA,D
, Mainassara ZAMAN-ALLAHB, Ndiaga CISSE
A,
Ndeye Ndack DIOPA,C
, Gerard ZOMBRED, Jeffrey D. EHLERS
C, Vincent VADEZ
B,*
A Centre d’Etude Régional pour l’Amélioration de l’Adaptation à la Sécheresse, BP 3320
Thiès-Escale, Sénégal
B International Crops Research Institute for the Semi-Arid Tropics, Patancheru 502 324
Andhra Pradesh, India
C Department of Botany and Plant Sciences, University of California, Riverside, CA 92 521-
0124, USA
D Laboratoire de Biologie et Physiologie Végétale, UFR-SVT, Université de Ouagadougou,
03 BP 7021 Ouagadougou 03, Burkina Faso
* Corresponding author. E-mail : [email protected] (V. Vadez), Tel.: +91 40 30713463; Fax:
+91 40 30713074.
Date of submission: December 19th
, 2011
Number of tables: 6
Number of figures: 7 + 2 supplemental
Word count: 8,290
Short running title: Water saving traits and terminal drought tolerance in cowpea

3
Lower Soil Moisture Threshold for Transpiration Decline under Water
Deficit Correlates with Lower Canopy Conductance and Higher
Transpiration Efficiency in Drought Tolerant Cowpea
Nouhoun BELKOA,D
, Mainassara ZAMAN-ALLAHB, Ndiaga CISSE
A,
Ndeye Ndack DIOPA,C
, Gerard ZOMBRED, Jeffrey D. EHLERS
C, Vincent VADEZ
B,*
A Centre d’Etude Régional pour l’Amélioration de l’Adaptation à la Sécheresse, BP 3320
Thiès-Escale, Sénégal
B International Crops Research Institute for the Semi-Arid Tropics, Patancheru 502 324
Andhra Pradesh, India
C Department of Botany and Plant Sciences, University of California, Riverside, CA 92 521-
0124, USA
D Laboratoire de Biologie et Physiologie Végétale, UFR-SVT, Université de Ouagadougou,
03 BP 7021 Ouagadougou 03, Burkina Faso
* Corresponding author. E-mail : [email protected] (V. Vadez), Tel.: +91 40 30713463; Fax:
+91 40 30713074.
Abstract
Water availability being critical for reproduction and grain filling, terminal drought tolerance
may involve water saving traits. Experiments were undertaken under different VPD and water
regimes (water stress [WS] and well-watered [WW]) to test genotypic differences and traits
relationships in the fraction of transpirable soil water [FTSW] at which transpiration declines,
canopy conductance [TR, g H2O cm-2
h-1
], canopy temperature depression [CTD, °C],
transpiration efficiency [TE, g kg-1
], growth parameters, using fifteen contrasting cowpea
genotypes. Under WW conditions at vegetative and early podding stage, plant mass and leaf
area were larger under low than under high VPD conditions and was generally lower in
tolerant than in sensitive genotypes. Several tolerant lines had lower TR under WW

4
conditions and restricted TR more than sensitive lines under high VPD. Under WS conditions,
transpiration declined at lower FTSW in tolerant than in sensitive lines. Tolerant lines also
maintained higher TR and CTD under severe stress than sensitive lines. TE was higher in
tolerant than in sensitive genotypes under WS conditions. Significant and close relationships
were found between TR and TE, CTD, and FTSW in both environments under different water
regime conditions. In sum, traits that condition how genotypes manage limited water
resources discriminated tolerant and sensitive lines. Our interpretation is that a lower canopy
conductance limits plant growth and plant water use, and allows tolerant lines to behave like
non-stressed plants until the soil is drier and maintains a higher transpiration under severe
stress. A lower TR at high VPD leads to higher transpiration efficiency.
Keywords: Canopy temperature depression, Drought stress, Fraction of transpirable soil water,
Canopy conductance, Transpiration efficiency, Vigna unguiculata.
Introduction
Cowpea [Vigna unguiculata (L.) Walp.], a protein-rich grain legume is widely cultivated by
resource-poor farmers in the semi-arid tropics of Africa, Asia, and Latin America where it is
immensely important for its central role in the diet and economy of millions people (Singh et
al. 2003; Dadson et al. 2005; Muchero et al. 2009). Despite its capacity to withstand water
deficits, significant differences exist among cowpea genotypes for their response to terminal
drought, i.e. water deficit stress occurring at the end of the growing season (Mai-Kodomi et
al. 1999a; Muchero et al. 2008). In Africa, cowpea is commonly grown in the Sudanian and
Sahelian semi-arid regions, where climate change is likely to make drought stresses even
more severe in the future (Hall et al. 2003; Wittig et al. 2007; Vadez et al. 2011). Therefore,
the identification of drought tolerant cowpea cultivars adapted to these agro-ecological zones
is needed (Van Duivenbooden et al. 2002; Kholová et al. 2010a).
Extensive research has been carried out on the screening for mid- and late-season
drought tolerance in cowpea, focusing on carbon isotope discrimination, chlorophyll stability
index, leaf gas exchange, relative turgidity, relative water content, water use efficiency, and
water potential (Hall et al. 1990; Cruz de Carvalho et al. 1998; Ashok et al. 1999; Singh and
Matsui 2002; Ogbonnaya et al. 2003; Anyia and Herzog 2004; Hall 2004; Onwugbuta-Enyi
2004; Padi 2004; Slabbert et al. 2004; Souza et al. 2004; Hamidou and Braconnier 2007).

5
Nevertheless, only very few studies have used these indices to select parental genotypes in
further genetic studies (Mai-Kodomi et al. 1999b; Muchero et al. 2009). We argue that,
despite the complexity of the drought response, simple hypotheses based on water needs can
be developed to guide the selection of critical traits (Vadez et al. 2007). Here, we test one of
these hypothesis, i.e. that water saving traits are important for terminal drought adaptation, by
comparing a range of contrasting lines.
Because water availability is critical for the reproduction and grain filling period, plant
traits involved in a conservative use of soil water even if water is not limiting are indeed
likely to be relevant for yield improvement under limiting water (Vadez et al. 2011). This has
been shown in chickpea (Zaman-Allah et al. 2011a, b) and pearl millet (Kholova et al. 2010a,
b). Recent findings showed that leaf area was lower in tolerant chickpea (Zaman-Allah et al.
2011a), peanut (Ratnakumar and Vadez 2011), and this logically limits plant water use.
Significant variations in canopy conductance were also found among contrasting genotypes
under non-limited water conditions in cowpea (Hall and Shulze 1980), chickpea (Zaman-
Allah et al. 2011a), soybean (Purcell and Specht 2004; Fletcher et al. 2007; Sadok and
Sinclair 2009), peanut (Bhatnagar-Mathur et al. 2007), sorghum (Gholipoor et al. 2010), and
pearl millet (Kholova et al. 2010b).
There is also water saving option by having different soil moisture threshold where
transpiration begins to decline upon progressive exposure to water deficit. For instance, the
transpiration decline occurred in wetter soil (higher soil moisture threshold for transpiration
decline) in tolerant than in sensitive chickpea genotypes (Zaman-Allah et al. 2011a).
Genotypic differences for this trait were also found for transpiration response to progressive
water deficit stress in several other crops (Vadez and Sinclair 2001; Bhatnagar-Mathur et al.
2007; Hufstetler et al. 2007; Devi et al. 2010;). This characteristic offers the opportunity to
reduce water use and such information is not available in cowpea. Nevertheless, tolerant pearl
millet had a lower FTSW threshold for the transpiration decline (Kholova et al. 2010a). This
was interpreted to be a consequence of the lower canopy conductance and then lower plant
transpiration of tolerant genotypes under well-watered conditions, which helped maintain the
relative transpiration of water stressed plants to a level similar to well-watered plants until the
soil was dryer. Whether these thresholds relate to the canopy conductance under well-watered
conditions is an important question to resolve. Whether these canopy conductance differences
would also relate to genotypic differences in transpiration efficiency [TE], which is a major
source of crops yield variation under drought stress (Condon et al. 2004; Sheshshayee et al.
6
2006; Krishnamurthy et al. 2007), is another one. None of these questions has been tested in
cowpea and they are addressed in here.
According to Gwathmey et al. (1992) and Gwathmey and Hall (1992), another
important morphological trait that may contribute to drought adaptation of cowpea is a
delayed leaf senescence [DLS] under water stress, which would enhance plant survival after a
mid-season drought and limit damages to the first flush of pods. Cultivars with DLS also have
enhanced production of forage because their leaves remain green and attached to the plant
until harvest. Moreover, DLS can be easily measured by visual scoring using an appropriate
scale as used by Muchero et al. 2008 to discriminate fifteen cowpea genotypes that exhibit
significant genetic variation for drought tolerance.
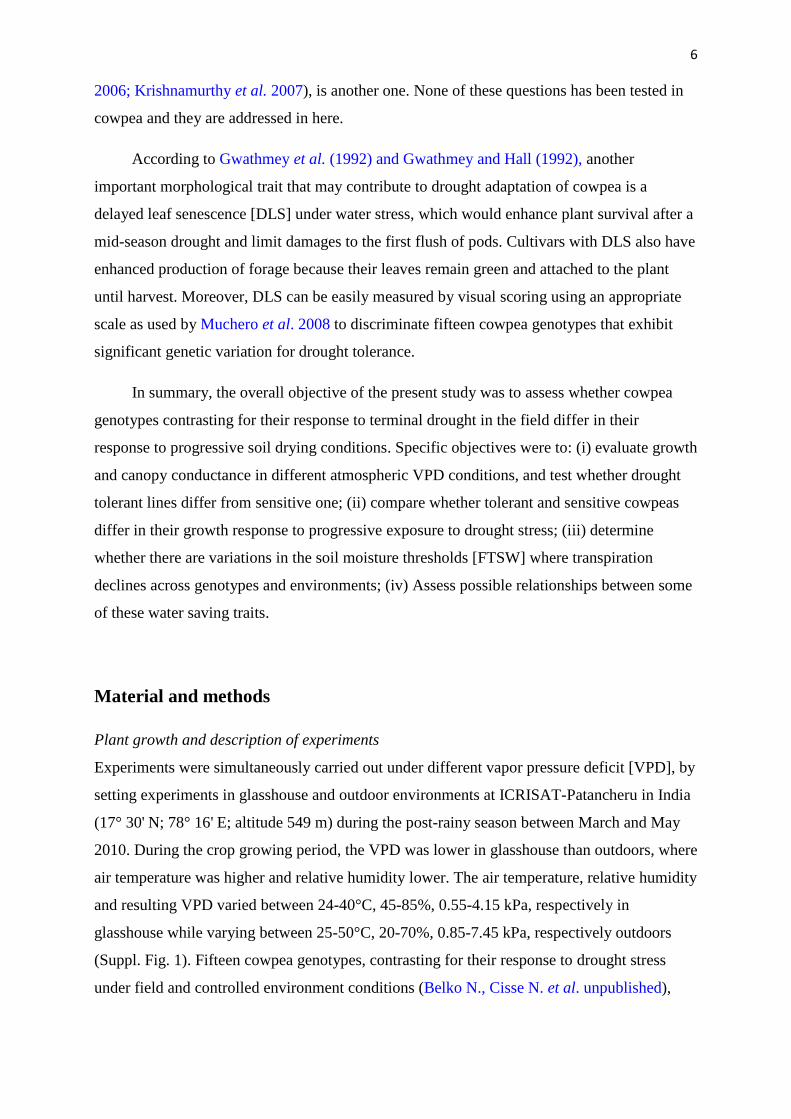
In summary, the overall objective of the present study was to assess whether cowpea
genotypes contrasting for their response to terminal drought in the field differ in their
response to progressive soil drying conditions. Specific objectives were to: (i) evaluate growth
and canopy conductance in different atmospheric VPD conditions, and test whether drought
tolerant lines differ from sensitive one; (ii) compare whether tolerant and sensitive cowpeas
differ in their growth response to progressive exposure to drought stress; (iii) determine
whether there are variations in the soil moisture thresholds [FTSW] where transpiration
declines across genotypes and environments; (iv) Assess possible relationships between some
of these water saving traits.
Material and methods
Plant growth and description of experiments
Experiments were simultaneously carried out under different vapor pressure deficit [VPD], by
setting experiments in glasshouse and outdoor environments at ICRISAT-Patancheru in India
(17° 30' N; 78° 16' E; altitude 549 m) during the post-rainy season between March and May
2010. During the crop growing period, the VPD was lower in glasshouse than outdoors, where
air temperature was higher and relative humidity lower. The air temperature, relative humidity
and resulting VPD varied between 24-40°C, 45-85%, 0.55-4.15 kPa, respectively in
glasshouse while varying between 25-50°C, 20-70%, 0.85-7.45 kPa, respectively outdoors
(Suppl. Fig. 1). Fifteen cowpea genotypes, contrasting for their response to drought stress
under field and controlled environment conditions (Belko N., Cisse N. et al. unpublished),

7
were selected for this investigation (Table 1). The work leading to this classification was
conducted in well managed experimental station field in Senegal, Nigeria, Burkina Faso and
California, and in controlled environments glasshouse and growth chamber in India, in
seasons when the VPD was high.Seeds were received from the Department of Botany and
Plant Sciences of the University of California Riverside, USA.
Plants were grown in plastic pots [20 cm diameter x 20 cm tall] filled with 5.5 kg of
sandy clay loam Alfisol collected from the ICRISAT farm and fertilized with di-ammonium
phosphate at the rate of 0.3 g kg-1
soil and with farm-yard manure (1:50 v/v). The day before
planting, the top soil of each pot was added with 2 g carbofuran to prevent seeds damage from
soil-borne pests. Each pot was sown with 3 seeds and thinned to one seedling a week later.
For each environment [glasshouse and outdoor], twenty one plants of each genotype were
grown under well watered conditions until 30 days after sowing [the time when water
treatments imposition started]. Then, fifteen most uniform plants of each genotype were
selected to design the experiments in both environments. A thermo-hygrograph sensor
(Tinytag Ultra 2 TGU-4500 Gemini Dataloggers Ltd., Chichester, UK) was positioned within
the plants canopy in both glasshouse and outdoor environments for regular records of the air
temperature and relative humidity throughout the crop growth and measurements period.
The day before water treatments imposition, pots were watered, allowed to drain to
reach field capacity, and then late in the evening, pots were bagged with transparent plastic
bag wrapped around the plant stem to prevent soil evaporation during the evaluation of plants
transpiration. The fifteen plants were divided in three sets of five plants: the first set was kept
under well-watered conditions [WW] and used for assessing the plants transpiration rate [TR,
in g water loss cm-2
h-1
, i.e. used as a simple proxy for canopy conductance] response to
natural change of atmospheric VPD during the course of an entire clear day then harvested to
measure the initial plant biomass [pre dry-down]. The second set was maintained under well-
watered [WW] conditions and the third set was gradually exposed to water stress [WS] (see
below). The experimental layout was a randomized complete block design with treatment-set
as the main factor and genotypes as sub-factor randomized five times within each block.
Transpiration rate in response to VPD
The rate of water-loss per unit of leaf area [TR] was assessed on WW plants from the first set
(see above) under natural variations of VPD during the course of an entire sunny day in both

8
glasshouse and outdoor conditions. The plant transpiration was measured gravimetrically
from the losses in pots weight between consecutive weighings. Pots were weighted with 0.01
g precision scale (PE 12, Mettler Toledo, Schweiz-GmbH, Germany) hourly between 7:00 am
and 5:00 pm (India Standard Time). At the end of the day, plants were harvested and the leaf
area measured (LI-3100, Licor, Lincoln, Nebraska, USA). Transpiration and leaf area data
were used to estimate the transpiration rate, i.e. leaf water loss per unit of leaf area [TR, g
H2O cm-2
h-1
]. The plants parts were dried in an oven at 60°C for 3 days then, their dry masses
were recorded. The specific leaf area [SLA, cm2 g
-1] was calculated as the ratio between the
leaf area [LA] and the leaf dry weight.
Plant exposure to progressive water deficit stress (dry-down)
After bagging, pots were weighed around 9:00 am at 31 days after sowing [DAS] to have the
initial pot weight and thereafter pots were weighed every day in the morning to calculate the
daily plants transpiration. Well watered plants were maintained as such by daily re-watering
up to 80% field capacity, i.e. by bringing the pot weight to 200 g below the field capacity
weight every day. Water stress plants were exposed to stress by partially compensating plant
water loss from transpiration, i.e. plants were allowed to lose no more than 70 g each day.
Therefore, any transpiration in excess of 70 g was added back to the pots, as previously
described by Vadez and Sinclair (2001), to allow a progressive development of water-deficit
stress over approximately two weeks.
The transpiration values were normalized to facilitate comparison as previously
described by Kholova et al. (2010a). First, the daily transpiration ratio (TR) for each plant
was calculated as the ratio of the transpiration rate of each individual WS plant divided by the
average of transpiration rate for the five WW plants of that genotype. Secondly, the TR data
were normalized by dividing each TR value over time by the average of the TR value for the
first 3 days of the experiment when there was still no water limitation. This second
normalization aimed to remove variation resulting from differences in plant size among WS
plants within a genotype. This gave the normalized transpiration ratio (NTR) which accounted
for plant to plant variation in transpiration within each genotype. When the NTR of stressed
plants fell below 0.10, i.e. when the transpiration of WS plants was < 10% of that of WW
plants, all the plants were harvested and their different parts were dried in an oven at 60°C for

9
3 days and then their dry mass were measured. The genotypes reached all that stage within
two days from one another.
After the final harvest, the daily fraction of transpirable soil water [FTSW], i.e. the
amount of soil water available for transpiration, was back-calculated on each day of the
experiment. First, the total transpirable soil water [TTSW] available to support plant
transpiration in each pot was calculated as the difference between the initial and final pot
weight which was defined as the weight at the end of the experiment (Sinclair and Ludlow
1986). The FTSW values were calculated as:
FTSW = (Daily Pot weight - Final Pot weight) / TTSW (1)
Since the plants were allowed to transpire no more than 70 g water per day, all the
genotypes were exposed to similar stress intensities, at least from the viewpoint of the soil
water content. Changes in NTR during the soil drying cycle were expressed as a function of
FTSW which was used as the indicator of the stress intensity (Ritchie 1981).
Canopy temperature depression [CTD], transpiration efficiency [TE], and leaf scoring
The day before the end of the dry-down leaf temperatures were recorded on five replicates
plants for both WW and WS treatments in both environments between 8:00 and 9:00 am with
an IR-thermometer (Fluke 574, Fluke Thermography, Annapolis Lane Plymouth, MN, USA).
Air temperature was recorded from a temperature and relative humidity recorder (Gemini
Tiny Tag Ultra 2 TGU-4500 Data logger), which was located at the crop canopy level. In each
plant, temperatures were recorded on three leaves at the top of the canopy and averaged. The
canopy temperature depression [CTD] was calculated as the difference between the air
temperature and the leaf temperature (CTD = Tair – Tleaf).
Transpiration efficiency [TE, g biomass kg-1
water transpired] was calculated for each
control and stressed plants in both environments as the ratio between the increase in plant
biomass over the course of the dry-down and the total water transpired during the same time:
TE = (Final Harvest biomass – Pre Dry-down biomass) / Total Water transpired (2),
where the pre dry-down biomass was the biomass of plants used to assess the TR response to
VPD and harvested at the beginning of the dry-down. The final harvested biomass was that of

10
WW and WS plants harvested at the end of the dry-down. The total water transpired was the
sum of daily transpiration measured by daily weighing of pots during the dry-down.
Leaf senescence due to water-deficit stress was scored at the end of the dry-down in
both glasshouse and outdoors. The state of leaf senescence was rated on a scale from 1 to 5,
with 1 = totally green and turgescent, 2 = green and slightly wilted, 3 = green-yellow and wilt,
4 = yellow-green and severely wilt and 5 = completely yellow to brown / almost died.
Statistical analysis
Analyses of variance (Anova) were done using the statistical package program SAS (SAS
Institute, Inc., 1988, Cary, NC, USA). One-way Anova was run to test the genotypic
differences within each water treatment for plant growth parameters, transpiration rates,
canopy temperature depression, transpiration efficiency and visual scores. The Tukey–Kramer
test was used for the analysis of differences between genotype means. The relationships
between TE and TR, TE and the FTSW thresholds, TR and the FTSW threshold, and CTD
and TR were also tested.
For the FTSW thresholds analysis for each genotype, each NTR value was plotted
against its corresponding FTSW value for each day of the experiment. A plateau regression
procedure of the SAS program was used to estimate a specific FTSW threshold value where
NTR initiated its decline (Ray and Sinclair 1997). This analysis provided a standard error and
95% confidence interval for each threshold value for each genotype. A non-linear regression
analysis was done using GraphPad Prism (GraphPad 2.01, San Diego, CA, 1996) to fit the
exponential model presented by Muchow and Sinclair (1991) (NTR = 1 / [1+A * exp (B *
FTSW)]. The regression result obtained using this equation was compared among genotypes
based on 95% confidence intervals of coefficients A and B. The plateau regression attempted
to fit two linear segments where one segment is a plateau at Y = 1 and the second regression
is a linear change in Y with respect to X. A key output from this analysis is the FTSW
threshold for the two segments and the confidence intervals for this threshold. The averages of
threshold values were compared across the genotypes using Tukey-Kramer method of Genstat
(Genstat 12.1 VSN International Ltd., Hemel Hempstead, UK).

11
For the TR versus CTD relationship, the data were analyzed with the split line
regression option of Genstat (9.0), which provides a breakpoint value where the slope of the
fitted regression significantly changes.
Results
Genotypic variation for plant growth under WW conditions at 30 DAS
Under glasshouse conditions, most tolerant lines had lower vigor than sensitive lines (Table
2). Higher root dry weight was found in five out of seven sensitive lines than in seven out of
eight tolerant lines. All sensitive genotypes, except IT89KD-288, produced higher plant
biomass than five tolerant lines. This was related more to difference in leaf dry weight (all but
one sensitive genotypes had higher leaf dry weight than five out of eight tolerant) than in stem
dry weight. The specific leaf area (SLA, cm2 g
-1) varied between genotypes but did not
discriminate tolerant from sensitive lines. Leaf area (cm2 plant
-1) was the smallest in all
drought tolerant lines, except IT97K-499-39 and KVx-61-1, than in all drought sensitive,
except IT89KD-288 (Table 2).
Under outdoor conditions, growth parameters varied significantly among genotypes but
did not clearly discriminate tolerant from sensitive lines, although the leaf area of five out of
seven sensitive genotypes was higher than five out of eight tolerant ones (Table 2). In addition
to the significant genotypic variations for all the growth parameters, there were highly
significant differences between the glasshouse and outdoors environments for these growth
attributes. Also, a significant effect of the interaction between genotype and environment [G x
E] on the variation of the growth parameters was found, explaining a variance close to that for
genotypic effect (Table 2).
In summary, tolerant genotypes had low early vigor for the majority of them but their
differences with the sensitive lines for growth parameters were not clearly expressed under
high VPD conditions outdoors as compared with the glasshouse environment.
Response of leaf transpiration rate to changing atmospheric VPD
Under glasshouse conditions at 30 DAS, canopy conductance [TR, g H2O cm-2
h-1
] closely
followed the diurnal pattern of atmospheric VPD, which ranged from 1.10 to 4.08 kPa during
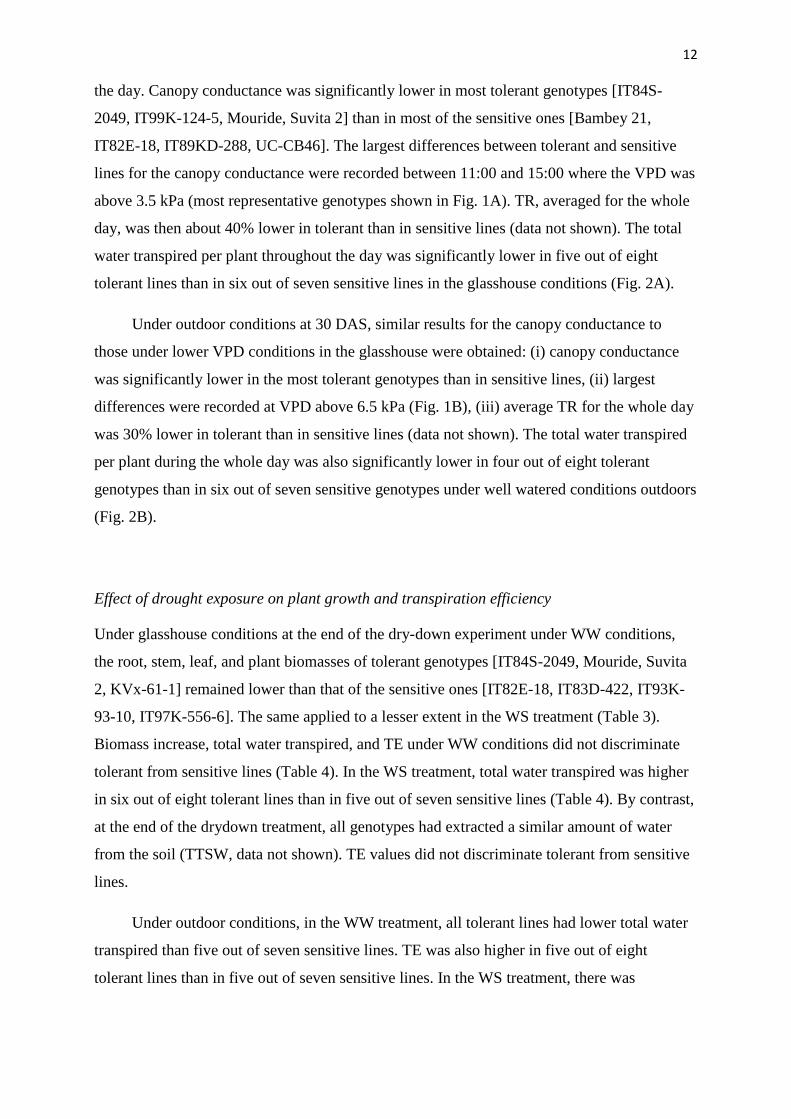
12
the day. Canopy conductance was significantly lower in most tolerant genotypes [IT84S-
2049, IT99K-124-5, Mouride, Suvita 2] than in most of the sensitive ones [Bambey 21,
IT82E-18, IT89KD-288, UC-CB46]. The largest differences between tolerant and sensitive
lines for the canopy conductance were recorded between 11:00 and 15:00 where the VPD was
above 3.5 kPa (most representative genotypes shown in Fig. 1A). TR, averaged for the whole
day, was then about 40% lower in tolerant than in sensitive lines (data not shown). The total
water transpired per plant throughout the day was significantly lower in five out of eight
tolerant lines than in six out of seven sensitive lines in the glasshouse conditions (Fig. 2A).
Under outdoor conditions at 30 DAS, similar results for the canopy conductance to
those under lower VPD conditions in the glasshouse were obtained: (i) canopy conductance
was significantly lower in the most tolerant genotypes than in sensitive lines, (ii) largest
differences were recorded at VPD above 6.5 kPa (Fig. 1B), (iii) average TR for the whole day
was 30% lower in tolerant than in sensitive lines (data not shown). The total water transpired
per plant during the whole day was also significantly lower in four out of eight tolerant
genotypes than in six out of seven sensitive genotypes under well watered conditions outdoors
(Fig. 2B).
Effect of drought exposure on plant growth and transpiration efficiency
Under glasshouse conditions at the end of the dry-down experiment under WW conditions,
the root, stem, leaf, and plant biomasses of tolerant genotypes [IT84S-2049, Mouride, Suvita
2, KVx-61-1] remained lower than that of the sensitive ones [IT82E-18, IT83D-422, IT93K-
93-10, IT97K-556-6]. The same applied to a lesser extent in the WS treatment (Table 3).
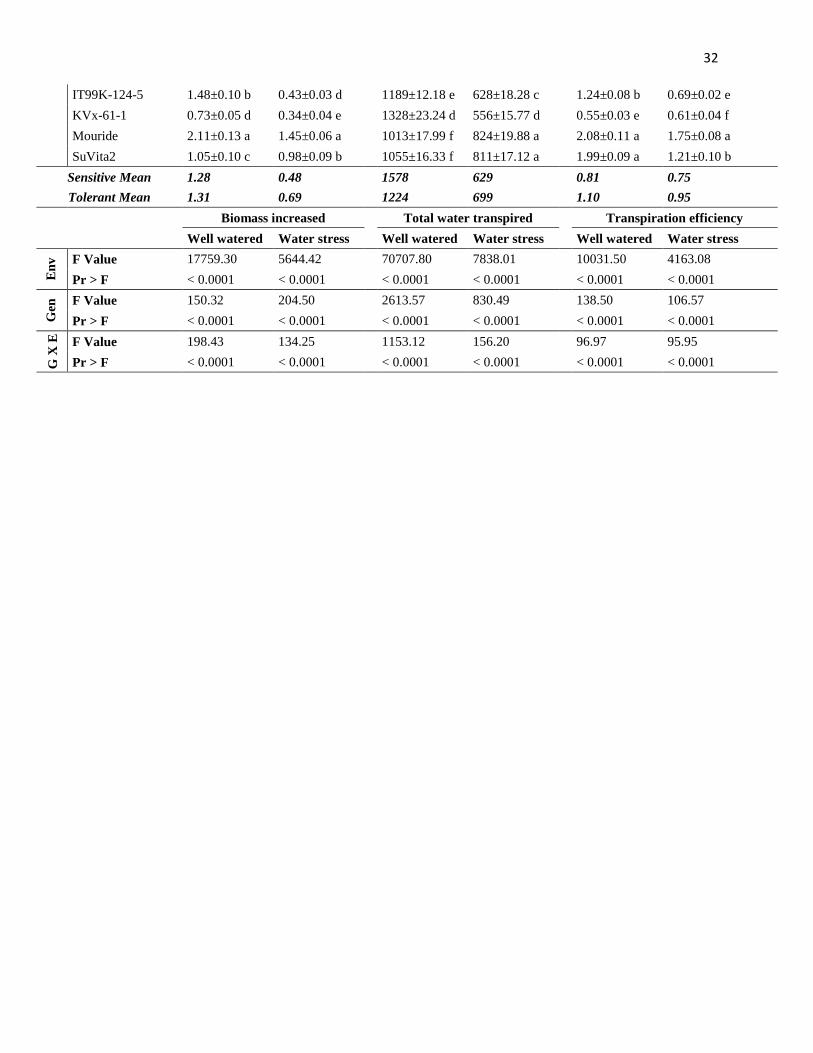
Biomass increase, total water transpired, and TE under WW conditions did not discriminate
tolerant from sensitive lines (Table 4). In the WS treatment, total water transpired was higher
in six out of eight tolerant lines than in five out of seven sensitive lines (Table 4). By contrast,
at the end of the drydown treatment, all genotypes had extracted a similar amount of water
from the soil (TTSW, data not shown). TE values did not discriminate tolerant from sensitive
lines.
Under outdoor conditions, in the WW treatment, all tolerant lines had lower total water
transpired than five out of seven sensitive lines. TE was also higher in five out of eight
tolerant lines than in five out of seven sensitive lines. In the WS treatment, there was

13
genotypic variation for the biomass increase, total water uptake, and TE, but no
discrimination between tolerant and sensitive lines (Table 4).
Overall, at the end of the dry down, the most tolerant lines showed lower biomass than
sensitive ones, especially under WW and to some extent under WS stress conditions in the
low VPD conditions of the glasshouse. Cowpea accumulated more biomass under low VPD
than under high VPD conditions and, as expected, TE was lower under high VPD as
compared with the low VPD conditions, for both water treatments. However, several drought
tolerant lines [Mouride, Suvita 2 and IT84S-2049] maintained TE at higher level as compared
with all the sensitive lines under high VPD conditions outdoors and especially in the WS
treatment.
Response of leaf gas exchange to progressive soil drying
In the glasshouse, the FTSW thresholds for transpiration decline were lower in six out of eight
tolerant than in five out of seven sensitive lines. The FTSW thresholds varied between 0.44
and 0.70 (Table 5) with the lowest thresholds recorded in the tolerant genotypes [Mouride,
IT84S-2049, Suvita 2] and the highest threshold showed by the sensitive lines [Bambey 21,
IT83D-442, IT93K-93-10]. A typical transpiration response discriminating tolerant from
sensitive lines is presented in Fig. 3A&B. In outdoor conditions, similar results were
obtained, with six out of eight tolerant lines having lower FTSW thresholds than six out of
seven sensitive ones (Table5; Fig. 3C&D).
Genotypic differences in canopy temperature depression in response to drought
Under glasshouse conditions in the WW treatment, the canopy temperature depression [CTD]
did not discriminate tolerant from sensitive lines at the end of the dry-down [45 DAS] (Fig.
4A). In contrast under WS conditions, CTD varied among genotypes and was lower in
sensitive lines (average of -0.03 °C) than in tolerant lines (average of 1.39 °C) (Fig. 4B). Only
one sensitive and one tolerant line differed from this. Under outdoor conditions, similar
results were obtained. In the WW treatment, there was no clear CTD discrimination between
tolerant and sensitive genotypes (Fig. 4C). Under WS conditions, the CTD was lower in
sensitive lines (average of -0.74 °C) than in tolerant lines (average of 1.82 °C) (Fig. 4D).

14
Scoring for stay green under water-deficit
Leaf senescence caused by drought stress varied across genotypes under both glasshouse and
outdoor conditions (Table 6), and several cowpea genotypes preserved stem and leaf
greenness more than others (Suppl. Fig. 2). Tolerant Mouride, Suvita 2, IT84S-2049, and
IT97K-499-39 kept greener (lower scores) than sensitive Bambey 21, IT82E-18, IT97K-556-
6, and UC-CB46 (higher scores). There was a close agreement between the two environments
for leaf damage visual rating.
Discussion
Several traits related to plant growth and patterns of soil water use under both well watered
and water stressed conditions discriminated terminal drought-tolerant from sensitive
genotypes and that in both glasshouse and outdoors environments.
Plant growth under non-limited water and drought stress conditions
At 30 DAS under WW conditions, most tolerant genotypes had lower growth than sensitive
lines under low VPD conditions in the glasshouse. These growth differences were not clearly
expressed under high VPD conditions outdoors, where growth was depressed, likely because
of a depressive VPD effect on leaf expansion (Tardieu et al. 2000). These early growth
differences were explained by two different mechanisms: (i) a lower leaf area of tolerant line;
(ii) a lower canopy conductance (TR, g cm-2
h-1
). These present results are consistent with
previous study in chickpea (Zaman-Allah et al. 2011a) and pearl millet (Kholova et al.
2010a). We interpret that under situations of terminal drought, high early vigor and
development of large leaf areas could lead to rapid water depletion, and leave plants facing
water scarcity while completing their cycle. Therefore, lower early growth by decreased LA
and lower canopy conductance under WW conditions, as found in some tolerant lines, could
be important adaptive response against late season drought stress, as previous hypothesized
(Hammer 2006). Our findings in cowpea, added to the earlier one on chickpea, pearl millet, or
sorghum facing similar stress, clearly indicate that limiting plant growth is a common
mechanism across crops facing terminal drought stress. Of course, limiting plant growth
would limit potential yield in those years or locations where the stress is mild.
15
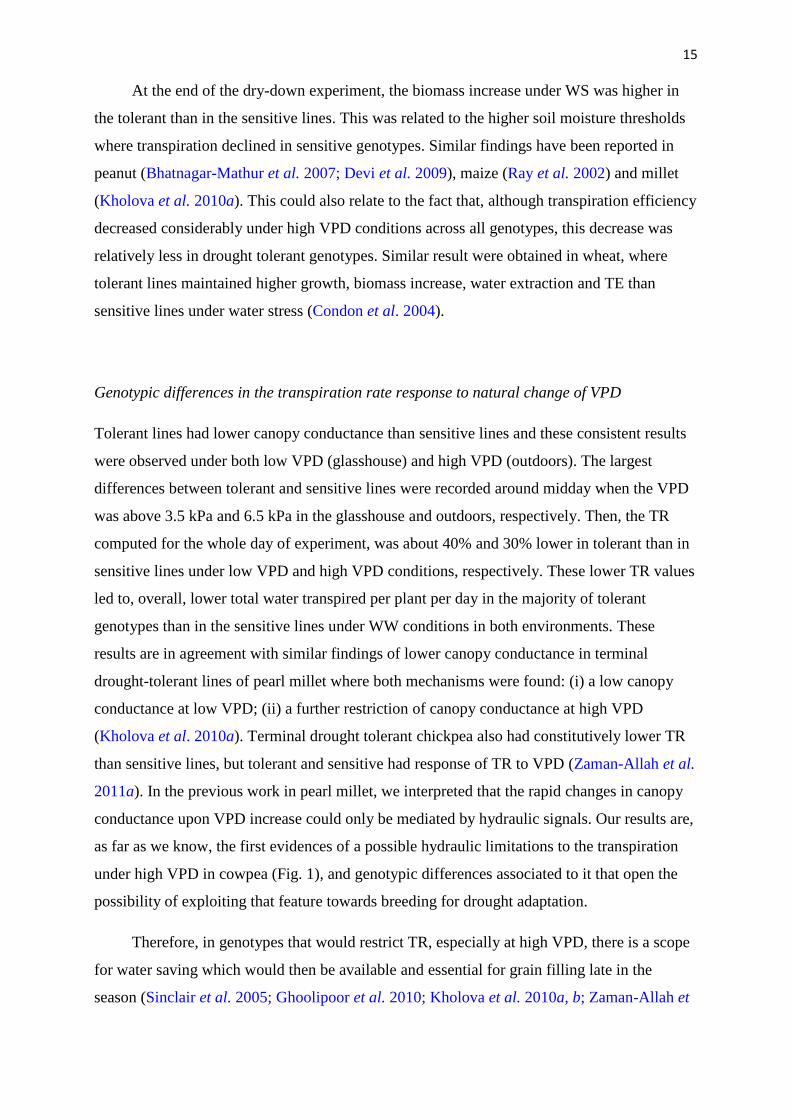
At the end of the dry-down experiment, the biomass increase under WS was higher in
the tolerant than in the sensitive lines. This was related to the higher soil moisture thresholds
where transpiration declined in sensitive genotypes. Similar findings have been reported in
peanut (Bhatnagar-Mathur et al. 2007; Devi et al. 2009), maize (Ray et al. 2002) and millet
(Kholova et al. 2010a). This could also relate to the fact that, although transpiration efficiency
decreased considerably under high VPD conditions across all genotypes, this decrease was
relatively less in drought tolerant genotypes. Similar result were obtained in wheat, where
tolerant lines maintained higher growth, biomass increase, water extraction and TE than
sensitive lines under water stress (Condon et al. 2004).
Genotypic differences in the transpiration rate response to natural change of VPD
Tolerant lines had lower canopy conductance than sensitive lines and these consistent results
were observed under both low VPD (glasshouse) and high VPD (outdoors). The largest
differences between tolerant and sensitive lines were recorded around midday when the VPD
was above 3.5 kPa and 6.5 kPa in the glasshouse and outdoors, respectively. Then, the TR
computed for the whole day of experiment, was about 40% and 30% lower in tolerant than in
sensitive lines under low VPD and high VPD conditions, respectively. These lower TR values
led to, overall, lower total water transpired per plant per day in the majority of tolerant
genotypes than in the sensitive lines under WW conditions in both environments. These
results are in agreement with similar findings of lower canopy conductance in terminal
drought-tolerant lines of pearl millet where both mechanisms were found: (i) a low canopy
conductance at low VPD; (ii) a further restriction of canopy conductance at high VPD
(Kholova et al. 2010a). Terminal drought tolerant chickpea also had constitutively lower TR
than sensitive lines, but tolerant and sensitive had response of TR to VPD (Zaman-Allah et al.
2011a). In the previous work in pearl millet, we interpreted that the rapid changes in canopy
conductance upon VPD increase could only be mediated by hydraulic signals. Our results are,
as far as we know, the first evidences of a possible hydraulic limitations to the transpiration
under high VPD in cowpea (Fig. 1), and genotypic differences associated to it that open the
possibility of exploiting that feature towards breeding for drought adaptation.
Therefore, in genotypes that would restrict TR, especially at high VPD, there is a scope
for water saving which would then be available and essential for grain filling late in the
season (Sinclair et al. 2005; Ghoolipoor et al. 2010; Kholova et al. 2010a, b; Zaman-Allah et
16
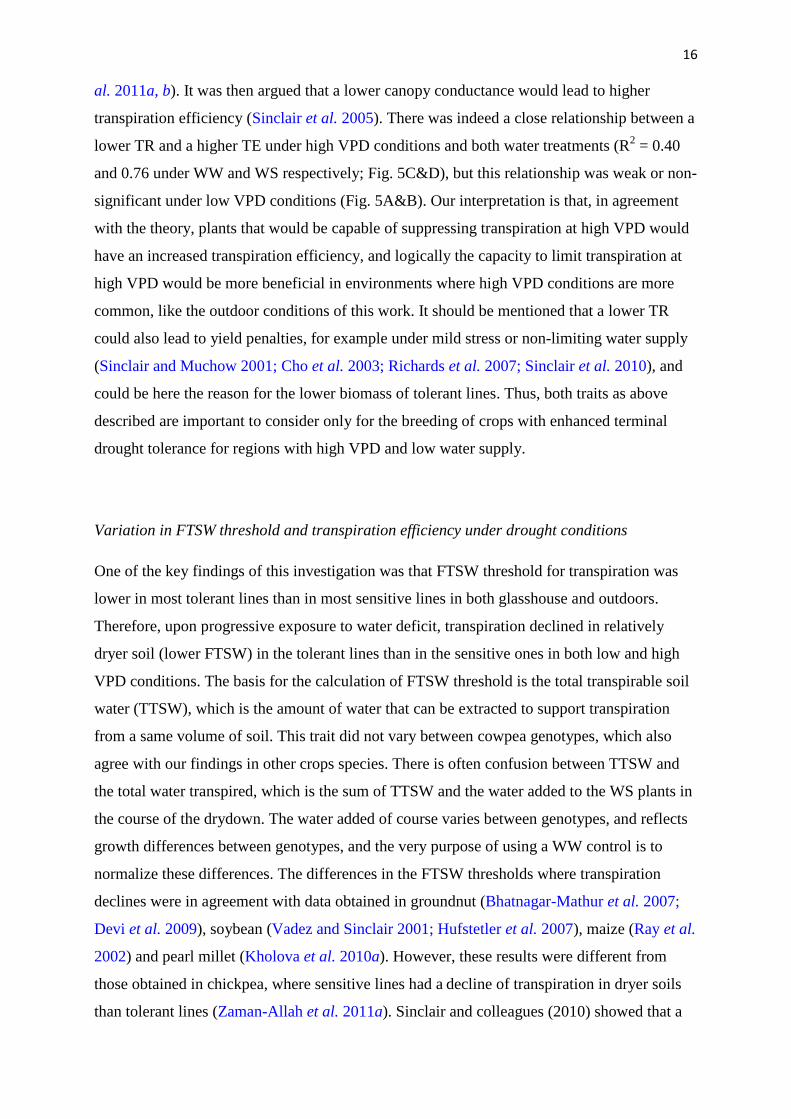
al. 2011a, b). It was then argued that a lower canopy conductance would lead to higher
transpiration efficiency (Sinclair et al. 2005). There was indeed a close relationship between a
lower TR and a higher TE under high VPD conditions and both water treatments (R2 = 0.40
and 0.76 under WW and WS respectively; Fig. 5C&D), but this relationship was weak or non-
significant under low VPD conditions (Fig. 5A&B). Our interpretation is that, in agreement
with the theory, plants that would be capable of suppressing transpiration at high VPD would
have an increased transpiration efficiency, and logically the capacity to limit transpiration at
high VPD would be more beneficial in environments where high VPD conditions are more
common, like the outdoor conditions of this work. It should be mentioned that a lower TR
could also lead to yield penalties, for example under mild stress or non-limiting water supply
(Sinclair and Muchow 2001; Cho et al. 2003; Richards et al. 2007; Sinclair et al. 2010), and
could be here the reason for the lower biomass of tolerant lines. Thus, both traits as above
described are important to consider only for the breeding of crops with enhanced terminal
drought tolerance for regions with high VPD and low water supply.
Variation in FTSW threshold and transpiration efficiency under drought conditions
One of the key findings of this investigation was that FTSW threshold for transpiration was
lower in most tolerant lines than in most sensitive lines in both glasshouse and outdoors.
Therefore, upon progressive exposure to water deficit, transpiration declined in relatively
dryer soil (lower FTSW) in the tolerant lines than in the sensitive ones in both low and high
VPD conditions. The basis for the calculation of FTSW threshold is the total transpirable soil
water (TTSW), which is the amount of water that can be extracted to support transpiration
from a same volume of soil. This trait did not vary between cowpea genotypes, which also
agree with our findings in other crops species. There is often confusion between TTSW and
the total water transpired, which is the sum of TTSW and the water added to the WS plants in
the course of the drydown. The water added of course varies between genotypes, and reflects
growth differences between genotypes, and the very purpose of using a WW control is to
normalize these differences. The differences in the FTSW thresholds where transpiration
declines were in agreement with data obtained in groundnut (Bhatnagar-Mathur et al. 2007;
Devi et al. 2009), soybean (Vadez and Sinclair 2001; Hufstetler et al. 2007), maize (Ray et al.
2002) and pearl millet (Kholova et al. 2010a). However, these results were different from
those obtained in chickpea, where sensitive lines had a decline of transpiration in dryer soils
than tolerant lines (Zaman-Allah et al. 2011a). Sinclair and colleagues (2010) showed that a

17
higher FTSW threshold would contribute to grain yield increase in soybean. Our finding of
large genotypic contrast for the FTSW thresholds in cowpea opens a scope to use that trait in
breeding. Here, the FTSW thresholds for the decline in transpiration with soil drying were
similar across VPD conditions. These results agreed with those reported in maize hybrids
(Ray et al. 2002), although they differ from earlier assumption from Denmead and Shaw
(1962) who make the assumption that FTSW threshold for the decline of transpiration upon
imposition of water deficit should increase if the imposition of water deficit took place in
conditions of higher evaporative demand.
Relationship between TR, CTD, TE, and the FTSW thresholds for transpiration decline
Since the largest TR differences between tolerant and sensitive lines were achieved at the time
of the day when the VPD was the highest, a first question was then whether these large TR
differences could lead to differences in TE, as hypothesized above. TE and TR were indeed
closely related but the relationships were significant only in outdoors conditions, where the
VPD was high (Fig. 5). The interpretation is that the low TR at high VPD was caused by a
partial stomata closure under high VPD, as it has been shown in other crops (Kholova et al.
2010b; Devi et al. 2010). Therefore, the effective VPD for the transpiration in these plants is
shifted to a lower value, leading to a higher TE according to the definition of TE (Tanner and
Sinclair 1983). Also recent report indicates that soybean having transpiration sensitivity to
high VPD reduced stomatal conductance under high VPD, but this was not accompanied by a
proportional decrease in photosynthetic activity. This led to differences in intrinsic water use
efficiency (Gilbert et al. 2011).
A second question was whether the differences in FTSW thresholds for the transpiration
decline were related to the lower TR under WW conditions. There was indeed a tight positive
relationship between the FSTW thresholds for transpiration decline and TR under both low
and high VPD conditions (R2 = 0.66 and 0.71 respectively; Fig. 6A&B). Our interpretation is
that a lower TR, which leads in part to a lower absolute transpiration (Fig. 2), makes drought-
stressed plant function like well watered ones until the soil has become dryer, as it was
previously found and discussed (Kholova et al. 2010a). This then leads to having a lower
FTSW threshold where transpiration drops upon progressive exposure to water deficit stress.
Since TR and the FTSW thresholds and TR and TE are both related, the third question
was then whether these FTSW threshold differences could be related to TE. Under low VPD

18
conditions, the relationship between TE and the threshold for transpiration decline was not
significant (Fig. 6C) By contrast, under high VPD conditions there was a negative trend
between the thresholds and TE (Fig. 6D). This agreed with the fact that no difference were
observed in TE among genotypes under low VPD conditions but under high VPD conditions
there were substantial TE differences among genotypes. These results were different from
those found in peanut (Devi et al. 2009), although the polynomial relationship in the 0.2-0.6
FTSW range in this study was relatively poor (R2=0.39). By contrast, the results presented
here are in agreement with more recent results showing also a strong negative relationship
(R2=0.88) between the FTSW thresholds and TE (Devi et al. 2011).
Our overall interpretation on these three questions is that the lower TR of tolerant lines
during the time of the day when the VPD is the highest, which is related to a partial closure of
stomata, had two consequences: (i) first the lower TR of tolerant plants at high VPD led to
increasing TE level, especially in those conditions with high VPD such as outdoors here. This
is what we find here in the negative relationships between TE and TR in outdoor conditions
(Fig. 5C&D). (ii) A lower TR saved water and allowed these plants, when exposed to stress,
to function like fully irrigated plants for a larger part of the drying cycle. This is our
interpretation of the positive relationships between the FTSW threshold for the transpiration
decline and TR (Fig. 6A & B), where plants with low TR have indeed low FTSW values for
transpiration decline. It is also illustrated by Figure 3, in which NTR of tolerant lines remains
at a value of 1 up until lower FTSW values, i.e. for a longer time during the drying period.
These two consequences are then the causal factors behind the relationship between the
FTSW thresholds for the transpiration decline and TE at high VPD (Fig. 6D). Therefore, these
FTSW thresholds become a very powerful tool to select plants that have the capacity to
restrict transpiration at high VPD, itself leading to increasing TE.
At the end of the experiment under WS conditions, tolerant genotypes showed higher
CTD than sensitive lines, which indicated that at these late stages of stress, tolerant lines
likely maintained transpiration activity and this was well related to the lower leaf senescence
scoring in these lines. CTD was also closely and positively related to TR, in a broken stick
regression that described this relationship under both low and high VPD (Fig. 7). Therefore,
the measurement of canopy temperature could become an easy way to assess TR in cowpea.
Conclusion

19
For enhancing crops terminal drought tolerance water availability during reproduction and
grain filling is crucial (Vadez et al. 2007; Zaman-Allah et al. 2011a). Lower early vigor,
lower TR under WW conditions during the vegetative stage, lower leaf area development,
sustained transpiration until the soil was relatively drier, and lower canopy conductance under
high VPD conditions, appeared to be the main features discriminating tolerant from sensitive
genotypes. Also, significant and close relationships were found between TR and: (i) TE under
both WW and WS treatments outdoors; (ii) CTD under water stress conditions in both
environments; and (iii) FTSW thresholds for transpiration decline. These results support the
importance of TR regulation in explaining the differences in adaptation between tolerant and
sensitive lines, especially under high VPD where lower TR, explained by a partial stomata
closure, contributes to water saving and increase water use efficiency.
Acknowledgements
The authors gratefully thank Mr. Pentaiah and Mr. Anjaiah, the senior technicians of crop
physiology laboratory of ICRISAT-Patancheru for the technical assistance during the trials
and Ms. Rekha for support with the statistical analysis. The first author expresses his gratitude
and acknowledgment to the German Academic Exchange Service (DAAD) for the In-Regions
Scholarship for his PhD program in CERAAS (413 Sub-Sahara Africa / A/07/99489). He was
also supported by a capacity building grant [Ensuring good and relevant phenotypic data to
feed molecular breeders] from the Bill and Melinda Gates Foundation through the Generation
Challenge Program Tropical Legumes 1 Project.
20
References
Anyia AO, Herzog H (2004) Genotypic variability in drought performance and recovery in
cowpea under controlled environment. Journal of Agronomy and Crop Science 190, 151-
159.
Ashok IS, Hussain A, Prasad TG, Kumar MU, Rao RCN, Wright GC (1999) Variation in
transpiration efficiency and carbon isotope discrimination in cowpea. Australian Journal
of Plant Physiology 26, 503-510.
Bhatnagar-Mathur P, Devi MJ, Reddy DS, Lavanya M, Vadez V, Serraj R, Yamaguchi-
Shinozaki K, Sharma KK (2007) Stress-inducible expression of At DREB1A in
transgenic peanut (Arachis hypogaea L.) increases transpiration efficiency under water-
limiting conditions. Plant Cell Reports 26, 2071-2082.
Cho Y, Njiti VN, Chen Y, Lightfoot DA, Wood AJ (2003) Trigonelline concentration in field-
grown soybean in response to irrigation. Plant Biology 46, 405-410.
Condon AG, Richards RA, Rebetzke GJ, Farquhar GD (2004) Breeding for high water use
efficiency. Journal of Experimental Botany 55, 2447-2460.
Cruz de Carvalho MH, Laffray D, Louguet P (1998) Comparison of the physiological responses
of Phaseolus vulgaris and Vigna unguiculata cultivars when submitted to drought
conditions. Environmental and Experimental Botany 40, 197-207.
Dadson RB, Hashem FM, Javaid I, Allen AL, Devine TE (2005) Effect of water stress on yield
of cowpea (Vigna unguiculata (L.) Walp.) genotypes in the Delmarva region of the
United States. Journal of Agronomy and Crop Science 191, 210-217.
Denmead OT, Shaw RH (1962) Availability of soil water to plants as affected by soil moisture
content and meteorological conditions. Agronomy Journal 54, 384-390
Devi JM, Sinclair TR, Vadez V, Krishnamurthy L (2009) Peanut genotypic variation in
transpiration efficiency and decreased transpiration during progressive soil drying. Field
Crops Research 114, 280–285
Devi MJ, Sinclair TR, Vadez V (2010) Genotypic variation in peanut for transpiration response
to vapor pressure deficit. Crop Science 50, 191-196.
Devi JM, Bhatnagar-Mathur P, Sharma KK, Serraj R, Anwar SY, and Vadez V (2011)
Relationships between transpiration efficiency (TE) and its surrogate traits in the
rd29A:DREB1A transgenic groundnut). Journal of Agronomy and Crop Science 197,
272-283. DOI: 10.1111/j.1439-037X.2011.00464.x
21
Fletcher AL, Sinclair TR, Allen Jr LH (2007) Transpiration responses to vapor pressure deficit in
well watered ‘slow-wilting’ and commercial soybean. Environmental and Experimental
Botany 61, 145-151.
Gholipoor M, Prasad PVV, Mutava RN, Sinclair TR (2010) Genetic variability of transpiration
response to vapor pressure deficit among sorghum genotypes. Field Crops Research 119,
85-90.
Gilbert ME, Zwieniecki MA, Holbrook NM (2011) Independent variation in photosynthetic
capacity and stomatal conductance leads to differences in intrinsic water use efficiency in
11 soybean genotypes before and during mild drought. Journal of Experimental Botany
62, 2875-2887.
Gwathmey CO, Hall AE, Madore MA (1992) Adaptive attributes of cowpea genotypes with
delayed monocarpic leaf senescence. Crop Science 32, 765-772.
Gwathmey CO, Hall AE (1992) Adaptation to midseason drought of cowpea genotypes with
contrasting senescence traits. Crop Science 32, 773–778.
Hall AE, Schulze ED (1980) Drought effects on transpiration and leaf water status of cowpea in
controlled environments. Australian Journal of Plant Physiology 7, 141-147.
Hall AE, Mutters RG, Farquhar GD (1990) Genotypic and drought-induced differences in carbon
isotope discrimination and gas exchange of cowpea. Crop Science 32, 1-6.
Hall AE, Cisse N, Thiaw S, Elawad HOA, Ehlers JD, Ismail AM, Fery R, Roberts PA, Kitch
LW, Murdock LL, Boukar O, Phillips RD, McWatters KH (2003) Development of
cowpea cultivars and germplasm by the Bean/Cowpea CRSP. Field Crops Research 82,
103–134.
Hall AE (2004) Breeding for adaptation to drought and heat in cowpea. European Journal of
Agronomy 21, 447–454.
Hamidou F, Zombre G, Braconnier S (2007) Physiological and biochemical responses of cowpea
genotypes to water stress under glasshouse and field conditions. Journal of Agronomy
and Crop Science 193, 229-237.
Hammer GL (2006) Pathways to prosperity: breaking the yield barrier in sorghum. Agricultural
Science 19, 16-22.
Hufstetler EV, Boerma HR, Carter TE, Earl HJ (2007) Genotypic variation for three
physiological traits affecting drought tolerance in soybean. Crop Science 47, 25-35.
22
Kholová J, Hash CT, Kakkera A, Kocŏvá M, Vadez V (2010a) Constitutive water conserving
mechanisms are correlated with the terminal drought tolerance of pearl millet
[Pennisetum americanum (L.) R. Br.]. Journal of Experimental Botany 61, 369-377.
Kholová J, Hash CT, Kumar LP, Yadav RS, Kocŏvá M, Vadez V (2010b) Terminal drought
tolerant pearl millet [Pennisetum glaucum (L.) R. Br.] have high leaf ABA and limit
transpiration at high vapor pressure deficit. Journal of Experimental Botany 61, 1431-
1440.
Krishnamurthy L, Vadez V, Devi MJ, Serraj R, Nigam SN, Sheshshayee MS, Chandra S, Aruna
R (2007) Variation in transpiration efficiency and its related traits in a groundnut
(Arachis hypogaea L.) mapping population. Field Crops Research 103, 189-197.
Mai-Kodomi Y, Singh BB, Myers OJr, Yopp JH, Gibson PJ, Terao T (1999a) Two mechanisms
of drought tolerance in cowpea. Indian Journal of Genetics 59, 309-316.
Mai-Kodomi Y, Singh BB, Myers OJr, Yopp JH, Gibson PJ, Terao T (1999b) Inheritance of
drought tolerance in cowpea. Indian Journal of Genetics 59, 317-323.
Muchero W, Ehlers JD, Roberts PA (2008) Seedling stage drought-induced phenotypes and
drought-responsive genes in diverse cowpea genotypes. Crop Science 48, 541-552
Muchero W, Ehlers JD, Close TJ, Roberts PA (2009) Mapping QTL for drought stress-induced
premature senescence and maturity in cowpea [Vigna unguiculata (L.) Walp.]. Theorical
and Applied Genetics 118, 849-863.
Muchow RC, Sinclair TR (1991) Water deficit effects on maize yields modeled under current
and greenhouse climates. Agronomy Journal 83, 1052-1059.
Ogbonnaya CI, Sarr B, Brou C, Diouf O, Diop NN, Roy-Macauley H (2003) Selection of
cowpea genotypes in hydroponics, pots, and field for drought tolerance. Crop Science 43,
1114-1120.
Onwugbuta-Enyi J (2004) Water balance and proximate composition in cowpea [Vigna
unguiculata (L) Walp.] seedlings exposed to drought and flooding stress. Journal of
Applied Science and Environment Management 8, 55-57.
Padi FK (2004) Relationship between stress tolerance and grain yield stability in cowpea.
Journal of Agricultural Science 142, 431-443.
Purcell LC, Specht JE (2004) Physiological traits for ameliorating drought stress. In: Boerma
H.R., Specht, J.E. (Eds.), Soybeans: Improvements, Production and Uses. Agronomy
Monograph No. 16 (3rd ed.) American Society of Agronomy and Crop Science, Society of
America Soil Science, Madison WI, pp. 569-520.

23
Ratnakumar P, Vadez V, Nigam SN, Krishnamurthy L (2009) Assessment of transpiration
efficiency in peanut (Arachis hypogaea L.) under drought using a lysimetric system.
Plant Biology 11, 124-130.
Ratnakumar P and Vadez V (2011) Groundnut (Arachis hypogaea L.) genotypes tolerant to
intermittent drought maintain a high harvest index and have small leaf canopy under
stress Functional Plant Biology (in press) http://dx.doi.org/10.1071/FP11145.
Ray JD, Sinclair TR (1997) Stomatal closure of maize hybrids in response to soil drying. Crop
Science 37, 803-807.
Ray JD, Gesch RW, Sinclair TR, Allen Jr LH (2002) The effect of vapor pressure deficit on
maize transpiration response to a drying soil. Plant and Soil 239, 113-121.
Richards RA, Watt M, Rebetzke GJ (2007) Physiological traits in cereal germplasm for
sustainable agricultural systems. Euphytica 154, 409-425.
Ritchie JT (1981) Water dynamics in the soil-plant-atmosphere system. Plant and Soil 58, 81-96.
Sadok W, Sinclair TR (2009) Genetic variability of transpiration response to vapor pressure
deficit among soybean cultivars. Crop Science 49, 955-960.
Sheshshayee MS, Bindumadhava H, Rachaputi NR, Prasad TG, Udayakumar M, Wright GC,
Nigam SN (2006) Leaf chlorophyll concentration relates to transpiration efficiency in
peanut. Annals of Applied Biology 148, 7-15.
Sinclair TR, Ludlow MM (1986) Influence of soil water supply on the plant water balance of
four tropical grain legumes. Australian Journal of Plant Physiology 13, 329-341.
Sinclair TR, Muchow RC (2001) System analysis of plant traits to increase grain yield on limited
water supplies. Agronomy Journal 93, 263-270.
Sinclair TR, Hammer GL, Van Oosterom EJ (2005) Potential yield and water-use efficiency
benefits in sorghum from limited maximum transpiration rate. Functional Plant Biology
32, 945-952.
Sinclair TR, Messina CD, Beatty A, Samples M (2010) Assessment across the United States of
the benefits of altered soybean drought traits. Agronomy Journal 102, 475-482.
Singh BB, Matsui T (2002) Cowpea varieties for drought tolerance. p. 287–300. In C.A. Fatokun
et al. (ed.) Challenges and opportunities for enhancing sustainable cowpea production.
Procedures of the 3rd World Cowpea Conference, Ibadan, Nigeria 4–8 September 2000
IITA, Ibadan, Nigeria.

24
Singh BB, Ajeigbe HA, Tarawali SA, Fernandez-Rivera S, Abubakar M (2003) Improving the
production and utilization of cowpea as food and fodder. Field Crops Research 84, 169-
177.
Slabbert R, Spreeth M, Kruger GHJ (2004) Drought tolerance, traditional crops and
biotechnology: breeding towards sustainable development. South African Journal of
Botany 70, 116-123.
Souza RP, Machado EC, Silva JAB, Lagoa AMMA, Silveira JAG (2004) Photosynhtetic gas
exchange, chlorophyll fluorescence and some associated metabolic changes in cowpea
(Vigna unguiculata) during water stress and recovery. Environmental and Experimental
Botany 51, 45-56.
Tanner CB, Sinclair TR (1983) Efficient water use in crop production: Research or re-search?
In: Taylor HM, Jordan WR, Sinclair TR (eds) Limitations to Efficient Water Use in Crop
Production, American Society of Agronomy, Madison WI, p 1-27.
Tardieu F, Reymond M, Hamard P, Granier C, Muller B (2000) Spatial distributions of
expansion rate, cell division rate and cell size in maize leaves: a synthesis of the effects of
soil water status, evaporative demand and temperature. Journal of Experimental Botany,
51: 1505-1514.
Vadez V, Sinclair TR (2001) Leaf ureide degradation and the N2 fixation tolerance to water
deficit in soybean. Journal of Experimental Botany 52, 153-159.
Vadez V, Krishnamurthy L, Serraj R, Gaur PM, Upadhyaya HD, Hoisington DA, Varshney RK,
Turner NC, Siddique KHM (2007) Large variation in salinity tolerance in chickpea is
explained by differences in sensitivity at the reproductive stage. Field Crops Research
104, 123-129.
Vadez V, Berger JD, Warkentin T, Asseng S, Ratnakumar P, Rao KPC, Gaur PM, Munier-Jolain
N, Larmure A, Voisin AS, Sharma HC, Pande S, Sharma M, Krishnamurthy L, Zaman-
Allah M (2011) Adaptation of grain legumes to climatic change: A review. Agronomy for
Sustainable Development DOI: 10.1007/s13593-011-0020-6.
Van Duivenbooden N, Abdoussalam S, Mohamed AB (2002) Impact of climate change on
agricultural production in the Sahel-Part 2. Case study for groundnut and cowpea in
Niger. Climate Change 54, 349-368.
Wittig R, König K, Schmidt M, Szarzynski J (2007) A study of climate change and
anthropogenic impacts in West Africa. Environmental Science and Pollution Research
14, 182-189.

25
Zaman-Allah M, Jenkinson DM, Vadez V (2011a) Chickpea genotypes contrasting for seed yield
under terminal drought stress in the field differ for traits related to the control of water
use. Functional Plant Biology 38, 270-281.
Zaman-Allah M, Jenkinson DM, Vadez V (2011b) A Conservative pattern of water use, rather
than deep or profuse rooting, is critical for the terminal drought tolerance of chickpea.
Journal of Experimental Botany 10.1093/jxb/err139.

26 Table 1. List of cowpea genotypes compared for their growth, transpiration rate, soil moisture thresholds [FTSW],
transpiration efficiency, and canopy temperature depression in response to progressive soil drying.
Genotypes Origin Maturity
Dro
ug
ht
sen
siti
ve
Bambey 21 ISRA Early
IT82E-18 IITA Early
IT83D-442 IITA Medium
IT89KD-288 IITA Medium
IT93K-93-10 IITA Early
IT97K-556-6 IITA Medium
UC - CB46 UC Davis Early
Dro
ug
ht
tole
ran
t
IT84S-2049 IITA Early
IT97K-207-15 IITA Medium
IT97K-499-39 IITA Early
IT98K-128-2 IITA Medium
IT99K-124-5 IITA Medium
KVx-61-1 INERA Early
Mouride ISRA Medium
SuVita2 INERA Medium
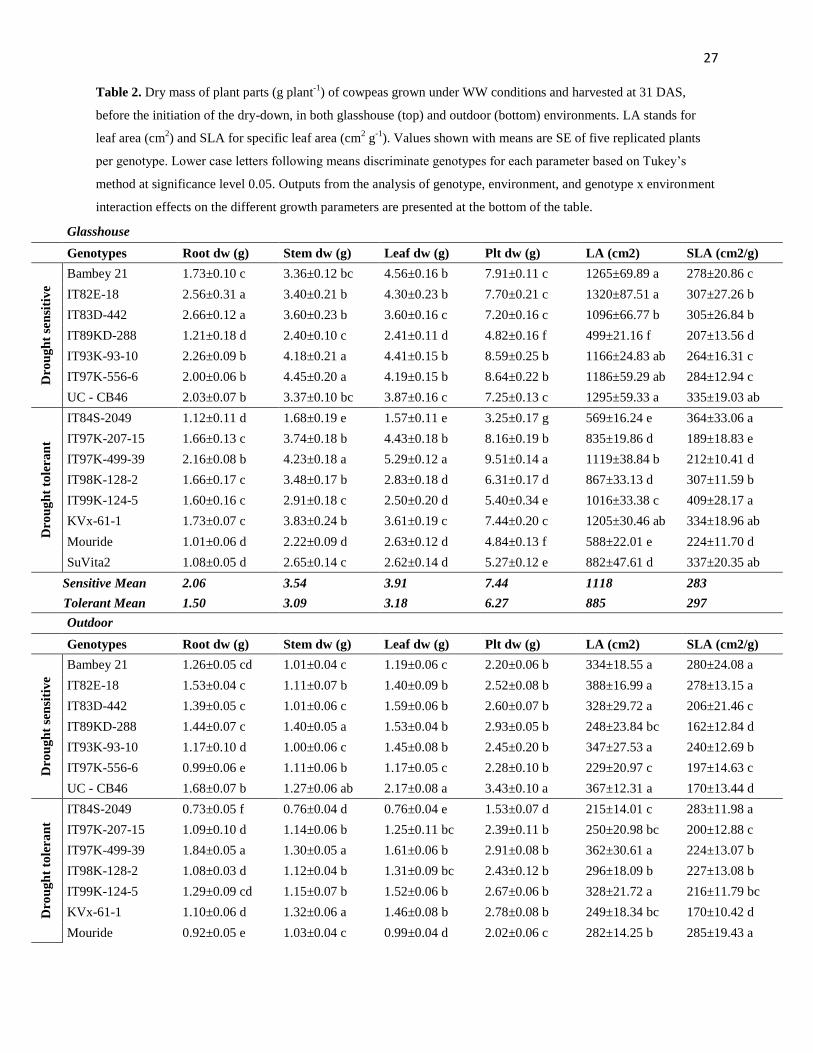
27 Table 2. Dry mass of plant parts (g plant
-1) of cowpeas grown under WW conditions and harvested at 31 DAS,
before the initiation of the dry-down, in both glasshouse (top) and outdoor (bottom) environments. LA stands for
leaf area (cm2) and SLA for specific leaf area (cm
2 g
-1). Values shown with means are SE of five replicated plants
per genotype. Lower case letters following means discriminate genotypes for each parameter based on Tukey’s
method at significance level 0.05. Outputs from the analysis of genotype, environment, and genotype x environment
interaction effects on the different growth parameters are presented at the bottom of the table.
Glasshouse
Genotypes Root dw (g) Stem dw (g) Leaf dw (g) Plt dw (g) LA (cm2) SLA (cm2/g)
Dro
ug
ht
sen
siti
ve
Bambey 21 1.73±0.10 c 3.36±0.12 bc 4.56±0.16 b 7.91±0.11 c 1265±69.89 a 278±20.86 c
IT82E-18 2.56±0.31 a 3.40±0.21 b 4.30±0.23 b 7.70±0.21 c 1320±87.51 a 307±27.26 b
IT83D-442 2.66±0.12 a 3.60±0.23 b 3.60±0.16 c 7.20±0.16 c 1096±66.77 b 305±26.84 b
IT89KD-288 1.21±0.18 d 2.40±0.10 c 2.41±0.11 d 4.82±0.16 f 499±21.16 f 207±13.56 d
IT93K-93-10 2.26±0.09 b 4.18±0.21 a 4.41±0.15 b 8.59±0.25 b 1166±24.83 ab 264±16.31 c
IT97K-556-6 2.00±0.06 b 4.45±0.20 a 4.19±0.15 b 8.64±0.22 b 1186±59.29 ab 284±12.94 c
UC - CB46 2.03±0.07 b 3.37±0.10 bc 3.87±0.16 c 7.25±0.13 c 1295±59.33 a 335±19.03 ab
Dro
ug
ht
tole
ran
t
IT84S-2049 1.12±0.11 d 1.68±0.19 e 1.57±0.11 e 3.25±0.17 g 569±16.24 e 364±33.06 a
IT97K-207-15 1.66±0.13 c 3.74±0.18 b 4.43±0.18 b 8.16±0.19 b 835±19.86 d 189±18.83 e
IT97K-499-39 2.16±0.08 b 4.23±0.18 a 5.29±0.12 a 9.51±0.14 a 1119±38.84 b 212±10.41 d
IT98K-128-2 1.66±0.17 c 3.48±0.17 b 2.83±0.18 d 6.31±0.17 d 867±33.13 d 307±11.59 b
IT99K-124-5 1.60±0.16 c 2.91±0.18 c 2.50±0.20 d 5.40±0.34 e 1016±33.38 c 409±28.17 a
KVx-61-1 1.73±0.07 c 3.83±0.24 b 3.61±0.19 c 7.44±0.20 c 1205±30.46 ab 334±18.96 ab
Mouride 1.01±0.06 d 2.22±0.09 d 2.63±0.12 d 4.84±0.13 f 588±22.01 e 224±11.70 d
SuVita2 1.08±0.05 d 2.65±0.14 c 2.62±0.14 d 5.27±0.12 e 882±47.61 d 337±20.35 ab
Sensitive Mean 2.06 3.54 3.91 7.44 1118 283
Tolerant Mean 1.50 3.09 3.18 6.27 885 297
Outdoor
Genotypes Root dw (g) Stem dw (g) Leaf dw (g) Plt dw (g) LA (cm2) SLA (cm2/g)
Dro
ug
ht
sen
siti
ve
Bambey 21 1.26±0.05 cd 1.01±0.04 c 1.19±0.06 c 2.20±0.06 b 334±18.55 a 280±24.08 a
IT82E-18 1.53±0.04 c 1.11±0.07 b 1.40±0.09 b 2.52±0.08 b 388±16.99 a 278±13.15 a
IT83D-442 1.39±0.05 c 1.01±0.06 c 1.59±0.06 b 2.60±0.07 b 328±29.72 a 206±21.46 c
IT89KD-288 1.44±0.07 c 1.40±0.05 a 1.53±0.04 b 2.93±0.05 b 248±23.84 bc 162±12.84 d
IT93K-93-10 1.17±0.10 d 1.00±0.06 c 1.45±0.08 b 2.45±0.20 b 347±27.53 a 240±12.69 b
IT97K-556-6 0.99±0.06 e 1.11±0.06 b 1.17±0.05 c 2.28±0.10 b 229±20.97 c 197±14.63 c
UC - CB46 1.68±0.07 b 1.27±0.06 ab 2.17±0.08 a 3.43±0.10 a 367±12.31 a 170±13.44 d
Dro
ug
ht
tole
ran
t
IT84S-2049 0.73±0.05 f 0.76±0.04 d 0.76±0.04 e 1.53±0.07 d 215±14.01 c 283±11.98 a
IT97K-207-15 1.09±0.10 d 1.14±0.06 b 1.25±0.11 bc 2.39±0.11 b 250±20.98 bc 200±12.88 c
IT97K-499-39 1.84±0.05 a 1.30±0.05 a 1.61±0.06 b 2.91±0.08 b 362±30.61 a 224±13.07 b
IT98K-128-2 1.08±0.03 d 1.12±0.04 b 1.31±0.09 bc 2.43±0.12 b 296±18.09 b 227±13.08 b
IT99K-124-5 1.29±0.09 cd 1.15±0.07 b 1.52±0.06 b 2.67±0.06 b 328±21.72 a 216±11.79 bc
KVx-61-1 1.10±0.06 d 1.32±0.06 a 1.46±0.08 b 2.78±0.08 b 249±18.34 bc 170±10.42 d
Mouride 0.92±0.05 e 1.03±0.04 c 0.99±0.04 d 2.02±0.06 c 282±14.25 b 285±19.43 a

28
SuVita2 1.27±0.06 cd 1.33±0.09 a 1.52±0.07 b 2.85±0.08 b 348±12.45 a 230±18.64 b
Sensitive Mean 1.35 1.13 1.50 2.63 320 219
Tolerant Mean 1.17 1.14 1.30 2.45 288 229
Root dw Stem dw Leaf dw Plt dw LA SLA
En
v F Value 944.14 11175.20 11513.60 33483.70 14623.80 599.36
Pr > F < 0.0001 < 0.0001 < 0.0001 < 0.0001 < 0.0001 < 0.0001
Gen
F Value 122.90 113.51 242.58 470.39 200.44 55.49
Pr > F < 0.0001 < 0.0001 < 0.0001 < 0.0001 < 0.0001 < 0.0001
G X
E
F Value 47.78 94.55 161.03 334.36 121.45 49.67
Pr > F < 0.0001 < 0.0001 < 0.0001 < 0.0001 < 0.0001 < 0.0001

29 Table 3. Dry mass of plant parts of cowpeas subjected to WS and WW conditions and harvested at the end of the
dry-down experiments in both glasshouse (top) and outdoor (bottom).Values shown with SE are means of five
replicated plants per genotype. Lower case letters following means discriminate genotypes for each parameter based
on Tukey’s method at significance level 0.05. Outputs from the analysis of genotype, water treatment, and genotype
x treatment interaction effects on the growth parameters are presented at the bottom of the table.
Glasshouse Root dw (g)
Stem dw (g)
Leaf dw (g)
Plt dw (g)
Genotypes WW WS
WW WS
WW WS
WW WS
Dro
ug
ht
sen
siti
ve
Bambey 21 3.18±0.11 d 2.30±0.18 b
6.86±0.10 c 4.49±0.14 b
4.64±0.19 e 4.61±0.16 b
11.50±0.13 f 9.10±0.17 c
IT82E-18 4.15±0.16 b 3.11±0.18 a
6.65±0.12 c 4.61±0.20 b
4.74±0.18 e 4.64±0.11 b
11.39±0.15 f 9.25±0.19 c
IT83D-442 5.19±0.18 a 3.50±0.21 a
7.26±0.17 b 4.50±0.15 b
6.44±0.14 b 4.59±0.15 b
13.70±0.22 c 9.10±0.20 c
IT89KD-288 4.64±0.19 b 3.22±0.11 a
7.16±0.17 b 4.35±0.21 b
5.21±0.11 d 4.16±0.16 bc 12.37±0.16 e 8.51±0.23 d
IT93K-93-10 4.18±0.17 b 3.73±0.17 a
8.69±0.12 a 6.43±0.17 a
6.43±0.18 b 4.82±0.10 b
15.11±0.17 b 11.26±0.20 a
IT97K-556-6 3.61±0.13 c 2.65±0.10 b
8.69±0.13 a 5.06±0.12 ab 7.34±0.15 a 5.29±0.15 ab 16.03±0.12 a 10.35±0.10 b
UC - CB46 2.34±0.13 e 2.17±0.10 b 5.77±0.24 d 4.92±0.15 ab 4.83±0.13 e 3.76±0.18 c 10.59±0.30 g 8.68±0.18 d
Dro
ug
ht
tole
ran
t
IT84S-2049 3.19±0.15 d 3.16±0.15 a
3.42±0.15 e 3.39±0.17 c
3.51±0.19 g 3.40±0.17 c
6.93±0.16 i 6.79±0.14 e
IT97K-207-15 2.70±0.17 e 2.50±0.15 b
7.44±0.14 b 4.82±0.18 ab 5.40±0.14 d 4.55±0.13 b
12.83±0.11 d 9.37±0.12 c
IT97K-499-39 4.18±0.18 b 2.76±0.18 b
8.53±0.17 a 4.66±0.18 b
7.33±0.15 a 5.79±0.12 a
15.86±0.22 a 10.44±0.20 b
IT98K-128-2 3.47±0.18 c 2.78±0.16 b
7.16±0.10 b 4.36±0.15 b
5.92±0.18 c 3.85±0.10 c
13.08±0.18 d 8.22±0.12 d
IT99K-124-5 3.57±0.18 c 2.62±0.16 b
5.66±0.11 d 4.49±0.16 b
5.49±0.19 d 3.82±0.13 c
11.15±0.14 f 8.32±0.19 d
KVx-61-1 2.87±0.19 e 2.51±0.18 b
6.61±0.14 c 4.49±0.18 b
4.72±0.11 e 4.12±01.0 bc 11.33±0.18 f 8.62±0.22 d
Mouride 3.71±0.15 c 3.10±0.14 a
5.79±0.12 d 4.39±0.18 b
3.89±0.17 f 3.78±0.11 c
9.57±0.17 h 8.28±0.16 d
SuVita2 2.41±0.21 e 2.39±0.16 b 5.57±0.10 d 4.60±0.19 b 4.76±0.18 e 4.70±0.16 b 10.33±0.24 g 9.30±0.17 c
Sensitive Mean 3.90 2.96
7.30 4.91
5.66 4.55
12.96 9.46
Tolerant Mean 3.26 2.73 6.27 4.40 5.13 4.25 11.39 8.67
Root dw
Stem dw
Leaf dw
Plt dw
F Value Pr > F
F Value Pr > F
F Value Pr > F
F Value Pr > F
GENOT 248.17 < 0.0001
544.22 < 0.0001
556.54 < 0.0001
1165.44 < 0.0001
TRT 1329.36 < 0.0001
10213.80 < 0.0001
2956.41 < 0.0001
14515.10 < 0.0001
GENOT X
TRT 48.17 < 0.0001
147.52 < 0.0001
116.20 < 0.0001
238.48 < 0.0001
Outdoor Root dw (g) Stem dw (g) Leaf dw (g) Plt dw (g)
Genotypes WW WS WW WS WW WS WW WS
Dro
ug
ht
sen
siti
ve
Bambey 21 1.88±0.14 b 1.66±0.16 b
1.87±0.15 b 1.33±0.16 ab 1.96±0.13 c 1.46±0.15 cd 3.83±0.17 b 2.79±0.17 b
IT82E-18 2.12±0.10 ab 1.85±0.17 ab 1.79±0.16 b 1.50±0.18 ab 2.19±0.14 b 1.87±0.12 b
3.98±0.18 b 3.38±0.09 a
IT83D-442 2.63±0.16 a 2.30±0.16 a
1.61±0.18 c 1.29±0.10 b
2.11±0.16 b 1.89±0.16 b
3.72±0.11 c 3.15±0.16 b
IT89KD-288 2.44±0.12 a 1.78±0.14 b
1.72±0.16 c 1.60±0.17 a
1.88±0.15 c 1.79±0.17 b
3.60±0.15 c 3.39±0.13 a
IT93K-93-10 1.99±0.17 b 1.72±0.15 b
1.73±0.19 c 1.14±0.15 bc 2.21±0.15 b 1.59±0.13 c
3.94±0.14 b 2.73±0.17 b
IT97K-556-6 1.80±0.14 b 1.47±0.13 b
1.51±0.16 c 1.26±0.18 b
1.88±0.15 c 1.46±0.14 cd 3.39±0.10 c 2.72±0.10 b
UC - CB46 2.51±0.14 a 1.91±0.17 ab 2.22±0.17 a 1.56±0.15 ab 2.80±0.10 a 2.31±0.14 a 4.88±0.15 a 3.89±0.14 a

30
Dro
ug
ht
tole
ran
t
IT84S-2049 1.54±0.12 b 1.27±0.18 c
1.17±0.13 d 1.07±0.10 c
1.53±0.13 d 1.21±0.14 d
2.71±0.12 d 2.28±0.08 c
IT97K-207-15 1.78±0.13 b 1.49±0.18 b
1.54±0.13 c 1.35±0.12 ab 1.95±0.20 c 1.61±0.14 c
3.49±0.10 c 2.96±0.19 b
IT97K-499-39 2.69±0.15 a 2.14±0.13 a
1.83±0.14 b 1.56±0.12 ab 2.68±0.17 a 1.83±0.17 b
4.52±0.14 ab 3.39±0.16 a
IT98K-128-2 1.47±0.12 b 1.24±0.14 c
1.61±0.10 c 1.32±0.11 b
1.90±0.13 c 1.53±0.13 c
3.51±0.10 c 2.85±0.11 b
IT99K-124-5 1.98±0.11 b 1.76±0.13 b
1.87±0.16 b 1.45±0.15 ab 2.28±0.15 b 1.65±0.13 c
4.15±0.11 b 3.10±0.14 b
KVx-61-1 1.84±0.18 b 1.31±0.18 bc 1.66±0.12 c 1.48±0.15 ab 1.86±0.13 c 1.64±0.16 c
3.51±0.14 c 3.12±0.14 b
Mouride 1.66±0.13 b 1.46±0.12 b
1.95±0.16 b 1.69±0.18 a
2.19±0.16 b 1.78±0.15 b
4.13±0.19 b 3.47±0.15 a
SuVita2 2.03±0.14 ab 1.53±0.18 b 1.90±0.13 b 1.80±0.16 a 2.09±0.18 b 1.93±0.11 b 3.99±0.17 b 3.73±0.15 a
Sensitive Mean 2.20 1.81
1.78 1.38
2.15 1.77
3.91 3.15
Tolerant Mean 1.87 1.52 1.69 1.47 2.06 1.65 3.75 3.11
Root dw Stem dw Leaf dw Plt dw
F Value Pr > F F Value Pr > F F Value Pr > F F Value Pr > F
GENOT 308.35 < 0.0001
51.11 < 0.0001
251.84 < 0.0001
298.91 < 0.0001
TRT 1335.75 < 0.0001
3997.19 < 0.0001
1986.66 < 0.0001
2645.69 < 0.0001
GENOT X
TRT 16.41 < 0.0001 12.23 < 0.0001 33.40 < 0.0001 44.44 < 0.0001

31 Table 4. Biomass increase (g per plant), total water transpired (g per plant), and transpiration efficiency (g biomass
kg-1
water transpired) of cowpea genotypes subjected to well watered (control) and progressive and controlled
drought stress during the dry-down experiements in glasshouse (top) and outdoor (bottom) environements. Values
shown with means are SE of five replicated plants for each genotype. Genotypes means followed with the same
letter are not significantly different based on Tukey’s test at significance level 0.05. Outputs from the analysis of
genotype, environment, and genotype x environment interaction effects on the different growth parameters are
presented at the bottom of the table.
Glasshouse Biomass increased (g) Total water transpired (g) Transpiration efficiency (g kg-1
)
Genotypes Well watered Water stress Well watered Water stress Well watered Water stress
Dro
ug
ht
sen
siti
ve
Bambey 21 3.59±0.11 d 1.18±0.09 e
1684±20.90 e 843±14.39 b
2.13±0.07 b 1.40±0.11 e
IT82E-18 3.68±0.31 d 1.55±0.09 d
2073±13.48 c 647±21.28 d
2.38±0.16 b 1.80±0.17 d
IT83D-442 6.50±0.23 b 1.90±0.15 c
2234±11.12 b 749±27.89 c
2.91±0.10 ab 2.54±0.22 b
IT89KD-288 7.55±0.24 a 2.70±0.29 b
2183±28.91 c 967±25.34 ab
3.46±0.12 a 2.79±0.08 b
IT93K-93-10 6.52±0.20 b 2.67±0.22 b
2166±14.54 c 737±12.56 c
3.01±0.11 ab 2.62±0.32 b
IT97K-556-6 7.39±0.31 a 1.71±0.17 d
2359±34.12 a 713±23.45 c
3.13±0.13 a 2.40±0.27 c
UC - CB46 3.35±0.21 d 1.43±0.07 d 1878±29.50 d 751±15.25 c 1.78±0.11 d 1.91±0.08 d
Dro
ug
ht
tole
ran
t
IT84S-2049 3.57±0.28 d 3.66±0.09 a
1524±26.60 e 1177±20.69 a
2.34±0.19 b 3.11±0.08 a
IT97K-207-15 4.67±0.19 c 1.21±0.18 e
2363±27.83 a 850±13.04 b
1.98±0.08 c 1.42±0.22 e
IT97K-499-39 6.34±0.29 b 0.93±0.07 e
2210±23.87 b 771±19.91 c
2.87±0.13 ab 1.20±0.09 e
IT98K-128-2 6.77±0.21 b 1.90±0.22 c
2429±17.13 a 730±15.03 c
2.79±0.10 ab 2.61±0.27 b
IT99K-124-5 5.75±0.40 c 2.91±0.22 b
2126±28.50 c 885±17.94 b
2.70±0.18 ab 3.30±0.29 a
KVx-61-1 3.89±0.18 d 1.18±0.24 e
2051±25.37 c 855±19.33 b
1.90±0.09 c 1.37±0.26 e
Mouride 4.73±0.11 c 3.44±0.09 a
1537±36.76 e 1108±15.34 a
3.08±0.08 a 3.10±0.05 a
SuVita2 5.00±0.23 c 2.08±0.08 c 1515±23.33 e 1005±19.41 ab 3.30±0.17 a 2.07±0.04 c
Sensitive Mean 5.51 1.88
2083 772
2.69 2.21
Tolerant Mean 5.09 2.16 1969 923 2.62 2.27
Outdoor Biomass increased (g) Total water transpired (g) Transpiration efficiency (g kg-1
)
Genotypes Well watered Water stress Well watered Water stress Well watered Water stress
Dro
ug
ht
sen
siti
ve
Bambey 21 1.63± 0.12 b 0.59±0.07 c
1516±17.48 c 717±14.34 b
1.08±0.08 bc 0.82±0.01 d
IT82E-18 1.46±0.06 b 0.56±0.08 c
1924±19.73 a 707±15.18 b
0.76±0.04 d 0.79±0.12 d
IT83D-442 1.12±0.07 c 0.56±0.03 c
1382±18.75 d 630±16.26 c
0.81±0.05 c 0.88±0.05 d
IT89KD-288 0.67±0.07 d 0.45±0.04 d
1449±14.16 d 560±18.80 d
0.46±0.04 f 0.81±0.07 d
IT93K-93-10 1.49±0.08 b 0.27±0.04 f
1485±25.47 c 546±23.92 d
1.00±0.05 bc 0.50±0.06 g
IT97K-556-6 1.11±0.05 c 0.44±0.04 d
1549±28.95 c 603±15.79 c
0.71±0.04 d 0.73±0.04 e
UC - CB46 1.45±0.06 b 0.46±0.05 d 1742±26.80 b 644±15.85 c 0.83±0.03 c 0.71±0.06 e
Dro
ug
ht
tole
ran
t
IT84S-2049 1.28±0.08 c 0.85±0.05 b
1142±13.70 e 894±13.35 a
1.12±0.07 b 1.55±0.03 ab
IT97K-207-15 1.10±0.10 c 0.57±0.03 c
1367±19.78 d 564±14.02 d
0.81±0.07 c 1.01±0.04 c
IT97K-499-39 1.61±0.11 b 0.48±0.05 d
1338±16.91 d 707±14.90 b
1.20±0.10 b 0.68±0.03 e
IT98K-128-2 1.08±0.05 c 0.43±0.05 d
1363±11.33 d 608±14.97 c
0.80±0.04 c 0.70±0.03 e
32
IT99K-124-5 1.48±0.10 b 0.43±0.03 d
1189±12.18 e 628±18.28 c
1.24±0.08 b 0.69±0.02 e
KVx-61-1 0.73±0.05 d 0.34±0.04 e
1328±23.24 d 556±15.77 d
0.55±0.03 e 0.61±0.04 f
Mouride 2.11±0.13 a 1.45±0.06 a
1013±17.99 f 824±19.88 a
2.08±0.11 a 1.75±0.08 a
SuVita2 1.05±0.10 c 0.98±0.09 b 1055±16.33 f 811±17.12 a 1.99±0.09 a 1.21±0.10 b
Sensitive Mean 1.28 0.48
1578 629
0.81 0.75
Tolerant Mean 1.31 0.69 1224 699 1.10 0.95
Biomass increased Total water transpired Transpiration efficiency
Well watered Water stress Well watered Water stress Well watered Water stress
En
v
F Value 17759.30 5644.42
70707.80 7838.01
10031.50 4163.08
Pr > F < 0.0001 < 0.0001 < 0.0001 < 0.0001 < 0.0001 < 0.0001
Gen
F Value 150.32 204.50
2613.57 830.49
138.50 106.57
Pr > F < 0.0001 < 0.0001 < 0.0001 < 0.0001 < 0.0001 < 0.0001
G X
E
F Value 198.43 134.25
1153.12 156.20
96.97 95.95
Pr > F < 0.0001 < 0.0001 < 0.0001 < 0.0001 < 0.0001 < 0.0001

33 Table 5. FTSW threshold values for the fifteen cowpea genotypes grown under progressive drying soil in
glasshouse (A) and outdoor (B) conditions. FTSW thresholds were calculated using the two-segment plateau
regression procedure with ± standard error (SE) and confidence interval (CI). Data are the means of five replicates
plants for each genotype. FTSW Threshold values identified with the same letter are not statistically varied from
each other based on Tukey’s test at significance level 0.05.
(A) Genotypes FTSW Threshold Approximate SE 95% CI
Dro
ug
ht
sen
siti
ve
Bambey21 0.6319 c 0.0341 0.6036 - 0.6702
IT82E-18 0.6234 c 0.0365 0.6062 - 0.6727
IT83D-442 0.6788 d 0.0553 0.6458 - 0.716
IT89KD-288 0.6201 c 0.0326 0.5048 - 0.6555
IT93K-93-10 0.6972 d 0.0289 0.6492 - 0.7452
IT97K-556-6 0.6217 c 0.0417 0.5780 - 0.6654
UC-CB46 0.6275 c 0.0462 0.6047 - 0.6702
Dro
ug
ht
tole
ran
t
IT84S-2049 0.4730 a 0.0133 0.4466 - 0.4999
IT97K-207-15 0.5274 b 0.0495 0.4882 - 0.5667
IT97K-499-39 0.5679 b 0.0307 0.5362 - 0.6095
IT98K-128-2 0.5923 b 0.0312 0.5797 - 0.6349
IT99K-124-5 0.5247 b 0.0303 0.4840 - 0.5655
KVx-61-1 0.5904 b 0.0355 0.5692 - 0.6215
Mouride 0.4449 a 0.0232 0.4186 - 0.4715
Suvita2 0.4765 a 0.0240 0.4368 - 0.5032
(B) Genotypes FTSW Threshold Approximate SE 95% CI
Dro
ug
ht
sen
siti
ve
Bambey21 0.6886 c 0.0191 0.6503 - 0.7168
IT82E-18 0.7129 d 0.0307 0.6813 - 0.7544
IT83D-442 0.6613 c 0.0128 0.6358 - 0.6869
IT89KD-288 0.6650 c 0.0102 0.6447 - 0.6853
IT93K-93-10 0.6864 c 0.0128 0.6608 - 0.7121
IT97K-556-6 0.7227 d 0.0140 0.6956 - 0.7518
UC-CB46 0.6724 c 0.0160 0.6403 - 0.7045
Dro
ug
ht
tole
ran
t
IT84S-2049 0.4920 a 0.0125 0.4670 - 0.5271
IT97K-207-15 0.6596 c 0.0145 0.6310 - 0.6890
IT97K-499-39 0.6092 b 0.0148 0.5896 - 0.6388
IT98K-128-2 0.6180 b 0.0113 0.5953 - 0.6307
IT99K-124-5 0.6353 b 0.0071 0.6012 - 0.6694
KVx-61-1 0.5978 b 0.0121 0.5736 - 0.6219
Mouride 0.4821 a 0.0056 0.4310 - 0.5033
Suvita2 0.4817 a 0.0094 0.4630 - 0.5104

34

35 Table 6. Visual scores for stay green of contrasting cowpea genotypes rated under drought stress conditions
outdoors and in the glasshouse. This rating was done at the end of the dry-down experiment [45 DAS]. Score values
are the means (±SE) of five replicated plants per genotype. Average score of sensitive and tolerant lines are
presented at the bottom of the table.
Genotypes Glasshouse Outdoor
Bambey 21 2.0±0.0 b 3.2±0.4 a
IT82E-18 3.6±0.5 a 4.0±0.0 a
IT83D-442 1.6±0.5 b 2.0±0.0 b
IT89KD-288 1.4±0.5 b 3.2±0.5 a
IT93K-93-10 1.2±0.4 b 1.4±0.5 c
IT97K-556-6 3.2±0.4 a 4.4±0.5 a
UC - CB46 3.6±0.5 a 3.6±0.5 a
IT84S-2049 1.8±0.4 b 1.6±0.5 b
IT97K-207-15 1.8±0.4 b 1.4±0.5 c
IT97K-499-39 1.2±0.4 b 1.2±0.4 c
IT98K-128-2 1.0±0.0 c 3.0±0.5 a
IT99K-124-5 1.4±0.5 b 2.2±0.4 b
KVx-61-1 1.6±0.5 b 1.8±0.4 b
Mouride 1.0±0.0 c 1.6±0.5 b
SuVita2 1.0±0.0 c 1.4±0.5 c
Sensitive Mean 2.37 3.11
Tolerant Mean 1.35 1.78

36
FIGURES CAPTIONS
Fig. 1. Transpiration rate [TR, g H2O cm-1
2h-1
] under well watered conditions of cowpea genotypes contrasting for
terminal drought tolerance [tolerant lines: IT84S-2049, Mouride, Suvita2, solid lines] and [sensitive lines: Bambey
21, IT82E-18, UC-CB46, dotted lines] exposed to natural variation of atmospheric VPD cycle. Plants were grown in
glasshouse (A) and outdoors (B) and tested at the vegetative stage over the course of an entire day. Values are the
means (±SE) of five plants per genotype. The polynomial dotted line fitting with the dashed points represents the
VPD variation during the course of the day of the experiments.
Fig. 2. Total water transpired [Tr, g H2O Plant-1
Day-1
] of drought tolerant (black bars) and sensitive genotypes (grey
bars) grown under non-limited water conditions. The amount of water loss was estimated on well watered plants
over an entire day in glasshouse (A) and outdoors (B) conditions at vegetative stage. Values are the means (± SE) of
five plants for each genotype.
Fig. 3. Normalized transpiration rate versus fraction of transpirable soil water of tolerant [Mouride and IT84S-2049,
open symbols and solid lines] and sensitive [Bambey and IT82E-18, closed symbols and dotted lines] cowpea
genotypes exposed to progressive drying soil under glasshouse (A and B) and outdoor (C and D) conditions. Values
are transpiration data of five replicated plants for each genotype at each FTSW condition. The FTSW thresholds
where transpiration initiated its decline were calculated with a plateau regression procedure from SAS. Then the
regression lines of the relationships between NTR and FTSW were drawn by fitting NTR to FTSW data above and
below the respective threshold for transpiration decline in each genotype with GraphPad Prism.
Fig. 4. Differences in canopy temperature depression among contrasting cowpea genotypes (Tolerant, black bars;
sensitive, grey bars) grown under well watered and water stress conditions in glasshouse (A and B) and outdoor (C
and D). Measurements of leaf temperature were done on the three most recent fully expanded leaves at the end of
the dry-down between 8:00 and 9:00 am. Values are the means (±SE) of five replicates plants per treatment and
genotype.
Fig. 5. Relationship between transpiration rate [TR, g H2O cm-2
h-1
] and transpiration efficiency [TE, g biomass / kg
water transpired] of fifteen tolerant and sensitive cowpea genotypes. TR was measured at the highest VPD under
well watered [WW] conditions at the vegetative stage and TE was estimated under both WW and water stress [WS]
conditions in the glasshouse (A and B) and outdoors (C and D). Data points are means of five replicated plants per
genotype and treatment.
Fig. 6. Relationship between TR and the FTSW-threshold [glasshouse (A) and outdoors (B)] and between FTSW-
threshold and transpiration efficiency [glasshouse (C) and outdoors (D)] of fifteen contrasting cowpea genotypes.
Data points are means of five replicated plants per genotype.

37 Fig. 7. Relationship between canopy temperature depression and transpiration rate of fifteen contrasting cowpea
genotypes under drought stress condition. CTD and TR were measured at the end of the dry-down experiment in
glasshouse (A) and outdoors (B). Data points are means of five replicated plants per genotype.
Suppl. Fig. 1. Weather conditions during the experiments in ICRISAT. The data presented were daily minimum and
maximum air temperature (A), relative humidity (B), and atmospheric VPD (C) recorded during the measurements
period starting from 18th
March 2010 (date of water treatments imposition) to 5th
May 2010 (date of final harvest).
The curves are in dotted lines for the glasshouse [Gh] and in solid lines for outdoors [Od].
Suppl. Fig. 2. Tolerant Suvita2 (A) and Mouride (B) and sensitive IT82-18 (C) and UC-CB46 (D) kept well watered
(4 plants on the left) or exposed to water stress (4 plants on the right) conditions at the end of the dry-down
experiment in the glasshouse. The tolerant genotypes had the lowest stay green scores [Suvita (1.0±0.0) and
Mouride (1.0±0.0)] and the sensitive genotypes showed the highest scores [IT82E-18 (3.6±0.5) and UC-CB46
(3.6±0.5)].

Lower Soil Moisture Threshold for Transpiration Decline under Water Deficit Correlates with
Lower Canopy Conductance and Higher Transpiration Efficiency in Drought Tolerant Cowpea
Nouhoun BELKOA,D, Mainassara ZAMAN-ALLAHB, Ndiaga CISSEA,
Ndeye Ndack DIOPA,C, Gerard ZOMBRED, Jeffrey D. EHLERSC, Vincent VADEZB,*
DOI: http://dx.doi.org/10.1071/FP11282
This is author version post-print archived in the official Institutional Repository of ICRISAT www.icrisat.org
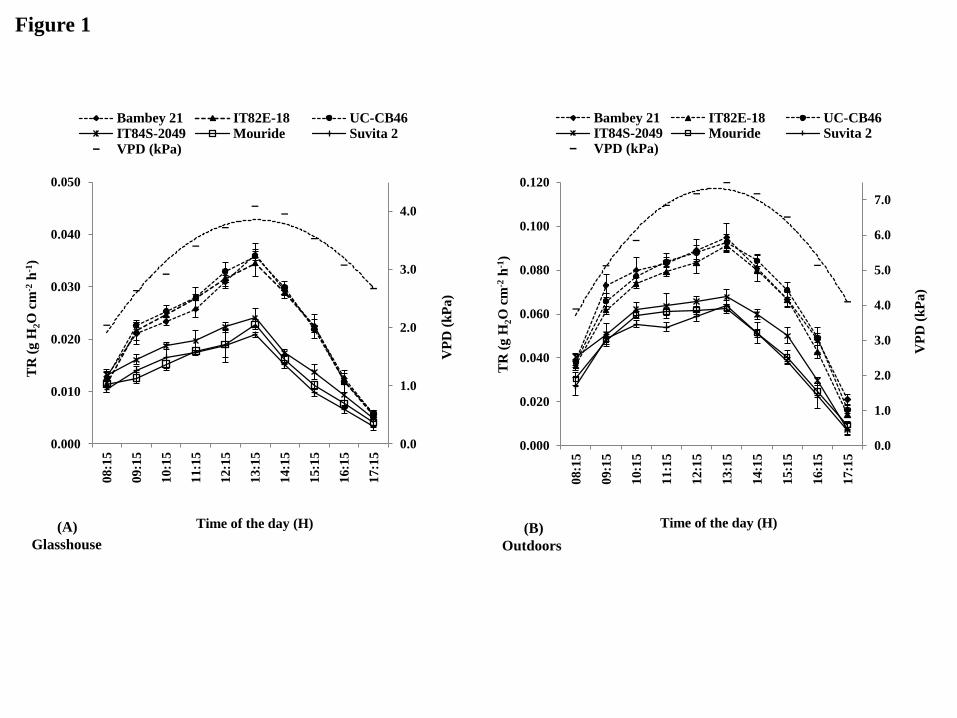
Figure 1
0.0
1.0
2.0
3.0
4.0
0.000
0.010
0.020
0.030
0.040
0.050
08:1
5
09:1
5
10:1
5
11:1
5
12:1
5
13:1
5
14:1
5
15:1
5
16:1
5
17:1
5
VP
D (
kP
a)
TR
(g H
2O
cm
-2 h
-1)
Time of the day (H)
Bambey 21 IT82E-18 UC-CB46IT84S-2049 Mouride Suvita 2VPD (kPa)
(A)
Glasshouse
0.0
1.0
2.0
3.0
4.0
5.0
6.0
7.0
0.000
0.020
0.040
0.060
0.080
0.100
0.120
08:1
5
09:1
5
10:1
5
11:1
5
12:1
5
13:1
5
14:1
5
15:1
5
16:1
5
17:1
5
VP
D (
kP
a)
TR
(g H
2O
cm
-2 h
-1)
Time of the day (H)
Bambey 21 IT82E-18 UC-CB46IT84S-2049 Mouride Suvita 2VPD (kPa)
(B)
Outdoors

Figure 2
0
50
100
150
200
250
300
Bam
bey
21
IT82E
-18
IT83D
-442
IT89K
D-2
88
IT93K
-93-1
0
IT97K
-556-6
UC
- C
B46
IT84S
-2049
IT97K
-207-1
5
IT97K
-499-3
9
IT98K
-128-2
IT99K
-124-5
KV
x-6
1-1
Mou
rid
e
Su
Vit
a2
Dail
y w
ate
r tr
an
spir
ed
(g H
2O
Pla
nt-1
Day
-1)
Sensitive genotypes Tolerant genotypes (A)
Glasshouse
0
50
100
150
200
250
300
Bam
bey
21
IT82E
-18
IT83D
-442
IT89K
D-2
88
IT93K
-93-1
0
IT97K
-556-6
UC
- C
B46
IT8
4S
-2049
IT97K
-207-1
5
IT97K
-499-3
9
IT98K
-128-2
IT99K
-124-5
KV
x-6
1-1
Mou
rid
e
Su
Vit
a2
Dail
y w
ate
r tr
an
spir
ed
(g H
2O
Pla
nt-1
Day
-1)
Sensitive genotypes Tolerant genotypes (B)
Outdoors

Figure 3
0.00.20.40.60.81.00.0
0.2
0.4
0.6
0.8
1.0
1.2
1.4
Fraction of transpirable soil water
Norm
alize
d t
ran
spir
ati
on
rate
---- ---- Bambey 21: FTSW = 0.63
0.00.20.40.60.81.00.0
0.2
0.4
0.6
0.8
1.0
1.2
1.4
Fraction of transpirable soil water
Norm
alize
d t
ran
spir
ati
on
rate
Mouride: FTSW = 0.44
(A)
Glasshouse
0.00.20.40.60.81.00.0
0.2
0.4
0.6
0.8
1.0
1.2
1.4
Fraction of transpirable soil water
Norm
alize
d t
ran
spir
ati
on
rate
---- ---- IT82E-18: FTSW = 0.62
0.00.20.40.60.81.00.0
0.2
0.4
0.6
0.8
1.0
1.2
1.4
Fraction of transpirable soil water
Norm
alize
d t
ran
spir
ati
on
rate
IT84S-2049: FTSW = 0.47
(B)
Glasshouse
0.00.20.40.60.81.00.0
0.2
0.4
0.6
0.8
1.0
1.2
1.4
Fraction of transpirable soil water
Norm
alize
d t
ran
spir
ati
on
rate
---- ---- Bambey 21: FTSW = 0.69
0.00.20.40.60.81.00.0
0.2
0.4
0.6
0.8
1.0
1.2
1.4
Fraction of transpirable soil water
Norm
alize
d t
ran
spir
ati
on
rate
Mouride: FTSW = 0.48
(C)
Outdoors
0.00.20.40.60.81.00.0
0.2
0.4
0.6
0.8
1.0
1.2
1.4
Fraction of transpirable soil water
Norm
alize
d t
ran
spir
ati
on
rate
---- ---- IT82E-18: FTSW = 0.71
0.00.20.40.60.81.00.0
0.2
0.4
0.6
0.8
1.0
1.2
1.4
Fraction of transpirable soil water
Norm
alize
d t
ran
spir
ati
on
rate
IT84S-2049: FTSW = 0.49
(D)
Outdoors

Figure 4 A&B
0.00
1.00
2.00
3.00
4.00
5.00
6.00
7.00
Bam
bey
21
IT8
2E
-18
IT8
3D
-44
2
IT8
9K
D-2
88
IT9
3K
-93-1
0
IT9
7K
-556
-6
UC
- C
B46
IT8
4S
-20
49
IT9
7K
-207
-15
IT9
7K
-499
-39
IT9
8K
-128
-2
IT9
9K
-124
-5
KV
x-6
1-1
Mou
rid
e
Su
Vit
a2
Can
op
y t
emp
eratu
re d
epre
ssio
n (°C
)
Sensitive genotypes Tolerant genotypes
(A) WW
Glasshouse
-1.50
-1.00
-0.50
0.00
0.50
1.00
1.50
2.00
2.50
UC
- C
B46
IT8
2E
-18
IT9
7K
-556
-6
IT8
3D
-44
2
IT9
3K
-93-1
0
Bam
bey
21
IT8
9K
D-2
88
IT9
7K
-207
-15
IT9
9K
-124
-5
IT9
7K
-499
-39
IT9
8K
-128
-2
KV
x-6
1-1
IT8
4S
-20
49
Mou
rid
e
Su
Vit
a2
Can
op
y t
emp
eratu
re d
epre
ssio
n (°C
)
Sensitive genotypes Tolerant genotypes
(B)
WS
Glasshouse
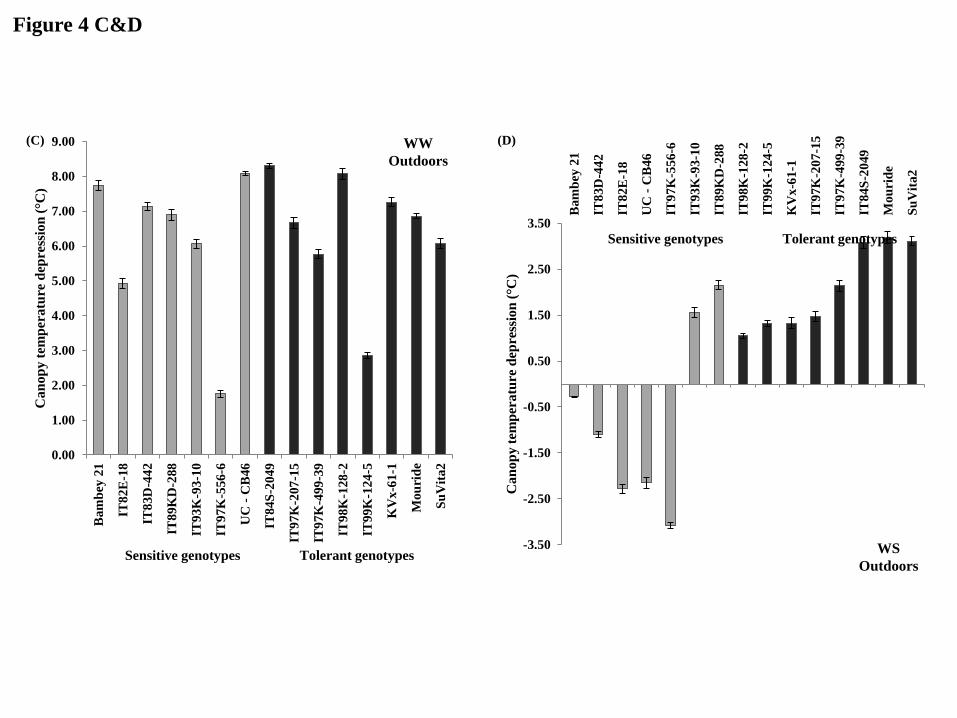
Figure 4 C&D
0.00
1.00
2.00
3.00
4.00
5.00
6.00
7.00
8.00
9.00
Bam
bey
21
IT8
2E
-18
IT8
3D
-44
2
IT8
9K
D-2
88
IT9
3K
-93-1
0
IT9
7K
-556
-6
UC
- C
B46
IT8
4S
-20
49
IT9
7K
-207
-15
IT9
7K
-499
-39
IT9
8K
-128
-2
IT9
9K
-124
-5
KV
x-6
1-1
Mou
rid
e
Su
Vit
a2
Can
op
y t
emp
eratu
re d
epre
ssio
n (°C
)
Sensitive genotypes Tolerant genotypes
(C) WW
Outdoors
-3.50
-2.50
-1.50
-0.50
0.50
1.50
2.50
3.50
Bam
bey
21
IT8
3D
-44
2
IT8
2E
-18
UC
- C
B46
IT9
7K
-556
-6
IT9
3K
-93-1
0
IT8
9K
D-2
88
IT9
8K
-128
-2
IT9
9K
-124
-5
KV
x-6
1-1
IT9
7K
-207
-15
IT9
7K
-499
-39
IT8
4S
-20
49
Mou
rid
e
Su
Vit
a2
Can
op
y t
emp
eratu
re d
epre
ssio
n (°C
)
Sensitive genotypes Tolerant genotypes
(D)
WS
Outdoors

Figure 5 A&B
y = -17.97x + 3.29
R² = 0.095
P = 0.2628
1.00
1.50
2.00
2.50
3.00
3.50
4.00
0.010 0.020 0.030 0.040 0.050 0.060
Tra
nsp
ira
tion
eff
icie
ncy
(g k
g-1
)
Transpiration rate (g H20 cm-2 h-1)
(A)
WW
Glasshouse
y = -32.43x + 3.41
R² = 0.179
P = 0.1157
1.00
1.50
2.00
2.50
3.00
3.50
0.010 0.020 0.030 0.040 0.050 0.060
Tra
nsp
ira
tion
eff
icie
ncy
(g k
g-1
)
Transpiration rate (g H20 cm-2 h-1)
(B)
WS
Glasshouse

Figure 5 C&D
y = -13.32x + 2.33
R² = 0.401
P = 0.0113
0.00
0.50
1.00
1.50
2.00
2.50
0.000 0.050 0.100 0.150 0.200
Tra
nsp
irati
on
eff
icie
ncy
(g k
g-1
)
Transpiration rate (g H20 cm-2 h-1)
(C)
WW
Outdoors
y = -17.68x + 2.56
R² = 0.756
P = 0.0000
0.00
0.50
1.00
1.50
2.00
0.000 0.050 0.100 0.150T
ran
spir
ati
on
eff
icie
ncy
(g k
g-1
)
Transpiration rate (g H20 cm-2 h-1)
(D)
WS
Outdoors
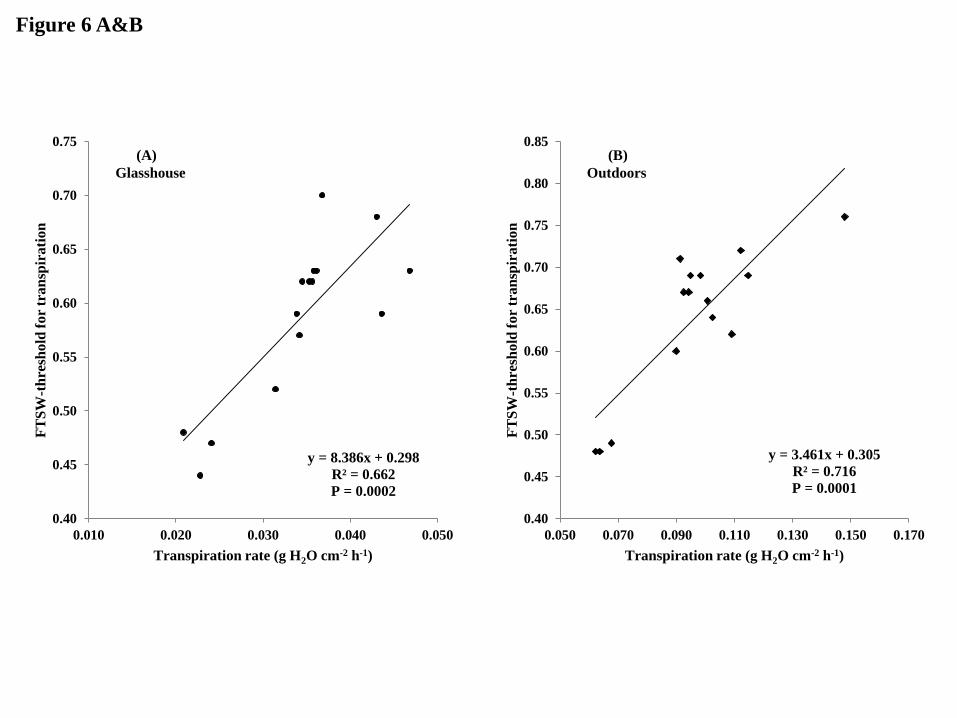
Figure 6 A&B
y = 8.386x + 0.298
R² = 0.662
P = 0.0002
0.40
0.45
0.50
0.55
0.60
0.65
0.70
0.75
0.010 0.020 0.030 0.040 0.050
FT
SW
-th
resh
old
for
tran
spir
ati
on
Transpiration rate (g H2O cm-2 h-1)
(A)
Glasshouse
y = 3.461x + 0.305
R² = 0.716
P = 0.0001
0.40
0.45
0.50
0.55
0.60
0.65
0.70
0.75
0.80
0.85
0.050 0.070 0.090 0.110 0.130 0.150 0.170
FT
SW
-th
resh
old
for
tran
spir
ati
on
Transpiration rate (g H2O cm-2 h-1)
(B)
Outdoors

Figure 6 C&D
y = -1.568x + 3.084
R² = 0.036
P = 0.5007
0.00
0.50
1.00
1.50
2.00
2.50
3.00
3.50
0.40 0.45 0.50 0.55 0.60 0.65 0.70 0.75
Tra
nsp
irati
on
eff
icie
ncy
(g/k
g)
FTSW-threshold for transpiration
(C)
Glasshouse
y = -3.389x + 3.017
R² = 0.617
P = 0.0005
0.00
0.50
1.00
1.50
2.00
0.4 0.45 0.5 0.55 0.6 0.65 0.7 0.75
Tra
nsp
irati
on
eff
icie
ncy
(g/k
g)
FTSW-threshold for transpiration
(C)
Outdoors

(°C)
Glasshouse
(°C)
Outdoors
Figure 7

Suppl. Fig. 1
0
5
10
15
20
25
30
35
40
45
50
55
0 2 4 6 8 10 12 14 16
Tem
per
au
tre
(°C
)
Days after water treatments imposition
Gh_Min Temp (°C)
Gh_Max Temp (°C)
(A)
0
10
20
30
40
50
60
70
80
90
100
0 2 4 6 8 10 12 14 16
Rel
ati
ve
hu
mid
ity (
%)
Days after water treatments imposition
Gh_Min RH (%)
Gh_Max RH (%)
(B)
0
1
2
3
4
5
6
7
8
9
0 2 4 6 8 10 12 14 16
Vap
or
pre
ssu
re d
efic
it (
kP
a)
Days water after treatments imposition
Gh_Min VPD (kPa)Gh_Max VPD (kPa)
(C)

Suppl. Fig. 2
A B
C D