Stillbirth rates around the nuclear installation - International Journal
9
C International Epidemiological Association 1998 Primed in Great Britain International Journal of Epidemiology 1998:27:74-82 Stillbirth rates around the nuclear installation at Sellafield, North West England: 1950-1989 TJB Dummer, a HO Dickinson, a MS Pearce, a ME Charlton, b J Smith, a J Salotti a and L Parker 8 Background The aim of the study was to investigate whether proximity to the nuclear installa- tion at Sellafield, in Cumbria, North West of England, increases the risk of still- birth in the resident population. The cohort consisted of all 256 066 live and 4034 stillbirths to mothers usually domiciled in Cumbria, 1950-1989. Methods The study was a retrospective cohort analysis allowing for year of birth, social class and birth order using: (i) Poisson probability mapping, (ii) comparison of cumulat- ive observed and expected numbers of stillbirths by distance from Sellafield, (iii) logistic regression of stillbirth risk in relation to distance and direction from Sellafield. Results Poisson probability mapping of stillbirths within 25 km of Sellafield provided no evidence to suggest that proximity to Sellafield increased the risk of stillbirth, either overall or in any specific direction. Comparison of the cumulative observed and expected numbers of stillbirths also showed no increased risk with proximity to Sellafield. Logistic regression analysis of all Cumbrian births supported these results, showing, in particular, that distance from Sellafield did not significantly influence stillbirth risk (P = 0.30). Although there was significant variation in stillbirth risk with direction (P = 0.0004), this was due to stillbirths in areas much further than 25 km from Sellafield. There was no significant effect with distance from Sellafield within any of six directional sectors (P > 0.05). Conclusions There was no evidence to suggest that proximity to Sellafield increases the risk of stillbirth in the resident population. Keywords Stillbirths, environmental radiation, cohort study Accepted 4 July 1997 There has been concern that women living near to the nuclear reprocessing plant at Sellafield, West Cumbria, may have an increased risk of having stillborn children. 12 However, neither a consideration of stillbirth rates in electoral wards between 1981 and 1992 1 nor an analysis of stillbirth numbers in the county district around Sellafield between 1949 and 1981 2 found evidence to support this concern. The aim of the present study was to test the hypothesis that proximity to Sellafield increases the risk of stillbirth in the resid- ent population, considering the time period from the beginning of nuclear operations at Sellafield in 1950 up to 1989. It differs from previous studies in the incorporation of individual level risk factors for stillbirth and the use of the much finer geographical ' North of England Children's Cancer Research Unll, Department of Child Health. University of Newcastle upon T\ne. Roval Victoria Infirmary Queen Victoria Road, Newcastle upon Tyne NE1 4LP. UK. b Department of Geography. University of Newcastle upon Tyne. Daysh Building. Newcastle upon Tyne NEI 7RU. UK. reference of unit postcodes rather than wards or administrative districts. In particular, the use of individual level data, geograph- ically referenced by unit postcodes and stored within a geograph- ical information system (G1S), allowed analysis at a range of user-defined spatial areas. Methods The study area considered was the area currently defined as Cumbria. 3 The cohort studied consisted of all live and stillbirths born to mothers usually resident in the study area during the period 1 January 1950 to 30 September 1989. During this period stillbirth was defined as fetal death after 28 weeks' gestation. 4 - 5 Three statistical analyses were undertaken. The first two ana- lyses compared the observed number of stillbirths within a 25 km radius of Sellafield with the expected number as estimated from the stillbirth rate in the remainder of Cumbria. The third ana- lysis was a logistic regression analysis 6 of stillbirths in the whole of Cumbria investigating the effect on stillbirth risk of the dis- tance and direction of each birth from Sellafield. 74 Downloaded from https://academic.oup.com/ije/article/27/1/74/813971 by guest on 15 January 2022
Transcript of Stillbirth rates around the nuclear installation - International Journal
C International Epidemiological Association 1998 Primed in Great Britain International Journal of Epidemiology 1998:27:74-82
Stillbirth rates around the nuclear installationat Sellafield, North West England: 1950-1989TJB Dummer,a HO Dickinson,a MS Pearce,a ME Charlton,b J Smith,a J Salottia and L Parker8
Background The aim of the study was to investigate whether proximity to the nuclear installa-tion at Sellafield, in Cumbria, North West of England, increases the risk of still-birth in the resident population. The cohort consisted of all 256 066 live and 4034stillbirths to mothers usually domiciled in Cumbria, 1950-1989.
Methods The study was a retrospective cohort analysis allowing for year of birth, social classand birth order using: (i) Poisson probability mapping, (ii) comparison of cumulat-ive observed and expected numbers of stillbirths by distance from Sellafield, (iii)logistic regression of stillbirth risk in relation to distance and direction fromSellafield.
Results Poisson probability mapping of stillbirths within 25 km of Sellafield provided noevidence to suggest that proximity to Sellafield increased the risk of stillbirth,either overall or in any specific direction. Comparison of the cumulative observedand expected numbers of stillbirths also showed no increased risk with proximityto Sellafield. Logistic regression analysis of all Cumbrian births supported theseresults, showing, in particular, that distance from Sellafield did not significantlyinfluence stillbirth risk (P = 0.30). Although there was significant variation instillbirth risk with direction (P = 0.0004), this was due to stillbirths in areas muchfurther than 25 km from Sellafield. There was no significant effect with distancefrom Sellafield within any of six directional sectors (P > 0.05).
Conclusions There was no evidence to suggest that proximity to Sellafield increases the risk ofstillbirth in the resident population.
Keywords Stillbirths, environmental radiation, cohort study
Accepted 4 July 1997
There has been concern that women living near to the nuclearreprocessing plant at Sellafield, West Cumbria, may have anincreased risk of having stillborn children.12 However, neithera consideration of stillbirth rates in electoral wards between1981 and 19921 nor an analysis of stillbirth numbers in thecounty district around Sellafield between 1949 and 19812 foundevidence to support this concern.
The aim of the present study was to test the hypothesis thatproximity to Sellafield increases the risk of stillbirth in the resid-ent population, considering the time period from the beginningof nuclear operations at Sellafield in 1950 up to 1989. It differsfrom previous studies in the incorporation of individual level riskfactors for stillbirth and the use of the much finer geographical
' North of England Children's Cancer Research Unll, Department of ChildHealth. University of Newcastle upon T\ne. Roval Victoria Infirmary QueenVictoria Road, Newcastle upon Tyne NE1 4LP. UK.
b Department of Geography. University of Newcastle upon Tyne. DayshBuilding. Newcastle upon Tyne NEI 7RU. UK.
reference of unit postcodes rather than wards or administrativedistricts. In particular, the use of individual level data, geograph-ically referenced by unit postcodes and stored within a geograph-ical information system (G1S), allowed analysis at a range ofuser-defined spatial areas.
MethodsThe study area considered was the area currently defined asCumbria.3 The cohort studied consisted of all live and stillbirthsborn to mothers usually resident in the study area during theperiod 1 January 1950 to 30 September 1989. During this periodstillbirth was defined as fetal death after 28 weeks' gestation.4-5
Three statistical analyses were undertaken. The first two ana-lyses compared the observed number of stillbirths within a 25 kmradius of Sellafield with the expected number as estimated fromthe stillbirth rate in the remainder of Cumbria. The third ana-lysis was a logistic regression analysis6 of stillbirths in the wholeof Cumbria investigating the effect on stillbirth risk of the dis-tance and direction of each birth from Sellafield.
74
Dow
nloaded from https://academ
ic.oup.com/ije/article/27/1/74/813971 by guest on 15 January 2022
STILLBIRTH AROUND A NUCLEAR INSTALLATION 75
Table 1 Ascertainment of live and stillbirths, excluding multiple births
Within 25 km of Sellafleld Outside 25 km of Sellafleld
Stillbirths Stillbirths Postcode unknown TotalsSection Live births No. RatexlO3 Live births No. Rate x 103 Livebirths Stillbirths Livebirths Stillbirths
a) Registered births within 54 716 877Cumbria to mothers domiciledin Cumbna
b) Registered births outside 28 1Cumbna to mothers domiciledin Cumbria
c) Unregistered births to mothers 2 10domiciled in Cumbria
Total births 54 746 888
1 5 8
34.5
16.0
199 276 3042
2037 85
7 19
201 320 3146
15.0
40.1
15.4
1404 7a 255 396 3926
2065
1
1405
86
7 10 36
14 257 471 4048a Five of these stillbirths were within the 25 km zone around Sellafleld
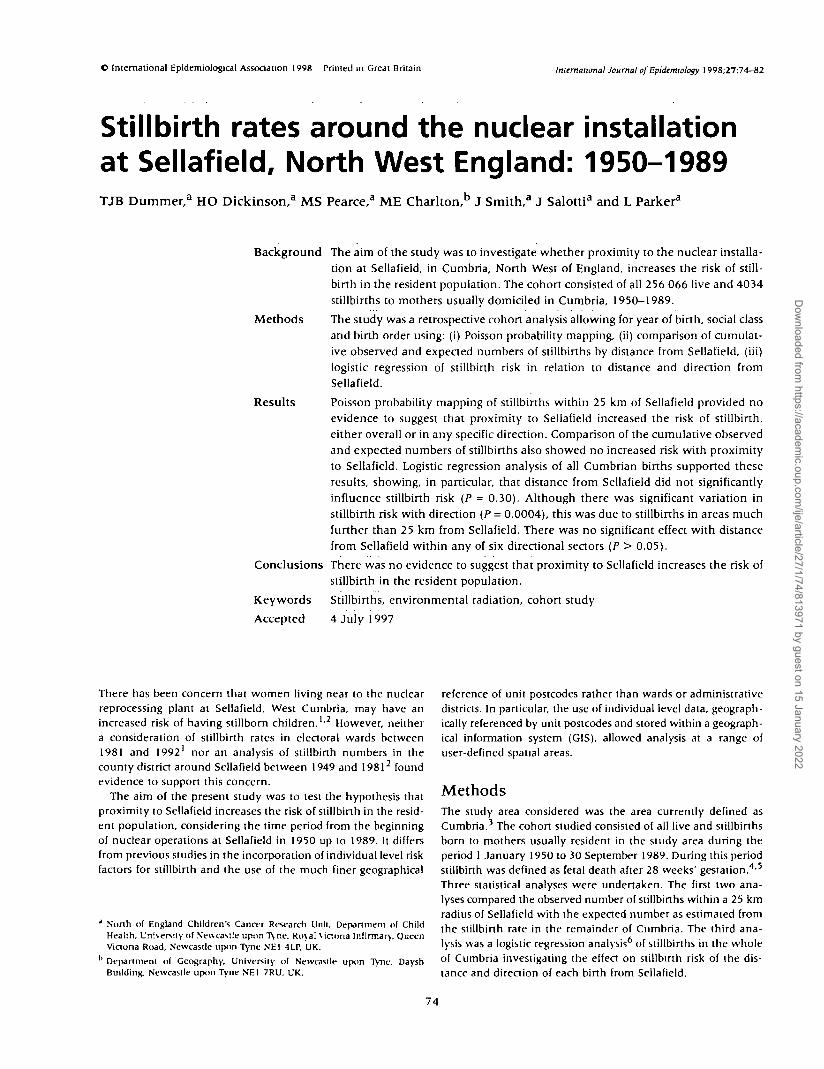
The Cumbrian databaseThe study was based on a database containing birth registrationdetails of all births to mothers normally domiciled in Cumbriabetween 1950 and 1989.78 In summary, all live and stillbirthregistrations for the study area were obtained from the Officefor National Statistics (ONS), formerly the Office of PopulationCensuses and Surveys, and entered into a computer database(Table 1, section a). Hospital records in Cumbria were searchedfor details of additional stillbirths to mothers resident in Cumbria.Maternity records in regional referral centres outside Cumbria,i.e., Newcastle, Hexham and Lancaster, were searched for detailsof live and stillbirths to mothers usually resident in Cumbria(Figure 1 and Table 1, section b). The birth registrations corres-ponding to these additional stillbirths were requested from ONSand the details added to the database. For a small number ofbirths, predominantly stillbirths, ONS were unable to identifythe relevant birth registrations and in these instances the birthdetails from hospital records were added directly to the database(Table 1, section c).
The mother's residence at the birth of the child was postcodedusing Post Office postcode directories9 and hence each birth wasassigned a grid reference using the Post Office Postzon file.10
The Postzon file provides grid references accurate to 100 m forthe first property in each unit postcode. The father's occupation,as recorded on the birth certificate, was coded and hence thesocial class was derived." Algorithms based on parents' nameswere used to identify siblings and multiple births and to assignbirth order. Whether or not the father was recorded on the birthcertificate was also flagged. A small percentage of the cohort,0.6% of live births and 0.4% of stillbirths, could not be postcoded(Table I) as the address on the birth registration was illegible orthe location could not be identified. These births were excludedfrom any further analysis, as were multiple births as they maynot represent independent events.
Poisson probability mapping of stillbirth numbers bydistance annuli and direction from SellafleldA comparison was made of the observed and expected numbersof stillbirths to mothers domiciled in distance annuli aroundSellafield, by decade. Taking the point location of Sellafieldas NY 027 039,' cirdes of radius 5, 10, 15, 20, 25 km centredon Sellafield were drawn and the distance annuli defined asthe areas between successive circles (except for the innermost'annulus' which was actually the area defined by the innermost
CUMBRIA
SELLAFIELD
Figure 1 Cumbria and the major maternity referral centres outsideCumbria in the North of England
circle) (Figure 2). A point-in-polygon overlay was performedwith the GIS Arc/Info12 to assign each birth to a distance zone.
Expected stillbirth rates within each area were estimated fromrates in the remainder of Cumbria. The logistic regression facil-ities in the statistical package Stata13 were first used to modelhow the probability of a stillbirth varied with social class, yearof birth, birth order, and whether or not the father was recordedon the birth certificate, for births outside the 25 km zone aroundSellafield. As the presence or absence of the father's name onthe birth certificate was strongly confounded with social class itwas treated as another category in the social class classification.The baseline for the presentation of results for social class wastaken to be social class Him as the largest number of births wasin this social class. These probabilities were then used to es-timate the expected number of stillbirths within the 25 km zone.
The expected number of stillbirths in each annulus for eachdecade was compared with the observed number of stillbirthsusing Poisson probability mapping.14'15 Since the hypothesisunder investigation was that there was an increased risk ofstillbirth closer to Sellafield, the Poisson probabilities were com-puted when the observed number of stillbirths was greater than
Dow
nloaded from https://academ
ic.oup.com/ije/article/27/1/74/813971 by guest on 15 January 2022
76 INTERNATIONAL JOURNAL OF EPIDEMIOLOGY
1950-59 1960-69
1970-79 1980-89
PO.001P<0.01PO.05
I not' significant
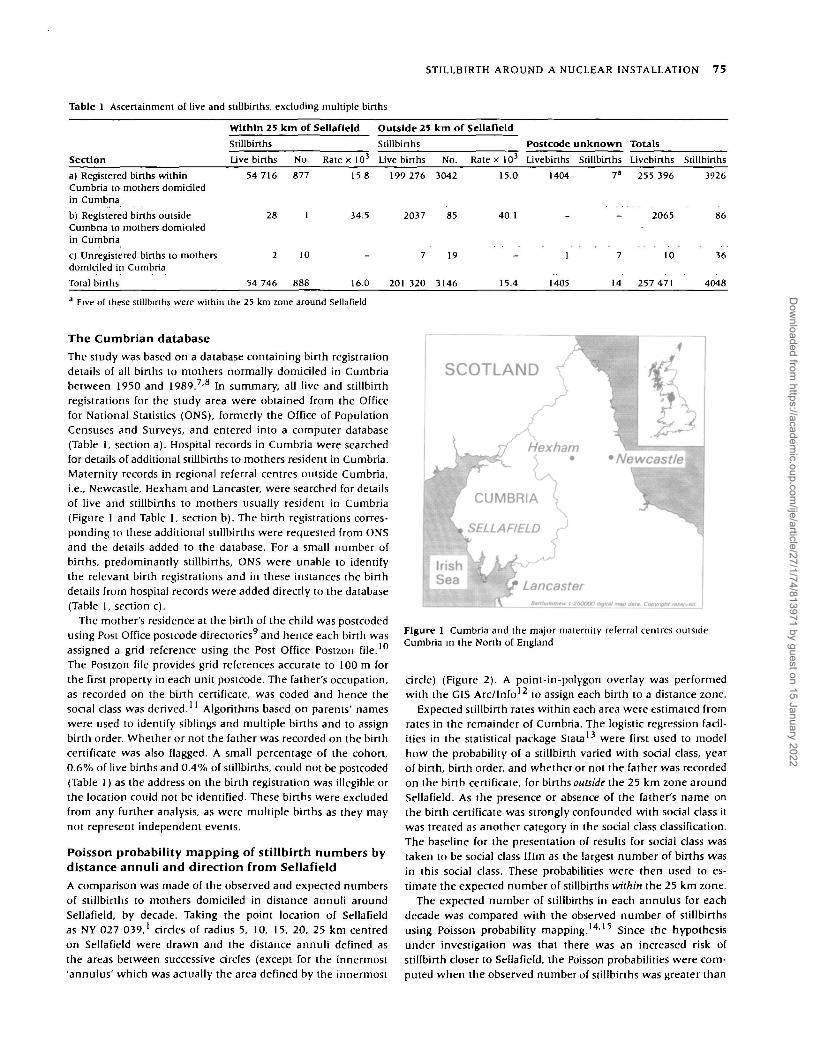
Figure 2 Distance annuli around Sellafield indicating those wherethe observed number of stillbirths was significantly higher thanexpected
P<0.001PO.01PO.05
I not' significant
Figure 3 Sub-seaors within the 25 km zone around Sellafieldindicating those where the observed number of stillbirths wassignificantly higher than expected
the expeaed and a one-tailed significance test was used. Annuliwhere the observed numbers of stillbirths were greater than theexpeaed number were mapped when the Poisson probabilitywas significant at the 0.001, 0.01 and 0.05 levels.
In addition, the 25 km zone was divided into the three dir-eaional seaors: north west, north east and south east, with theorigin centred on Sellafield (Figure 3). These seaors enabledthe investigation of potential effeas downwind of the plant;assumed to be north east of the installation given the south,south-west or west prevailing wind system in the British Isles.16
The three direaional seaors were overlaid with the five distancezones to produce 15 sub-seaors (Figure 3). Poisson probabilitymapping was undertaken for all seaors and sub-seaors.
Cumulative observed and expected stillbirthnumbers by distance from SellafieldThe cumulative observed and expeaed numbers of stillbirthswithin the 25 km zone around Sellafield were calculated forincreasing distance from Sellafield; both for the entire zone andwithin the direaional seaors. The expeaed stillbirth numberswere derived, as outlined above, from the logistic regressionmodel describing stillbirths outside the 25 km zone. The 95%confidence interval (CI) for the expeaed number of stillbirthswas derived from the standard error of the probability prediaedby the logistic regression model.
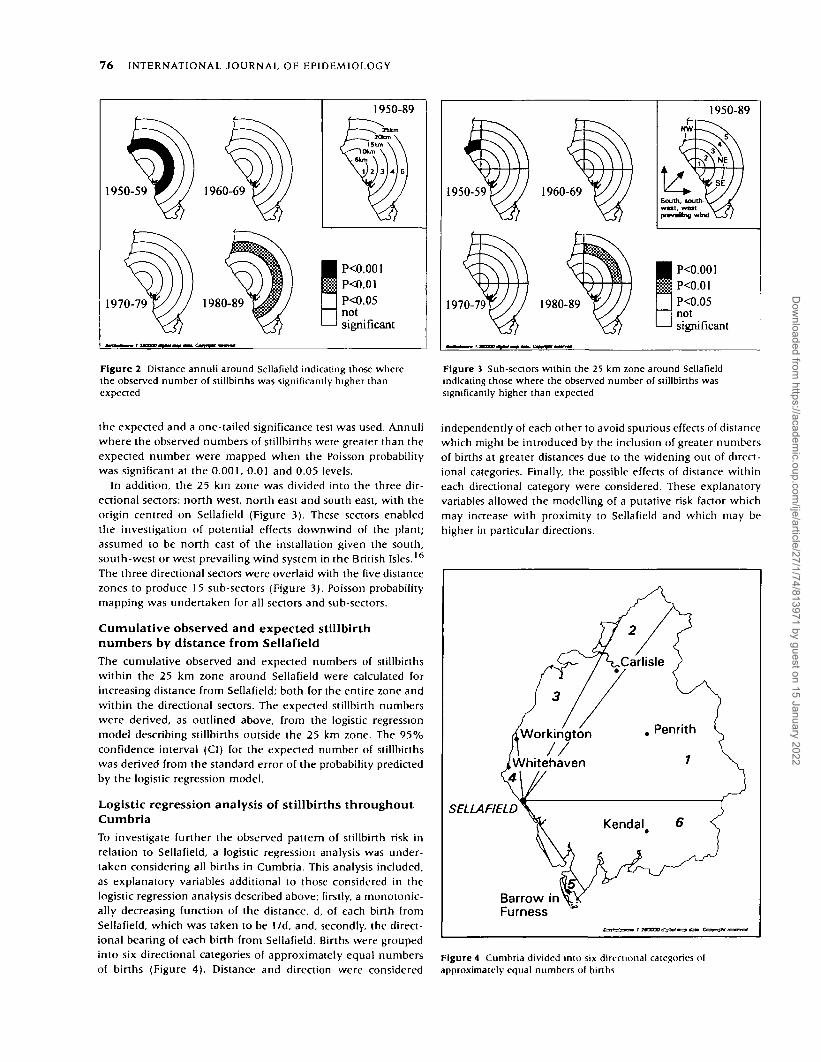
Logistic regression analysis of stillbirths throughoutCumbriaTo investigate further the observed pattern of stillbirth risk inrelation to Sellafield, a logistic regression analysis was under-taken considering all births in Cumbria. This analysis included,as explanatory variables additional to those considered in thelogistic regression analysis described above; firstly, a monotonic-ally decreasing funaion of the distance, d, of each birth fromSellafield, which was taken to be 1/d, and, secondly, the direa-ional bearing of each birth from Sellafield. Births were groupedinto six direaional categories of approximately equal numbersof births (Figure 4). Distance and direaion were considered
independently of each other to avoid spurious effeas of distancewhich might be introduced by the inclusion of greater numbersof births at greater distances due to the widening out of direa-ional categories. Finally, the possible effeas of distance withineach direaional category were considered. These explanatoryvariables allowed the modelling of a putative risk faaor whichmay increase with proximity to Sellafield and which may behigher in particular direaions.
SELLAFIELD
Barrow inFurness
Figure 4 Cumbria divided into six direaional categories ofapproximately equal numbers of births
Dow
nloaded from https://academ
ic.oup.com/ije/article/27/1/74/813971 by guest on 15 January 2022
STILLBIRTH AROUND A NUCLEAR INSTALLATION 77
Table 2 Odds ratios for stillbirth by year of birth, social class and birthorder for births-outside the 25 km zone around Sellafield
Explanatory variables No.
Year of birth—quadratic
Social Class
InmnHim
rvV
Armed Forces
Social class unknown
Father not recorded onbirth certificate
Birth order1
2
3
4
* 5
of births
-
9288
33 460
17 685
82 694
31 731
17 010
4466
734
7398
123 560
53 990
18 331
5682
2903
Odds ratio
0.9989
0.59
0.88
0.77
1.00
1.12
1.13
0.90
1.21
2.19
1.00
0.63
0.81
0.91
1.35
95% CI
0.9988-0 9990
0.47-0.75
0.79-0.98
0.66-0.89
-
1.01-1 24
0 99-1.28
0.71-1.13
0.68-2.14
1.90-2.53
-
0.57-0.70
0.71-0.93
0.73-1.12
1.07-1.71
ResultsThe total numbers of live and stillbirths within and outside a25 km radius of Sellafield and the sources of ascertainment areshown in Table 1.
The odds ratios (OR) for the risk of stillbirth for all births out-side the 25 km zone around Sellafield, estimated using logisticregression, are shown in Table 2.
The stillbirth rate in Cumbria has fallen dramatically, from24.6 per 1000 births in 1950 to 4.7 per 1000 births in 1989. Thelogistic regression analysis showed that this decrease over timewas best modelled by a quadratic term in year (which corres-ponds to, for example, an OR of 0.90 in 1960, 0.64 in 1970 and0.37 in 1980 relative to a baseline of 1.0 in 1950). There was atrend for risk of stillbirth to increase with decreasing social class
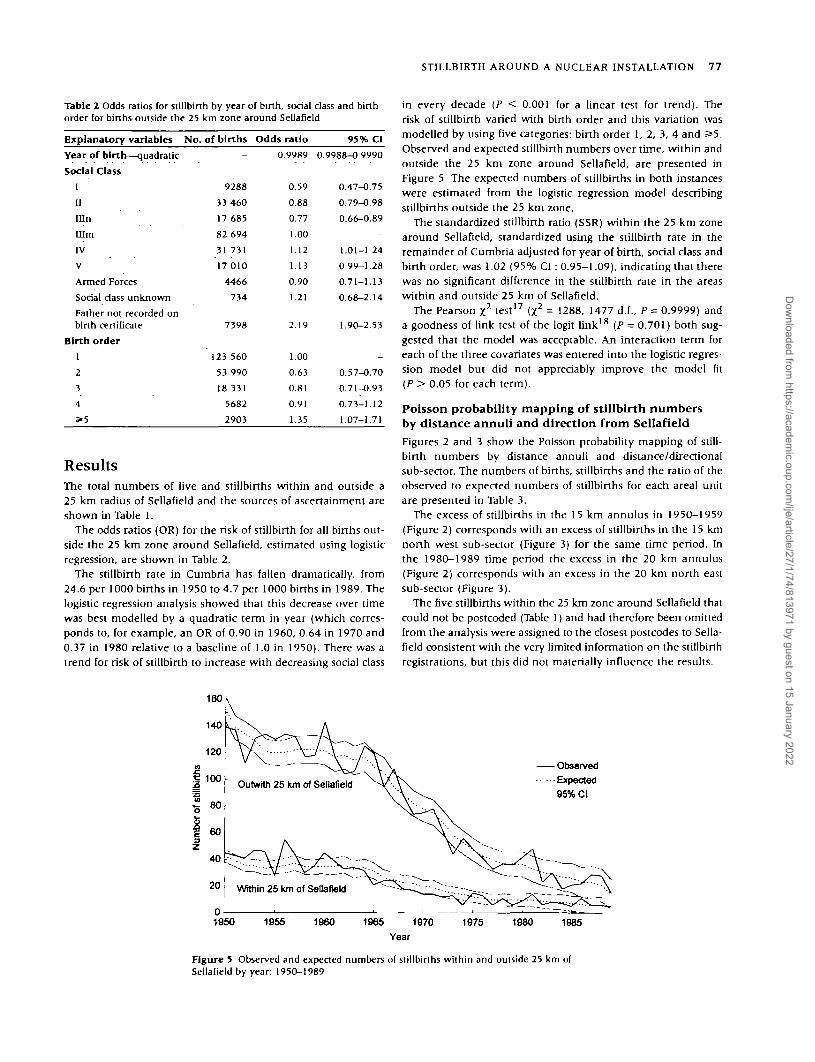
in every decade (P < 0.001 for a linear test for trend). Therisk of stillbirth varied with birth order and this variation wasmodelled by using five categories: birth order 1, 2, 3, 4 and 3>5.Observed and expeaed stillbirth numbers over time, within andoutside the 25 km zone around Sellafield, are presented inFigure 5 The expeaed numbers of stillbirths in both instanceswere estimated from the logistic regression model describingstillbirths outside the 25 km zone.
The standardized stillbirth ratio (SSR) within the 25 km zonearound Sellafield, standardized using the stillbirth rate in theremainder of Cumbria adjusted for year of birth, social class andbirth order, was 1.02 (95% CI : 0.95-1.09), indicating that therewas no significant difference in the stillbirth rate in the areaswithin and outside 25 km of Sellafield.
The Pearson %2 test17 (x2 = 1288, 1477 d.f., P = 0.9999) anda goodness of link test of the logit link18 (P = 0.701) both sug-gested that the model was acceptable. An interaaion term foreach of the three covariates was entered into the logistic regres-sion model but did not appreciably improve the model fit(P > 0.05 for each term).
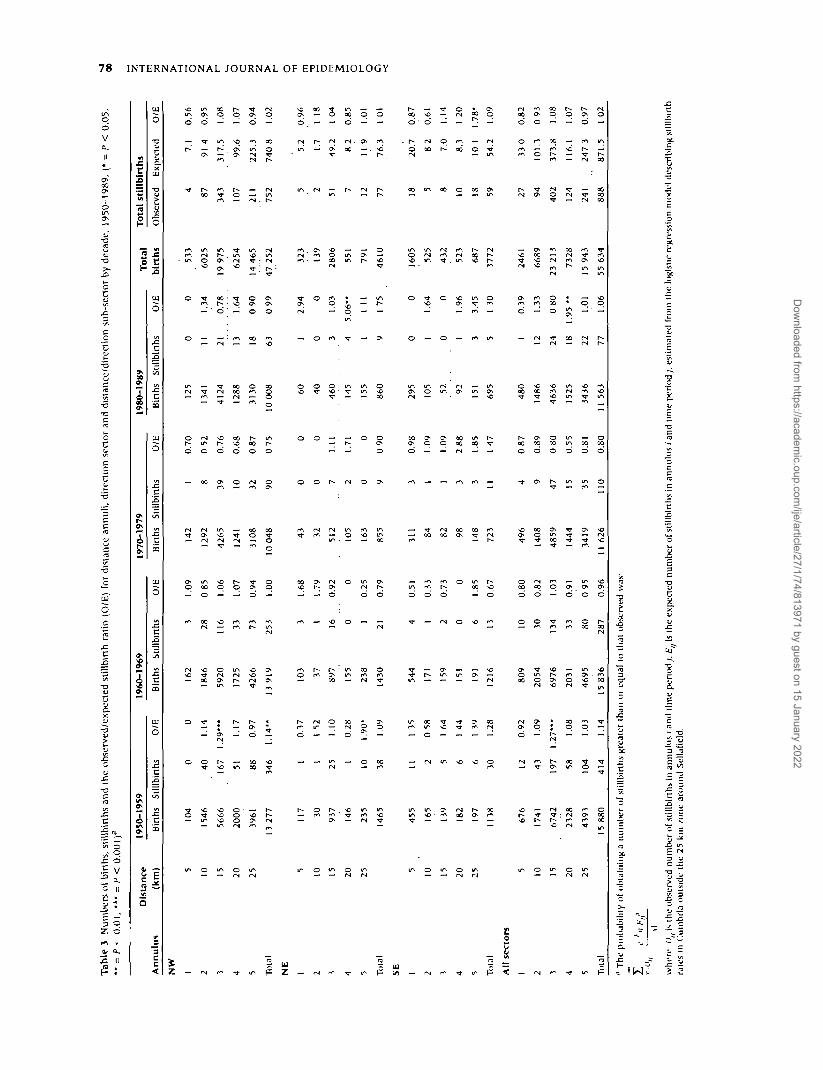
Poisson probability mapping of stillbirth numbersby distance annuli and direction from SellafieldFigures 2 and 3 show the Poisson probability mapping of still-birth numbers by distance annuli and distance/direaionalsub-seaor. The numbers of births, stillbirths and the ratio of theobserved to expeaed numbers of stillbirths for each areal unitare presented in Table 3.
The excess of stillbirths in the 15 km annulus in 1950-1959(Figure 2) corresponds with an excess of stillbirths in the 15 kmnorth west sub-seaor (Figure 3) for the same time period. Inthe 1980-1989 time period the excess in the 20 km annulus(Figure 2) corresponds with an excess in the 20 km north eastsub-seaor (Figure 3).
The five stillbirths within the 25 km zone around Sellafield thatcould not be postcoded (Table 1) and had therefore been omittedfrom the analysis were assigned to the closest postcodes to Sella-field consistent with the very limited information on the stillbirthregistrations, but this did not materially influence the results.
Observed
Expected
95% CI
1950 1955 1960 1965 1970
Year1975 1980 1985
Figure 5 Observed and expeaed numbers of stillbirths within and outside 25 km o[Sellafield by year: 1950-1989
Dow
nloaded from https://academ
ic.oup.com/ije/article/27/1/74/813971 by guest on 15 January 2022
Ta
ble
3
Nu
mb
ers
of b
irth
s, s
till
bir
ths
and
th
e o
bse
rved
/ex
pec
ted s
till
bir
th r
atio
(O
/E)
for
dis
tan
ce a
nn
uli
, d
irec
tio
n s
ecto
r an
d d
ista
nce
/dir
ecti
on s
ub
-sec
tor
by d
ecad
e, 1
95
0-1
98
9,
(* =
P <
0.0
5,
Jj**
= P
«
0.0
1,
***
= /
><
0.0
01 )
a
D| s
ta
nc
e 19
50-1
959
1960
-196
9 19
70-1
979
1980
-198
9 T
ot
a,
Tot
al s
till
bir
ths
H
An
nu
lus
(km
) B
irth
s S
till
birt
hs
0/E
B
irth
s S
till
birt
hs
O/E
B
irth
s S
iill
binh
s O
/E
Bir
ths
Sti
llbi
rths
O
/E
bir
ths
Obs
erve
d E
xpec
ted
O/E
»
NW
>
1
5
104
0
0
162
3
1.09
142
1
0.70
125
0
0
533
4
7.1 0.56
g
2
10
1546
40
1.14
1846
28
0 85
1292
8
0 52
1341
11
1.34
6025
87
914 0.95
Z
3
15
5666
167 1.29***
5920
116
1.06
4265
39
0.76
4124
21
0.78
19 975
343
317.5 1.08
M
4
20
2000
51
1.17
1725
33
1.07
1241
10
0.68
1288
13
1.64
6254
107
99.6 1.07
O
5
25
3961
88
0.97
4266
73
0.94
3108
32
0 87
3130
18
0 90
14 465
211
225.3
0.94
JO
Total
13 277
346
1.14**
13 919
253
1.00
10 048
90
0 75
10 008
63
0 99
47 252
752
740 8
1.02
> I—
NE
O1
5
117
1
0.37
103
3
1.68
43
0
0
60
1
2.94
323
5
5.2 0.96
^2
10
30
1
I 52
37
I
1.79
32
0
0
40
0
0
139
2
1.7
1 18
2O
3 15
937
25
1.
10
897
16
0.9
2
512
7
1.11
4
60
3
1.03
28
06
51
49
.2
10
4
rrt
4 20
14
6
1
0.2
8
155
0
0
105
2
1.71
14
5
4
5.06
**
551
7
8 2
0.8
5
•-
5 25
2
35
10
1.
90*
23
8
1
0.2
5
163
0
0
155
1
11
1
791
12
11
9
1.01
g
Tot
al
1465
38
1.
09
1430
21
0.
79
855
9
0 9
0
860
9
17
5
4610
77
7
6.3
1
01
O
SE 1
5
45
5
11
1.35
54
4
4
0.5
1
311
3
0.9
8
29
5
0
0
1605
18
2
0.7
0.8
7
2 10
16
5
2
0.5
8
171
I 0.3
3
84
1
1.09
10
5
I 1.
64
525
5
8 2
0.
61
3 15
13
9
5
1 64
15
9
2
0.7
3
82
1
1.09
52
0
0
43
2
8
7.0
1.14
4 20
18
2
6
1 44
15
1
0
0
98
3
2 8
8
92
1
1.96
52
3
10
8.3
12
0
5 25
19
7
6
1.39
19
1
6
1.85
14
8
3
1.85
15
1
3
3.45
6S
7
18
10 1
1.
78*
Toi
al
1138
30
1.
28
1216
13
0.6
7
72
3
11
14
7
69
5
5
13
0
3772
59
54
.2
1.09
All
sec
tors
1 5
6
76
12
0.9
2
80
9
10
0.8
0
49
6
4
0 8
7 4
80
1
0.3
9
2461
27
33 0
0.8
2
2 10
17
41
43
1.
09
2054
30
0.
82
1408
9
0.8
9
1486
12
1.
33
6689
94
10
1.3
0 9
3
3 15
67
42
197
1.
27**
*
6976
13
4
1.03
48
59
47
0 8
0
4636
24
0 8
0
23 2
13
40
2
373.
8 1.
08
4 20
23
28
58
1.08
2031
33
0.91
14
44
15
0.5
5
1525
18
1.
95**
73
28
124
116.
1
1.07
5 25
43
93
104
1.
03
4695
80
0 9
5
3419
35
0.8
1
3436
22
1.
01
15 9
43
241
247 3
0
.97
Tot
al
15 8
30
4
14
1.
14
15 8
36
287
0.9
6
11 6
26
110
0.8
0
11 5
63
77
1.06
55
634
88S
8
71
.5
1 02
a The
prob
abil
ity
of o
btai
ning
a n
umbe
r of
sti
llbi
rths
gre
ater
tha
n or
equa
l to
tha
t ob
serv
ed w
as'
wh
ere
i)/(ls
th
e ob
serv
ed n
umbe
r of
sti
llbi
rths
In
an
nu
lus
i an
d t
ime
peri
od j.
EIs
th
e ex
pect
ed n
um
ber
of
stil
lbir
ths
in a
nn
ulu
s/an
d ti
me
peri
od j
, es
lim
ated
fro
m t
he
logi
stic
reg
ress
ion
mod
el d
escr
ibin
g sl
illb
irth
rate
s in
Cum
bria
out
side
th
e 25
km
zon
e ar
ound
S
ella
fiel
d.
Dow
nloaded from https://academ
ic.oup.com/ije/article/27/1/74/813971 by guest on 15 January 2022
STILLBIRTH AROUND A NUCLEAR INSTALLATION 79
8 10 12 14 16Distance from Sellafield (km)
18 20 22 24
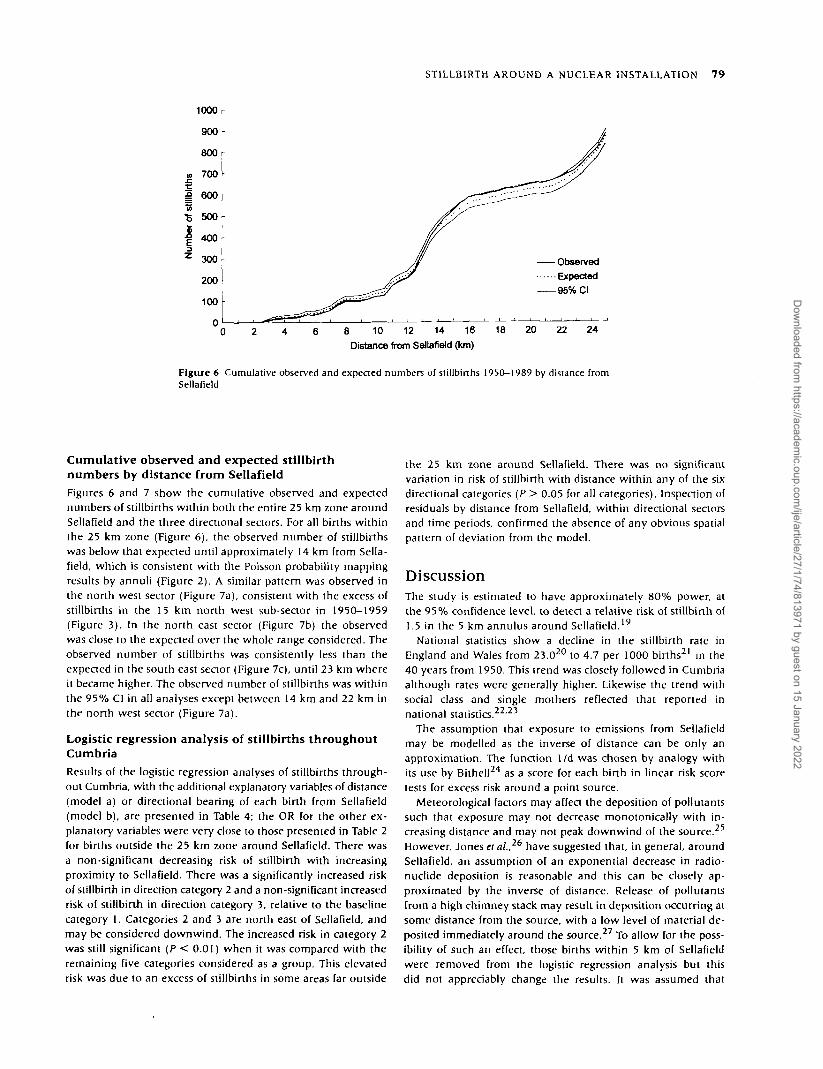
Figure 6 Cumulative observed and expeaed numbers of stillbinhs 1950-1989 by distance fromSellafield
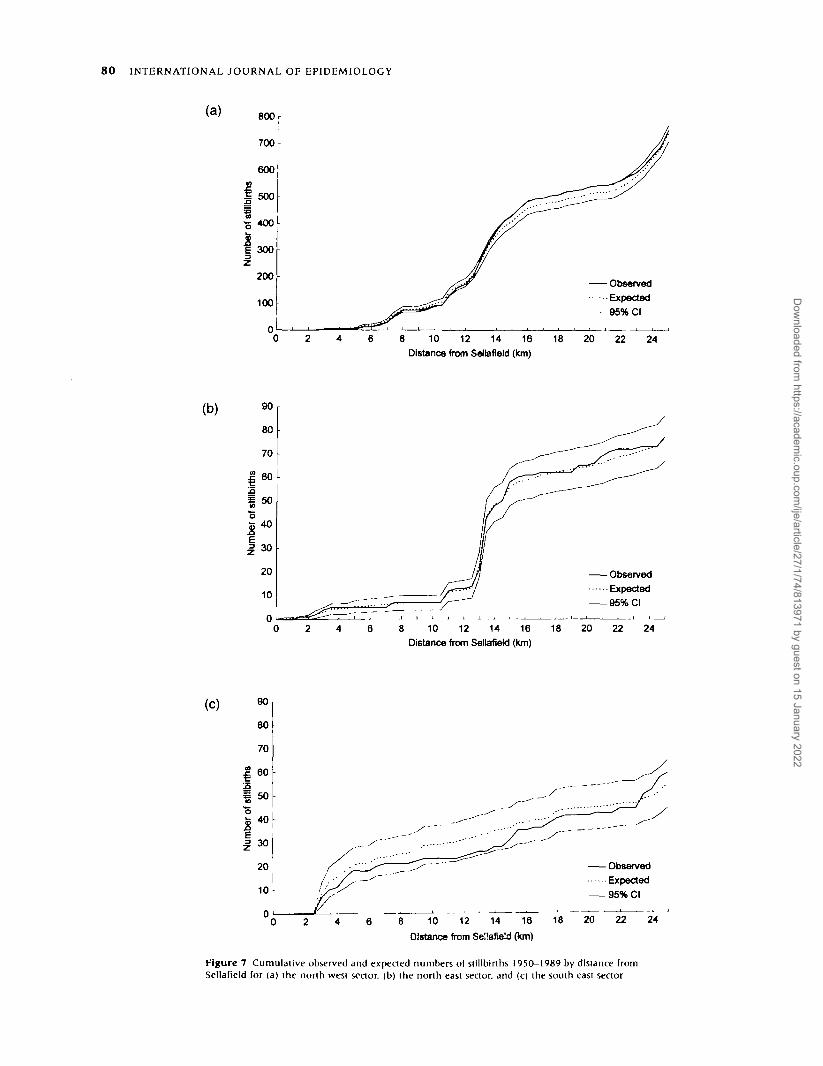
Cumulative observed and expected stillbirthnumbers by distance from SellafieldFigures 6 and 7 show the cumulative observed and expectednumbers of stillbinhs within both the entire 25 km zone aroundSellafield and the three directional sectors. For all binhs withinthe 25 km zone (Figure 6), the observed number of stillbirthswas below that expected until approximately 14 km from Sella-field, which is consistent with the Poisson probability mappingresults by annuli (Figure 2). A similar pattern was observed inthe nonh west sector (Figure 7a), consistent with the excess ofstillbinhs in the 15 km nonh west sub-sector in 1950-1959(Figure 3). In the north east sector (Figure 7b) the observedwas close to the expected over the whole range considered. Theobserved number of stillbinhs was consistently less than theexpected in the south east sector (Figure 7c), until 23 km whereit became higher. The observed number of stillbirths was withinthe 95% CI in all analyses except between 14 km and 22 km inthe nonh west sector (Figure 7a).
Logistic regression analysis of stillbirths throughoutCumbriaResults of the logistic regression analyses of stillbirths through-out Cumbria, with the additional explanatory variables of distance(model a) or directional bearing of each birth from Sellafield(model b), are presented in Table 4; the OR for the other ex-planatory variables were very close to those presented in Table 2for births outside the 25 km zone around Sellafield. There wasa non-significant decreasing risk of stillbirth with increasingproximity to Sellafield. There was a significantly increased riskof stillbirth in direaion category 2 and a non-significant increasedrisk of stillbirth in direction category 3, relative to the baselinecategory 1. Categories 2 and 3 are north east of Sellafield, andmay be considered downwind. The increased risk in category 2was still significant (P < 0.01) when it was compared with theremaining five categories considered as a group. This elevatedrisk was due to an excess of stillbirths in some areas far outside
the 25 km zone around Sellafield. There was no significantvariation in risk of stillbirth with distance within any of the sixdirectional categories (P > 0.05 for all categories). Inspection ofresiduals by distance from Sellafield, within directional sectorsand time periods, confirmed the absence of any obvious spatialpattern of deviation from the model.
DiscussionThe study is estimated to have approximately 80% power, atthe 95% confidence level, to detect a relative risk of stillbirth of1.5 in the 5 km annulus around Sellafield.19
National statistics show a decline in the stillbirth rate inEngland and Wales from 23.020 to 4.7 per 1000 births21 in the40 years from 1950. This trend was closely followed in Cumbriaalthough rates were generally higher. Likewise the trend withsocial class and single mothers reflected that reported innational statistics.2223
The assumption that exposure to emissions from Sellafieldmay be modelled as the inverse of distance can be only anapproximation. The function 1/d was chosen by analogy withits use by Bithell24 as a score for each birth in linear risk scoretests for excess risk around a point source.
Meteorological factors may affect the deposition of pollutantssuch that exposure may not decrease monotonically with in-creasing distance and may not peak downwind of the source.25
However, Jones ct al.,26 have suggested that, in general, aroundSellafield, an assumption of an exponential decrease in radio-nuclide deposition is reasonable and this can be closely ap-proximated by the inverse of distance. Release of pollutantsfrom a high chimney stack may result in deposition occurring atsome distance from the source, with a low level of material de-posited immediately around the source.27 To allow for the poss-ibility of such an effect, those binhs within 5 km of Sellafieldwere removed from the logistic regression analysis but thisdid not appreciably change the results. It was assumed that
Dow
nloaded from https://academ
ic.oup.com/ije/article/27/1/74/813971 by guest on 15 January 2022
80 INTERNATIONAL JOURNAL OF EPIDEMIOLOGY
(a) 800
700
600
I 500
•5 4«)
I 3003Z
200
100
ObservedExpected95% Cl
8 10 12 14 16
Distance from Seltafleld (km)
18 20 22 24
(b)
8 10 12 14 16
Distance from Sellafield (km)
20 22 24
(C)
°0 8 10 12 14 16
Distance from Sellafield (tan)
18 22 24
Figure 7 Cumulative observed and expeaed numbers of stillbirths 1950-1989 by distance fromSellafield for (a) the north west sector, (b) the north east sector, and (c) the south east sector
Dow
nloaded from https://academ
ic.oup.com/ije/article/27/1/74/813971 by guest on 15 January 2022
STILLBIRTH AROUND A NUCLEAR INSTALLATION 8 1
42
43
42
43
43
43
852
403
947
919
098
881
0.66
1.00
1.12
1.07
1.01
0.96
0.88
0.30-1.49
1.00-1.24
0.96-1 19
0.90-1.12
0.86-1.07
0.78-0.98
Table 4 Odds ratios for stillbirth by distance and direction of each birthfrom Sellafield for the whole of Cumbria, controlling for the effects ofyear of birth, social class and birth order
Explanatory variables No. of births Odds ratio 95% CI
Model a
Inverse of distance fromSellaQeld (km)
Model b
Direction from Sellafield
Category 1
Category 2
Category 3
Category 4
Category 5
Category 6
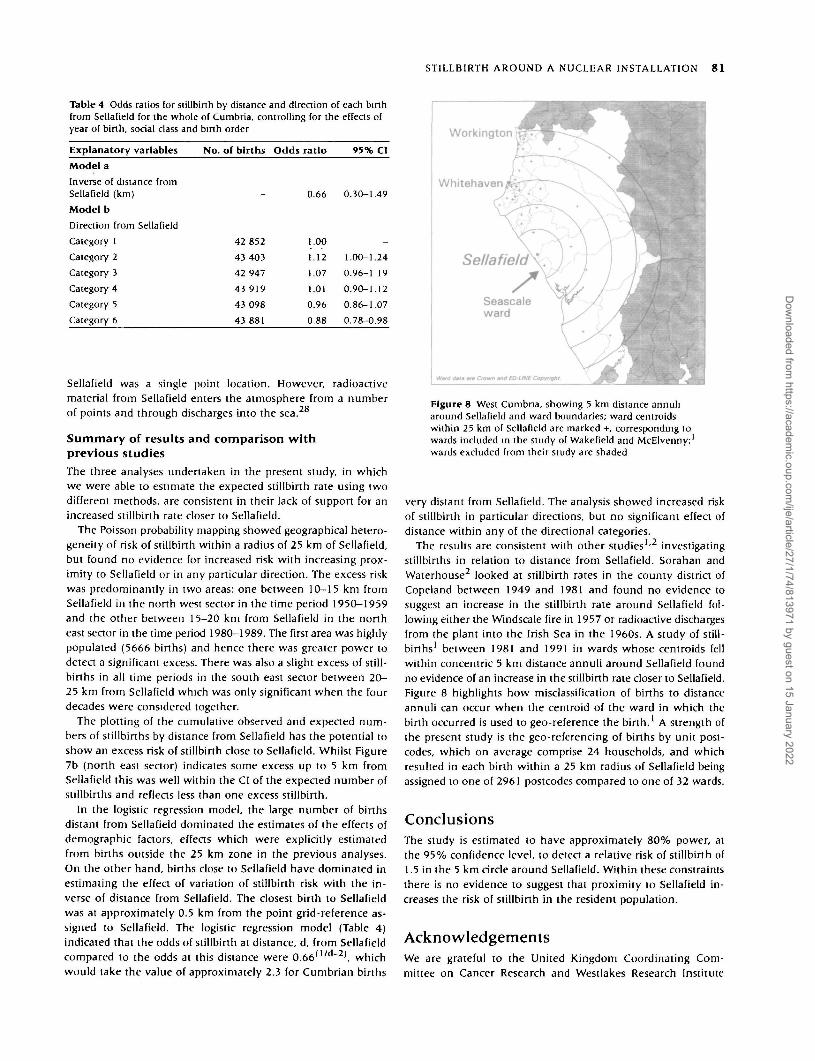
Sellafield was a single point location. However, radioactivematerial from Sellafield enters the atmosphere from a numberof points and through discharges into the sea.28
Summary of results and comparison withprevious studiesThe three analyses undertaken in the present study, in whichwe were able to estimate the expected stillbirth rate using twodifferent methods, are consistent in their lack of support for anincreased stillbirth rate closer to Sellafield.
The Poisson probability mapping showed geographical hetero-geneity of risk of stillbirth within a radius of 25 km of Sellafield,but found no evidence for increased risk with increasing prox-imity to Sellafield or in any particular direction. The excess riskwas predominantly in two areas: one between 10-15 km fromSellafield in the north west seaor in the time period 1950-1959and the other between 15-20 km from Sellafield in the northeast seaor in the time period 1980-1989. The first area was highlypopulated (5666 births) and hence there was greater power todetea a significant excess. There was also a slight excess of still-births in all time periods in the south east seaor between 20-25 km from Sellafield which was only significant when the fourdecades were considered together.
The plotting of the cumulative observed and expeaed num-bers of stillbirths by distance from Sellafield has the potential toshow an excess risk of stillbirth close to Sellafield. Whilst Figure7b (north east seaor) indicates some excess up to 5 km fromSellafield this was well within the CI of the expeaed number ofstillbirths and refleas less than one excess stillbirth.
In the logistic regression model, the large number of birthsdistant from Sellafield dominated the estimates of the effeas ofdemographic faaors, effeas which were explicitly estimatedfrom births outside the 25 km zone in the previous analyses.On the other hand, births close to Sellafield have dominated inestimating the effea of variation of stillbirth risk with the in-verse of distance from Sellafield. The closest birth to Sellafieldwas at approximately 0.5 km from the point grid-reference as-signed to Sellafield. The logistic regression model (Table 4)indicated that the odds of stillbirth at distance, d, from Sellafieldcompared to the odds at this distance were 0.66(1/d~2), whichwould take the value of approximately 2.3 for Cumbrian births
Figure 8 West Cumbna, showing 5 km distance annuliaround Sellafield and ward boundaries; ward centroidswithin 25 km of Sellafield are marked +, corresponding towards included in the study of Wakefield and McElvenny;'wards excluded from their study are shaded
very distant from Sellafield. The analysis showed increased riskof stillbirth in particular direaions, but no significant effea ofdistance within any of the direaional categories.
The results are consistent with other studies1'2 investigatingstillbirths in relation to distance from Sellafield. Sorahan andWaterhouse2 looked at stillbirth rates in the county district ofCopeland between 1949 and 1981 and found no evidence tosuggest an increase in the stillbirth rate around Sellafield fol-lowing either the Windscale fire in 1957 or radioaaive dischargesfrom the plant into the Irish Sea in the 1960s. A study of still-births1 between 1981 and 1991 in wards whose centroids fellwithin concentric 5 km distance annuli around Sellafield foundno evidence of an inaease in the stillbirth rate closer to Sellafield.Figure 8 highlights how misclassification of births to distanceannuli can occur when the centroid of the ward in which thebirth occurred is used to geo-reference the birth.1 A strength ofthe present study is the geo-referencing of births by unit post-codes, which on average comprise 24 households, and whichresulted in each birth within a 25 km radius of Sellafield beingassigned to one of 2961 postcodes compared to one of 32 wards.
ConclusionsThe study is estimated to have approximately 80% power, atthe 95% confidence level, to detea a relative risk of stillbirth of1.5 in the 5 km circle around Sellafield. Within these constraintsthere is no evidence to suggest that proximity to Sellafield in-creases the risk of stillbirth in the resident population.
AcknowledgementsWe are grateful to the United Kingdom Coordinating Com-mittee on Cancer Research and Westlakes Research Institute
Dow
nloaded from https://academ
ic.oup.com/ije/article/27/1/74/813971 by guest on 15 January 2022

82 INTERNATIONAL JOURNAL OF EPIDEMIOLOGY
who funded the project and to the North of England Children'sCancer Research Fund for the ongoing support it gives to theChildren's Cancer Research Unit, Newcastle. Birth registrationdata were supplied by the Office for National Statistics (formerlythe Office of Population Censuses and Surveys) and we aregrateful to them for their cooperation. We thank Dr John Bithell(University of Oxford), for many stimulating discussions, sug-gestions and comments on the manuscript. We are grateful toDr Adam Lawson and Mrs Christine Kinsella for their efforts inensuring the completeness of the ascertainment of stillbirths.We thank our colleagues Professor Alan Craft, Dr RichardWakeford and Mr Keith Binks for useful comments on themanuscript. We are grateful to Mrs Katharine Kirton for secret-arial assistance and to the data entry team in the Department ofChild Health, University of Newcastle, for their meticulous andpainstaking work in computerising the dataset. This work isbased on data provided with the support of the Economic andSocial Research Council and uses boundary material which iscopyright of the Crown. This paper contains maps based oncopyright digital map data owned and supplied by BartholomewLtd and is used with permission.
References1 Wakeford R, McElvenny DM. Stillbirth rates around Sellafield. Lancet
1994;344:550-51.2 Sorahan T, Waterhouse JAH. Stillbirth rates in the area around
Windscale, 1949-81. Br Med J 1984;288:148.
Compton Sir E. Great Britain. Local Government Boundary Commission for
England Reports London: HMSO, 1974.4 Births and Deaths Registration Aa, 1926.5 Births and Deaths Registration Aa, 1953
6 Breslow NE, Day NE. Statistical Methods in Cancer Research, Vol. I. TheAnalysis of Case-Control Studies Lyon: International Agency forResearch on Cancer, 1980.
7 Parker L, Craft AW, Smith J el al Geographical distribution ofpreconceptional radiation doses to fathers employed at the Sellafieldnuclear installation. West Cumbria. Br Med J 1993:307:966-71.
8 Parker L, Smith J, Dickinson HO et al. The creation of a database ofworkers at a nuclear facility: an exercise In record linkage. Appl OccupEnviron Hyg 1997; 12:40-45.
9 Royal Mail Postcode Services. Postcodes. Royal Mail, 1991.1 0 Royal Mail Postcode Services. Postzon. Portsmouth: National Postcode
Centre, 1992.
' ' Office of Population Censuses and Surveys. Standard OccupationalClassification, Vols 1, 2, 3. London: HMSO, 1990.
1 2 Environmental Systems Research Institute. Arc/Info version 7 0 3.California: Environmental Systems Research Institute, 1995.
1 3 StataCorp. Stata Statistical Software. Release 4.0. College Station, Texas:Stata Corporation, 1995.
14Choynowski M. Maps based on probabilities. J Am Statist Assoc 1958;
54:385-88.
"Cliff A, Haggett P Atlas of Disease Distribution Analytical Approaches toEpidemiological Data Oxford: Blackwell, 1988.
1 6 Meteorological Office. Meteorological Glossary. London: HMSO, 1991.1 7 Hosmer DW, Lemeshow S. Applied Logistic Regression. New York: Wiley,
1989.1 8 Pregibon D. Goodness of link tests for generalized linear models. Appl
Stat 1980:29:15-24.1 9 Breslow NE, Day NE. Statistical Methods in Cancer Research. Vol 11 The
Design and Analysis of Cohort Studies. Lyon International Agency forResearch on Cancer, 1987
2 0 Office of Population Censuses and Surveys. Birth Statistics England andWales (Series FM1 no 2). London: HMSO, 1975.
2 1 Boning B (ed ). The Health of Our Children Decennial Supplement. Officeof Population Censuses and Surveys (Senes DS no 11) London.HMSO, 1995.
2 2 Office of Population Censuses and Surveys Mortality Statistics—Child-hood and Maternity (Series DH3 no. 4) London: HMSO, 1977.
2 3 Office of Population Censuses and Surveys. Mortality Statistics—Perinatal and Infant Social and Biological Factors (Series DH3, nos 7, 9,13-15, 17, 18, 20-23) London: HMSO, 1978-1989.
2 4 Bithell JF, Dutton SJ, Draper GJ, Neary NM. Distribution of childhoodleukaemias and non-Hodgkin's lymphomas near nuclear installationsin England and Wales. Br Med J 1994:309:501-05.
2 5 Lawson A, Williams FLR Armadale: a case-study in environmentalepidemiology. J R Statist Soc Series A 1994:157:285-98.
2 6 Jones SR, Williams SM, Smith AD, Cawse PA, Baker SJ. Deposition ofactinides in the vicinity of Sellafield, Cumbria—accounting for his-torical discharges to atmosphere from the plant. 5n Total Environment1996:183:213-29.
2 7 Lawson AB, Waller LA. A review of point pattern methods for spatialmodelling of events around sources of pollution. Environmelrics 1996;7:471-87.
28Simmonds JR, Robinson CA, Phipps AW, Muirhead CR, Fry FA. Risksof Leukaemia and Other Cancers in Seascale from All Sources of IonisingRadiation Exposure NRPB R276. Didcol: National Radiological Protec-tion Board, 1995.
Dow
nloaded from https://academ
ic.oup.com/ije/article/27/1/74/813971 by guest on 15 January 2022