Classification systems for causes of stillbirth and ...
16
RESEARCH ARTICLE Open Access Classification systems for causes of stillbirth and neonatal death, 2009–2014: an assessment of alignment with characteristics for an effective global system Susannah Hopkins Leisher 1,2* , Zheyi Teoh 1 , Hanna Reinebrant 1,2 , Emma Allanson 3,4 , Hannah Blencowe 5 , Jan Jaap Erwich 2,6 , J. Frederik Frøen 7,8 , Jason Gardosi 9 , Sanne Gordijn 2,6 , A. Metin Gülmezoglu 3 , Alexander E. P. Heazell 2,10,11 , Fleurisca Korteweg 2,12 , Joy Lawn 5 , Elizabeth M. McClure 2,13 , Robert Pattinson 14 , Gordon C. S. Smith 15 , Ӧzge Tunçalp 3 , Aleena M. Wojcieszek 1,2 and Vicki Flenady 1,2 Abstract Background: To reduce the burden of 5.3 million stillbirths and neonatal deaths annually, an understanding of causes of deaths is critical. A systematic review identified 81 systems for classification of causes of stillbirth (SB) and neonatal death (NND) between 2009 and 2014. The large number of systems hampers efforts to understand and prevent these deaths. This study aimed to assess the alignment of current classification systems with expert-identified characteristics for a globally effective classification system. Methods: Eighty-one classification systems were assessed for alignment with 17 characteristics previously identified through expert consensus as necessary for an effective global system. Data were extracted independently by two authors. Systems were assessed against each characteristic and weighted and unweighted scores assigned to each. Subgroup analyses were undertaken by system use, setting, type of death included and type of characteristic. Results: None of the 81 systems were aligned with more than 9 of the 17 characteristics; most (82 %) were aligned with four or fewer. On average, systems were aligned with 19 % of characteristics. The most aligned system (Frøen 2009-Codac) still had an unweighted score of only 9/17. Alignment with individual characteristics ranged from 0 to 49 %. Alignment was somewhat higher for widely used as compared to less used systems (22 % v 17 %), systems used only in high income countries as compared to only in low and middle income countries (20 % vs 16 %), and systems including both SB and NND (23 %) as compared to NND-only (15 %) and SB-only systems (13 %). Alignment was higher with characteristics assessing structure (23 %) than function (15 %). (Continued on next page) * Correspondence: [email protected] 1 Mater Research Institute, The University of Queensland (MRI-UQ), Brisbane, Australia 2 International Stillbirth Alliance, Millburn, USA Full list of author information is available at the end of the article © The Author(s). 2016 Open Access This article is distributed under the terms of the Creative Commons Attribution 4.0 International License (http://creativecommons.org/licenses/by/4.0/), which permits unrestricted use, distribution, and reproduction in any medium, provided you give appropriate credit to the original author(s) and the source, provide a link to the Creative Commons license, and indicate if changes were made. The Creative Commons Public Domain Dedication waiver (http://creativecommons.org/publicdomain/zero/1.0/) applies to the data made available in this article, unless otherwise stated. Leisher et al. BMC Pregnancy and Childbirth (2016) 16:269 DOI 10.1186/s12884-016-1040-7
Transcript of Classification systems for causes of stillbirth and ...
Leisher et al. BMC Pregnancy and Childbirth (2016) 16:269 DOI 10.1186/s12884-016-1040-7
RESEARCH ARTICLE Open Access
Classification systems for causes ofstillbirth and neonatal death, 2009–2014:an assessment of alignment withcharacteristics for an effective globalsystem
Susannah Hopkins Leisher1,2*, Zheyi Teoh1, Hanna Reinebrant1,2, Emma Allanson3,4, Hannah Blencowe5,Jan Jaap Erwich2,6, J. Frederik Frøen7,8, Jason Gardosi9, Sanne Gordijn2,6, A. Metin Gülmezoglu3,Alexander E. P. Heazell2,10,11, Fleurisca Korteweg2,12, Joy Lawn5, Elizabeth M. McClure2,13, Robert Pattinson14,Gordon C. S. Smith15, Ӧzge Tunçalp3, Aleena M. Wojcieszek1,2 and Vicki Flenady1,2Abstract
Background: To reduce the burden of 5.3 million stillbirths and neonatal deaths annually, an understanding ofcauses of deaths is critical. A systematic review identified 81 systems for classification of causes of stillbirth (SB)and neonatal death (NND) between 2009 and 2014. The large number of systems hampers efforts to understand andprevent these deaths. This study aimed to assess the alignment of current classification systems with expert-identifiedcharacteristics for a globally effective classification system.
Methods: Eighty-one classification systems were assessed for alignment with 17 characteristics previously identifiedthrough expert consensus as necessary for an effective global system. Data were extracted independently by twoauthors. Systems were assessed against each characteristic and weighted and unweighted scores assigned to each.Subgroup analyses were undertaken by system use, setting, type of death included and type of characteristic.
Results: None of the 81 systems were aligned with more than 9 of the 17 characteristics; most (82 %) were alignedwith four or fewer. On average, systems were aligned with 19 % of characteristics. The most aligned system (Frøen2009-Codac) still had an unweighted score of only 9/17. Alignment with individual characteristics ranged from 0 to49 %. Alignment was somewhat higher for widely used as compared to less used systems (22 % v 17 %), systems usedonly in high income countries as compared to only in low and middle income countries (20 % vs 16 %), and systemsincluding both SB and NND (23 %) as compared to NND-only (15 %) and SB-only systems (13 %). Alignment washigher with characteristics assessing structure (23 %) than function (15 %).(Continued on next page)
* Correspondence: [email protected] Research Institute, The University of Queensland (MRI-UQ), Brisbane,Australia2International Stillbirth Alliance, Millburn, USAFull list of author information is available at the end of the article
© The Author(s). 2016 Open Access This article is distributed under the terms of the Creative Commons Attribution 4.0International License (http://creativecommons.org/licenses/by/4.0/), which permits unrestricted use, distribution, andreproduction in any medium, provided you give appropriate credit to the original author(s) and the source, provide a link tothe Creative Commons license, and indicate if changes were made. The Creative Commons Public Domain Dedication waiver(http://creativecommons.org/publicdomain/zero/1.0/) applies to the data made available in this article, unless otherwise stated.

Leisher et al. BMC Pregnancy and Childbirth (2016) 16:269 Page 2 of 16
(Continued from previous page)
Conclusions: There is an unmet need for a system exhibiting all the characteristics of a globally effectivesystem as defined by experts in the use of systems, as none of the 81 contemporary classification systemsassessed was highly aligned with these characteristics. A particular concern in terms of global effectiveness isthe lack of alignment with “ease of use” among all systems, including even the most-aligned. A system whichmeets the needs of users would have the potential to become the first truly globally effective classificationsystem.
Keywords: Stillbirth, Neonatal death, Perinatal death, Classification, Classification system, Cause
BackgroundClassification of the causes of the 5.3 million peri-natal deaths (stillbirths and neonatal deaths) thatoccur each year is critical to reducing these deaths; itincreases our understanding of underlying causes andenables comparison of causes within and betweencountries [1, 2]. In a related manuscript, we describea systematic review which identified 81 classificationsystems for causes of stillbirth and neonatal death (inaddition to the World Health Organization (WHO)International Classification of Diseases 10th revision(ICD-10)) that were created, modified, and/or usedbetween 2009 and 2014, all with widely varying char-acteristics. Stated reasons for system developmentincluded the need to add features and missingcategories, increase accuracy, reach new user groups,enable identification of underlying causes, and reducethe number of “unexplained” deaths [3].The review found that alignment of systems with
general principles of the ICD, the global standard forcause of death assignment and reporting, was some-what limited, with just 21 % of systems using ICDcodes. Systems were also found to have quite lowcoverage as measured by data from published reportsbetween 2009 and 2014 showing numbers of deathsclassified by each system, including in high-burdencountries. The majority of systems were used only inthe regions (high- or low/medium-income countries)where they had been developed.Data produced by different systems are often in-
compatible, hampering efforts to increase understand-ing of the global burden of specific causes ofperinatal deaths [4, 5]. In 2008, the WHO beganwork to rationalize the global approach to classifica-tion of causes of perinatal death. This approach, theICD for Perinatal Mortality, or ICD-PM, is now inthe testing phase [6]. As part of this effort, an itera-tive process to identify characteristics for an effectiveglobal classification system for causes of stillbirth (SB)and neonatal death (NND) was undertaken, and aglobal panel of experts in perinatal death classification
identified 17 such characteristics (reported in thisseries; see Wojcieszek et al. [7]).This is the second part of a two-part study. Part one
was a systematic review of classification systems forcauses of SB and NND created or used between 2009and 2014; results are presented in this series [3].The aim of the present study was to assess the align-
ment of identified classification systems against theexpert-identified characteristics in order to inform worktowards a globally effective approach for classification ofcauses of SB and NND.
MethodsSystems assessedEighty-one new, modified or used systems for SBand/or NND were identified through a systematicliterature review reported in this series (see [3] forthe methodology and results of this systematic review,including the PRISMA flowchart, and Additional file1 for details of included systems). Throughout thispaper, systems are referred to by first author and yearof publication of the source document, e.g. “DeGalan-Roosen 2002”, which is a standard way of labellingstudies in systematic reviews, i.e. Cochrane. The manyco-authors of some systems are named in the relevantcitation.
Outcome measures
1. Frequency of system alignment with individualcharacteristics for an effective global classificationsystem;
2. Weighted and unweighted scores measuringsystem alignment against the set of all 17characteristics.
The characteristics were those developed throughexpert consultation as reported by Wojcieszek et al.[7]. Ten characteristics related to systems’ structure,assessing comprehensiveness, relevance, validity, and

Leisher et al. BMC Pregnancy and Childbirth (2016) 16:269 Page 3 of 16
sufficiency of detail for understanding cause ofdeath. The remaining seven characteristics relatedto systems’ functioning, assessing reliability, accessi-bility, and value to users. In this paper, we assessalignment against the penultimate list of characteris-tics reported by Wojcieszek et al., which comprisedeight structural characteristics and nine functionalcharacteristics, as this was the format for whichweights (percent agreement by the expert panel) wereavailable.Following are definitions of some terms used in this
article:
� System: Any approach to classifying causes ofneonatal deaths and/or stillbirths that wasdescribed by authors of included papers as a“system” or “approach”, and/or that included aclearly delineated list of causes separated fromthe data.
� Modified system: Any system that was created asa result of making changes to an existing system,where:
� the system presented was described by theauthors as a modification of an existing system,or
� it was apparent that the system had beenmodified, despite the authors stating that thesystem was unchanged from its original form(e.g. different number of levels, number ofcategories at the top level, meaning ofcategories, etc.).
� New system: Any system that was created withoutmodifying an existing system.
� Used system: A system that was used for anypurpose (e.g. clinical, research) other thanpurely developmental (e.g. testing forreliability).
� Global system: Any system used to classify orestimate causes of stillbirths and neonataldeaths in all countries for which data isavailable.
� National system:∘ used by a national government for annual
reporting of causes for the majority (>50%)of SB and/or NND nationwide, or
∘ used by any research group (e.g. theUnited States Agency for InternationalDevelopment, USAID, or the United NationsChildren’s Fund, UNICEF) to classify causesof death
▪ as reported by Demographic and HealthSurveys (DHS) in at least one year, whereDHS data is assumed to be nationallyrepresentative, or
▪ of the majority (>50%) of SB and/or NNDthat occur in a country in at least one year,or
∘ otherwise stated to be a system developed onpurpose for national government use.
� Widely used system: any system used to classify1000+ deaths and/or in 2+ countries between 2009and 2014.
� Level: Some systems may have a single “level” ofcauses and other systems may have several levelsof causes, with the top level listing more generalcauses and each lower level listing sub-categorieswithin a given general cause. For example,classifying the cause of a SB or NND in a systemwith multiple levels would mean that a set ofcauses, from most general (taken from the toplevel) to most specific (taken from the lowest level),would be selected, e.g. “congenital anomaly” from thetop level and then more detail on that cause viaassignation of a sub-category at the next level down,e.g. “trisomy 13”.
Data collection and analysisRules were developed to extract variables to measure the17 characteristics using information available in pub-lished reports (see Table 1 for a summary of rules, andAdditional file 2 for greater detail).Each system was assessed for alignment with individ-
ual characteristics and categorized as either “aligned” or“not aligned”. Frequency of system alignment with indi-vidual characteristics was assessed. Overall system align-ment with the full set of 17 characteristics was assessedusing two measures: a weighted and an unweightedscore. The unweighted score for a system was calculatedby adding the total number of characteristics withwhich a system was aligned. The weighted score wasequal to the total of the weights for each characteris-tic with which the system was aligned, where theweights represented the percentage of experts whohad voted to include that characteristic, as reportedby Wojcieszek et al. ([7]). Thus, if all experts agreedto include a characteristic, its weight was 1, and if80 % agreed, its weight was 0.80. The maximum pos-sible unweighted and weighted scores were 17 and15.64, respectively.Sensitivity to cut-offs for quantitative variables was
assessed by reanalyzing system alignment at higher andlower cut-offs and comparing the resulting lists of most-aligned systems. Sensitivity analyses were also under-taken to determine the effect of excluding variablesjudged to measure a given characteristic less well

Table 1 Summary of how alignment was assessed
Characteristics Weight Variables used to assess alignment Aligned if Judgment of variable accuracyas a measure of alignment
Structural characteristics
1 A global system must use rules to ensurevalid assignment of cause of deathcategories
.98 Rules available? Yes Strong
2 A global system must be able to work withall levels of data (from both low-income andhigh-income countries), including minimallevels
.98 Yes for all threevariables
Used in both HIC and LMIC? Strong
Used with verbal autopsy? Strong
Used in >1 LMIC? Weak
3 A global system must ensure cause of deathcategories are relevant in all settings
.96 Used in both HIC and LMIC? Yes Weak
4 A global system must require associatedfactors to be recorded and clearlydistinguished from causes of death
.94 Yes for bothvariables below
Associated factors included? Strong
Distinguishes associated factorsfrom causes?
Strong
5 A global system must distinguish betweenantepartum and intrapartum conditions
.90 Distinguishes IP from AP? Yes Strong
6 A global system should record the level ofdata available to assign the cause of death(e.g. verbal autopsy only, placental histology,autopsy, etc.)
.86 Records type of data used? Yes Strong
7 A global system must have multiple levelsof causes of death, with a small number ofmain categories
.82 As below
Number of causes ≤10 Strong
Number of levels 2+ Strong
8 A global system must include a sufficientlycomprehensive list of categories to result ina low proportion of deaths classified as“other”
.80 % “other” Max <20 % Weak
Functional characteristics
9 A global system must be easy to use, andproduce data that are easily understood andvalued by users
1 As below
# deaths classified/# countriesof use
500+ cases and/or 2+ countries
Weak
Definitions available? Yes Weak
Rules available? Yes Weak
National? Yes Weak
10 A global system must have clear guidelinesfor use and definitions for all terms used
1 Yes for bothvariables below
Definitions available? Strong
Rules available? Strong
Leisher et al. BMC Pregnancy and Childbirth (2016) 16:269 Page 4 of 16

Table 1 Summary of how alignment was assessed (Continued)
11 A global system must produce data that canbe used to inform strategies to preventperinatal deaths
.96 As below
IP vs AP? Yes Weak
% “other” Max <20 % Weak
National? Yes Weak
12 A global system must require neonataldeaths to be clearly distinguished fromstillbirths
.94 Yes for bothvariables below
Distinguishes SB and NND? Strong
Separate categories for SBand NND?
Strong
13 A global system must have high inter- andintra-rater reliability
.94 Reliability testing? Yes; min ≥0.60 Strong
14 A global system must be available indifferent formats including inexpensiveehealth and mhealth options, and inmultiple languages
.92 Yes for bothvariables below
E-format? Strong
>1 language? Weak
15 A global system must allow easy access tothe data by the end-users
.92 Accessible data? Yes Weak
16 A global system must incorporate bothstillbirths and neonatal deaths
.86 Both SB and NND? Yes Strong
17 A global system must require the singlemost important factor leading to the deathto be recorded
.86 As below
Hierarchical? No or partially Weak
Only 1 cause allowed? Yes Strong
Includes FGR/IUGR/SGA? No Strong
Leisher et al. BMC Pregnancy and Childbirth (2016) 16:269 Page 5 of 16
(“weak” variables). For example, the variable recordingthe number of categories at the highest level of a systemwas judged to be particularly robust (“strong”) in meas-uring characteristic 7, which calls for systems to have asmall number of main categories, as data extraction wasstraightforward. On the other hand, the variable record-ing whether a system was available in more than onelanguage was judged to be less robust (“weak”) in measur-ing characteristic 14, since it was possible that we hadmissed systems in languages not commonly found in thedatabases searched for the systematic literature review.The maximum possible unweighted and weighted scoresusing “strong” variables only were 12 and 11, respectively.Subgroup analyses were undertaken to explore dif-
ferences in alignment according to: (i) type of death in-cluded (SB only, NND only, or both); (ii) systems thatwere widely vs less used (a widely used system was de-fined as any system used to classify 1000 or more deathsand/or used in two or more countries between 2009 and2014; details presented in [3]); (iii) region of use accord-ing to World Bank country classification (HIC vs LMIC)
[8]; and (iv) type of characteristic (functional vs struc-tural). For the type of characteristic, mean unweightedscores for alignment of all systems with functional andstructural characteristics were calculated (with max-imum possible scores of 9 and 8, respectively).Data were entered into in Stata/IC 12.1 for analysis
of frequency distributions. System developers who areco-authors were excluded from data extraction andanalysis.
ResultsOverall alignmentThe range of unweighted scores for system alignment withthe 17 expert-identified characteristics for an effective glo-bal system was 0 to 9 out of a maximum possible score of17, meaning that none of the 81 systems was aligned withmore than 9 of these characteristics (see Table 2). Mostsystems (82 %) were aligned with four or fewer character-istics. The range of weighted scores for system alignmentwith the characteristics was 0 to 7.94 out of a maximum

Table 2 Weighted and unweighted scores measuring system alignment against expert-identified characteristics
Score using all variables Score using “strong” variables only
Unweighted Weighted Unweighted Weighted
Maximum possible score 17 15.64 12 11.00
Froen 2009-Codac [9] 9 7.94 8 7.14
Korteweg 2006-Tulip [10] 7 6.20 6 5.40
Black 2010-CHERG [11] 6 5.50 3 2.82
Cole 1986 [12] 6 5.48 5 4.52
Flenady 2009-PSANZ-PDC [13] 6 5.50 5 4.54
Kotecha 2014-Wales [14] 6 5.42 4 3.70
Ujwala 2012 [15] 6 5.18 5 4.38
Chan 2004-PSANZ-NDC [23] 5 4.46 4 3.66
Kidanto 2009 [24] 5 4.38 5 4.38
Lawn 2006-CHERG [25] 5 4.72 4 3.82
Manning 2013-maternal & fetal-Ireland [26] 5 4.52 4 3.60
Pattinson 1989 [27] 5 4.58 4 3.78
Schmiegelow 2012 [28] 5 4.42 5 4.42
Varli 2008-Stockholm [29] 5 4.58 4 3.78
Wigglesworth 1980 [30] 5 4.46 3 2.70
Abdellatif 2013 [31] 4 3.34 3 2.54
CMACE 2010-maternal & fetal [32] 4 3.60 4 3.60
CMACE 2010-neonatal [32] 4 3.46 3 2.66
de Galan-Roosen 2002 [16] 4 3.48 4 3.48
Engmann 2012 [33] 4 3.46 3 2.66
Flenady 2009-PSANZ-NDC [13] 4 3.58 3 2.78
Gardosi 2014-MAINa 4 3.52 4 3.52
Gordijn 2009 [18] 4 3.68 4 3.68
Khanum 2009 [34] 4 3.42 3 2.62
Kidron 2009 [35] 4 3.78 4 3.78
McClure 2015 [42]b 4 3.74 5 4.60
Mo-Suwan 2009 [36] 4 3.52 4 3.52
MRC 2002-PPIP-South Africa [37] 4 3.52 3 2.72
National Services Scotland 2013-neonatal [38] 4 3.40 2 1.68
NIPORT 2005-Bangladesh [39] 4 3.70 2 1.98
Shah 2011 [40] 4 3.60 4 3.66
Van Diem 2010 [41] 4 3.46 3 2.66
VanderWielen 2011-WiSSP [42] 4 3.60 4 3.60
Wood 2012 [43] 4 3.44 4 3.44
Basys 2014-Lithuania [44] 3 2.58 3 2.58
Chan 2004-PSANZ-PDC [23] 3 2.84 3 2.84
CMACE 2011-maternal & fetal [45] 3 2.62 3 2.62
Cole 1989-ICE [46] 3 2.84 3 2.84
De Reu 2009-Tulip mod. [47] 3 2.52 2 1.72
Froen 2009-simplified Codac [9] 3 2.54 3 2.54
Gardosi 2005-ReCoDe [48] 3 2.76 2 1.80
Glinianaia 2010 [49] 3 2.52 2 1.72
Leisher et al. BMC Pregnancy and Childbirth (2016) 16:269 Page 6 of 16
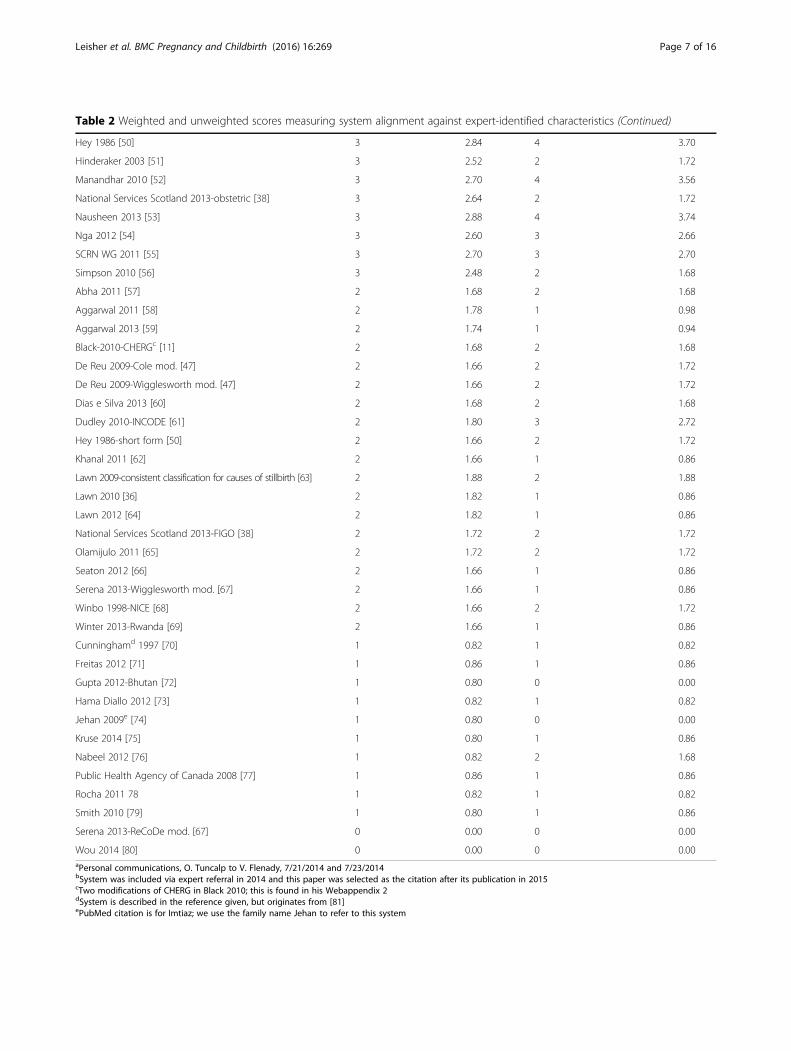
Table 2 Weighted and unweighted scores measuring system alignment against expert-identified characteristics (Continued)
Hey 1986 [50] 3 2.84 4 3.70
Hinderaker 2003 [51] 3 2.52 2 1.72
Manandhar 2010 [52] 3 2.70 4 3.56
National Services Scotland 2013-obstetric [38] 3 2.64 2 1.72
Nausheen 2013 [53] 3 2.88 4 3.74
Nga 2012 [54] 3 2.60 3 2.66
SCRN WG 2011 [55] 3 2.70 3 2.70
Simpson 2010 [56] 3 2.48 2 1.68
Abha 2011 [57] 2 1.68 2 1.68
Aggarwal 2011 [58] 2 1.78 1 0.98
Aggarwal 2013 [59] 2 1.74 1 0.94
Black-2010-CHERGc [11] 2 1.68 2 1.68
De Reu 2009-Cole mod. [47] 2 1.66 2 1.72
De Reu 2009-Wigglesworth mod. [47] 2 1.66 2 1.72
Dias e Silva 2013 [60] 2 1.68 2 1.68
Dudley 2010-INCODE [61] 2 1.80 3 2.72
Hey 1986-short form [50] 2 1.66 2 1.72
Khanal 2011 [62] 2 1.66 1 0.86
Lawn 2009-consistent classification for causes of stillbirth [63] 2 1.88 2 1.88
Lawn 2010 [36] 2 1.82 1 0.86
Lawn 2012 [64] 2 1.82 1 0.86
National Services Scotland 2013-FIGO [38] 2 1.72 2 1.72
Olamijulo 2011 [65] 2 1.72 2 1.72
Seaton 2012 [66] 2 1.66 1 0.86
Serena 2013-Wigglesworth mod. [67] 2 1.66 1 0.86
Winbo 1998-NICE [68] 2 1.66 2 1.72
Winter 2013-Rwanda [69] 2 1.66 1 0.86
Cunninghamd 1997 [70] 1 0.82 1 0.82
Freitas 2012 [71] 1 0.86 1 0.86
Gupta 2012-Bhutan [72] 1 0.80 0 0.00
Hama Diallo 2012 [73] 1 0.82 1 0.82
Jehan 2009e [74] 1 0.80 0 0.00
Kruse 2014 [75] 1 0.80 1 0.86
Nabeel 2012 [76] 1 0.82 2 1.68
Public Health Agency of Canada 2008 [77] 1 0.86 1 0.86
Rocha 2011 78 1 0.82 1 0.82
Smith 2010 [79] 1 0.80 1 0.86
Serena 2013-ReCoDe mod. [67] 0 0.00 0 0.00
Wou 2014 [80] 0 0.00 0 0.00aPersonal communications, O. Tuncalp to V. Flenady, 7/21/2014 and 7/23/2014bSystem was included via expert referral in 2014 and this paper was selected as the citation after its publication in 2015cTwo modifications of CHERG in Black 2010; this is found in his Webappendix 2dSystem is described in the reference given, but originates from [81]ePubMed citation is for Imtiaz; we use the family name Jehan to refer to this system
Leisher et al. BMC Pregnancy and Childbirth (2016) 16:269 Page 7 of 16

Table 3 System alignment with expert-identified characteristics for an effective global classification system for causes of stillbirthand neonatal death
Characteristics % consensus % systems in alignment with each characteristic
All (81) Widelyuseda (27)
Lessused (54)
Used in HIConly (36)
Used in LMIConly (32)
SB-onlysystems (15)
NND-onlysystems (26)
Combinedsystems (NNDand SB) (40)
Structural
1 A global system must userules to ensure validassignment of cause ofdeath categories.
98 % 41 % 52 % 35 % 44 % 28 % 53 % 35 % 40 %
2 A global system must beable to work with alllevels of data (fromboth low-income andhigh-income countries),including minimal levels.
98 % 3 % 7 % 0 % 0 % 0 % 0 % 8 % 0 %
3 A global system mustensure cause of deathcategories are relevant inall settings.
96 % 10 % 30 % 0 % 0 % 0 % 7 % 15 % 8 %
4 A global system mustrequire associated factorsto be recorded and clearlydistinguished from causesof death.
94 % 14 % 19 % 11 % 17 % 13 % 7 % 8 % 20 %
5 A global system mustdistinguish betweenantepartum andintrapartum conditions.
90 % 20 % 19 % 20 % 22 % 16 % 20 % 0 % 33 %
6 A global system shouldrecord the level of dataavailable to assign thecause of death (e.g. verbalautopsy only, placentalhistology, autopsy, etc.).
86 % 9 % 19 % 4 % 19 % 0 % 7 % 4 % 13 %
7 A global system musthave multiple levels ofcauses of death, with asmall number of maincategories.
82 % 40 % 33 % 43 % 33 % 44 % 33 % 42 % 40 %
8 A global system mustinclude a sufficientlycomprehensive list ofcategories to result in alow proportion of deathsclassified as “other”.
80 % 48 % 52 % 46 % 53 % 53 % 27 % 65 % 45 %
Functional
9 A global system must beeasy to use, and producedata that are easilyunderstood and valuedby users.
100 % 0 % 0 % 0 % 0 % 0 % 0 % 0 % 0 %
10 A global system musthave clear guidelines foruse and definitions for allterms used.
100 % 17 % 15 % 19 % 17 % 16 % 20 % 19 % 15 %
11 A global system mustproduce data that can beused to inform strategiesto prevent perinataldeaths.
96 % 0 % 0 % 0 % 0 % 0 % 0 % 0 % 0 %
Leisher et al. BMC Pregnancy and Childbirth (2016) 16:269 Page 8 of 16

Table 3 System alignment with expert-identified characteristics for an effective global classification system for causes of stillbirthand neonatal death (Continued)
12 A global system mustrequire neonatal deathsto be clearly distinguishedfrom stillbirths.
94 % 5 % 7 % 4 % 0 % 9 % 0 % 0 % 10 %
13 A global system musthave high inter- andintra-rater reliability.
94 % 7 % 11 % 6 % 8 % 6 % 7 % 0 % 13 %
14 A global system must beavailable in differentformats includinginexpensive ehealth andmhealth options, and inmultiple languages.
92 % 0 % 0 % 0 % 0 % 0 % 0 % 0 % 0 %
15 A global system mustallow easy access to thedata by the end-users.
92 % 10 % 11 % 9 % 14 % 6 % 0 % 12 % 13 %
16 A global system mustincorporate both stillbirthsand neonatal deaths.
86 % 49 % 48 % 50 % 56 % 44 % 0 % 0 % 100 %
17 A global system mustrequire the single mostimportant factor leadingto the death to berecorded.
86 % 47 % 52 % 44 % 50 % 41 % 33 % 50 % 50 %
a“Widely used”: systems used in more than one country and/or to classify 1000 or more deaths
Leisher et al. BMC Pregnancy and Childbirth (2016) 16:269 Page 9 of 16
possible score of 15.64; by this measure, systems werealigned with 19 % of characteristics on average (equivalentto an average weighted score of 2.82).The most aligned of the 81 systems was Frøen 2009-
Codac [9], with an unweighted score of 9 and a weightedscore of 7.94. The next most aligned system was Korteweg2006-Tulip [10], with an unweighted score of 7 and aweighted score of 6.20.
Fig. 1 Percent of systems aligned with expert-identified characteristics forrefer to sequence of characteristics in Table 1
Five systems were next most aligned with the 17 expert-identified characteristics, according to both unweighted andweighted scores. These were Black 2010-CHERG [11], Cole1986 [12], Flenady 2009-PSANZ-PDC [13], Kotecha 2014-Wales [14], and Ujwala 2012 [15]. All were aligned with 6out of the 17 characteristics (i.e., an unweighted score of 6);they had weighted scores of 5.50, 5.48, 5.50, 5.42, and 5.18,respectively.
an effective global system. Note: Numbers in front of characteristics

Leisher et al. BMC Pregnancy and Childbirth (2016) 16:269 Page 10 of 16
This group of seven most aligned systems includedone global system and two national systems (used inAustralia, New Zealand, and Wales). All but one (Black2010-CHERG) were used for classifying both SB andNND. All but one (Cole 1986) were developed from2006 onward. All but Kotecha 2014-Wales and Ujwala2012 were “widely used” by our definition.
Characteristics with greatest and least alignmentSystem alignment with individual characteristics rangedfrom 0 to 49 % (see Table 3 and Fig. 1 for details). Therewere only five characteristics with which systems werehighly aligned (i.e., 40 % or more systems aligned): (1)forty systems (49 %) were aligned with the requirementto incorporate both stillbirths and neonatal deaths, withLMIC-only systems somewhat less aligned than HIC-only systems (44 % v 56 %); (ii) just under half thesystems were aligned with the requirement to produce alow proportion of deaths classified as “other”, withalignment particularly high for the NND-only systems ascompared to the SB-only systems (65 % v 27 %); (iii) alsojust under half the systems were aligned with the re-quirement to record the single most important factorleading to death, with alignment of SB-only systemssomewhat lower than for NND-only systems (33 % v50 %); (iv) thirty-three systems (41 %) were aligned withthe requirement to use rules for valid assignment ofcause of death, a feature that was more common amongwidely used than less used systems (52 % v 35 %),HIC-only than LMIC-only systems (44 % v 28 %), andSB-only than NND-only systems (53 % v 35 %); and(v) thirty-two systems (40 %) were aligned with the re-quirement to have multiple levels and a small number ofcauses at the top level.Alignment was 10 % or lower for nine characteristics:
(i) just eight of the 81 systems (10 %) were aligned withthe requirement that systems use categories that are“relevant in all settings” (the exact characteristic is “Aglobal system must ensure cause of death categories arerelevant in all settings”), including 8 of the 27 widelyused systems (30 %) and 4 of the 26 NND-only systems(15 %); (ii) eight systems were aligned with the require-ment to allow end-users easy access to the data, includ-ing five of the 36 HIC-only systems and three of the 26NND-only systems; (iii) seven systems (9 %) werealigned with the requirement to record the type of dataused to assign cause of death, including seven of the 36systems used only in HIC (19 %); (iv) six systems (7 %)were aligned with the requirement that systems have highreliability, including five of the 40 systems classifying bothSB and NND; (v) four systems (5 %) were aligned with therequirement that systems distinguish NND from SB;(vi) two systems were aligned with the requirement thatsystems be able to work with data from LMIC as well as
HIC settings; and (vii) no systems were aligned with therequirements that systems produce data that can be usedto inform strategies to prevent death, be easy to useand produce easily understood data, and be accessible(available online and in multiple languages).
Subgroup analysesAlignment according to type of death classifiedAlignment according to type of death classified (SB only,NND only, or both) was broadly similar to overall align-ment (see Table 3). The 26 NND-only systems had anaverage unweighted score of 2.58, meaning they werealigned with an average of 15 % of the 17 characteristics;the 15 SB-only systems were aligned with 13 % of the 17characteristics on average, and the 40 combined systemswith 23 % (data not shown).Alignment with the eight structural characteristics was
generally similar for SB-only, NND-only and combined(SB and NND) systems, but different for the ninefunctional characteristics, with the 15 SB-only systemshaving an average unweighted score of just 0.60 (meaningthey were aligned with just 0.60 of these characteristics onaverage) and the 26 NND-only systems aligned with just0.81, whereas the 40 combined systems were aligned with2.00 of these characteristics on average.Alignment with individual characteristics also varied
somewhat according to type of death classified. Otherthan characteristics requiring certain types of deaths tobe included (e.g. the one requiring intrapartum andantepartm SB to be distinguished), alignment variedmost strongly for the characteristic which requires sys-tems to have a low proportion of deaths classified as“other”: four out of the 15 SB-only systems, or 27 %, and17 out of the 26 NND-only systems, or 65 %, werealigned. Systems including both types of death weremore aligned with the requirement to include associatedfactors (20 %, v 7 % for SB-only systems and 8 % forNND-only systems). NND-only systems were leastaligned with the requirement to use rules for assigningcause of death (35 %, v 40 % for combined systems and53 % for SB-only systems), while NND-only and com-bined systems were both more aligned with the require-ment to record the single most important factor leadingto death—50 %, as opposed to 33 % for SB-only systems.
Alignment of widely used systemsThe 27 widely used systems were somewhat morealigned than the 54 less used systems with all 17 charac-teristics, with an average unweighted score of 3.74(aligned with an average of 22 % of the characteristics)as compared to 2.91 (aligned with an average of 17 %).Widely used systems were also more aligned with theeight structural characteristics than less used systems,with an average unweighted score of 2.30 as compared

Leisher et al. BMC Pregnancy and Childbirth (2016) 16:269 Page 11 of 16
to 1.59; the main differences related to characteristics re-quiring rules for use, globally relevant categories, and re-cording of the type of data used to assign cause of death.Widely and less used systems were similar in terms ofalignment with the nine functional characteristics.
Alignment by region of useSystems used only in HIC and only in LMIC had gener-ally similar alignment with the 17 characteristics (withaverage unweighted scores of 3.33 and 2.75, representing20 % and 16 % of the maximum possible score, respect-ively). Alignment was also similar for structural andfunctional characteristics considered separately, thoughHIC-only systems were slightly more aligned within eachgroup: HIC-only systems were aligned with 24 % of theeight structural characteristics and 16 % of the nine func-tional characteristics; the figures for LMIC-only systemswere 19 % and 14 %, respectively. Systems used only inHIC were more aligned with the characteristics requiringsystems to use rules to assign cause of death and to recordthe type of data used to assign cause of death.
Alignment by type of characteristicOn average, systems had a mean unweighted score of1.83 for alignment with the eight characteristics asses-sing systems’ structure (equivalent to alignment with23 % of these characteristics) and 1.36 of the nine char-acteristics assessing systems’ functioning (equivalent toalignment with 15 % of these characteristics).
Sensitivity analysisThe results of sensitivity analyses (see Methods andAdditional file 3 for details) show that Frøen 2009-Codac remained the most-aligned system even whenrestricting the alignment assessment to only the “strong”variables, with an unweighted score of 8 out of a max-imum possible score of 12 (meaning that it was alignedwith 67 % of characteristics measured by “strong” vari-ables), and a weighted score of 7.14 out of a maximumpossible 11 (aligned with 65 % of characteristics measuredby “strong” variables when weighting was applied). Simi-larly, Korteweg 2006-Tulip remained the second-most-aligned system even with the restricted analysis, with anunweighted score of 6 and a weighted score of 5.40.Three other systems were also among the highest scor-
ing independently of whether weaker variables were in-cluded or not: Cole 1986, Flenady 2009-PSANZ-PDC,and Ujwala 2012, with unweighted scores using only“strong” variables of 5 for each of these systems, andweighted scores of 4.52, 4.54, and 4.38, respectively.Results of sensitivity testing for different cut-offs for
quantitative variables used to assess alignment withcharacteristics 7, 8 and 13 showed that the number ofaligned systems was not very sensitive to the cut-offs
assessed (see Table 1 for list of characteristics andAdditional file 3 for details).
DiscussionThis study is the first to apply characteristics for an ef-fective global classification system, as identified by anexternal panel of experts, to a set of classification sys-tems for causes of SB and NND that were identifiedthrough a comprehensive, systematic literature reviewwithout language limits, and which included modifica-tions as well as new systems. We found that classifica-tion systems for causes of stillbirth and neonatal deathwere overall poorly aligned with expert-identified char-acteristics; no system was aligned with more than 9 of17 characteristics. This lack of alignment of current sys-tems with the characteristics of an “ideal” classificationsystem for causes of perinatal death may contribute tothe ongoing development of new and modified systemsat the rate of ten a year for the previous five years, pos-sibly hindering the potential for widespread acceptanceof one classification system.Several researchers have previously assessed classifica-
tion systems against various characteristics for an effect-ive system. De Galan-Roosen 2002 assessed 12 systems,including four included in our study (the Wigglesworth1980, Cole 1986, Hey 1986, and de Galan-Roosen 2002itself ), against seven characteristics, four of which aresimilar to our expert-identified characteristics (reliability,explanation of underlying cause, inclusion of both SBand NND, and the percent of “unclassifiable” deaths)[16]. Flenady 2009 assessed six systems, five of which areincluded in our study (Cole 1986, Flenady 2009-PSANZ-PDC, Gardosi 2005-ReCoDe, Korteweg 2006-Tulip andFrøen 2009-Codac) against three characteristics, two ofwhich are included among our expert-identified charac-teristics (ease of use and reliability) [82]. Frøen 2009assessed 11 systems, at least six of which were includedin our study (versions of Aberdeen and Pattinson werealso included but the version is unknown), against sevencharacteristics, four of which are included among ourexpert-identified characteristics (number of categoriesper level, whether underlying cause is identified, whattype of data are required for use, and reliability) [17].The previous most comprehensive review we are awareof, Gordijn, assessed 35 systems, of which we have in-cluded 12, against six characteristics, only one of whichis included among the expert characteristics (number ofcauses per level) [18].De Galan [16] found that their own system was most
in alignment with the characteristics they considered,followed by the Hovatta system [19]; Flenady 2009 foundthat Frøen 2009-Codac, Flenady 2009-PSANZ-PDC andGardosi 2005-ReCoDe performed best overall; and Frøen2009 found that Flenady 2009-PSANZ-PDC and Frøen

Leisher et al. BMC Pregnancy and Childbirth (2016) 16:269 Page 12 of 16
2009-Codac were most in compliance with the charac-teristics reviewed, while Korteweg 2006-Tulip wouldrequire only modest modification (a new category forintrapartum) to become compliant. Gordijn stated that“each system [reviewed] has its own strengths andweaknesses”, and proposed combining existing systemsto capitalize on their strengths so as to produce a newapproach that would be well-aligned with key character-istics for an effective system.A major difference between this study and prior re-
views was our approach of assessing overall alignment ofa comprehensively identified set of systems using aweighted scoring system against characteristics devel-oped transparently by an external panel of experts. Des-pite this difference, we also identified Frøen 2009-Codacas the most aligned with expert characteristics for aneffective global system, according to both unweightedand weighted scoring and regardless of whether we in-cluded only “strong” variables in the assessment or not.Four other systems were also consistently identified asamong the most-aligned regardless of the scoring ap-proach: Korteweg 2006-Tulip, which was consistentlythe second-most-aligned system, and Flenady 2009-PSANZ-PDC, Cole 1986, and Ujwala 2012. These resultsare similar to the findings of the Flenady and Frøen re-views [17, 82].The concordance of these reviews may indicate under-
lying strengths of these systems, but must also beregarded in light of our finding of poor alignment evenamong the most aligned systems. We therefore suggestthat rather than “best” systems, we have instead identi-fied the most-aligned of a group that still lacks someessential features needed for effective global use. For in-stance, Frøen 2009-Codac, which we found to be themost-aligned system, and which was recently adopted bythe UK for use in its national perinatal mortality surveil-lance, has shown a high proportion of stillbirths classi-fied with “unknown” as the primary cause of death (47 %and 46 % from the first two annual reports in 2013 and2014, respectively) [20, 21]. This high rate of “unknown”stillbirths using Codac in a high-income country has oc-curred despite education and training for the designatedhospital-based staff who submit the data. However, dis-aggregation of the data (as the “unknown” category inCodac includes subcategories of both “unexplained”deaths despite thorough investigation, and “unknown”deaths with insufficient investigation or documentation)could help indicate the need for improved investigationof stillbirths as well as areas in need of strengtheningwithin the system itself.This example highlights the fact that while education
and training for system implementation are necessary,they may not be sufficient to classify causes of perinataldeath adequately. There remains a need for a system
that is fully aligned with expert-identified characteristicsfor an effective global solution, notably including align-ment with characteristics calling for the ability to workwith all levels of data, from both HIC and LMIC set-tings, “ease of use”, and the production of data that “canbe used to inform strategies to prevent perinatal death”.It might be expected that a globally effective system
would be aligned with the characteristics we found to havehighest alignment among identified systems—hence, thatit would provide rules for use, have multiple levels and asmall number of categories at the top level, produce nomore than 20 % of deaths classified as “other”, includeboth SB and NND, and record the single most importantfactor leading to death. Such a system would stand outfrom existing systems for also being aligned with the char-acteristics we found to have lowest alignment overall, inparticular, the three characteristics absent from all systems(that systems should be easy to use and produce easilyunderstandable data, produce data that can be used to in-form strategies to prevent perinatal death, and be availablein ehealth and mhealth options and in multiple lan-guages). Having these features would strongly distinguishany new system from the rest.Development of a globally effective system may also
benefit from reference to systems that we identified asmore aligned, despite their low alignment ratings overall.For instance, Frøen 2009-Codac was alone among themore aligned systems in providing a link for users to ac-cess data that are produced by the system. There areseven other systems we found which provide this access,one global and all the rest national systems. It may alsobe of interest to examine the characteristics of thenational systems we found that are more aligned. Inaddition to being used nationally, these two systems(Kotecha 2014-Wales and Flenady 2009-PSANZ-PDC)were both aligned with two characteristics: they providedrules for use, and they included both SB and NND. Aglobally effective system might therefore stand apartfrom the large number of existing systems if it also borethese characteristics.That combined systems (those incorporating both SB
and NND) were somewhat more aligned than SB-onlyand NND-only systems may be a reflection of the weightplaced upon this feature within the assessment me-thodology, with two characteristics dependent upon it(requiring SB to be distinguished from NND, and requir-ing inclusion of both types of death). An effective globalsystem must incorporate both SB and NND. Given thesomewhat greater alignment of the 27 widely used sys-tems, it may also be of interest to note key features ofthese, which included identification of the single mostimportant factor leading to death, greater availability ofrules for use, definitions for some or all causes of death,and allowing associated factors to be recorded [3]. The

Leisher et al. BMC Pregnancy and Childbirth (2016) 16:269 Page 13 of 16
slightly higher alignment of systems used only in HIC ascompared to only in LMIC could point to a need forparticularly careful implementation of a system intendedto be globally effective, in order to identify and addressany differences in functioning, acceptance, access, or in-terpretation across settings.Given the finding of overall lower alignment with func-
tional as compared to structural characteristics, attentionshould also be paid to ensuring a new system exhibitssome of the key functional characteristics, including reli-ability (systems scored low on this more due to the lack ofany reliability testing than to low Kappa scores) and acces-sibility (systems scored low on this due to lack of avail-ability online and in multiple languages).Another approach that may be of use to policy makers
and public health officials in low-resource settings seekingto apply the results of this research would be to prioritizethe characteristics and work toward alignment of theirclassification systems to the higher-priority ones first. Dur-ing the process of identifying characteristics [7], panellistswere not asked to rank them, rather, to indicate their levelof agreement that a given characteristic was important fora globally effective system. Hence, each characteristic wasjudged on its own merit, not in conjunction with othercharacteristics. With an agreed cut-off of 80 % of morepanellists stating “agree” or “strongly agree” with the char-acteristic’s importance for a globally effective system, 17characteristics were ultimately selected. The percent agree-ment (shown in Table 1 as the weights for each cha-racteristic) could be taken as a rough proxy for rank. Thedifferences between characteristics are necessarily not verypronounced, since all had at least 80 % agreement. Yet still,some were less strongly supported than others. There aresix characteristics with 96 % agreement or more, whichcould be a starting point for lower-resourced settings:
� A global system must be easy to use, and producedata that are easily understood and valued by users(agreed by 100 % of panellists)
� A global system must have clear guidelines for useand definitions for all terms used (agreed by 100 %of panellists)
� A global system must use rules to ensure validassignment of cause of death categories (agreed by98 % of panellists)
� A global system must be able to work with all levelsof data (from both low-income and high-incomecountries), including minimal levels (agreed by 98 %of panellists)
� A global system must ensure cause of death categoriesare relevant in all settings (agreed by 96 % of panellists)
� A global system must produce data that can be usedto inform strategies to prevent perinatal deaths(agreed by 96 % of panellists)
This study had some limitations. There was not a one-to-one correspondence between characteristics and the vari-ables meant to measure these characteristics, and we reliedon information available in published reports, which oftenlacked the detail required to measure characteristics pre-cisely. This, along with the inherently more subjective natureof some characteristics (for instance, the characteristic re-quiring systems to produce data “that can be used to informstrategies to prevent perinatal deaths”), meant that somecharacteristics were found to be measured less accurately(designated as “weak” variables in Additional file 2) thanothers. However, the sensitivity analysis which excluded all“weak” variables from the assessment of alignment produceda similar list of most-aligned systems, indicating the method-ology was not particularly sensitive to variables’ “strength”.The number of deaths classified by national systems
may have been underestimated due to retaining only themost recent paper between 2009 and 2014 that describeda national system. This would have affected the assess-ment of alignment with the characteristic requiring sys-tems to be easy to use and produce easily understandabledata, as this relied in part on the number of deaths classi-fied. However, this is unlikely to have affected overall re-sults, as four other variables were also incorporated intothe assessment of alignment for this characteristic (whichwas found to be 0 % for all systems).The list of expert-identified characteristics did not
include two characteristics relevant to the ICD-PM, namelywhether ICD codes were used and whether both a maternaland a fetal/neonatal condition are required [22]. Both thesecharacteristics were considered by the expert panel butultimately did not receive 80 % or greater consensus [7].However, the characteristic requiring systems to recordassociated factors and distinguish them clearly from causesof death may overlap with the concept of inclusion of bothmaternal and fetal/neonatal conditions. Data on this charac-teristic and the use of ICD codes are described in Leisheret al. 2016 in this series [3].“Hierarchy”, meaning a set of rules forcing causes to be
selected or rejected in a pre-determined order, was not in-cluded among the expert-identified characteristics. This isa common feature of systems (nearly one-third of systemswe assessed were at least partially hierarchical), and ismeant to assist in consistent assignment of cause of deathwhen multiple conditions are present. However, alongwith two other variables, the “hierarchical” variable wasused to assess alignment with the characteristic requiringthe single most important factor leading to death to berecorded, with a value of “not hierarchical” or “partiallyhierarchical” indicating alignment. In recognition of thefact that there was no consensus on whether a globallyeffective system should be hierarchical [7], this variablewas judged to be “weak”, and hence excluded in thesensitivity analysis.

Leisher et al. BMC Pregnancy and Childbirth (2016) 16:269 Page 14 of 16
ConclusionDespite the large number of classification systems recentlyused and/or developed (81), there remains an unmet needfor a system that is aligned with expert-identified character-istics. To increase acceptance by potential users, ease of useand accessibility will be important, including availabilityonline and in multiple languages, provision of links to dataproduced by the system, and education and training forpotential users. A system including these features wouldhave the potential to become the first truly globally effect-ive classification system, making a critical contribution tothe efforts of researchers, practitioners and policy makersin all countries to prevent the tragic loss of life—5.3 millionstillbirths and neonatal deaths every year.
Additional files
Additional file 1: 81 included systems and selected features. (DOCX 59.8 kb)
Additional file 2: Variables used to assess system alignment withexpert-identified characteristics for an effective global classificationsystem for causes of stillbirth and neonatal death. (DOCX 89.1 kb)
Additional file 3: Sensitivity analyses. (DOCX 62.6 kb)
AbbreviationsAP: Antepartum; CHERG: Child health epidemiology reference group;CMACE: Centre for maternal and child enquiries; Codac: Causes of death andassociated conditions; DHS: Demographic and health surveys; FGR: Fetalgrowth restriction; FIGO: International federation of gynaecology andobstetrics; HIC: High-income countries; ICD: International classification ofdiseases; ICD-PM: International classification of diseases for perinatalmortality; ICE: International collaborative effort; INCODE: Initial causes of fetaldeath; IP: Intrapartum; IUGR: Intrauterine growth restriction; LMIC: Low- andmiddle-income countries; MAIN: The maternal, antenatal, intrapartum &neonatal classification system for perinatal deaths; MRC: Medical researchcouncil; NICE: Neonatal and intrauterine death classification according toetiology; NIPORT: National institute of population research and training;NND: Neonatal death; PPIP: Perinatal problem identification programme;PSANZ-NDC: Perinatal Society of Australia and New Zealand Neonatal DeathClassification; PSANZ-PDC: Perinatal Society of Australia and New ZealandPerinatal Death Classification; ReCoDe: Relevant condition at death;SB: Stillbirth; SCRN WG: The stillbirth collaborative research network workinggroup; SGA: Small for gestational age; WHO: World Health Organization;WiSSP: Wisconsin stillbirth service program
AcknowledgementsThis project was initially undertaken as part of the Harmonized ReproductiveHealth Registries project through the Norwegian Institute of Public Healthin partnership with the Mater Research Institute, Brisbane, Australia, and incollaboration with the Department of Reproductive Health and Research, WHO.Gratitude to Craig D Leisher for support and Wilder D Leisher for inspiration.
FundingThe Mater Research Institute of the University of Queensland, Australia,provided partial funding for VF, HR, AW, TZ, and SHL to undertake this study.There was no other source of funding for this study.
Availability of data and materialsPlease visit: http://research.mater.org.au/getdoc/75129bba-ca95-4481-a815-b143f12ec494/stillbirth-research.
Authors’ contributionsVF conceptualized the study; SHL designed the study with VF; SHL carried outdata extraction and analysis; SHL coordinated all aspects of the study anddrafted the paper with VF; VF and AW reviewed drafts of the manuscript.All authors (SHL, ZT, HR, EA, HB, JJE, JFF, JG, SG, AMG, AEPH, FK, JL, EMM, RP,GCSS, ӦT, AMW, VF) read and approved the final manuscript.
Competing interestsSHL, TZ, HR and AW have nothing to declare. The remaining authors havebeen involved in the development or evaluation of existing perinatal deathclassification systems.
Consent for publicationNot applicable, as no individual person’s data has been reported in this paper.
Ethics approval and consent to participateNot applicable, as no individual person’s data has been reported in this paper.
Author details1Mater Research Institute, The University of Queensland (MRI-UQ), Brisbane,Australia. 2International Stillbirth Alliance, Millburn, USA. 3Department ofReproductive Health and Research including UNDP/UNFPA/UNICEF/WHO/World Bank Special Programme of Research, Development and ResearchTraining in Human Reproduction (HRP), World Health Organization, Geneva,Switzerland. 4School of Women’s and Infants’ Health, Faculty of Medicine,Dentistry and Health Sciences, University of Western Australia, Perth,Australia. 5London School of Hygiene & Tropical Medicine, London, UK.6University Medical Center Groningen, The University of Groningen,Groningen, The Netherlands. 7Department of International Public Health,Norwegian Institute of Public Health, Oslo, Norway. 8Center for InterventionScience for Maternal and Child Health, University of Bergen, Bergen, Norway.9Perinatal Institute, Birmingham, UK. 10Maternal and Fetal Health ResearchCentre, University of Manchester, Manchester, UK. 11St. Mary’s Hospital,Central Manchester University Hospitals NHS Foundation Trust, ManchesterAcademic Health Science Centre, Manchester, UK. 12Department ofObstetrics and Gynaecology, Martini Hospital, Groningen, The Netherlands.13Research Triangle Institute, North Carolina, USA. 14South Africa MedicalResearch Council Maternal and Infant Health Care Strategies Unit, Universityof Pretoria, Pretoria, South Africa. 15NIHR Biomedical Research Centre &Department of Obstetrics & Gynaecology, Cambridge University, Cambridge,UK.
Received: 2 October 2015 Accepted: 11 August 2016
References1. You D, Hug L, Ejdemyr S, Beise J, on behalf of the United Nations Inter-agency
Group for Child Mortality Estimation (UN IGME). Levels and Trends in ChildMortality Report 2015. New York: United Nations Children’s Fund; 2015.
2. Lawn JE, Blencowe H, Waiswa P, Amouzou A, Mathers C, Hogan D, et al.Stillbirths: rates, risk factors, and acceleration towards 2030. Lancet.2016;387(10018):587–603. doi:10.1016/S0140-6736(15)00837-5.
3. Leisher SH, Zheyi T, Reinebrant H, Wojcieszek AM, Korteweg F, Blencowe H,et al. Seeking order amidst chaos: A systematic review of classificationsystems for causes of stillbirth and neonatal death, 2009–2014. EndingPreventable Stillbirths Supplement. [in press at BMC Pregnancy Childbirth].2016.
4. Flenady V. Epidemiology of fetal and neonatal death. In: Khong TY, MalcomsonRDG, editors. Keeling’s Fetal and Neonatal Pathology (in press). 1st ed. 2015.
5. Lawn JE, Blencowe H, Pattinson R, Cousens S, Rajesh K, Ibiebele I, et al.Stillbirths: where? When? Why? How to make the data count? Lancet.2011;377(9775):1448–63.
6. Allanson ER, Tunçalp Ö, Gardosi J, Pattinson RC, Francis A, Vogel JP, et al.The WHO application of ICD-10 to deaths during the perinatal period(ICD-PM): results from pilot database testing in South Africa and UnitedKingdom. BJOG. 2016. doi:10.1111/1471-0528.14244.
7. Wojcieszek AM, Reinebrant HE, Leisher SH, Teoh Z, Frøen JF, Tunçalp O,et al. Characteristics of a global classification system for perinatal deaths:A Delphi consensus study. Ending Preventable Stillbirths Supplement.BMC Pregnancy Childbirth. 2016. in press. doi:10.1186/s12884-016-0993-x.
8. World Bank. http://data.worldbank.org/about/country-and-lending-groups#High_income. 2015. Accessed 23 Feb 2015.
9. Froen JF, Pinar H, Flenady V, Bahrin S, Charles A, Chauke L, et al. Causes ofdeath and associated conditions (Codac) - a utilitarian approach to theclassification of perinatal deaths. BMC Pregnancy Childbirth. 2009;9(22).doi:10.1186/1471-2393-9-22.

Leisher et al. BMC Pregnancy and Childbirth (2016) 16:269 Page 15 of 16
10. Korteweg FJ, Gordijn SJ, Timmer A, Erwich JJ, Bergman KA, Bouman K, et al.The Tulip classification of perinatal mortality: introduction and multidisciplinary inter-rater agreement. BJOG. 2006;113(4):393–401. doi:10.1111/j.1471-0528.2006.00881.x.
11. Black RE, Cousens S, Johnson HL, Lawn JE, Rudan I, Bassani DG, et al.Global, regional, and national causes of child mortality in 2008: a systematicanalysis. Lancet. 2010;375(9730):1969–87. doi:http://dx.doi.org/10.1016/S0140-6736(10)60549-1.
12. Cole SK, Hey EN, Thomson AM. Classifying perinatal death: an obstetricapproach. Br J Obstet Gynaecol. 1986;93(12):1204–12.
13. Flenady V, King J, Charles A, Gardener G, Ellwood D, Day K, et al.PSANZ Clinical Practice Guideline for Perinatal Mortality. 2009.
14. Kotecha S, Kotecha S, Rolfe K, Barton E, John N, Lloyd M, et al.All Wales Perinatal Survey Annual Report 2013 Cardiff, Wales. 2014.
15. Ujwala B, Alcock G, More NS, Sushmita D, Wasundhara J, Osrin D. Stillbirths andnewborn deaths in slum settlements in Mumbai, India: a prospective verbalautopsy study. BMC Pregnancy Childbirth. 2012;12(39). doi:10.1186/1471-2393-12-39.
16. de Galan-Roosen AE, Kuijpers JC, van der Straaten PJ, Merkus JM. Fundamentalclassification of perinatal death. Validation of a new classification system ofperinatal death. Eur J Obstet Gynecol Reprod Biol. 2002;103(1):30–6.
17. Froen JF, Gordijn SJ, Abdel-Aleem H, Bergsjo P, Betran A, Duke CW, et al.Making stillbirths count, making numbers talk - issues in data collection forstillbirths. BMC Pregnancy Childbirth. 2009;9:58. doi:10.1186/1471-2393-9-58.
18. Gordijn SJ, Korteweg FJ, Erwich JJHM, Holm JP, van Diem MT, Bergman KA, et al.A multilayered approach for the analysis of perinatal mortality using differentclassification systems. Eur J Obstet Gynecol Reprod Biol. 2009;144(2):99–104.
19. Hovatta O, Lipasti A, Rapola J, Karjalainen O. Causes of stillbirth: a clinicopathologicalstudy of 243 patients. Br J Obstet Gynaecol. 1983;90(8):691–6.
20. Manktelow BM, Smith LK, Evans TA, Hyman-Taylor P, Kurinczuk JJ, Field DJ,et al. UK Perinatal Mortality Surveillance Report UK Perinatal Deaths for birthsfrom January to December 2013. Leicester: The Infant Mortality and MorbidityGroup, Department of Health Sciences, University of Leicester; 2015.
21. Manktelow BM, Smith LK, Seaton SE, Hyman-Taylor P, Kurinczuk JJ, Field DJ,et al. UK Perinatal Mortality Surveillance Report UK Perinatal Deaths for Birthsfrom January to December 2014. Leicester: The Infant Mortality and MorbidityGroup, Department of Health Sciences, University of Leicester; 2016.
22. World Health Organization. International statistical classification of diseasesand related health problems. 10th ed. Geneva: World Health Organization;2004.
23. Chan A, King JF, Flenady V, Haslam RH, Tudehope DI. Classification ofperinatal deaths: development of the Australian and New Zealandclassifications. J Paediatr Child Health. 2004;40(7):340–7.
24. Kidanto HL, Mogren I, van Roosmalen J, Thomas AN, Massawe SN, Nystrom L,Lindmark G. Introduction of a qualitative perinatal audit at Muhimbili NationalHospital, Dar es Salaam, Tanzania. BMC Pregnancy Childbirth. 2009;9:45.
25. Lawn JE. Estimating the causes of 4 million neonatal deaths in the year2000. Int J Epidemiol. 2006;35(3):706–18.
26. Manning E, Corcoran P, Meaney S, Greene RA, on behalf of the PerinatalMortality Group. Perinatal Mortality in Ireland Annual Report 2011. Cork:National Perinatal Epidemiology Centre; 2013.
27. Pattinson RC, De Jong G, Theron GB. Primary causes of total perinatallyrelated wastage at Tygerberg Hospital. S Afr Med J. 1989;75(2):50–3.
28. Schmiegelow C, Minja D, Oesterholt M, Pehrson C, Suhrs HE, Boström S,Lemnge M, Magistrado P, Rasch V, Lusingu J, Theander TG, Nielsen BB.Factors associated with and causes of perinatal mortality in northeasternTanzania. Acta Obstet Gynecol Scand. 2012;91(9):1061–8.
29. Varli IH, Petersson K, Bottinga R, Bremme K, Hofsjö A, Holm M, Holste C,Kublickas M, Norman M, Pilo C, Roos N, Sundberg A, Wolff K,Papadogiannakis N. The Stockholm classification of stillbirth. Acta ObstetGynecol Scand. 2008;87(11):1202–12.
30. Wigglesworth JS. Monitoring perinatal mortality. A pathophysiologicalapproach. Lancet. 1980;2(8196):684–6.
31. Abdellatif M, Battashi AA, Ahmed M, Bataclan MF, Khan AA, Maniri AA. Thepatterns and causes of neonatal mortality at a tertiary Hospital in Oman.Oman Med J. 2013;28(6):422–6.
32. Centre for Maternal and Child Enquiries (CMACE). Perinatal mortality 2008:United Kingdom. London: CMACE; 2010.
33. Engmann C, Garces A, Jehan I, Ditekemena J, Phiri M, Mazariegos M,Chomba E, Pasha O, Tshefu A, McClure EM, Thorsten V, Chakraborty H,Goldenberg RL, Bose C, Carlo WA, Wright LL. Causes of communitystillbirths and early neonatal deaths in low-income countries using verbalautopsy: an International, Multicenter Study. J Perinatol. 2011;32(8):585–92.
34. Khanum F. Perinatal mortality-one year analysis at tertiary care hospital ofPeshawar. J Postgrad Med Inst. 2009;23(3):267–71.
35. Kidron D, Bernheim J, Aviram R. Placental findings contributing to fetaldeath, a study of 120 stillbirths between 23 and 40 weeks gestation.Placenta. 2009;30(8):700–4.
36. Mo-suwan L, Isaranurug S, Chanvitan P, Techasena W, Sutra S,Supakunpinyo C, et al. Perinatal death pattern in the four districts ofThailand: findings from the Prospective Cohort Study of Thai Children(PCTC). J Med Assoc Thai. 2009;92(5):660–6.
37. The MRC Unit for Maternal and Infant Health Care Strategies, PPIP Users,National Department of Health. Saving Babies 2002: Third Perinatal CareSurvey of South Africa. 2002.
38. National Services Scotland. Scottish perinatal and infant mortality andmorbidity report 2011. Edinburgh: National Services Scotland; 2013.
39. National Institute of Population Research and Training (NIPORT), Mitra andAssociates, ORC Macro. Bangladesh Demographic and Health Survey 2004.Dhaka: National Institute of Population Research and Training, Mitra andAssociates, and ORC Macro; 2005.
40. Shah BD, Dwivedi LK. Causes of Neonatal Deaths among Tribal Women inGujarat, India. Popul Res Policy Rev. 2011;30(4):517–36.
41. van Diem M, De Reu P, Eskes M, Brouwers H, Holleboom C, Slagter-Roukema T,Merkus H. National perinatal audit, a feasible initiative for the Netherlands!?A validation study. Acta Obstet Gynecol Scand. 2010;89(9):1168–73.
42. VanderWielen B, Zaleski C, Cold C, McPherson E. Wisconsin stillbirth servicesprogram: a multifocal approach to stillbirth analysis. Am J Med Genet A.2011;155(5):1073–80.
43. Wood AM, Pasupathy D, Pell JP, Fleming M, Smith GCS. Trends insocioeconomic inequalities in risk of sudden infant death syndrome, othercauses of infant mortality, and stillbirth in Scotland: population based study.BMJ. 2012;344:e1552.
44. Basys V, Drazdienë N, Vezbergienë N, Isakova J. Gimimø medicininiaiduomenys [Medical data of Births 2013]. Vilnius: Institute of Hygiene HealthInformation Centre, Vilnius University Medical Faculty, Vilnius University,Centre of Neonatology; 2014.
45. Centre for Maternal and Child Enquiries (CMACE). Perinatal Mortality 2009:United Kingdom. London: CMACE; 2011.
46. Cole S, Hartford RB, Bergsjø P, McCarthy B. International Collaborative Effort(ICE) on Birth Weight, Plurality, Perinatal, and Infant Mortality: III: a methodof grouping underlying causes of infant death to aid internationalcomparisons. Acta Obstet Gynecol Scand. 1989;68(2):113–7.
47. De Reu P, Van Diem M, Eskes M, Oosterbaan H, Smits L, Merkus H,Nijhuis J. The Dutch Perinatal Audit Project: a feasibility study fornationwide perinatal audit in the Netherlands. Acta Obstet GynecolScand. 2009;88(11):1201–8.
48. Gardosi J. Classification of stillbirth by relevant condition at death (ReCoDe):population based cohort study. BMJ. 2005;331(7525):1113–7.
49. Glinianaia SV, Rankin J, Pearce MS, Parker L, Pless-Mulloli T. Stillbirth andinfant mortality in singletons by cause of death, birthweight, gestationalage and birthweight-for-gestation, Newcastle upon Tyne 1961-2000.Paediatr Perinat Epidemiol. 2010;24(4):331–42.
50. Hey EN, Lloyd DJ, Wigglesworth JS. Classifying perinatal death: fetal andneonatal factors. BJOG. 1986;93(12):1213–23.
51. Hinderaker SG, Olsen BE, Bergsjo PB, Gasheka P, Lie RT, Havnen J, Kvale G.Avoidable stillbirths and neonatal deaths in rural Tanzania. BJOG.2003;110(6):616–23.
52. Manandhar SR, Ojha A, Manandhar DS, Shrestha B, Shrestha D, Saville N,Costello AM, Osrin D. Causes of stillbirths and neonatal deaths in Dhanushadistrict, Nepal: a verbal autopsy study. Kathmandu Univ Med J. 2010;8(29):62–72.
53. Nausheen S, Soofi SB, Sadiq K, Habib A, Turab A, Zahid M, Imran Khan M,Suhag Z, Bhatti Z, Ahmed I, Bahl R, Bhutta S, Bhutta ZA, Carlo WÂA.Validation of verbal autopsy tool for ascertaining the causes of stillbirth.PLoS ONE. 2013;8(10):e76933.
54. Nga NT, Hoa DTP, Målqvist M, Persson L-Å, Ewald U. Causes of neonataldeath: results from NeoKIP community-based trial in Quang Ninh province,Vietnam. Acta Paediatr. 2012;101(4):368–73.
55. The Stillbirth Collaborative Research Network Writing Group. Causes ofdeath among stillbirths. J Am Med Assoc. 2011;306(22):2459–68.
56. Simpson CDA, Ye XY, Hellmann J, Tomlinson C. Trends in cause-specificmortality at a Canadian outborn NICU. Pediatrics. 2010;126(6):e1538–44.
57. Singh A, Toppo A. Re. Co. De.: a better classification for determination ofstill births. J Obstet Gynaecol India. 2011;61(6):656–8.

Leisher et al. BMC Pregnancy and Childbirth (2016) 16:269 Page 16 of 16
58. Aggarwal AK, Jain V, Kumar R. Validity of verbal autopsy for ascertaining thecauses of stillbirth. Bull World Health Organ. 2011;89(1):31–40.
59. Aggarwal AK, Kumar P, Pandit S, Kumar R, Eisele T. Accuracy of WHOverbal autopsy tool in determining major causes of neonatal deaths inIndia. PLoS ONE. 2013;8(1):e54865.
60. Dias e Silva CMC, Gomes KRO, Rocha OAMS, de Almeida IMLM, Neto JMM.Validity and reliability of data and avoidability of the underlying cause ofneonatal deaths in the intensive care unit of the North-Northeast PerinatalCare Network [Portuguese]. Cad Saude Publica. 2013;29(3):547–56.
61. Dudley DJ, Goldenberg R, Conway D, Silver RM, Saade GR, Varner MW, Pinar H,Coustan D, Bukowski R, Stoll B, Koch MA, Parker CB, Reddy UM. A new system fordetermining the causes of stillbirth. Obstet Gynecol. 2010;116(2, Part 1):254–60.
62. Khanal S, GC VS, Dawson P, Houston R. Verbal autopsy to ascertain causesof neonatal deaths in a community setting: a study from Morang, Nepal.JNMA J Nepal Med Assoc. 2011;51(181):21–7.
63. Lawn JE, Mohammad Y, Haws RA, Tanya S, Darmstadt GL, Bhutta ZA.3.2 million stillbirths: epidemiology and overview of the evidence review.BMC Pregnancy Childbirth. 2009;9 Suppl 1:S2.
64. Lawn JE, Kinney MV, Black RE, Pitt C, Cousens S, Kerber K, Corbett E,Moran AC, Morrissey CS, Oestergaard MZ. Newborn survival: a multi-countryanalysis of a decade of change. Health Policy Plan. 2012;27 suppl 3:iii6–iii28.
65. Olamijulo JA, Olaleye O. Perinatal mortality in Lagos University TeachingHospital: a five year review. Nig Q J Hosp Med. 2011;21(4):255–61.
66. Seaton SE, Field DJ, Draper ES, Manktelow BN, Smith GCS, Springett A,Smith LK. Socioeconomic inequalities in the rate of stillbirths by cause: apopulation-based study. BMJ Open. 2012;2(3):e001100.
67. Serena C, Marchetti G, Rambaldi MP, Ottanelli S, Di Tommaso M, Avagliano L,Pieralli A, Mello G, Mecacci F. Stillbirth and fetal growth restriction. J MaternFetal Neonatal Med. 2012;26(1):16–20.
68. Winbo I. NICE, a new cause of death classification for stillbirths and neonataldeaths. Neonatal and Intrauterine Death Classification according to Etiology.Int J Epidemiol. 1998;27(3):499–504.
69. Winter R, Pullum T, Langston A, Mivumbi NV, Rutayisire PC, Muhoza DN,et al. Trends in Neonatal Mortality in Rwanda, 2000-2010. Calverton: ICFInternational; 2013.
70. Cunningham F, Leveno K, Bloom SL, Hauth JC, Rouse DJ, Spong CY, editors.Williams obstetrics. 23rd ed. New York: McGraw-Hill; 2010.
71. Freitas BAC, Goncalves MR, Ribeiro RCL. Infant mortality according topreventable causes and components - Vicosa-MG, 1998-2010. [Portuguese].Pediatria Moderna. 2012;48(6):237–45.
72. Gupta SS. Identification of causes of under-five deaths in health facilities inBhutan Ministry of Health of the Royal Government of Bhutan. 2012.
73. Hama Diallo A, Meda N, Sommerfelt H, Traore GS, Cousens S, Tylleskar T.The high burden of infant deaths in rural Burkina Faso: a prospectivecommunity-based cohort study. BMC Public Health. 2012;12(1):739.
74. Jehan I. Neonatal mortality, risk factors and causes: a prospectivepopulation-based cohort study in urban Pakistan. Bull World Health Organ.2009;87(2):130–8.
75. Kruse AY, Phuong CN, Ho BTT, Stensballe LG, Pedersen FK, Greisen G.Identification of important and potentially avoidable risk factors in aprospective audit study of neonatal deaths in a paediatric hospital inVietnam. Acta Paediatr. 2014;103(2):139–44.
76. Nabeel M, Bushra M, Anum Y, Muneer A, Jai K. The study of etiological anddemographic characteristics of neonatal mortality and morbidity - aconsecutive case series study from Pakistan. BMC Pediatr. 2012;12:131.
77. Public Health Agency of Canada. Canadian Perinatal Health Report. 2008thed. Ottawa: Public Health Agency of Canada; 2008.
78. Rocha R, Oliveira C, Karina Ferreira D, Bonfim C. Neonatal mortality andavoidability: an epidemiological profile analysis [Portuguese]. Rev EnfermUERJ. 2011;19(1):114–20.
79. Smith LK, Manktelow BN, Draper ES, Springett A, Field DJ. Nature ofsocioeconomic inequalities in neonatal mortality: population based study.BMJ. 2010;341:c6654.
80. Wou K, Ouellet M-P, Chen M-F, Brown RN. Comparison of the aetiology ofstillbirth over five decades in a single centre: a retrospective study. BMJOpen. 2014;4(6):e004635.
81. Cunningham FG, Hollier LM. Fetal death. In: Williams obstetrics. 20th ed(Suppl 4) ed. Norwalk: Appleton & Lange; 1997.
82. Flenady V, Froen JF, Pinar H, Torabi R, Saastad E, Guyon G et al. Anevaluation of classification systems for stillbirth. BMC Pregnancy Childbirth.2009;9:24.
• We accept pre-submission inquiries
• Our selector tool helps you to find the most relevant journal
• We provide round the clock customer support
• Convenient online submission
• Thorough peer review
• Inclusion in PubMed and all major indexing services
• Maximum visibility for your research
Submit your manuscript atwww.biomedcentral.com/submit
Submit your next manuscript to BioMed Central and we will help you at every step: