Scenarios and challenges for feeding the world in 2050
25
1 [email protected] & [email protected] Scenarios and challenges for feeding the world in 2050 OECD workshop “Long-Term Scenarios Supporting Robust Policies for Global Agriculture and Food” Paris, 21-22 October 2010
Transcript of Scenarios and challenges for feeding the world in 2050

1
[email protected] & [email protected]
Scenarios and challenges for feeding the world in 2050
OECD workshop “Long-Term ScenariosSupporting Robust Policies for Global Agriculture and Food”Paris, 21-22 October 2010

2
The foresight exercise Agrimonde (introduction)
A joint INRA-CIRAD project (2006-2009 = 1st phase)- French National Institute for Agricultural Research (www.inra.fr) - French Agricultural Research Centre for International Development (www.cirad.fr)
Objectives(1) to explore possible futures of food and farming systems up to 2050(2) to design and debate orientations and strategies for INRA - CIRAD research agendas (3) to contribute to international debates on food, agriculture and the environment
A three-component platform
The Agrimonde platform
Experts panel
Project team
Steering Committee
a THINK TANK(experts, stakeholders…)
a QUANTITATIVETOOL (Agribiom…)
debating
with
and the expertiseof its members
some SCENARIOS(re-examined or generated)
2050

3
Aims & architecture of AgribiomA quantitative tool designed for exploring
past and future world production, consumption & trade of biomassesthrough (1) collective expertise & debates (such as Agrimonde)
(2) hybrid modeling works (not presented here)
Par
t I
Past- 45 years
(1960 => 2005)
Future scenarios+ 45 years
(2005 => 2050)
S1
S2
.../…
The ambition for Agrimonde
Having a quantitative tool for :
(1) revisiting the past, better understand it (with new estimates,
new models…)
(2) debating the future
translated / summarized intofew quantitative parameters
...from scenarios description (own or external qualitative conjectures)
Global Consistency ?(physical equilibrium between biomass uses & resources)
Impact of variants ?(populations, composition of diets…)
Implications ? (international trade, fossil fuel & water consumptions…)
(populations, diets, non-food uses land uses, productivities…)

4
Cro
plan
ds
tota
llyno
n-fo
od Permanentpastures Forests
Others(mountains, deserts,
cities, roads…)
Fres
hwat
er
Continental shelves
FOODNON-FOOD
(wood, fibres, leather, rubber, tobacco, bio-energies, bio-materials…)
Biomass
RegionalLAND USE
RegionalPRODUCTION
RegionalSupply-UseBALANCE
RegionalCONSUMPTION from terrestrial
PLANTSfrom terrestrial
ANIMALSof AQUATIC
origins
Imports –
Exports
Imports –
Exports
Fooduse
Feeduse
Seeduse
Otheruse Waste
VEGE
RUMI
MONO
Edible
Inedible
Edible
Inedible
Edible
Inedible
AQUA
Edible
Inedible
MARI
Edible
Inedible
PopulationRegional
POPULATIONAgricultural working
populationRural population
other than farmers Urban citizens
Demand
Production Production
yield
A food balance modelCountries => World balances of food biomassesreconstituted (1961-2003, using FAO commodity balances in tons)and/or simulated (2030, 2050…)
Cal ries

5
127
The unit of account
All primary foodstuffs
gathered into 5 « compartments » of food biomasses
PLANTS (VEGE)
Cereals : wheat, rice, barley, maize…Sugar crops : sugarcane, sugar beat…Pulses : beans, peas…Oilseeds : soybean, groundnut, coconut…Roots & tubers : cassava, potato…Fruits & vegetables : apple, onion…Stimulants : cocoa, coffee, alcohol…
GRAZING ANIMALS (RUMI)Meats : bovines, goat, mutton…Milk, Butter, Animal fats…
Non-GRAZING ANIMALS (MONO)Meats : poultry, pig…Eggs…
FRESH WATER (AQUA) Fishes…
MARINE (MARI)Demersal & Pelagic fishes… Fats…
1961-2003: 120 product lines of FAO Commodity Balances (SUA)
The items
Food CALORIES(or equivalent for oilcakes, molasses…)
Total Calories = Carbohydrates (4 kcal/g)+ Proteins (4 kcal/g) + Fat (9 kcal/g)

6
Imports,transformations (S/U balances in kcal, proteins…)and connectionof millions historical data (1960-2005) relating to national productions, consumptions and trade of biomasses :
- Populations (human, animal)- Consumptions (human, animal)- Land use (crops, pastures, forests…)- Production factors (labor, tractors, fertilizers…)- Productions (human, animal, aquatic…
food, non-food…)- Trade (Imports / Exports)- Environmental externalities- …/…
Analyzing / Visualizingmillions of historical data
Collective debatewith live simulations
(researchers, decision makers…)
New models(e.g. animal/vegetal production
functions…)
Hybrid modeling(with economic andbiophysical models)
An interactive interface

7
= f (FEED )
0
1 000
2 000
3 000
4 000
5 000
6 000
7 000
8 000
9 000
1960 1965 1970 1975 1980 1985 1990 1995 2000 2005 2010
Use
of v
eget
al fo
odst
uffs
(Gkc
al /
day)
n.a.
Waste
Seed
Other
FEED
FOOD
0
500
1 000
1 500
2 000
2 500
3 000
3 500
4 000
4 500
5 000
1960 1965 1970 1975 1980 1985 1990 1995 2000 2005 2010
Use
of v
eget
al fo
odst
uffs
(Gkc
al /
day)
n.a.
Waste
Seed
Other
FEED
FOOD
Source : own calculations using FAO data
A statistical model for livestock production
OECD-1990(987 M inhab. In 2003)
SSA(706 M inhab. In 2003)
( in 2003, the OECD cattle ate 3 times as muchfood as the SSA human population did )
RUMI production (meat & milk proteins)MONO production (meat & eggs proteins)
Cross-country animal production functions
, PASTURE, MONO/RUMI)
Facts
Model
Results
=> replicate very-well the past 40-year of national/regional/global animal productions
=> “on-line” tests and modeling (choice of model, change of parameters/coefficients, simulations…)
01 0002 0003 0004 0005 0006 0007 000
1960 1970 1980 1990 2000
RUMI in FSUproduction of proteins (Gg/y)
(Dorin & Le Cotty)

8
Annual R/U balances of food biomassreconstituted (1961-2003) …or simulated (2050)

9
0
1 000
2 000
3 000
4 000
5 000
6 000
7 000
1960 1965 1970 1975 1980 1985 1990 1995 2000 2005 2010
Inha
bita
nts
(milli
on)
Urbanpopulation
Other ruralpopulation
Economicallyactive inagriculture
dd
From past trends to scenariosA 1961-2003 brief overview of the world food economy
through Agribiom eyes…Par
t II
The population doubled
From average world increases…
The per-capita food availabilityincreased too…
0
500
1 000
1 500
2 000
2 500
3 000
3 500
1960 1965 1970 1975 1980 1985 1990 1995 2000 2005 2010
kcal
/ da
y / c
ap
MARI
AQUA
MONO
RUMI
VEGE
Source: own calculations using FAO data

10
0
2 000
4 000
6 000
8 000
10 000
12 000
14 000
1960 1965 1970 1975 1980 1985 1990 1995 2000 2005 2010
Surfa
ce (m
illion
s he
ctar
es)
- Crops : + 13%- Pastures : + 11%
- Veg calories / cultivated ha : + 123%- Veg calories / farmer : + 53%
On the resources side:
Agricultural area
Land and labour productivities
Livestock
0
500
1 000
1 500
2 000
2 500
3 000
3 500
4 000
1960 1965 1970 1975 1980 1985 1990 1995 2000 2005 2010
Effe
ctifs
(mill
ions
de
tête
s)
Camélidés
Anes…
Cheveaux
Caprins
Ovins
Buffles
Bovins
0
2 000
4 000
6 000
8 000
10 000
12 000
14 000
16 000
18 000
20 000
1960 1965 1970 1975 1980 1985 1990 1995 2000 2005 2010
Effe
ctifs
(mill
ions
de
tête
s)
Ruches
Léporidés
Porcins
Oies,pintades
Dindons
Canards
Poules
BIG HERBIVORES
and/or RUMINANTS
POULTRY,
PIGS
and OTHERS
Forests
Pastures
Crops
Water
0
2 000
4 000
6 000
8 000
10 000
12 000
14 000
0 1
0=pluvial 1=pluvial or irrigated
x
0
1 (mS)
2 (MS)
3 (S)
4 (VS)
Up to(potential)
0
5 000
10 000
15 000
20 000
25 000
1960 1965 1970 1975 1980 1985 1990 1995 2000 2005 2010
Food
pro
duct
ion
(kca
l / d
ay /
ha)
VEGE (per ha)
AQUA (per 100 ha)
MARI (per 100 ha)
Source : own calculations using FAO data
Source : data from Fischer et al.
Source : data from FAO

11
Human populations
0
1 000
2 000
3 000
4 000
5 000
6 000
7 000
1960 1965 1970 1975 1980 1985 1990 1995 2000
Inhabitants (million) Active agricultural workers (million)
0
200
400
600
800
1 000
1 200
1 400
1960 1965 1970 1975 1980 1985 1990 1995 2000
OECD
MENA
FSU
ASIA
LAM
SSA
OECD = Oecd-1990
MENA = Middle East & North Africa
FSU = Former USSR
ASIA = Asia
LAM = Latin America & the Caribbean
SSA = Sub-Saharan Africa
…to regional disparities
Farmers : highly and increasinglyconcentrated in Asia and Africa
The 6 MEA regions
Source: data from FAO

12
Highest land productivityin ASIA
A labour productivity boomin OECD
Vegetal kcal / day / cultivated hectare
Note : 10 000 kcal =~ 2.4 kg of soybean~ 2.8 kg of rice milled~ 2.9 kg of pea~ 3.0 kg of wheat~ 15.0 kg of potato~ 58.8 kg of tomato
0
5 000
10 000
15 000
20 000
25 000
30 000
1960 1965 1970 1975 1980 1985 1990 1995 2000 2005
Vegetal kcal / day / agricultural worker
0
50 000
100 000
150 000
200 000
250 000
300 000
350 000
400 000
450 000
1960 1965 1970 1975 1980 1985 1990 1995 2000 2005
Source: own calculations using FAO data
SSA
LAM
ASIA
FSU
MENA
OECD
OECD: 423,800 kcal/worker19 ha/workers22 M workers
ASIA: 11,500 kcal/worker0.5 ha/workers
1,011 M workers
World: 22,000 kcal/worker 1.15 ha/workers1,331 M workers
13
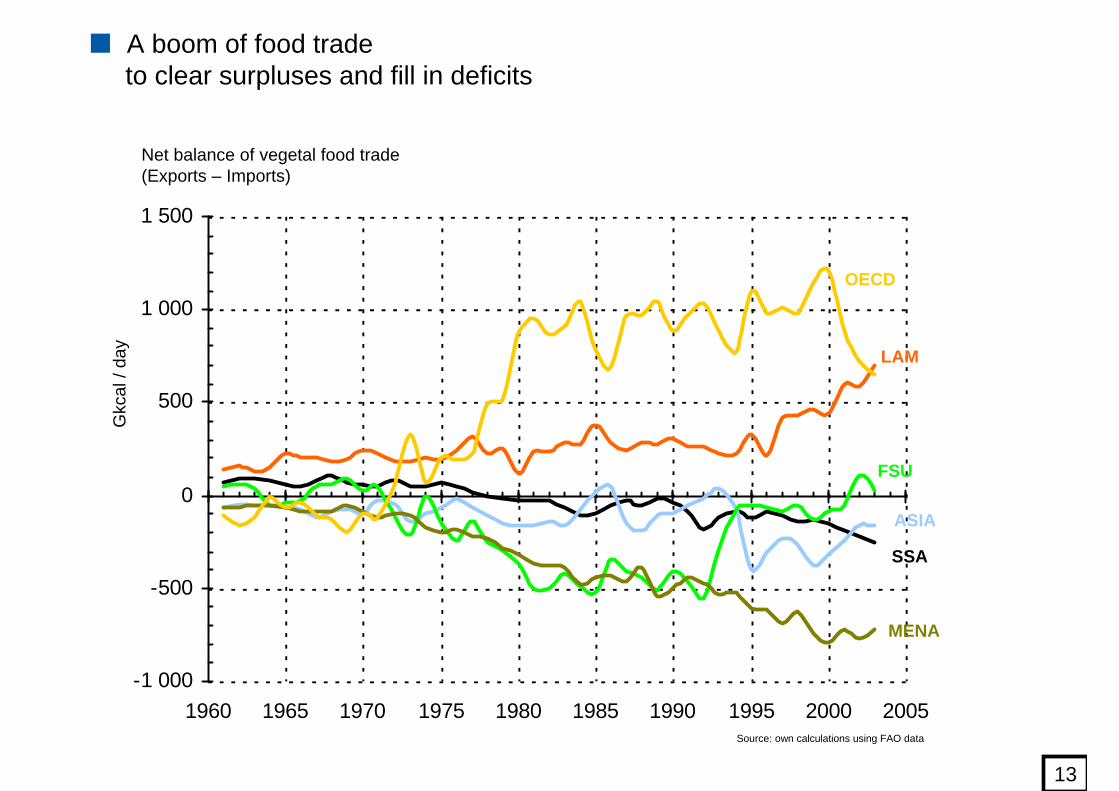
A boom of food tradeto clear surpluses and fill in deficits
-1 000
-500
0
500
1 000
1 500
1960 1965 1970 1975 1980 1985 1990 1995 2000 2005
Net balance of vegetal food trade (Exports – Imports)
Gkc
al/ d
ay
Source: own calculations using FAO data
OECD
FSU
LAM
SSA
ASIA
MENA

14
0
500
1 000
1 500
2 000
2 500
3 000
3 500
4 000
4 500
1960 1965 1970 1975 1980 1985 1990 1995 2000 2005 2010
kcal
/ da
y / c
ap
MARI
AQUA
MONO
RUMI
VEGE
0
500
1 000
1 500
2 000
2 500
3 000
3 500
4 000
4 500
1960 1965 1970 1975 1980 1985 1990 1995 2000 2005 2010
kcal
/ da
y / c
ap
MARI
AQUA
MONO
RUMI
VEGE
But still very large disparities in per-capita food availabilities
Sub-Saharan Africa
OECD
Animal proteins : 12 on 60 g / day (20%)
Animal fats : 10 on 48 g / jour (20%)
Animal proteins :71 g / day on 125 (60%)
Animal fats :89 g / day on 165 (55%)
Source: author’s calculations using FAO data

15
Towards which new «equilibrium» in 2050 ?Resources, productions, trade and uses of food biomasses (2003)
Scenarios, hypotheses, collective debates… (2050) Agribiomsimulations
http://www.cirad.fr/upload/en/communique/Cirad-Inra-Agrimonde-GB.pdf

16
ddPar
t II
I
+/- population growth (7-11 billions inhabitants in 2050) ?
+/- change in food diets (vegetal/animal, macro/micro nutrients…) ?
+/- climate change
+/- demand in non-food products (bio-energies, bio-materials...) ?
+/- incomes, incomes distribution and population migrations (regional opportunities of decent incomes, self-subsistence…) ?
+/- economic liberalization and trust in international trade(“sovereignty” in cereals / other basic vegetal foodstuffs / feed for animal productions / animal foodstuffs…) ?+/- environmental regulations (forests, greenhouse gases, biodiversity…) ?
…/…
+/- important crisis on present yield boosts (fossil fuels, water, pesticides, phosphates…) ?
Scenarios and challengesfor feeding the world in 2050
First explorations by Agrimonde : the “AGO” and “AG1” worlds…
Towards which new «equilibrium» in 2050 with…

1717
dd
Par
t II
I• 2 scenarios, 2050 timeline, MA regions • Same regional population trends assumed in both scenarios in order to assess each region’s capacity to satisfy its food needs
•Agrimonde 1 : a normative scenario: sustainable development is assumed to be met by 2050; the goal being to better understand the dilemmas, tensions, synergies and challenges of such a development
• Drastic reduction of under-nourishment and also of excess of caloric intakes
• Ecological intensification : agriculture meets growing needs, is a driving force of development, and respectful of the environment
• Agrimonde GO : a trend-based scenario, reprocessing Global Orchestration, the most efficient MA scenario, regarding poverty alleviation and under-nourishment reduction:
• Fast technological advances and trade liberalization• Reactivity in ecosystem management
⇒ trade is addressed only after this capacity is assessed, without any market simulation
Building-principles of the scenarios

18
Quantitative assumptions : (1) regional uses• Populations in 2050 : UN median projections• Food consumptions (availabilities):
1,500
2,000
2,500
3,000
3,500
4,000
4,500
1960 1970 1980 1990 2000 2010 2020 2030 2040 2050 2050
kcal
/cap
/day
AG
1
Allregions
AG
O
MENA
SSA
FSULAMASIAOECD
AGO: GO assumptions, growth explains
consumption trends
AG1: 3,000 in all regions; 2,500 of plant origin ; regional specificities in
the allocation of the remainder
Quantitative assumptions and resource-use balances

1919
2. Animal: F (pasture area, feed, mono/rumi)
Quantitative assumptions: (2) Regional resources
3. Aquatic: resource - use identity
1. Plant: land use and foodcrop yield• Agrimonde GO: GO assumptions• Agrimonde 1: What possible evolution of land use and yield ?
• given past trends• while preserving ecosystems and natural resources• given possible impacts of climate change
0
5 000
10 000
15 000
20 000
25 000
30 000
35 000
40 000
45 000
50 000
MENA SSA LAM ASIA FSU OECD World
daily kcal / ha196120002050 AG12050 AGO

2020
Quantitative scenarios (2000-2050)World AGO AG1
Use
Population +47%
Consum
ption
Kcal/cap/day +20% stable
Animal share from 16% to 23% stable
Resource
Land use
Cultivated land1961-2000 :+4 M ha per
year
+ 23%+ 7 M ha per
year
+ 39% +12 M ha per
year
11% non food
Forest stable
Pasture +7% -15%
Yield1961-2000 : +2% per year
+ 75%+1,14% per
year
+7% +0,14% per
year
Resource-use balances in 2050• In both scenarios, at the global level, resources meet needs in 2050
– But 3 regions remain net importers of food calories : SSA, MENA, ASIA
– Net deficits/surpluses of food calories considerably increases between 2000 and 2050
• Regional net deficits and surpluses are higher in AG1

2121
dd
What is on our plates which is a key driver for:•Preserving ecosystem services•Saving farming inputs•Solving nutrition-related health problems•Opening new opportunities for non-food use…
The planet can feed properly 9 billion people in 2050 but it will depend on…
World AGO 2050 AG1 2050 Food
consumption per cap. & per day
+ 20% stable
Animal share 23% stable (15%)
Total use of plant cal. (Gkcal/day) (28,100 in 2000)
53,600 (+90%)
37,600(+35%)
Diets (and waste) are key determinants of resource-use balances
what is lost before & after reaching our plates
Food trade can secure regional food needs since:• natural resources are not distributed like human population• and agriculture development takes time
Main conclusions
providing that:• local opportunities of wealth creation are developed • as well as a fair and secure trade regulation system coupled with environmental regulation

2222
• AGO and AG1 relate to 2 contrasted yield-surface trade-offs and have different consequences on ecosystem preservation
• AGO can be seen as a possible sustainable option since cultivated areas are limited thanks to high yields
• AG1 is another sustainable option, providing:- The development of radical innovations in farming systems to
overcome biodiversity loss and GHG emissions associated with a large land conversion
- A change in performance criteria of farming systems- A blurring of the frontiers between urban areas, agricultural areas and
areas of nature
Spatial organisation, technological innovation & social changeare strongly related

23
To follow up…
23
Need to involve a large set of stakeholders and academic disciplines into food production, food security, food safety and food quality issues
Need to extend/link simulations with- price/market mechanisms- induced consumptions of fossil fuel and water- GHG emissions/sinks (C, CO2, CH4, N2O…)- regional employments / incomes / migrations- …biodiversity
Need to discuss and investigate scenarios at different geographical scales with various stakeholders ( to share & debate different visions of the future)

24
Preliminary results8 pages brochure
May 2008
Agrimonde materials available on the web & elsewherehttp://www.inra.fr/l_institut/prospective/agrimondehttp://www.cirad.fr/actualites/toutes-les-actualites/articles/2009/science/resultats-de-la-prospective-agrimonde
REPORT200 pages Feb. 2009
VIDEOSPresentations & debates
Feb-Oct 2009
SUMMARY REPORT32 pages June 2009
BROCHURE12 pagesOct 2009
Coming soon…BOOKS (FR & EN)
2010
FR & ENUpdated versionsDecember 2009
FR & ENFR & EN FR only

25
Thank you for your attentionProject team AOUDAÏ Maryse (Inra)
BARRE Rémi (Cnam)CHAUMET Jean-Marc (Inra)DORIN Bruno (Cirad - Responsable analyses quantitatives)LE COTTY Tristan (Cirad)PAILLARD Sandrine (Inra - Responsable unité prospective Inra)RONZON Tévécia (Inra)TREYER Sébastien (AgroParisTech-Engref - Responsable analyses qualitatives)
Experts panel
BACHELIER Bernard BARRET Danielle BOSC Pierre-Marie BUTAULT Jean-Pierre DEBAR Jean-Christophe DE LATTRE-GASQUET MarieGHERSI Gérard DELPEUCH Francis DREYFUS Fabrice GRIFFON Michel HOSTE Christian LACROIX Denis LOYAT Jacques PETIT Michel RASTOUIN Jean-Louis
Steering Committee
CARON PatrickCARSALADE HenriESNOUF Catherine GUYOMARD HervéHUBERT Bernard WEIL Alain
ALLAIRE GillesARVANITIS RigasBESSE AntoineBROSSIER JacquesCLEMENT OLIVIERCOLLEU SylvieCOLONNA PaulDELEBECQUE DenisDRONNE YvesESTABLET PierreFERLIN ChristopheFOUCHER Jean-FrançoisFRESCO Louise
…and many others
GOSSE GhislainHEBERT AnneHOULLIER FrançoisHOURCADE Jean-CharlesKARCHER IsabelleKUTAS GéraldineLEVERVE XavierPARROT LaurentRINGLER ClaudiaROUDART LaurenceSALLE ChristianTOUREAU Valérie…/…