Review of Swiss Electricity Scenarios 2050 - psi.ch · Review of Swiss Electricity Scenarios 2050...
51
PSI Bericht Nr. 14-05 December 2014 ISSN 1019-0643 Review of Swiss Electricity Scenarios 2050 Report prepared for the Group Energy Perspectives and the Swiss Competence Center for Energy Research “Supply of Electricity“ (SCCER SoE) Martin Densing, Stefan Hirschberg, Hal Turton
Transcript of Review of Swiss Electricity Scenarios 2050 - psi.ch · Review of Swiss Electricity Scenarios 2050...

PSI Bericht Nr. 14-05 December 2014
ISSN 1019-0643
Review of Swiss Electricity Scenarios 2050Report prepared for the Group Energy Perspectives and the Swiss Competence
Center for Energy Research “Supply of Electricity“ (SCCER SoE)
Martin Densing, Stefan Hirschberg, Hal Turton


PSI Bericht Nr. 14-05 December 2014
ISSN 1019-0643
Martin Densing, Stefan Hirschberg, Hal Turton
Energy Economics Group (EEG)Laboratory for Energy Systems Analysis (LEA)
The Energy DepartmentsPaul Scherrer Institut (PSI)
5232 Villigen PSI, SwitzerlandTel. +41 56 310 2361Fax +41 56 310 4411
www.psi.ch
Review of Swiss Electricity Scenarios 2050
Report prepared for the Group Energy Perspectives and the Swiss Competence Center for Energy Research “Supply of Electricity“ (SCCER SoE)
Abstract
We review recent scenario studies of the Swiss electricity system. Input assumptions and results of eight studies are compared. On the input side, potentials and costs of technologies, and the assumed socio-economic environments of the scenarios are evaluated; on the result side, we consider the elec-tricity demand, the supply mix and its costs, carbon emissions, and the flexibility of supply. We report also on the modelling frameworks of the studies with their assumptions.
If the assumptions in the postulated scenarios are considered as feasible, then the resulting pathways of the electricity system are indeed plausible; for example, the low electricity demand in some scenar-ios is a consequence of assumptions on aggressive efficiency gains in all energy demand sectors, or even due to additionally assumed behavioural changes, which are not analysed in full detail in the studies.
As a general result on the supply side, if nuclear power is phased-out, then net import or gas-powered generation is very likely needed at least in the mid-term (around year 2035), that is, before 2050 where—according to some studies and depending on the demand level—renewables could be suffi-ciently deployed. In most of the scenarios, the electricity prices will maximally double, which is partial-ly due to the higher costs of intermittent renewables, for example solar photovoltaic and wind. Some studies use models with hourly time resolution; those models show that power storage and especially the pumped-storage hydropower plants must be used more intensively in the future because of inter-mittent supply.
Hence, more advanced, future studies should analyse in more detail the link between electricity gen-eration, storage, and demand. The uncertainty in future market regulations and in energy-policy inter-ventions, as well as uncertainty in future cost and unknown decisions of competitors induce invest-ment risks for suppliers. Therefore, it is of interest to evaluate in the future studies also the profitability for different types of market participants.
1 Introduction We review selected scenario studies for the Swiss electricity system. The considered studies were published in the years 2011–2013, that is, after the severe accident in the nuclear power plant Fuku-shima in Japan of March 2011 and the subsequent decision of the Swiss Federal Council to gradually phase-out nuclear power of May 2011. Currently, the electricity generation in Switzerland relies heavi-ly on nuclear power; see Table 1 with the current supply mixes of Switzerland and neighbouring coun-tries. The principal goal of the Energy Strategy 2050 of the Swiss Federal Council is an energy supply that allows affordable prices and a level of security of supply as of today, as well as less CO2-emission than today [7]. Relative to the neighbouring countries, Switzerland has the lowest share of electricity generation from fossil fuels and from other renewable sources than hydropower (i.e., photo-voltaic, wind, biomass, geothermal); see Table 1. Consequently, a main focus in the considered stud-ies is on the supply side for these two largely unexplored options to achieve—at least partially—the goals of the Energiewende (energy transition).
The reviewed studies are listed in Table 2; the major focus of the studies is the electricity system. Hence, studies that focus on the wider economy and the entire energy system of Switzerland are not considered ([10], [18], [31]).The review aims to support decision-makers in assessing the range of
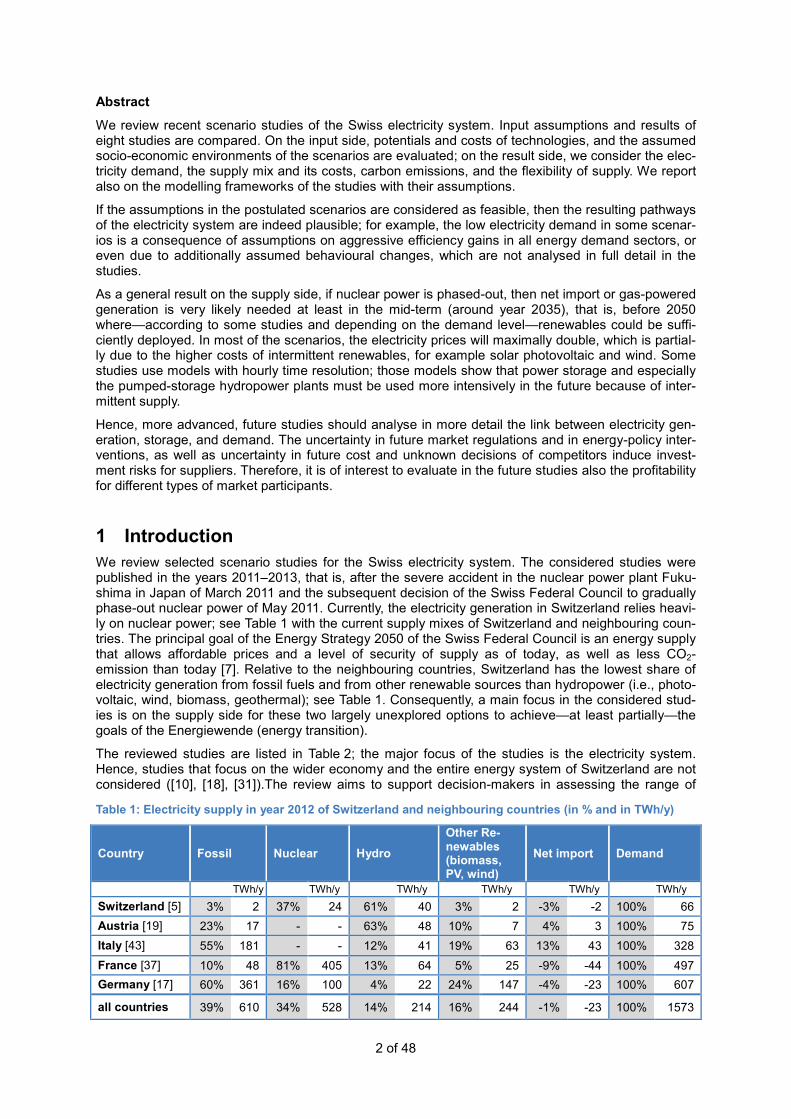
Table 1: Electricity supply in year 2012 of Switzerland and neighbouring countries (in % and in TWh/y)
Country Fossil Nuclear Hydro Other Re-newables (biomass, PV, wind)
Net import Demand
TWh/y TWh/y TWh/y TWh/y TWh/y TWh/y Switzerland [5] 3% 2 37% 24 61% 40 3% 2 -3% -2 100% 66 Austria [19] 23% 17 - - 63% 48 10% 7 4% 3 100% 75 Italy [43] 55% 181 - - 12% 41 19% 63 13% 43 100% 328 France [37] 10% 48 81% 405 13% 64 5% 25 -9% -44 100% 497 Germany [17] 60% 361 16% 100 4% 22 24% 147 -4% -23 100% 607
all countries 39% 610 34% 528 14% 214 16% 244 -1% -23 100% 1573
2 of 48

options exhibited by the different scenarios of electricity supply and demand, and it aims to help in-dustry experts and researchers to improve scenario development and model transparency.
For each scenario, the assumed socio-economic boundary conditions and the reported key drivers are reviewed. We compare input parameters, for example technology potentials and costs, and as-sumed efficiency gains (if reported). We report on details of the used modelling frameworks, their scope and implicit assumptions (in case such information is publically available). The following major groups of results are compared: electricity demand, electricity supply mix, levelized generation costs, retail prices (if reported), and CO2-emissions.
The review tries also to evaluate the robustness of scenario results with respect to the inherent op-tionality and the exogenous variability of the future electricity system. A related issue is the share of imports in the seasonal supply mix with its implications on energy security. We also evaluate how decision-making under uncertainty is taken into account; for example by deterministic (wait-and-see) decisions or by including the optionality of future decisions.
In the next section (Sect. 2), we provide for each study a short description of the scenario assump-tions, and we explain the modelling framework. In Section 3, the assumptions on electricity demand are compared. In Section 4, we report on the assumed potentials of renewable power generation. In Section 5, the annual electricity mixes over time are compared. In Section 6, we consider costs; for comparison, we focus mainly on technology costs and levelized production cost of the mix. The result-ing CO2-emissions from the generation mix are shown in Section 7. The variability and the flexibility of the supply in the scenarios are considered in Section 8. Some additional statistical charts are provid-ed in Section 9; a forthcoming research paper will elaborate more on statistical decomposition. In the conclusions and outlook (Sect. 10), we comment—among others—on the transparency of the studies, which is relevant for impartial energy policy decisions. In this regard, we extracted all the reviewed information from the published studies itself (or from clearly indicated supplementary sources that were publically available). Importantly, this review tries not to be biased towards a desirable future scenario outcome of a particular study.
Table 2: The reviewed studies and their namings in this report
Acronym Title (short) Authors Title (full) Year
BFE Energieperspektiven Swiss Federal Office of Energy (BFE) / Prognos AG
Die Energieperspektiven für die Schweiz bis 2050 [33]
2012
VSE Stromzukunft Verband Schweizerischer Elektrizitätsunternehmen (VSE)
Wege in die neue Stromzukunft – Gesamtbericht [46]
2012
ETH / ESC Energiezukunft ETH Zürich / Energy Sci-ence Centre
Energiezukunft Schweiz [1] 2011
Green-peace
energy [r]evolution Greenpeace Switzerland energy [r]evolution – Eine nachhalti-ge Energieversorgung für die Schweiz [44]
2013
Cleantech Energiestrategie Swisscleantech Business Associtation
Cleantech Energiestrategie – Richtig rechnen und wirtschaftlich profitie-ren, auf CO2-Zielkurs [2]
2013
SCS SCS-Energiemodell Super Computing Sys-tems AG (SCS)
SCS-Energiemodell – Simulation der elektrischen Energieversorgung der Schweiz anhand von konfigu-rierbaren Szenarien [40]
2013
PSI-sys PSI energy system model
Nicolas Weidmann, PhD-Thesis (PSI/ETHZ)
Transformation strategies towards a sustainable Swiss energy system – an energy-economic scenario anal-ysis [48]
2013
PSI-elc PSI electricity model Paul Scherrer Institute (PSI)
(i) Energie-Spiegel Nr. 21 [36] (ii) Swiss Electricity Supply Options:
A supplementary paper for PSI's Energie-Spiegel Nr. 21 [28],
(iii) The Swiss TIMES Electricity Model (STEM-E): Updates to the model input data [27]
2012
3 of 48

2 Summary of Scenario Assumptions and Modelling frameworks In this section, we summarize for each study (Table 2) its scope, the general scenario assumptions, and the used modelling framework; major quantitative assumptions, for example technology costs, potentials, and demand, are presented in subsequent sections. Usually the studies consider several scenarios, which allow exploring different socio-economic and political boundary conditions (see Ta-ble 4 for a list of all scenarios).
2.1 Common Assumptions Some assumptions and model restrictions are common to most of the scenarios of the studies as follows.
Nuclear phase-out This review considers only scenarios that were published after the decision of the Swiss Federal Council to phase-out nuclear power. Hence, most of the scenarios assume that nuclear is gradually phased-out. For comparison and for purpose of research, the SCS study and the PSI-elc study in-clude scenarios with new nuclear plants; similarly, for comparison, the study ETH/ESC evaluates the economic impact of the phase-out.
Separate models of demand and of supply In most of the studies, the used modelling framework separates modelling of electricity demand from modelling of electricity supply as follows. In a first step, the demand over time in a scenario is calcu-lated by a demand-side model. Then, a supply-side model matches the demand with currently availa-ble production capacity, with trade of electricity, and with new production capacity that is built accord-ing to a set of rules or an objective, for example by minimizing electricity system costs.
By contrast, a fully integrated model allows for changes in demand that are triggered by a price-signal from within the model (elastic demand model). Such an integrated model is used as a supplementary model in the ETH/ESC study; this economy-wide equilibrium model has endogenous (aggregated) energy prices. In this study, this model is used to verify qualitatively the cost-results of a supply-side model ([1], p. 42). Currently, the drawback of such models is the low detail in technology. A less inte-grated approach (but allowing more details) is the energy-system model of the PSI-sys study [48] (see also [47]): The model simultaneously optimizes the technology and fuel choices for the supply of en-ergy, for the conversion of energy, and for the end-use technologies; the energy-service demands are given as inputs. Such energy system models can evaluate the optimal substitution between energy carriers across demand sectors (e.g. fuel substitutions in the residential, commercial, and transport sector). In contrast, a (simple) demand-side-only model simulates each demand sector separately. Indeed, several studies mention that more integrated analyses could be beneficial ([46], p. 94; [33], p. 49).
Models of electricity grid The electricity grid is not properly modelled; the most detailed approach is in the SCS study, where the grid is represented simply by in- and out-feeds at several voltage levels; the representation can account for lower grid costs for decentralized generation. Nevertheless, a proper model of the grid would be a so-called power flow model (either AC flow or the more simple DC flow approximation). Consequently, reported costs for grid refurbishment and for grid expansion are almost entirely based on the two studies on the transmission and the distribution grid by the consulting company Consentec on behalf of BFE ([13], [14]); for example, the BFE and the VSE study refer to those studies. Indeed, the analysis of integrating decentralized generation (e.g. PV) into the distribution grid is an ongoing research topic in the current SCCERs (Swiss Competence Centers of Energy Research).
Models of energy markets Most of the models take the view of a central, socio-economic planner for Switzerland. The models do not consider future market designs which would satisfy stakeholders on the demand- or supply-side. For example, the BFE study mentions that “questions of the required and efficient market design are a next step” [33] (p. 799); the Cleantech study states that markets for renewables would be efficient if prices included all external costs, for example total social or life-cycle costs [2] (p. 33); though, a quantification for any technology is not given in this study.
4 of 48

The previous common assumptions, that is, (i) nuclear phase-out, (ii) separate modelling of demand and of supply, (iii) no grid and market model, are taken for granted in the in the following summary of each study and are generally not mentioned anymore.
2.2 BFE (Energieperspektiven) The author of the study is the consulting company Prognos AG on behalf of the BFE. The compre-hensive study has more than 900 pages and was published in September 2012 [33]. The scope of the study is the entire Swiss energy system until year 2050. The study considers three energy-demand scenarios and four electricity-supply scenarios.
General Assumptions Three demand scenarios are considered: Weiter Wie Bisher (WWB), Neue Energiepolitik (NEP) and Politische Massnahmen (POM). The demand scenarios are assumed to have the same overall socio-economic drivers as follows. The population is assumed to follow a single scenario, that is, the medi-um scenario A-00-2010 of the Federal Institute of Statistics (BfE), which has approximately 9 mio. inhabitants in 2050 [5]. The assumed averaged GDP growth rate between 2000 and 2050 is 1.1% (p.a., real), and is based on an estimate of SECO [41]. The historical structural changes of the econ-omy are assumed to continue: Energy-intensive primary industry and low-tech consumer industry are declining, whereas high-tech industry, e.g. chemistry and electronics, as well as the construction and the commercial service sector are expanding. The heated floor area is expanding from 709 million m2 in year 2010 to 938 million m2 in 2050, with the largest part in the housing sector, which floor area is increasing because of increasing population and of an increasing heated floor area of 74 m2 per per-son in 2050 (62 m2 per person in 2010) [33] (p. 52, p. 60).
While the general socio-economic drivers are the same in the scenarios, the low-demand NEP sce-nario assumes some future social activity changes, for example in the transport sector, where the total person-kilometres-per-year in Switzerland is lower in the NEP scenario than in WWB and POM, and transport mode is shifted to rail transport; see Table 5, and [33] (p. 67).
The discount rate is 2.5% p.a.; the discount (capital) rate is the rate to convert investment costs into yearly amortized costs by using the lifespan of a technology [33] (p. 41).
Imports are assumed to be available at requested amounts at (generally) constant pric-es [33] (p. 202); the prices are taken from other European energy studies [33] (p. 227).
Scenario Assumptions In the scenario WWB, today’s political laws and incentives will stay in place and there will be no ac-celerated energy policy and no major additional policy measures until 2050. The rate of efficiency increases until 2050 by continuing historical trends (dynamics-as-usual); the political guidelines for increased efficiency are following correspondingly. The deployment rate of electric vehicles is small (Table 5). The CO2 price increases to a moderate 56 USD(2010)/tCO2 in year 2050 (same price as in POM scenario).
The scenario NEP is a target scenario: The target is a range of 1 to 1.5 ton of CO2-emissions per person in year 2050; the NEP scenario fulfils the target of 20% CO2-reduction in year 2020 with re-spect to 2000 values. The scenario assumes strong international collaboration in technology devel-opment and in climate policy; for example, the CO2-price is assumed to be 137 USD2010/tCO2 in 2050 [33] (p. 69). In this scenario, energy service demands are assumed to be reduced by strong policy measures.
The scenario POM envisages an increased rate of energy policy measures until 2050 than today. The policy measures have a wide range, with the primary goal to achieve large efficiency gains in all energy sectors (commercial, residential, industrial, and transport sector). The envisaged measures include guidelines for increased efficiency in space heating, appliances and vehicle drivetrains.
An example of the assumed efficiency increase of appliances is shown in Figure 4 and Figure 5.
The assumptions of the electricity-supply scenarios (so-called variants) are as follows.
In variant C, the nuclear power plants are replaced by combined-cycle gas turbine (CCGT) plants that are centrally installed and fuelled by fossil natural gas. The electricity net import over a year is assumed to be zero. Renewables are supported according to today’s policy assumptions. The de-
5 of 48

ployment of decentralized CHP plants is market-driven and as well as under today’s policy assump-tions. The KEV (Kostendeckende Einspeisevergütung), that is, the tax on retail electricity prices to subsidise renewables, stays at its 2013 level of 0.9 Rp./kWh [33] (p. 201).
In variant E, the nuclear power plants are replaced by renewable generation according to ambitious deployment paths, whereas the deployment of CHP is market-driven as in variant C. The KEV in-creases to maximally 2.1 Rp./kWh [33] (p. 202). Despite the large deployment of renewables, the obtained results of the study show supply gaps, especially in the years 2022, 2035–2045 [33] (p. 6); the gaps are filled with imports.
In variant C+E, renewables and decentralized CHP are deployed as in variant E (the potentials are also the same). The KEV is maximally 2 Rp./kWh. In contrast to variant E, the supply gap is now filled by CCGT plants.
In variant C+D+E, the renewables are deployed as in variant E (renewables have also the same po-tentials as in E). The supply gap is filled by CCGT plants and in addition by an increased deployment of decentralized CHP plants. This scenario was added to the main study in an appendix.
Modelling Framework The projections on the demand-side (electricity consumption) and on the supply-side (electricity gen-eration) are calculated by bottom-up simulation models; bottom-up models are technology detailed models. Generally, the models are developed by the consulting company Prognos AG; the demand-side model for the mobility sector is originally from Infras AG.
Demand-side models: Each demand sectors of the energy systems, that is, residential, commercial, industry and transport sector, has a simulation model to project energy demands. For example, de-mand for household appliances is calculated as follows. The set of appliances is partitioned in detail, for example in different cooling, heating, electronic media, and lighting devices with own input as-sumptions. The time series that are input to the model are: the number of households, the devices’ efficiency, their size per household (includes an assumed substitution by other devices) and lifetime of the devices. The current demand is simply obtained by dividing the number of devices by its assumed efficiency, and summing over the devices. Some of the input parameters depend on policy assump-tions, for example the efficiency and size; see Figure 4, Figure 5, and [33] (p. 15).
The supply-side model of electricity generation is a simulation model with yearly time steps; each year is split additionally in a winter and summer interval. The input is the electricity demand and the potentials per technology, and the output is the generation mix and the imports. The growth rates of technologies are determined by scenario assumption. Costs have apparently no influence on deploy-ment [33] (p. 34–35, Fig. 2-9). Hence, costs are calculated after the generation mix is determined. The deployment rates of renewables, of CHP and hydropower plants are independent of the gap be-tween existing production and future demand, and are given by scenario assumptions; the only varia-bles are the amounts of import and of CCGT (p. 35). Those amounts seems actually also to be pre-determined because imports and CCGT are mutually exclusive in the scenarios (at least in the final year 2050).
The aforementioned supply-side model is a production planning model with winter and summer sea-sons; to ensure that the calculated generation capacity is sufficient also on an hourly time-scale, a dispatch-model is used in an ex-post analysis [33] (p. 7, pp. 790–830, Appendix II.3). This model has hourly time-steps with a yearly time-horizon; it is confined to Switzerland. The link to the production planning model is by the condition that the hourly electricity demand and supply add up over time to the previously determined yearly totals. The hourly demand, which is an input to the model, is a de-trended time series based on data of the years 2007–2011 [33] (p. 792). The assumed hourly genera-tion of wind power and of PV is a synthesized, “typical” profile based on data from the years 2004–2011. The production of hydro-storage plants is assumed to be the long-term seasonal average gen-eration amount [33] (p. 797). Hydro pumped-storage plants are assumed to have a maximal produc-tion of 200 GWh per year. Hence, storage options are not (yet) modelled in every detail. The dispatch model is a simulation model: The dispatch of the flexible part of generation is triggered in a fixed prior-ity order: The (pumped-) storage plants are dispatched first, and then plants as the CCGT plants that have more CO2-emissions [33] (p. 797). Results are reported in the study for the two scenarios WWB+C and NEP+C+E, which have no net-imports of electricity over the year (that is, the modelling of trade seems to be neglected).
6 of 48

2.3 VSE (Stromzukunft) The report is published by the industry organisation Verband Schweizerischer Elektrizitätsunter-nehmen (VSE) in 2012; it has 126 pages [46]. The scope of the study is the Swiss electricity system until 2050; hence, this study (as well as the SCS and the PSI-elc study) do not consider the other sectors of the energy system and can therefore focus in more details on electricity. The study consid-ers three scenarios. The modelling partner, the consulting company Pöyry, published also a comple-mentary report [32] (currently not officially linked on VSE webpage).
General Assumptions The study encompasses three scenarios, called Scenario 1, 2 and 3, which have an increasingly stringent energy policy from 1 going to 3. All three scenarios allow annual net-imports and new, cen-trally installed CCGT plants. The CO2-price increases to 60 EUR/tCO2 in 2035 and stays flat thereaf-ter for all scenarios [32] (p. 28); the increase of CO2-price is meant to reflect historically trends. The required compensation of CO2-emissions is different in the scenarios; for example, imported electricity needs a renewable certificate in Scenario 3. The influence of a different discount factor (5% or 10%) on annualized investment costs are commented in detail [46] (e.g., Fig. 6.3); nevertheless, the actual factors used in the modelling seems not to be reported in the main report [46], but only in the com-plementary report with varying factors across technologies from 8–13% [32] (Appendix A.1, p. 1., “Required return”).
Scenario Assumptions In Scenario 1, energy efficiency grows moderately. Similarly, the growth of renewables and of decen-tralized generation is moderately more than the historical trend. The increased growths are enabled by a moderately more stringent energy policy than today; hence, the policy is (slightly) more stringent that in the scenario WWB of the BFE study [46] (p. 27). The efficiency measures, for example in light-ing and heating, help to lower the growth of electricity demand. Nevertheless, the demand is assumed to increase almost linearly until 2050 by population and economic growth, by increased electric road mobility and by increased use of heat pumps, which substitute fossil fuels. Annual net-imports of elec-tricity and new CCGT plants are allowed; indeed, the model results show that both options are in-creasingly deployed until 2050. An additional scenario variant with restricted amounts of imports is used to explore the issue of energy security. The CO2-emission from CCGT plants are allowed to be compensated non-domestically within the European emission trading system [46] (p. 27). Because electricity and heat demands are relatively high, the potential for demand-side load-shifting is the largest in this high-demand and low-efficiency scenario [46] (p. 43).
In Scenario 2, the authors assume an internationally coordinated climate policy, and renewable gen-eration is assumed to be widely deployed in Europe. Stringent efficiency guidelines are in place in Switzerland and in line with those in Europe (e.g., Germany is assumed to have 62% renewable pow-er in 2050 [46] (p. 27). The demand increases until 2035 because of population and economic growth, of more electric road mobility, more heat pumps, and the lifetime of existing, less-efficient installations. The increase of demand is stopped after 2040. Imports and new CCGT plants are allowed and are intended to be used transitorily (which is also reflected in the model results).
In Scenario 3, the electricity generation is assumed to be by 100% renewables on a yearly basis in 2050. In comparison to Scenario 2, the energy policy towards more efficiency and more renewables is even more stringent in Switzerland and in Europe; for example, it is assumed that Germany’s produc-tion in 2050 is 72% renewable [46] (p. 27), an energy-plus buildings become standard [46] (p. 38). In Scenario 3, the society aims towards the 1-ton-CO2-per-person society, which implies changes in personal behaviour to enable large energy savings with declining demands towards 2050. Electric mobility increases more than in Scenario 2. Import of electricity and new CCGT plants are used transi-torily (which is also reflected in the model results). The CO2-emissions from electricity import is com-pensated fully with CO2-certificates (Grünstromzertifikate) [46] (p. 97, 98).
The CO2-price on these certificates is assumed to be 22 EUR/tCO2 in year 2015, and 60 EUR/tCO2 in 2050 [46] (p. 97), which is the common long-term CO2-price in the three scenarios.
Modelling Framework In the demand-side model, the electricity demand is reported to be split into 23 demand sectors [46] (p. 42). In each sector, the number of devices and the energy consumption per device is as-
7 of 48

sumed to follow a specific future scenario path. The assumed flexibility of demand and the win-ter/summer-share is reported to be also evaluated per sector.
The supply-side model was developed by the consulting company Pöyry AG. The cost-optimization model comprises the electricity supply sector of Switzerland as well as that of the surrounding Cen-tral-European countries. Among the input parameters are the electricity demands of Switzerland and of these European countries, which are given by the three different scenario assumptions. The de-ployment paths over time of the different renewable generation types (i.e. the yearly production by water, biomass, PV, wind, and geothermal power) are given exogenously by the scenario assump-tions. Hence, the (linear) model optimises the costs of the electricity system by choosing an optimal solution mix of new gas plants (CCGT and CHP) and import volumes. The used model with name “Zephyr” seems to be a dispatch-planning as well as a capacity-planning model (although the ability of endogenous capacity-planning seems currently not to be advertised on Pöyry’s webpage). The pro-duction mix of the surrounding countries, especially the share of renewables, is chosen to be in-line with the scenario assumption for Switzerland.
The model has hourly time steps with time horizon at year 2050. For each year, the electricity supply has to satisfy the demand in each hour for 6 different yearly weather-profiles. The profiles, which are time series of wind, of water-availability and of solar radiation, are from the years 2005 to 2010. The 6 time series can be considered as the 6 scenarios of a (simple) stochastic programming model; hence, the model solution is robust against at least some parts of uncertainty. The hourly historical data en-sures correct (auto-) correlations. The hourly time-scale allows for example to model the curtailment of wind power in order to avoid ramping costs of other, inflexible production technologies [46] (p. 79). Minimal out-of-service times and minimal operation times of large-scale plants are also modelled. It seems that CO2-costs (especially the certificates used for imports in Scenario 3 ([46], p. 97) are not included in the objective of the optimization model.
2.4 ETH/ESC (Energiezukunft) The report from the ETH Zürich has the lead author from its Energy Science Center (ESC) and was published in November 2011; the report has 48 pages [1]. The scope of the report is the entire Swiss energy system until year 2050.
General Assumptions The three considered scenarios are called Hoch, Mittel, and Niedrig. They correspond mainly to dif-ferent demand scenarios, which are related to the population scenarios of the Swiss Federal Office for Statistics [8]: Hoch, Mittel, Tief [1] (p. 18).
Scenario Assumptions The scenarios are normative: The goal is 1 ton of CO2-emission per person and year in the year 2100, which translates to 1.6 ton in 2050 [1] (p. 6, p. 11). It seems that these emissions exclude CO2-emissions from imports.
Modelling framework All models are maintained by the ETH.
A demand-side model determines the energy demands based on assumed pathways of population and of GDP, as well as by assumptions on structural changes, electricity prices and “technological innovations” [1] (p. 9). The model seems to be a simulation (or accounting) model; unfortunately, many more details are not disclosed in the study itself.
The supply-side model is a technologically detailed, bottom-up model; the main output per scenario is the supply mix of the generation technologies per year until the time horizon 2050; in addition, for the Scenario Mittel, the winter/summer share for the year 2050 is reported. The amounts of renewa-bles are determined in each scenario by the assumed socio-economic potential and by assumed de-ployment rates. The gap between the renewable generation and the given demand is assumed to be either filled by CCGT plants or by import (the share between the two options is not provided).
Complementary to the demand- and the supply-side model, an economy-wide model “top-down” model called CITE (Computable Induced Technology and Energy) is used to evaluate the response of the whole Swiss economy on the phase-out of nuclear power. The model belongs to the class of com-putable general equilibrium (CGE) models; the economic growth is endogenous in the model and
8 of 48
determined by decisions of the different agents [1] (p. 37). The production factors of the CGE model are energy, labour and capital; the factors are substitutable in the major economic sectors to different degrees. There are currently three electricity generation technologies in the model: nuclear, hydro and other renewables generation [1] (Fig. 16, p. 38); a more detailed model is in preparation [1] (p. 38). The major outputs of the model are the growth of GDP and energy prices (which include as an aggre-gate the electricity prices).
2.5 Greenpeace (energy [r]evolution) The study was published in November 2013 by Greenpeace Switzerland and Greenpeace Interna-tional and has 80 pages [44]. The scope is the entire Swiss energy system. A single scenario of the future energy system is considered.
Scenario Assumptions The single scenario is a target scenario with a reduction of 95% energy-related CO2-emissions in year 2050 with respect to 1990 [44] (p. 16). The GDP and population assumptions are from the BFE study [44] (p. 21). The electricity mix is based on the “100PRO-Strommix” of the organisation Umweltallianz [44] (p. 10, p. 21); see also [45]. This mix aims at a share of renewable production of at least 90% in 2050. The potential of geothermal power is according to the BFE study [44] (p. 10). The CO2-price is assumed to be an internationally valid price of 30 EUR(2010)/tCO2 in 2030 and 57 EUR/tCO2 in 2050 [44] (p. 67). The scenario has a variant Sufficiency, which is used for selected results. In this variant, behavioural changes in the society towards less use of energy-services are assumed: for example, the private floor area and the mobility demands in year 2050 stays on the level of 2010 [44] (p. 19).
The scenario assumes a relatively large amount of (stochastic) solar and wind generation; excess generation is assumed to be partially converted to storable energy carriers by power-to-gas technolo-gies; for example, 10 TWh per year in year 2050 of electricity are assumed to be converted into hy-drogen by electrolysis [44] (p. 77); though, the study does not report the corresponding production costs. Annual electricity imports are limited to maximal 8 TWh (this amount is actually used in inter-mediate years). We acknowledge that the presented scenario is extensively compared with the sce-nario POM from the BFE study.
Modelling Framework Greenpeace partnered with the group of Systems Analysis and Technology Assessment of the Insti-tute of Technical Thermodynamics at the DLR in Germany and used their model Mesap/PlaNet [44] (p. 21). Inputs to the model are the future shares of energy carriers and the energy demand. The en-ergy demand is based on assumptions of population, GDP, demand for mobility, floor area, and of energy intensities per economic sector. The simulation model PlaNet is representing the energy sys-tem. Hence, it incorporates the network of different energy flows and energy conversion technologies. It is a target-oriented simulation model (and seems not to be an optimization model). The model PlaNet belongs to the company Seven2One; the original version is described in [39].
To model the dispatch on an hourly time scale over a single year, the dispatch-model of the SCS study [40] is used [44] (p. 24, footnote 31). Input data is the hourly time series of weather and demand of year 2010. In a sensitivity analysis, weather data also from years 2003 to 2012 was used to test the robustness of the solution [44] (p. 29, p. 32).
2.6 Cleantech (Energiestrategie) The study has publication date January 2013 and encompasses 39 pages [2]. The scope is the entire energy system in Switzerland. The report is a summary; members of the business association Clean-tech are entitled to get more information [2] (p. 39). A single scenario is considered.
General Assumptions A major and most distinguishing assumption to other studies is that all costs in the scenario are ac-counted on their full cost basis (“Vollkostenrechnung”) [2] (Table 5, p. 33; p. 37). The authors argue that currently some (indirect) costs are neglected in evaluating energy production technologies and market prices should include all costs, which include life-cycle costs, external costs and accident risk premiums.
9 of 48

Scenario Assumptions The study considers a scenario that tries to balance between efficiency measures and expansion of renewable generation by an economically feasible pathway [2] (p. 16). The scenario is goal-oriented; the two main goals related to the electricity sector are: (i) production and import of electricity are 100% renewable in 2050 (this satisfies the related goal of 1 ton CO2 per person and per year) [2] (p. 13); and (ii) electricity production should be eventually cost-effective [2] (p. 15). The as-sumed potentials are such that their availability is proven as of today except for the speculative poten-tial for geothermal [2] (p. 15). On the demand side, it is assumed that most of the buildings are heated with heat pumps in year 2050 with an average efficiency of 500% [2] (Table 1, p. 18). The amount of electricity demand in 2050 is ambiguous: 70 TWh/y or 80 TWh/y [2] (p. 24, p. 35). To assess the mac-ro-economic impact of the scenario with the nuclear phase-out, the authors refers to the ETH/ESC study; the reduced growth of GDP is considered negligible.
Modelling Framework The model has 50 fixed parameters and 50 other parameters that are adjustable to scenario assump-tions [2] (p. 16); examples of adjustable parameters are efficiencies and potentials. More details may be disclosed to members of Cleantech.
2.7 SCS (SCS Energiemodell) The model SCS-Energiemodell of the study with the same name is developed by the consulting com-pany SCS Supercomputing Systems AG. The published information of the study so far is a slide-presentation (version 1.2, June 2013; model version 1.4 of May 2013) having 131 slides [40]. The scope of the study and of the model is the electricity dispatch in a single future year, that is, genera-tion capacities are an input to the model (capacity expansion planning is not considered). The scenar-ios encompass an example scenario and eight other scenarios, including two scenarios with demand and capacity data from the BFE study (scenarios NEP+E and WWB+C+E).
In contrast to the other studies, this study presents not a broad scenario analysis for explicit policy recommendations. Instead, the study reports examples of inputs and corresponding outputs of the proposed simulation model. One of the major goals of the model is “to be transparent and a basis for consensus” [40] (p. 5). The model “is as simple as possible and as complicated as needed” [40] (p. 6, p. 26) and “open to allow expert reviews” [40] (p. 6); though the model is not (yet) downloadable from the web site. The study mentions that the model is work-in-progress with various possible model ex-tensions, for example to calculate an optimized dispatch instead of using the current, fixed merit order [40] (p. 27).
General Assumptions In the modelling framework, the discount rate and lifetime can be chosen separately for each technol-ogy and is explicitly reported, for example nuclear power has 6% p.a. and PV has 3% p.a. [40] (e.g., p. 41).
Scenario Assumptions Two of the considered scenarios correspond to the scenarios NEP+E and WWB+C+E of the BFE study. The input parameters taken from BFE study are based on the yearly demands and the yearly generation capacity (or amount) per technology; unfortunately, the assumed electricity demand after losses seems to be the demand before losses in the BFE study [34]. The other scenarios are named: Neue Kernkraftwerke, Massiver Solarausbau, Solar- und Windausbau, Erneuerbar A – Mischszenario, Erneuerbar B – Mischszenario, and Lastverschiebung. We will compare the scenarios (i.e., the input parameterizations) corresponding to the BFE study and Neue Kernkraftwerke.
Modelling Framework The electricity system model is a simulation model and focused on supply. The model is a dispatch planning model; capacity expansion planning is not considered inside the model. The model has a time horizon of one year with minutely time steps. The supply-side of the model consists of the differ-ent generation technologies and the possibility of import/export; Wind and PV power production are a function of weather, which is modelled geographically different and time-dependent. The model con-siders hydro pumped-storage plants as well as short-term storage options in form of decentralized batteries. The electricity demand is split into a flexible and an inflexible part to model demand side
10 of 48

management. An aggregated grid is represented by four different grid levels (together with an option for a direct at-production-site consumption). The different production technologies and demands feed-in and feed-out at the different grid levels, respectively. Hence, a simplified impact on the grid of de-centralized production is captured [40] (p. 23); explicit grid expansion costs are not evaluated. To ac-count for the different hydrological and weather data from year to year, the model-runs are simply repeated with different data [40] (p. 30).
In the current modelling approach, the dispatch decisions for the different types of power plants and for storage are exogenously given; more precisely, the functional form of the dispatch control, which has as argument the state of the system, is fixed [40] (p. 13). In the case when production exceeds the demand, the dispatch is according to the following scheduling order: (i) store surplus in batteries, (ii) pump remaining surplus into-hydro reservoirs, and –finally-- (iii) export residual surplus. In the case when an unexpected intraday solar variation occurs, then the imbalance is buffered in the flexible part of the demand. The merit order of production is fixed by a “Prioritätenliste” [40] (p. 11) as follows: (i) inflexible production, (ii) PV and wind power, (iii) batteries, (iv) pumped-storage hydropower, (v) CCGT plants, and (vi) hydro-storage plants. The import and export is determined by a trading strategy that is determined based on results after a simulation run. The strategy is then iteratively improved by new runs [40] (p. 130). The production costs are also calculated after the simulation run (i.e. are not part of the dispatch decision).
2.8 PSI-sys (PSI energy system model) This study is a PhD-thesis from the ETH Zurich of year 2013 and was supervised at the Paul Scherrer Institute (PSI); the thesis encompasses 146 pages [48]. The scope is the entire energy system of Switzerland. The study considers 8 major scenario storylines; in addition, the study also includes 4 scenarios with 2012/2013-updates of energy demand assumptions, which are related to the new BFE estimates.
General Assumptions The growth of GDP from 2010 to 2050 is assumed to be 1% on average [48] (p. 106). Population growth is approximately that of BfS’ scenario Mittel [8], that is, 9 million in 2050 [48] (p. 106). The as-sumptions on the sectorial energy demands for the updated scenarios draw heavily from the BFE study [33], and they are augmented by own analysis [48] (p. 105–114). For example, the residential floor area per person is assumed to increase from 62m2 in 2010 to 74m2 in 2050 (cf. [33], p. 60), and the total vehicle-kilometres of passenger cars in Switzerland increase by 26%, which correspond to the scenarios WWB+POM of the BFE study [48] (p. 114) (cf. [33], p. 68). In all scenarios, yearly elec-tricity imports and exports are balanced; imports of other energy carriers are generally unlimited. Geo-thermal energy is not considered. The discount rate is 3%.
Scenario Assumptions The study considers 8 major scenario storylines. We focus on the two additional scenarios with the updated demand assumptions [48] (pp. 115).
In scenario noClimPol, there is no new climate policy in addition to today’s policy.
In scenario 50%, the CO2-emissions from the energy sector are limited in year 2050 to be 50% of those in year 1990.
Modelling Framework On the demand side, the useful-energy demands (energy services) of the end-use sectors are ob-tained by a simulation model [48] (p. 107, p. 109). The time series of the sectorial demands are driven by several factors, for example: population and GDP growth, floor area, number of appliances, heat-ing reduction by climate change, efficiency of end-use technologies, and assumed behavioural changes.
The supply-side model, called SMM (Swiss MARKAL Model), is developed by the Paul Scherrer Institute. It is an energy-system model from the family of MARKAL models, which are technology de-tailed, bottom-up models. The model is a capacity planning models of the energy system which de-termines the cost-optimal mix of technologies. Hence, SMM is mainly a supply-side model with some demand-side aspects (see below). The model considers the entire Swiss energy system, including the network consisting of energy imports, energy conversions, and different end-use demand sectors. The
11 of 48

SMM identifies the least-cost combination of fuels and technologies to satisfy energy service de-mands in Switzerland. It is used for deterministic scenario evaluations (perfect foresight).
As an example of the technology detail of SMM in the end-use sectors, the service sector is split into cooling, cooking, space heating, hot water, lighting, office, and refrigeration; each subsector can be satisfied by different end-use technologies. The time horizon is year 2050 with 5 year time steps. The period of each time step is divided into different typical profiles having different demand and supply assumption (time slice). Each time slice corresponds to a season (winter, summer, intermediate) and is either peak or off-peak. Hence, the model has 6 time slices.
The final energy (demand) consumptions are determined by the optimization model itself, while the energy service demands, for example, the amount of kinetic energy or the heated floor area, are giv-en as input to the model. Nevertheless, insulation is modelled also as an end-use technology to allow heat reductions by more insulation. Because the entire energy system is modelled, optimal system-wide effects can be quantified, for example energy substitutions between the electricity sector and the different heating sectors. The system-wide energy model has some simplifications: For example, hy-dropower is modelled as an aggregated single technology.
Complementary to the thesis [48], an analysis of the Swiss energy system is provided also in [47]; in that scenario analysis, the electricity sector is modelled by the more detailed model of the PSI-elc study (Sect. 2.9).
2.9 PSI-elc (PSI electricity model) A summary of results of the study is published by the Paul Scherrer Institute (PSI) on November 2012 in form of PSI’s periodical Energie-Spiegel No. 21, which is a 6-page leaflet [36]; the full study is a 122-page report [28], and more data assumptions are in [27]. The scope is the electricity system in Switzerland (and not the entire energy system). Nine different scenarios are considered.
General Assumptions Common assumptions across the scenarios are the technology costs over time, and the potentials of renewable generation technologies. Across the scenarios, the cost-optimization methodology is used to determine the supply mixes. The discount rate is 2.5%.
Scenario Assumptions The study reports results for three demand variants and three supply variants, which are combined to 9 scenarios. The three demand variants have the electricity demands of the scenarios WWB, NEP, and POM of the BFE study [33]. The assumed CO2-prices are also according to these scenarios.
The supply variant Gas is a nuclear phase-out scenario. New, centrally installed gas plants, as well as gas-fired CHP plants can be deployed (gas plants having 550 MW unit size). Annual net-imports are constrained (approximately) to be zero.
The supply variant Import is also a nuclear phase-out scenario, but new gas and new CHP plants are not allowed. In demand variant POM, maximally 1/5th of yearly demand is allowed to be satisfied by imports [36] (p. 3); in variant WWB, imports are maximally 1/3rd of demand.
In the supply variant Nuclear, new nuclear plants are allowed to be build (1 GW unit size).
Modelling Framework The used model, called STEM-E (Swiss TIMES Electricity model), is developed by PSI. It is an ener-gy-system model from the family of TIMES energy-system models. TIMES models are technology detailed, bottom-up cost-optimization models. The time horizon is year 2100. The model allows ca-pacity planning as well as (simplified) hourly dispatch optimization; the optimization identifies the least-cost combination of fuels and technologies to satisfy electricity demands. The model is a deter-ministic model (Indeed, the perfect-foresight planning assumption is used in all models of the other studies except of the VSE study, which applies some simple form of robustness analysis). For capaci-ty expansion, the time step is 5 years until 2025, and then 11, 14, and 15 years. At each time step, the yearly interval is divided into different demand and supply profiles, which are called time slices (typical days with hourly profiles). Each profile is a combination of a season (winter, spring, summer, fall), day (workdays, Saturday, Sunday), and hours; hence, the model has 4*3*24=288 time slices.
12 of 48

The cost parameters of technologies encompass the investment costs, fixed and variable operation & maintenance costs; those costs can vary over time. The CHP plants receive a cost-credit for heat production. CO2-costs from domestic production are included in the cost-optimization [28] (p. 12). Some detailed characteristics of technologies are included, for example, the model considers the storage and pumping in hydropower, and individual wind and solar generation per time slice. Electrici-ty imports are also limited by an (aggregated) interconnector capacity.
More details on input data, including the used weather and hourly demand variation, is published in [27]. As an example, the wind data is from the year 2011 from the Jurassic mountains. The model is currently extended into two directions. The first is to extend the model into a multi-regional model to allow realistic trading with the surrounding countries. The second extension is widening the model into an energy-system model for Switzerland, similarly to the approach of the PSI-sys study (Sect. 2.8), but having more time slices than six.
2.10 List of Models and Scenarios In the previous section, a synopsis of the studies and their scenarios was presented. To provide an overview, the modelling approaches are summarized in Table 3, and the scenarios are listed in Ta-ble 4.
As indicated in Table 4, most of the scenarios are included in the comparison in the following sections; excluded are some of the various scenarios of the SCS study, which are primarily re-parametrizations of the model input, and BFE’s scenario variant D with the larger deployment of CHP plants. We ex-cluded this BFE variant because (i) it was added later on to the BFE study in an appendix, (ii) all the studies (apart from this scenario variant) do not model in detail the difference between a centralized (large) and a decentralized (small) CHP plant, (iii) results specifically for CHP plants are only scarcely reported separately in the studies (apart from results for generic fossil or biomass plants), and (iv) the difference in terms of cost, of security of supply and of emissions between a CHP plant and the alter-native of having a CCGT plant plus a heat pump (plus optionally a boiler to yield high water tempera-tures) may be small; see the exhaustive discussion in the VSE study [46] (p. 58, p. 80).
Table 3: Summary of the modelling approaches of the studies
Study (elec-tricity sector only)
Demand model (if no model: data from)
Capacity planning model
Dispatch planning model
Modelling of energy system network
Speciality
BFE Simulation Simulation Simulation na
VSE (elc) Simulation Optimization na Cap./Disp. planning model also for neighbouring countries
ETH/ESC Simulation Simulation na na A 3rd model is used for the whole economy (labour, capital, energy)
SCS (elc) (from BFE) na Simulation na Model is only for year 2050
Greenpeace Simulation Simulation (from SCS) yes Electricity demand is endoge-nous
Cleantech Simulation Simulation na na no costs (not even ex-post)
PSI-sys Optimization na yes Electricity demand is endoge-nous
PSI-elc (from BFE) Optimization na «Typical hour» for dispatch
13 of 48

Table 4: The scenarios of the studies (and indication whether they are compared in this review)
Study Scenario Description Compared
BFE WWB+C no increased energy policy; central CCGT Yes
WWB+C+E no increased energy policy; central CCGT, and increased renewable incentives / potentials
Yes
POM+C strong efficiency measures; central CCGT Yes
POM+C+E strong efficiency measures; central CCGT and increased renewable incentives / potentials
Yes
POM+E strong efficiency measures; imports and increased re-newable incentives / potentials
Yes
NEP+C strong CO2-target; central CCGT Yes
NEP+C+E strong CO2-target; central CCGT and increased renewa-ble incentives / potentials
Yes
NEP+E strong CO2-target; imports and increased renewable in-centives / potentials
Yes
X+C+E+D “X” is either WWB, POM, or NEP scenario; in addition: increased CHP incentives / potentials
No
VSE Szenario 1 high demand, low efficiency Yes
Szenario 2 medium demand, more efficiency Yes
Szenario 3 low demand, stringent efficiency, behavioural changes Yes
ETH / ESC Hoch high demand, high population Yes
Mittel medium demand, medium population Yes
Niedrig low demand, low population Yes
Greenpeace - strong move to renewables and energy alternatives (e.g. hydrogen production/storage)
Yes
Cleantech - market-oriented deployments; full-cost accounting (life-cycle, external and insurance costs)
Yes
SCS NEP+E parameterization from NEP+E Yes
WWB+C+E parameterization from WWB+C+E Yes
Neue Kernkraftwerke moderate demand; new nuclear plants Yes
other scenarios Scenarios: „Solarausbau“, „Solar- und Windausbau“, “Erneuerbare A“ und „B“, „Lastverschiebung“
No
PSI-sys noClimPol no additional climate policy; annual net-import is zero Yes
50% -50% CO2-emission of entire energy sector; annual net-import is zero
Yes
other scenarios scenarios with older demand assumptions No
PSI-elc X + Gas “X” means that demands and CO2-price are as in WWB, POM or NEP; central CCGT; annual net-import is zero
Yes
X + Import “X” means that demands and CO2-price are as in WWB, POM, or NEP; no central CCGT; annual net-import possi-ble
Yes
X + Nuclear “X” means that demands and CO2-price are as in WWB, POM, or NEP; new nuclear plants possible; annual net-import is zero
Yes
14 of 48

3 Electricity Demand The historical growth of electricity demand in Switzerland is shown in Figure 1; for example, in abso-lute numbers, the demand in the year 1970 was 25 TWh (after losses) and increased to 59 TWh in year 2012. Historically, the electricity demand growth rate is comparable to that of GDP, whereas it was higher than the population growth rate (Figure 1). Figure 1 shows also that demand seems to decouple from GDP starting in year 2005 to today; but drawing conclusions based on this short-term observation may not be valid.
Apart from the historical corre-lation with the macro-economic drivers of population and of GDP, more electricity demand is clearly needed by additional end-use devices, for example by more installations of heat pumps and more personal elec-tric mobility. Demand is re-duced by higher efficiency; a predominant example is elec-tricity for heating, where re-sistance heating can be substi-tuted in principle by heat pumps (heat-pump space heat-ing, heat-pump washing ma-chine); other areas for large efficiency gains are illumination (e.g. using LED) and applianc-es (e.g., using zero stand-by mode). The electricity demand for a device (of standard size) is simply the number of devices in Switzerland multiplied by its inverse efficiency. The number and the kind of devices may be difficult to predict in year 2050, that is, for a time span of 36 years; for example, the notion of a smartphone or of a personal computer was not widely known 36 years ago. For each economic sector, the BFE study [33] tries a detailed accounting to estimate the number/sizes of devices and their assumed future energy consumption; the study VSE [46] considers also 23 economical subsectors with their efficiency and growth potentials (see also Sect. 2.2 and 2.3). The other studies that have an explicit demand-side model seem to apply a more generic approach with more aggregated assumptions on efficiency gains.
Despite the fact that (in all studies that have a demand-side model) assumptions on the split of elec-tricity consumption into the determining factors, which consist of efficiency, usage time, structural shift, and of installation size, were made at least implicitly, the quantitative split into those factors for each economic subsector are not reported in most studies. Hence, a proper assessment of the feasibility of the demand for Switzerland is difficult. An exception is the BFE study that tries to report the decompo-sition in more detail (see below); consequently, the studies that build on those assumptions can bene-fit, for example the PSI-sys study. In summary, the electricity demand scenarios are shown in Fig-ure 2.
Scenarios that have relatively low demands are BFE’s NEP and POM scenario, VSE’s Scenario 3 and Greenpeace (Figure 2). To yield the very low demands of BFE’s NEP and of VSE’s Scenario 3, ag-gressive efficiency measures are not enough; these scenarios explicitly assume behavioural changes in society for energy use (cf. Sect. 2.2, Sect. 2.3). In these low demand scenarios, demand is usually assumed to be declining already in the coming years. An exception is VSE’s Scenario 3, which as-sumes more inertia in the energy system; in fact, in all VSE scenarios, the demand (and the genera-tion mix) is assumed not to change drastically before the year 2035 [46] (p. 98).
A special case is the electricity demand of the PSI-sys study [48]: The demand is determined endoge-nously by the cost-optimal solution of the whole energy system. The result is that even in the stringent climate policy scenario of 50% CO2-reduction, more electricity is needed (see Figure 2) to increase efficiency in the energy system and to substitute combusted oil products by the less CO2-intensive
Figure 1: Historical growth of GDP, electricity demand and of popu-lation in Switzerland. Demand: after losses, no heating-days cor-rection. Sources: BFE (energy), BFS (pop), SECO (GDP)
15 of 48

power generation from gas. We will see in the production mix in Chapter 5 that in this stringent climate scenario, additional fossil power plants are deployed (without carbon capture), which implies that high CO2-reductions may be possible with relatively low cost in other sectors of the energy system.
3.1 Assumptions on Mobility and Efficiency As mentioned previously, the split of the electricity demand into its components is in most cases not reported transparently; we try to report in this section some numbers focusing on mobility and effi-ciency. Historically, mobility demands were increasing. For example, the number of train-kilometres increased from 135 mio. vehicle-km (v-km) in year 1990 to 188 mio. v-km in year 2012 (+39%), and the travelled distance of personal cars increased from 42,649 mio. v-km in year 1990 to 52,582 mio. v-km (+23%) [9].
Figure 3 shows the distance travelled by personal cars and the distance per person: The number of driven car kilometres increases (more or less) linearly, and the increase since year 1990 seems to be mainly due to the increasing population. As a remark, general travel demand per person is still in-creasing since 1990 because of to the increasing air transport per person. Selected assumptions of some studies on future mobility and specifically on electric personal mobility are listed in Table 5. Sur-prisingly, most of the studies report electric mobility as an approximate 40% share in 2050 in many scenarios (with different definition of vehicles). Note again that the PSI-sys study evaluates a cost-optimal mix of car technologies.
Figure 2: Electricity demand of the scenarios. Demand is after hydro-pumps, after import/export, and before losses. The demands of the SCS scenarios should be those of the BFE scenarios with same name, but seem to be different. The PSI-elc study (not shown) uses the demands of the BFE scenarios. Greenpeace: without electricity used for H2-production
16 of 48

The assumption on the future electricity demand for Switzerland is always reported (see Figure 2 above), but the future efficiency of a device or of a specific energy sub-sector to achieve the demand is not always reported in detail. Moreover, different definitions of energy sectors and of efficiency may be used across the studies. Reporting merely demand projec-tions (even if reported by energy-sector) inhibit an evaluation of the underlying assumptions. A small collection of efficiency assumption is shown in Table 6. Figure 4 and Figure 5 show the large efficiency gains in the household sector that are assumed in the BFE study; most of devices have an assumed demand reduction by around 50% until 2050, with a maximum of 90% for lighting. For the same BFE study, Figure 6 and Figure 7 show the large decrease in heating energy per square meter needed in the residential sector; in scenario NEP in 2030, all new and all refurbished houses are near or below of 10 W/m2, which is in the range of the theoretical efficiency of the stringent Minergie-P standard. The BFE study also assumes that the renovation rate in NEP and POM is doubling, such that in 2050 nearly all buildings are renovated or newly build.
Figure 3: Driven distance of personal cars (including 10% non-domestic cars), and driven distance per person. Source: [9]
Table 5: Scenario assumptions on electric mobility and transport demand in selected studies (BEV: Bat-tery electric vehicles; PHEV: Plugin-hybrid-electric vehicles)
Study Electric mobility Demand
BFE 41% electric personal cars (BEV, PHEV, H2-fuel cell vehicles) in scenario NEP and POM; 30% in scenario WWB [33]
In scenario WWB and POM, personal transport increases +30% (p-km/y) until 2050 with respect to 2010 [33] (p. 68); per-sonal rail increase by +62% (p-km/y) and cargo rail by +88% (ton-km/y). In scenario NEP, personal transport increases +25% (p-km/y) until 2050; personal rail and cargo increases both by +105% (p. 68).
ETH/ESC 40% (v-km/y) by electric personal cars [1] (p. 15), corresponding to +4 TWh/y in 2050 (p. 15)
Personal transport: Driven vehicle distance (v-km/y) is approximately the same as in 2010 [1] (p. 15)
Greenpeace 42% are electric vehicles in 2050 (incl. H2-fuel cell vehicles with H2 from electrolysis) [44] (p. 25). Shares of cars in 2050: 28% BEV, 14% Hydrogen/Methane, 39% Hybrid electric, 17% Biogas/Biodiesel, 2.5% Die-sel/Gasoline (p. 11).
In the scenario variant “Suffizienz”: Demand is as of today [44] (p. 26)
Cleantech 40% vehicles in 2050 are mainly driven by electric motor [2] (Tab. 1, p. 18)
Personal transport: +20% (p-km/y) ; cargo transport: +40% (t-km/y) in 2050; 20% of today’s personal transport shifts to public transport; 22% of road-cargo shifts to rail in 2050
PSI-sys In the 50% CO2-reduction scenario in 2050, the cost-optimal mix for the energy-system is 40% (v-km/y) H2-fuel cell cars and 60% gas-fuelled hybrids. In the No-climate-policy scenario, 100% gas-fuelled hybrids are cost-optimal [48] (p. 119)
Increase of +26% (v-km/y) demand in pas-senger cars in 2050 [48] (p. 114). Rail pas-senger demand +40%, and rail cargo de-mand +75%.
17 of 48

Table 6: Assumptions on demand reduction per energy service until year 2050 (inverse efficiency)
Study Household Sector Industry Sector Commercial Sector
BFE see Figure 4 and Figure 5 [33] -31% in 2050 (technical potential) [46] (p. 34)
-42% in 2050 (tech-nical potential) [46] (p. 34)
Cleantech Heat: -60% (-30% up to -35% for old build-ings); -35% for appliances in 2050. Average efficiency of heat pumps: 500% [2] (Tab. 1, p. 18)
Heat: -20%; specific energy: -35% in 2050
Greenpeace Average efficiency of heat pumps: 400% [44] (p. 25)
PSI-sys based on BFE based on BFE based on BFE
Figure 4: Electricity demand reduction of household devices in scenario POM of BFE study
Figure 5: Electricity demand reduction of household devices in scenario NEP of BFE study
Figure 6: BFE study: Heating energy per m2 for multi-family houses (EBF = Energiebezugsfläche)
Figure 7: BFE study: Heating energy per m2 for sin-gle-family houses (EBF = Energiebezugsfläche)
The possibility of demand-side management is addressed in some of the studies. The ETH/ESC study reports an aggregated potential [1] (Fig. 9, p. 28), and the VSE study provides estimates for the possible shift of parts of the demand in terms of time and power. For example, the VSE study esti-mates the flexible power to be 2.4 TWh per year in Scenario 2. This Scenario 2 has relatively few competing efficiency measures that may reduce this potential. For comparison, Scenario 3 has only an estimated potential of 0.7 TWh in 2050 [46] (p. 43). The VSE study reports also possible demand reduction from smart metering: A mentioned field study yielded merely 3% reduction over year [46]
18 of 48

(p. 78). It is also reported that the existing Rundsteuerung (for boilers, resistance-storage heaters and heat pumps) seems to be already quite effective in many balancing zones [46] (p. 41). The SCS study considers a potential for demand-shifting in its dispatch-model.
4 Potential of Renewable Technologies The potential of a technology is its maximally possible deployment amount; the VSE study explains six different definitions of “possible” [46] (p. 30). The technical potential, which neglects the political and socio-economic barriers, is usually the highest. In the considered studies, the maximal deploy-ment of a technology is usually the economic and socially acceptable potential, where “economic” means usually from a system viewpoint (macro-economic); the realizable potential in a market-oriented future can be lower, because market players may not choose the technology, for example because of an unacceptable investment risk. The reported potentials of renewable generation are shown in Figure 8; the figure shows also the maximal deployment over the scenarios for each study, which is lower or equal to the potential.
In the following we comment on the potential of the renewables.
4.1 Hydropower Potential The additional hydropower potential in the studies are shown in Figure 8. The largest additional poten-tial is from the BFE study (8.6 TWh/y); for comparison, the production of the nuclear power plant Leibstadt in year 2010 is 8.8 TWh/y. A recent report of the BFE re-examines the potential to be lower: Under today’s dispatch decisions, the net potential of new installations and of extensions is assumed to be 1.5 TWh/y, whereas under an optimized dispatch, the net potential is assumed to be 3.2 TWh/y [6]. Generally, the economic potential of additional hydropower is limited for the following reasons.
• The most suitable plant sites are already taken
Figure 8: Assumed potentials of renewable generation, and maximal production in the studies. Hydro (new installations): with respect to 2010 production. ETH/ESC: “max. prod.” is scenario “ETH, Mittel” (the only reported one). BFE: max. prod. occurs in supply variants “C+E” and “E”. PSI-sys: biomass is with 33% efficiency in this chart, and is also for non-electricity use; geothermal not in study. PSI-elc: Biomass: 50% of potential of all biogas & waste (also for non-energy use). SCS: the max.prod. in the 3 scenarios that are considered in more detail in this review are reported separately
19 of 48

• Environmental issues disfavour a further expansion of hydropower (this is the main reason for the relatively low potentials in the Greenpeace and Cleantech study).
• Specifically, stronger future regulations for higher residual running-water amounts reduce the flexibility of the plants. The reduction is expected to be in the range of 1.4 TWh/y [33] (p. 233) to 2 TWh/y [46]. Climate change may affect also flexibility; for example, peak levels in rivers are ex-pected to come earlier in summer/spring [33] (p. 795).
• In the coming years, many power producers must re-lease plants from the communities at possi-ble higher prices (“Heimfall”), such that investments in existing plants may be delayed to after the Heimfall [46] (p. 94).
• If hydro-storage plants are extensively used to balance stochastic solar and wind production, then the increased wear-down of machinery and the rapid change of water levels in rivers may cause additional costs or additional restrictions [49].
• Water inflow is lower in winter in Switzerland, when the electricity demand is higher in Switzer-land. This limits the usefulness of additional small hydro plants that have only small or no storage capacity.
4.2 Biomass Electricity Potential The data sources for the estimates on electricity from biomass and for the initial estimates on primary biomass are listed in Table 7. The mostly cited report is from INFRAS [4]: The ecologically sustainable biomass potential is estimated to be 35 TWh/y in primary energy units, from which approximately 15 TWh/y are currently harvested for energy and non-energy purposes. Biomass consists currently mostly of wood and dry waste; a large remaining potential useful for electricity production is wood, but also stover and dung from agriculture (approximately 12 TWh/y [4]). A large share of biomass (espe-cially wood) is usually expected to be directly converted into heating energy or into biofuels for mobili-ty. The estimated potential of biomass for electricity in the studies is shown in Figure 8. The figure shows that the potential dedicated for electricity is approximately not more than 5 TWh/y in most of the studies (after conversion losses in units of electricity). Because biomass can be used also outside the electricity sector, an integrated energy system model as in the PSI-sys study is advantageous to analyse the fuel competition between the transport, heat and power sector. Table 7: References of biomass potential
Reference Ecologically sustainable potential (primary energy) in reference
cited by
INFRAS [23] 35 TWh/y (15 TWh are currently used)
Greenpeace, BFE, VSE, PSI-sys
SATW [38] (cites also [23]) 33 TWh/y PSI-elc
Steubing [42] 23 TWh/y (12 TWh are currently used)
ETH/ESC
no reference Cleantech, SCS
4.3 Wind Potential In principle, wind power provides a beneficial diversification effect to solar power because times of high wind speeds are only faintly correlated with sunshine, and wind speed in Switzerland is slightly higher in winter. For example, approximately 60% of yearly generation is in winter; e.g., see [33] (p. 219; Figs. II.3-3, 3-4, p. 795–796). Drawbacks of wind power are the environmental (mostly visual) impact in the elevated areas of the Jurassic mountains and Alpine regions. Except for the higher esti-mate of the study Cleantech (7 TWh/y), the socio-economic potentials of the studies are all approxi-mately around 4 TWh/y (Figure 8). With an average power of roughly 2 W/m2 (on-shore wind in Eng-land [30]), the required area of the wind parks is 4e12/8760/2= 228e6 m2, which is roughly the size of Kanton Zug (239 km2). According to Table 8, the potential of 4 TWh/y is essentially based on a single study.
20 of 48

Table 8: References of wind potential
Reference Socio-economic potential in reference
cited by
Hirschberg et al. [21] 4 TWh/y (2.8 TWh/y in wind farm + 1.2 TWh/y stand-alone)
BFE, PSI-sys (cites BFE)
Energie-Trialog [11] (meta-study; cites also [21])
0.4 to 4 TWh/y VSE, ETH/ESC (cites also the study Clean-tech and a precursor study of VSE)
Umweltallianz [45] 1.5 TWh/y in 2035 (400 tur-bines)
Greenpeace (assumes that efficiency in-crease allows 4TWh/y with same number of turbines)
SATW [38] (cites also [21]) 4 TWh/y PSI-elc
- Cleantech
Simulation tool: meteonorm (Solar/Wind Statistik CH)
7 TWh/y SCS
4.4 PV Potential The assumed potential of production from PV in Switzerland is shown in Figure 8. In most of the stud-ies, it is assumed that PV panels are attached to buildings, which corresponds to a potential between 9 and 18 TWh/y; the original references are traced back in Table 9. Cleary, the technical potential of PV that can be installed on the ground is larger. The study Greenpeace recommends also installations on avalanche barriers, hydro damns, and sound protection walls [44] (p. 22); this may explain the larger potential in this study, which is nevertheless not fully used in the Greenpeace scenario. A large deployment of PV may compete with solar heating; for example, the study Cleantech states that in their scenario solar “energy” is used for 40% of hot water demand, whereas 30% of all rooftops should be used for PV [2] (p. 20). Combined heat and PV panels may help to achieve this dual-use of rooftops [12]. Clearly, the summer half-year share of PV production in Switzerland is larger (approxi-mately 73%) [33] (p. 219). But PV output in winter can be relatively high in high-mountain places, which is taken into account in the Cleantech study [2] (p. 30) and the SCS study. Table 9: References of PV potential
Reference Socio-economic potential cited by
Hirschberg et al. [21] 9.78 TWh/y in their scenario „high“
BFE, PSI-sys (which cites BFE)
Energie-Trialog [11] (meta-study; cites also [21])
0.2–9.7 TWh/y PSI-elc, ETH/ESC (which cites also the study Cleantech and a precursor study from VSE)
IEA [22]
18 TWh/y technical potential on rooftops and on facades of buildings with 10% efficiency; utilization factor of 55% per building ground area
Greenpeace, VSE
Simulation tool: meteonorm (So-lar/Wind Statistik CH)
rooftop: 9 TWh/y, mountain: 12 TWh/y
SCS
no reference Cleantech
4.5 Geothermal Electricity Potential All the studies agree that the geothermal potential for electricity production is uncertain; the PSI-sys study has no geothermal electricity potential at all. For the physical potential, the studies usually refer to Hirschberg et al. [21] (see Table 10). Unfortunately, how much of the physical potential can be tapped must first be evaluated by various test drillings in the upcoming years.
21 of 48

Table 10: References of Geothermal potential
Reference Socio-economic potential cited by
Internal BFE Report (2011) 0.4 TWh/y (assumed in the BFE study to be expandable to 4.4 TWh/y)
BFE (which is cited by ETH/ESC, Greenpeace, and PSI-elc). ETH/ESC cites in addition: VSE and Cleantech
Hirschberg et al. [21] Mainly the physical potential is referenced in the studies (the con-tinuous thermal conduction is ap-prox. 3 GW over surface of Swit-zerland; stored heat >> 1000 TWh)
BFE, VSE
no reference Cleantech, SCS
5 Yearly Electricity Supply Mix In this section, we compare the yearly production and import of electricity, and the corresponding in-stalled capacities.
5.1 Yearly Electricity Production The assumed electricity supply mix of the studies is shown in Figure 9, Figure 10, Figure 11, Fig-ure 12 and Figure 13 for year 2050, 2040, 2035, 2030, and 2020, respectively; missing values in a specific year were linearly interpolated. We highlight some selected topics in Figure 9.
BFE study: In the renewable scenario NEP under all supply variants, net imports or CCGT plants are needed mainly during winter in 2050 [33] (p. 203); see also Figure 23. In the POM and NEP scenarios with CCGT plants and with the enforced renewable deployment of variants C and E, Switzerland can become a net exporter in summer in 2050; see also Figure 23 (if the assumed international market prices are feasible). In all scenarios in earlier years, CCGT plants or imports are extensively needed (Figure 11).
VSE study: In Scenario 1, 23% of the Swiss supply are imports in year 2050 [46] (p. 70). In Scenar-io 2, imports reach also a very high level of up to a quarter of demand in intermediate years [46] (p. 71). In Scenario 3, which is a strong-policy scenario, imports increase in 2015 to 2035 considera-bly more than in the other two scenarios because domestic capacities are missing (30% in 2035); see Figure 11. Nevertheless, the decreasing demand and increasing production from renewables allows in
Figure 9: Yearly production mix in 2050.
22 of 48
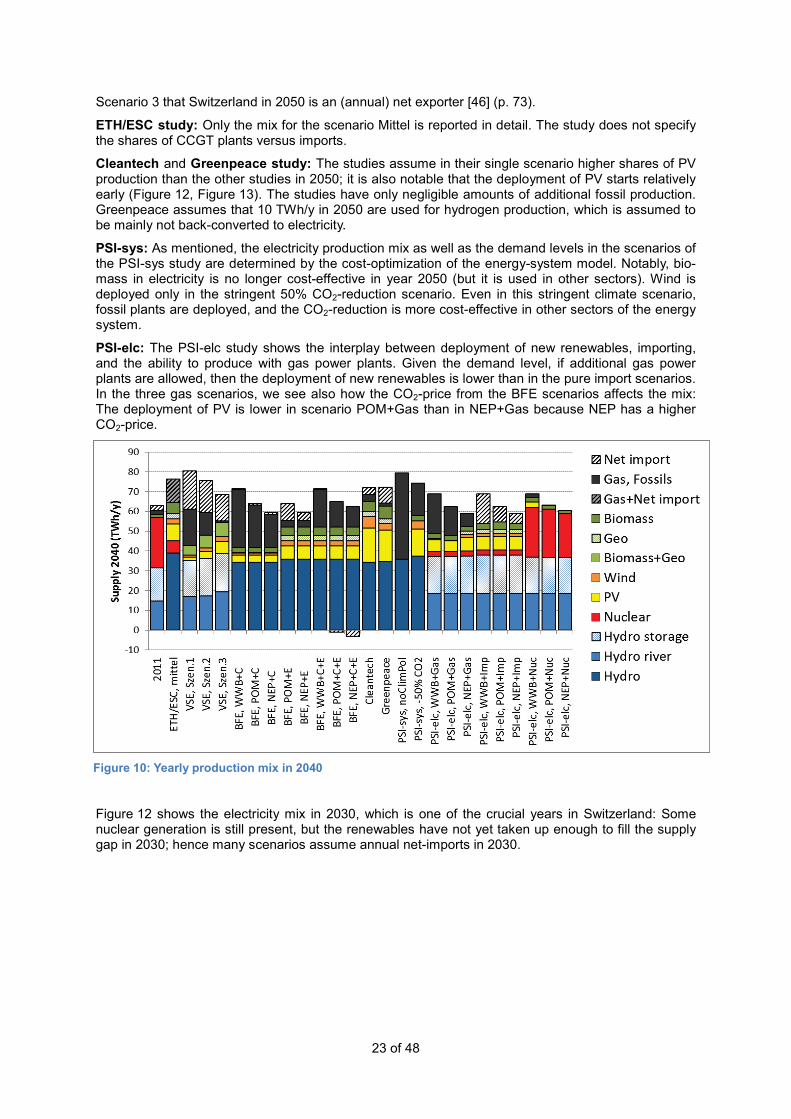
Scenario 3 that Switzerland in 2050 is an (annual) net exporter [46] (p. 73).
ETH/ESC study: Only the mix for the scenario Mittel is reported in detail. The study does not specify the shares of CCGT plants versus imports. Cleantech and Greenpeace study: The studies assume in their single scenario higher shares of PV production than the other studies in 2050; it is also notable that the deployment of PV starts relatively early (Figure 12, Figure 13). The studies have only negligible amounts of additional fossil production. Greenpeace assumes that 10 TWh/y in 2050 are used for hydrogen production, which is assumed to be mainly not back-converted to electricity.
PSI-sys: As mentioned, the electricity production mix as well as the demand levels in the scenarios of the PSI-sys study are determined by the cost-optimization of the energy-system model. Notably, bio-mass in electricity is no longer cost-effective in year 2050 (but it is used in other sectors). Wind is deployed only in the stringent 50% CO2-reduction scenario. Even in this stringent climate scenario, fossil plants are deployed, and the CO2-reduction is more cost-effective in other sectors of the energy system.
PSI-elc: The PSI-elc study shows the interplay between deployment of new renewables, importing, and the ability to produce with gas power plants. Given the demand level, if additional gas power plants are allowed, then the deployment of new renewables is lower than in the pure import scenarios. In the three gas scenarios, we see also how the CO2-price from the BFE scenarios affects the mix: The deployment of PV is lower in scenario POM+Gas than in NEP+Gas because NEP has a higher CO2-price.
Figure 10: Yearly production mix in 2040
Figure 12 shows the electricity mix in 2030, which is one of the crucial years in Switzerland: Some nuclear generation is still present, but the renewables have not yet taken up enough to fill the supply gap in 2030; hence many scenarios assume annual net-imports in 2030.
23 of 48
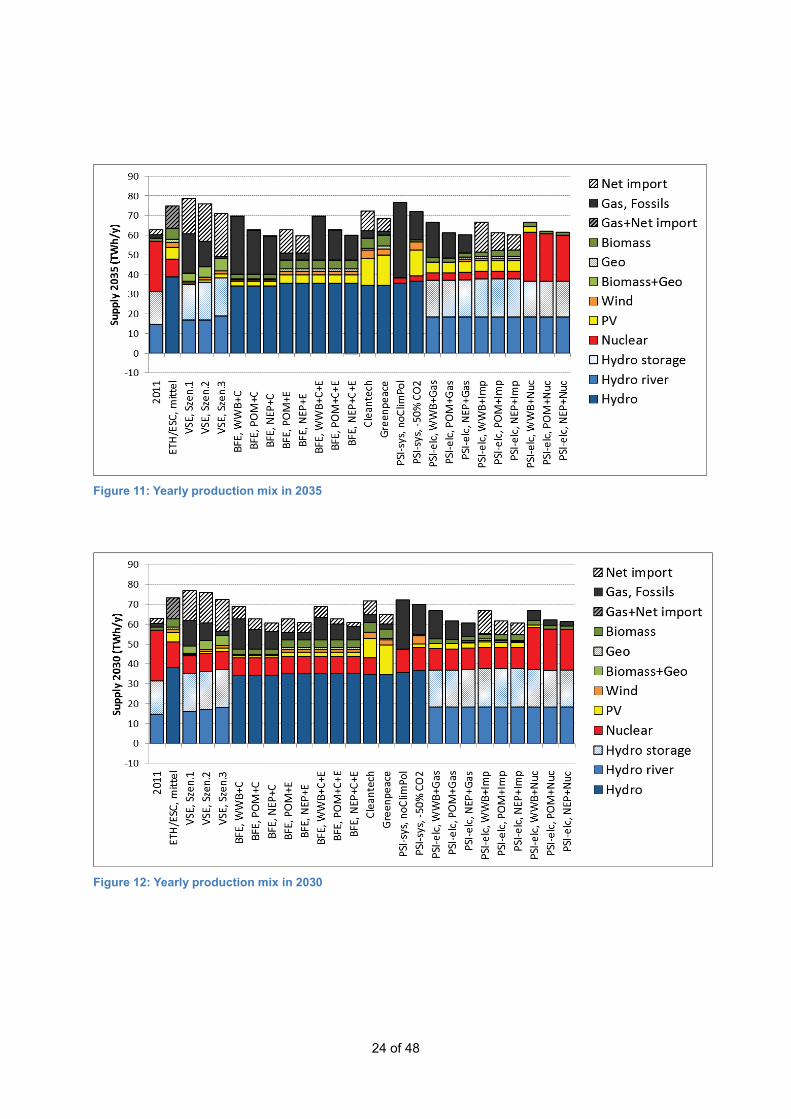
Figure 11: Yearly production mix in 2035
Figure 12: Yearly production mix in 2030
24 of 48

Figure 13: Yearly production mix in 2020
5.2 Capacity of Power Generation Installed capacity for some technologies is reported only in some studies. In fact, the capacity can in principle be calculated from the yearly production and by assuming a load factor; we compare only capacities that are explicitly reported. The assumed installed capacity in the year 2050 is shown in Figure 14. Unfortunately, the BFE study reports only the sum of PV, wind, biomass, and geothermal capacities. In the BFE study, this capacity of new renewables is the same for all scenarios with supply variants C+E and E (C is CCGT plants, E is more renewables). Note that the capacities of hydropow-er in the VSE, BFE and SCS studies are relatively higher than those of the PSI-elc and Greenpeace studies when comparing with actual production (Figure 9). This may be caused by different assump-tions on load factors, or because of the optimized load-factor in case of the PSI-elc study.
Figure 14: Capacity in year 2050. Capacities are not reported in studies: ETH/ESC, Cleantech, and PSI-sys (for the new scenarios)
25 of 48

6 Costs In this section, costs are compared: technology costs, production costs, retail costs, system costs. The costs may either be by assumption or a result of the applied energy modelling. We start with a comment on the difficulty of cost comparisons.
6.1 Difficulty in comparing costs Comparing costs across the studies is difficult because the reported cost categories are not always identical (Table 11). For example, to properly calculate levelized production costs for a technology, the following information is needed: (i) discount factor for the capital costs, (ii) technology lifetime, (iii) capital (i.e. investment) costs, (iv) operation & maintenance costs (incl. fuel costs), and (v) external costs if needed (e.g. CO2-price, LCA-costs, decommissioning costs). Similarly, to properly compare electricity system costs, the following delimitations must be defined: (i) inclusion of costs of existing installations, (ii) inclusion of cost of retrofitting existing plants, (iii) inclusion of grid cost, and (iv) sal-vage value for installations that have a lifetime beyond the year 2050. Moreover, the interpretation of total system costs of the electricity system is difficult: Obviously, if the electricity demand is low, then (all other things being equal) system costs are low; hence, system cost can be transferred to efficien-cy measures, which may be outside of the system boundary. Such costs of efficiency measures are not accounted fully in the studies. A partial exception is the model in the PSI-sys study [48], which includes insulation measures; also the economy-wide model in the ETH/ESC study [1] can account for some these costs on an aggregated level. Moreover, to compare discounted cost values, the as-sumed discount factor should be the same, which is not the case across studies (Table 11); a special case is the VSE study, which assumes varying discount factor across technologies [32] (Appendix A.2). Table 11: Reported costs, CO2-emissions and production capacities
Reported value BFE VSE ETH/ESC
Green-peace
Clean-tech
SCS PSI-sys (new sce-narios)
PSI-elc
Discount factor yes (2.5%)
variable (8-13%)
no no no yes yes (2.5%)
yes (3%)
Investment costs of generation technol-ogies
no (or just not found)
yes no yes no yes (but not com-mented)
yes yes [27]
O&M costs of gen-eration technolo-gies (incl. fuel costs)
no yes no yes no Yes yes implied by other values
Price of natural gas yes no no yes no yes yes yes [27] Levelized produc-tion costs of tech-nologies
yes yes yes no only PV yes yes (implied by other values)
yes
Price of electricity import
no (info of con-stant level)
no no no no yes (but not com-mented)
no yes [27]
Levelized produc-tion cost of mix (yearly system cost, without grid)
yes yes yes yes no yes no (yes for old scenarios)
yes
Undiscounted cu-mul. investment costs of new gener-ation
no yes no no no no no (relative numbers for old scenarios)
no
Undiscounted cu-mul. investment costs of new and old generation
no no no yes no no no (relative numbers for old scenarios)
yes
Discounted cumul. system costs of new generation
yes no no no no no no (relative numbers for old scenarios)
no
26 of 48

Reported value BFE VSE ETH/ESC
Green-peace
Clean-tech
SCS PSI-sys (new sce-narios)
PSI-elc
Investment costs in new and old grid (transmission & distribution)
refer-ence to [13] [14]
refer-ence to [13] [14]
no refer-ence to [13] [14]
no no no (relative numbers for old scenarios)
no
Grid feed-in cost estimations
no no no no no yes (but not com-mented)
no no
Retail electricity price
no yes no no yes yes no no
CO2-price yes no no no no no cap on CO2-emissions
yes
Costs of efficiency measures
no no no no no no insulation is modelled
no
Capacity (GW) of technologies
yes yes no yes no yes no yes
CO2-emissions (electricity sector)
yes yes no yes no no no yes
CO2-emissions (energy sector)
yes no yes yes yes no cap on CO2-emissions
no
Despite the aforementioned difficulties in comparing costs, we try to compare some of the cost as-sumptions in the following sections.
6.2 Technology costs The following figures show the technology cost of solar PV (Figure 15), wind power (Figure 16), nu-clear power (Figure 17), and of CCGT plants (Figure 18). The base year of the Swiss Franc may vary from 2000 to 2012 across the studies, but this does not explain fully why the numbers in starting years are that different. Actually, differences arise from a different accounting as explained in the previous sections, and, unfortunately, those accountings are not disclosed in detail.
In general, the levelized production costs of PV and of wind in year 2050 stay in the bounds provided by the BFE study. An exception is the optimistic assumption of Greenpeace and the lower bound of the ETH/ESC study. We may note that the relative span of costs across studies in Figure 15 is roughly the same in 2010 as in 2050; hence it seems that the variability of PV costs will not increase accord-ing to the set of given studies.
Nuclear costs are highly sensitive to capital costs, which depend in turn on the discount rate and life-time. This partially explains the different current values, which stay more or less constant over time (Figure 17). It also seems that the SCS study includes some additional costs based on retrofitting and improved decommissioning.
Levelized costs of central CGGT plants are shown in Figure 18. Again the cost is sensitive to assump-tions on the discount rate, the lifetime and the cost of natural gas. The assumptions on the gas price increase are shown in Figure 19. The high increase of the gas price in the Greenpeace study may include some CO2-costs or is market(power)-driven, because natural gas is almost surely available in Europe with moderately increasing extraction costs over the next 50 years [20], whereas a constant price in the SCS study may be very optimistic.
27 of 48

Figure 15: PV levelized costs (without system cost of intermittency). BFE: long-term cost range with no exact year. 2010 means 2011 and 2012 for some studies
Figure 16: Wind levelized costs (without system cost of intermittency). BFE: reports a long-term cost range with no exact year. 2010 means 2011 and 2012 for some studies. Cleantech does not report wind cost
28 of 48
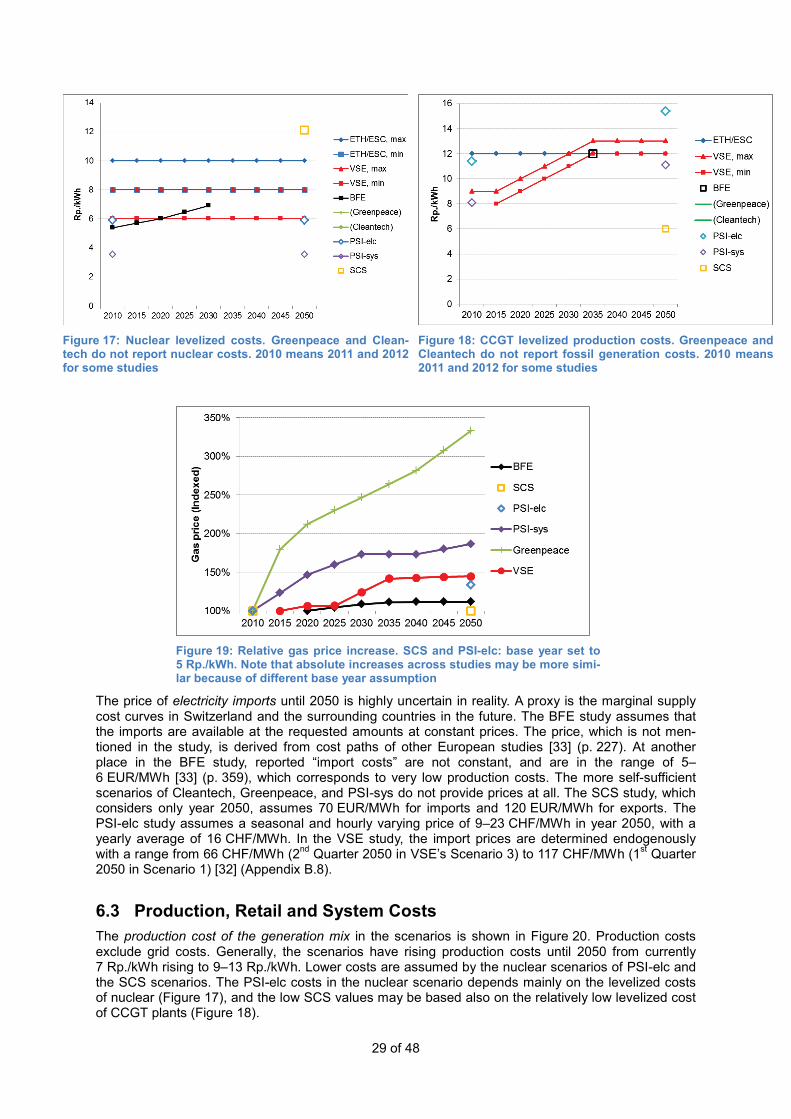
Figure 17: Nuclear levelized costs. Greenpeace and Clean-tech do not report nuclear costs. 2010 means 2011 and 2012 for some studies
Figure 18: CCGT levelized production costs. Greenpeace and Cleantech do not report fossil generation costs. 2010 means 2011 and 2012 for some studies
Figure 19: Relative gas price increase. SCS and PSI-elc: base year set to 5 Rp./kWh. Note that absolute increases across studies may be more simi-lar because of different base year assumption
The price of electricity imports until 2050 is highly uncertain in reality. A proxy is the marginal supply cost curves in Switzerland and the surrounding countries in the future. The BFE study assumes that the imports are available at the requested amounts at constant prices. The price, which is not men-tioned in the study, is derived from cost paths of other European studies [33] (p. 227). At another place in the BFE study, reported “import costs” are not constant, and are in the range of 5–6 EUR/MWh [33] (p. 359), which corresponds to very low production costs. The more self-sufficient scenarios of Cleantech, Greenpeace, and PSI-sys do not provide prices at all. The SCS study, which considers only year 2050, assumes 70 EUR/MWh for imports and 120 EUR/MWh for exports. The PSI-elc study assumes a seasonal and hourly varying price of 9–23 CHF/MWh in year 2050, with a yearly average of 16 CHF/MWh. In the VSE study, the import prices are determined endogenously with a range from 66 CHF/MWh (2nd Quarter 2050 in VSE’s Scenario 3) to 117 CHF/MWh (1st Quarter 2050 in Scenario 1) [32] (Appendix B.8).
6.3 Production, Retail and System Costs The production cost of the generation mix in the scenarios is shown in Figure 20. Production costs exclude grid costs. Generally, the scenarios have rising production costs until 2050 from currently 7 Rp./kWh rising to 9–13 Rp./kWh. Lower costs are assumed by the nuclear scenarios of PSI-elc and the SCS scenarios. The PSI-elc costs in the nuclear scenario depends mainly on the levelized costs of nuclear (Figure 17), and the low SCS values may be based also on the relatively low levelized cost of CCGT plants (Figure 18).
29 of 48

Some studies report also the assumed retail electricity price, which includes the assumed grid costs; see Figure 21. The starting price in year 2010 in Figure 21 may vary based on different definition of retail price as follows. A concise overview of historical retail prices is given in the fact sheet of the BFE [3]: Averaged over different consumer classes, the price stays between the years 1985 and 2013 near 20 Rp./kWh; the price includes all taxes and is in real CHF2010. Without taxes, the average prices is 17 Rp./kWh for the example of year 2010 and of category H4 (4-people household con-sumer profile of El-COM) [3]. It must be emphasized that no study calculated the grid costs; usually numbers from the Consentec studies are taken over [13, 14].
Figure 20: Levelized production cost of mix. Costs of import are included. PSI-elc: add-on to match starting 2010 costs; ETH/ESC: without add-on; Cleantech: no value; PSI-sys: no value (only technology costs and shares)
Figure 21: Retail electricity prices in the scenarios (in CHF 2010; after KEV and before other taxes, cf. [3]). BFE’s price in 2010 is for consumer category H3 [5] (p. 71)
30 of 48

As argued in Section 6.1 (and Table 11), the total cost of the electricity system is difficult to compare because of different definitions across studies. In Table 12, we list of total system costs and of total investment costs. These costs have to be compared with care; for example, it is not always clear whether a salvage value of investments with a lifetime beyond 2050 is subtracted.
In the following, we comment on the cost of some selected studies; the comments are partially taken from the studies themselves. Finally, we report on grid costs.
Costs in the BFE study In the final year 2050, the scenarios POM+E and NEP+E, which have a relatively large share of re-newables and no CCGT plants, have the lowest levelized yearly production costs because the other supply variants (C and C+E) use more natural gas and are therefore more affected by increasing nat-ural gas and import prices. Another reason is that levelized production cost of renewables are de-creasing in the long-term [33] (p. 209). On the other hand, if we consider the cumulative discounted costs of the electricity generation system (Table 12), then the supply variant C, which has additional CCGT plants and less renewables, is cheaper than the variants C+E and E for NEP, POM and for WWB. This is because the relatively low yearly production costs at the end of the time horizon in C+E and E contribute less to cumulative costs because they are discounted by 2.5% [33] (p. 210).
Costs in the VSE study “In Scenario 3 in 2050, almost 45% of the Swiss production costs must be subsidised”, and the subsi-dies are 6 times higher than in Scenario 1, which has the least stringent policy [46] (p. 97, p. 110). Until the year 2035 in Scenarios 1 and 2, prices are expected to increase by a third, and in Scenario 3
Table 12: Selection of total investment and system costs. ETH/ESC: total absolute costs are not reported
Study Cumulative Cost Type Old or new plants?
Discounted costs?
Scenario Cost (Mrd. CHF)
BFE Total cost of production, 2010-2050 (p. 211) new disc. WWB+C 72 WWB+C+E 75 NEP+C 59 NEP+C+E 64 NEP+E 60 POM+C 60 POM+C+E 66 POM+E 64
old disc. - 126 VSE Investment cost of production, 2011-2050
(p. 94, p. 95) old+new undisc. Scen. 1 54
Scen. 2 67 Scen. 3 78
old undisc. - 29 Investment cost of grid, 2011-2050 (p. 95) new undisc. Scen. 1 5
Scen. 2 8 Scen. 3 12
Investment cost of grid, 2011-2050 old undisc. - 59 Investment cost of transmission grid, 2011-2050
new undisc. all scenari-os
2.6
Greenpeace Investment cost of production, 2011-2050 (p. 78)
old+new undisc. - 88
Cleantech Investment cost of production, until 2050 (p. 31)
old+new undisc. - 80
PSI-elc System cost of production, 2013-2055, with-out trade profit (p. 16)
old+new undisc. WWB+Gas 226 WWB+Imp 239 WWB+Nuc 167 POM+Gas 188 POM+Imp 197 POM+Nuc 133 NEP+Gas 169 NEP+Imp 171 NEP+Nuc 123
31 of 48

by nearly 50%. While costs are stagnating thereafter in Scenario 1, costs and prices are expected to increase in the other two scenarios mainly because of the accelerated deployment of renewables [46] (p. 102). Differences between retail prices and production costs are large in the stringent policy Sce-nario 3 [46] (Fig. 8.19, p. 96-97). In Scenario 3, production costs are declining towards 2050 because of less demand and technology learning (the decline has a more pronounced downward slope than in BFE’s NEP+E scenario); see Figure 20. In contrast, retail prices are still rising because of increasing grid integration costs and because subsidies for renewables are assumed to be still needed in year 2050 (Figure 21); see also [46] (p. 98). We may note that the aforementioned high subsidies (“Förderbeiträge”) in Scenario 3 may be difficult to justify in a fully liberalized European market in year 2050.
The investment to maintain the power grid is assumed to be 1.5 billion CHF per year. Total investment costs for the electricity system are estimated to be 120 billion CHF at minimum, which is the cost in the least stringent Scenario 1 (Table 12). The VSE study also reports the costs of a blackout [46] (p. 99), which is 2–4 billion CHF per day. For comparison, the Swiss GPD per day is currently 2.4 billion CHF.
Costs in the Cleantech study The Cleantech study focused not on the production costs but on the desirable price-building process [2] (p. 27). Consumers should be faced with short-interval billing based on the hourly supply mix, and prices should in general follow the supply situation. The authors demand that “customers should have access to a free market for electricity”, which is in contrast to the result in the VSE study that produc-tion will at least stay partially subsidized in scenarios that have high shares of new renewables.
Costs in the ETH/ESC study The ETH/ESC study uses a complementary, Swiss-economy-wide equilibrium model (see also Sect. 2.4). Results of the model include aggregated energy prices and GDP growth rates as follows. If the price elasticity is assumed to be -25%, then energy prices increases by approximately +100% until 2050 in the case nuclear power is phased out, and by +50% in case nuclear generation is continuing (accordingly, an elasticity of -50% yields price increases of +50% and +25%). For comparison, the main model of the ETH/ESC study, that is, the supply-side bottom-up model, gives an increase of production costs by 0%–30% [1] (p. 42). Moreover, the result of the economic equilibrium model show that the nuclear phase-out yields a reduction of the average GDP growth-rate until 2050 of 0.05% per year (from 1.29% down to 1.24%). This reduction may be compared with the share of the (direct) val-ue-added of the electricity sector in Switzerland to the GDP, which is 1.5% per year [46] (p. 102). Hence, it seems that in the aggregated economy modeling the increasing energy prices are mostly counterbalanced by positive effects to allow the GDP reduction to be relatively small.
Costs in the PSI-elc study The system costs of supplying the low demands of the NEP scenarios are relatively low (Table 12), which is possible because cost of efficiency measures in the energy end-use sectors are excluded (as in all studies). Under the assumptions of the study, the nuclear supply variants have lowest system costs. The levelized costs of the mix include trade profits and are also correspondingly low for the NEP scenarios (Figure 20). Within the cost-optimized modelling of the study, trade profits are positive (see [28] for the values). The production costs in the scenarios having annual net-imports are higher than in the scenarios having additional gas-fired plants and no net-imports because electricity import prices are not low enough by assumption and because the cross-border transmissions are restricted.
Costs of the electricity grid As already mentioned, the cost of the electricity grid is sparsely reported, and the reported numbers are based on the Consentec studies [13, 14]; numbers in the VSE study are listed in Table 12. Based on these costs, the Greenpeace study assumes that the extension of the distribution grid in their chal-lenging (as they say) scenario may require investments above 13 billion CHF [44] (p. 60). The Clean-tech study states qualitatively that the grid plays a major role because of the new decentralized re-newables and volatile imports, such that smart grids and a connection to a desirable European DC-transmission grid are important [2] (p. 15).
The VSE study elaborates more on the grid. For the reader’s convenience, this supplementary infor-mation can be summarized as follows. The grid in Switzerland seems to be in a relatively good shape: Today’s low- and middle-voltage grid can handle an additional 5 GW decentralized power generation
32 of 48
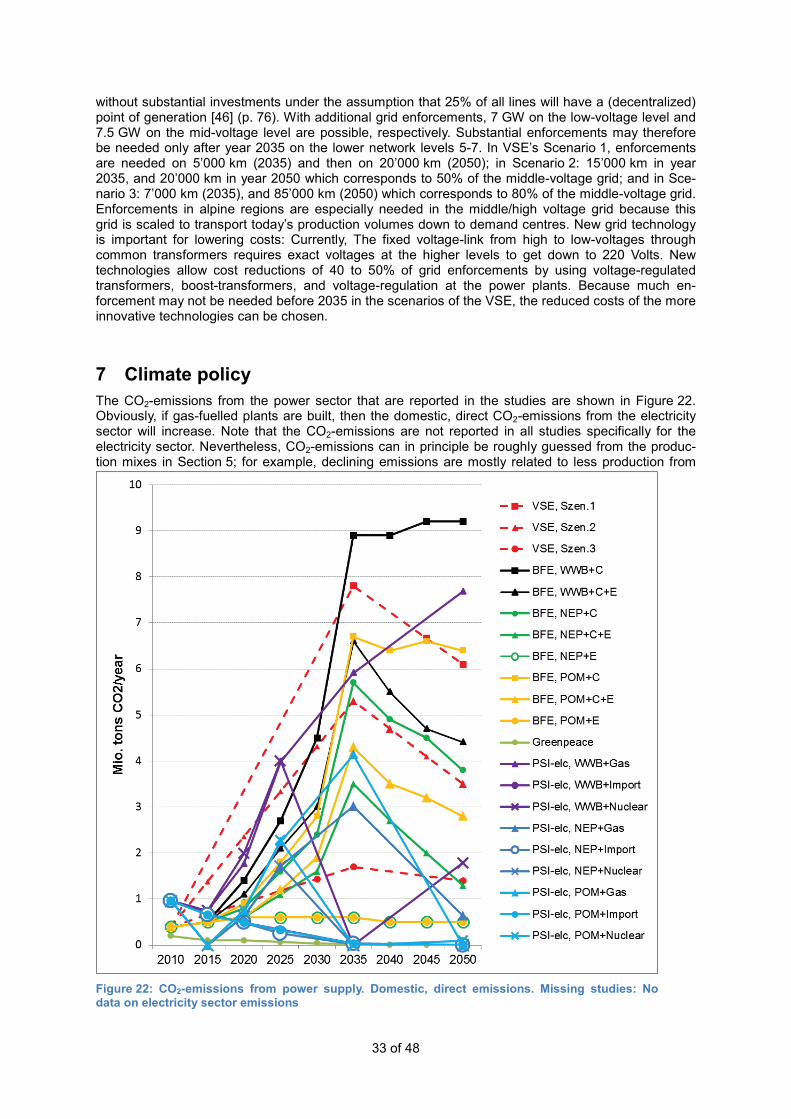
without substantial investments under the assumption that 25% of all lines will have a (decentralized) point of generation [46] (p. 76). With additional grid enforcements, 7 GW on the low-voltage level and 7.5 GW on the mid-voltage level are possible, respectively. Substantial enforcements may therefore be needed only after year 2035 on the lower network levels 5-7. In VSE’s Scenario 1, enforcements are needed on 5’000 km (2035) and then on 20’000 km (2050); in Scenario 2: 15’000 km in year 2035, and 20’000 km in year 2050 which corresponds to 50% of the middle-voltage grid; and in Sce-nario 3: 7’000 km (2035), and 85’000 km (2050) which corresponds to 80% of the middle-voltage grid. Enforcements in alpine regions are especially needed in the middle/high voltage grid because this grid is scaled to transport today’s production volumes down to demand centres. New grid technology is important for lowering costs: Currently, The fixed voltage-link from high to low-voltages through common transformers requires exact voltages at the higher levels to get down to 220 Volts. New technologies allow cost reductions of 40 to 50% of grid enforcements by using voltage-regulated transformers, boost-transformers, and voltage-regulation at the power plants. Because much en-forcement may not be needed before 2035 in the scenarios of the VSE, the reduced costs of the more innovative technologies can be chosen.
7 Climate policy The CO2-emissions from the power sector that are reported in the studies are shown in Figure 22. Obviously, if gas-fuelled plants are built, then the domestic, direct CO2-emissions from the electricity sector will increase. Note that the CO2-emissions are not reported in all studies specifically for the electricity sector. Nevertheless, CO2-emissions can in principle be roughly guessed from the produc-tion mixes in Section 5; for example, declining emissions are mostly related to less production from
Figure 22: CO2-emissions from power supply. Domestic, direct emissions. Missing studies: No data on electricity sector emissions
33 of 48

gas power plants (in contrast, the installed capacity of gas power may vary slower).
In most of the studies, CO2-emissions are direct emissions; the study ETH/ESC reports also life-cycle-CO2-emissions per KWh separately for each technology, and the PSI-elc study reports for each sce-nario the life-cylce-CO2-emission of imported electricity. In both studies, it seems that life-cycle emis-sions are not directly used to influence the share of technologies.
Note that the starting value of in 2010 is different for the studies (Figure 22); this may arise from dif-ferent accounting methods of direct (non-life-cycle) CO2-emissions, which give for example between 0.3 to 1 MtCO2/y emissions in year 2007 [24].
In some scenarios, CO2-emissions from imported electricity are compensated with CO2-certificates. In particular, the Cleantech study assumes that most imports are “green-power” [2] (p. 35), and in VSE’s strong-policy Scenario 3, retail costs include cost of green certificates on imports [46] (p. 97). On the other hand, the BFE study for example seems not to consider the CO2-emissions from imported elec-tricity.
Even if life-cycle-emissions and emissions from imported electricity were taken fully integrated into account, an objective to reduce CO2-emissions only in the electricity sector may not be cost-optimal for the whole energy system; as already mentioned in Section 5, the PSI-sys study, which considers the entire energy system in a single model, deploys gas-powered plants even in a stringent 50%-CO2-reduction scenario.
8 Flexible production, storage and imports
8.1 Seasonal Variation Unfortunately, the electricity demand in Switzerland is higher in winter, when the production of hydro-power is lower (see for example the winter/summer production in year 2011 in Figure 23). Higher de-mands in winter are expected to prevail in the future because in most of the scenarios heat pumps replace partially fossil heating. Figure 23 shows the seasonal production mix of summer and winter for some of the scenarios in year 2050; note that the Cleantech study reports only a monthly chart, and the PSI-elc study reports daily winter/summer profiles; for both studies, the winter and summer shares were synthesized.
Clearly, PV production is lower in winter, whereas wind production is slightly higher in all scenarios (Figure 23). Total hydropower production is currently usually lower in winter in all scenarios, whereas
Figure 23: Winter/summer production mix. Cleantech: Synthesized winter/summer share based on monthly chart. PSI-elc: Synthesized winter/summer share based on daily profile for one selected scenario (POM+GAS)
34 of 48

the stored-hydropower production can be slightly higher in certain years. Most scenarios of the stud-ies follow this pattern. An exception are the scenarios NEP+E and NeueKernkraftwerke of the SCS study, where the hydropower plants in total produce more in winter. This high production in winter from stored-hydropower can also be seen in the daily patterns of Table 13 in the rows of the studies SCS, Greenpeace (which uses the SCS model), and also partially of the BFE study, which reports the daily pattern of the NEP+C+E scenario. Similarly, the Cleantech study assumes that stored-hydropower produces mainly for winter demand. In our view, it must be carefully evaluated in future studies whether high hydropower production in winter is technically as well as economically feasible under different stochastic conditions. Economic feasibility should be evaluated from the system plan-ner’s as well as from the investor’s perspective.
Greenpeace does not provide an easily extractable seasonal or daily generation mix, but we can comment with help of the daily winter/summer mix in Table 13 as follows. In summer, there is no sub-stantial biomass production, more run-of-river production, less seasonal-storage plant production, less production and pumping from pumped-storage plants, no export, but power-to-gas. In winter, there is less run-of-river, more stored-hydropower production, and no substantial production and pumping of pumped-storage plants [44] (Fig. 3.7, Fig 3.8). In winter, PV production is relatively high because the study assumes also installation in alpine areas. In this study, the highest imports are during October to December [44] (p. 30).
8.2 Hourly variation and storage The dispatch problem may be defined as the problem to match in every minute demand and supply over a yearly time horizon under stochastic solar and wind production, and under uncertain water inflows for hydropower as well as under constrained storage options. The dispatch problem will be-come more complex in the future because most of the envisaged scenarios assume an increasing variation in production by more PV and wind power. On the demand-side, some of the load can be flexibilized to counterbalance those variations: For example, the SCS, VSE and the ETH/ESC study try to quantify such demand side management. Generally, if the inflexible part of demand is still lower than production, then electricity must be stored, exported or discarded. On the other hand, if stochas-tic production is too low, then it must be augmented by flexible production or by imports.
As of today the short-term variations are mainly balanced using hydro-power plants (“ancillary ser-vices”). The VSE study, which is focused on the power sector, evaluates also the costs of more ancil-lary services in the future, that is, the ramping costs as well as the opportunity costs. The service costs are estimated to be 40% higher in year 2050 than today in VSE’s Scenario 2, which has a rela-tively large amount of wind and solar production in year 2050, and they are estimated to be 60% higher in Scenario 3, which has very large shares of solar and wind [46] (p. 93).
The optimal short-term dispatch of hydropower is a non-trivial optimization problem because the hour-ly dispatch influences the yearly production, and the water-inflow is varying from year to year. In addi-tion, interconnected reservoirs and bounds on the feasible water levels in rivers reduce the operation-al flexibility. The sum of the peak capacities of all hydropower plants in Switzerland (14 GW in 2012) overestimates the available production capacities; for example, the average load factor of all hydro-power in 2012 is approximately only 30% [5]. With more inflexible generation by solar and wind, pumped-storage plants may be used to store excess production and increase load factors. In the studies, it is generally assumed that the pumps in pump-storage plants will have 5 GW peak capacity, which usually assumes that the project “Lagobianco” of the company Repower will be built (this pro-ject was shelved recently in 2013). The common generation pattern as of today with pumping during night is shown in Table 13.
In the BFE study, the hourly dispatch is investigated in the scenarios WWB+C and NEP+C+E; the C variant means that central CCGT plants are allowed and annual net-imports are zero. In scenario WWB+C in winter in year 2050, the relatively high capacity of the CCGT plants in combination with the hydro-storage plants are able to balance the low winter-production from run-of-river and from PV [33] (Fig. II.3.21, p. 815). In this scenario, throughout the year, pumped-storage hydropower is not heavily required. In scenario NEP+C+E, which has more renewables and less CCGT plants, pumping is more needed as follows. In summer, the pumped-storage hydropower is engaged every day, whereas the hydro-storage (without pumps) plays a minor role [33] (Fig. II.3.24, p. 818). After year 2045 additional storage capacity is required in summer [33] (p. 828) or exports/curtailing must happen on a regular basis. In winter, the hydro-storage must be used extensively after the full nuclear phase-out in year 2034, which requires special management to safely cover production during different win-
35 of 48
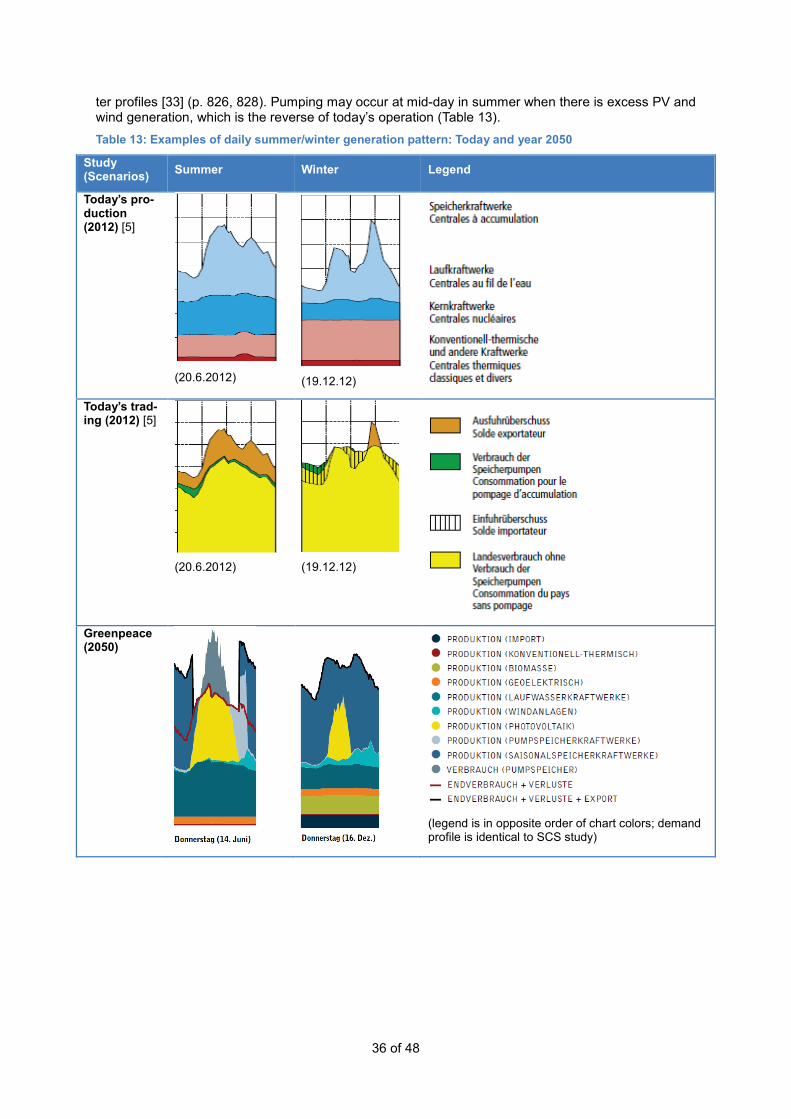
ter profiles [33] (p. 826, 828). Pumping may occur at mid-day in summer when there is excess PV and wind generation, which is the reverse of today’s operation (Table 13). Table 13: Examples of daily summer/winter generation pattern: Today and year 2050
Study (Scenarios) Summer Winter Legend
Today’s pro-duction (2012) [5]
(20.6.2012)
(19.12.12)
Today’s trad-ing (2012) [5]
(20.6.2012)
(19.12.12)
Greenpeace (2050)
(legend is in opposite order of chart colors; demand profile is identical to SCS study)
36 of 48

SCS, NEP+E (2050)
(legend is in opposite order of chart colors)
VSE, Scenar-io 2 (2050)
BFE, NEP+C+E (2050)
37 of 48

In the VSE study, the load factors of pumped-storage hydropower plants are increasing from 13%–14% in 2015 to 20%–21% in 2050 [46] (Fig. 8.13, p. 91). In the stringent Scenario 3, the load factor of hydropower is almost flat, that is, the diurnal and the weekend/workday variations disappear, which means shorter cycles than today (with short cycle length of a few hours). The shorter cycles and high load factors usually increase the O&M costs. In Table 13, it is also shown that in the intermediate Scenario 2, pumping may occur at mid-day in summer when there is excess PV and wind power, which is again the reverse of today’s operation.
In the Greenpeace study, the authors come to a similar conclusion of increased load factors. The expected 5 GW of pumped-storage hydropower are not enough to store excess electricity in summer in 2050 [44] (p. 11). The dispatch solution from the used SCS model shows extreme full-to-empty cycles for each day-to-night cycle in summer (Table 13); see also [44] (p. 31). To empty the storage during night, large exports are continuously required, which may be not feasible in European markets. Therefore, the authors suggest to use power-to-gas (hydrogen by electrolysis), which is assumed to be cost-effective with a minimum of 4000 full load hours per year; to maintain this minimal load factor, it is assumed that electricity imports are needed. The electricity consumption for power-to-gas is as-sumed to be 10 TWh in year 2050. Back-conversion of hydrogen into electricity is expected to be a small share (0.7 TWh in 2050) [44] (p. 11), whereas the larger share is used through methanisation for heavy transport and in industry.
In the ETH/ESC study, the future capacity of pumped-storage hydropower (5 GW) is expected to be sufficient in Scenario Mittel until 2035 to store the required 50% share of PV and wind power [1] (p. 36); afterwards batteries are needed in addition [1] (p. 30). The battery costs are included in re-ported production costs [1] (p. 36).
In the Cleantech study, the hydro-storage plants in year 2035 are expected to produce (in net terms) almost exclusively in the winter from December to March [2] (p. 30, Fig. 7). The assumed energy sup-ply is assumed to be used tightly: The electricity demand is matched by production and by import only if the reported total energy output of WKK, KVA and of geothermal energy is entirely electricity [2] (Table 3, p. 24).
In the PSI-elc study, in all seasons, base-load generation is supplemented with electricity imports at night when import prices are low. The gas plants are not used in summer because of low demand and the higher output from hydropower in summer. During the day, hydro-storage and pumped-storage plants are scheduled, with the excess generation exported when export prices are high. The marginal cost of electricity on weekdays varies between 11-16 Rp./kWh in summer and 14-19 Rp./kWh in win-ter. More details on the daily production pattern are discussed in [26] and [29].
PSI-elc, POM+Gas (2050)
(the blue line is demand after losses; pumping is not explicitly shown by a separate colour)
38 of 48

8.3 CCGT plants versus Imports The future profitability of CCGT plants may depend on several factors: (i) the load factor (i.e. the number of full load hours of operation per year), (ii) the frequency of future electricity price peaks (where the flexible CCGT plants could be profitable in addition to the already flexible hydropower), and (iii) the price of gas and of CO2-emissions. As of today, all these factors are uncertain for the fu-ture, such that the investment risk is high.
The VSE study reports in some detail the assumed operation of CCGT plants. In Scenario 3, which has a large share of renewables and low demand, CCGT plants operate mainly in low- to mid-load [46] (p. 90, Fig. 8.11). In Scenario 1, which has a relatively large demand and less renewables, mid- to full-load operation is economically optimal in this study until year 2035, whereas only low- to mid-load operation in later years 2035 to 2050.
In the PSI-elc study, the results are similar as in the VSE study. With the low demand in scenario NEP+Gas, the load factor of CCGT plants is approximately 75% in mid-term (years 2025 to 2035). Before and after this period, the load factors are maximally 20%. In the scenarios WWB+Gas and WWB+Nuclear, which have higher demands and lower CO2-prices, the load factors of the CCGT plants stay after 2025 above 50% [28].
In many scenarios with expansion of gas power, the main load is during winter (Figure 23). For exam-ple, in the SCS study in scenario WWB+C+E, the yearly averaged load factor is approximately 50%, whereas in summer it is below 5%.
The multi-regional model of the VSE study allows cross-border analyses. The interplay between import and CCGT plants is as follows [46] (p. 80). Because the generation mix in Italy will be similar to Switzerland in the future (hydro power, CCGT and PV plants), exports to Italy are becoming lower in Scenario 1 and 2 (first in winter, then in later years also in summer), whereas imports from other coun-tries can be cost-effective; for example, Scenario 1 has 25% annual net import in 2050. If imports are restricted to 10% over a year (and 25% in winter), then the cost-optimal capacity of CCGT plants in year 2050 increases from 3 GW to 4.5 GW (and some additional CHP plants are built). Moreover, with this import restriction, the yearly electricity retail costs increase by 10% in year 2050 [46] (p. 93, 98). Hence, the modelling of the surrounding countries in the VSE study suggests that imported electricity can be cheaper than new CCGT plants. Clearly, if the share of renewables becomes large (e.g. in Scenario 3), then exports (mainly in summer) become cost-effective. Note that VSE’s model is sys-tem-cost based, and the actual market bids for import/export may be different.
The cross-border capability of VSE’s model helps also to evaluate import dependence. The model result indicates that the required imports are indeed satisfied by the assumed cross-border transmis-sion capacity and the assumed non-domestic generation capacity almost at all time in all scenarios. Exceptions are specific days that have extremely low or high temperatures, which would need exces-sive cooling or heating energy, and the efficiency of thermal plants would be reduced; but such days could be forecast [46] (p. 92). The model indicates also a reduction in transit-trade from Germany to Italy [46] (p. 92). This quantitative result is in contrast to the qualitative statement in the Cleantech study that a new German-Italy DC transit line is important [2] (p. 27).
The VSE study investigates also the additional costs in a scenario variant when demand is higher than expected [46] (p. 93, Fig. 8.15; p. 98, p. 99). In particular, the authors investigate a variant of Scenario 3 with the 20% higher demand in year 2050 from Scenario 2 (but still with the renewable potential of Scenario 3). The cost-effective solution shows more CCGT production and more imports, and the yearly electricity retail costs increase by 20% in 2050 [46] (p. 93, p. 98).
9 Statistics of the Production Mix in 2050
Figure 25 shows again the distribution of production per technologies across the studies. The correla-tion between PV and wind production is shown in Figure 26, and the correlation between PV and combined biomass and geothermal production is shown in Figure 27 across the studies. A principal component analysis of the multivariate vector of supply in 2050 across the studies is shown in Fig-ure 28 and Figure 29. More than 90% of the variance can be explained by the first three uncorrelated movements. The components reflect the most important decisions in energy-policy and for power producers at the moment as follows. Depending on the sign of the production technology in the com-
39 of 48

ponents, the first components can be given the following meaning: 1st “Nuclear production (or non-nuclear production)”, 2nd “Central production (or decentralized, renewable production)” and 3rd “Import (or domestic production)”. More details will be presented in a forthcoming publication.
Figure 24: Overview of the supply technologies in the year 2050 and in 2011
Figure 25: Distribution of the production of each technology in year 2050. The thick horizontal line is the median of all values across the scenarios. Inside each box are 50% of all values. The length of the “whisker” (¦---) extends maximally to 1.5 times of the box heights (or to the most extreme value). Values outside whisker are called “outliers”
Hydro Nuclear PV Wind Bio+Geo Gas Import
-10
010
2030
40
TWh/
y
40 of 48

Figure 26: Correlation between solar PV and wind power production in year 2050
Figure 27: Correlation between solar PV and combined bio-mass+geothermal power production in year 2050
Figure 28: The first three principal components of the multivariate vector of electricity production by tech-nologies in the year 2050
Figure 29: The variance explained by the first seven principal components of the multivariate vector of electricity production by technologies in the year 2050
41 of 48

10 Conclusions We conclude that the authors of the eight studies invested substantial effort and knowledge into es-tablishing scenario assumptions and models. In our view, each scenario shows indeed a feasible fu-ture of the Swiss electricity system under particular scenario assumptions which are sometimes given only implicitly.
We focus on three central objectives of the electricity system, that is, cost-effectivness, supply securi-ty, and climate goals. Eventually, we provide directions for further analysis.
The studies suggest the following technical measures in various combinations to ensure the function-ality of the future electricity system: More new renewables (PV, wind, biomass, geothermal), new gas-powered plants, more imported electricity, certificates for green imports, lower-voltage-grid enforce-ment to allow more decentralized production, additional electricity storage (battery, power-to-gas), efficiency increase in the end-use sectors, or even energy sufficiency. New nuclear power plants are considered in applicable cases only for the sake of comparison. The studies show that a suitable combination of some of these measures allows in principle to varying degree to satisfy the require-ments on the three central performance criteria for the electricity system: For costs in the studies, see Section 6; for CO2-emissions, see Section 7; for supply security, see Section 8. The “suitable” combi-nation may be achieved by expert judgment in a simulation model or by a mathematical optimization model. The trade-offs between the three objectives are discussed in each study in their conclusions at length. In the following, we try to discuss instead whether the objectives are clearly defined and real-izable.
10.1 Costs System costs versus profitability In all nuclear phase-out scenarios, the levelized production costs of the supply mix will in-crease (Figure 20). The overall cost range is within a factor of two with respect to today’s prices for different types of scenarios, that is, for scenarios with accelerated deployment of renewables and reduced demands, as well as for demand-expansion scenarios with larger deployment of gas-powered plants or imports.
Because many households currently do not know the amount of their electricity bills, such price in-creases may not be noticed by some consumers, even if the cost of grid enforcements is included. On the other hand, some Swiss power producers may no longer be competitive on the markets in some of the scenarios of the studies. In particular, all studies take the viewpoint of a central planner. Accord-ingly, models that apply cost-optimization (i.e., the VSE, PSI-elc, and the PSI-sys study) optimize so-cial welfare. Under the assumption of perfectly competitive markets and of perfect foresight, social-welfare maximization is also the optimal solution for all market players. Yet, the previous assumptions may not be fully valid in reality under market conditions and transmission constraints.
As already mentioned in the previous sections, the cost of the electricity system can be reduced in principle arbitrarily by reducing the demand with help of costly efficiency measures and of substitu-tions in the energy end-use sectors and building sector. Such costs are not considered in the studies; an exception is the cost of insulation in the PSI-sys study. Note also that cost comparisons are notori-ously difficult per se. An example are levelized costs of investment-intensive technologies. Those costs depend on the assumed discount rate and on the lifetime, which are different in the studies; normalization across studies is not possible without full access to all data.
Hydropower has a pivotal role in the future electricity system of Switzerland The majority of the studies consider an electricity dispatch model on an hourly time scale, that is, the BFE, VSE, SCS, Greenpeace (which uses SCS), and the PSI-elc study. In scenarios with a large share of PV production, the optimal operation from a system perspective is as follows: Pumping of hydropower is at mid-day, and hydropower production is during the rest of the time. If exports during day are restricted, then storage basins must be fully emptied each day to be able to take the load of the next day (Section 8.2). Exports of large amounts from hydropower may be needed during nights, which may not be always economically feasible. Hence, (pumped-)storage hydropower plants may have to operate in a strongly coordinated manner to prevent price-spiking and to ensure that the sea-sonal storage can cover the whole winter period during which natural water inflows are reduced. The
42 of 48

question remains whether the coordinated dispatch strategy is always safely triggered by the price-signals of a liberalized electricity market (i.e. the invisible hand).
Some studies consider also additional storage options: The Greenpeace study considers power-to-gas, and the ETH/ESC study electric batteries. Nevertheless, an intensive pumped-storage operation is essential for all scenarios that have high shares of renewables. In blatant contrast, the company RePower in year 2013 shelved the 1 GW pumped-storage project “Lagobianco” because of the diffi-cult market perspective. This may also reduce the 5 GW pumping-capacity that is assumed in most studies. It is thus also no surprise that the studies do not elaborate details of other market issues (the VSE study is partially an exception in this respect), for example the currently quite attractive market for ancillary services in Switzerland, which is a significant source of profitability for today’s Swiss pow-er producers.
In addition, the perspective of single players may also be important for the investment risk and profit-ability of large CCGT plants: They should be profitable over several decades under stochastic de-mand, stochastic fuel costs, uncertain future CO2-policy and unknown investment decisions of other players, who may influence prices by market power. Why would a Swiss power producer who already has a large amount of flexible hydropower in the portfolio invest in flexible gas power plants under uncertainty? This question is not answered by the deterministic studies that focus on the system per-spective.
10.2 Supply Security Supply security can be defined differently on different time scales. In a multi-year time scale, supply security may imply that long-run production costs are (more or less) predictable and energy import prices have low volatility, too. On a yearly and daily time scale, it means the ability to meet the de-mand by supply, where both demand and supply have seasonal or daily uncertainties. On a very short-time scale, blackouts have to be prevented. In all the studies, the demand is met by the supply under the assumption of perfect foresight in the studies. In reality, forecast errors of PV and Wind production may cause price-peaks, and power producers may be challenged to be profitable in case of unusual seasonal events. The current studies do not address in detail those uncertainties, which also affect long-term profitability. A first step in this direction is the VSE study which considers six weather patterns in parallel.
The future actions of the neighbouring countries may be only partially predictable. An example from the past is the first-mover advantage of Germany in terms of PV (“Prisoner's dilemma”). German sub-sidies for renewables are currently partially re-financed through profit reductions of Swiss power pro-ducers, who are no longer able to cash-in on price-peaks at noon with their flexible hydropower. The deployment of PV in Germany has currently reached the optimal level for Germany’s large base-load producers: The price peak at noon, where Swiss hydropower was profitable, is just cut-away. Even the multi-region model of the VSE study with its central-planner optimization can only partially be used for such analysis.
Some of the uncertainties of the future electricity system are assessed by different scenarios in the studies. For example, demands over time are different, and the availability of renewables, gas-powered plants and of imports is varied across scenarios. Moreover, some studies assume different CO2-prices across the scenarios (e.g., the BFE, PSI-elc, and PSI-sys studies). The VSE study con-siders in addition a scenario variant where demand can unexpectedly not be met by domestic supply, and another variant assumes an unexpected reduced import capacity. Nevertheless, some major un-certainties are not yet considered. Examples are variations of electricity import and gas import prices, and variations in the potential of geothermal power. For the underlying macro-economic drivers of the demand-side models, such as population and GDP growth, a sensitivity analysis would be helpful.
It is doubtful whether the aggregated modelling of hydropower and especially pumped-storage hydropower is realistic. Each storage reservoir has different characteristics of natural inflow and vol-ume. In addition, many reservoirs are interconnected, so the sum of the reservoirs cannot be repre-sented exactly by a single, large reservoir with a single large turbine and pump. Hence, if the flexibility is overestimated due to this simplification, then the supply security is threatened.
43 of 48

10.3 Climate Goals Full accounting of CO2-emissions Some studies assume a normative, long-term climate goal of 1 ton CO2-emission per person and per year (scenarios in ETH/ESC, BFE’s NEP scenario, and Greenpeace). Implicitly, the amount of emis-sions is usually the sum of emissions from domestic electricity production and emissions from imports. Even with this restricted definition, it seems that only the PSI-elc study considers emissions of imports and adds them (ex-post) to the emission result from optimization which takes only domestic emissions into account. Unfortunately, the aforementioned definition does not yet capture the CO2-footprint per person. A more complete measure is to count the emissions from the life-cycle of each technology, which includes the indirect emissions from construction, decommissioning etc. [35]. The life-cycle-emissions are at least mentioned in the ETH/ESC study for each technology separately.
If mitigation of climate change is the main objective of the CO2-emission reduction, then an optimiza-tion of the domestic energy system by minimizing life-cycle CO2-emissions of the electricity sector (or even of the whole domestic energy system) leads still to biased solutions because the energy-intensive economy will be shifted outside of Switzerland. Part of this externalization has already hap-pened and may continue. For example, the domestic CO2-emissions in Switzerland from energy con-sumption is 7.2 tCO2-eq/person in year 2004, whereas the emissions on the basis of consumption of products were 12.5 tCO2-eq/person [25]; see also [15]. Hence, policy makers may want to consider whether focusing mainly on domestic, direct CO2-emissions is appropriate.
Carbon Capture and Sequestration (CCS) The new CCGT plants in many scenarios imply more CO2-emissions (Figure 22). CCS may be used to reduce emissions to the atmosphere from fossil power plants. The studies mostly do not consider CCS. The ETH/ESC study mentions the option of CCS while discussing gas-power plants, but CCS seems not to be fully integrated in the supply model. The PSI-sys study models CCS for a set of sce-narios. On the other hand, in reality, CCS is not yet deployed for large-scale production in Switzerland or in the neighbouring countries, which also holds for geothermal electricity, which (with the exception of the PSI-sys study) is assumed to be available in all studies.
10.4 Directions of Future Research Addressing profitability and investment risk Future research has to consider the investment risk for the market players. For example, investment in large CCGT plants should be profitable over several decades under stochastic demand, stochastic fuel costs and uncertain future CO2-policy. The size of the plants may be large to have sufficient economy-of-scale. How can we insure the financial risk of large CCGT plants? Why should a Swiss power producer who already has a large amount of flexible hydropower in the portfolio invest in flexi-ble gas power plants under uncertainty? This question is not answered by the studies. A related issue is the market power of large players, which may invalidate the current assumptions of perfect compe-tition.
Modelling of storage In all the studies, the technical aspects of the many hydropower plants in Switzerland are lumped together to (at most) three single, aggregated plants: Run-of-river, hydro-storage and pumped-storage hydropower. In fact, the specific storage of each plant, and sometimes the interdependency of reser-voirs may limit the flexibility of an aggregated plant in reality, which may invalidate some of the pro-posed dispatch plans, even if executed strictly by a central planner. This enhanced modelling allows to compare better to additional, alternative storage options (e.g. batteries), which are also not taken into account in some of the studies.
Increasing transparency and comparability between studies The used models are quite data-intensive and may be complicated. Nevertheless, more precise, pub-lished model documentation on the assumptions would be useful. As an example, the assumption for a demand-side model for the residential heating sector may comprise numbers on: (i) efficiencies (over time), (ii) share of energy carriers, (iii) floor area per person, (iv) population, and (iv) demand shifting. Most of the studies report synthesized numbers, but are no explicit on such initial assump-
44 of 48

tions, and if they are, then only for selected end-use sectors. A reader may conjecture that the initial, precise assumptions may sometimes not exist.
As an example of a rather minimalistic view of transparency, the Cleantech study mentions that mem-bers of their business association can get more information, which may not be an optimal way to dis-seminate results for the Swiss audience. The studies of BFE, VSE, Greenpeace and Cleantech use commercial proprietary model frameworks. The studies PSI-sys, PSI-elc use commercial, but open model frameworks. The SCS study mentions that their model should become a common basis for all stakeholders, and it is indeed used by the Greenpeace study for the hourly simulation, but still it seems that a download link for the model or any further published information apart from the study report itself is missing. In summary, the models cannot generally be re-run by other parties. A model at hand would also allow verifying the entire set of assumptions (in principle if the code and data are well-structured). In summary, it would be desirable that the authors of future studies would—at least partially—be open to address some minimal standards on data and model assumptions.
On the positive side, some of the studies refer to other studies: The Greenpeace study compares extensively to the POM scenario of BFE, the PSI-sys study compares the results with BFE, the VSE study compares the demands with other studies, the PSI-elc study uses the demand and the CO2-price assumptions of BFE, and the SCS study uses the demands and capacities of some of the BFE scenarios.
Robust modelling under uncertainty More advanced modelling approaches may be needed for the objective to ensure high profitability under constrained risk. The problem is complicated by the different time scales and the additional constraints of climate policy, import restrictions etc. A first step in this direction is the model in the VSE study, which assumes that the supply capacities have to be feasible over a year for hourly weather time series of six different historical years. More extreme events and a multivariate analysis of the time series of demand, wind, solar and water availability should be taken into account by sensitivity analyses. Robust methods from stochastic programming may help to model decision making under uncertainty [16].
Moreover, the modelling needs to take the neighbouring countries with their actions into account as considered in the model of the VSE study and also in a forthcoming model extension of the PSI-elc study.
11 References
[1] G. Andersson, K. Boulouchos, and L. Bretschger. Energiezukunft Schweiz. Technical report, ETHZ, Energy Science Center, Nov 2011. URL http://www.cces.ethz.ch/energiegespraech/-Energiezukunft_Schweiz_20111115.pdf.
[2] F. Barmettler, N. Beglinger, and C. Zeyer. Energiestrategie – Richtig rechnen und wirtschaft-lich profitieren, auf CO2-Zielkurs. Technical Report Version 3.1, swisscleantech, Bern, Jan 2013. URL http://www.swisscleantech.ch/fileadmin/content/CES/energiestrategie_v03_1_D_2013_digital.pdf.
[3] BfE. Faktenblatt Strompreise – Strompreisentwicklung in der Schweiz (1985–2013). URL http://www.news.admin.ch/NSBSubscriber/message/attachments/28116.pdf.
[4] BFE. Strategie für die energetische Nutzung von Biomasse in der Schweiz - Biomasse-Energiestrategie Schweiz. Technical report, Bundesamt für Energie, 2010. URL http://-www.energieschweiz.ch/_ws/publicationDetails.aspx?id=p5436&lang=de-ch.
[5] BfE. Schweizerische Elektrizitätsstatistik. Technical report, Bundesamt für Energie, 2012. URL http://www.bfe.admin.ch/php/modules/publikationen/-stream.php?extlang=de&name=de_389419491.pdf.
[6] BFE. Wasserkraftpotenzial der Schweiz – Abschätzung des Ausbaupotenzials der Wasser-kraftnutzung im Rahmen der Energiestrategie 2050. Technical report, Bundesamt für Energie (BFE), Jun 2012. URL http://www.news.admin.ch/NSBSubscriber/message/attachments/27057.pdf.
[7] BFE. Botschaft zum ersten Massnahmenpaket der Energiestrategie 2050 (Revision des Energierechts), Sep 2013. URL http://www.admin.ch/opc/de/federal-gazette/2013/7561.pdf. 13.074.
45 of 48

[8] BfS. Szenarien zur Bevölkerungsentwicklung der Schweiz - 2010–2060. Technical Report 201-1000, Bundesamt für Statistik, Neuchâtel, 2010. URL http://www.bfs.admin.ch/bfs/portal/de/-index/news/publikationen.Document.132799.pdf.
[9] BfS. Fahrzeugbewegungen und Fahrleistungen im Personenverkehr, Feb 2014. URL http://-www.bfs.admin.ch/bfs/portal/de/index/themen/11/04/blank/01.html.
[10] L. Bretschger, R. Ramer, and L. Zhang. Economic effects of a nuclear phase-out policy: A CGE analysis. Economics Working Paper Series 12/167, ETH, CER-ETH – Center of Economic Re-search at ETH Zurich, Sep 2012. URL http://www.cer.ethz.ch/research/WP-12-167.pdf.
[11] E. A. Brugger, P. Dietrich, T. Kaiser, and A. Wokaun. Erneuerbare Energien – Übersicht über vorliegende Studien und Einschätzung des Energie Trialog Schweiz zu den erwarteten inländischen Potenzialen für die Strom-, Wärme-, und Treibstoffproduktion. Technical report, Energie-Trialog Schweiz (ETS), 2009. URL http://www.energietrialog.ch/cm_data/-ETS_Potenzial_Erneuerbare_2009.pdf. Version 16.06.2009.
[12] T. Chow. A review on photovoltaic/thermal hybrid solar technology. Applied Energy, 87 (2): 365–379, Feb. 2010. ISSN 0306-2619. doi: 10.1016/j.apenergy.2009.06.037.
[13] consentec. Auswirkungen eines verstärkten Ausbaus der dezentralen Erzeugung auf die Schweizer Verteilnetze. Technical report, BfE, May 2012. URL http://www.bfe.admin.ch/php/modules/-publikationen/stream.php?extlang=de&name=de_519518234.pdf. Abschlussbericht.
[14] consentec. Einfluss verschiedener Stromangebotsvarianten auf das Übertragungsnetz der Schweiz. Technical report, BfE, Feb 2012. URL http://www.bfe.admin.ch/php/modules/publikationen/-stream.php?extlang=de&name=de_734620830.pdf. Abschlussbericht.
[15] S. J. Davis and K. Caldeira. Consumption-based accounting of CO2 emissions. Proceedings of the National Academy of Sciences, 107 (12): 5687–5692, 2010. doi: 10.1073/pnas.0906974107.
[16] M. Densing. Price-driven hydropower dispatch under uncertainty. In R. M. Kovacevic, G. C. Pflug, and M. T. Vespucci, editors, Handbook of Risk Management in Energy Production and Trading, volume 199 of International Series in Operations Research & Management Science. Springer, Nov 2013. doi: 10.1007/978-1-4614-9035-7_4. URL http://www.springer.com/book/978-1-4614-9034-0.
[17] DESTATIS. Bruttostromerzeugung in Deutschland. Technical report, Destatis - Statistisches Bundesamt, 2012. URL https://www.destatis.de/DE/ZahlenFakten/Wirtschaftsbereiche/Energie/-Erzeugung/Tabellen/Bruttostromerzeugung.html.
[18] P. H. Egger and S. Nigai. Energiewende in der Schweiz: Simulationsergebnisse zur Energie-strategie des Bundes. KOF Studien, 2013 (38), Jan 2013. URL http://www.kof.ethz.ch/de/-publikationen/p/kof-studien/2813/.
[19] EnergieControl. Betriebsstatistik 2012. Technical report, Energie-Control Austria, Wien, 2012. URL http://www.e-control.at/de/statistik/strom/betriebsstatistik.
[20] C. Frei, H. Turton, M. Densing, E. Panos, and K. Volkart. World Energy Scenarios – Compos-ing energy futures to 2050. Project Partner: Paul Scherrer Institute (PSI), Switzerland. World Energy Council, 2013. URL http://www.worldenergy.org/wp-content/uploads/2013/10/World-Energy-Scenarios_Composing-energy-futures-to-2050_Full-report1.pdf.
[21] S. Hirschberg, C. Bauer, P. Burgherr, S. Biollaz, W. Durisch, K. Foskolos, P. Hardegger, A. Meier, W. Schenler, T. Schulz, S. Stucki, and F. Vogel. Neue Erneuerbare Energien und neue Nuk-learanlagen – Potenziale und Kosten. Technical Report 05-04, Paul Scherrer Institute, Villigen, May 2005. URL http://www.psi.ch/ta/SwissEnePerspEN/PSI-Bericht_05-04sc.pdf. ISSN 1019-0643.
[22] IEA. Potential for building integrated photovoltaics. Technical Report T7-4, IEA-PVPS, Jan 2002. URL http://www.iea-pvps.org/index.php?id=9. Summary.
[23] INFRAS. Potentiale zur energetischen Nutzung von Biomasse in der Schweiz. Technical re-port, Bundesamt für Energie (BfE), 2004. URL http://www.news.admin.ch/NSBSubscriber/message/-attachments/2664.pdf.
[24] M. Jakob, K. Volkart, and D. Widmer. CO2-Intensität des Stromabsatzes an Schweizer End-kunden – Schlussbericht. Technical report, TEP Energy GmbH, Zurich, Jul 2009. URL http://-www.stromundklima.ch/.
46 of 48

[25] N. Jungbluth, R. Steiner, and R. Frischknecht. Graue Treibhausgas-Emissionen der Schweiz 1990-2004: Erweiterte und aktualisierte Bilanz. Umwelt-Wissen UW-0711, Bundesamt für Umwelt (BAFU), Bern, Nov 2007. URL http://www.bafu.admin.ch/publikationen/publikation/00048.
[26] R. Kannan and H. Turton. Cost of ad-hoc nuclear policy uncertainties in the evolution of the Swiss electricity system. Energy Policy, 50: 391–406, 2012. doi: 10.1016/j.enpol.2012.07.035.
[27] R. Kannan and H. Turton. The Swiss TIMES electricity model (STEM-E): Updates to the mod-el input data and assumptions (model release 2). Technical report, Paul Scherrer Institute, Nov 2012. URL http://www.psi.ch/eem/PublicationsTabelle/2012_Kannan_STEME.pdf.
[28] R. Kannan and H. Turton. Swiss electricity supply options: A supplementary paper for PSI’s Energie Spiegel nr. 21. Technical report, Paul Scherrer Institute, Nov 2012. URL http://www.psi.ch/-eem/PublicationsTabelle/2012_energiespiegel_sup.pdf.
[29] R. Kannan and H. Turton. A long-term electricity dispatch model with the times framework. Environment Modeling and Assessment, 2012. doi: 10.1007/s10666-012-9346-y.
[30] D. J. MacKay. Sustainable Energy – wihtout the hot air. UIT Cambridge, England, 2009. URL http://www.withouthotair.com.
[31] A. Marcucci and H. Turton. Swiss energy strategies under global climate change and nuclear policy uncertainty. Swiss Journal of Economics and Statistics, 148 (2): 317–345, 2012. URL http://-www.sjes.ch/papers/2012-II-8.pdf.
[32] Poyry. Angebot und Nachfrage nach flexiblen Erzeugungskapazitäten der Schweiz - Endbe-richt. Technical report, VSE, May 2012. URL http://www.strom.ch/uploads/media/Poyry_Studie-Flexibilitaet_2012_03.pdf.
[33] Prognos. Die Energieperspektiven für die Schweiz bis 2050. Technical report, Bundesamt für Energie, Basel, Sep 2012. URL http://www.bfe.admin.ch/php/modules/publikationen/-stream.php?extlang=de&name=de_564869151.pdf.
[34] Prognos. Anhang iii – Die Energieperspektiven für die Schweiz bis 2050. Technical report, Bundesamt für Energie, Basel, Sep 2012. URL http://www.bfe.admin.ch/php/modules/publikationen/-stream.php?extlang=de&name=de_728972068.pdf.
[35] PSI. Energie-Spiegel – sustainable electricity: Wishful thinking or near-term reality? Technical Report 20, Paul Scherrer Institute, Villigen PSI, Jun 2010. URL http://www.psi.ch/info/MediaBoard/-Energiespiegel_20e.pdf.
[36] PSI. Energie-Spiegel – Die Neue Schweizer Energiepolitik: Woher kommt der Strom? Tech-nical Report 21, Paul Scherrer Institute, Villigen PSI, Nov 2012. URL http://www.psi.ch/info/-MediaBoard/Energiespiegel_21_e.pdf.
[37] RTE. Electricity statistics. Technical report, RTE-France, 2012.
[38] SATW. Road map renewable energies Switzerland – An analysis with a view to harnessing existing potentials by 2050. Technical Report 39, Schweizerische Akademie der Technischen Wissen-schaften, Dec 2006. URL http://www.satw.ch/publikationen/schriften/39_roadmap_e.pdf.
[39] C. Schlenzig. PlaNet – Ein entscheidungsunterstützendes System für die Energie- und Um-weltplanung. PhD thesis, University Stuttgart, Stuttgart, Jan. 2001. URL http://elib.uni-stuttgart.de/-opus/volltexte/2001/742/pdf/diss_cs.pdf.
[40] SCS. SCS Energiemodell. Technical Report 1.2, Supercomputing Systems AG, Zürich, Jun 2013. URL http://www.scs.ch/fileadmin/images/tg/energie.pdf. Model Version v1.4.
[41] SECO. Scenario du SECO pour le PIB á long terme. Technical report, Staatssekretariat für Wirtschaft, Bern, 2011.
[42] B. Steubing, R. Zah, P. Waeger, and C. Ludwig. Bioenergy in Switzerland: Assessing the do-mestic sustainable biomass potential. Renewable and Sustainable Energy Reviews, 14 (8): 2256–2265, Oct. 2010. ISSN 1364-0321. doi: 10.1016/j.rser.2010.03.036.
[43] Terna. Statistical data - general data. Technical report, Terna S.p.A., Rome, 2012. URL http://-www.terna.it/default/home_en/electric_system/statistical_data.aspx.
47 of 48

[44] S. Teske and G. Heiligtag. Energy [r]evolution. Technical report, Greenpeace International, Greenpeace Schweiz, Global Wind Energy Council, European Renewable Energy Council, Nov 2013. URL http://www.greenpeace.org/switzerland/de/Themen/Stromzukunft-Schweiz/EnergyRevolution.
[45] Umweltallianz. Strommix 2035 - 100 Prozent einheimisch, erneuerbar, effizient. Technical report, Umweltallianz, Bern, 2012. URL http://www.umweltallianz.ch/de/stromzukunft.html.
[46] VSE. Wege in die neue Stromzukunft. Technical report, Verband Schweizerischer Elektrizi-tätsunternehmen, Aarau, 2012. URL http://www.strom.ch/uploads/media/VSE_Wege-Stromzukunft_Gesamtbericht_2012.pdf.
[47] N. Weidmann, R. Kannan, and H. Turton. Swiss climate change and nuclear policy: A com-parative analysis using an energy system approach and a sectoral electricity model. Swiss Journal of Economics and Statistics, 148 (2): 275–316, 2012. URL http://www.sjes.ch/papers/2012-II-7.pdf.
[48] N. O. Weidmann. Transformation strategies towards a sustainable Swiss energy system – an energy-economic scenario analysis. PhD thesis, ETH, Zürich, 2013. Nr. 21137. doi: http://dx.doi.org/10.3929/ethz-a-009962867.
[49] A. Wüest. Hydropower – potential for and limits to expansion. Eawag News, 72: 22–25, Jun 2012. URL http://www.eawag.ch/medien/publ/eanews/news_72/en72e_wuest.pdf.
48 of 48

Paul Scherrer Institut :: 5232 Villigen PSI :: Switzerland :: Tel. +41 56 310 21 11 :: Fax +41 56 310 21 99 :: www.psi.ch