Rx15 tpp wed_1115_1_zhou_2fisher_3skinner
66
Third-Party Payer Track: Financial Toll of Rx Addiction Presenters: • Chao Zhou, PhD, Economist, National Center for Injury Prevention and Control, CDC • Stephen N. Fisher, MD, PhD, Medical Advisor to the CEO, Chesapeake Employers’ Insurance Company • Asheley Cockrell Skinner, PhD, Associate Professor, Injury Prevention Research Center, UNC - Chapel Hill Moderator: Grant T. Baldwin, PhD, MPH, Director, Division of Unintentional Injury Prevention, National Center for Injury Prevention and Control, CDC, and Member,
-
Upload
opunite -
Category
Healthcare
-
view
308 -
download
0
Transcript of Rx15 tpp wed_1115_1_zhou_2fisher_3skinner

Third-Party Payer Track:Financial Toll of Rx AddictionPresenters:• Chao Zhou, PhD, Economist, National Center for Injury
Prevention and Control, CDC• Stephen N. Fisher, MD, PhD, Medical Advisor to the CEO,
Chesapeake Employers’ Insurance Company• Asheley Cockrell Skinner, PhD, Associate Professor, Injury
Prevention Research Center, UNC - Chapel Hill
Moderator: Grant T. Baldwin, PhD, MPH, Director, Division of Unintentional Injury Prevention, National Center for Injury Prevention and Control, CDC, and Member, Rx Summit National Advisory Board

Disclosures
Chao Zhou, PhD; Stephen N. Fisher, MD, PhD; Asheley Cockrell Skinner, PhD; and Grant T. Baldwin, PhD, MPH, have disclosed no relevant, real, or apparent personal or professional financial relationships with proprietary entities that produce healthcare goods and services.

Disclosures
• All planners/managers hereby state that they or their spouse/life partner do not have any financial relationships or relationships to products or devices with any commercial interest related to the content of this activity of any amount during the past 12 months.
• The following planners/managers have the following to disclose:– Kelly Clark – Employment: Publicis Touchpoint Solutions;
Consultant: Grunenthal US– Robert DuPont – Employment: Bensinger, DuPont & Associates-
Prescription Drug Research Center– Carla Saunders – Speaker’s bureau: Abbott Nutrition

Learning Objectives
1. Identify national trends in opioid use and expenditures.
2. Outline strategies to identify and manage high-risk claims within the workers’ compensation population.
3. Describe the North Carolina Medicaid Lock-In Program.

National Trends in Prescription Opioid Utilization and Third-Party Payment in the
United States, 1999-2012
Chao Zhou, Ph.DCurtis Florence, Ph.D
Deborah Dowell, MD, MPH
National Center for Injury Prevention and ControlCenters for Disease Control and Prevention
April 2015Disclaimer: The findings and conclusions in this report are those of the authors and do not necessarily represent the official position of the Centers for Disease Control and Prevention.

Opioid-related overdose deaths by age group, United States, 1999-2012
Authors’ calculation using mortality data from NCHS
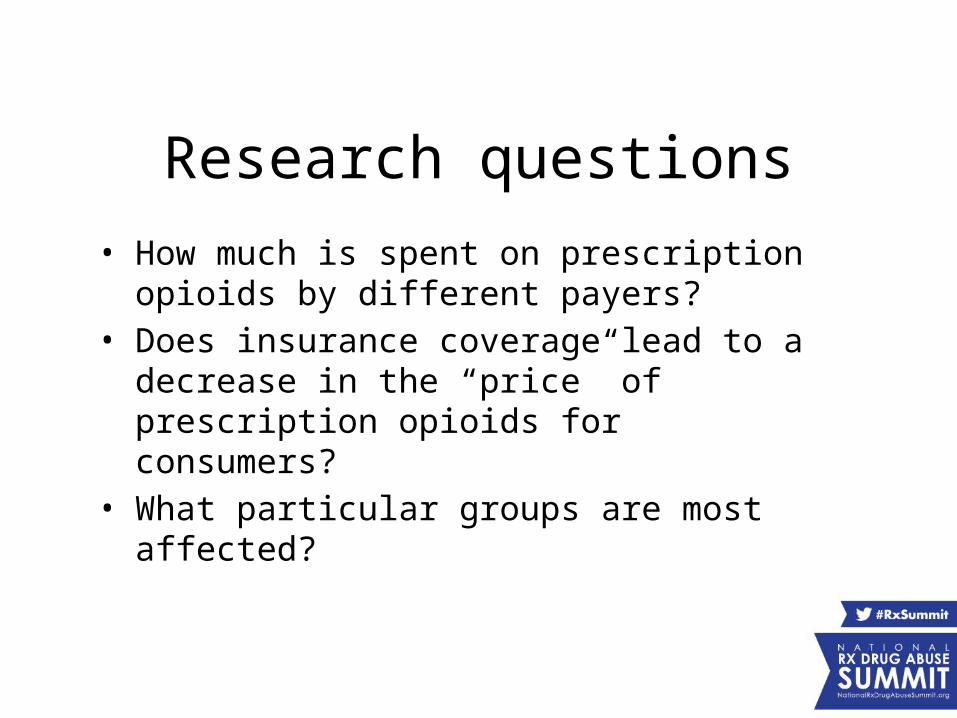
Research questions
• How much is spent on prescription opioids by different payers?
• Does insurance coverage lead to a decrease in the “price” of prescription opioids for consumers?
• What particular groups are most affected?

Study data and methods• Study design: descriptive analysis of trends in
expenditure• Data: Medical Expenditure Panel Survey (1999-2012)• Population: people with at least one opioid prescription• Payer type: self-pay, Medicare, Medicaid, private
insurance, other private insurance and other public insurance
• Measure for the strength of a given amount of opioid analgesic: morphine milligram equivalent (MME)

Total expenditures charged for opioid prescriptions by insurance type, United States, 1999-2012
Medical Expenditure Panel Survey

Total morphine milligram equivalent (MME)by payer type, United States, 1999-2012
Medical Expenditure Panel Survey

Average expenditure per one hundred morphine milligram equivalents by payer
type, United States
Year Total Self Pay Private Medicare Medicaid Other *
2001 $8.90 $4.40 $2.40 $0.30 $0.90 $0.90
2006 $8.70 $2.80 $2.00 $3.00 $0.40 $0.50
2012 $4.70 $0.90 $1.40 $1.20 $0.40 $0.80
Medical Expenditure Panel Survey* All other payers

Prescription opioid expenditure by age group and Medicare\Medicaid, United States, 1999-2012
Medical Expenditure Panel Survey

Expenditures for opioid prescription per person with at least one opioid prescription
Payer Overall Age over 65
Age 45 -64 Age 44 -25 Age under
24
Medicare $328 $192 $683 $339 $12
Medicaid $139 $69 $251 $120 $47
Private insurance $209 $205 $274 $171 $48
Medical Expenditure Panel Survey

Preliminary results
• Shift in payer from individuals to private, Medicaid to Medicare from 1999-2012
• The cost to consumers of prescription opioids has declined during this time period
• Large percentage of opioid expenditures are for Medicare recipients less than age 65

Conclusion and limitation
• Conclusion: -majority of opioid prescription costs are for
prescriptions to adults under age 65-Role of Medicare as payer for prescription
opioids increases after 2006• Limitations:
-Does not capture drug diversion -MEPS was not designed to produce state-
level estimates
Third-Party Payer Track: Financial Toll of Rx Addiction
Stephen Fisher, M.D., Ph.D.Medical Advisor to the CEODirector of Health ServicesChesapeake Employers’ Insurance CompanyApril 8, 2015
Disclosure
• Stephen Fisher, MD., Ph.D., has disclosed no relevant, real or apparent personal or professional financial relationships with proprietary entities that produce health care goods and services.
Learning Objectives
1. Identify national trends in opioid use and expenditures.
2. Outline strategies to identify and manage high-risk claims within the workers’ compensation population.
3. Describe the North Carolina Medicaid Lock-In Program.

Drug and Alcohol-Related IntoxicationDeaths in Maryland, 2013
Maryland Department of Health and Mental Hygienehttp://dhmh.Maryland.gov/data/Documents/2013%20final%20intoxication%20report.pdf

Opiate Prescribing by State
Source: http://www.riskandinsurance.com/wc-narcotics-abuse/
Chesapeake Employers’ Overview
• Insures primarily small to medium employers- approx. 21,000 policy holders
• Large percentage of policyholders in construction and the trades
• Insures 70% of all Maryland municipalities and counties• Third party administrator for the State of Maryland

Why a Work Comp Problem?
Higher amounts of narcotics in treating acute work-related low back pain cause injured workers to be:• away from work longer (up to 69 days longer)• have higher medical costs • be 3X more likely to have surgery • have a 6X greater chance of using narcotics beyond
the recommended time
WorkComp Central 7/20/09

Chesapeake Employers / IWIFTop 10 Manual Class Codes Associated with Top 10 Drug Cost
STATE EMPLOYEE -- NON-HAZARDOUS WORK
CARPENTRY PRIVATE RESIDENCES
TOWNSHIP, MUNICIPALITY; ALL EMP EXCL CLERICAL, POLICE & FIRE
CLERICAL OFFICE EMPLOYEES N O C
COUNTIES, ALL EMPLOYEES EXCLUDING POLICE AND FIREFIGHTERS
PLUMBING NOC & DRIVERS
GAS STATION-FULL SERVICE/AUTO REPAIR
TRUCKING: LOCAL HAULING ONLY-ALL EMPLOYEES
CONVAL NURSE HOMES-ALL EMPLOYEES
ELECT WIRING WITHIN BLDGS & DRIVERS
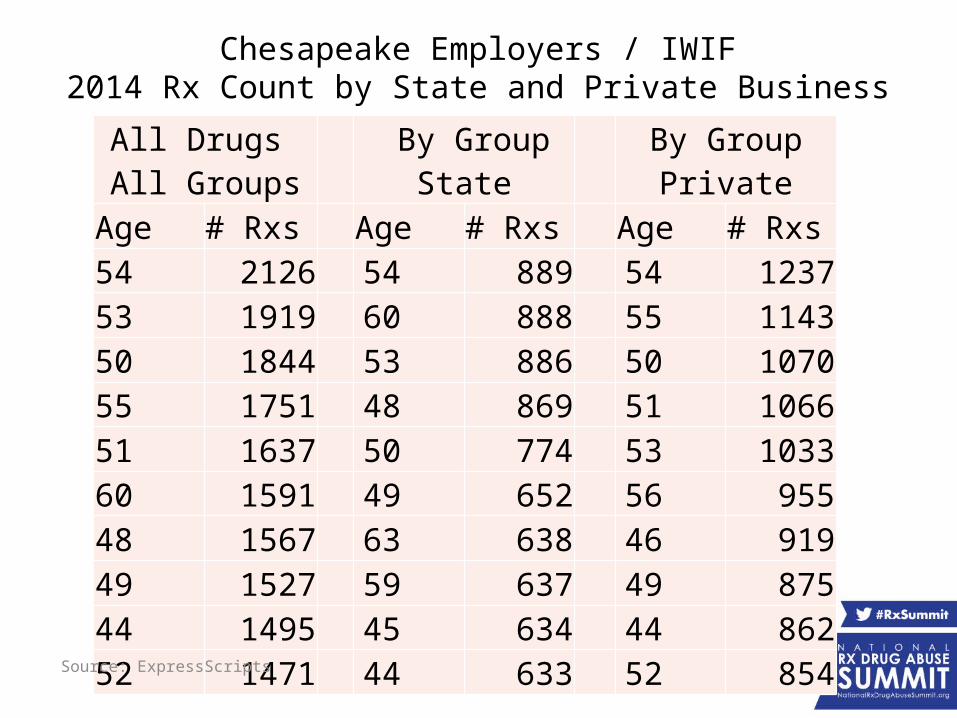
Chesapeake Employers / IWIF2014 Rx Count by State and Private Business
All Drugs All Groups By Group State By Group Private
Age # Rxs Age # Rxs Age # Rxs54 2126 54 889 54 123753 1919 60 888 55 114350 1844 53 886 50 107055 1751 48 869 51 106651 1637 50 774 53 103360 1591 49 652 56 95548 1567 63 638 46 91949 1527 59 637 49 87544 1495 45 634 44 86252 1471 44 633 52 854
Source: ExpressScripts

Prescription Drug Problem in Maryland Workers’ Comp
• There is a guaranteed payer, no co-pays, and freedom to choose practitioner
• Opioids make up to 3 percent of costs in shorter term claims and between 15 and 20 percent of all medical costs in longer term claims
• Travelers estimates medical costs currently make up 60 percent of workers’ comp claim costs and are projected to increase to 67 percent by 2019
• Narcotics account for 25% of drug costs (NCCI, September 26, 2013)
• Utilization is a major driver in cost changes (NCCI, September 26, 2013)
Insurance Business May 17, 2013- Opioid Epidemic Plagues Workers’ Comp

Key Cost Areas for Workers’ Compensation
• Epidemic of opioid use, overuse and abuse (prescribing, utilization)
• Physician dispensing• Costs associated with compound medications• Converting brand opioids to generic alternatives

Chesapeake Employers-Prescribers by Specialty
Rank by Cost Specialty
% of Rxs
% of Cost
# of Rxs with MED
> 901 Physical Medicine & Rehabilitation 10.9% 14.4% 6622 Internal Medicine 12.9% 13.9% 1953 Physician Assistant 12.6% 11.5% 6874 Nurse Practitioner 9.8% 10.2% 5955 Family Medicine 8.4% 8.0% 2206 Specialist 6.1% 5.9% 1987 Psychiatry & Neurology 5.7% 5.8% 738 Pain Medicine 3.6% 5.8% 2749 Anesthesiology 4.5% 4.9% 271
10 Orthopaedic Surgery 6.5% 3.2% 22011 Registered Nurse 1.1% 2.2% 9612 General Practice 1.5% 1.4% 29113 Clinical Nurse Specialist 0.2% 0.8% 2314 Neurological Surgery 1.4% 0.8% 5515 Emergency Medicine 1.2% 0.6% 3016 Surgery 0.7% 0.6% 24

Chesapeake Employers Pharmacy/ Opioids - Interventions
• Early opioid utilization 60-90 days following injury• Narcotic alert reporting• Evidence-based-guidelines• Alerts for MED > 120 • Narcotic scripts continuing 90 days following the injury• Houston cocktail report• Formulary control using days from injury, duration and
number of refills• Red flags in duplicate therapy, early refills, multiple
prescribers, poly-pharmacies • Peer reviews, Independent Medical Evaluations

Chesapeake Employers’Program Initiatives
• Pharmacy Benefit Manager (PBM) partnership on Fraud, Waste and Abuse
• Pain Management group• Pharmacy Nurse• Behavioral Health Assessments• Functional Restoration Programs• Multidisciplinary Back Program• State Regulatory Health Agency• Identifying groups prescribing and or dispensing inappropriately• Education of injured workers of the dangers of long term opioids• Soft tissue algorithm to prevent medical and drug over utilization

RESULTS OF PHARMACY INITIATIVES

Chesapeake Employers 2014 Percentage and Average of Narcotics Rxs
% Narcotics to total rxs Average narcotic rxs/claim
2011 2012 2013 2014
13 12 11
10
2011 2012 2013 201456%
58%
60%
62%
64%
66%
68%
70% 69%
66%65%
61%
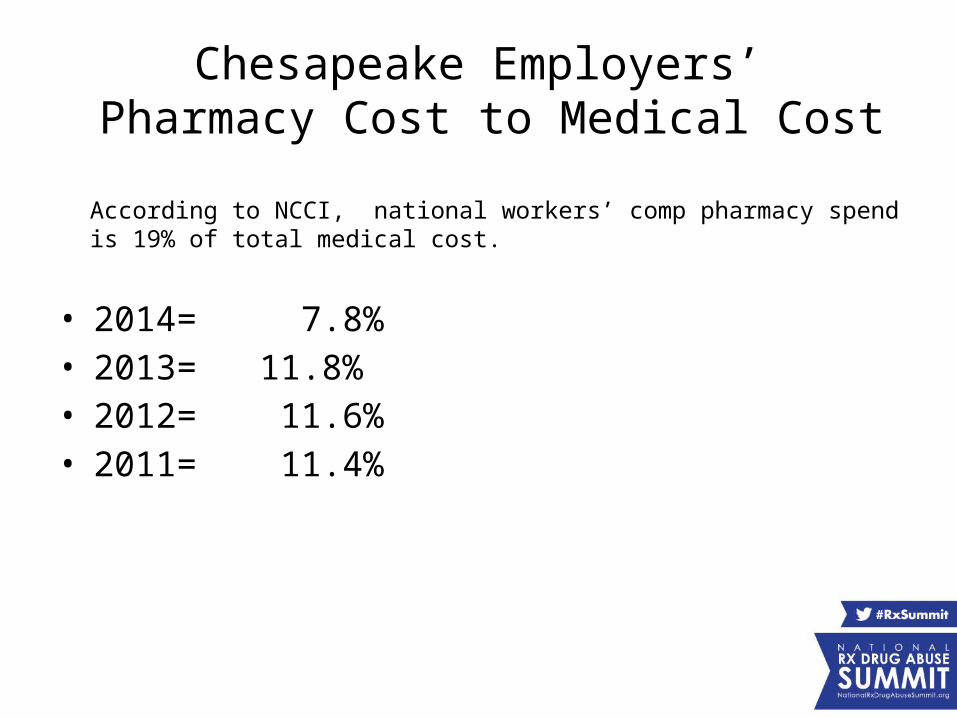
Chesapeake Employers’ Pharmacy Cost to Medical Cost
• 2014= 7.8%• 2013= 11.8%• 2012= 11.6%• 2011= 11.4%
According to NCCI, national workers’ comp pharmacy spend is 19% of total medical cost.

Chesapeake Employers -Top Therapy Classes by % of plan cost & Rx count
0%
5%
10%
15%
20%
25%
30%
35%
% of Plan Cost
% Rx Count

Chesapeake Employers - Top 10 Drugs By Percentage of Plan Cost and Script Count in 2014
OXYCONTIN
LYRICA
OXYCODONE HCL
OXYCODONE-ACETAM
INO...
GABAPENTIN
DULOXETIN
E HCL
MORPHIN
E SULF
ATE ER
OPANA ER
LIDOCAIN
E
FENTANYL
0%
2%
4%
6%
8%
10%
12%
% of Plan Cost
% Rx Count
Express Scripts
Acetaminophen

Chesapeake Employers' Results-Brand to Generic Initiative
Started in 2014
% generic Rx count
% generic cost
% brand
Rx count
% brand cost
2014 82% 49% 18% 51%2013 76% 38% 24% 62%

Chesapeake Employers Drug Therapy Class Percentage of Yearly
Cost Variance
YEAR2011 to 2012
2012 to 2013
2013 to 2014
OPIOID AGONISTS 14.32% -0.12% 4.34%
ANTICONVULSANTS-MISC 0.67% -15.42% 0.22%
OPIOID COMBINATIONS 9.77% 2.14% -6.89%
CENTRAL MUSCLE RELAXANTS 7.72% -8.26% 0.91%NSAIDS- ANTI-INFLAMMATORY -8.68% -21.54% 6.76%

Chesapeake EmployersTop Five Drugs
Percentage of Yearly Cost Variance
YEAR2011 to
20122012 to
20132013 to
2014
Oxycontin 13.84% 1.97% 3.07%
Lyrica 3.53% -19.36% -1.44%
Oxycodone HCL 1.60% -8.52% -40.67%
Oxycodone-Acetaminophen 13.47% -9.51% -43.21%
Gabapentin 4.48% -15.60% -4.00%

Chesapeake Employers’ Office Dispensing Strategy
Office Dispensing- Maryland has no pharmacy fee schedule• Re-pricing of dispensed drugs to PBM pricing• Data analytics - prescribing data and by medical specialty• PBM educational mailings to injured workers regarding
prescription drugs• Direct outreach to injured worker by adjuster or nurse case
managers

2014 Office Dispensing for aPain Management Practice
• Large pain management practice with large number of physician extenders
• # distinct claims - 187 # of overall office visits - 1,208 office visits
• # of visits with a drug dispensed - 155 of the visits (238 scripts)
• 13% of visits with drug dispensed• 1.5 scripts per visits
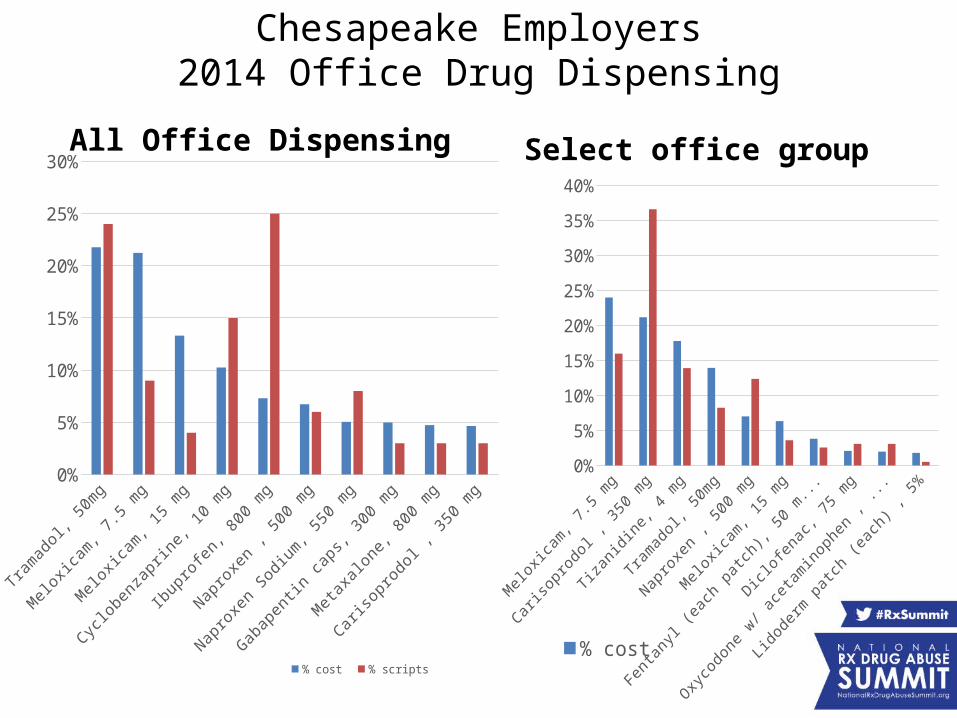
Chesapeake Employers2014 Office Drug Dispensing
All Office Dispensing
Tramadol, 5
0mg
Meloxic
am, 7.5 m
g
Meloxic
am, 15 m
g
Cyclobenza
prine, 1
0 mg
Ibuprofen, 8
00 mg
Naproxe
n , 500 m
g
Naproxe
n Sodium, 5
50 mg
Gabapentin caps,
300 mg
Metaxa
lone, 800 m
g
Carisopro
dol , 350 m
g0%
5%
10%
15%
20%
25%
30%
% cost % scripts
Select office group
0%
5%
10%
15%
20%
25%
30%
35%
40%
% cost% scripts
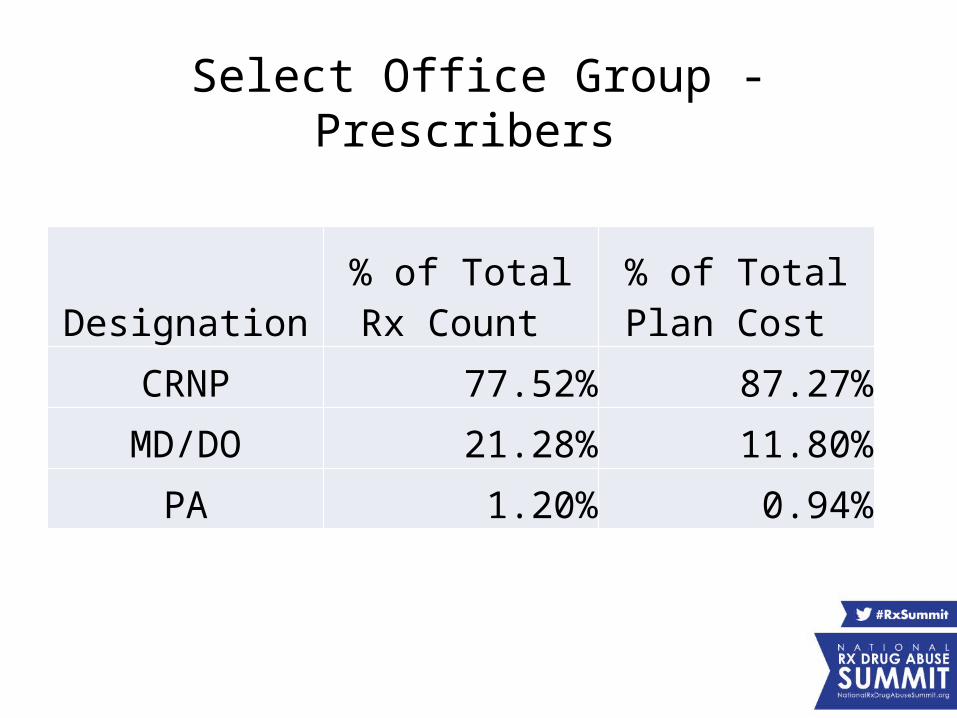
Select Office Group - Prescribers
Designation% of Total Rx
Count % of Total Plan
Cost
CRNP 77.52% 87.27%
MD/DO 21.28% 11.80%
PA 1.20% 0.94%

Chesapeake Employers’Compound Drugs Initiatives
• Implementation of Chesapeake Employers’ evidence-based Medical Policy
• Re-price each drug in compound mixture back to original NDC#
• Peer reviews/ Independent Medical Evaluations• Evaluate continued therapy upon pain reduction or
improvement in function

Chesapeake Employers’Compound Drug Results
Year Rx Count Plan Cost
2014 148 $ 122,896.45
2013 233 $ 190,582.61
2012 194 $ 100,021.24
2011 311 $ 101,699.59

Conclusion-Key Points
• Build pain management expertise• Provide early intervention!!!!• Identify cost drivers• Implement strategies to mitigate drug use, costs and abuse• Reduce legacy claims• Utilize evidence-based-medicine• Identify red flags for at risk workers and prescribers • Partner with Pharmacy Benefit Manager• Explore Data Analytics• Increase number of appropriate settlements

Using a PDMP to Understand the True Effects
of a Medicaid Program Targeting Opioid Misuse
Asheley Cockrell Skinner, PhDAssociate ProfessorInjury Prevention Research CenterUniversity of North Carolina at Chapel Hill

Disclosure Statement
Asheley Cockrell Skinner, PhD, has disclosed no relevant, real, or apparent personal or professional relationships with proprietary entities that produce health care goods and services.

Learning Objectives
• Identify national trends in opioid use and expenditures.
• Outline strategies to identify and manage high-risk claims within the workers’ compensation population.
• Describe the North Carolina Medicaid Lock-In Program.

History: North Carolina Medicaid Lock-In Program
• Medicaid-based programs are used to minimize controlled substance misuse and abuse, and improve continuity of care – Mortality from overdose in Medicaid-eligible
populations is 5-7 times that of the general population
– Medicaid Lock-In Programs are one such effort• Recommended by the Center for Medicare and
Medicaid Services

History: North Carolina Medicaid Lock-In Program
• Medicaid Lock-In Programs– Constrain patients to a single pharmacy and/or
provider for their controlled substance medications• Improves the monitoring of controlled substance use
across multiple points in the health care system
– Virtually all states have them, though their design varies widely

NC Medicaid Lock-In Program
• 2009 GAO audit showed NC as 1 of 5 states with an unusually large number of controlled substance claims
• North Carolina MLIP developed in response – Implemented in October 2010

NC MLIP Eligibility Details
• Eligibility - In 2 consecutive months:– Fill 6 or more opioid or benzodiazepine
prescriptions;– Receive opioid or benzodiazepine prescriptions from
3 or more unique providers; and/or– Receive a direct provider referral
• Locked in for 12 months– May utilize only 1 prescriber and 1 pharmacy, self-
specified, for all opioid or benzodiazepine prescriptions

The MLIP Loophole: Circumvention
• If there is no Medicaid claim associated with a purchase (cash payment), prescriptions may be obtained without being monitored– Minimizes clinical and economic impact of Lock-In
programs• Prescriptions may be misused, abused, or diverted• Wastes Medicaid resources devoted to MLIP
administration

Research Objectives
1. Determine the effect of enrollment in the NC MLIP on opioid prescriptions, including volume, prescribers, and costs.
2. Determine the effect of enrollment in the NC MLIP on circumvention of opioid prescriptions.

Study Design
• Pre-post MLIP enrollment comparison– October 2009 – June 2013
• One year prior to the initiation of the MLIP through the first two years of implementation
• Controls– Multiple observations used to minimize the effects
of regression to the mean– Enrollment in the MLIP occurs for a group of
individuals each month, minimizing temporal effects

Data Sources
1. North Carolina Medicaid Claims2. North Carolina Controlled Substance Reporting
System (CSRS)– State Prescription Drug Monitoring Program (PDMP)– Does not capture Medicaid ID or other shared identifiers
Records between these two systems were matched by hand at the NC Division of Medical Assistance (DMA)– Used names, addresses, dates of birth– De-identified prior to acquisition by UNC
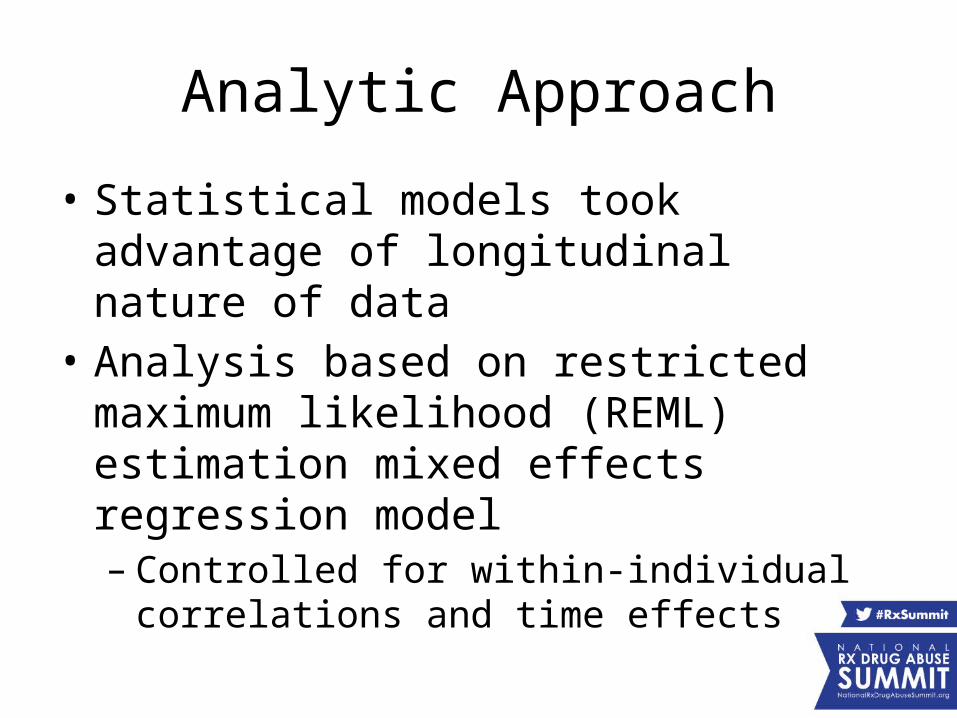
Analytic Approach
• Statistical models took advantage of longitudinal nature of data
• Analysis based on restricted maximum likelihood (REML) estimation mixed effects regression model– Controlled for within-individual correlations and
time effects
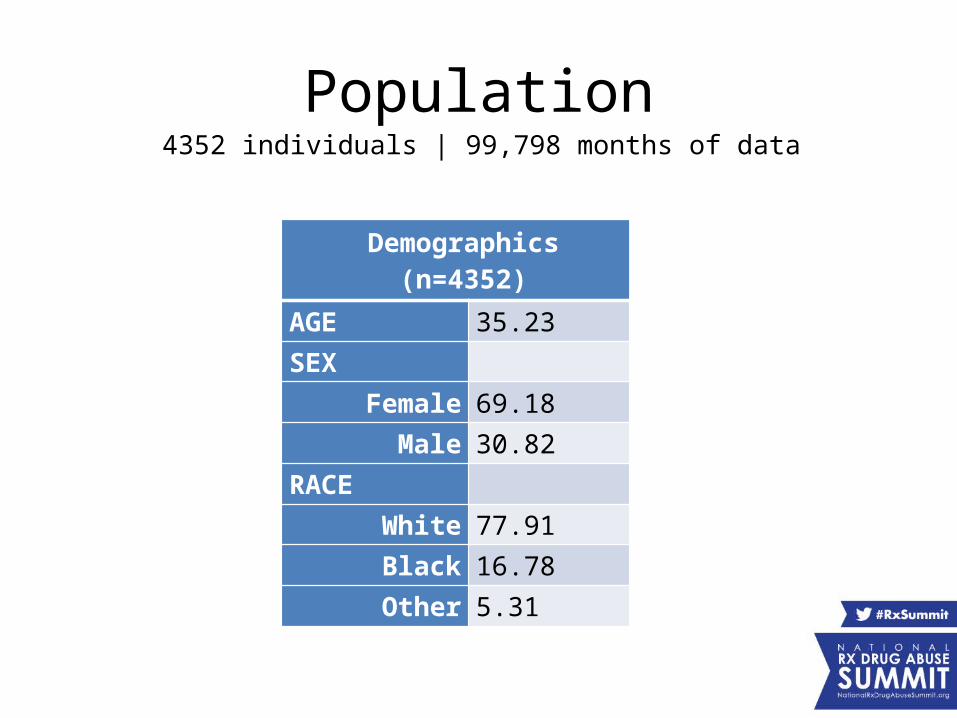
Population4352 individuals | 99,798 months of data
Demographics (n=4352)
AGE 35.23
SEX
Female 69.18
Male 30.82
RACE
White 77.91
Black 16.78
Other 5.31

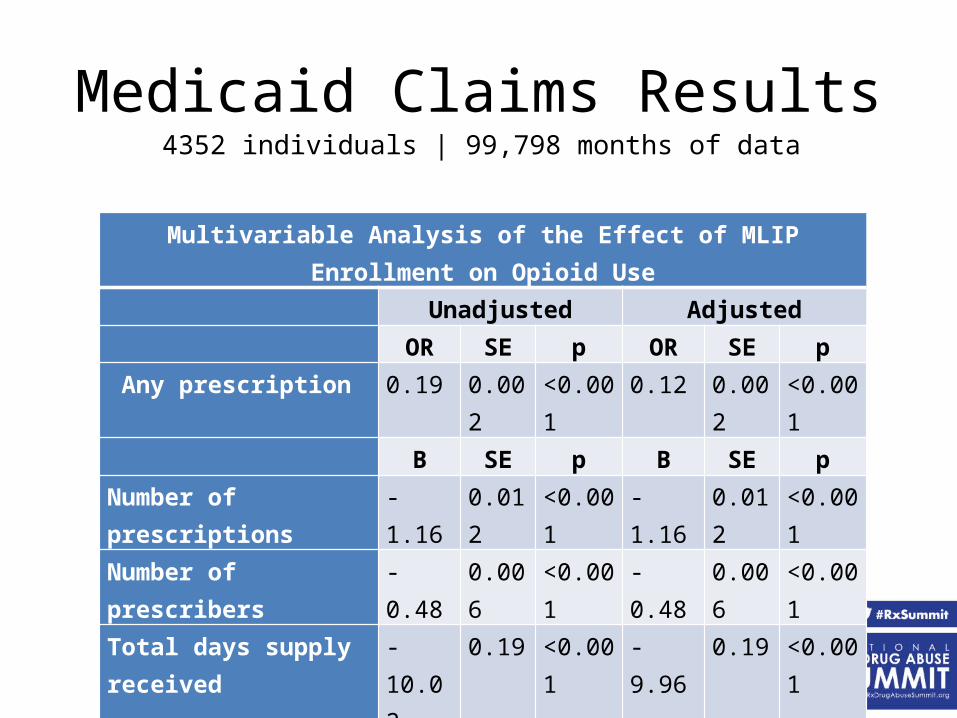
Medicaid Claims Results4352 individuals | 99,798 months of data
Opioid Claims Averages for MLIP Cohort (by whether or not enrolled that month)
Overall Not Enrolled Enrolled p
Opioids
Any opioid claim 57.5 64.8 37.9 <0.001
Number of prescriptions 1.44 1.64 0.84 <0.001
Number of prescribers 0.51 0.56 0.35 <0.001
Total days supply received 22.67 23.72 19.48 <0.001
Total units received 86.1 91.97 68.32 <0.001
Total Medicaid payments 104.07 101.12 113.01 <0.001
Medicaid Claims Results4352 individuals | 99,798 months of data
Multivariable Analysis of the Effect of MLIP Enrollment on Opioid Use Unadjusted Adjusted OR SE p OR SE p
Any prescription 0.19 0.002 <0.001 0.12 0.002 <0.001 B SE p B SE p
Number of prescriptions -1.16 0.012 <0.001 -1.16 0.012 <0.001Number of prescribers -0.48 0.006 <0.001 -0.48 0.006 <0.001Total days supply received -10.02 0.19 <0.001 -9.96 0.19 <0.001Total units received -41.62 0.88 <0.001 -41.52 0.88 <0.001Total Medicaid payments -23.75 2.56 <0.001 -23.85 2.58 <0.001

Multivariable Analysis of the Effect of MLIP Enrollment on Opioid Circumvention
Unadjusted Adjusted OR SE p OR SE pAny circumvention 5.07 0.09 <0.001 5.11 0.14 <0.001 B SE p B SE pNumber of prescriptions 0.58 0.01 <0.001 0.58 0.01 <0.001Prescribers 0.47 0.01 <0.001 0.48 0.01 <0.001Units 23.33 0.80 <0.001 23.36 0.80 <0.001Days supply 5.77 0.15 <0.001 5.76 0.15 <0.001
Circumvention Results4352 individuals | 99,798 months of data
Potential MLIP Benefits
• Appropriate use of controlled substances - reduced number of prescriptions and volume per prescription– Improved quality of care– Cost savings

Potential MLIP Limitations
• Enrollees may be denied access to needed medications
• Circumvention may have a significant impact on the effectiveness of the MLIP– Medicaid covers medical care related to
circumvented prescriptions
Lessons Learned
• Integrating PDMP and Medicaid claims allows for a different picture of the effect of Medicaid-based programs– Future improvement to PDMPs should consider
shared identifiers to permit linkages

Conclusions
• Limited evaluation of MLIPs– Appear to reduce opioid prescriptions– Many opioids are relatively inexpensive – enrollees
may attempt to circumvent the system by paying cash
• Limited information sharing between Medicaid and PDMPs– Need PDMPs to collect and share payment methods– Need the sharing of a random unique identifier for
linking purposes

Third-Party Payer Track:Financial Toll of Rx AddictionPresenters:• Chao Zhou, PhD, Economist, National Center for Injury
Prevention and Control, CDC• Stephen N. Fisher, MD, PhD, Medical Advisor to the CEO,
Chesapeake Employers’ Insurance Company• Asheley Cockrell Skinner, PhD, Associate Professor, Injury
Prevention Research Center, UNC - Chapel Hill
Moderator: Grant T. Baldwin, PhD, MPH, Director, Division of Unintentional Injury Prevention, National Center for Injury Prevention and Control, CDC, and Member, Rx Summit National Advisory Board