Rx15 pdmp wed_1115_1_kreiner_2ringwalt
54
PDMP Track Ensuring Appropriate Prescribing: Using PDMPs to Identify and Address Problematic Prescribing Presenters: • Peter W. Kreiner, PhD, Senior Scientist, Institute for Behavioral Health, Brandeis University • Christopher Ringwalt, DrPH, MSW, Senior Scientist, Injury Prevention Center, University of North Carolina at Chapel Hill Moderator: John L. Eadie, Director, Prescription Drug Monitoring Program (PDMP) Center of Excellence, and Member, Rx Summit National Advisory Board
-
Upload
opunite -
Category
Healthcare
-
view
285 -
download
0
Transcript of Rx15 pdmp wed_1115_1_kreiner_2ringwalt

PDMP Track
Ensuring Appropriate Prescribing: Using PDMPs to Identify and
Address Problematic Prescribing
Presenters:• Peter W. Kreiner, PhD, Senior Scientist, Institute for
Behavioral Health, Brandeis University• Christopher Ringwalt, DrPH, MSW, Senior Scientist,
Injury Prevention Center, University of North Carolina at Chapel Hill
Moderator: John L. Eadie, Director, Prescription Drug Monitoring Program (PDMP) Center of Excellence, and Member, Rx Summit National Advisory Board

Dislosures
• Peter W. Kreiner, PhD; Chris Ringwalt, DrPH; and John L. Eadie have disclosed no relevant, real or apparent personal or professional financial relationships with proprietary entities that produce health care goods and services.

Disclosures
• All planners/managers hereby state that they or their spouse/life partner do not have any financial relationships or relationships to products or devices with any commercial interest related to the content of this activity of any amount during the past 12 months.
• The following planners/managers have the following to disclose:– Kelly Clark – Employment: Publicis Touchpoint Solutions;
Consultant: Grunenthal US– Robert DuPont – Employment: Bensinger, DuPont &
Associates-Prescription Drug Research Center– Carla Saunders – Speaker’s bureau: Abbott Nutrition

Learning Objectives
1. Advocate use of PDMPs to identify and address problematic prescribing.
2. Explain the purpose, operation and epidemiological findings of the Prescription Behavior Surveillance System.
3. List metrics that can be used to identify providers manifesting unusual or uncustomary prescribing practices.

Ensuring Appropriate Prescribing Using PDMPs to Identify and
Address Problematic Prescribing:Epidemiological Findings from the Prescription Behavior Surveillance
System
April 8, 2015
Peter W. Kreiner, Ph.D.
Brandeis University

Disclosure Statement
Peter Kreiner, Ph.D., has disclosed no relevant, real, or apparent personal or professional financial relationships with proprietary entities that produce health care goods and services.

Learning Objectives
1. Advocate use of PDMPs to identify and address problematic prescribing.
2. Explain the purpose, operation and epidemiological findings of the Prescription Behavior Surveillance System.
3. List metrics that can be used to identify prescribers manifesting unusual or uncustomary prescribing practices.

Overview
• Development of the Prescription Behavior Surveillance System (PBSS):
– Federal and state PDMP partners
– Data submitted by state partners
– Measures of prescribing behavior; and patient, prescriber, and pharmacy risk indicators
• Applications of PDMP data: Examples of trends in prescribing behaviors and risk indicators
• Issues in data quality and its assessment, including record-matching procedures

The Prescription Behavior Surveillance System (PBSS)
A longitudinal, multi-state database of de-identified PDMP data, to serve as:
1. An early warning public health surveillance tool
2. An evaluation tool, in relation to state and local laws, policies and initiatives, such as prescriber educational initiatives
Info available at: http://www.pdmpexcellence.org/content/
prescription-behavior-surveillance-system-0

PBSS Continued• Began in FY2012 with support from CDC and FDA,
administered through BJA
• Guided by Oversight Committee:
– Federal partners: CDC, FDA, BJA, SAMHSA
– State partners to date: CA, DE, FL, ID, KY, LA, ME, OH, TX, WA, WV
– Additional state partners in process
– Adjunct state partners (MA, OK, TN) – unable to share data but may be willing to provide PBSS surveillance measures
– No release of data or findings without Oversight Committee approval

PBSS Continued• De-identified data from each participating
state– Data use agreements tailored to each state’s laws and
requirements
– Beginning with 2010 or 2011, initial 2 – 4 years of data
– Data updated quarterly (including prior 12 months)
– Project-specific ID #’s for patients, prescribers, pharmacies
• Maintained for the duration of the data
– Data housed in secure IT environment at Brandeis University

PBSS Measures• Prescribing measures
– Rates of opioid, benzodiazepine, stimulant prescriptions• By quarter and year, by drug class, sex, and age group
• By quarter and year, by major opioid, benzodiazepine, and stimulant drug category
• Patient risk indicators– Average daily dosage of opioids (MMEs)
– Days of overlapping prescriptions
– Multiple provider episode rates• By drug class, age group, and drug category

PBSS Measures Continued• Prescriber risk indicators
– Prescriber percentile ranking, based on daily prescribing volume• By quarter, year, and drug class
– Average daily dosage for opioid patients (MMEs)
– Median distance in miles, patient to prescriber
– Percentage of patients with MPE
– Percentage of prescriptions by payment type
– Percentage of patients prescribed LA/ER opioids who were opioid-naïve
• Pharmacy risk indicators– Analogous to prescriber risk indicators

Some Examples
• Trends in prescribing rates, by state– Opioids in general
– Hydrocodone in particular
• Trends in patient/prescriber risk indicators, by state– Overlapping opioid and benzodiazepine prescriptions
– High average daily dosage of opioids
– Multiple provider episodes (MPEs)
• Framework for validation studies of prescriber risk indicators

0
50
100
150
200
250
300
350
400
2010Q1
2010Q2
2010Q3
2010Q4
2011Q1
2011Q2
2011Q3
2011Q4
2012Q1
2012Q2
2012Q3
2012Q4
2013Q1
2013Q2
2013Q3
2013Q4
2014Q1
2014Q2
2014Q3
2014Q4
Opioid Prescriptions per 1,000 State ResidentsBy State and Quarter
CA
DE
FL
ID
KY
LA
ME
OH
WA
WV
Tramadol becomes Sch. IV

0
50
100
150
200
250
2010Q1
2010Q2
2010Q3
2010Q4
2011Q1
2011Q2
2011Q3
2011Q4
2012Q1
2012Q2
2012Q3
2012Q4
2013Q1
2013Q2
2013Q3
2013Q4
2014Q1
2014Q2
2014Q3
2014Q4
Hydrocodone Prescriptions per 1,000 State ResidentsBy State and Quarter
CA
DE
FL
ID
KY
LA
ME
OH
WA
WV
Hydrocodone rescheduled to Sch. II

0.00
5.00
10.00
15.00
20.00
25.00
2010Q1
2010Q2
2010Q3
2010Q4
2011Q1
2011Q2
2011Q3
2011Q4
2012Q1
2012Q2
2012Q3
2012Q4
2013Q1
2013Q2
2013Q3
2013Q4
2014Q1
2014Q2
2014Q3
2014Q4
Percent of Opioid Patients Receiving an Average Dosage > 100 MME per Day
CA
DE
FL
ID
KY
LA
ME
OH
WA
WV

0.00
5.00
10.00
15.00
20.00
25.00
2010Q1
2010Q2
2010Q3
2010Q4
2011Q1
2011Q2
2011Q3
2011Q4
2012Q1
2012Q2
2012Q3
2012Q4
2013Q1
2013Q2
2013Q3
2013Q4
2014Q1
2014Q2
2014Q3
2014Q4
Percent of Opioid Prescription Days with Overlapping Benzodiazepine Prescriptions, by State and Quarter
CA
DE
FL
ID
KY
LA
ME
OH
WA
WV
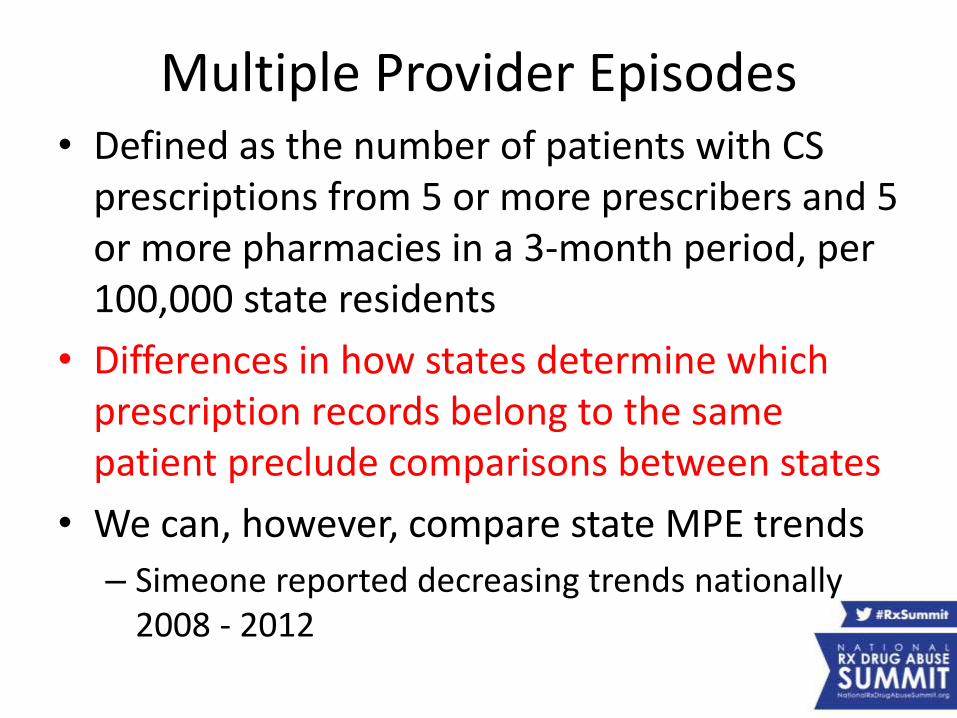
Multiple Provider Episodes• Defined as the number of patients with CS
prescriptions from 5 or more prescribers and 5 or more pharmacies in a 3-month period, per 100,000 state residents
• Differences in how states determine which prescription records belong to the same patient preclude comparisons between states
• We can, however, compare state MPE trends
– Simeone reported decreasing trends nationally 2008 - 2012

0.00
5.00
10.00
15.00
20.00
25.00
30.00
35.00
2010Q1
2010Q2
2010Q3
2010Q4
2011Q1
2011Q2
2011Q3
2011Q4
2012Q1
2012Q2
2012Q3
2012Q4
2013Q1
2013Q2
2013Q3
2013Q4
2014Q1
2014Q2
2014Q3
2014Q4
MP
E ra
tes
pe
r 1
,00
0 s
tate
re
sid
en
tsMultiple Provider Episodes by State and Quarter
Rates per 1,000 Residents
CA
DE
FL
ID
KY
LA
ME
OH
WA
WV
Kentucky mandatory PDMP use law implemented

0.00
5.00
10.00
15.00
20.00
25.00
30.00
2010 2011 2012 2013 2014
MP
E ra
te p
er
10
0,0
00
sta
te r
esi
de
nts
Multiple Provider Episodes by State and YearRates per 100,000 Residents, Annual Averages
CA
DE
FL
ID
KY
LA
ME
OH
WA
WV

Prescriber Risk Indicators
• Prescribing volume by prescriber decile: Proportion of total prescriptions accounted for by prescriber 10% groupings
• Average daily opioid dosage (MMEs) by prescriber decile (volume)
• Distance patients travel to prescriber and proportion of prescriber practice who meet MPE threshold

0
10
20
30
40
50
60
70
1st 2nd 3rd 4th 5th 6th 7th 8th 9th 10th
California, 2012: Proportion of Total Opioid, Stimulant, and Benzodiazepine Prescriptions Written
by Prescriber Deciles
Percent of total opioidprescriptions
Percent of total stimulantprescriptions
Percent of totalbenzodiazepineprescriptions

0
10
20
30
40
50
60
70
80
1st 2nd 3rd 4th 5th 6th 7th 8th 9th 10th
Ave
rage
dai
ly d
osa
ge o
f p
atie
nts
in M
MEs
Prescriber decile based on volume of opioid prescriptions
California 2012: Average Daily Dosage of Patients by Prescriber Decile
Based on Volume of Opioid Prescriptions

0
0.05
0.1
0.15
0.2
0.25
0.3
0.35
0 20 40 60 80 100 120 140
Pe
rce
nta
ge o
f p
resc
rib
er
pat
ien
ts w
ith
MP
E
Average distance patients travel in miles
California 2012: Prescriber Deciles Based on Average Distance Patients Travel, Compared with Percentage of
Prescriber Patients with an MPE
Percentage of patientswith MPE
Log. (Percentage ofpatients with MPE)

Validation Studies
Purpose:
1. Examine frequency of prescribers highest on prescriber risk indicators having actions taken against them (Medical Board, DEA, law enforcement)
– Vs. prescribers lower on these indicators
2. Develop predictive models of actions taken to estimate relative effects of different prescriber behaviors

Validation Studies: Analytic Strategy
• Prescriber outcomes
– Identify prescribers against whom actions have been taken
• By the state Medical Board/Board of Osteopathic Medicine
• By the DEA
• By other law enforcement
– Categorize types of offense and types of action taken
– Examine/take into account prescriber license type and physician specialty
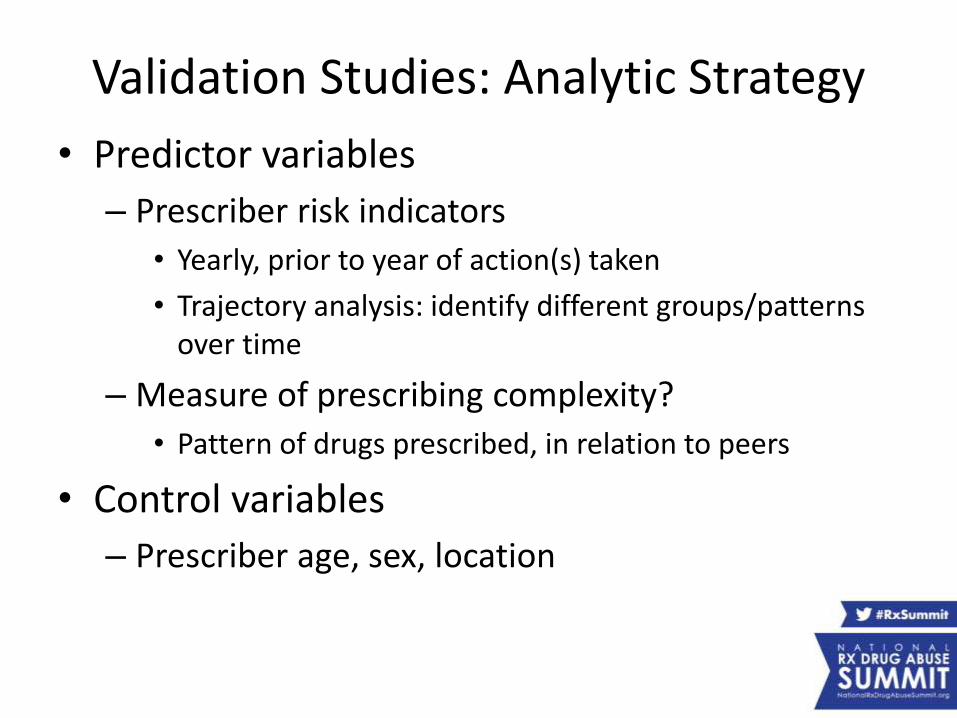
Validation Studies: Analytic Strategy
• Predictor variables
– Prescriber risk indicators
• Yearly, prior to year of action(s) taken
• Trajectory analysis: identify different groups/patterns over time
– Measure of prescribing complexity?
• Pattern of drugs prescribed, in relation to peers
• Control variables
– Prescriber age, sex, location


Limitations of PDMP Data for Surveillance and Evaluation
• No unique identifier for patients: record linking procedures vary by PDMP– Probabilistic vs. deterministic record linking
• PDMP relies on submitting pharmacies for data accuracy
• Practices to assess and ensure data quality vary by PDMP
• Recording of PRN prescriptions subject to pharmacist discretion (e.g., 30 pills may be recorded as 30 days’ supply)

Contact Information
Peter Kreiner, Ph.D.
Principal Investigator
PDMP Center of Excellence
Brandeis University
781-736-3945
www.pdmpexcellence.org

Chris Ringwalt, DrPH*Sharon Schiro, PhD**
Meghan Shanahan, PhD*Scott Proescholdbell, MPH***
Harold Meder, MBA*Anna Austin, MPH,***
Nidhi Sachdeva, MPH ***
*UNC Injury Prevention Research Center**UNC Department of Surgery
***NC Division of Public Health
Using the NC Controlled Substances Reporting System to Identify
Providers Manifesting Unusual Prescribing Practices
32

Disclosure Statement• Chris Ringwalt, DrPH, has disclosed no
relevant, real or apparent personal or professional financial relationships with proprietary entities that produce health care goods and services.
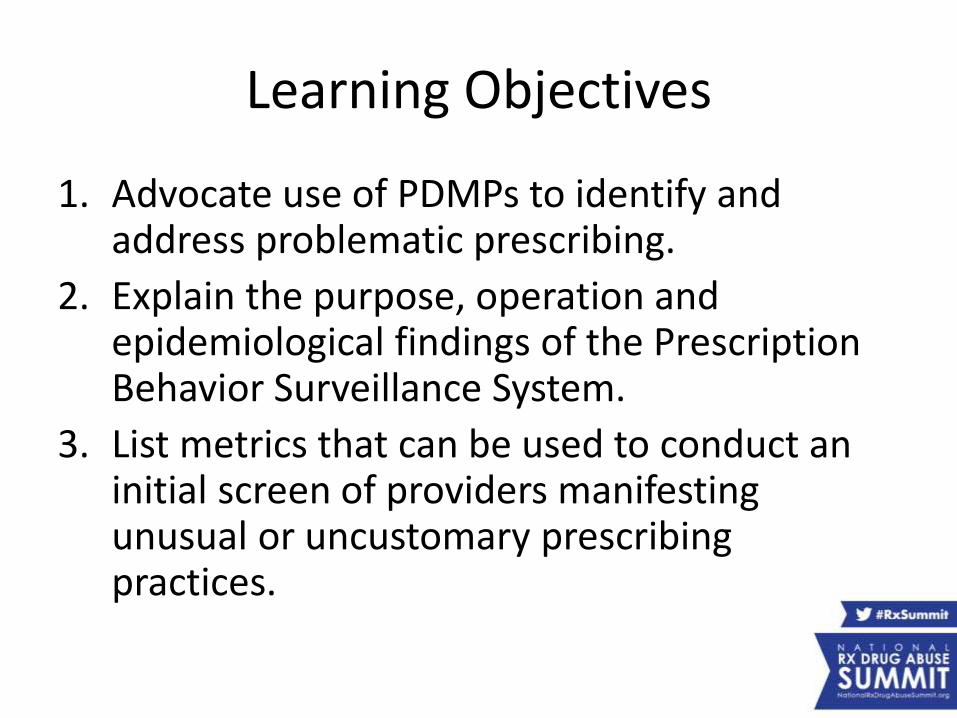
Learning Objectives
1. Advocate use of PDMPs to identify and address problematic prescribing.
2. Explain the purpose, operation and epidemiological findings of the Prescription Behavior Surveillance System.
3. List metrics that can be used to conduct an initial screen of providers manifesting unusual or uncustomary prescribing practices.

35
Introduction• In 2012, the percent of the population admitting
to the misuse of prescriptions drugs in the past 12 months was:– 5.3% of youth aged 12-17– 10.1% of young adults aged 18-25– 3.8% of adults >25
• In 10 years, the annual number of prescriptions for opioid analgesics has increased from 76 to 210 million
• 1.2 million visits to EDs for the nonmedical use of prescription drugs in 2009
• 11,700 deaths were attributed to the nonmedical use of prescription drugs in 2011
• Total cost to society in 2007: $55.4 million

36
Prescription Drug Monitoring Programs: A Powerful Clinical and Research Tool
• Registries of all scheduled drug (controlled substances) prescriptions filled in a given state
• Typically include:
– Date dispensed
– Type, strength, and duration of each prescription
– Identifying information relating to each patient, prescriber, and dispenser (pharmacy)
• Designed to be used for multiple purposes:
– Querying by registered providers and pharmacies of activepatients to promote appropriate prescribing practices and prevent fraud
– Detect inappropriate prescribing (or dispensing) practices
– (Occasionally) research
• Now in all states but Missouri

37
Problems with Use of PDMPs to Detect Inappropriate Prescribing
• Lack of clarity as to which indicators may serve as a good screening tool
• Concerns about the potential for many false positives
• Lack of resources to investigate providers identified by these screens
• Lack of information in PDMPs concerning provider specialty (e.g., oncologists, end-of-life treatment specialists)
• Concern that providers treating chronic patients may:– Dismiss those prematurely
– Treat them sub-optimally
– Decline to accept these patients into their practices

38
How do Regulatory Authorities Detect Inappropriate Prescribing Now?
• Complaints from patients and colleagues
• Audits of medical records
• Investigations by coroners or chief medical examiners
However, currently, there is no standardized screening tool to apply to Prescription Drug Monitoring Programs for this purpose

39
Project Goal
To develop and validate a set of algorithms from metrics that utilize data from North Carolina’s PDMP to develop a screening tool to identify prescribers who manifest unusual and uncustomary prescribing patterns

40
Candidates for MetricsProviders who Write the Highest:
• Rates of prescriptions for daily doses of opioids >100 milligrams of morphine equivalents (MMEs)
• Average daily dose of MMEs• Total MMEs for each prescription• Rates of prescriptions for following drug
classes, irrespective of dose:– Benzodiazepines– Opioids– Stimulants
• Rates of co-prescribed benzodiazepines + opioids >100 MMEs
• Temporally overlapping prescriptions

41
Candidates for Metrics Providers with patients who:
• Travel long distances from their homes to their:– Providers
– Pharmacies
• Fill prescriptions received from multiple providers (doctor shopping) for:– Opioids
– Stimulants
– Benzodiazepines
– Any controlled substance
• Fill prescriptions at multiple pharmacies (pharmacy hopping)

42
Example of metric distribution
0
200
400
600
800
1000
1200
1400
1600
1800
2000
0 5 10 15 20 25 30 35
Nu
mb
er
of
Pro
vid
ers
Average daily rate that providers write opioids for >100 MMEs
Average daily rate that NC providers write opioid prescriptions for >100 MMEs

43
Example: Distribution tail
47
34
810
11
24
21
20 0
1 10
10 0 0 0 0 0 0 0 0
1
0
5
10
15
20
25
30
35
40
45
50
0 1 2 3 4 5 6 7 8 9 10 11 12 13 14 15 16 17 18 19 20 21 22 23 24 25 26 27 28 29 30
Nu
mb
er
of
Pro
vid
ers
Average daily rate that providers write opioids for >100 MMEs
Average daily rate that NC providers write opioid prescriptions for >100 MMEs

44
SO WHAT? So Nothing, until Each Metric is ValidatedInitial Validation Strategy:
• Combed NC Vital Statistics records for deaths (N=465) in 2012 related to opioid overdose – used t-codes representing drug-related poisonings
• Recorded DEA #s of providers who had prescribed opioids to these patients within 30 days of their death.
• Any given decedent could have received prescriptions from multiple providers (N=651)
• Matched these to metrics relating to:– List 1: Top 1% of prescribers of controlled substances in
each tail– List 2: Top 1% of prescribers in each tail + top 1% of
prescribers for all controlled substances– Thus List 2 is a subset of List 1
• Note that because the number of providers in each full distribution varies, the number in the top 1% will also

46%77%
n=57
n=31
0
10
20
30
40
50
60
Highest 1% of this metric Highest 1% of this metric + 1% ofprescribers
Co-prescribed benzodiazepines + opioids >100MMEs
Providers who did not prescribeopioids to a decedent
Providers who prescribed opioids to adecedent

10% 61%
n=165
n=18
0
20
40
60
80
100
120
140
160
180
Highest 1% of this metric Highest 1% of this metric + 1% ofprescribers
Temporally overlapping prescriptions
Providers who did not prescribe opioidsto a decedent
Providers who prescribed opioids to adecedent

34%43%
n=157
n=96
0
20
40
60
80
100
120
140
160
180
Highest 1% of this metric Highest 1% of this metric + 1% ofprescribers
Prescriptions for opioids >100MMEs
Providers who did not prescribe opioidsto a decedent
Providers who prescribed opioids to adecedent

36%
42%
n=290
n=176
0
50
100
150
200
250
300
350
Highest 1% of this metric Highest 1% of this metric + 1% ofprescribers
Prescriptions for any opioids
Providers who did not prescribe opioidsto a decedent
Providers who prescribed opioids to adecedent

30%
32%
n=271
n=167
0
50
100
150
200
250
300
Highest 1% of this metric Highest 1% of this metric + 1% ofprescribers
Prescriptions for any benzodiazepine
Providers who did not prescribe opioidsto a decedent
Providers who prescribed opioids to adecedent

50
Key Metrics Validated by this Mechanism
Metric labelHighest 1% of metric (Proportion, %)
Highest 1% of metric + 1% of prescribers (Proportion, %)
Co-prescribedbenzodiazepines + opioids >100 MMEs
26/57 (46%) 24/31 (77%)
Temporally overlapping prescriptions
16/165 (10%) 11/18 (61%)
Prescriptions for opioids >100 MMEs
54/157 (34%) 41/96 (43%)
Prescriptions for any opioids 105/290 (36%) 74/176 (42%)
Prescriptions for any benzodiazepines
80/271 (30%) 54/167 (32%)

51
Non-Performing Metrics*: Providers with Patients who
• Travel long distances to their
– Providers
– Pharmacies
• Are doctor shoppers
• Are pharmacy shoppers
* With this validation effort, at least

52
Discussion• Some of these metrics performed remarkably well• However, prescribing opioid analgesics within a month of a
patient’s death does not constitute causality• Further, attributing deaths to opioid overdoses is not a perfect
science• Thus we assessed concurrent, not criterion, validity• And findings from these metrics only represent an initial screen• Sensitivity analyses may be helpful: nothing magical about top 1%
of providers• Greater concurrent validity related to providers in top 1% of all
prescribers of a controlled substance (2nd bar) may be a function of greater exposure – i.e., they write the most prescriptions
• Our PDMD:– Lacks specialty information– Lacked (until last year) payer information
• Further validation required, ideally within the context of a longitudinal study that examines the results of screening metrics relative to investigative outcomes

Conclusions
• A few metrics show considerable promise as a screening tool for aberrant prescribing
• Others await further validation before they should be employed
• Appropriate regulatory bodies (law enforcement, medical boards) can now open investigations for proactive in addition to reactive reasons
• Potential for metric placement (rate & rank) to assist investigations by demonstrating to providers exactly where they lie on these distributions
• Effects of use of screening mechanisms like this should be carefully evaluated to determine potential for “chilling” effects on prescribing behaviors
PDMP Track
Ensuring Appropriate Prescribing: Using PDMPs to Identify and
Address Problematic Prescribing
Presenters:• Peter W. Kreiner, PhD, Senior Scientist, Institute for
Behavioral Health, Brandeis University• Christopher Ringwalt, DrPH, MSW, Senior Scientist,
Injury Prevention Center, University of North Carolina at Chapel Hill
Moderator: John L. Eadie, Director, Prescription Drug Monitoring Program (PDMP) Center of Excellence, and Member, Rx Summit National Advisory Board