
Rx15 pharma wed_300_1_egan-gregory_2gray
68
Pharmacy Track: Lessons Learned from Rx Disposal Programs Presenters: • Kathleen Egan, MS, Research Associate, Department of Social Science & Health Policy, Wake Forest School of Medicine • Eric Gregory, EdD, CPS, Executive Director, Save Our Kids Coalition • Jeffrey Gray, PharmD, RPh, Associate Professor, Gatton College of Pharmacy, & Adjunct Professor, College of Public Health, East Tennessee State University Moderator: Dan Smoot, Director of Drug Prevention & Education, Appalachia High Intensity Drug Trafficking Area (HIDTA)
-
Upload
opunite -
Category
Healthcare
-
view
202 -
download
2
Transcript of Rx15 pharma wed_300_1_egan-gregory_2gray

Pharmacy Track:Lessons Learned fromRx Disposal Programs
Presenters:
• Kathleen Egan, MS, Research Associate, Department of Social Science & Health Policy, Wake Forest School of Medicine
• Eric Gregory, EdD, CPS, Executive Director, Save Our Kids Coalition
• Jeffrey Gray, PharmD, RPh, Associate Professor, GattonCollege of Pharmacy, & Adjunct Professor, College of Public Health, East Tennessee State University
Moderator: Dan Smoot, Director of Drug Prevention & Education, Appalachia High Intensity Drug Trafficking Area (HIDTA)

Disclosures
• Kathleen Egan, MS, has disclosed no relevant, real, or apparent personal or professional financial relationships with proprietary entities that produce healthcare goods and services.
• Eric Gregory, EdD, CPS, has disclosed no relevant, real, or apparent personal or professional financial relationships with proprietary entities that produce healthcare goods and services.
• Jeffrey Gray, PharmD, RPh, has disclosed no relevant, real, or apparent personal or professional financial relationships with proprietary entities that produce healthcare goods and services.
• Dan Smoot has disclosed no relevant, real, or apparent personal or professional financial relationships with proprietary entities that produce healthcare goods and services.

Disclosures
• All planners/managers hereby state that they or their spouse/life partner do not have any financial relationships or relationships to products or devices with any commercial interest related to the content of this activity of any amount during the past 12 months.
• The following planners/managers have the following to disclose:– Kelly Clark – Employment: Publicis Touchpoint Solutions;
Consultant: Grunenthal US– Robert DuPont – Employment: Bensinger, DuPont &
Associates-Prescription Drug Research Center– Carla Saunders – Speaker’s bureau: Abbott Nutrition
Learning Objectives
1. Describe the Rx drug disposal methods of DEA take-back events, permanent drop boxes and retail pharmacies.
2. Evaluate the effectiveness of these disposal methods.
3. Identify best practices for implementing these disposal methods.


Disclosure
• Kathleen Egan, M.S., has disclosed no relevant, real or apparent personal or professional financial relationships with proprietary entities that produce health care goods and services.
• Eric Gregory, Ed.D., CPS has disclosed no relevant, real or apparent personal or professional financial relationships with proprietary entities that produce health care goods and services.

• Describe the Rx drug disposal methods of DEA-approved take-back events, permanent drop boxes and retail pharmacies.
• Evaluate the effectiveness of these disposal methods.
• Identify best practices for implementing these disposal methods.

Between 1991 and 2010, prescriptions for opioid analgesics increased from 30 million to 180 million (Phillips, 2013).
Millions of pounds of prescription medications go unused each year in the United States (Shrank, 2011).
Source: AwareRXSource: Nova Southeastern University

To prevent diversion of RX drugs for misuse & abuse.“Providing individuals with a secure and convenient way to dispose of medications will help prevent diversion and abuse, and help to reduce the introduction of drugs into the environment.” (ONDCP, 2011; Stewart et al., 2014)
“Proper disposal is crucial in countering this illegal activity.” (Herring et al., 2008).
To prevent accidental poisoning among children.(Gray and Hagermeier, 2012; Stewart et al., 2014)
To prevent crime in communities.“Medication storage can increase the risk of home invasions.” (Stewart et al., 2014)
To prevent environmental hazards. “Proper disposal of drugs is a straightforward way for individuals to prevent pollution.” (U.S. Environmental Protection Agency, 2010)

• The Galaxy Project
– The Partnership
– Objectives & Research Questions
– DEA Take-Back Events & Permanent Disposal Units
– Collections Assessment
– Results
• Implications for the Field

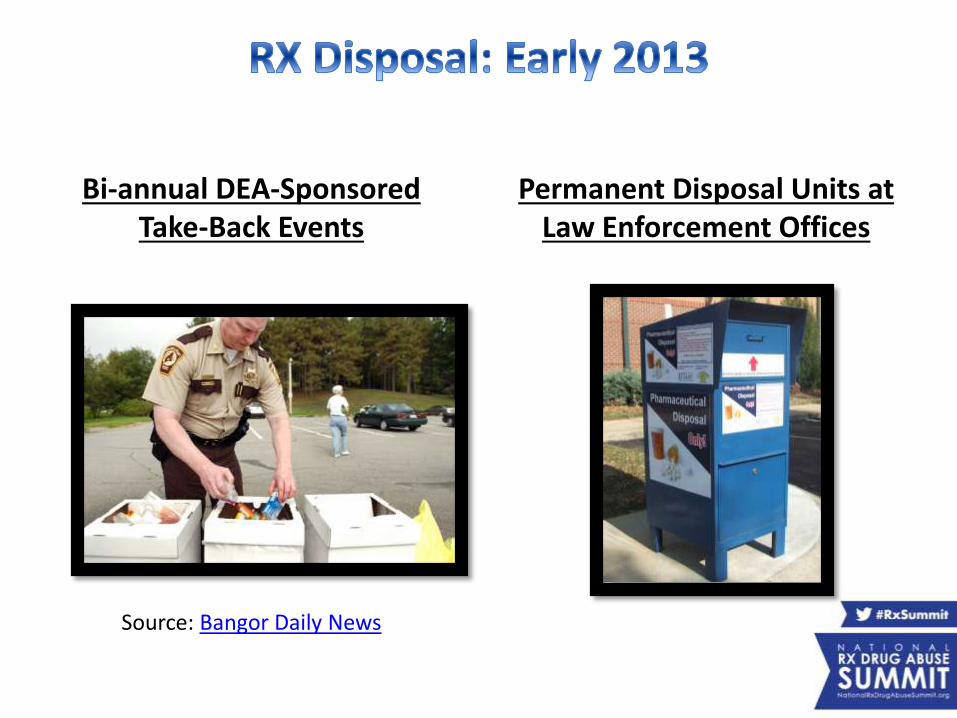
Permanent Disposal Units at Law Enforcement Offices
Bi-annual DEA-Sponsored Take-Back Events
Source: Bangor Daily News

• Minimal published reports on pill count and substance type
Source: http://www.dea.gov/docs/results_final.pdf
• Primarily weight-based assessments

Save Our Kids Coalition
Wake Forest School of Medicine
LifeSkills, Inc.
Law Enforcement Agencies
Pharmacists
SparksInitiatives, Inc.

Objectives• To examine the potential impact of RX disposal through the assessment of
collections from DEA-sponsored take-back events and permanent disposal units using a community-based participatory research (CBPR) approach.
• To disseminate our findings with researchers, practitioners, & policy-makers.
Research Questions1) What is disposed at take-back events and in permanent disposal units (i.e.,
controlled prescription medications, non-controlled medications, trash, etc.)?
2) How many & what type of controlled prescription medications are collected?
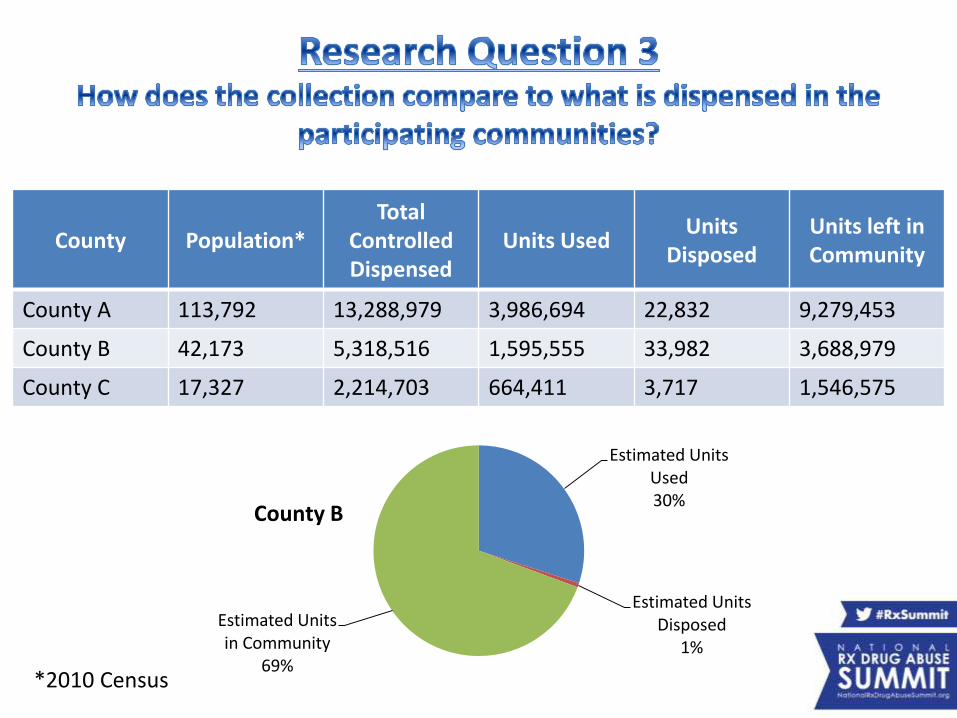
3) How does the collection compare to what is dispensed in the participating communities?
4) Is the assessment protocol feasible?

10/26/2013 4/26/20146/13/2014
-6/20/2014
8/15/2014 -
8/22/201410/25/2014
11/14/2014 -
11/21/2014
2/20/15–
2/27/15
Take Back Event
Take Back Event
Permanent Disposal
Permanent Disposal
Take Back Event
Permanent Disposal
Permanent Disposal

DEA Take-back Events Permanent Disposal Units
Number Conducted 3 4
Number of LEAs ParticipatedEvent/Permanent Collection #1Event/Permanent Collection #2Event/Permanent Collection #3Event/Permanent Collection #4
2-32 agencies3 agencies3 agenciesNA
4 – 77 agencies6 agencies4 agencies6 agencies
Timeframe 1 Day from 10am-2pm 1 Week
LocationAgency #1Agency #2Agency #3
Police DepartmentHigh School Parking LotSheriff’s Department
Law Enforcement Offices
Procedure • Events were advertised by law enforcement agencies hosting the events.
• Boxes were emptied immediately prior to the start of the collection.
• Medications were collected after 1 week.
• No additional advertising the week of collection.

• Collection assessment occurred in the office of the local Drug Task Force (DTF). – Collections were transported to assessment location by Law
Enforcement Officers of the home collection.
• Assessment was conducted by Eric Gregory (Assessment Supervisor), Law Enforcement Officers, Pharmacist, three Pharmacy Technicians, and two additional assistants.
• Collection assessment was divided into four stages:1) Pre-Sort
2) Sort & Drug Identification
3) Measurement
4) Analysis

• Collections were pre-sorted:– First stage of trash reduction
– Safety inspection using magnet & Turtle Skin LE Search Gloves (28 ga)
– Handling of bottles, blister packs, and loose pills


• Sort collection into controlled, non-controlled, and trash– Removed and identified pills from bottles or packs
– Identified loose pills
– Used color-coded bins to separate controlled, non-controlled, & trash
• Controlled prescription medications were identified and recorded by generic name.


• Trash and non-controlled substances were measured by weight (g/kg)
• Controlled pills measured by weight (g/kg) and counted by pill
• Controlled liquids measured by weight (kg) and volume (ml)
• Controlled patches measured by weight (g/kg) and counted by patch
• Two scales: Royal DG200 and Acculab VI-1200
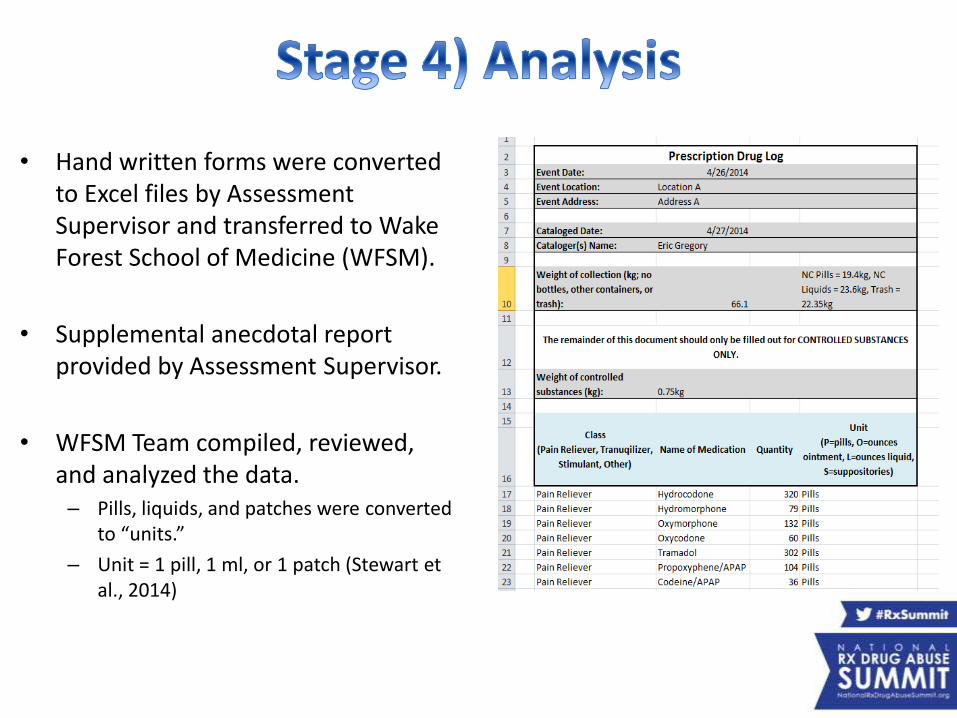
• Hand written forms were converted to Excel files by Assessment Supervisor and transferred to Wake Forest School of Medicine (WFSM).
• Supplemental anecdotal report provided by Assessment Supervisor.
• WFSM Team compiled, reviewed, and analyzed the data.– Pills, liquids, and patches were converted
to “units.”
– Unit = 1 pill, 1 ml, or 1 patch (Stewart et al., 2014)


263
10180
38
94
35
80
266 14 0
0
50
100
150
200
250
300
Take Back Events (n=3) Permanent Disposal (n=3)
We
igh
t (k
g)
Overall Weight
Total
Trash
Non-controlled pills
Non-controlled liquids
Controlled pills
Controlled liquids
% of Total Weight Take Back & Permanent
Trash = 30%; 38%Non-controlled = 66%; 61%
Controlled = 4%; 1%

18069
3435
9554
2418
4784
8483065
92130 50536
280
5000
10000
15000
20000
Take Back Events (n=3) Permanent Disposal (n=4)
Overall Units of Controlled RX Medication Collected
Total Pain Reliever Tranquilizer Stimulant Muscle Relaxer Other
Nu
mb
er
of
un
its

988
4857
959
45
3845
425106
2006
953
0 0 096
981315
0
1000
2000
3000
4000
5000
10/26/2013 (n=2) 4/26/2014 (n=3) 9/27/2014 (n=3)
Nu
mb
er
of
un
its
All Agencies (range; n=2-3)
988
2068
659
45
490
47106 176 00 0 096 346 254
0
1000
2000
3000
4000
5000
10/26/2013 (n=2) 4/26/2014 (n=2) 9/27/2014 (n=2)
Nu
mb
er
of
un
its
Restricted to agencies that participated at all events (n=2)

491
703
141
714
235
843
526
0 0 25 673 0 0
470 0 0 28
0
200
400
600
800
June '14 (n=4) Aug. '14 (n=4) Nov. '14 (n=4) Feb. '15 (n=4)
Nu
mb
er
of
Un
its
Restricted to agencies that participated in all assessments (n=4)
491
737
141
764
235
840
526
0 0 25 673 0 0
470 0 28
0
200
400
600
800
June '14 (n=7) Aug. '14 (n=6) Nov. '14 (n=4) Feb. '15 (n=6)
Nu
mb
er
of
Un
its
All Agencies (range; n=4-7)

• Total Controlled Units Dispensed• Units dispensed in 2013 based on KASPER reports.
• Units Used• Estimate based on 30% of “Total Controlled Units Dispensed”
(Stewart et al., 2014).
• Units Disposed: • Estimate based on an average of the four permanent collections
multiplied by 52. • Estimate based on an average of the three DEA Sponsored Take-
Back Events multiplied by 2.
• Units left in Community• Total Dispensed – (Used + Disposed)
County Population*Total
Controlled Dispensed
Units UsedUnits
DisposedUnits left in Community
County A 113,792 13,288,979 3,986,694 22,832 9,279,453
County B 42,173 5,318,516 1,595,555 33,982 3,688,979
County C 17,327 2,214,703 664,411 3,717 1,546,575
Estimated Units Used30%
Estimated Units Disposed
1%
Estimated Units in Community
69%
County B
*2010 Census

• All collections were weighed, sorted, and categorized within one day.
• Assessments were conducted ~ 9 individuals (Assessment Supervisor, Law Enforcement Officers, Pharmacist, three Pharmacy Technicians, and two additional assistants).
• The protocol was adapted during the first two assessments based on lessons learned.
• While assessment of a limited number of collections over the year is feasible, assessment of collections over an entire year is likely not feasible or efficient.
• It may be difficult to get agencies who collected substances to participate in all assessments.– Two out of seven agencies participated in every collection.

• RQ 1: What is disposed (based on weight)?
– ~3% Controlled Substances, ~65% Non-Controlled Substances, ~32% Trash
• RQ 2: How many controlled RX medications were collected?
– 21,504 units were collected from 3 take-back events (18,069) and 4 week-long permanent disposal collections (3,435).
– Pain relievers followed by tranquilizers were the most common controlled substances.
• RQ 3: How does the collection compare to what is dispensed in the participating communities?
– Disposed controlled prescription medications accounted for ~1% of all dispensed into the community.
• RQ 4: Is the assessment protocol feasible?
– Yes, but maybe not on an annual or more frequent basis.

• What is the denominator (# of doses dispensed)?
– Availability of information
– Timeframe
– Location
• Limited information about how many of dispensed medications are actually used (as intended).
• Variability in context of communities and disposal opportunities.
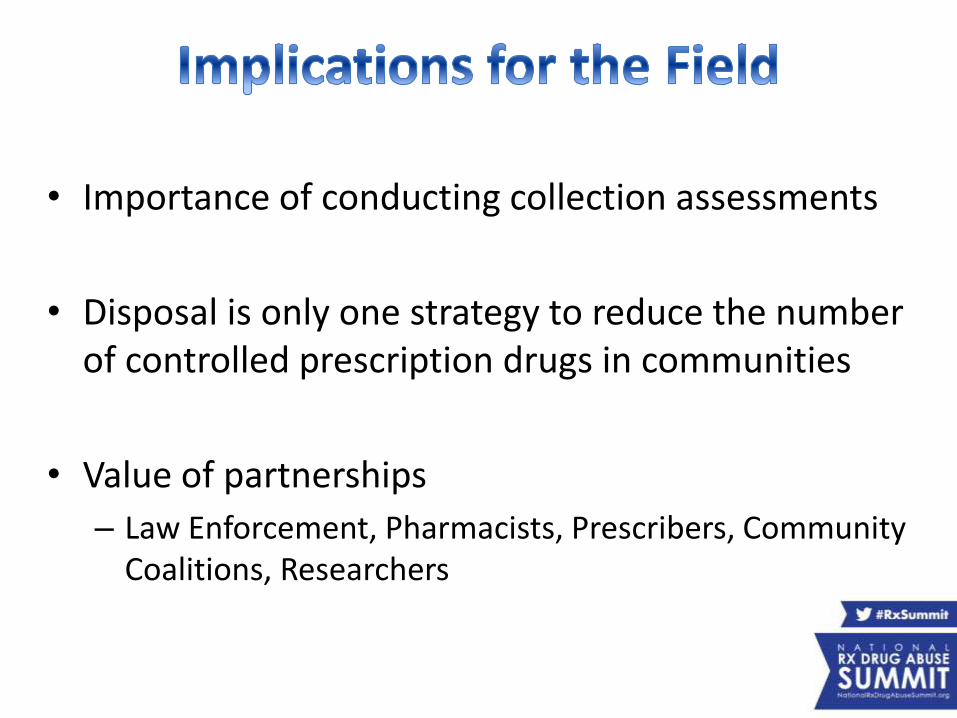
• Importance of conducting collection assessments
• Disposal is only one strategy to reduce the number of controlled prescription drugs in communities
• Value of partnerships
– Law Enforcement, Pharmacists, Prescribers, Community Coalitions, Researchers

• Improve disposal efforts– *New policy* Authorized collectors - manufacturers, distributors,
reverse distributors, narcotic treatment programs, hospitals/clinics with an on-site pharmacy, and retail pharmacies - can now register to participate in Rx collection
– Engage in local partnerships
– Advertise disposal locations & educational information on medicine bottles, materials, and in the pharmacy
• National and long-term assessments of disposal efforts
Gray, J. A., & Hagemeier, N. E. (2012). Prescription drug abuse and DEA-sanctioned drug take-back events: characteristics and outcomes in rural Appalachia. Archives of internal medicine, 172(15), 1186-1187.
Herring, M. E., Shah, S. K., Shah, S. K., & Gupta, A. K. (2008). Current regulations and modest proposals regarding disposal of unused opioids and other controlled substances. JAOA: Journal of the American Osteopathic Association, 108(7), 338-343.
Phillips, J. (2013). Prescription drug abuse: Problem, policies, and implications. Nursing outlook, 61(2), 78–84. doi:10.1016/j.outlook.2012.06.009.
Shrank, W. H. (2011). Our Bulging Medicine Cabinets — The Other Side of Medication Non-adherence. New England Journal of Medicine, 364(17), 1591–1593. doi:10.1056/NEJMp1011624.
Stewart, H., Malinowski, A., Ochs, L., Jaramillo, J., McCall III, K., & Sullivan, M. (2015). Inside Maine’s Medicine Cabinet:Findings From the Drug Enforcement Administration's Medication Take-Back Events. American journal of public health, 105(1), e65-e71.
Office of National Drug Control Policy. (2011). Prescription Drug Abuse. Retrieved April 5, 2013, from http://www.whitehouse.gov/ondcp/prescription-drug-abuse
U.S. Environmental Protection Agency. (2010). Pharmaceutical and Personal Care Products (PPCPs). Retrieved October 29, 2013, from http://www.epa.gov/ppcp/basic2.html

• Joy White, Lifeskills Regional Prevention Center
• Michael Sparks, M.A., SparksInitiatives, Inc.
• Mark Wolfson, PhD, Wake Forest School of Medicine
• Funding: Partnerships for Success II, Substance Abuse and Mental Health Services Administration
• Tommy Loving, Director, Warren County Drug Task Force
• Tod Young, Detective, Warren County Drug Task Force
• Amy Stillwell, The Save Our Kids Coalition
• Lisa Mason, The Save Our Kids Coalition
• Missy Greathouse, Pharmacist
• Alan Hudson, Pharmacy Tech
• Cindy Whitmore, Pharmacy Tech
• Jana Young, Pharmacy Tech
• Latasha Bunton, Pharmacy Tech
Lessons Learned from a Rx Disposal Program in NE Tennessee
April 8, 2015
Jeffrey A Gray, PharmD, CDEAssociate Professor, ETSU College of Pharmacy
Adjunct Professor, ETSU College of Public Health

Disclosure Statement of
Unapproved/Investigative Use
I, Jeff Gray,
DO NOT have a financial interest/arrangement or affiliation with one or more organizations that
could be perceived as a real or apparent conflict of interest in the context of the subject of this
presentation.
DO NOT anticipate discussing the unapproved/investigative use of a commercial
product/device during this activity or presentation.
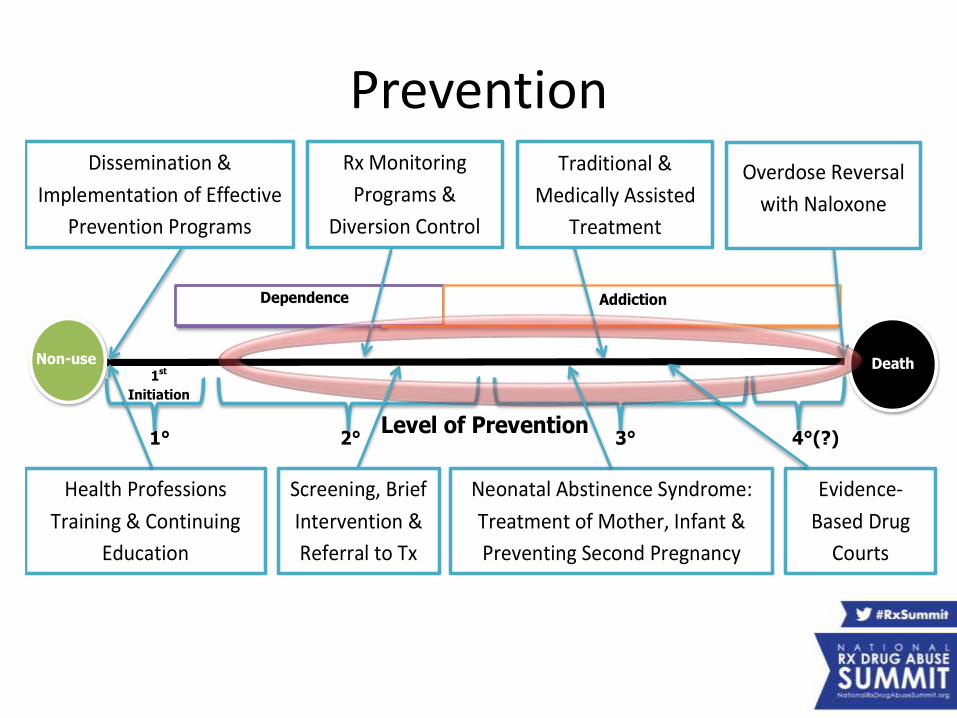
Prevention
1° 2° 3° 4°(?)
Non-use Death
RxMonitoring
Programs&
DiversionControl
Dependence Addiction
1st
Initiation
Traditional&
MedicallyAssisted
Treatment
Dissemination&
ImplementationofEffective
PreventionPrograms
OverdoseReversal
withNaloxone
Level of Prevention
NeonatalAbstinenceSyndrome:
TreatmentofMother,Infant&
PreventingSecondPregnancy
Evidence-
BasedDrug
Courts
HealthProfessions
Training&Continuing
Education
Screening,Brief
Intervention&
ReferraltoTx

Study Objectives
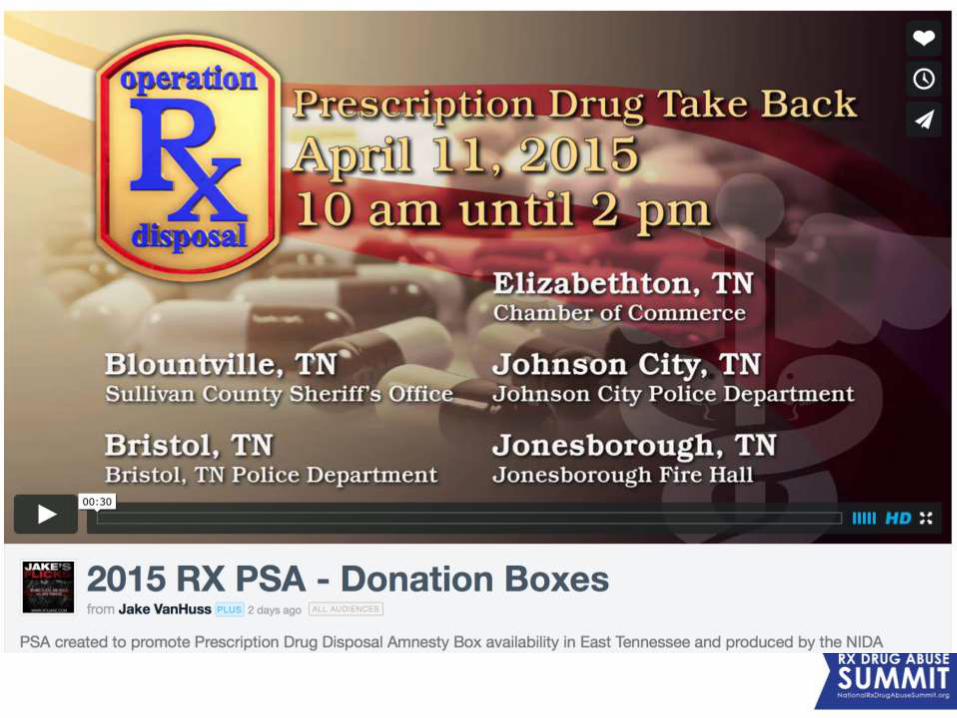
• List quantitative metrics for reoccurring (Live Take Back) and consistently available (Amnesty Box) donation options
• Describe donor tendencies related to medications storage and destruction
• Explain population density variables which influence donation behaviors
• Identify characteristics of a successful public awareness campaign
Methodology
• Active partnership with the DEA and local law enforcement
• Onsite donor survey (LTB only), sorting, identification, label interpretation, counting, and recording
• Research sites– 5 Live Take Back Sites over 18 months
– 5 + 3 Amnesty Box Sites over 30 months
• Awareness campaign (TV, print)

Data Collected
• Total donation weight (lbs)• Total Controlled Substance (CS) weight (lbs)• CS Active ingredient (C II- CV)• Therapeutic category (Opioids, Stimulants, etc)• Quantity of CS in dosage units
– Tablet, capsule, film, lozenge, nasal spray– Milliliter, patch, syringe, suppository, IV drip
• Date of dispensing• Donation location• Municipality population as 2012


Live Take Back Collections
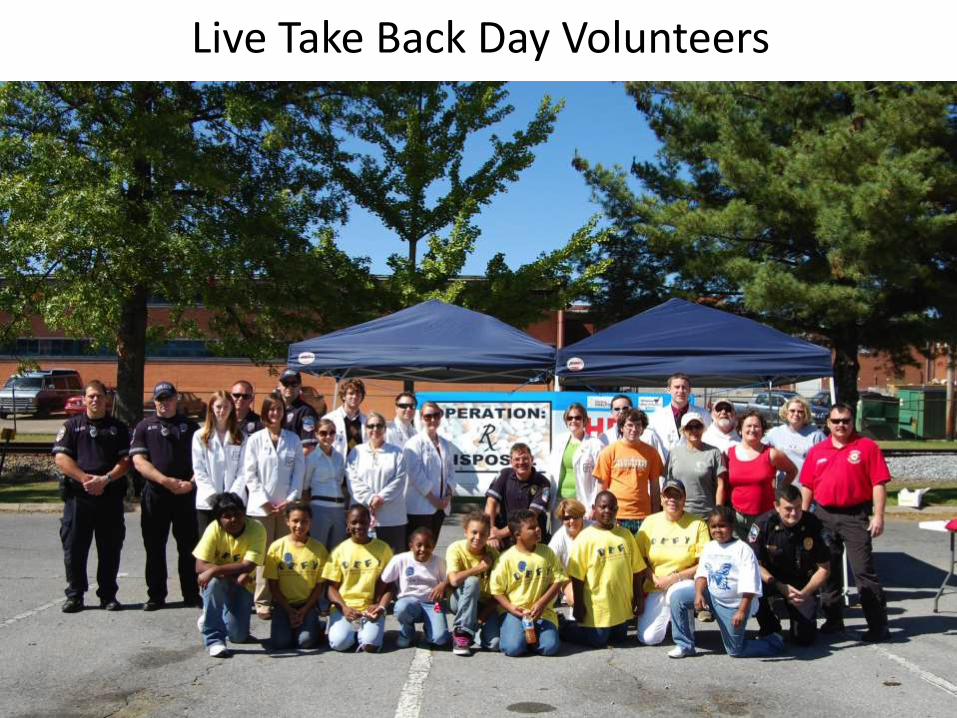
Live Take Back Day Volunteers

Controlled Substances Collected
25859
6585
436
3018
Units of Controlled Substances Collected, by Therapeutic Class
Opioids Sedative/ Hypnotics Stimulants Miscellaneous

Donations by Weight
0
50
100
150
200
250
300
350
400
450
500
Blountville Bristol Elizabethton Johnson City Jonesborough
213.5
497
250.5
301.2
388.5
14 18 10.5 16.3 23
Total Pounds of Rx and Controlled Substances Collected, by Municipality
Total Rx CS

Donations by CS Units
0 2000 4000 6000 8000 10000 12000
Blountville
Bristol
Elizabethton
Johnson City
Jonesborogh
Units Collected
Units of Controlled Substances Collected, by Municipality

Dispensing to Donation Time
56.72
67.36
59.27
42.39
0.00
10.00
20.00
30.00
40.00
50.00
60.00
70.00
80.00
Sedative/ Hypnotics Miscellaneous Opioids Stimulants
Mea
n N
um
ber
of
Mo
nth
s
Average Number of Months Between Dispensing and Donation, By Therapeutic Class
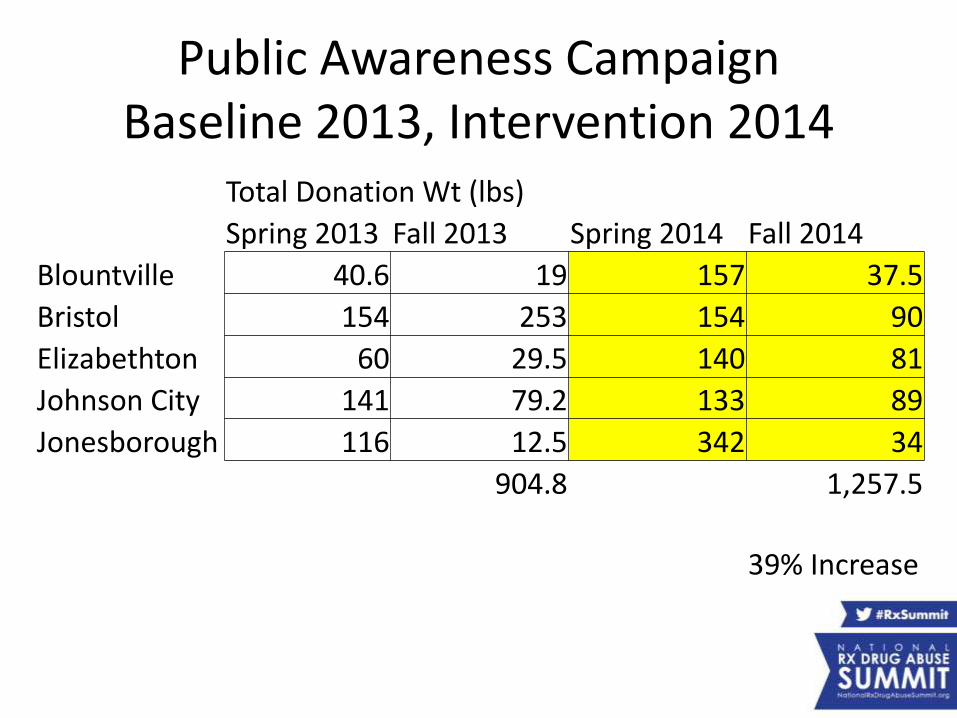
Public Awareness CampaignBaseline 2013, Intervention 2014
Total Donation Wt (lbs)
Spring 2013 Fall 2013 Spring 2014 Fall 2014
Blountville 40.6 19 157 37.5
Bristol 154 253 154 90
Elizabethton 60 29.5 140 81
Johnson City 141 79.2 133 89
Jonesborough 116 12.5 342 34
904.8 1,257.5
39% Increase

Amnesty Box Collections

Permanent Drug Disposal Boxes

Controlled Substances Collected
97560
28031
2481
7102
Total Controlled Substance Units Collected by Drug Class
Opioids Sedative Hypnotics Stimulants Misc.

Donations by Weight
0
500
1000
1500
2000
2500
966
313.5518
1380
444.5
2184
82261.5
58.5 11 22 55 31.596
4 21.5
Po
un
ds
Total Pounds of Rx and Controlled Substances by Collection Site
Total Rx Controlled Substances
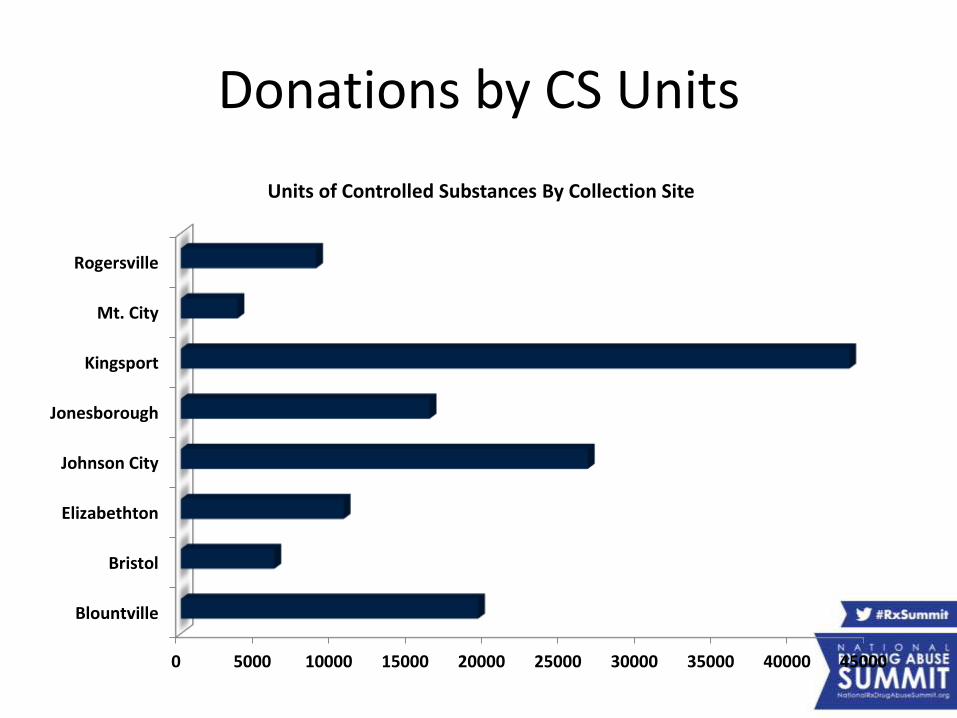
Donations by CS Units
0 5000 10000 15000 20000 25000 30000 35000 40000 45000
Blountville
Bristol
Elizabethton
Johnson City
Jonesborough
Kingsport
Mt. City
Rogersville
Units of Controlled Substances By Collection Site

Dispensing to Donation Time
53.93
43.3241.52
50.00
0
10
20
30
40
50
60
Opioids Sedative Hypnotics Stimulants Misc.
Mean Number of Months Between Dispensing and Donation
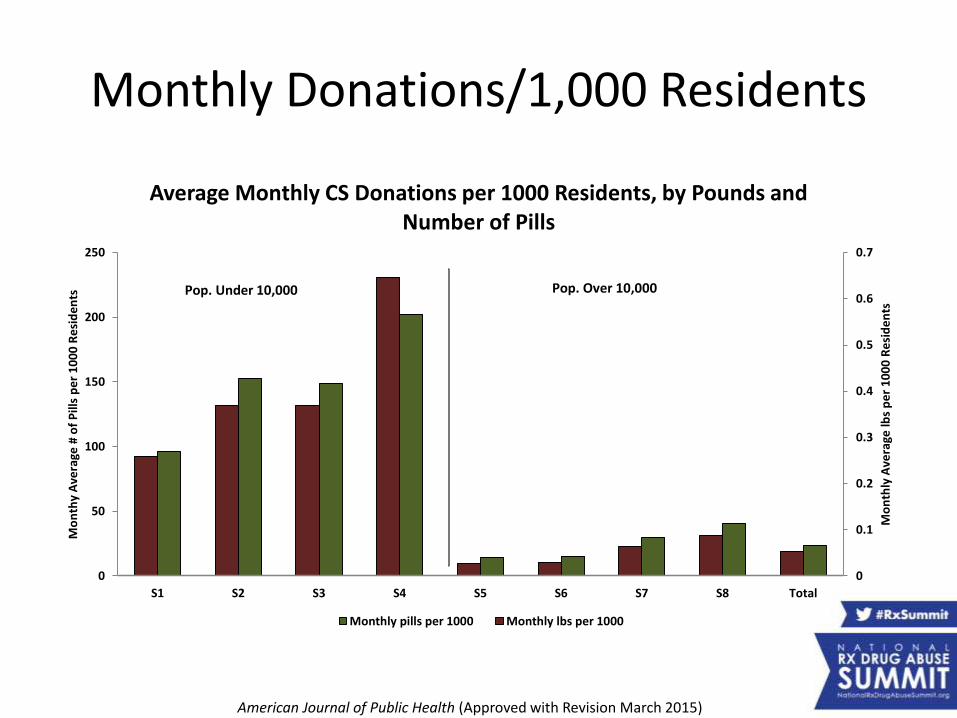
Monthly Donations/1,000 Residents
0
0.1
0.2
0.3
0.4
0.5
0.6
0.7
0
50
100
150
200
250
S1 S2 S3 S4 S5 S6 S7 S8 Total
Mo
nth
ly A
vera
ge lb
s p
er
10
00
Re
sid
en
ts
Mo
nth
y A
vera
ge #
of
Pill
s p
er
10
00
Re
sid
en
ts
Average Monthly CS Donations per 1000 Residents, by Pounds and Number of Pills
Monthly pills per 1000 Monthly lbs per 1000
Pop. Over 10,000Pop. Under 10,000
American Journal of Public Health (Approved with Revision March 2015)

Combined
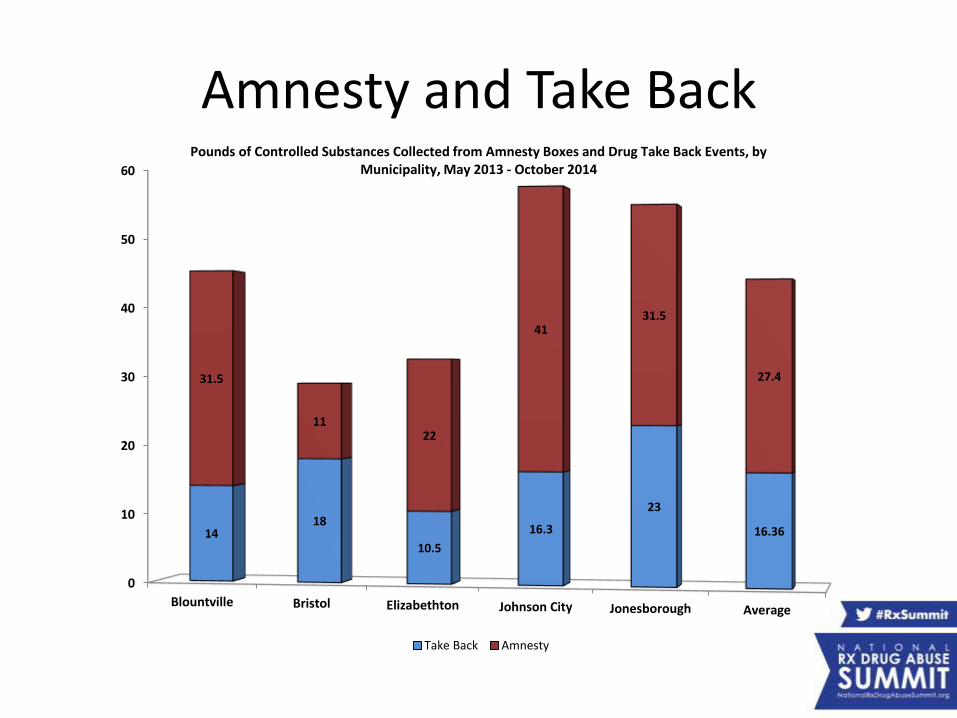
Amnesty and Take Back
0
10
20
30
40
50
60
Blountville Bristol Elizabethton Johnson City Jonesborough Average
1418
10.5
16.3
23
16.36
31.5
1122
4131.5
27.4
Pounds of Controlled Substances Collected from Amnesty Boxes and Drug Take Back Events, by Municipality, May 2013 - October 2014
Take Back Amnesty

0.0%
1.0%
2.0%
3.0%
4.0%
5.0%
6.0%
7.0%
8.0%
Percent Controlled Substance for Amnesty and Take Back Collections, May 2013-October 2014
Take Back
Amnesty
0
10
20
30
40
50
Pounds of Controlled Substances for Amnesty and Take Back Collections, May 2013-October 2014
Take Back
Amnesty
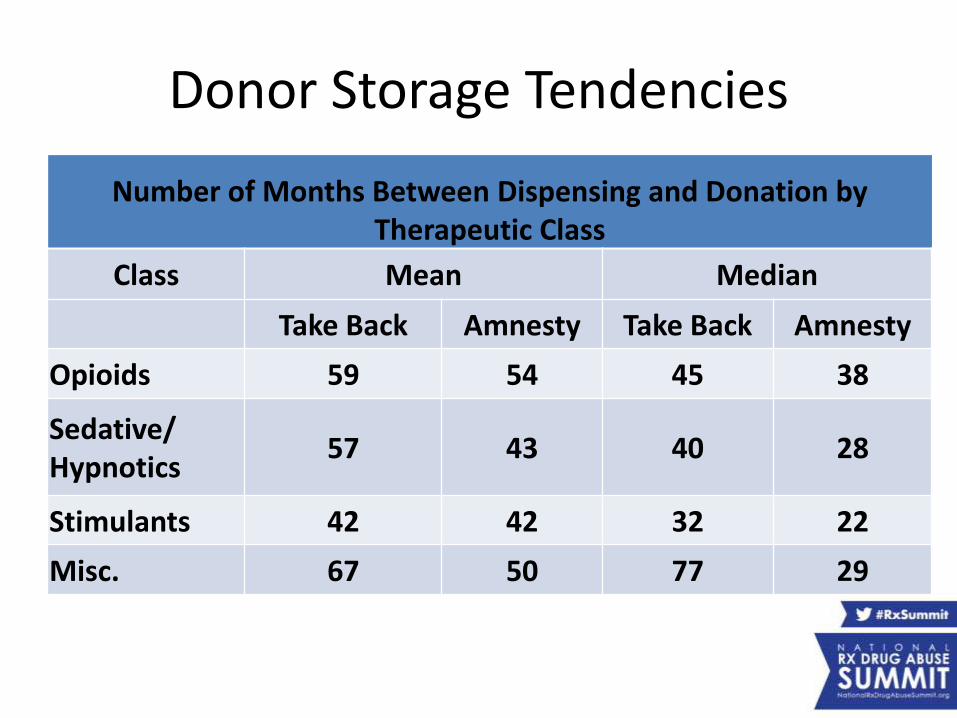
Donor Storage Tendencies
Number of Months Between Dispensing and Donation by Therapeutic Class
Class Mean Median
Take Back Amnesty Take Back Amnesty
Opioids 59 54 45 38
Sedative/ Hypnotics
57 43 40 28
Stimulants 42 42 32 22
Misc. 67 50 77 29

Conclusions
• Amnesty Box and traditional Take Back options are effective primary prevention mechanisms
• Amnesty Box donations outpace Live Take Back donations in the same municipalities (total & CS)
• CS donation percentage by weight is similar between the two options
• The number of CS dosage units collected is higher per capita for Amnesty Box donors
• Time from dispensing to donation is approximately six months earlier for Amnesty Box donations
Diversity-promoting Institutions Drug Abuse Research Program Team
NIH/NIDA R24 – Sponsored Research 2013-18

Pharmacy Track:Lessons Learned fromRx Disposal Programs
Presenters:
• Kathleen Egan, MS, Research Associate, Department of Social Science & Health Policy, Wake Forest School of Medicine
• Eric Gregory, EdD, CPS, Executive Director, Save Our Kids Coalition
• Jeffrey Gray, PharmD, RPh, Associate Professor, GattonCollege of Pharmacy, & Adjunct Professor, College of Public Health, East Tennessee State University
Moderator: Dan Smoot, Director of Drug Prevention & Education, Appalachia High Intensity Drug Trafficking Area (HIDTA)