on March 7, 2018 Compressivestrengthafter...
27
rsta.royalsocietypublishing.org Research Cite this article: Arora H, Kelly M, Worley A, Del Linz P, Fergusson A, Hooper PA, Dear JP. 2014 Compressive strength after blast of sandwich composite materials. Phil. Trans. R. Soc. A 372: 20130212. http://dx.doi.org/10.1098/rsta.2013.0212 One contribution of 12 to a Theme Issue ‘Shock and blast: celebrating the centenary of Bertram Hopkinson’s seminal paper of 1914 (Part 1)’. Subject Areas: mechanical engineering, structural engineering Keywords: blast, composites, sandwich materials, compression after impact Author for correspondence: H. Arora e-mail: [email protected] Compressive strength after blast of sandwich composite materials H. Arora 1 , M. Kelly 1 , A. Worley 1 , P. Del Linz 1 , A. Fergusson 2 , P. A. Hooper 1 and J. P. Dear 1 1 Department of Mechanical Engineering, Imperial College London, London SW7 2AZ, UK 2 FAC Technology, Canterbury Court, 1–3 Brixton Road, London SW9 6DE, UK Composite sandwich materials have yet to be widely adopted in the construction of naval vessels despite their excellent strength-to-weight ratio and low radar return. One barrier to their wider use is our limited understanding of their performance when subjected to air blast. This paper focuses on this problem and specifically the strength remaining after damage caused during an explosion. Carbon-fibre-reinforced polymer (CFRP) composite skins on a styrene– acrylonitrile (SAN) polymer closed-cell foam core are the primary composite system evaluated. Glass- fibre-reinforced polymer (GFRP) composite skins were also included for comparison in a comparable sandwich configuration. Full-scale blast experiments were conducted, where 1.6 × 1.3 m sized panels were subjected to blast of a Hopkinson–Cranz scaled distance of 3.02 m kg −1/3 , 100 kg TNT equivalent at a stand-off distance of 14 m. This explosive blast represents a surface blast threat, where the shockwave propagates in air towards the naval vessel. Hopkinson was the first to investigate the characteristics of this explosive air-blast pulse (Hopkinson 1948 Proc. R. Soc. Lond. A 89, 411–413 (doi:10.1098/rspa.1914.0008)). Further analysis is provided on the performance of the CFRP sandwich panel relative to the GFRP sandwich panel when subjected to blast loading through use of high-speed speckle strain mapping. After the blast events, the residual compressive load- bearing capacity is investigated experimentally, using appropriate loading conditions that an in-service vessel may have to sustain. Residual strength testing is 2014 The Authors. Published by the Royal Society under the terms of the Creative Commons Attribution License http://creativecommons.org/licenses/ by/3.0/, which permits unrestricted use, provided the original author and source are credited. on June 4, 2018 http://rsta.royalsocietypublishing.org/ Downloaded from
Transcript of on March 7, 2018 Compressivestrengthafter...

rsta.royalsocietypublishing.org
ResearchCite this article: Arora H, Kelly M, Worley A,Del Linz P, Fergusson A, Hooper PA, Dear JP.2014 Compressive strength after blast ofsandwich composite materials. Phil. Trans. R.Soc. A 372: 20130212.http://dx.doi.org/10.1098/rsta.2013.0212
One contribution of 12 to a Theme Issue ‘Shockand blast: celebrating the centenary ofBertram Hopkinson’s seminal paperof 1914 (Part 1)’.
Subject Areas:mechanical engineering, structuralengineering
Keywords:blast, composites, sandwich materials,compression after impact
Author for correspondence:H. Arorae-mail: [email protected]
Compressive strength afterblast of sandwich compositematerialsH. Arora1, M. Kelly1, A. Worley1, P. Del Linz1,
A. Fergusson2, P. A. Hooper1 and J. P. Dear1
1Department of Mechanical Engineering, Imperial College London,London SW7 2AZ, UK2FAC Technology, Canterbury Court, 1–3 Brixton Road, LondonSW9 6DE, UK
Composite sandwich materials have yet to be widelyadopted in the construction of naval vessels despitetheir excellent strength-to-weight ratio and low radarreturn. One barrier to their wider use is our limitedunderstanding of their performance when subjectedto air blast. This paper focuses on this problemand specifically the strength remaining after damagecaused during an explosion. Carbon-fibre-reinforcedpolymer (CFRP) composite skins on a styrene–acrylonitrile (SAN) polymer closed-cell foam coreare the primary composite system evaluated. Glass-fibre-reinforced polymer (GFRP) composite skinswere also included for comparison in a comparablesandwich configuration. Full-scale blast experimentswere conducted, where 1.6 × 1.3 m sized panels weresubjected to blast of a Hopkinson–Cranz scaleddistance of 3.02 m kg−1/3, 100 kg TNT equivalent ata stand-off distance of 14 m. This explosive blastrepresents a surface blast threat, where the shockwavepropagates in air towards the naval vessel. Hopkinsonwas the first to investigate the characteristics of thisexplosive air-blast pulse (Hopkinson 1948 Proc. R.Soc. Lond. A 89, 411–413 (doi:10.1098/rspa.1914.0008)).Further analysis is provided on the performanceof the CFRP sandwich panel relative to the GFRPsandwich panel when subjected to blast loadingthrough use of high-speed speckle strain mapping.After the blast events, the residual compressive load-bearing capacity is investigated experimentally, usingappropriate loading conditions that an in-servicevessel may have to sustain. Residual strength testing is
2014 The Authors. Published by the Royal Society under the terms of theCreative Commons Attribution License http://creativecommons.org/licenses/by/3.0/, which permits unrestricted use, provided the original author andsource are credited.
on June 4, 2018http://rsta.royalsocietypublishing.org/Downloaded from

2
rsta.royalsocietypublishing.orgPhil.Trans.R.Soc.A372:20130212
.........................................................
well established for post-impact ballistic assessment, but there has been less researchperformed on the residual strength of sandwich composites after blast.
1. IntroductionThe recent advances in composite manufacturing have occurred predominantly in the aerospace,marine, automotive and related industries. Formerly, naval vessels were constructed from steel,but composites provide a significant weight reduction and increase in stealth properties whilemaintaining high strength properties. Glass-fibre-reinforced polymer (GFRP) and carbon-fibre-reinforced polymer (CFRP) composites are quickly finding application in the construction of navalstructures as well as new polymer–fibre hybrids. Composites behave in different ways to steels,which have predominantly isotropic properties. This leads to a need for new design protocolsto be developed for the safety of naval craft. These materials can be subjected to increasinglydemanding and varied conditions during service. In a military context, blast loads representthe most extreme threat to a structure. The research presented in this paper focuses on air-blastloading of sandwich composite panels.
There have been numerous investigations into blast loading of structures using open-aircharges and underwater charges since Hopkinson’s seminal paper [1]. Several studies haveinvestigated dynamic deformations due to explosive blast loading on plates. Neuberger et al. [2,3]and Menkes & Opat [4] highlighted several early studies, which classified the failure modes ofstructures under impulse loading, from large inelastic deformation to tearing and shear failure atthe supports. Neuberger et al. also highlighted various studies investigating the scaling effects forcomparison of similar blast events using different explosive mass or specimen distance to quantifymaterial response. These studies observed the effect of air blast [2] and underwater charges [3]on clamped circular plates and the validity of scaled testing. Several earlier studies have alsoinvestigated the dynamic deformations due to explosive blast loading on plates. Nurick, amongothers, has conducted extensive studies over the years investigating various plate responses toblast loading [5]. For example, the types of failures described by Menkes & Opat [4] have beeninvestigated further by Nurick et al. [6]. In particular, the significant effects of the boundaryconditions for the purpose of predicting tearing in steel plates have been highlighted [7]. Cantwellet al. [8–10] have continued similar experimental investigations and analysis into compositebehaviour under blast conditions. Mouritz [11] has also performed underwater blast testing using30–50 g explosives on air-backed stitched and unstitched composites in order to determine thereduction of delamination from using stitched composites.
Rather than using explosives to generate shocks, shock tubes have been shown to be afavourable alternative used extensively in shock/blast simulation studies. Tekalur et al. [12–14]have experimentally studied the effect of blast loading using shock tubes and controlled explosiontubes loading on E-glass-fibre-based composites and other materials. Arora et al. [15] haveconducted research, in the past, on the blast resistance of GFRP sandwich panels of varyingcore thicknesses. The results showed the strong influence of this parameter on the behaviourof the panels, as their stiffness was significantly higher for thicker cores. Wang et al. [16–18]performed extensive research on air-blast response of stepwise graded density foam cores andincluded the addition of a polyurea layer between the skin and core. The effect of these interfacesreduced air-blast damage, and this was also performed with experiments using a shock tube.Wang & Shukla [19] performed further shock tube testing on composite sandwich panels within-plane compressive loading present during the shockwave loading, in an attempt to replicatethe in-plane loading applied to many sandwich composite vessels in service, such as the hullof a ship.
The research presented in this paper adds to previous research, focusing on full-scale air-blastexperimentation conducted on GFRP and CFRP sandwich composite panels. These panels wereof similar mass per unit area and overall thickness. This provided for a direct comparison between
on June 4, 2018http://rsta.royalsocietypublishing.org/Downloaded from
3
rsta.royalsocietypublishing.orgPhil.Trans.R.Soc.A372:20130212
.........................................................
these two forms of construction. The aim was to evaluate these materials experimentally in termsof blast response and damage sustained, and to assess their residual load-bearing capacity, afeature often overlooked.
The residual edgewise compressive strength of the air-blasted panels was evaluated. Aroraet al. [15,20] performed air blasts of 38.4 kg TNT equivalent against large-scale GFRP sandwichpanels as well as 100 kg TNT equivalent blast tests against GFRP and CFRP sandwich panels [21].Here, strength was evaluated relative to location on the sandwich panel during the blast, i.e.where on a marine vessel or section of a marine vessel is most susceptible to compressive failurein service post-blast. The nature of damage sustained and location of damage were recorded priorto compression, and analysis of these experiments and related numerical studies is the mainfocus. Strength after impact testing is fairly commonplace in composites research in general,particularly in the area of ballistic impacts. However, there is relatively little research on post-blast damage due to blast loading, as blasts are often considered catastrophic. This research, onthe other hand, considers the capability of a naval vessel subjected to blast continuing in limitedservice, maintaining sufficient residual strength and integrity. When a composite sandwich panelis subjected to blast loading, complex damage conditions can be generated throughout the panel,which are difficult to quantify in order to make an estimate of residual strength of the materialfor further use. This research looks at crack distributions in sections of the panel, and relatesthese to the residual strength. Some early research was performed on this by Caprino & Teti [22],where glass-fibre skin–polyvinyl chloride (PVC) core sandwich panels were subjected to impacton a drop tower, and their residual strength determined with tensile testing. Three densities ofcore were tested to determine the effect of core strength on residual strength, and it was foundthat the effect was minimal. It was further concluded that the residual strength of the sandwichpanels was actually dominated by fibre failures during impact, as opposed to delamination, aswas originally suggested.
Bull & Edgren [23] performed residual strength testing on carbon-fibre skin–PVC coresandwich panels, which had been subjected to impact loading on a drop tower. Two impactorshapes were used, a spherical indentor and a pyramid-shaped indentor, in order to create differenttypes of damage in the specimen. Two drop heights were tested, one that would cause minimaldamage, and one that would cause severe damage. These test results were then compared withresidual strength models, and good correlation was determined, within 6% for the sphericalindentor. This model assumes an equivalent circular hole in the panel with cracks emanatingfrom its boundary, with the initial size of the hole determined by C-scans of the initial impactdamage. This model was then further developed by Zenkert and co-workers [24], who assumedclosing cracks developing from a notch and incorporated cohesive laws to predict crack growth.This showed improved correlation with test results.
The edgewise compression tests performed by Zenkert and co-workers [24] caused panelfailure in the facesheet containing the damage from the impactor, as is expected. The actualmode of failure of the panels was rapid growth of the dent left by the impactor into the panel.By using digital image correlation (DIC), these tests were used to verify finite-element analysis(FEA) models, in which damage was already present in the form of a region of already crushedcore material directly below the dent in the front facesheet. With the FEA model set up in thisway, strong agreement was found with experimental results for panel response in edgewisecompression and the onset of dent growth [24]. This approach is similar to that used in thisresearch, in which damage is generated in the FEA geometry from the start, in order to determinethe residual strength with this damage in place. Lacy & Hwang [25] also produced FEA models offacesheet and core damage due to impact. In this model, various radii of reduced tensile moduluswere incorporated into the facesheet around the point of indentation to account for the reductionin stiffness caused by damage. These properties and the severity of indentation were estimatedfrom non-destructive inspection, such as C-scans. Similarly, a separate section was introduceddirectly beneath the indented facesheet to account for the reduction in stiffness of the honeycombcore. In this study, it was found that the residual strengths predicted using FEA were significantlyless than those found experimentally, but that failure modes were consistent.
on June 4, 2018http://rsta.royalsocietypublishing.org/Downloaded from

4
rsta.royalsocietypublishing.orgPhil.Trans.R.Soc.A372:20130212
.........................................................
0
0.5
1.5
1.0
2.5
2.0
3.5
3.0
4.0
4.5
5 40353025impact energy (J)
× edgewisecompression
four-pointbending
ultim
ate
edge
wis
e co
mpr
essi
on s
tres
s (M
Pa)
ultim
ate
bend
ing
forc
e (k
N)
201510 450
40
80
120
160
200
Figure 1. Impact energy to cause inherent damage versus stress to cause failure in edgewise compression, and force to causefailure in four-point bending. Adapted from reference [28]. (Online version in colour.)
Compression after impact testing has also been carried out on carbon-fibre facesheets onan aluminium honeycomb core by Davies et al. [26] and, while honeycomb cores differ greatlyfrom the polymeric foam cores studied here, there is some merit in comparing residual strengthpredictions and test methods. The impact tests performed on these panels used a 20 mm flatindentor on a drop tower and two impact energies. Two types of panel lay-ups were tested tocause top-face and local core damage in half of the panels and debonding of the back face and thecore in the others. These impacted sandwich panels showed a 35% reduction in strength for a thincore with back-face delamination, and a 68% reduction with a thick core. These figures are 31%and 18%, respectively, for front-face damage and core crushing.
Xie et al. [27] also performed tests on carbon-fibre facesheets with an aluminium honeycombcore, this time looking only at barely visible damage. A drop tower was used to create mildindentation with ply delamination and core crushing, and then FEA models were created withdamage present, to be validated using edgewise compression testing. The delamination of theskin and core was already present in the model, and this was achieved using point-to-surfacecontact elements. The FEA incorporated routines to simulate in more detail core crushing andthe nonlinear effect of the core stiffness during displacement. Very good correlation was foundwith experimental results and modes of failure with core crushing present, whereas there washigh deviation at higher strains without core crushing present. Shipsha et al. [28] investigated theeffect of impact on a panel by a spherical indentor, and on a beam by a cylindrical impactor. Itwas found that, in both cases, a cavity formed underneath the skin in the core where the twohad completely separated, and core crushing occurred around this zone. The materials used werepolymethacrylimide foam cores and glass-fibre skins. In these tests, drop tower energies wereused that would cause negligible damage in the front facesheet. This was found to produce areduction in stiffness of less than 5%. Post-impact testing of these sandwich panels was in the formof edgewise compression and four-point bending. In the bending tests, it was found that failuretook place suddenly at the periphery of the local core damage, with no steady crack propagationbeforehand. The variation of force to cause failure in the four-point bending tests, and stress tofailure in edgewise compression tests, versus the impact energy used to create initial damage areshown in figure 1.
Various approaches have been addressed to develop numerical models for the prediction offailure stress, a topic that is covered in this paper. However, an inherent failure criterion that is
on June 4, 2018http://rsta.royalsocietypublishing.org/Downloaded from

5
rsta.royalsocietypublishing.orgPhil.Trans.R.Soc.A372:20130212
.........................................................
Table 1. Material properties of the GFRP and CFRP sandwich panel constituent elements [29].
material property QE1200 RC245T RC380T M130. . . . . . . . . . . . . . . . . . . . . . . . . . . . . . . . . . . . . . . . . . . . . . . . . . . . . . . . . . . . . . . . . . . . . . . . . . . . . . . . . . . . . . . . . . . . . . . . . . . . . . . . . . . . . . . . . . . . . . . . . . . . . . . . . . . . . . . . . . . . . . . . . . . . . . . . . . . . . . . . . . . . . . . . . . . . . . . . . . . . . . . . . . . . . . . . . . . . . . . . . .
density (kg m−3) 1750 1393 1393 140. . . . . . . . . . . . . . . . . . . . . . . . . . . . . . . . . . . . . . . . . . . . . . . . . . . . . . . . . . . . . . . . . . . . . . . . . . . . . . . . . . . . . . . . . . . . . . . . . . . . . . . . . . . . . . . . . . . . . . . . . . . . . . . . . . . . . . . . . . . . . . . . . . . . . . . . . . . . . . . . . . . . . . . . . . . . . . . . . . . . . . . . . . . . . . . . . . . . . . . . . .
tensile modulus (GPa) 17 50 11 0.18. . . . . . . . . . . . . . . . . . . . . . . . . . . . . . . . . . . . . . . . . . . . . . . . . . . . . . . . . . . . . . . . . . . . . . . . . . . . . . . . . . . . . . . . . . . . . . . . . . . . . . . . . . . . . . . . . . . . . . . . . . . . . . . . . . . . . . . . . . . . . . . . . . . . . . . . . . . . . . . . . . . . . . . . . . . . . . . . . . . . . . . . . . . . . . . . . . . . . . . . . .
compressive modulus (GPa) — — — 0.17. . . . . . . . . . . . . . . . . . . . . . . . . . . . . . . . . . . . . . . . . . . . . . . . . . . . . . . . . . . . . . . . . . . . . . . . . . . . . . . . . . . . . . . . . . . . . . . . . . . . . . . . . . . . . . . . . . . . . . . . . . . . . . . . . . . . . . . . . . . . . . . . . . . . . . . . . . . . . . . . . . . . . . . . . . . . . . . . . . . . . . . . . . . . . . . . . . . . . . . . . .
tensile strength (MPa) 260 471 — 2.85. . . . . . . . . . . . . . . . . . . . . . . . . . . . . . . . . . . . . . . . . . . . . . . . . . . . . . . . . . . . . . . . . . . . . . . . . . . . . . . . . . . . . . . . . . . . . . . . . . . . . . . . . . . . . . . . . . . . . . . . . . . . . . . . . . . . . . . . . . . . . . . . . . . . . . . . . . . . . . . . . . . . . . . . . . . . . . . . . . . . . . . . . . . . . . . . . . . . . . . . . .
compressive strength (MPa) 200 316 — 2.31. . . . . . . . . . . . . . . . . . . . . . . . . . . . . . . . . . . . . . . . . . . . . . . . . . . . . . . . . . . . . . . . . . . . . . . . . . . . . . . . . . . . . . . . . . . . . . . . . . . . . . . . . . . . . . . . . . . . . . . . . . . . . . . . . . . . . . . . . . . . . . . . . . . . . . . . . . . . . . . . . . . . . . . . . . . . . . . . . . . . . . . . . . . . . . . . . . . . . . . . . .
shear modulus (MPa) 6500 3150 23 600 59. . . . . . . . . . . . . . . . . . . . . . . . . . . . . . . . . . . . . . . . . . . . . . . . . . . . . . . . . . . . . . . . . . . . . . . . . . . . . . . . . . . . . . . . . . . . . . . . . . . . . . . . . . . . . . . . . . . . . . . . . . . . . . . . . . . . . . . . . . . . . . . . . . . . . . . . . . . . . . . . . . . . . . . . . . . . . . . . . . . . . . . . . . . . . . . . . . . . . . . . . .
tensile failure strain (%) 1.5 0.9 — 1.6. . . . . . . . . . . . . . . . . . . . . . . . . . . . . . . . . . . . . . . . . . . . . . . . . . . . . . . . . . . . . . . . . . . . . . . . . . . . . . . . . . . . . . . . . . . . . . . . . . . . . . . . . . . . . . . . . . . . . . . . . . . . . . . . . . . . . . . . . . . . . . . . . . . . . . . . . . . . . . . . . . . . . . . . . . . . . . . . . . . . . . . . . . . . . . . . . . . . . . . . . .
missing from the literature is the presence of shear cracks in the core, which cause a discontinuitybetween the two facesheets, which can be detrimental to the residual strength and stiffness of thesandwich panel. Shear cracking and resultant skin and core debonding are the primary damagemechanisms in blast loading of large-scale sandwich composites. This paper therefore addressesthe effect of crack distribution and density after the blast event as well as debond severity onresidual properties. Criteria for damage assessment of service life are investigated, with theview of damage mapping models being generated to enable the assessment of continued serviceapplied to naval vessels subjected to blast.
2. MaterialsThe composite materials used in this study were all purchased from S. P. Gurit, manufacturedby P. E. Composites. GFRP- and CFRP-skinned sandwich panels were produced, eachconstructed with a 25 mm thick closed-cell M130 Corecell styrene–acrylonitrile (SAN) foamcore. Four composite sandwich panels, 1.6 × 1.3 m in area, of equivalent mass (26 kg) wereevaluated: two with GFRP skins, denoted GL1 and GL2; and two with CFRP skins, denotedCA1 and CA2.
The glass-fibre-skinned panels, GL1 and GL2, were constructed using two plies of 0◦/90◦/±45◦ E-glass quadriaxial skins (QE1200) on a 25 mm SAN foam core (M130). The CFRP equivalentpanels, CA1 and CA2, consisted of skins with two repeat layers of two plies of 0◦/90◦ carbon(RC245T) and two plies of ±45◦ carbon (RC380T) on a 25 mm SAN foam core (material codeM130). Ampreg 22 was the epoxy resin system used for each test sample. Material properties forall constituent materials used during this study are summarized in table 1.
3. Blast loading of sandwich materialsThe research presented in this paper builds on previous studies focusing on full-scale air-blast experimentation conducted on GFRP [15,20] and CFRP [21] sandwich composite panels.This previous research provided experimental data for full-scale explosive testing on compositematerials. The nature and quality of scaling from small-scale to large-scale blast response is stillin development within the research community. Therefore, large-scale data and novel approachesapplied to data acquisition are an important contribution to this field of research, in particularfor industry. The experiments presented here were performed at RAF Spadeadam, Cumbria,UK. The Hopkinson–Cranz scaled distance [30,31], Z, of 3.02 m kg−1/3, 100 kg TNT equivalentat a stand-off distance of 14 m, was used for each of the four targets presented here. The aim ofthese air-blast experiments was to capture full-field displacement–time histories of the sandwichcomposite panels and understand how damage develops during a given blast event. High-speedthree-dimensional DIC was used to capture full-field displacement plots of the rear surface of the
on June 4, 2018http://rsta.royalsocietypublishing.org/Downloaded from

6
rsta.royalsocietypublishing.orgPhil.Trans.R.Soc.A372:20130212
.........................................................
testcubicle
testsamples
20 × M10 bolts
M10 bolt through steel stripsand composite
steel tube to prevent corecrushing when bolting thepanel to the cubicle front
section A-A
sandwich panel
(a)
(b)A
A
M10 nut
test cubicle front
10 × 100 mm steel strips,adhered to the
composite
explosive charge,100 kg nitromethane
side-onpressuregauge
externalcamerahousing
stand-off distance, 14m
Figure 2. (a) Schematic of the experimental layout on the test pad at RAF Spadeadam, Cumbria, UK, and (b) the clampingarrangement of the sandwich panels onto the test cubicle. (Online version in colour.)
targets. These experiments provide full-scale data to validate analytical and numerical models ofsuch structures.
(a) ExperimentalDamage was induced in the sandwich panels by use of an explosive charge, simulating amoderate blast load in close proximity to a structure in air. Charge size and stand-off distancewere chosen, based on a finite-element simulation presented in reference [20], to initiate failure inthe GFRP panel and hence allow a comparison of the CFRP panel’s performance. A 100 kg chargeof nitromethane was assembled 14 m from the front of the test cubicle. The panels were mountedand the charge set up on the mid-plane of the cubicle, with the front face perpendicular to thedirection of the charge. A schematic of the full test layout is given in figure 2a. In order to createquasi-built-in boundary conditions, the panels were bolted to the test cubicle using 20 M10 boltsaround the perimeter. Then, 5 mm thick steel strips were adhered to both sides of the composite
on June 4, 2018http://rsta.royalsocietypublishing.org/Downloaded from
7
rsta.royalsocietypublishing.orgPhil.Trans.R.Soc.A372:20130212
.........................................................
panels as shown in figure 2b. This clamping approximates the loading as a ‘built-in’ boundarycondition. Full modelling should also consider the response of the cubicle front.
Two pairs of Photron SA3 high-speed video cameras were positioned inside the cubicle,each behind one of the two panels tested side-by-side to record back-face deformation in threedimensions. The speckle pattern applied to the back face of each panel was sized accordingto the 1 MP resolution of the cameras at a frame rate of 2000 fps. The pattern was applied inmatte acrylic paint, with an even distribution over the whole panel, but randomly distributedwithin the frames of the facets used for measuring displacement in the DIC software. Thepositions of the cameras were accurately recorded by imaging a calibration pattern beforethe test, once the cameras were in their final positions. LaVision provided the high-speedcameras for this study, and the DIC analysis in this section was performed using the LaVisionsoftware [32].
An additional high-speed camera was positioned outside of the cubicle to observe the effectsof the blast on the front face of the panel and moreover to allow the user to confirm that thetest conditions remained as desired throughout. An arbitrary cross shape was painted onto thefront of the panels to aid in the visualization of the deflection during blast, but not intended asa quantitative measurement of the front face. The displacements were taken from the rear faceusing DIC. Overpressure due to the blast was measured with a pressure gauge positioned next tothe cubicle at the same stand-off distance (figure 2a).
The samples were tested side-by-side to compare directly the response of the GFRP sandwichpanel with the CFRP sandwich panel. For one pair of test samples (GL1 and CA1), central pointdisplacement, full-field contour DIC data and pressure data are provided for the duration of theevent. Two pairs of samples tested at the same scaled distance provide good statistical comparisonfor observing the effect of skin configuration on blast mitigation and damage incurred. It is to benoted that the second pair of composite sandwich panels, GL2 and CA2, were positioned at thesame stand-off from the charge, but were not instrumented for DIC analysis. They were simplyincluded to provide more test samples of blasted panels for post-blast evaluation.
(b) Results and analysisFigures 3 and 4 show sample front-view images taken from the high-speed video cameraspositioned on the test pad during the 100 kg nitromethane charge explosion. The shockwave isseen to arrive at the target after 16.5 ms post-detonation. This blast experiment was designed totake the panels beyond their elastic limit and inflict a significant proportion of damage on eachtarget. The test samples have an arbitrary cross painted on their front face for ease of tracking thefront face deformation.
Figure 3 shows the effect of the blast on test samples GL1 and CA1. Front-face damage is seento initiate in the top right corner of GL1 at 19.8 ms and propagate down the right-hand edge.The final front-face damage is shown at the bottom of figure 3, highlighting the relative visibledamage sustained by each target. There was no visible skin damage in CA1.
For the second pair of samples subjected to blast, figure 4 shows the external view of samplesGL2 and CA2 for the duration of the loading cycle. Front-face damage is seen to initiate in the topleft and right corners of GL2 between 19.8 and 23.1 ms. These cracks propagate down the sides ofGL2. This time, in the CFRP panel, there is a small amount of skin failure visible, highlighted inthe final front-face damage image at the bottom of figure 4.
At the 14 m stand-off from the 100 kg charge, an impulse of 420 kPa ms was recorded, and theinitial positive pressure wave lasted for 12.0 ms. This is shown alongside the transient centralout-of-plane displacement plots for CA1 and GL1 in figure 5.
The glass-fibre-skinned panel, GL1, deformed symmetrically until the point of maximumz-displacement. By this point, front-face and core damage had already occurred and affected thereturn response of the panel, causing a non-uniform rebound response at 20 ms about the peakout-of-plane displacement (see graphic in figure 5). This asymmetry caused by the damaged coreis highlighted in the out-of-plane displacement contour plots in figure 6.
on June 4, 2018http://rsta.royalsocietypublishing.org/Downloaded from

8
rsta.royalsocietypublishing.orgPhil.Trans.R.Soc.A372:20130212
.........................................................
3.4 m
19.8 ms 23.1 ms 26.4 ms16.5 ms
29.7 ms 34.0 ms
GL1 CA1
37.3 ms 40.6 ms
GL1 CA1
3.9
m
(a)
(b)
Figure 3. (a) Images taken at regular intervals with the shockwave impinging on test samples GL1 and CA1 after16.5 ms. (b) Final visible front-face damage. Time stamps are relative to detonation time at 0.0 ms. (online versionin colour.)
The maximum z-displacement, Umaxz , was 140 mm and the maximum principal strain, εmax,
peaked at 1.6% towards the right- and left-hand edges of the panel (figure 7). The carbon-fibre-skinned panel, CA1, deflected to a Umax
z of only 107 mm, owing to a higher stiffness than that ofthe glass-fibre-skinned panel. Core shear failure was still observed. There was no skin damagevisible in CA1, although a fine crack on one of the panel edges of CA2 was observed to occur,
on June 4, 2018http://rsta.royalsocietypublishing.org/Downloaded from

9
rsta.royalsocietypublishing.orgPhil.Trans.R.Soc.A372:20130212
.........................................................
3.4 m
GL2 CA2
29.7 ms 34.0 ms 37.3 ms 40.6 ms
GL2 CA2
3.9
m
19.8 ms 23.1 ms 26.4 ms16.5 ms
(a)
(b)
Figure 4. (a) Images taken at regular intervals with the shockwave impinging on test samples GL2 and CA2 after 16.5 ms.(b) Final visible front-face damage of targets 1.6 × 1.3 m area. (Online version in colour.)
as shown previously in figure 4. The damage to the panel also led to a reduced stiffness, whichcaused an increase in the time for the return response. This was seen in the carbon-fibre panelas an elongated return from maximum displacement in figure 5 and the relatively flat-lookingcontour plot in figure 8. It took 1 ms longer for the carbon–fibre panel to return to its originalposition than the glass-fibre panel owing to the difference in core crack distribution observed inthe carbon-fibre-skinned panels compared with the glass-fibre-skinned panels and other effects.
on June 4, 2018http://rsta.royalsocietypublishing.org/Downloaded from

10
rsta.royalsocietypublishing.orgPhil.Trans.R.Soc.A372:20130212
.........................................................
30 35 40–100
–50
0
50
100
150
200
10–100
–50
0
pres
sure
(kP
a)
disp
lace
men
t (m
m)
50
100
150
200
15 20 25time (ms)
overpressurecarbon displacementglass displacement
Figure 5. Graph showing the out-of-plane displacement of both CA1 and GL1 alongside the synchronized overpressuremeasurement. (Online version in colour.)
19.5 ms
130
80
30
–20out-
of-p
lane
dis
plac
emen
t (m
m)
–70
18.0 ms
1.3 m
1.6
m
21.0 ms
24.0 ms22.5 ms 25.5 ms
Figure 6. DIC analysis of blast on GL1 featuring contour plots of out-of-plane displacement. (Online version in colour.)
CA1 was seen to have strain concentrating around the edges of the panel in figure 9, with thecentral region relatively unstrained, complementing the displacement observations in figure 8.Similarly, the edges of the GL1 were relatively highly strained between 18.0 and 21.0 ms; however,this strain progressed to concentrate around a region that suffered complete failure along an edge(figure 7). This coincided with the time at which a front-face failure was observed in figure 3.
on June 4, 2018http://rsta.royalsocietypublishing.org/Downloaded from

11
rsta.royalsocietypublishing.orgPhil.Trans.R.Soc.A372:20130212
.........................................................
19.5 ms
2.0
1.5
1.0
0.5
prin
cipa
l str
ain
(%)
0
18.0 ms
1.3 m
1.6
m
21.0 ms
24.0 ms22.5 ms 25.5 ms
Figure 7. DIC analysis of blast on GL1 featuring contour plots of maximum principal strain. (Online version in colour.)
19.5 ms
130
80
30
–20out-
of-p
lane
dis
plac
emen
t (m
m)
–70
18.0 ms
1.3 m
1.6
m
21.0 ms
24.0 ms22.5 ms 25.5 ms
Figure 8. DIC analysis of blast on CA1 featuring contour plots of out-of-plane displacement. (Online version in colour.)
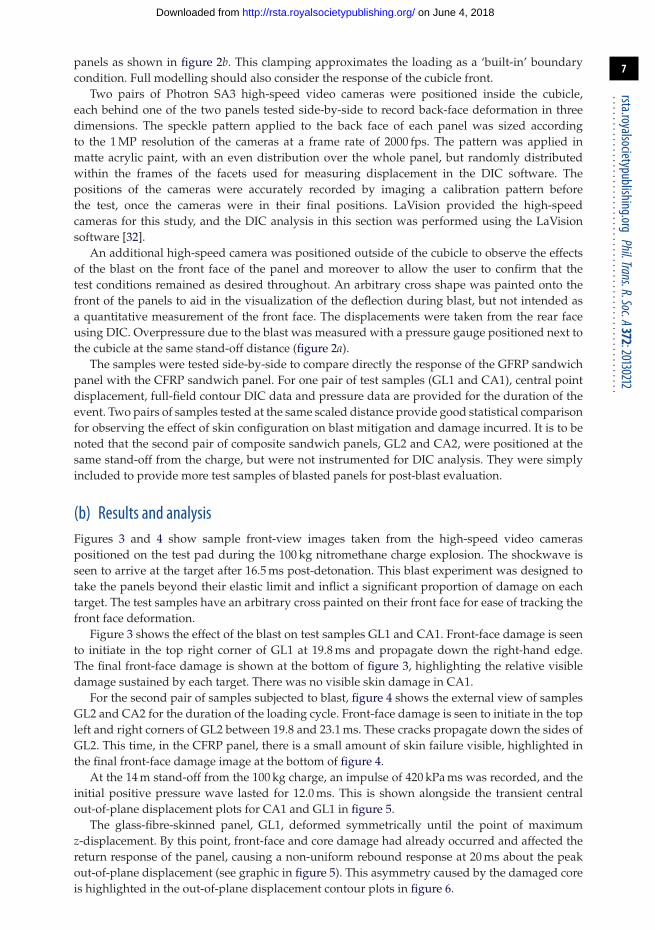
Clear indications of damage induced are shown in the DIC images. Sample snapshots ofthe maximum principal strain are given in figure 10a. For GL1, there is a region of materialin compression of approximately −1% when GL1 is at its peak rebound displacement (outtowards the origin of the charge). This region builds in strain owing to the lack of support
on June 4, 2018http://rsta.royalsocietypublishing.org/Downloaded from

12
rsta.royalsocietypublishing.orgPhil.Trans.R.Soc.A372:20130212
.........................................................
19.5 ms
2.0
1.5
1.0
0.5
prin
cipa
l str
ain
(%)
0
18.0 ms
1.3 m
1.6
m
21.0 ms
24.0 ms22.5 ms 25.5 ms
Figure 9. DIC analysis of blast on CA1 featuring contour plots of maximum principal strain. (Online version in colour.)
provided by the core. This lack of support due to core cracking can also be observed inCA1, along the top of the panel, but, in this case, front facesheet damage is not observedowing to the higher strength of the carbon fibre. A core shear failure propagated through thepanel, resulting in a front-skin failure as well shown in figure 10b. The front-face image ofthe damaged sample in figure 10b has been mirrored for ease of comparison with the rear-face DIC result in figure 10a. In both carbon panels, there was no visible skin damage apartfrom a few hairline cracks on the front-most fibres. The higher-stiffness fibres resisted theblast better in terms of a lower out-of-plane deflection. However, by deflecting less, moreenergy was retained in the sandwich panel and, rather than being dissipated in momentum,it was dissipated in internal reflections within the sandwich material. This led to a greatercoverage of core shear failure within the carbon-fibre-skinned panels than the glass-fibre-skinned ones. Evidence in figure 10a shows a typical flicker of subsurface damage in CA1.During the deformation and rebound phases, the core cracks are individually highlighted withbands of strain concentration, i.e. the dark (blue online) streaks in the plot of 0.5% strainacross the relatively unstrained surface (light (purple online)). Areas where wider bands ofstrain relief are observed also suffered propagation of the shear cracks into interfacial failuresas well, again showing that the strain contour plots available through DIC analysis can beused as an indication of subsurface damage in the sandwich composites (to be discussedfurther in §3c).
(c) Damage analysis of sandwich panelsAfter the blast experiments, the samples were recovered and sectioned into eight equally sizedsubpanels, 635 × 400 mm in area. The global panels of CA1, CA2, GL1 and GL2 were cut downtheir vertical into halves and then cut into a further four sections down each side. Each subpanelwas then visually inspected for damage. An example of a 1R subpanel (top right when viewedfrom rear) for CFRP is presented in figure 11 and a 1R subpanel for GFRP is presented in
on June 4, 2018http://rsta.royalsocietypublishing.org/Downloaded from
13
rsta.royalsocietypublishing.orgPhil.Trans.R.Soc.A372:20130212
.........................................................
(a)
(b)
1.3 m
GL1 at 31.5 ms after detonation CA1 at 31.5 ms after detonation
2.0
1.5
1.0
0.5
0
prin
cipa
l str
ain
(%)
1.6
m
1.3 m
GL1 CA1
1.6
m
Figure 10. DIC analysis of both GL1 and CA1 showing (a) the maximum principal strains and (b) the mirrored images of thedamaged front faces of each target. (Online version in colour.)
figure 12. Core cracks are identified and recorded in terms of orientation. Debonded surfaces arealso recorded in terms of percentage propagation along a length. Sample records are shown forCA1 and GL1 for subpanel location 1R, presented in table 2. Such visual inspection records werecollected for all subpanels, to be used later in the discussion to analyse how post-blast damageinfluences residual strength. The estimates are based on debonds as a percentage of the length ofthe edge, from edge inspections. This can be further verified with the use of three-dimensionalCT scanning to determine the extent of subsurface damage.
Signs of where the most damaged areas of each global panel occur were available in the DICanalysis. Figure 13 shows the strain in the y-direction in the image, denoted εyy, for GL1 and CA1.It is shown that the propensity for horizontal cracking along the shorter length (x-direction) isfairly uniform in GL1, whereas in CA1, εyy is much higher towards the top edge of the target.This goes some way to highlight why visual inspections show that the GFRP panels were moreuniformly damaged throughout the target compared with the CFRP sandwich panels. Evidence
on June 4, 2018http://rsta.royalsocietypublishing.org/Downloaded from

14
rsta.royalsocietypublishing.orgPhil.Trans.R.Soc.A372:20130212
.........................................................
top
debond
45° crack
bottom
front
left
righ
t
30° crack
vertical crack
Figure 11. An example of the documentation process for visual inspection post-blast on CA1 subpanel 1R (650 × 400 mm inarea), showing images and schematics of damage noted. Subpanel 1R is top right when viewed from the rear. (Online versionin colour.)
top
bottom
front
left
righ
t
30° crackdebond
45° crack
vertical crack
Figure 12. An example of the documentation process for visual inspection post-blast on GL1 subpanel 1R (650 × 400 mm inarea), showing images and schematics of damage noted. Subpanel 1R is top right when viewed from the rear. (Online versionin colour.)
presented in the previous section highlighted the fact that damage initiated at points of highconstraint, i.e. the corners of the support structure, and these visual inspections show the extentof through-thickness damage.
on June 4, 2018http://rsta.royalsocietypublishing.org/Downloaded from

15
rsta.royalsocietypublishing.orgPhil.Trans.R.Soc.A372:20130212
.........................................................
1.3 m
GL1 at 19.5 ms after detonation CA1 at 19.5 ms after detonation
2.4
1.2
0
–1.2
–2.4
e yy (
%)
1.6
m
Figure 13. DIC analysis showing strain in the y-direction in GL1 and CA1 recorded during the blast taken at 19.5 ms afterdetonation. (Online version in colour.)
Table 2. Index of damage observed on the subpanel samples shown in figures 11 and 12.
sample top edge bottom edge right edge left edge. . . . . . . . . . . . . . . . . . . . . . . . . . . . . . . . . . . . . . . . . . . . . . . . . . . . . . . . . . . . . . . . . . . . . . . . . . . . . . . . . . . . . . . . . . . . . . . . . . . . . . . . . . . . . . . . . . . . . . . . . . . . . . . . . . . . . . . . . . . . . . . . . . . . . . . . . . . . . . . . . . . . . . . . . . . . . . . . . . . . . . . . . . . . . . . . . . . . . . . . . .
CA1-1R front 80% debond 30% debond 15% debond 25% debond. . . . . . . . . . . . . . . . . . . . . . . . . . . . . . . . . . . . . . . . . . . . . . . . . . . . . . . . . . . . . . . . . . . . . . . . . . . . . . . . . . . . . . . . . . . . . . . . . . . . . . . . . . . . . . . . . . . . . . . . . . . . . . . . . . . . . . . . . . . . . . . . . . . . . . . . . . . . .
core 1 × 45◦, 1 × 30◦ 3 × 45◦, 1 × 90◦ — 2 × 45◦, 2 × 90◦. . . . . . . . . . . . . . . . . . . . . . . . . . . . . . . . . . . . . . . . . . . . . . . . . . . . . . . . . . . . . . . . . . . . . . . . . . . . . . . . . . . . . . . . . . . . . . . . . . . . . . . . . . . . . . . . . . . . . . . . . . . . . . . . . . . . . . . . . . . . . . . . . . . . . . . . . . . . .
back — — — —.. . . . . . . . . . . . . . . . . . . . . . . . . . . . . . . . . . . . . . . . . . . . . . . . . . . . . . . . . . . . . . . . . . . . . . . . . . . . . . . . . . . . . . . . . . . . . . . . . . . . . . . . . . . . . . . . . . . . . . . . . . . . . . . . . . . . . . . . . . . . . . . . . . . . . . . . . . . . . . . . . . . . . . . . . . . . . . . . . . . . . . . . . . . . . . . . . . . . . . . . .
total no. of cracks 10. . . . . . . . . . . . . . . . . . . . . . . . . . . . . . . . . . . . . . . . . . . . . . . . . . . . . . . . . . . . . . . . . . . . . . . . . . . . . . . . . . . . . . . . . . . . . . . . . . . . . . . . . . . . . . . . . . . . . . . . . . . . . . . . . . . . . . . . . . . . . . . . . . . . . . . . . . . . . . . . . . . . . . . . . . . . . . . . . . . . . . . . . . . . . . . . . . . . . . . . . .
total area of debond 37%. . . . . . . . . . . . . . . . . . . . . . . . . . . . . . . . . . . . . . . . . . . . . . . . . . . . . . . . . . . . . . . . . . . . . . . . . . . . . . . . . . . . . . . . . . . . . . . . . . . . . . . . . . . . . . . . . . . . . . . . . . . . . . . . . . . . . . . . . . . . . . . . . . . . . . . . . . . . . . . . . . . . . . . . . . . . . . . . . . . . . . . . . . . . . . . . . . . . . . . . . .
GL1-1R front 20% debond — — —. . . . . . . . . . . . . . . . . . . . . . . . . . . . . . . . . . . . . . . . . . . . . . . . . . . . . . . . . . . . . . . . . . . . . . . . . . . . . . . . . . . . . . . . . . . . . . . . . . . . . . . . . . . . . . . . . . . . . . . . . . . . . . . . . . . . . . . . . . . . . . . . . . . . . . . . . . . . .
core 1 × 45◦ 2 × 45◦, 2 × 60◦ — —.. . . . . . . . . . . . . . . . . . . . . . . . . . . . . . . . . . . . . . . . . . . . . . . . . . . . . . . . . . . . . . . . . . . . . . . . . . . . . . . . . . . . . . . . . . . . . . . . . . . . . . . . . . . . . . . . . . . . . . . . . . . . . . . . . . . . . . . . . . . . . . . . . . . . . . . . . . . .
back — 15% debond — —. . . . . . . . . . . . . . . . . . . . . . . . . . . . . . . . . . . . . . . . . . . . . . . . . . . . . . . . . . . . . . . . . . . . . . . . . . . . . . . . . . . . . . . . . . . . . . . . . . . . . . . . . . . . . . . . . . . . . . . . . . . . . . . . . . . . . . . . . . . . . . . . . . . . . . . . . . . . . . . . . . . . . . . . . . . . . . . . . . . . . . . . . . . . . . . . . . . . . . . . . .
total no. of cracks 5. . . . . . . . . . . . . . . . . . . . . . . . . . . . . . . . . . . . . . . . . . . . . . . . . . . . . . . . . . . . . . . . . . . . . . . . . . . . . . . . . . . . . . . . . . . . . . . . . . . . . . . . . . . . . . . . . . . . . . . . . . . . . . . . . . . . . . . . . . . . . . . . . . . . . . . . . . . . . . . . . . . . . . . . . . . . . . . . . . . . . . . . . . . . . . . . . . . . . . . . . .
total area of debond 6%. . . . . . . . . . . . . . . . . . . . . . . . . . . . . . . . . . . . . . . . . . . . . . . . . . . . . . . . . . . . . . . . . . . . . . . . . . . . . . . . . . . . . . . . . . . . . . . . . . . . . . . . . . . . . . . . . . . . . . . . . . . . . . . . . . . . . . . . . . . . . . . . . . . . . . . . . . . . . . . . . . . . . . . . . . . . . . . . . . . . . . . . . . . . . . . . . . . . . . . . . .
4. Edgewise compression of sandwich panelsWhile the blast experiment allows for an assessment of hazard to occupants from the blast-wave energy, it does not account for the changes in load-bearing capacity of the material oncedamaged. In order to understand the effects of the blast on the structural integrity of the panels,it was decided to test the panels under a compressive load that the panels might be expected tosupport within a larger structure. It is important to note here that blast tests were not conductedwith pre-load applied to the panels. The severity of the damage to the panels and the dynamicresponse of the panel to the pre-load under these conditions may vary from the idealized situationpresented here. Such relevant modifications to the blast experimental set-up are of interest forfuture investigations. The tests conducted here demonstrate the ability of the panels to supportapplied load after blast damage has already occurred.
(a) ExperimentalOnce recovered from the blast experiment, the carbon- and glass-fibre-skinned panels were eachsectioned into eight equally sized samples. The original panels were split down the middle
on June 4, 2018http://rsta.royalsocietypublishing.org/Downloaded from

16
rsta.royalsocietypublishing.orgPhil.Trans.R.Soc.A372:20130212
.........................................................
Instron 8806250 ton
fixture
400m
m635 mm
three-dimensionalDIC set-up
testsamples
Figure 14. Schematic of the experimental test set-up for edgewise compression of sandwich materials. (Online version incolour.)
vertically, and then into four smaller panels horizontally. Damage was observed along the edgesof each panel, and recorded in a series of images. Examples of such images are shown in figures 11and 12. These images were used to estimate the degree of damage within each panel to correlatesuch measures of damage, as presented previously in table 2, with residual strength.
Panels were restrained in 10 mm deep channels aligned between compression plates on anInstron 8806 2.5 MN dynamic hydraulic testing machine. The channels constrained the panelsagainst out-of-plane displacement, but were shallow enough (5 mm edge height restraint) to allowrotation at either end. Low-stiffness elastomeric sheet was inserted at either end of the panel tohelp ensure even loading along the whole panel length.
Two 5 MP digital cameras were set up and calibrated for three-dimensional DIC on one sideof the panel, which now had a finer speckle pattern applied owing to the higher resolution ofthe recording apparatus and the smaller size of the samples, as per standard image correlationpractices [33]. In all cases, the imaged face was the skin, which was originally facing the explosivecharge. A schematic of the experimental test set-up is shown in figure 14.
The panels were compressed at a constant displacement rate of 2 mm min−1. The panels werecompressed until either full delamination occurred sharply, or the load dropped to below 20% ofthe maximum. Images of the panels were taken at a rate of 1 Hz, measuring the displacementof the front face of the panel, but not recording dynamic unloading of the panel due to fastfracture. The blast panels were tested in edgewise compression under the assumption thatthe naval vessel will only be subjected to one blast event, meaning that integrity of the hullneed only be maintained until such time as repairs can take place. Owing to extensive corecracking during blast causing a discontinuity between the two facesheets, it is expected thatflexural stiffness becomes minimal after blast, a prediction that can be verified with furthertesting. Edgewise compressive strength, on the other hand, should be much less affected by theblast (up to the buckling load) owing to the facesheets providing the majority of the structuralinput. For this reason, the test specimens were deemed to have ‘failed’ in the residual edgewisecompression strength tests when buckling occurred. If these materials were structural members,then they may be expected to maintain a certain amount of static compressive load, and thereforethis is of interest.
on June 4, 2018http://rsta.royalsocietypublishing.org/Downloaded from

17
rsta.royalsocietypublishing.orgPhil.Trans.R.Soc.A372:20130212
.........................................................
3001L 1R
2L 2R
3L 3R
4L 4R
200
100load
(kN
)
0 1510displacement (mm) displacement (mm)
5 0 15105
300
200
100load
(kN
)
0
0
300
200
100load
(kN
)
0
300
200
100load
(kN
)
Figure 15. Force–time data for each sample in GL1. Data for each subpanel are shown in the position of where it lay in theglobal blast panel as viewed from rear of panel. The inset shows the location of the subpanel within the GFRP panel. (Onlineversion in colour.)
(b) Results and analysisFigure 15 shows a summary of all the load–displacement plots taken for each subpanel of GL1tested, with each location of the subpanel within the global blasted panel labelled. It was observedin the glass specimens that the ultimate compressive load was greater for those panels which weresituated in positions 2 and 3. The damage here was observed to be less severe than the bottomof the panels. The damage in the centre panels was also noted to be predominantly at the topand bottom, and the DIC data from the blast test (figures 16 and 17) suggested that core crackstravelled vertically, in line with the direction of the compressive load. It can be seen in figure 18that higher ultimate loads were withstood by the panels in positions 2 and 3, and that, particularlyin position 4R, a much lower load was attained before ultimate failure. These panels demonstrated
on June 4, 2018http://rsta.royalsocietypublishing.org/Downloaded from

18
rsta.royalsocietypublishing.orgPhil.Trans.R.Soc.A372:20130212
.........................................................
15
10
5
0
–15
–10
–5
15
10
5
0
–15
–10
–5
15
10
(mm) (%)
5
0
–15–16–13–10–7–4–1258
1215 15.0
12.510.07.55.02.5
–2.50
–5.0–7.5–10.0
(mm) (%)
–16–13–10–7–4–1258
1215 15.0
12.510.07.55.02.5
–2.50
–5.0–7.5–10.0
(mm)
y
L x C R(%)
–16–13–10–7–4–1258
1215 15.0
12.510.07.55.02.5
–2.50
–5.0–7.5–10.0
0Dy = 8.0 mm
Dy = 5.0 mm
Dy = 2.5 mm
e yU
ze y
Uz
e yU
z
95 190
Y (mm)
Uz(m
m)
Uz(m
m)
Uz(m
m)
285
R
CL
R
C
L
R
C
L
380
–10
–5
Figure 16. DIC analysis for subpanel 1L (top left when viewed from rear) in global blast panel GL1: out-of-plane displacement,Uz , and strain in the y-direction,εy ; and section plots showing the variation ofUz along the height of the panel at three locationsalong the length—right (R), centre (C) and left (L). Note the subpanel dimensions were 635 × 400 mm; however, a windowheight of 360 mmwas imaged. (Online version in colour.)
cracks travelling across the loading direction, and 4R showed the most damage of any of theglass-fibre panels.
Figure 16 shows DIC images, which have been extracted to illustrate out-of-planedisplacement, Uz, of the front GFRP skin, as well as strain in the vertical direction, εy, on thefront face. The idea here is that, during the early stages of the loading of the subpanels, theDIC contours can tell the user what kind of subsurface damage is present. A simple concept
on June 4, 2018http://rsta.royalsocietypublishing.org/Downloaded from

19
rsta.royalsocietypublishing.orgPhil.Trans.R.Soc.A372:20130212
.........................................................
35
30
25
20
15
10
5
0
–5
(mm) (%)15.012.510.07.55.02.5
–2.50
–5.0–7.5–10.0
(mm) (%)15.012.510.07.55.02.5
–2.50
–5.0–7.5–10.0
(mm)
y
L x C R(%)
16.012.59.05.52.0
–1.5–5.0
19.523.026.532.0
16.012.59.05.52.0
–1.5–5.0
19.523.026.532.0
16.012.59.05.52.0
–1.5–5.0
19.523.026.532.0
15.012.510.07.55.02.5
–2.50
–5.0–7.5–10.0
0Dy = 15.0 mm
Dy = 9.0 mm
Dy = 3.0 mm
e yU
ze y
Uz
e yU
z
95 190
Y (mm)
Uz(m
m)
35
30
25
20
15
10
5
0
–5
Uz(m
m)
35
30
25
20
15
10
5
0
–5
Uz(m
m)
285
R
CL
R
C
L
R
C
L
380
Figure 17. DIC analysis for subpanel 3L in global blast panel GL1: out-of-plane displacement, Uz , and strain in the y-direction,εy ; and section plots showing the variation of Uz along the height of the panel at three locations along the length—right (R),centre (C) and left (L). (Online version in colour.)
is proposed such that, if there is a localized strain field but a uniform displacement trace, thensubsurface cracks in the core are causing this strain concentration. If there is a bulge in the Uz
plot, relative to the global behaviour, and a strain concentration, then there is likely to be a debondpresent (in addition to any cracks or otherwise). Therefore, this analysis has been used to clarifywhat damage was present, reaffirming edge inspections or correcting them. Graphs of out-of-plane displacement along the height of the subpanels are shown for the edges and centre of thesesubpanels to illustrate the bulging effect or uniformity where present. Plots are shown for 1L in
on June 4, 2018http://rsta.royalsocietypublishing.org/Downloaded from

20
rsta.royalsocietypublishing.orgPhil.Trans.R.Soc.A372:20130212
.........................................................
K = 12.3 MN m–1
Pmax = 207 kN
K = 13.4 MN m–1
Pmax = 225 kN
K = 15.2 MN m–1
Pmax = 192 kN
K = 9.52 MN m–1
Pmax = 161 kN
1L 1R
2L 2R
3L 3R
4L 4R
>255
240
225
210
195
180
165
150
max
imum
load
(kN
)
135
120
105
<90
K = 19.3 MN m–1
Pmax = 210 kN
K = 12.6 MN m–1
Pmax = 226 kN
K = 8.32 MN m–1
Pmax = 95.0 kN
K = 9.47 MN m–1
Pmax = 174 kN
Figure 18. Graphic showing, as a greyscale (colour) plot, how ultimate load-bearing capacity varied with location of subpanelon the global GFRP blast panel as viewed from rear. (Online version in colour.)
figure 16 and 3L in figure 17 for various compressive loading stages labelled with reference to thefull load–displacement plots given in figure 14.
Clearly visible from these images are residual cracks that were in place in the front glasssheet from blast testing. Also visible in these DIC images is the fact that wrinkling hastaken place in the front skin, mainly due to discontinuity across the facesheet as a resultof the skin cracking. This is an interesting feature, as it shows that the two facesheets stillmaintain some connection through the foam, so not all out-of-plane displacement is away fromthe centreline.
Figure 19 shows a summary of the load–displacement plots for the subpanels of CA1 tested.Figures 20 and 21 show the DIC for out-of-plane displacement in the CA1 subpanels 1R and 4R,respectively. The point during each test where the plots have been extracted are marked in termsof compressive displacement relating to the plots in figure 19. Similar to those figures producedfor the GFRP subpanels, each compressive stage shows DIC images to illustrate the variation ofout-of-plane motion and εy along the height of the panel front. The carbon skins suffered minimaldamage during blast testing, which can be seen from the even displacements in the DIC images.However, core cracking and debonding were present in these test samples. In CA1-4R, this canbe seen by the high out-of-plane deflection and relatively uniform strain plots on the right-handedge, which corresponds to the core cracking damage.
Ultimate load-bearing capacity data are presented for the CFRP panels in figure 22. It canbe seen again that the residual strength of the panels corresponds to the damage severity andorientation observed from the edges of the panels and interpreted from the DIC blast data. Inthis case, it can be noted that panel 4L demonstrates a very high ultimate compressive strength,and that the corresponding corner, 1R, demonstrates a very low compressive strength. This
on June 4, 2018http://rsta.royalsocietypublishing.org/Downloaded from

21
rsta.royalsocietypublishing.orgPhil.Trans.R.Soc.A372:20130212
.........................................................
3001L 1R
2L 2R
3L 3R
4L 4R
200
100load
(kN
)
0 1510displacement (mm) displacement (mm)
5 0 15105
300
200
100load
(kN
)
0
0
300
200
100load
(kN
)
0
300
200
100load
(kN
)
Figure 19. Force–time data for each sample in CA1. Data for each subpanel are shown in the position of where it lay in theglobal blast panel as viewed from rear. The inset shows the location of the subpanel within the CFRP panel.
corresponds to the amount of visible damage to the panels, and is indicative of the unequalloading shown in the DIC blast data due to the constraint of the panel. Otherwise, a reasonablyhigh compressive strength was still observed at the centre of the carbon-fibre panel, and locationsof lower strength were observed at the upper and lower positions.
5. DiscussionIt was shown that during the blast the CFRP-skinned sandwich panels provided a greaterresistance to the blast-wave impact, deflecting to a lower Umax
z compared with the GFRP-skinnedtarget. The post-blast damage inspection showed CA1 and CA2 to have suffered minimal to novisible skin damage, but comparable severity of core damage to GL1 and GL2. The GFRP targets
on June 4, 2018http://rsta.royalsocietypublishing.org/Downloaded from

22
rsta.royalsocietypublishing.orgPhil.Trans.R.Soc.A372:20130212
.........................................................
35
30
25
20
15
10
5
0
35
30
25
20
15
10
5
0
35
30
25
20
15
10
5
y
L x C R
18.013.59.04.5
0–4.5
–10.0
22.527.031.537.0 2.0
1.81.61.41.21.0
0.60.8
0.40.20
18.013.59.04.5
0–4.5
–10.0
22.527.031.537.0 2.0
1.81.61.41.21.0
0.60.8
0.40.20
18.013.59.04.5
0–4.5
–10.0
22.527.031.537.0 2.0
1.81.61.41.21.0
0.60.8
0.40.20 0Dy = 7.5 mm
Dy = 5.0 mm
Dy = 2.5 mm
e yU
ze y
Uz
e yU
z
200Y (mm)
Uz(m
m)
Uz(m
m)
Uz(m
m)
R
C
L
R
C
L
R
C
L
600400
(mm) (%)
(mm) (%)
(mm) (%)
Figure 20. DIC analysis for subpanel 1L in global blast panel CA1: out-of-plane displacement, Uz , and strain in the y-direction,εy ; and section plots showing the variation of Uz along the height of the panel at three locations along the length—right (R),centre (C) and left (L). (Online version in colour.)
both suffered significant front-face skin cracks. The cracks were seen to originate in the corners ofthe targets where there is a high degree of restraint on the sample. It is here that the shear wavessuperimpose after rebound from the boundaries to initiate core failures, leading to compressiveskin failures once sufficiently detached from the core to enable the failure strain, approximately1.5%, to be reached.
The amount of core damage was approximately the same across the panel, but the skin damagewas localized. This can be expected on a structure owing to the uneven loading that can developduring a blast. It is expected that the central portion of the test fixture towards the bottom would
on June 4, 2018http://rsta.royalsocietypublishing.org/Downloaded from

23
rsta.royalsocietypublishing.orgPhil.Trans.R.Soc.A372:20130212
.........................................................
(mm)
y
L x C R(%)
–1.2–0.6
–2.0
5.0 0.50
5
4
3
2
1
0
–1
–2
0.450.400.350.300.250.200.150.100.050
4.23.52.82.11.40.7
0
0Dy = 8.0 mm
Dy = 5.0 mm
Dy = 2.5 mm
e yU
ze y
Uz
e yU
z
180
Y (mm)
Uz(m
m)
(mm) (%)
–1.2–0.6
–2.0
5.0 0.505
4
3
2
1
0
–1
–2
0.450.400.350.300.250.200.150.100.050
4.23.52.82.11.40.7
0
Uz(m
m)
(mm) (%)
–1.2–0.6
–2.0
5.0 0.505
4
3
2
1
0
–1
–2
0.450.400.350.300.250.200.150.100.050
4.23.52.82.11.40.7
0
Uz(m
m)
R
C
L
R
C
L
R
C
L
360
Figure 21. DIC analysis for subpanel 4R in global blast panel CA1: out-of-plane displacement, Uz , and strain in the y-direction,εy ; and section plots showing the variation of Uz along the height of the panel at three locations along the length—right (R),centre (C) and left (L). (Online version in colour.)
see the greatest initial loading. This is evident from the Uz plots during each blast for the targetsin figures 6 and 8. However, composite structures exhibit compliance; therefore the pressures donot build up necessarily to their theoretical maxima based on geometry alone. GL1 was seen tosuffer the most damage at the bottom corner closest to the centre of the fixture (4R), whereas CA1was seen to suffer most damage in the opposite corner (1R). When the blast wave hits the targets,there are a series of transmitted waves and reflected waves. The transmitted waves are eitherthrough-thickness surface waves or a combination of shear waves. Upon impact, the bottom-most central corner (GL1-4R and CA1-4L) will be loaded first and see the initial peak loading
on June 4, 2018http://rsta.royalsocietypublishing.org/Downloaded from

24
rsta.royalsocietypublishing.orgPhil.Trans.R.Soc.A372:20130212
.........................................................
K = 23.8 MN m–1
Pmax = 201 kN
K = 14.8 MN m–1
Pmax = 258 kN
K = 20.0 MN m–1
Pmax = 263 kN
K = 25.0 MN m–1
Pmax = 216 kN
1L 1R
2L 2R
3L 3R
4L 4R
>255
240
225
210
195
180
165
150
max
imum
load
(kN
)
135
120
105
<90
K = 11.1 MN m–1
Pmax = 190 kN
K = 16.1 MN m–1
Pmax = 236 kN
K = 21.2 MN m–1
Pmax = 135 kN
K = 15.9 MN m–1
Pmax = 100 kN
Figure 22. Graphic showing, as a greyscale (colour) plot, how ultimate load-bearing capacity varied with location of subpanelon the global GFRP blast panel as viewed from rear. (Online version in colour.)
relative to the whole target, which is also being loaded by the blast. There is a period of build-up during the loading phase, particularly on a non-infinitely rigid surface. The surface wavestravelling along the panel are transmitted along the lengths towards other regions of the target,i.e. opposite corners. The faster wave speed in the CFRP targets allows the waves to propagateto the other boundaries quicker than in the GFRP targets. Therefore, damage builds up greatly inthe CFRP targets away from the centre. However, in the GFRP targets, the magnitude of the blastwave is sufficient to breach the failure strain of the fibres (especially once support from the coreis lost due to shear failures), and so energy dissipation to remote areas from peak-loaded onesis minimized. Energy is lost due to other failure mechanisms in the GFRP sandwich panels suchas gross skin failure, rather than simply core damage. Therefore, the more significantly damagedarea is focused in the GFRP targets to where the most force is expected to be applied and notnecessarily focused in the CFRP targets. This concept is shown in figures 18 and 22.
The GFRP targets appeared to sustain a broad degree of damage, as did the CFRP targets. Fora blast-resistant structure, it is advantageous to understand the residual strength of the structurepost-blast, as well as what level of blast it can sustain prior to catastrophic failure, e.g. rear-skinperforation. The edgewise compression tests represent one of a few types of loading conditionsthat would be of interest to study from the point of view of the residual strength in structures;others include flexure and normal impact or compressive loading.
A number of trends and hypotheses can be drawn from the raw data. However, theimportance of core cracking, particularly those normal to the loading direction, can lead tosignificant reduction in stiffness and load-bearing capacity. The graph shown in figure 23 plots thenormalized number of cracks, i.e. the total number of cracks observed visually from each edge ofthe subpanel divided by the greatest number observed, all plotted against the peak compressiveload. The peak values of compressive load were obtained from testing non-blasted materials.
on June 4, 2018http://rsta.royalsocietypublishing.org/Downloaded from

25
rsta.royalsocietypublishing.orgPhil.Trans.R.Soc.A372:20130212
.........................................................
0
100
200
300
400
500
600
700
800
0.2 0.4no. cracks observed/maximum no. observed
max
imum
com
pres
sive
load
(kN
)
0.6
CFRP panelCFRP panel
0.8 1.0
Figure 23. Plot showing compressive load against normalized number of cracks recorded prior to compression testing. Dashedline represents the theoretical minimum compressive load to crush the core and buckle the skins. (Online version in colour.)
Referring to figure 23, it is seen that the CFRP targets have a much higher initial maximumload-bearing capacity (which is taken to be the buckling load) than the GFRP targets. However,based on the stiffer fibres in CFRP and the improved blast resistance, resulting in greater degree ofblast energy absorption, the relative reduction in load-bearing capacity was greater for the CFRPtargets compared with the GFRP targets. Furthermore, a stiffer material experiences a higher load(or resistance to impact); therefore the apparent damage induced in the core and interfaces isunderstandable compared with a more compliant material such as GFRP.
Both targets seem to reach a similar lower level of strength once some small amount of damageis incurred. The graph, however, goes beyond the x-axis plotted, i.e. the panels can damage furtherthan shown in this paper, to a theoretical maximum damage where the panels are loaded purelyto compress the foam core and buckle the skins. This minimum compressive load is shown as thedotted asymptote at the bottom of the graph in figure 23.
6. ConclusionCFRP sandwich panels were shown to have a greater blast resistance, in terms of their deflectionunder severe blast to a lower peak out-of-plane displacement, than the GFRP equivalent targets.Damage and failure mechanisms were identified to be shear failure initiation in the core and itsinherent propagation through the core and core–skin interface. Skin failures were clearly observedin the GFRP targets, forming around areas of complete skin-to-skin core shear failure, with someskin cracking seen to occur to a lesser degree in the CFRP targets.
The residual strength of the two constructions was evaluated under compression loading. Thepercentage drop in the CFRP targets was greater than in the GFRP targets. It was shown that,once a certain level of damage is inflicted by the 100 kg TNT blast, there is a drop in load-bearingcapacity. Carbon fibres are much stronger than glass fibres, but both remain susceptible to impactdamage, and so the relative drop in strength was seen to be greater in the CFRP sandwich panels.The trends observed here indicate that, if residual strength is a key design factor after severe blast,then a drop of two-thirds of the residual compressive strength in CFRP and half in GFRP needsto be taken into account in design.
Acknowledgements. We thank Dr Yapa Rajapakse of the Office of Naval Research (N00014-08-1-1151 and N00014-12-1-0403) for supporting Mark Kelly and Dr Hari Arora for their PhDs; the MoD for supporting Alex
on June 4, 2018http://rsta.royalsocietypublishing.org/Downloaded from

26
rsta.royalsocietypublishing.orgPhil.Trans.R.Soc.A372:20130212
.........................................................
Worley for his PhD; and Arup for supporting Paolo Del Linz and Dr Paul Hooper in their PhDs. Muchappreciated is the supply of high-speed cameras for the blast trials as well as assistance with data processingby LaVision (Dave Hollis and John Boaler) and continued research support from GOM UK, CPNI, Gurit andGL-Noble Denton.
References1. Hopkinson B. 1914 A method of measuring the pressure produced in the detonation
of high explosives or by the impact of bullets. Proc. R. Soc. Lond. A 89, 411–413.(doi:10.1098/rspa.1914.0008)
2. Neuberger A, Peles S, Rittel D. 2007 Scaling the response of circular plates subjected to largeand close-range spherical explosions. I. Air-blast loading. Int. J. Impact Eng. 34, 859–873.(doi:10.1016/j.ijimpeng.2006.04.001)
3. Neuberger A, Peles S, Rittel D. 2007 Scaling the response of circular plates subjected tolarge and close-range spherical explosions. II. Buried charges. Int. J. Impact Eng. 34, 874–882.(doi:10.1016/j.ijimpeng.2006.04.002)
4. Menkes SB, Opat HJ. 1973 Tearing and shear failure in explosively loaded clamped beams.Exp. Mech. 13, 480–486. (doi:10.1007/BF02322734)
5. Nurick GN, Martin JB. 1989 Deformation of thin plates subject to impulsive loading: a review.Part II: Experimental studies. Int. J. Impact Eng. 8, 159–186. (doi:10.1016/0734-743X(89)90014-6)
6. Olsson MD, Nurick GN, Fagnan JR. 1993 Deformation and rupture of blast loadedsquare plates: predictions and experiments. Int. J. Impact Eng. 13, 279–291. (doi:10.1016/0734-743X(93)90097-Q)
7. Nurick GN, Gelman ME, Marshall NS. 1996 Tearing of blast loaded plates with clampedboundary conditions. Int. J. Impact Eng. 18, 803–827. (doi:10.1016/S0734-743X(96)00026-7)
8. Langdon GS, Cantwell WJ, Nurick GN. 2005 The blast response of novel thermoplastic-basedfibre–metal laminates: some preliminary results and observations. Compos. Sci. Technol. 65,861–872. (doi:10.1016/j.compscitech.2004.09.025)
9. Langdon GS, Lemanski SL, Nurick GN, Simmons MC, Cantwell WJ, Schleyer GK. 2007Behaviour of fibre–metal laminates subjected to localised blast loading. I. Experimentalobservations and failure analysis. Int. J. Impact Eng. 34, 1202–1222. (doi:10.1016/j.ijimpeng.2006.05.008)
10. Lemanski SL, Nurick GN, Langdon GS, Simmons MC, Cantwell WJ, Schleyer GK. 2007Behaviour of fibre–metal laminates subjected to localised blast loading. II. Quantitativeobservations. Int. J. Impact Eng. 34, 1223–1245. (doi:10.1016/j.ijimpeng.2006.05.009)
11. Mouritz A. 2001 Ballistic impact and explosive blast resistance of stitched composites. Compos.B, Eng. 32, 901–910. (doi:10.1016/S1359-8368(01)00015-4)
12. Tekalur SA, Shukla A, Shivakumar K. 2009 Blast resistance of polyurea based layeredcomposite materials. Compos. Struct. 84, 271–281. (doi:10.1016/j.compstruct.2007.08.008)
13. Tekalur SA, Shivakumar K, Shukla A. 2008 Mechanical behavior and damage evolution inE-glass vinyl ester and carbon composites subjected to static and blast loads. Compos. B, Eng.39, 57–65. (doi:10.1016/j.compositesb.2007.02.020)
14. Tekalur SA, Bogdanovich AE, Shukla A. 2009 Shock loading response of sandwich panels with3-D woven E-glass composite skins and stitched foam core. Compos. Sci. Technol. 69, 736–753.(doi:10.1016/j.compscitech.2008.03.017)
15. Arora H, Hooper PA, Dear JP. 2012 The effects of air and underwater blast on compositesandwich panels and tubular laminate structures. Exp. Mech. 52, 59–81. (doi:10.1007/s11340-011-9506-z)
16. Wang E, Gardner N, Shukla A. 2009 The blast resistance of sandwich composites withstepwise graded cores. Int. J. Solids Struct. 46, 3492–3502. (doi:10.1016/j.ijsolstr.2009.06.004)
17. Gardner N, Wang E, Kumar P, Shukla A. 2011 Blast mitigation in a sandwich composite usinggraded core and polyurea interlayer. Exp. Mech. 52, 119–133. (doi:10.1007/s11340-011-9517-9)
18. Gardner N, Wang E, Shukla A. 2012 Performance of functionally graded sandwichcomposite beams under shock wave loading. Compos. Struct. 95, 1755–1770. (doi:10.1016/j.compstruct.2011.12.006)
19. Wang E, Shukla A. 2011 Blast performance of sandwich composites with in-plane compressiveloading. Exp. Mech. 52, 1–10.
on June 4, 2018http://rsta.royalsocietypublishing.org/Downloaded from
27
rsta.royalsocietypublishing.orgPhil.Trans.R.Soc.A372:20130212
.........................................................
20. Arora H, Hooper PA, Dear JP. 2011 Dynamic response of full-scale sandwich compositestructures subject to air-blast loading. Compos. A, Appl. Sci. Manuf. 42, 1651–1662. (doi:10.1016/j.compositesa.2011.07.018)
21. Arora H, Hooper PA, Del Linz P, Yang H, Chen S, Dear JP. 2012 Modelling the behaviour ofcomposite sandwich structures when subject to air blast loading. Int. J. Multiphys. 6, 199–218.(doi:10.1260/1750-9548.6.3.199)
22. Caprino G, Teti R. 1994 Impact and post-impact behavior of foam core sandwich structures.Compos. Struct. 29, 47–55. (doi:10.1016/0263-8223(94)90035-3)
23. Bull PH, Edgren F. 2004 Compressive strength after impact of CFRP–foam coresandwich panels in marine applications. Compos. B, Eng. 35, 535–541. (doi:10.1016/j.compositesb.2003.11.007)
24. Shipsha A, Zenkert D. 2005 Compression-after-impact strength of sandwich panels with corecrushing damage. Appl. Compos. Mater. 12, 149–164. (doi:10.1007/s10443-005-1119-1)
25. Lacy TE, Hwang Y. 2003 Numerical modeling of impact-damaged sandwich compositessubjected to compression-after-impact loading. Compos. Struct. 61, 115–128. (doi:10.1016/S0263-8223(03)00034-5)
26. Davies GAO, Hitchings D, Besant T, Clarke A, Morgan C. 2004 Compression afterimpact strength of composite sandwich panels. Compos. Struct. 63, 1–9. (doi:10.1016/S0263-8223(03)00119-3)
27. Xie Z, Vizzini AJ, Yang M. 2005 On residual compressive strength predictionof composite sandwich panels after low-velocity impact damage. In SandwichStructures 7: Advancing with sandwich structures and materials (Proc. 7th Int. Conf. onSandwich Structures, Aalborg University, Denmark, 29–31 August) (eds OT Thomsen, EBozhevolnaya, A Lyckegaard), pp. 363–372. Dordrecht, The Netherlands: Springer. Seehttp://link.springer.com/chapter/10.1007/1-4020-3848-8_36.
28. Shipsha A, Hallström S, Zenkert D. 2003 Failure mechanisms and modelling of impactdamage in sandwich beams—a 2D approach: Part I—Experimental investigation. J. Sandw.Struct. Mater. 5, 7–31. (doi:10.1177/1099636203005001584)
29. Gurit. 2013 Material data sheets. See http://www.gurit.com/datasheets-and-downloads.aspx.30. Hopkinson B. 1915 British Ordnance Board Minutes 13565.31. Cranz C. 1926 Lehrbuch der Ballistik. Berlin, Germany: Springer.32. LaVision. 2013 StrainMaster. See http://www.lavision.de/en/products/strainmaster-dic.php.33. GOM mbH. 2013 ARAMIS. See http://www.gom.com/3d-software/aramis-software.html.
‘
on June 4, 2018http://rsta.royalsocietypublishing.org/Downloaded from