molson coors brewing COORS_AR2002
98
ADOLPH COORS COMPANY 1 ADOLPH COORS COMPANY 1 ADOLPH COORS COMPANY 1 ADOLPH COORS COMPANY 1 ADOLPH COORS COMPANY 1 Adolph Coors Company 2002 Annual Report To be the BEST
-
Upload
finance46 -
Category
Economy & Finance
-
view
507 -
download
0
Transcript of molson coors brewing COORS_AR2002

A D O L P H C O O R S C O M P A N Y 1A D O L P H C O O R S C O M P A N Y 1A D O L P H C O O R S C O M P A N Y 1A D O L P H C O O R S C O M P A N Y 1A D O L P H C O O R S C O M P A N Y 1
Adolph Coors Company 2002 Annual Report
To be the
BEST
Adolph Coors CompanyGolden, Colorado 80401
(303) 279-6565www.coors.com
Adolph C
oors Com
pany2002 A
nnual Report
It’s like a long climb up a tall anddifficult mountain. It’s exhilarating,but it’s hard work that requiresabsolute focus.
The climb accelerated as we trans-formed Coors in several importantways in 2002. Our acquisition ofone of the U.K.’s largest beer busi-nesses dramatically increased our scale, breadth and potential.A completely new U.S. advertisingapproach launched a renewed driveto strengthen Coors Light and otherbrands. And throughout the organ-ization, we made dramatic strides in productivity improvement andcost reduction.
Even with our transformation, westill have a long way to go in ourclimb to be the best. But look how far we’ve come, just in 2002.
To be the BESTin the beer business.
A D O L P H C O O R S C O M P A N Y A N D S U B S I D I A R I E S 95
Investor Information
Annual Informational Meeting for Shareholders
The Company will hold its Annual Informational Meeting for
Shareholders starting at 2:00 p.m. on Thursday, August 14,
2003, in the Sixth-floor Auditorium, located in the Brewery
Office Complex, Coors Brewing Company, Golden, Colorado.
Shareholder Relations
Questions about stock ownership and dividends
should be directed to Kay Guthrie in Shareholder Relations,
(303) 277-7759. Shareholders may obtain a copy of the
Company’s 2002 Annual Report on Form 10-K filed with
the Securities and Exchange Commission by visiting our
Web site, www.coors.com; writing to the Coors Consumer
Information Center, Mail No. NH475, Adolph Coors Company,
P.O. Box 4030, Golden, Colorado 80401; or by calling
(800) 642-6116.
Investor Relations
Securities analysts, investment professionals and share-
holders with business-related inquiries regarding Adolph
Coors Company should contact Dave Dunnewald or Kevin
Caulfield in Investor Relations, (303) 279-6565.
For the latest copy of the Company’s annual report to
shareholders, visit the “Invest In Us” section of our Web site,
www.coors.com; write to the Coors Consumer Information
Center, Mail No. NH475, Adolph Coors Company, P.O. Box 4030,
Golden, Colorado 80401; or call (800) 642-6116.
Customer/News Media Relations
Customers are invited to call our Consumer Information Center,
(800) 642-6116, or access our Web site, www.coors.com, for
information about the Company and our products.
The news media should direct questions to Corporate
Communications, (303) 277-2555.
The Company is pleased to offer specific information to the
public regarding the Company’s financial, environmental and
social performance, as well as other areas of interest. For
example, interested individuals can obtain the Coors Brewing
Company Environmental, Health and Safety Progress Report
or Corporate Social Performance briefings on a wide range of
topics of interest to our customers, investors, neighbors and
other stakeholders. Simply visit our Web site, www.coors.com.
Transfer Agent
EquiServe Trust Company, N.A., Shareholder Services,
150 Royall Street, Canton, Massachusetts 02021,
(781) 575-3400.
Stock Information
Adolph Coors Company Class B common stock is traded
on the New York Stock Exchange and is listed under the
ticker symbol “RKY.” Daily stock prices are listed in major
newspapers, generally alphabetically under “Coors B.”
Dividends on common stock have historically been paid
in the months of March, June, September and December to
shareholders of record on the last day of the preceding month.
Shareholders of record as of February 28, 2003: 2,963.
Class B common shares outstanding as of February 28,
2003: 35,081,353.
The range of the high and low quotations and the divi-
dends paid per share for each quarter of the past two years
are shown in the following tables:
2002 High Low Dividends
First Quarter 67.47 51.92 $0.205
Second Quarter 68.76 59.34 $0.205
Third Quarter 64.18 51.40 $0.205
Fourth Quarter 69.66 56.30 $0.205
2001 High Low Dividends
First Quarter 78.25 61.38 $0.185
Second Quarter 67.11 49.39 $0.205
Third Quarter 52.40 43.59 $0.205
Fourth Quarter 59.27 43.83 $0.205
In February, the Company declared a quarterly dividend
of 20.5 cents per share, which was paid March 17, 2003, to
shareholders of record February 28, 2003.
Equal Opportunity at Coors
Coors employs 8,700 people worldwide, which includes 3,000
employees of Coors Brewers Limited in the United Kingdom,
and maintains a long-standing commitment to equal opportu-
nity in the areas of employment, promotion and purchasing.
We enthusiastically support Coors Brewing Company’s policy,
which prohibits discrimination on the basis of race, color,
national origin, sexual orientation, religion, disability, veteran
status, gender or age.
Des
ign:
Bol
ler,
Coa
tes
& N
eu
Writ
ing:
Dov
etai
l Com
mun
icat
ions
P
rintin
g: L
ake
Cou
nty
Pres
s
This report is printed on recycled paper.

2 A D O L P H C O O R S C O M P A N Y
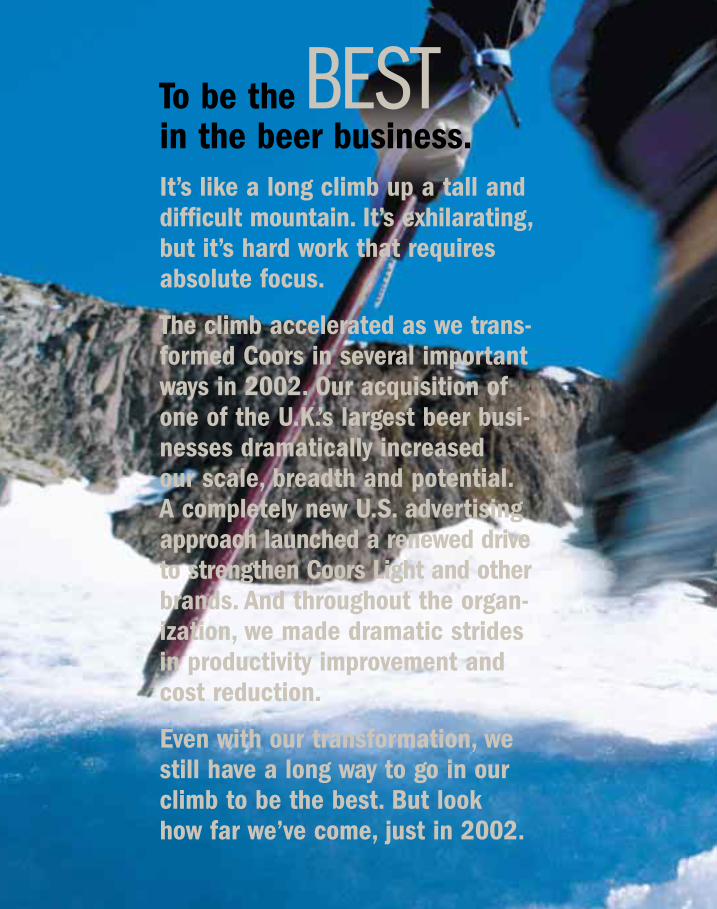
Base camp in the climb to be the best: brewinggreat beers. It all startswith what goes in the can,bottle and keg.
A D O L P H C O O R S C O M P A N Y 3
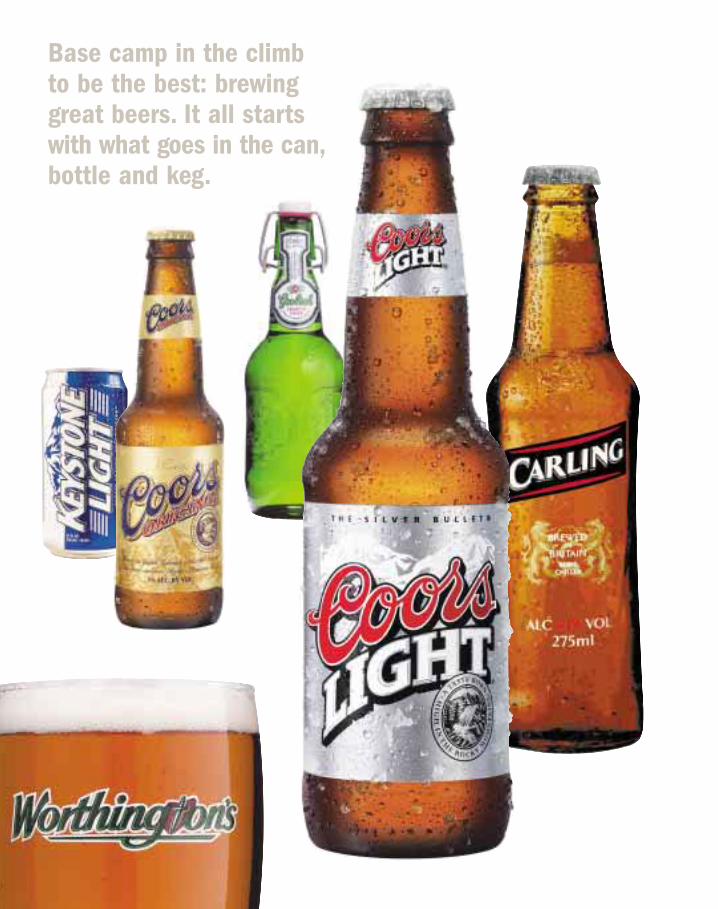
Our relationship with Canada’s oldestbrewer, Molson, bringsa great Canadiantaste to our U.S. port-folio and has helpedmake Coors LightCanada’s best-sellinglight beer.
Doing great beer has always been our pas-
sion. Coors Light, one of America’s favorite
light beers, Coors Original, George Killian’s
Irish Red, Zima, Keystone, Blue Moon, Extra
Gold and Coors NA all represent a great brew-
ing tradition born in the Rockies – cold, crisp
refreshment for every taste.
The Coors Brewers Limited (CBL) acquisi-
tion brought us market leadership across the
Atlantic with Carling, the U.K.’s best-selling
beer; Grolsch, the U.K.’s fastest-growing major
premium lager; Worthington’s, a traditional ale
served in more than 17,000 pubs; Caffrey’s,
the U.K.’s number-one premium ale; and Reef,
a flavored alcohol beverage.
But great beer is just the start. To be the
best, you need innovative marketing, disciplined
operations and, most of all, talented, engaged
people. That’s what Coors is all about.

BUILDINGTo be the best at
BRANDS
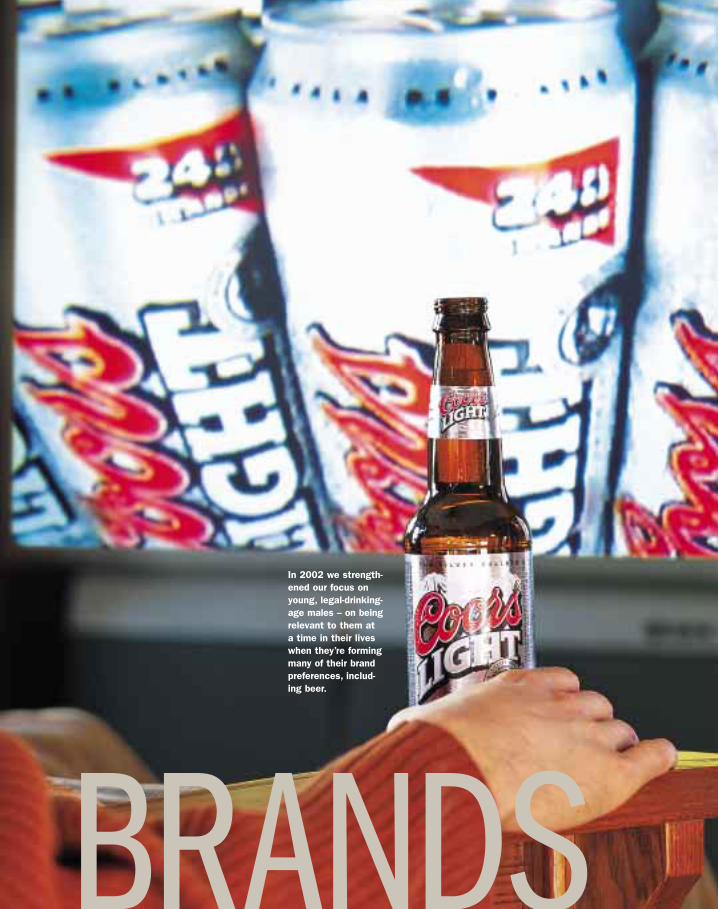
In 2002 we strength-ened our focus onyoung, legal-drinking-age males – on beingrelevant to them at a time in their liveswhen they’re formingmany of their brandpreferences, includ-ing beer.
6 A D O L P H C O O R S C O M P A N Y
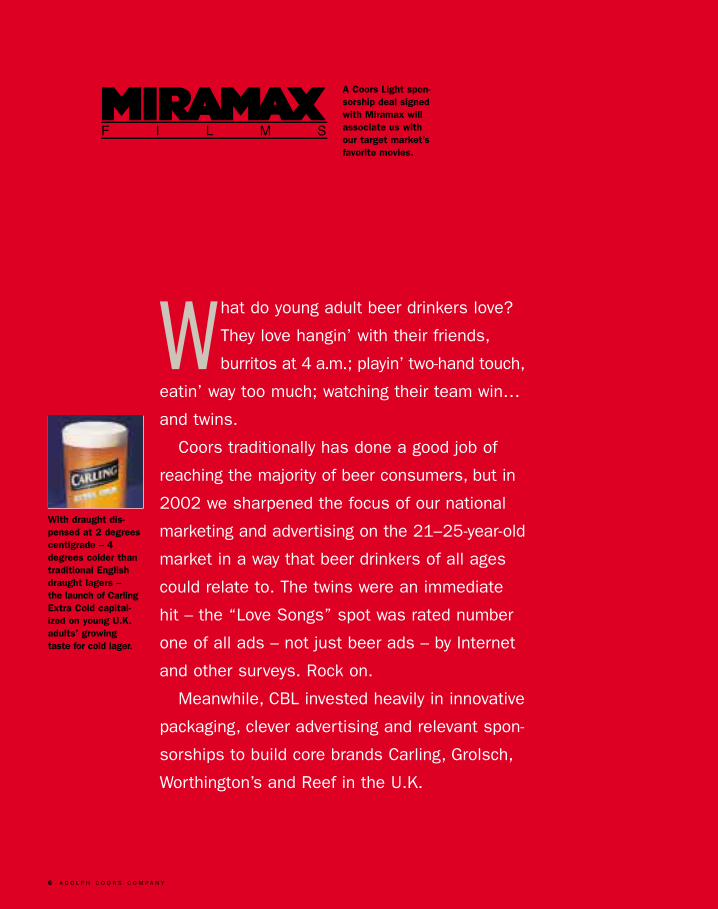
What do young adult beer drinkers love?
They love hangin’ with their friends,
burritos at 4 a.m.; playin’ two-hand touch,
eatin’ way too much; watching their team win…
and twins.
Coors traditionally has done a good job of
reaching the majority of beer consumers, but in
2002 we sharpened the focus of our national
marketing and advertising on the 21–25-year-old
market in a way that beer drinkers of all ages
could relate to. The twins were an immediate
hit – the “Love Songs” spot was rated number
one of all ads – not just beer ads – by Internet
and other surveys. Rock on.
Meanwhile, CBL invested heavily in innovative
packaging, clever advertising and relevant spon-
sorships to build core brands Carling, Grolsch,
Worthington’s and Reef in the U.K.
With draught dis-pensed at 2 degreescentigrade – 4degrees colder thantraditional Englishdraught lagers – the launch of CarlingExtra Cold capital-ized on young U.K.adults’ growing taste for cold lager.
A Coors Light spon-sorship deal signedwith Miramax willassociate us withour target market’sfavorite movies.
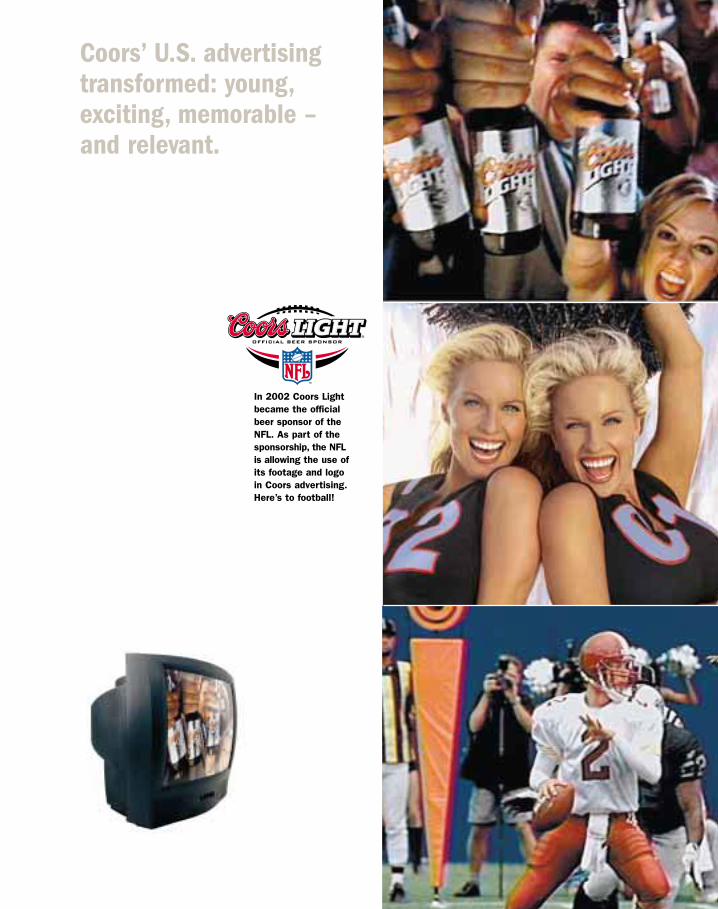
Coors’ U.S. advertisingtransformed: young,exciting, memorable – and relevant.
In 2002 Coors Lightbecame the officialbeer sponsor of theNFL. As part of thesponsorship, the NFLis allowing the use ofits footage and logoin Coors advertising.Here’s to football!

BUILDINGTo be the best at
MARKETS
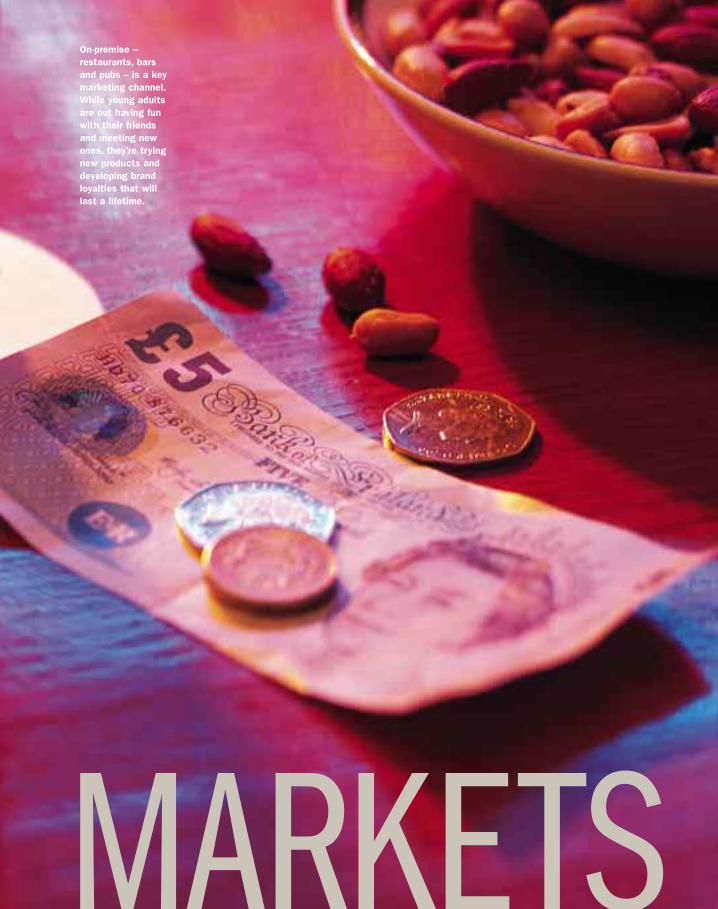
On-premise – restaurants, barsand pubs – is a keymarketing channel.While young adultsare out having funwith their friendsand meeting newones, they’re tryingnew products anddeveloping brand loyalties that willlast a lifetime.
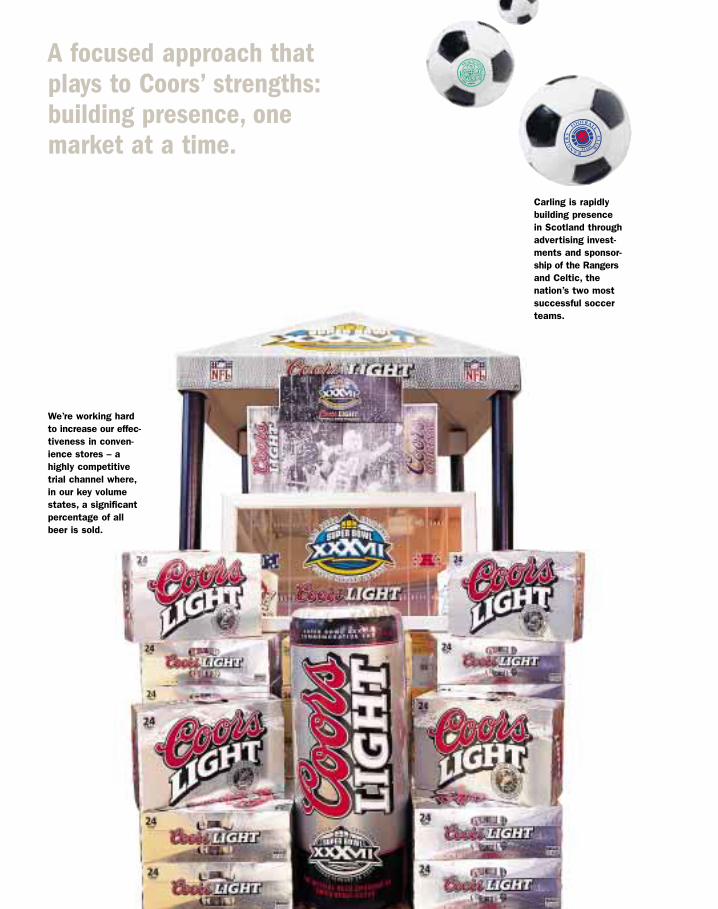
A focused approach thatplays to Coors’ strengths:building presence, onemarket at a time.
Carling is rapidlybuilding presence in Scotland throughadvertising invest-ments and sponsor-ship of the Rangersand Celtic, thenation’s two mostsuccessful soccerteams.
We’re working hardto increase our effec-tiveness in conven-ience stores – ahighly competitivetrial channel where,in our key volumestates, a significantpercentage of allbeer is sold.
Coors Light’s sponsorship of theGrammy-winningLatino band Maná isjust one aspect ofour comprehensiveand multifacetedcommitment to theHispanic market.
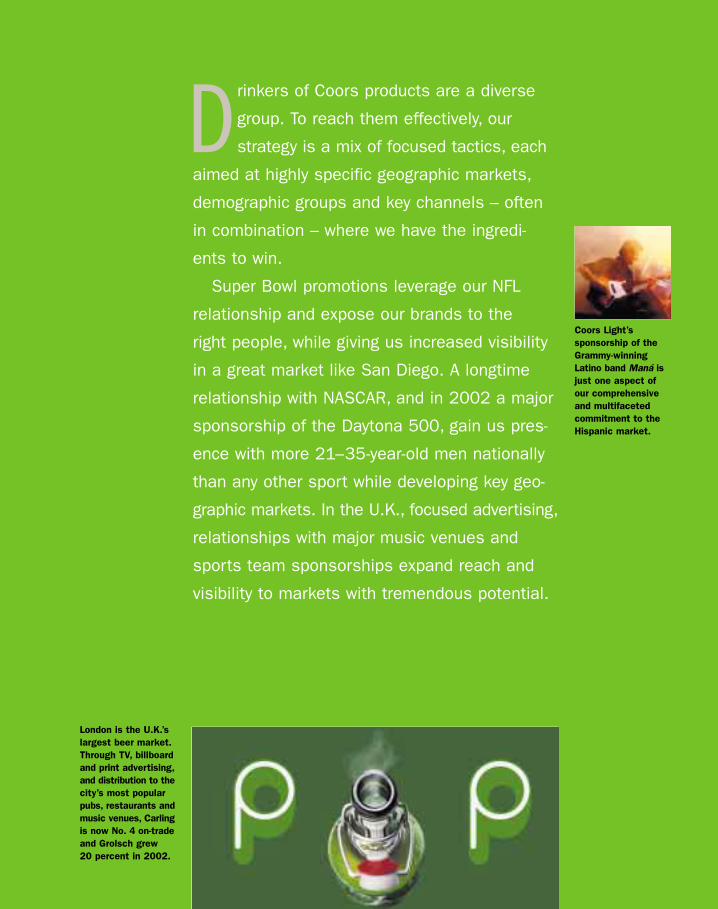
Drinkers of Coors products are a diverse
group. To reach them effectively, our
strategy is a mix of focused tactics, each
aimed at highly specific geographic markets,
demographic groups and key channels – often
in combination – where we have the ingredi-
ents to win.
Super Bowl promotions leverage our NFL
relationship and expose our brands to the
right people, while giving us increased visibility
in a great market like San Diego. A longtime
relationship with NASCAR, and in 2002 a major
sponsorship of the Daytona 500, gain us pres-
ence with more 21–35-year-old men nationally
than any other sport while developing key geo-
graphic markets. In the U.K., focused advertising,
relationships with major music venues and
sports team sponsorships expand reach and
visibility to markets with tremendous potential.
London is the U.K.’slargest beer market.Through TV, billboardand print advertising,and distribution to thecity’s most popularpubs, restaurants andmusic venues, Carlingis now No. 4 on-tradeand Grolsch grew 20 percent in 2002.
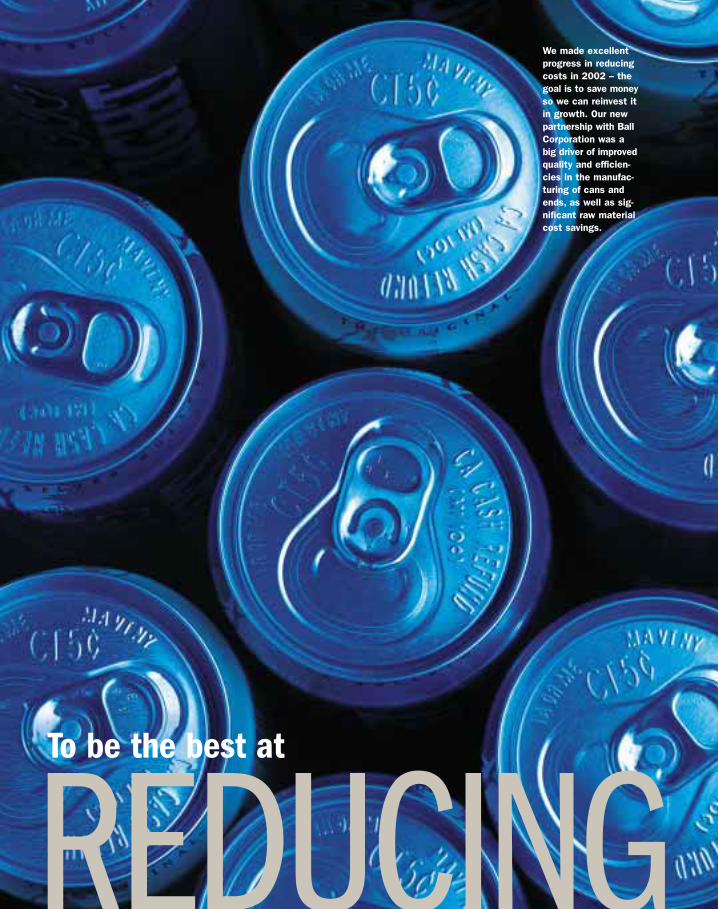
REDUCINGTo be the best at
We made excellentprogress in reducingcosts in 2002 – thegoal is to save moneyso we can reinvest itin growth. Our newpartnership with BallCorporation was abig driver of improvedquality and efficien-cies in the manufac-turing of cans andends, as well as sig-nificant raw materialcost savings.

COSTS
14 A D O L P H C O O R S C O M P A N Y
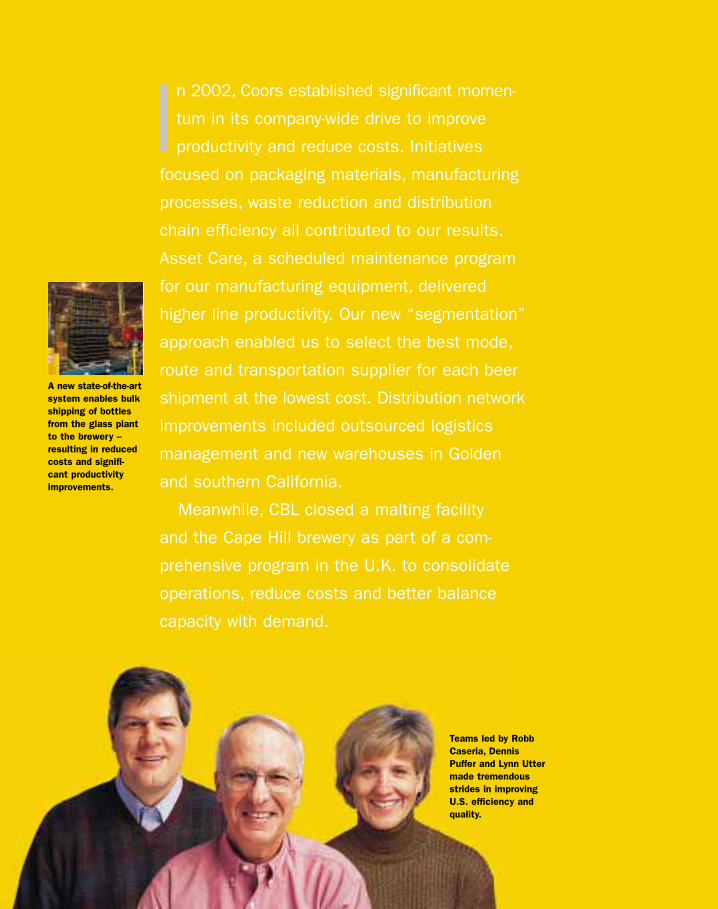
In 2002, Coors established significant momen-
tum in its company-wide drive to improve
productivity and reduce costs. Initiatives
focused on packaging materials, manufacturing
processes, waste reduction and distribution
chain efficiency all contributed to our results.
Asset Care, a scheduled maintenance program
for our manufacturing equipment, delivered
higher line productivity. Our new “segmentation”
approach enabled us to select the best mode,
route and transportation supplier for each beer
shipment at the lowest cost. Distribution network
improvements included outsourced logistics
management and new warehouses in Golden
and southern California.
Meanwhile, CBL closed a malting facility
and the Cape Hill brewery as part of a com-
prehensive program in the U.K. to consolidate
operations, reduce costs and better balance
capacity with demand.
A new state-of-the-artsystem enables bulkshipping of bottlesfrom the glass plantto the brewery –resulting in reducedcosts and signifi-cant productivityimprovements.
Teams led by RobbCaseria, DennisPuffer and Lynn Uttermade tremendousstrides in improvingU.S. efficiency andquality.
A D O L P H C O O R S C O M P A N Y 15
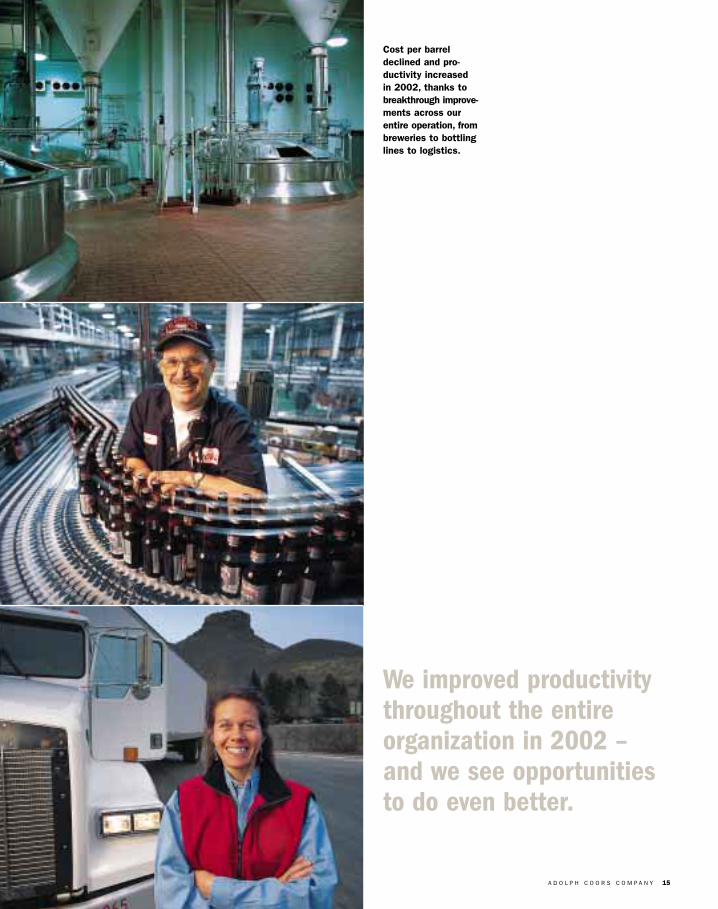
We improved productivitythroughout the entireorganization in 2002 –and we see opportunitiesto do even better.
Cost per barreldeclined and pro-ductivity increasedin 2002, thanks tobreakthrough improve-ments across ourentire operation, frombreweries to bottlinglines to logistics.

A COORSTo be the best:

CULTURE
Here at Coors,we build a winningculture by living our enduring valuesevery single day –integrity, quality,excelling, creativityand passion. Coorspeople are talented,honest, dedicatedand diverse teamplayers. A key man-agement priority is to continue todevelop, engage and inspire them.
18 A D O L P H C O O R S C O M P A N Y
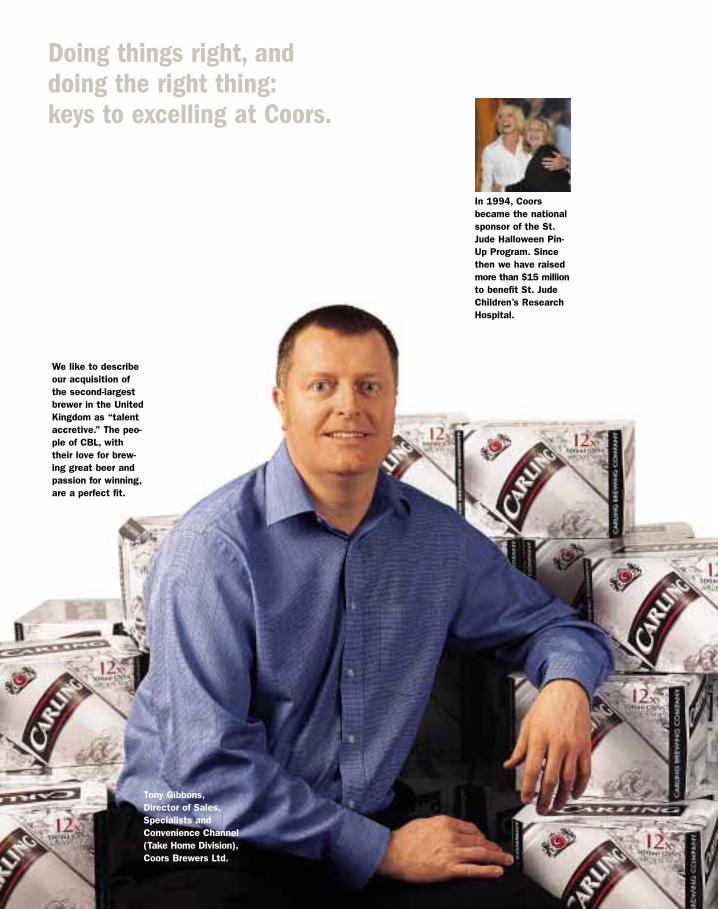
In 1994, Coorsbecame the nationalsponsor of the St.Jude Halloween Pin-Up Program. Sincethen we have raisedmore than $15 millionto benefit St. JudeChildren’s ResearchHospital.
Doing things right, anddoing the right thing: keys to excelling at Coors.
We like to describeour acquisition ofthe second-largestbrewer in the UnitedKingdom as “talentaccretive.” The peo-ple of CBL, with their love for brew-ing great beer andpassion for winning,are a perfect fit.
Tony Gibbons,Director of Sales,Specialists andConvenience Channel(Take Home Division),Coors Brewers Ltd.
A D O L P H C O O R S C O M P A N Y 19
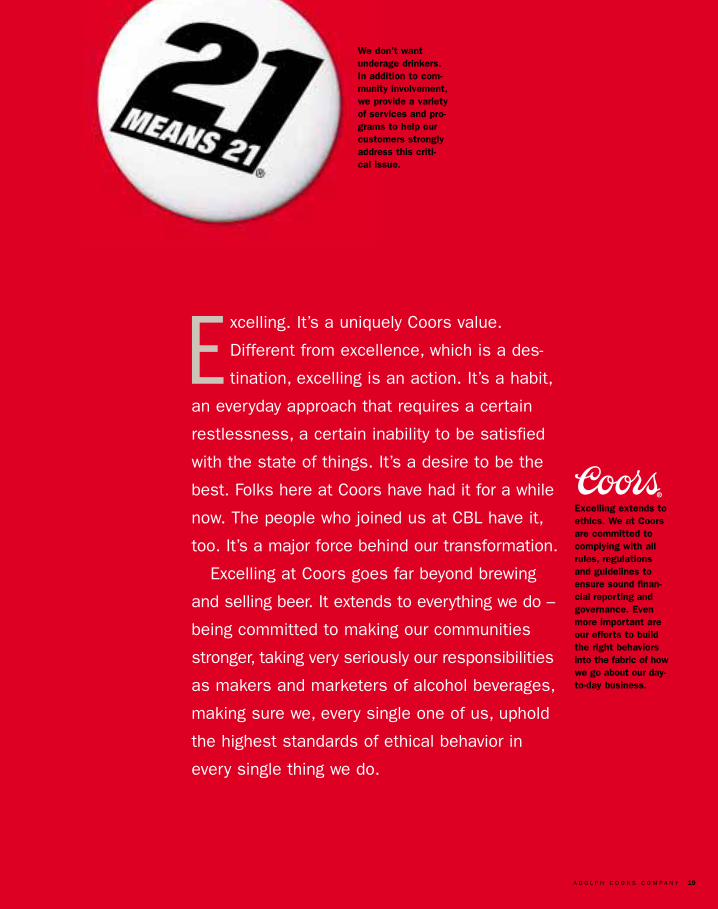
Excelling extends toethics. We at Coorsare committed tocomplying with allrules, regulationsand guidelines toensure sound finan-cial reporting andgovernance. Evenmore important areour efforts to buildthe right behaviorsinto the fabric of howwe go about our day-to-day business.
E xcelling. It’s a uniquely Coors value.
Different from excellence, which is a des-
tination, excelling is an action. It’s a habit,
an everyday approach that requires a certain
restlessness, a certain inability to be satisfied
with the state of things. It’s a desire to be the
best. Folks here at Coors have had it for a while
now. The people who joined us at CBL have it,
too. It’s a major force behind our transformation.
Excelling at Coors goes far beyond brewing
and selling beer. It extends to everything we do –
being committed to making our communities
stronger, taking very seriously our responsibilities
as makers and marketers of alcohol beverages,
making sure we, every single one of us, uphold
the highest standards of ethical behavior in
every single thing we do.
We don’t want underage drinkers. In addition to com-munity involvement,we provide a varietyof services and pro-grams to help ourcustomers stronglyaddress this criti-cal issue.
20 A D O L P H C O O R S C O M P A N Y A N D S U B S I D I A R I E S
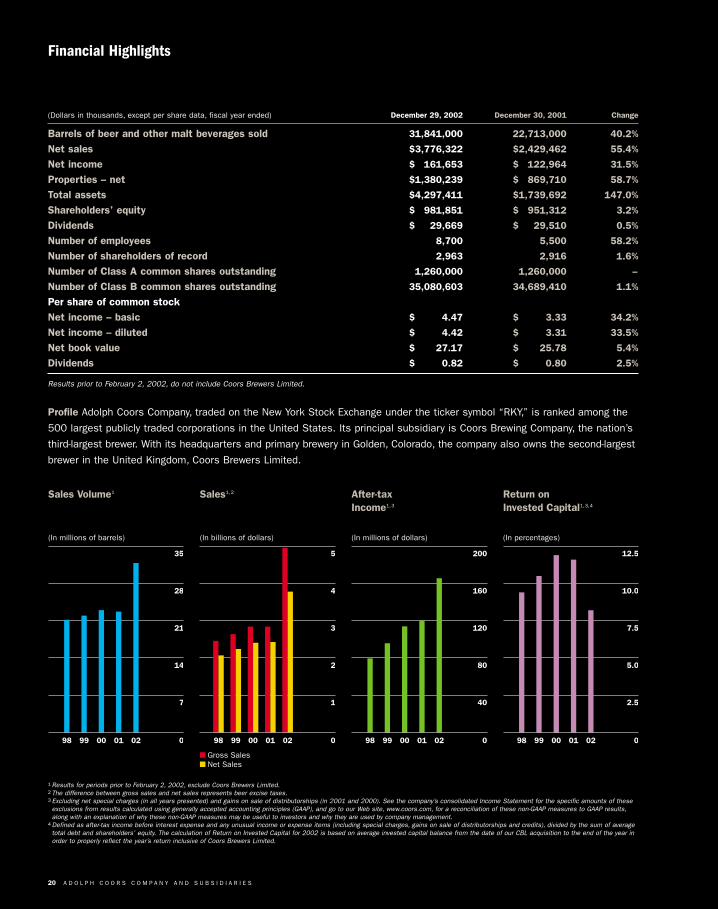
(Dollars in thousands, except per share data, fiscal year ended) December 29, 2002 December 30, 2001 Change
Barrels of beer and other malt beverages sold 31,841,000 22,713,000 40.2%
Net sales $3,776,322 $2,429,462 55.4%
Net income $÷«161,653 $«««122,964 31.5%
Properties – net $1,380,239 $«««869,710 58.7%
Total assets $4,297,411 $1,739,692 147.0%
Shareholders’ equity $÷«981,851 $«««951,312 3.2%
Dividends $÷÷«29,669 $«««««29,510 0.5%
Number of employees 8,700 5,500 58.2%
Number of shareholders of record 2,963 2,916 1.6%
Number of Class A common shares outstanding 1,260,000 1,260,000 –
Number of Class B common shares outstanding 35,080,603 34,689,410 1.1%
Per share of common stockNet income – basic $÷÷÷÷«4.47 $÷÷÷«÷3.33 34.2%
Net income – diluted $÷÷÷÷«4.42 $÷÷÷«÷3.31 33.5%
Net book value $÷÷÷«27.17 $÷÷÷«25.78 5.4%
Dividends $÷÷÷«««0.82 $÷÷«÷÷0.80 2.5%
Results prior to February 2, 2002, do not include Coors Brewers Limited.
Financial Highlights
1 Results for periods prior to February 2, 2002, exclude Coors Brewers Limited.2 The difference between gross sales and net sales represents beer excise taxes.3 Excluding net special charges (in all years presented) and gains on sale of distributorships (in 2001 and 2000). See the company’s consolidated Income Statement for the specific amounts of theseexclusions from results calculated using generally accepted accounting principles (GAAP), and go to our Web site, www.coors.com, for a reconciliation of these non-GAAP measures to GAAP results,along with an explanation of why these non-GAAP measures may be useful to investors and why they are used by company management.
4 Defined as after-tax income before interest expense and any unusual income or expense items (including special charges, gains on sale of distributorships and credits), divided by the sum of averagetotal debt and shareholders’ equity. The calculation of Return on Invested Capital for 2002 is based on average invested capital balance from the date of our CBL acquisition to the end of the year inorder to properly reflect the year’s return inclusive of Coors Brewers Limited.
Profile Adolph Coors Company, traded on the New York Stock Exchange under the ticker symbol “RKY,” is ranked among the
500 largest publicly traded corporations in the United States. Its principal subsidiary is Coors Brewing Company, the nation’s
third-largest brewer. With its headquarters and primary brewery in Golden, Colorado, the company also owns the second-largest
brewer in the United Kingdom, Coors Brewers Limited.
Sales Volume1
(In millions of barrels)
98 99 00 01 02
35
28
21
14
7
0
Sales1,2
(In billions of dollars)
98 99 00 01 02
5
4
3
2
1
0
� Gross Sales� Net Sales
After-taxIncome1,3
(In millions of dollars)
98 99 00 01 02
200
160
120
80
40
0
Return on Invested Capital1,3,4
(In percentages)
98 99 00 01 02
12.5
10.0
7.5
5.0
2.5
0
A D O L P H C O O R S C O M P A N Y 21
W e successfully completed the acquisition and transition of the U.K.’s
number-two brewer, giving us a very strong team and a portfolio of
leading brands in that market, while significantly increasing the size
and breadth of our overall business. We revitalized our U.S. advertising with
an exciting new campaign and important new sales and marketing partner-
ships. Our ongoing efforts to improve our cost structure and productivity
gained momentum and delivered significant results.
One thing hasn’t been transformed: our vision. In fact, the major accomplish-
ments of the year were a logical extension of what we’ve been striving to do for
some time now. Our focus on the fundamentals of the beer business. Our vision
and values. The commitment of our people to successfully execute these fun-
damentals and strategic planks is what made our progress in 2002 possible.
That said, we didn’t grow the way we wanted to in 2002 in our Americas
segment. We operated in a continued difficult economic and industry environ-
ment, with challenges in both our business segments. Americas volume was
up only slightly, and some of our brands declined, particularly Zima and Killian’s.
In Puerto Rico, Coors Light suffered a one-two punch with a tough economy
and an even tougher 50 percent excise tax increase.
Nonetheless, we achieved many of our goals in 2002:
• A year later, it was clear that in Coors Brewers Limited (CBL) we had acquired
a great and growing business at an attractive price. The transaction added
to our talent and, even after financing costs, to our profitability.
• U.S. operations made significant progress toward our goal of reducing costs
and improving our capabilities, while our U.K. business continued to bring its
capacity in line with demand.
• Across the business, we were able to invest heavily in our big brands and
still deliver significant profit growth.
• We launched exciting new advertising in the United States, and we became
the official beer sponsor of the National Football League.
• Our relationship with Molson stepped up another level. Our Canadian Coors
Light business delivered double-digit growth both in volume and pretax profit,
and we grew Molson USA volume after years of declines.
To Our Shareholders
Transformational. This is a wordyou’ll hear around here when wetalk about 2002. Without ques-tion, it was a year of dramaticprogress for Coors.
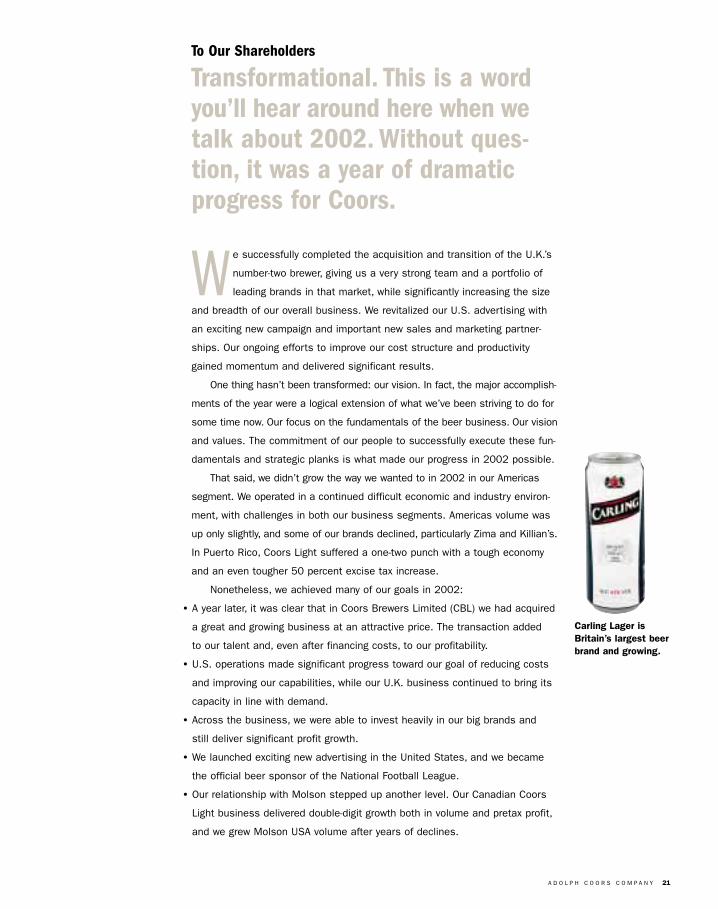
Carling Lager isBritain’s largest beerbrand and growing.
22 A D O L P H C O O R S C O M P A N Y
2002 Financial Results
For the total company, 2002 unit volume was 31.8 million U.S. barrels,
22.7 million of which was from the Americas, and 9.2 million from Europe.
Gross sales totaled nearly $5 billion for the year, with net sales of $3.8 bil-
lion. Thanks primarily to the attractive purchase price of our U.K. acquisition,
we delivered substantial profit growth in 2002. Operating income grew 97 per-
cent to $298 million, net income grew 32 percent, and diluted earnings per
share increased 34 percent compared with 2001. Results for all periods prior
to February 2, 2002, exclude CBL.
In the Americas, sales volume increased 0.1 percent in 2002 versus the
previous year, negatively impacted by declines in Zima, Killian’s and Coors
Light export to Puerto Rico. Excluding Zima and Coors Light export, our U.S.
domestic beer volume was up approximately 1.7 percent. Coors Original
declined only slightly during 2002, which was encouraging in a tough year.
Even in a weak economy, the U.S. pricing environment remained steady
during the year. In Canada, Coors Light continued to achieve strong growth.
Our Molson USA joint venture halted a seven-year double-digit decline, deliver-
ing double-digit growth in its flagship Molson Canadian brand. Meanwhile,
U.S. operations succeeded in reducing costs per barrel substantially. These
and other factors contributed to our increasing gross margins by 1.6 per-
centage points and pretax income by 3.6 percent in the Americas segment.
Our Europe segment delivered low-single-digit volume growth in 2002,
compared with pro forma 2001. In a highly competitive environment, our U.K.
brands together gained another 0.4 percentage points of market share for
the year. Volume for Carling grew at mid-single-digit rates in both the on-trade
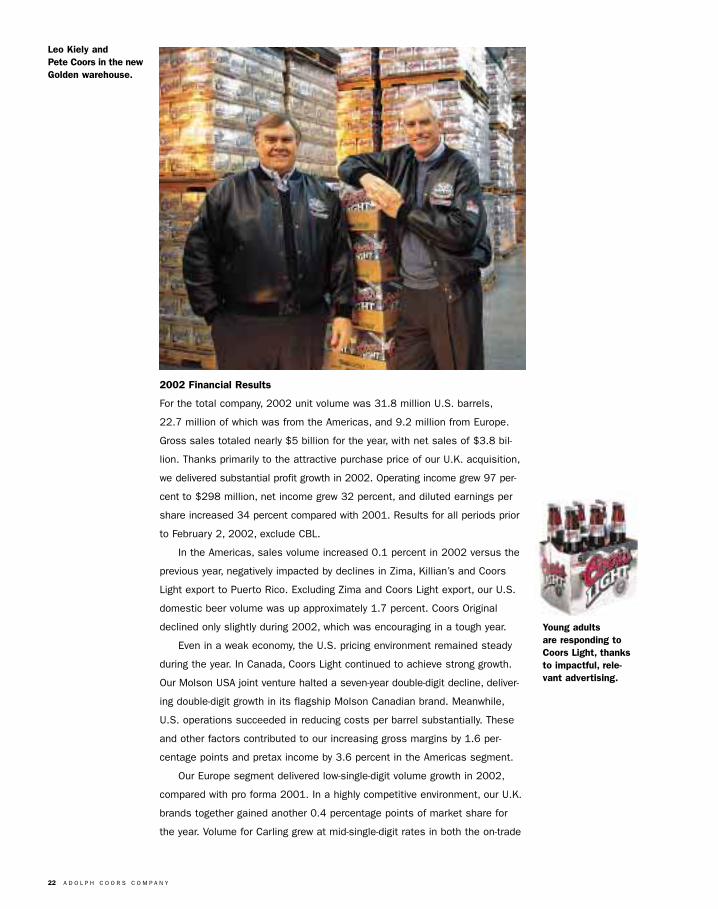
Leo Kiely and Pete Coors in the newGolden warehouse.
Young adults are responding toCoors Light, thanksto impactful, rele-vant advertising.
A D O L P H C O O R S C O M P A N Y 23
and off-trade channels during 2002, while Grolsch and Reef both grew more
than 20 percent during the year. Although Worthington’s volume fell about
3 percent, it gained market share in the declining mainstream ale segment.
As part of our program to reduce operations costs and better align
capacity with demand, our U.K. team closed the Alloa malting facility and the
Cape Hill brewery during the year. At the same time, we invested aggressively
in marketing our core brands both in established and in high-opportunity mar-
kets. Early results from our growth initiatives in Scotland and London are
very encouraging.
A Pause in the Climb, a Look Ahead
Sometimes events in the business world serve as a wake-up call, causing
companies to pause and evaluate how they do business. The misconduct
of a number of large publicly held U.S. corporations uncovered in early 2002
was just such a wake-up call. We are proud of our tradition of sound financial
and governance practices. Rest assured that it will continue.
We could not be more optimistic as we look to the future. We are imple-
menting dynamic U.S. marketing and advertising strategies that we are
convinced will drive positive results over time. We believe the new processes
and systems put in place across our operations will continue to reduce our
costs and increase productivity, and we see a number of additional areas for
substantial improvement in the future.
Our CBL business is very strong, with excellent prospects for both short-
and long-term volume and share growth. Equally important, the people who
joined us through the acquisition are skilled and committed, with a passion for
the beer business that we are proud and pleased to have at Coors. There is
no doubt in our minds that we are building the best team in the beer business.
To be the best. That’s the goal. Not the biggest… the best… at building
our brands, our markets, our business and our talent. It’s like climbing a moun-
tain, with varying slopes and unexpected challenges to overcome. As far as
we’ve climbed, we really feel that we are only just beginning to achieve our
potential. That’s what’s so exciting about being a part of Coors.
Thanks for the part you’ve all played in our success thus far.
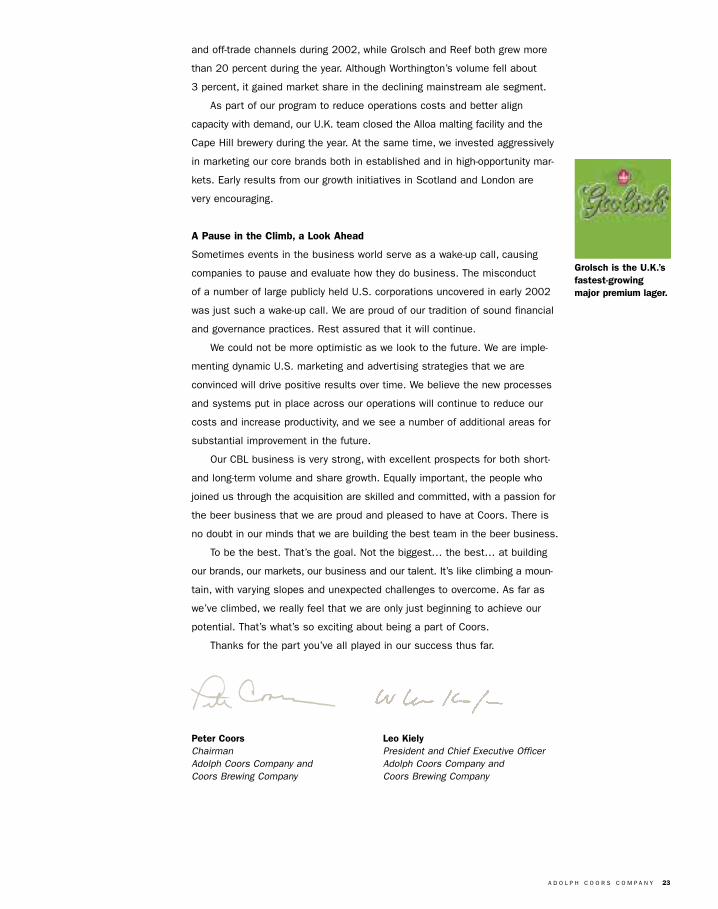
Grolsch is the U.K.’sfastest-growingmajor premium lager.
Peter Coors Leo KielyChairman President and Chief Executive OfficerAdolph Coors Company and Adolph Coors Company andCoors Brewing Company Coors Brewing Company
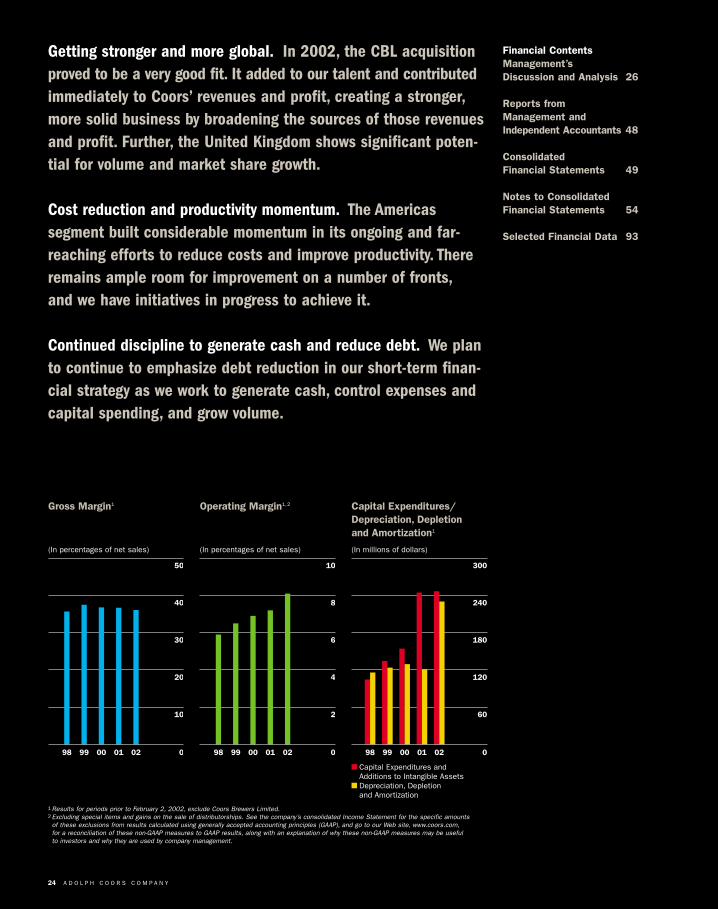
1 Results for periods prior to February 2, 2002, exclude Coors Brewers Limited.2 Excluding special items and gains on the sale of distributorships. See the company’s consolidated Income Statement for the specific amounts of these exclusions from results calculated using generally accepted accounting principles (GAAP), and go to our Web site, www.coors.com,for a reconciliation of these non-GAAP measures to GAAP results, along with an explanation of why these non-GAAP measures may be useful to investors and why they are used by company management.
Gross Margin1
(In percentages of net sales)
98 99 00 01 02
50
40
30
20
10
0
Operating Margin1,2
(In percentages of net sales)
98 99 00 01 02
10
8
6
4
2
0
Capital Expenditures/Depreciation, Depletion and Amortization1
(In millions of dollars)
98 99 00 01 02
300
240
180
120
60
0
� Capital Expenditures and Additions to Intangible Assets� Depreciation, Depletion and Amortization
24 A D O L P H C O O R S C O M P A N Y
Financial ContentsManagement’s Discussion and Analysis 26
Reports from Management andIndependent Accountants 48
Consolidated Financial Statements 49
Notes to Consolidated Financial Statements 54
Selected Financial Data 93
Getting stronger and more global. In 2002, the CBL acquisitionproved to be a very good fit. It added to our talent and contributedimmediately to Coors’ revenues and profit, creating a stronger,more solid business by broadening the sources of those revenuesand profit. Further, the United Kingdom shows significant poten-tial for volume and market share growth.
Cost reduction and productivity momentum. The Americas segment built considerable momentum in its ongoing and far-reaching efforts to reduce costs and improve productivity. Thereremains ample room for improvement on a number of fronts,and we have initiatives in progress to achieve it.
Continued discipline to generate cash and reduce debt. We planto continue to emphasize debt reduction in our short-term finan-cial strategy as we work to generate cash, control expenses andcapital spending, and grow volume.
A D O L P H C O O R S C O M P A N Y 25
Financial Performance Summary
Despite challenges, wetransformed Coors anddelivered strong financialperformance in 2002.
D uring 2002, a new Coors emerged: stronger, larger,
with a broader set of markets that give us more
diverse sources of sales, profit and cash flow; a new
advertising strategy and new marketing alliances, especially
with the NFL; all groups in our company focused and commit-
ted to reducing our costs per barrel; and a different capital
structure, challenging us to generate cash to reduce debt.
These changes reflect our goal to be a stronger, more
global brewer. They also brought new challenges: operating
a much larger business; translating great advertising into
volume growth; maintaining cost-reduction momentum;
reducing debt in a difficult industry and economic environ-
ment, particularly in the Americas.
While we are not satisfied with our U.S. volume –
and won’t be until we regain above-industry growth – we
performed well in other important areas. We repaid nearly
$210 million in debt in 2002, well ahead of our $190 million
goal. The CBL acquisition increased earnings by 27 percent
on a book basis and 37 percent on a cash basis. We retained
virtually all of CBL’s top management team, we grew share
significantly in nearly all our key U.K. brands and markets,
and we made significant progress in reducing costs and
improving efficiency.
Despite the tough Americas market, we grew pretax
profits by 3.6 percent, driven largely by our success in reduc-
ing costs of goods per barrel – the result of an ongoing and
far-reaching focus on productivity and cost reduction that
began in 2001 and developed momentum in 2002. In the
United States, our advertising began to show traction, as
reflected in significant increases in unaided awareness and
purchase intent – improvements we believe bode well for
volume growth in 2003.
To be sure, there are new challenges that we face in
2003, particularly in the first half of the year: a traditionally
slow January in the U.K., increased pension plan costs and
significant interest expense.
We face challenges every year, yet we have delivered
profit growth for the past seven years, operating in headwinds
at least as strong as what we see today. We will continue
to make meaningful cost reductions in 2003, including an
estimated $15 million from closing the Cape Hill brewery,
consolidating production in the U.K., and $8 million from
our recent restructuring in the United States. Other initia-
tives designed to improve line rates, reduce waste and lower
transportation costs are under way in our U.S. operations.
We will continue to focus on disciplined debt reduction.
We will work to generate incremental cash by selling non-core
assets and tightly managing working capital, while holding
capital spending at or slightly below 2002 levels. Most impor-
tantly, we will continue our intense focus on restoring volume
growth in the Americas – clearly the best way to increase
profit and generate cash.
We are prepared to attack challenges in 2003. In 2002,
we met the challenge of acquiring CBL, making it a key con-
tributor to Coors’ success. We will be no less focused and
energetic in 2003 in building our volume, reducing costs,
generating cash and, above all, continuing to build the best
team in the beer world.
Tim Wolf
Timothy V. WolfChief Financial Officer
26 A D O L P H C O O R S C O M P A N Y A N D S U B S I D I A R I E S
Introduction
We acquired the Carling business (subsequently renamed
CBL) in England and Wales from Interbrew S.A. on February 2,
2002. Since the acquisition was finalized in 2002, the oper-
ating results and financial position of CBL are not included
in our results discussed below for any period prior to the
acquisition. This acquisition had a significant impact on
our operating results and financial condition. CBL generated
sales volume of approximately 9.2 million barrels in 2002.
This acquisition was funded through cash and third-party
debt as reflected in our consolidated balance sheet. The bor-
rowings will have a significant impact on our capitalization,
interest coverage and cash flow trends. See further discus-
sion of this impact in the Liquidity and Capital Resources
section below.
Critical Accounting Policies
Management’s discussion and analysis of our financial condi-
tion and results of operations are based upon our consolidated
financial statements, which have been prepared in accor-
dance with accounting principles generally accepted in the
United States of America, or GAAP. We review the accounting
policies we use in reporting our financial results on an on-
going basis. The preparation of our consolidated financial
statements requires us to make estimates and judgments
that affect the reported amounts of assets, liabilities, rev-
enues and expenses, and related disclosures of contingent
assets and liabilities. In many cases, the accounting treat-
ment of a particular transaction is specifically dictated by
GAAP and does not require our judgment in an application.
There are also areas in which our judgment in selecting
among reasonable alternatives would not produce a materi-
ally different result. We base our estimates on historical
experience and on various other assumptions we believe to
be reasonable under the circumstances, the results of which
form the basis for making judgments about the carrying val-
ues of assets and liabilities that are not readily apparent
from other sources. By their nature, estimates are subject to
an inherent degree of uncertainty. Actual results may differ
materially from these estimates under different assumptions
or conditions. We have identified the policies below as criti-
cal to our financial condition and results of operations:
Allowance for doubtful accounts In the Americas segment,
our allowance for doubtful accounts and credit risk is insignifi-
cant as the majority of the Americas accounts receivable
balance is generated from sales to independent distributors
with whom we have a predetermined collection date arranged
through electronic funds transfer. Also, in the Americas, we
secure substantially all of our credit risk with purchase money
security interests in inventory and proceeds, personal guar-
antees and other letters of credit.
Because the majority of CBL sales are directly to retail
customers and, because of the policy of making trade loans
to customers, our ability to manage our credit risk in this
business is critical. At CBL, we provide allowances for trade
receivables and trade loans associated with the ability to col-
lect outstanding receivables from our customers. Generally,
provisions are recorded to cover the full exposure to a spe-
cific customer (total amount of all trade accounts and loans
from a specific customer less the amount of security and
insurance coverage) at the point the account is considered
uncollectible. We record the provision as a bad debt in gen-
eral and administrative expenses. Provisions are reversed
upon recoverability of the account or relieved at the point
an account is written off.
We are not able to predict changes in financial condition
of our customers and, if circumstances related to our cus-
tomers deteriorate, our estimates of the recoverability of our
trade receivables could be materially affected, and we may
be required to record additional allowances.
Pension and postretirement benefits CBC and its sub-
sidiaries have defined benefit plans that cover the majority
of employees. As a result of the acquisition of CBL, we have
assumed responsibility for a portion of the assets and liabili-
ties of what was the Bass Brewers Pension Plan, renamed
the Coors Brewers Pension Plan. CBC also has postretire-
ment plans that provide medical benefits and life insurance
for retirees and eligible dependents. The accounting for these
plans is subject to the guidance provided in Statement of
Financial Accounting Standards No. 87, Employers Accounting
for Pensions (SFAS No. 87), and Statement of Financial
Accounting Standards No. 106, Employers’ Accounting for
Postretirement Benefits Other than Pensions (SFAS No.
106). Both of these statements require that management
Management’s Discussion and Analysis ofFinancial Condition and Results of Operations
make certain assumptions relating to the long-term rate
of return on plan assets, discount rates used to measure
future obligations and expenses, salary scale inflation rates,
health care cost trend rates and other assumptions. We
believe that the accounting estimates related to our pension
and postretirement plans is a critical accounting estimate
because it is highly susceptible to change from period to
period based on the performance of plan assets, actuarial
valuations, and market conditions (for further explanation
of our assumptions and year-end financial results for these
plans, see Note 7, “Employee Retirement Plans,” and Note 8,
“Postretirement Benefits”).
Contingencies, environmental and litigation reserves
We estimate the range of liability related to environmental
matters or other legal actions where the amount and range
of loss can be estimated. We record our best estimate of
a loss when the loss is considered probable. As additional
information becomes available, we assess the potential lia-
bility related to our pending matter and revise our estimates.
Costs that extend the life, increase the capacity or improve
the safety or efficiency of company-owned assets or are
incurred to mitigate or prevent future environmental contam-
ination may be capitalized. Other environmental costs are
expensed when incurred. The most significant estimates
that could impact our financial statements relate to the
Lowry Superfund site.
Goodwill and other intangible asset valuation We adopted
the provisions of Statements of Financial Standards No. 141,
Business Combinations (SFAS No. 141), on July 1, 2001,
and No. 142, Goodwill and Other Intangible Assets (SFAS
No. 142), on December 31, 2001. We evaluate the carrying
value of our goodwill and other indefinite-lived intangible
assets annually, and we evaluate our other intangible assets
whenever there is evidence that certain events or changes
in circumstances indicate that the carrying amount of these
assets may not be recoverable. Significant judgments and
assumptions are required in the evaluation of intangible assets
for impairment, most significantly the estimated future cash
flows to be generated by these assets. Changes in these
estimates could have a material adverse effect on the assess-
ment of our goodwill and other intangible assets, thereby
requiring us to write down the assets. As an example, our
valuation model for the goodwill associated with our Molson
USA joint venture assumes certain volume growth and pric-
ing assumptions that, if not ultimately achieved, could result
in impairment charges.
Trade loans CBL extends loans to retail outlets that sell
our brands. Some of these loans provide for no interest to
be payable, others provide for payments at below market
interest rate. In return, the retail outlets receive smaller dis-
counts on beer and other beverage products purchased from
us, with the net result being CBL attaining a market return
on the outstanding loan balance.
Consistent with GAAP, we have reclassified a portion of
the beer revenue into interest income to reflect a market
rate of interest on these notes. For the fiscal year ended
December 29, 2002, this amount was $16.4 million. We
have included this interest income in the European segment
since it is so closely related to the European business, even
though all other interest income and expense is reflected
in the Corporate segment.
Derivatives We use derivatives in the normal course of
business to manage our exposure to fluctuations in produc-
tion and packaging material prices, interest rates and foreign
currency exchange rates. By policy, we do not enter into such
contracts for trading purposes or for the purpose of specula-
tion. All derivatives held by us are designated as hedges with
the expectation that they will be highly effective in offsetting
underlying exposures. We account for our derivatives on the
Consolidated Balance Sheet as assets or liabilities at fair
value in accordance with Statement of Financial Accounting
Standards No. 133, “Accounting for Derivative Instruments
and Hedging Activities” (SFAS No. 133), which we early
adopted on January 1, 1999. Such accounting is complex,
as evidenced by significant interpretations of the primary
accounting standard, which continues to evolve, as well as
the significant judgments and estimates involved in the esti-
mation of fair value in the absence of quoted market values.
These estimates are based upon valuation methodologies
deemed appropriate in the circumstances; however, the use
of different assumptions may have a material effect on the
estimated fair value amounts.
A D O L P H C O O R S C O M P A N Y A N D S U B S I D I A R I E S 27
28 A D O L P H C O O R S C O M P A N Y A N D S U B S I D I A R I E S
Management’s Discussion and Analysis ofFinancial Condition and Results of Operations
Equity method accounting We generally apply the equity
method of accounting to 20%–50% owned investments where
we exercise significant influence. As described below, we
have an equity ownership in, and conduct business with vari-
ous joint ventures, which directly relate to our core activities.
There are no related parties that own interests in our equity
method investments.
Coors Canada is a general partnership that was formed
to market CBC products in Canada. We own a 50.1% interest
in this non-consolidated joint venture that we account for using
the equity method of accounting due to the effective control
of the partnership being shared equally by the partners under
the operating agreement. All manufacture, distribution and
sale of CBC branded beers are contracted to Molson Inc.
(Molson) by the partnership. The partnership never takes title
to the beer. It is paid an amount equal to the sales proceeds
Molson receives from third-party customers, less the costs
incurred by Molson for its manufacture, distribution and
sale of the CBC branded products. We reflect this amount
in revenue in our Consolidated Statements of Income (see
Note 10, “Investments”).
Rocky Mountain Metal Container and Rocky Mountain
Bottle Co., along with CBL’s Tradeteam joint venture, are
dedicated predominantly to our packaging and distribution
activities and were formed with companies which have core
competencies sought by us to reduce costs. The CBL joint
venture with Grolsch was formed to provide a long-term rela-
tionship with that brand’s owner in a key segment of the U.K.
beer market. In 2002, our share of the pre-tax joint venture
profits for each of these investments has been offset against
Cost of Goods Sold in our Consolidated Statements of Income
(see Note 10, “Investments”).
Effective with the first quarter of 2003, we will include
our entire share of Tradeteam results in the Other income,
net line of our Consolidated Statements of Income and reflect
the results on a separate line if and when they become mate-
rial. This prospective change in presentation is attributable to
Tradeteam no longer being a captive provider of distribution
and logistics services to CBL. In November 2002, Tradeteam
entered into an agreement to provide distribution services
to Interbrew U.K. Limited, another large brewer in the
United Kingdom.
Other income, net line includes the equity method
income for the Molson USA joint venture. This joint venture
was formed to import, market, sell and distribute Molson
products in the United States. We have recorded our share
of the venture’s results in the Other income, net line in our
Consolidated Statements of Income given the immateriality
of its results.
A qualitative analysis of our results would be impacted if
the results of these joint ventures were included in different
lines of our Consolidated Statements of Income.
Income taxes We account for income taxes in accordance
with SFAS No. 109, Accounting for Income Taxes. Judgment
is required in determining our worldwide provision for income
taxes. In the ordinary course of our global business, there
are many transactions for which the ultimate tax outcome is
uncertain. Additionally, our income tax provision is based on
calculations and assumptions that are subject to examina-
tion by many different tax authorities. We adjust our income
tax provision in the period it is probable that actual results
will differ from our estimates. Tax law and rate changes are
reflected in the income tax provision in the period in which
such changes are enacted.
We record a valuation allowance to reduce our deferred
tax assets to the amount that is more likely than not to be
realized. While we consider future taxable income and ongo-
ing prudent and feasible tax planning strategies in assessing
the need for the valuation allowance, in the event we were
to determine that we would be able to realize our deferred
tax assets in the future in excess of its net recorded amount,
an adjustment to the deferred tax asset would increase income
in the period a determination was made. Likewise, should
we determine that we would not be able to realize all or part
of our net deferred tax asset in the future, an adjustment
to the deferred tax asset would be charged to income in
the period such determination was made. Reductions to the
valuation allowance related to the acquisition of CBL that
relate to deferred taxes arising from that acquisition would
reduce goodwill.
A D O L P H C O O R S C O M P A N Y A N D S U B S I D I A R I E S 29
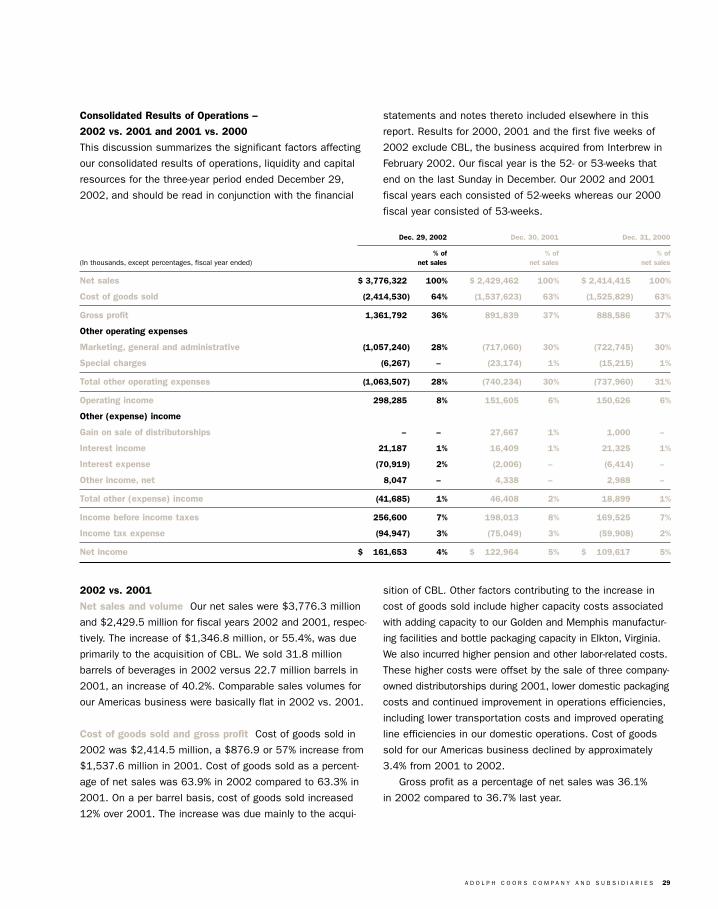
Consolidated Results of Operations –
2002 vs. 2001 and 2001 vs. 2000
This discussion summarizes the significant factors affecting
our consolidated results of operations, liquidity and capital
resources for the three-year period ended December 29,
2002, and should be read in conjunction with the financial
2002 vs. 2001
Net sales and volume Our net sales were $3,776.3 million
and $2,429.5 million for fiscal years 2002 and 2001, respec-
tively. The increase of $1,346.8 million, or 55.4%, was due
primarily to the acquisition of CBL. We sold 31.8 million
barrels of beverages in 2002 versus 22.7 million barrels in
2001, an increase of 40.2%. Comparable sales volumes for
our Americas business were basically flat in 2002 vs. 2001.
Cost of goods sold and gross profit Cost of goods sold in
2002 was $2,414.5 million, a $876.9 or 57% increase from
$1,537.6 million in 2001. Cost of goods sold as a percent-
age of net sales was 63.9% in 2002 compared to 63.3% in
2001. On a per barrel basis, cost of goods sold increased
12% over 2001. The increase was due mainly to the acqui-
Dec. 29, 2002 Dec. 30, 2001 Dec. 31, 2000
% of % of % of (In thousands, except percentages, fiscal year ended) net sales net sales net sales
Net sales $«3,776,322 100% $«2,429,462 100% $«2,414,415 100%
Cost of goods sold (2,414,530) 64% (1,537,623) 63% (1,525,829) 63%
Gross profit 1,361,792 36% 891,839 37% 888,586 37%
Other operating expenses
Marketing, general and administrative (1,057,240) 28% (717,060) 30% (722,745) 30%
Special charges (6,267) – (23,174) 1% (15,215) 1%
Total other operating expenses (1,063,507) 28% (740,234) 30% (737,960) 31%
Operating income 298,285 8% 151,605 6% 150,626 6%
Other (expense) income
Gain on sale of distributorships – – 27,667 1% 1,000 –
Interest income 21,187 1% 16,409 1% 21,325 1%
Interest expense (70,919) 2% (2,006) – (6,414) –
Other income, net 8,047 – 4,338 – 2,988 –
Total other (expense) income (41,685) 1% 46,408 2% 18,899 1%
Income before income taxes 256,600 7% 198,013 8% 169,525 7%
Income tax expense (94,947) 3% (75,049) 3% (59,908) 2%
Net income $÷÷161,653 4% $÷÷122,964 5% $÷÷109,617 5%
statements and notes thereto included elsewhere in this
report. Results for 2000, 2001 and the first five weeks of
2002 exclude CBL, the business acquired from Interbrew in
February 2002. Our fiscal year is the 52- or 53-weeks that
end on the last Sunday in December. Our 2002 and 2001
fiscal years each consisted of 52-weeks whereas our 2000
fiscal year consisted of 53-weeks.
sition of CBL. Other factors contributing to the increase in
cost of goods sold include higher capacity costs associated
with adding capacity to our Golden and Memphis manufactur-
ing facilities and bottle packaging capacity in Elkton, Virginia.
We also incurred higher pension and other labor-related costs.
These higher costs were offset by the sale of three company-
owned distributorships during 2001, lower domestic packaging
costs and continued improvement in operations efficiencies,
including lower transportation costs and improved operating
line efficiencies in our domestic operations. Cost of goods
sold for our Americas business declined by approximately
3.4% from 2001 to 2002.
Gross profit as a percentage of net sales was 36.1%
in 2002 compared to 36.7% last year.
30 A D O L P H C O O R S C O M P A N Y A N D S U B S I D I A R I E S
Management’s Discussion and Analysis ofFinancial Condition and Results of Operations
Marketing, general and administrative expenses Marketing,
general and administrative expenses were $1,057.2 million,
compared to $717.1 million during the same period last year.
The increase was due to the acquisition of CBL and investing
more in our domestic advertising and sales promotion efforts,
especially activity related to our exclusive beer sponsorship
with the NFL. As a percentage of net sales, marketing, gen-
eral and administrative expenses were 28.1% and 29.5% in
2002 and 2001, respectively. Comparable marketing, general
and administrative costs for our Americas business increased
by approximately 2.6% from 2001 to 2002.
Special charges In 2002, we recorded special charges of
$6.3 million. A net $6.4 million charge was recorded in the
fourth quarter related primarily to restructuring initiatives in
our Golden brewery business operations. We also recorded
charges for acquisition costs for CBL, including accounting,
appraisal and legal fees. These special charges were offset
by a credit related to the cash payment on a debt due to
us from our former partner in a brewing business in South
Korea (see Note 9, “Special Charges”). During 2001, we
recorded special charges of $23.2 million primarily related
to incremental consulting, legal and other costs incurred in
preparation to restructure and outsource our information tech-
nology infrastructure. Also included in the 2001 charges were
termination and severance costs related to the restructuring
of our purchasing and production organizations, impairment
charges on certain fixed assets and charges related to the
dissolution of our former can and end joint venture. These
charges were partially offset by a gain related to the sale
of our former Spain brewery and related fixed assets.
Operating income Operating income was $298.3 million for
the year ended December 29, 2002, an increase of $146.7
million or 96.8% over operating income of $151.6 million for
the year ended December 30, 2001, mainly due to the acqui-
sition of CBL and the other factors noted above. Comparable
operating income for our Americas business grew by approxi-
mately 19.3% from 2001 to 2002.
Interest income Interest income of $21.2 million increased
$4.8 million over the prior year, due to interest in the current
year on loans to customers in the acquired CBL business,
partially offset by a decrease in interest income on previously
held interest bearing securities, which we sold in January
2002 to help fund the acquisition of CBL.
Interest expense Total year interest expense of $70.9 million
increased $68.9 million over the same period last year due
to the significant increase in debt incurred to purchase CBL.
Other income, net Net other income was $8.0 million in
2002 compared to income of $4.3 million in 2001. The
increase is primarily the result of a $1.8 million gain from
the sale of non-core water rights in 2002.
Consolidated effective tax rate Our fiscal year ended
2002 effective tax rate was 37.0%, down from 37.9% for
2001 mainly due to the effects of purchase price accounting
and tax planning associated with the acquisition of CBL.
Net income Net income for 2002 was $161.7 million, or
$4.47 per basic share ($4.42 per diluted share), compared
to $123.0 million, or $3.33 per basic share ($3.31 per
diluted share), in 2001.
2001 vs. 2000
Net sales and volume Our net sales were $2,429.5 mil-
lion for the 52-week fiscal year ended December 30, 2001,
resulting in a $15.1 million or 0.6% increase over our 2000
Net sales of $2,414.4 million. Sales volume totaled 22.7 mil-
lion barrels in 2001, a 1.2% decrease from 2000. Excluding
the extra week in fiscal year 2000, net sales volume decreased
0.1% in 2001. The relatively soft volume in 2001 resulted
primarily from the following factors:
• Competitors’ introduction of new flavored malt-based bever-
ages (FABs) supported by heavy advertising which took market
share from more traditional beers and diverted some attention
from distributors and retailers and from core beer brands;
• Unseasonably cold weather early in the year in most parts
of the United States; and,
• Weak economic conditions and sales results in some of
our key markets, including California and Texas.
The increase in net sales and net revenue per barrel over
last year was due to higher domestic pricing of approximately
2% and less promotional discounting, partially offset by a
mix shift away from higher-priced brands and geographies.
Cost of goods sold and gross profit Cost of goods sold
increased by 0.8% to $1,537.6 million from $1,525.8 million
in 2000. Cost of goods sold as a percentage of net sales was
63.3% in 2001 compared to 63.2% in 2000. This increase
A D O L P H C O O R S C O M P A N Y A N D S U B S I D I A R I E S 31
was primarily due to higher packaging material costs for
aluminum cans and glass bottles, in addition to higher raw
materials, energy and labor costs. The continuing shift in our
package mix toward more expensive longneck bottles also
increased costs slightly. These increases were partially off-
set by distribution efficiencies from new information systems
and processes designed to reduce transportation costs, the
benefits from not incurring the 53rd week of costs and clos-
ing our Spain brewing and commercial operations in 2000.
Gross profit as a percentage of net sales was 36.7% in
2001 compared to 36.8% in 2000.
Marketing, general and administrative expenses Marketing,
general and administrative expenses were $717.1 million in
2001 compared to $722.7 million in 2000. The $5.6 million
decrease was mostly due to lower costs for advertising and
promotions and the favorable impact from the sale of our com-
pany-owned distributorships. In addition, overhead expenses
declined due to 52 weeks in 2001 versus 53 weeks in the
prior year. These favorable variances were offset partially by
higher costs related to information systems, market research
and professional fees.
Special charges Our net special charges were $23.2 mil-
lion in 2001 compared to special charges of $15.2 million
in 2000. The following is a summary of special charges
incurred during these years:
Information technology We entered into a contract with EDS
Information Services, LLC, effective August 1, 2001, to out-
source certain information technology functions. We incurred
start-up and transition costs during the year of approximately
$14.6 million.
Restructure charges In the third quarter of 2001, we
recorded $1.6 million of severance costs for approximately
25 employees, primarily due to the restructuring of our pur-
chasing organization. During the fourth quarter of 2001, we
announced plans to restructure certain production areas. As
a result, we recorded associated employee termination costs
of approximately $4.0 million in the fourth quarter. Similar
costs of approximately $0.4 million related to employee
terminations in other functions were also recorded in the
fourth quarter.
Can and end plant joint venture In the third quarter of
2001, we recorded a $3.0 million charge related to the dis-
solution of our existing can and end joint venture as part of
the restructuring of this part of our business that will allow
us to achieve operational efficiencies. Effective January 1,
2002, we entered into a partnership with Ball Corporation
for the manufacture and supply of aluminum cans and ends
for our domestic business.
Property abandonment In 2001, we recorded a $2.3 million
charge for a portion of certain production equipment that
was abandoned and will no longer be used.
Spain closure In 2000, we recorded a total pretax special
charge of $20.6 million related to the closure of our Spain
brewing and commercial operations. In December 2001, the
plant and related fixed assets were sold, resulting in a net
gain before tax of approximately $2.7 million, which was
credited to special charges.
Insurance settlement In 2000, we received an insurance
claim settlement of $5.4 million that was credited to
special charges.
Operating income As a result of the factors noted above,
operating income was $151.6 million for the year ended
December 30, 2001, an increase of $1.0 million or 0.7%
over operating income of $150.6 million for the year ended
December 31, 2000.
Other income (expense), net Net other income was
$46.4 million in 2001 compared with income of $18.9 mil-
lion in 2000. The $27.5 million increase was due mainly to
$27.7 million of gains recognized from the sale of company-
owned distributorships coupled with a $2.0 million gain from
the sale of certain non-core water rights. In addition, as part
of our tax strategy to utilize certain capital loss carryforwards,
we recognized gains of $4.0 million from the sale of mar-
ketable securities. Partially offsetting these gains were net
foreign currency exchange losses of $0.3 million primarily
related to a derivative transaction performed in anticipation
of the Carling acquisition, a write-off of mineral land reserves
of $1.0 million, an equity loss from the Molson USA joint
venture of $2.2 million and goodwill amortization of $1.6 mil-
lion related to this investment.
32 A D O L P H C O O R S C O M P A N Y A N D S U B S I D I A R I E S
Management’s Discussion and Analysis ofFinancial Condition and Results of Operations
Income taxes Our reported effective tax rate for 2001 was
37.9% compared to 35.3% in 2000. In 2000, our rate was
affected by the favorable settlement of certain tax issues
related to the Spain brewery closure, the resolution of an
Internal Revenue Service audit and reduced state tax rates.
Net income Net income for the year increased $13.3 mil-
lion, or 12.2%, over the prior year. For 2001, net income was
$123.0 million, or $3.33 per basic share ($3.31 per diluted
share), which compares to net income of $109.6 million, or
$2.98 per basic share ($2.93 per diluted share), for 2000.
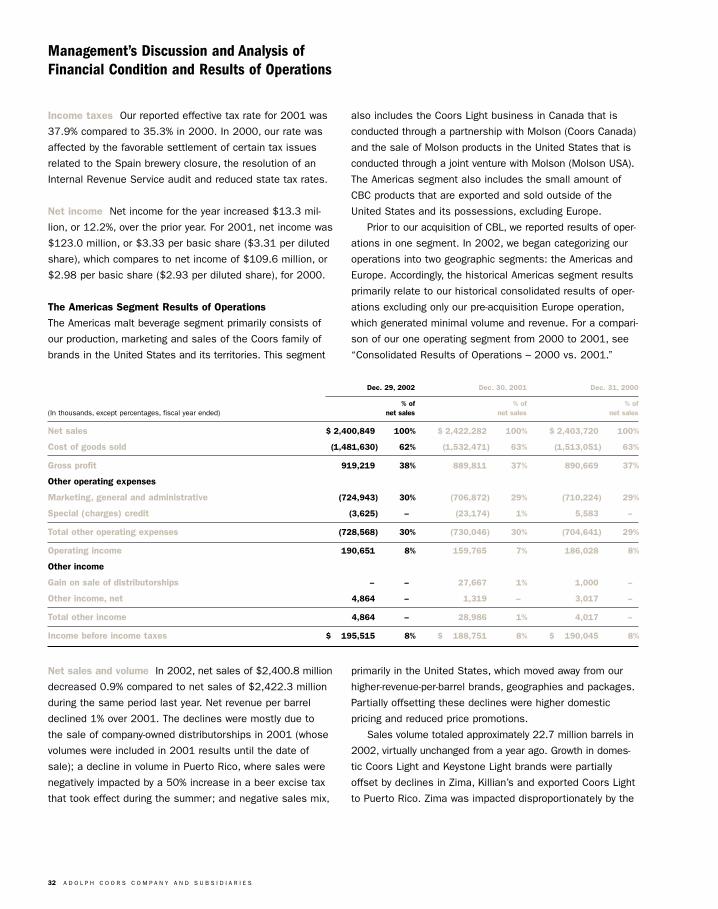
The Americas Segment Results of Operations
The Americas malt beverage segment primarily consists of
our production, marketing and sales of the Coors family of
brands in the United States and its territories. This segment
also includes the Coors Light business in Canada that is
conducted through a partnership with Molson (Coors Canada)
and the sale of Molson products in the United States that is
conducted through a joint venture with Molson (Molson USA).
The Americas segment also includes the small amount of
CBC products that are exported and sold outside of the
United States and its possessions, excluding Europe.
Prior to our acquisition of CBL, we reported results of oper-
ations in one segment. In 2002, we began categorizing our
operations into two geographic segments: the Americas and
Europe. Accordingly, the historical Americas segment results
primarily relate to our historical consolidated results of oper-
ations excluding only our pre-acquisition Europe operation,
which generated minimal volume and revenue. For a compari-
son of our one operating segment from 2000 to 2001, see
“Consolidated Results of Operations – 2000 vs. 2001.”
Dec. 29, 2002 Dec. 30, 2001 Dec. 31, 2000
% of % of % of (In thousands, except percentages, fiscal year ended) net sales net sales net sales
Net sales $«2,400,849 100% $«2,422,282 100% $«2,403,720 100%
Cost of goods sold (1,481,630) 62% (1,532,471) 63% (1,513,051) 63%
Gross profit 919,219 38% 889,811 37% 890,669 37%
Other operating expenses
Marketing, general and administrative (724,943) 30% (706,872) 29% (710,224) 29%
Special (charges) credit (3,625) – (23,174) 1% 5,583 –
Total other operating expenses (728,568) 30% (730,046) 30% (704,641) 29%
Operating income 190,651 8% 159,765 7% 186,028 8%
Other income
Gain on sale of distributorships – – 27,667 1% 1,000 –
Other income, net 4,864 – 1,319 – 3,017 –
Total other income 4,864 – 28,986 1% 4,017 –
Income before income taxes $÷÷195,515 8% $÷÷188,751 8% $÷÷190,045 8%
Net sales and volume In 2002, net sales of $2,400.8 million
decreased 0.9% compared to net sales of $2,422.3 million
during the same period last year. Net revenue per barrel
declined 1% over 2001. The declines were mostly due to
the sale of company-owned distributorships in 2001 (whose
volumes were included in 2001 results until the date of
sale); a decline in volume in Puerto Rico, where sales were
negatively impacted by a 50% increase in a beer excise tax
that took effect during the summer; and negative sales mix,
primarily in the United States, which moved away from our
higher-revenue-per-barrel brands, geographies and packages.
Partially offsetting these declines were higher domestic
pricing and reduced price promotions.
Sales volume totaled approximately 22.7 million barrels in
2002, virtually unchanged from a year ago. Growth in domes-
tic Coors Light and Keystone Light brands were partially
offset by declines in Zima, Killian’s and exported Coors Light
to Puerto Rico. Zima was impacted disproportionately by the
A D O L P H C O O R S C O M P A N Y A N D S U B S I D I A R I E S 33
recent influx of new FABs in the United States. Additionally,
exported Coors Light incurred a significant decline in the lat-
ter half of the year due to the 50% increase in Puerto Rico’s
beer excise tax.
Cost of goods sold and gross profit Cost of goods sold
was $1,481.6 million in 2002 compared to $1,532.5 million
for the same period last year. As a percentage of net sales,
cost of goods sold was approximately 61.7% in 2002 com-
pared to 63.3% in 2001. On a per barrel basis, cost of goods
sold decreased 3.4% from 2001. The decrease in cost of
goods sold during 2002 was attributable primarily to the
sale of company-owned distributorships in 2001, and lower
transportation and packaging costs, as well as the result
of continued operations efficiency initiatives. The decreases
were partially offset by higher capacity costs associated with
adding capacity to our Golden and Memphis manufacturing
facilities and bottle packaging capacity to our facility in
Elkton, Virginia. Also, we incurred higher pension and other
labor-related costs.
Gross profit increased 3.3% to $919.2 million in 2002
compared to the same period last year as a result of the
factors noted above. Gross profit as a percentage of net
sales was 38.3% in 2002 compared to 36.7% last year.
Marketing, general and administrative expenses Marketing,
general and administrative expenses increased 2.6% to
$724.9 million in 2002 from $706.9 million in 2001, mostly
due to higher marketing expense as a result of investing
more behind our brands in advertising and sales promotion,
including additional headcount in certain markets. General
and administrative expenses were down slightly in 2002
primarily due to the sale of company-owned distributorships
last year, somewhat offset by higher systems investments
and labor related expenses.
Special (charges) credit Our special charges of $3.6 million
in 2002 were mainly due to a $7.0 million charge in the fourth
quarter related to restructuring initiatives in our Golden brewery
business operations and charges related to the dissolution of
our former can and end joint venture. These charges were par-
tially offset by a credit related to a cash payment on a debt
from our former partner in a brewing business in South Korea.
During 2001, we recorded special charges of $23.2 mil-
lion primarily related to incremental consulting, legal and other
costs incurred in preparation to restructure and outsource
our information technology infrastructure. Also included in
the 2001 charges were termination and severance costs
related to the restructuring of our purchasing and production
organizations, impairment charges on certain fixed assets
and charges related to the dissolution of our former can and
end joint venture.
Operating income Due to the factors noted above, operat-
ing income increased 19.3% to $190.7 million compared
to $159.8 million for the same period last year.
Other income, net Other income, net was $4.9 million in
2002, representing a $24.1 million decrease from 2001.
The decrease resulted from the sale of company-owned dis-
tributorships in 2001, coupled with the equity loss from the
Molson USA joint venture, partially offset by a gain on the
sale of non-core water rights.
The Europe Segment Results of Operations
We acquired the CBL business on February 2, 2002, and
began reporting these results in a new Europe reporting seg-
ment. The Europe segment consists of our production and
sale of the CBL brands, principally in the United Kingdom,
but also in other parts of the world, our joint venture arrange-
ment relating to the production and distribution of Grolsch
in the United Kingdom and Republic of Ireland, and our joint
venture arrangement with Tradeteam for the physical distribu-
tion of products throughout Great Britain. It also includes the
sale of Coors Light in the United Kingdom and the Republic
of Ireland. The CBL business represents nearly all of our new
Europe segment. Since we did not own CBL prior to February
2002, we do not report historical financial results for this
business. Accordingly, the historical Europe segment results
include only our pre-acquisition Europe operation, which gen-
erated very small volume and revenue. Our discussion on
the results of operations for the Europe segment has been
condensed for these purposes, as comparative results are
generally not meaningful.
34 A D O L P H C O O R S C O M P A N Y A N D S U B S I D I A R I E S
Management’s Discussion and Analysis ofFinancial Condition and Results of Operations
The Europe Segment Results of Operations (continued)
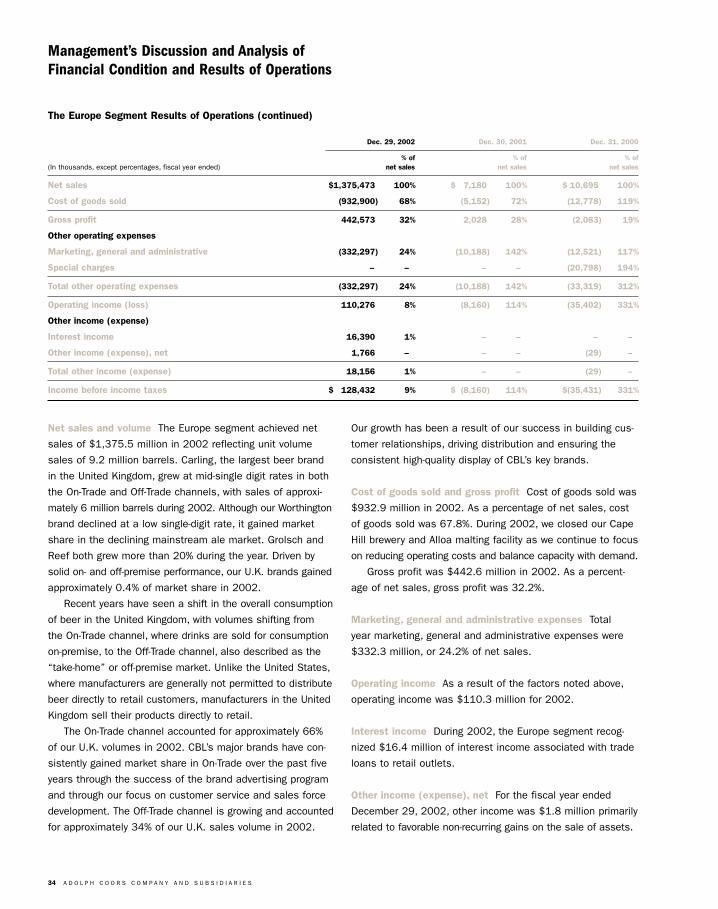
Dec. 29, 2002 Dec. 30, 2001 Dec. 31, 2000
% of % of % of (In thousands, except percentages, fiscal year ended) net sales net sales net sales
Net sales $1,375,473 100% $«÷7,180 100% $«10,695 100%
Cost of goods sold (932,900) 68% (5,152) 72% (12,778) 119%
Gross profit 442,573 32% 2,028 28% (2,083) 19%
Other operating expenses
Marketing, general and administrative (332,297) 24% (10,188) 142% (12,521) 117%
Special charges – – – – (20,798) 194%
Total other operating expenses (332,297) 24% (10,188) 142% (33,319) 312%
Operating income (loss) 110,276 8% (8,160) 114% (35,402) 331%
Other income (expense)
Interest income 16,390 1% – – – –
Other income (expense), net 1,766 – – – (29) –
Total other income (expense) 18,156 1% – – (29) –
Income before income taxes $÷«128,432 9% $÷(8,160) 114% $(35,431) 331%
Net sales and volume The Europe segment achieved net
sales of $1,375.5 million in 2002 reflecting unit volume
sales of 9.2 million barrels. Carling, the largest beer brand
in the United Kingdom, grew at mid-single digit rates in both
the On-Trade and Off-Trade channels, with sales of approxi-
mately 6 million barrels during 2002. Although our Worthington
brand declined at a low single-digit rate, it gained market
share in the declining mainstream ale market. Grolsch and
Reef both grew more than 20% during the year. Driven by
solid on- and off-premise performance, our U.K. brands gained
approximately 0.4% of market share in 2002.
Recent years have seen a shift in the overall consumption
of beer in the United Kingdom, with volumes shifting from
the On-Trade channel, where drinks are sold for consumption
on-premise, to the Off-Trade channel, also described as the
“take-home” or off-premise market. Unlike the United States,
where manufacturers are generally not permitted to distribute
beer directly to retail customers, manufacturers in the United
Kingdom sell their products directly to retail.
The On-Trade channel accounted for approximately 66%
of our U.K. volumes in 2002. CBL’s major brands have con-
sistently gained market share in On-Trade over the past five
years through the success of the brand advertising program
and through our focus on customer service and sales force
development. The Off-Trade channel is growing and accounted
for approximately 34% of our U.K. sales volume in 2002.
Our growth has been a result of our success in building cus-
tomer relationships, driving distribution and ensuring the
consistent high-quality display of CBL’s key brands.
Cost of goods sold and gross profit Cost of goods sold was
$932.9 million in 2002. As a percentage of net sales, cost
of goods sold was 67.8%. During 2002, we closed our Cape
Hill brewery and Alloa malting facility as we continue to focus
on reducing operating costs and balance capacity with demand.
Gross profit was $442.6 million in 2002. As a percent-
age of net sales, gross profit was 32.2%.
Marketing, general and administrative expenses Total
year marketing, general and administrative expenses were
$332.3 million, or 24.2% of net sales.
Operating income As a result of the factors noted above,
operating income was $110.3 million for 2002.
Interest income During 2002, the Europe segment recog-
nized $16.4 million of interest income associated with trade
loans to retail outlets.
Other income (expense), net For the fiscal year ended
December 29, 2002, other income was $1.8 million primarily
related to favorable non-recurring gains on the sale of assets.
A D O L P H C O O R S C O M P A N Y A N D S U B S I D I A R I E S 35
Income before income taxes The Europe segment con-
tributed $128.4 million, or approximately 50%, in 2002 to
consolidated income before income taxes.
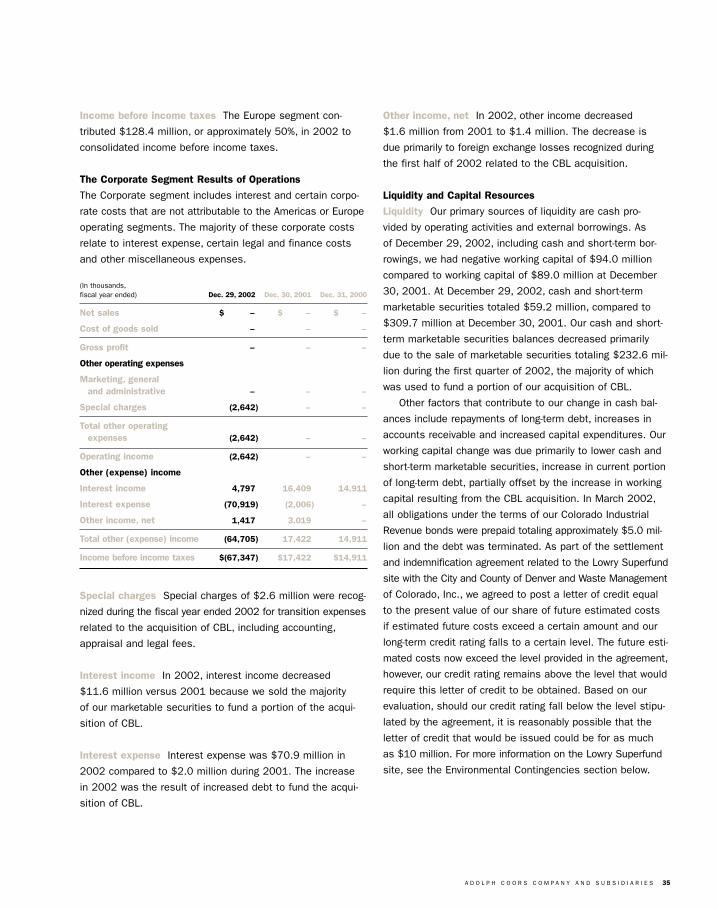
The Corporate Segment Results of Operations
The Corporate segment includes interest and certain corpo-
rate costs that are not attributable to the Americas or Europe
operating segments. The majority of these corporate costs
relate to interest expense, certain legal and finance costs
and other miscellaneous expenses.
(In thousands,fiscal year ended) Dec. 29, 2002 Dec. 30, 2001 Dec. 31, 2000
Net sales $÷÷÷÷÷– $÷÷÷÷«– $÷÷÷÷«–
Cost of goods sold – – –
Gross profit – – –
Other operating expenses
Marketing, general and administrative – – –
Special charges (2,642) – –
Total other operating expenses (2,642) – –
Operating income (2,642) – –
Other (expense) income
Interest income 4,797 16,409 14,911
Interest expense (70,919) (2,006) –
Other income, net 1,417 3,019 –
Total other (expense) income (64,705) 17,422 14,911
Income before income taxes $(67,347) $17,422 $14,911
Special charges Special charges of $2.6 million were recog-
nized during the fiscal year ended 2002 for transition expenses
related to the acquisition of CBL, including accounting,
appraisal and legal fees.
Interest income In 2002, interest income decreased
$11.6 million versus 2001 because we sold the majority
of our marketable securities to fund a portion of the acqui-
sition of CBL.
Interest expense Interest expense was $70.9 million in
2002 compared to $2.0 million during 2001. The increase
in 2002 was the result of increased debt to fund the acqui-
sition of CBL.
Other income, net In 2002, other income decreased
$1.6 million from 2001 to $1.4 million. The decrease is
due primarily to foreign exchange losses recognized during
the first half of 2002 related to the CBL acquisition.
Liquidity and Capital Resources
Liquidity Our primary sources of liquidity are cash pro-
vided by operating activities and external borrowings. As
of December 29, 2002, including cash and short-term bor-
rowings, we had negative working capital of $94.0 million
compared to working capital of $89.0 million at December
30, 2001. At December 29, 2002, cash and short-term
marketable securities totaled $59.2 million, compared to
$309.7 million at December 30, 2001. Our cash and short-
term marketable securities balances decreased primarily
due to the sale of marketable securities totaling $232.6 mil-
lion during the first quarter of 2002, the majority of which
was used to fund a portion of our acquisition of CBL.
Other factors that contribute to our change in cash bal-
ances include repayments of long-term debt, increases in
accounts receivable and increased capital expenditures. Our
working capital change was due primarily to lower cash and
short-term marketable securities, increase in current portion
of long-term debt, partially offset by the increase in working
capital resulting from the CBL acquisition. In March 2002,
all obligations under the terms of our Colorado Industrial
Revenue bonds were prepaid totaling approximately $5.0 mil-
lion and the debt was terminated. As part of the settlement
and indemnification agreement related to the Lowry Superfund
site with the City and County of Denver and Waste Management
of Colorado, Inc., we agreed to post a letter of credit equal
to the present value of our share of future estimated costs
if estimated future costs exceed a certain amount and our
long-term credit rating falls to a certain level. The future esti-
mated costs now exceed the level provided in the agreement,
however, our credit rating remains above the level that would
require this letter of credit to be obtained. Based on our
evaluation, should our credit rating fall below the level stipu-
lated by the agreement, it is reasonably possible that the
letter of credit that would be issued could be for as much
as $10 million. For more information on the Lowry Superfund
site, see the Environmental Contingencies section below.
36 A D O L P H C O O R S C O M P A N Y A N D S U B S I D I A R I E S
Management’s Discussion and Analysis ofFinancial Condition and Results of Operations
We believe that cash flows from operations and cash
provided by short-term borrowings, when necessary, will
be sufficient to meet our ongoing operating requirements,
scheduled principal and interest payments on debt, dividend
payments and anticipated capital expenditures. However,
our liquidity could be impacted significantly by a decrease in
demand for our products, which could arise from competitive
circumstances, a decline in the acceptability of alcohol bev-
erages, any shift away from light beers and any of the other
factors we describe in the section titled Risk Factors. We
also have credit facilities which contain financial and operat-
ing covenants, and provide for scheduled repayments, that
could impact our liquidity on an ongoing basis. During the fis-
cal year ended December 29, 2002, we repaid $208 million
of long- and short-term debt, net of short-term borrowings.
Operating activities Net cash provided by operating activi-
ties of $258.5 million for the fiscal year ended December
29, 2002, increased $65.1 million from the prior fiscal year.
The change was attributable primarily to an increase in net
income and the absence of the non-cash gain on the sale
of the company-owned distributorships, partially offset by
a net decrease resulting from changes in operating assets
and liabilities. Operating cash flows were $87.3 million lower
in 2001 than in 2000 as higher net income of $13.3 mil-
lion was more than offset by a decline in cash distributions
received from our joint venture entities. Also in 2001, we
realized significant non-cash gains on the sale of properties
and securities, and our net deferred tax liability decreased
from year-end 2000 due mainly to the realization of certain
tax benefits. The gains from the sale of properties were due
mainly to the sale in 2001 of three company-owned distrib-
utorships for $27.7 million.
Investing activities During the fiscal year ended December
29, 2002, net cash used in investing activities was $1.6 bil-
lion compared to $196.7 million in the same period last
year. The increase is due to the $1.6 billion payment, net
of cash acquired, made to purchase CBL. Also, in 2001, we
made a payment of $65.0 million for our 49.9% interest in
Molson USA. However, excluding our $1.6 billion payment to
acquire CBL and our $65.0 million payment for our interest
in Molson USA, total cash provided by investing activities
increased approximately $134.5 million compared to the
same period last year, mostly due to a substantial decrease
in purchases of securities. We did not purchase any new
marketable securities in 2002 compared to purchases of
$228.2 million during 2001.
During 2001, we used $196.7 million in investing activ-
ities compared to a use of $297.5 million in 2000. The
$100.8 million decrease from 2000 to 2001 was due pri-
marily to proceeds from the sale of properties, mainly three
of our company-owned distributorships, and lower net invest-
ment activity in 2001. In 2001, our net cash proceeds from
marketable securities activity was $39.9 million compared
to a net cash use of $148.6 million in 2000. Cash used in
2001 for investing activities consisted of the $65.0 million
payment made to acquire our interest in the Molson USA
joint venture and increased capital expenditures and addi-
tions to intangible assets of $244.5 million compared to
$154.3 million in 2000. A significant portion of our 2001
capital expenditures were for capacity-related projects that
were started late in 2000 and in early 2001.
Financing activities Net cash provided by financing activities
was $1.3 billion in 2002. Activity in the current year included
debt proceeds of $2.7 billion partially offset by debt repayments
and capital lease obligations of $1.4 billion, and changes in
cash overdraft balances of $27.8 million. Net cash used in
financing activities was $38.8 million in 2001, consisting prima-
rily of $72.3 million for purchases of our Class B common stock
under our stock repurchase program; dividend payments of
$29.5 million on our Class B common stock, partially offset by
cash inflows of $51.6 million related to an increase in cash
overdrafts over year-end 2000; and $10.7 million associated
with the exercise of stock options under our stock option plans.
Debt Obligations
Senior private placement notes At December 29, 2002,
we had $20 million in unsecured Senior notes at a fixed
interest rate of 6.95% per annum. Interest on the notes is
due semi-annually in January and July. At December 29,
2002, $20 million was classified as long-term debt as this
balance is due in July of 2005. In July 2002, we made an
$80 million principal payment on the “A” series of notes due
in July 2002. Our private placement notes require that we
conduct our business with certain restrictions on indebted-
ness, liens, mergers, consolidations, asset sales and certain
other types of business activities in which we can engage.
We were in compliance with these requirements at
December 29, 2002.
A D O L P H C O O R S C O M P A N Y A N D S U B S I D I A R I E S 37
63⁄8% Senior notes due 2012 On May 7, 2002, CBC com-
pleted a private placement of $850 million principal amount
of 63⁄8% Senior notes, due 2012, with interest payable semi-
annually. The notes were priced at 99.596% of par for a yield
to maturity of 6.43%, were unsecured, were not subject to
any sinking fund provision and included a redemption provi-
sion (make-whole provision) which allowed us to retire the
notes at whole or any time at a redemption price. The notes
were issued with registration rights and were guaranteed by
Adolph Coors Company and certain domestic subsidiaries.
Net proceeds from the sale of the notes were approximately
$841 million. The net proceeds were used to (1) repay the
$750 million of loans outstanding under our senior unsecured
bridge facility which we entered into in connection with our
acquisition of CBL and (2) to repay approximately $91 million
of outstanding term borrowings under our senior unsecured
credit facilities.
Simultaneously with the private placement, we entered
into a registration rights agreement pursuant to which we
exchanged the unregistered notes for substantially identical
notes registered with the SEC. The exchange of all the notes
was completed on September 16, 2002.
Under the terms of the notes, we must comply with
certain restrictions. These restrictions include restrictions
on debt secured by certain types of mortgages, above certain
threshold percentages of consolidated net tangible assets
and restrictions on certain types of sale-leaseback transac-
tions. As of December 29, 2002, we were in compliance
with all of these restrictions.
Senior credit facility At December 29, 2002, we had
$533.7 million outstanding in unsecured Senior credit facili-
ties consisting of a U.S. dollar denominated amortizing term
loan in an aggregate principal amount of $168 million and a
228 million GBP denominated amortizing term loan. Based
on foreign exchange rates at December 29, 2002, aggregate
principal amounts outstanding related to the 228 million
GBP amortizing term loan were $365.7 million.
Our term loan is payable quarterly in arrears beginning
June 27, 2003, and matures February 1, 2007. During the
year ended December 29, 2002, we repaid approximately
$310 million on our five-year amortizing term loan. This has
reduced the scheduled required future amortization amounts
based upon application of payments already made against
future payments due as per the terms of our loan agreement.
We and all of our existing and future, direct and indirect,
domestic subsidiaries, other than immaterial domestic sub-
sidiaries, have guaranteed our term loan borrowings.
Our term loan requires us to meet certain periodic financial
tests, including maximum total leverage ratio and minimum
interest coverage ratio. There are also certain restrictions on
indebtedness, liens and guarantees; mergers, consolidations
and some types of acquisitions and assets sales; and certain
types of business in which we can engage. As of December 29,
2002, we were in compliance with all of these restrictions.
Revolving line of credit At December 29, 2002, we had an
unsecured committed credit arrangement totaling $300 mil-
lion, of which $241 million was available. On December 24,
2002, we borrowed approximately $59 million on this line of
credit and used the borrowings to pay down our U.S. dollar
denominated amortizing term loan on the same date. This
action was undertaken to facilitate the movement of funds
from CBL to the United States.
This line of credit has a five-year term expiring 2007. On
a quarterly basis, we pay a facilities fee based on the total
amount of available committed credit. Under the terms of this
credit facility, we are required to maintain the same leverage
ratio and interest coverage ratio as those defined in our term
loan, as well as operate our business with the same restric-
tions as defined in the term loan. We were in compliance
with these requirements at December 29, 2002.
Uncommitted lines of credit At December 29, 2002, we
had two USD uncommitted lines of credit totaling $40 mil-
lion. The lines of credit are with two different lenders. We
had $22 million outstanding under these lines of credit as
of December 29, 2002.
In addition, CBL had two uncommitted lines of credit total-
ing GBP 20 million, or approximately $32 million based on
foreign exchange rates at December 29, 2002. Approximately
10 million GBP, or $16 million based on prevailing exchange
rates, was outstanding under these lines of credit at
December 29, 2002.
See Note 4, “Debt,” for additional discussion of our long-
term borrowings.
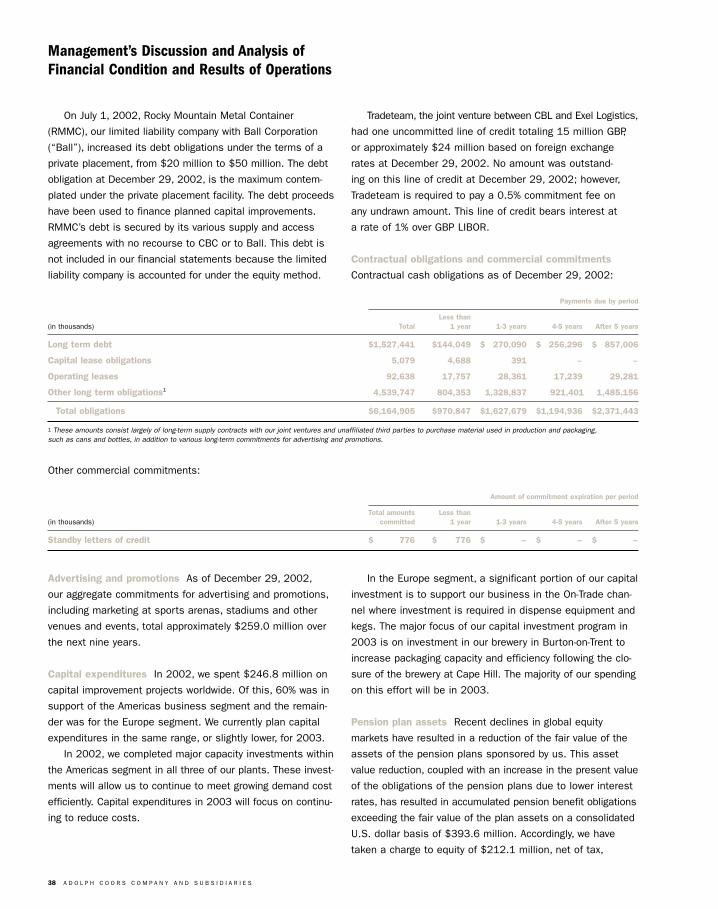
38 A D O L P H C O O R S C O M P A N Y A N D S U B S I D I A R I E S
Management’s Discussion and Analysis ofFinancial Condition and Results of Operations
On July 1, 2002, Rocky Mountain Metal Container
(RMMC), our limited liability company with Ball Corporation
(“Ball”), increased its debt obligations under the terms of a
private placement, from $20 million to $50 million. The debt
obligation at December 29, 2002, is the maximum contem-
plated under the private placement facility. The debt proceeds
have been used to finance planned capital improvements.
RMMC’s debt is secured by its various supply and access
agreements with no recourse to CBC or to Ball. This debt is
not included in our financial statements because the limited
liability company is accounted for under the equity method.
Tradeteam, the joint venture between CBL and Exel Logistics,
had one uncommitted line of credit totaling 15 million GBP,
or approximately $24 million based on foreign exchange
rates at December 29, 2002. No amount was outstand-
ing on this line of credit at December 29, 2002; however,
Tradeteam is required to pay a 0.5% commitment fee on
any undrawn amount. This line of credit bears interest at
a rate of 1% over GBP LIBOR.
Contractual obligations and commercial commitments
Contractual cash obligations as of December 29, 2002:
Payments due by period
Less than(in thousands) Total 1 year 1-3 years 4-5 years After 5 years
Long term debt $1,527,441 $144,049 $÷«270,090 $÷«256,296 $÷«857,006
Capital lease obligations 5,079 4,688 391 – –
Operating leases 92,638 17,757 28,361 17,239 29,281
Other long term obligations1 4,539,747 804,353 1,328,837 921,401 1,485,156
Total obligations $6,164,905 $970,847 $1,627,679 $1,194,936 $2,371,443
1 These amounts consist largely of long-term supply contracts with our joint ventures and unaffiliated third parties to purchase material used in production and packaging,such as cans and bottles, in addition to various long-term commitments for advertising and promotions.
Other commercial commitments:
Amount of commitment expiration per period
Total amounts Less than(in thousands) committed 1 year 1-3 years 4-5 years After 5 years
Standby letters of credit $÷÷÷÷÷776 $÷÷÷«776 $÷÷÷÷÷÷÷– $÷÷÷÷÷÷÷– $÷÷÷÷÷÷÷–
Advertising and promotions As of December 29, 2002,
our aggregate commitments for advertising and promotions,
including marketing at sports arenas, stadiums and other
venues and events, total approximately $259.0 million over
the next nine years.
Capital expenditures In 2002, we spent $246.8 million on
capital improvement projects worldwide. Of this, 60% was in
support of the Americas business segment and the remain-
der was for the Europe segment. We currently plan capital
expenditures in the same range, or slightly lower, for 2003.
In 2002, we completed major capacity investments within
the Americas segment in all three of our plants. These invest-
ments will allow us to continue to meet growing demand cost
efficiently. Capital expenditures in 2003 will focus on continu-
ing to reduce costs.
In the Europe segment, a significant portion of our capital
investment is to support our business in the On-Trade chan-
nel where investment is required in dispense equipment and
kegs. The major focus of our capital investment program in
2003 is on investment in our brewery in Burton-on-Trent to
increase packaging capacity and efficiency following the clo-
sure of the brewery at Cape Hill. The majority of our spending
on this effort will be in 2003.
Pension plan assets Recent declines in global equity
markets have resulted in a reduction of the fair value of the
assets of the pension plans sponsored by us. This asset
value reduction, coupled with an increase in the present value
of the obligations of the pension plans due to lower interest
rates, has resulted in accumulated pension benefit obligations
exceeding the fair value of the plan assets on a consolidated
U.S. dollar basis of $393.6 million. Accordingly, we have
taken a charge to equity of $212.1 million, net of tax,
A D O L P H C O O R S C O M P A N Y A N D S U B S I D I A R I E S 39
representing the recording of the appropriate liability and
the related deferred tax effects. For pension plans with accu-
mulated obligations in excess of plan assets, the projected
benefit obligation was $2,199.0 million and the accumulated
benefit obligation was $2,011.1 million.
The amounts reflected in the Consolidated Balance
Sheets for accrued pension liability, accumulated other com-
prehensive loss, prepaid benefit cost and intangible asset
in 2002 are $431.4 million, $359.0 million ($220.6 million,
net of tax), $37.7 million and $42.2 million, respectively. In
2002, an additional minimum pension liability of $339.3 mil-
lion was recorded and is included in the accrued pension
liability amount. It is our practice to fund amounts for pen-
sions at least sufficient to meet the minimum requirements
set forth in applicable employee benefits laws and local tax
laws. For further information regarding pension plan assets,
refer to Note 7, “Employee Retirement Plans,” and Note 13,
“Other Comprehensive Income.”
In 2002, our actuarially assumed long-term rates of return
on plan asset investments was 9.5% for the CBC Retirement
Plan and 7.25% for the Coors Brewers Pension Plan. In select-
ing those assumptions, we considered investment returns
by asset class as represented by our independent pension
investment consultants, and applied the relevant asset allo-
cation percentages. The discount rates used were based on
prevailing yields of high-quality corporate fixed income invest-
ments in the United States and the United Kingdom.
In 2002, consolidated pension expense was $18.6 mil-
lion, which represented less than 1% of consolidated Cost
of goods sold and other operating expenses. Pension contri-
butions on a consolidated basis were $31.5 million in the
current year.
From a cash flow standpoint, on a consolidated basis we
increased our voluntary pension contributions from $2.6 mil-
lion per month to $3.6 million per month in October, 2002,
and we are continuing to contribute at that higher level in
2003. We expect that the funded positions of the two primary
pension plans will improve through a combination of higher
contributions and investment returns more in line with long-
term historical averages.
We are still evaluating lowering our 2003 actuarial assump-
tion relative to the rate of return on plan asset investments for
the CBC Retirement Plan. If we lowered our rate of return by
50 basis points, pension expense in 2003 would increase by
approximately $2.7 million. Any change in this assumption
would have no effect on our cash flows.
On a consolidated basis, we had unrecognized net actuarial
losses of $547.0 million and $105.0 million at December 29,
2002 and December 30, 2001, respectively. Actuarial losses
are primarily comprised of short-term investment losses
which are lower than actuarially assumed investment returns
and liability losses due to increased pension liabilities and
falling interest rates. Pension expense includes amortization
of these actuarial losses after they exceed certain thresholds
and, as a result, we recorded actuarial loss amortization of
$0.1 million in 2001 and $1.0 million in 2002. It is expected
that actuarial loss amortization in 2003 will increase to
approximately $8.0 million. We anticipate consolidated pen-
sion expense will increase from the $18.6 million in 2002 to
approximately $35.0 million in 2003. The expected increase
in consolidated pension cost is due to the combined impacts
of higher actuarial loss amortization and other factors associ-
ated with the decrease in the pension plan’s funded position.
Cautionary Statement Pursuant to Safe Harbor Provisions
of the Private Securities Litigation Reform Act of 1995
This report contains “forward-looking statements” within the
meaning of Section 27A of the Securities Act of 1933 and
Section 21E of the Securities Exchange Act of 1934. You
can identify these statements by forward-looking words such
as “expect,” “anticipate,” “plan,” “believe,” “seek,” “esti-
mate,” “outlook,” “trends,” “industry forces,” “strategies,”
“goals” and similar words. Statements that we make in this
report that are not statements of historical fact may also
be forward-looking statements.
In particular, statements that we make under the head-
ings “Narrative Description of Business,” “Management’s
Discussion and Analysis of Financial Condition and Results
of Operations,” and “Outlook for 2003” including, but not
limited to, statements relating to our overall volume trends,
consumer preferences, pricing trends and industry forces,
cost reduction strategies and anticipated results, our expec-
tations for funding our 2003 capital expenditures and
operations, debt service capabilities, shipment levels and
profitability, increased market share and the sufficiency of
capital to meet working capital, capital expenditures require-
ments and our strategies are forward-looking statements.
Forward-looking statements are not guarantees of
our future performance and involve risks, uncertainties
and assumptions that may cause our actual results to differ
materially from the expectations we describe in our forward-
looking statements. In particular, our future results could
40 A D O L P H C O O R S C O M P A N Y A N D S U B S I D I A R I E S
Management’s Discussion and Analysis ofFinancial Condition and Results of Operations
be affected by our acquisition of the CBL business in the
United Kingdom and the substantial amount of indebtedness
incurred to finance the acquisition, which could, among other
things, hinder our ability to adjust rapidly to changing market
conditions, make us more vulnerable in the event of a down-
turn and place us at a competitive disadvantage relative to
less leveraged competitors. You should not place undue
reliance on forward-looking statements. We do not promise
to notify you if we learn that our assumptions or projections
are wrong for any reason. You should be aware that the fac-
tors we discuss in “Risk Factors” and elsewhere in this report
could cause our actual results to differ from any forward-
looking statements.
Risk Factors
The reader should carefully consider the following factors
and the other information contained within this document.
The most important factors that could influence the achieve-
ment of our goals, and cause actual results to differ materially
from those expressed in the forward-looking statements,
include, but are not limited to, the following:
We have a substantial amount of debt. As of December 29,
2002, we hold approximately $1.5 billion in debt primarily
associated with the acquisition of CBL.
Because of the acquisition of the CBL business, we have
indebtedness that is substantial in relation to our stockhold-
ers’ equity. Our consolidated indebtedness could have the
effect of restricting our flexibility in responding to changing
market conditions and could make us more vulnerable in the
event of a general downturn in economic conditions or our
business, than if we had no or lower debt.
Our substantial indebtedness could have important
consequences to us, including:
• A substantial portion of our cash flow from operations must
be dedicated to the payment of principal and interest on our
debt, reducing the funds available to us for other purposes
including expansion through acquisitions, marketing spend-
ing and introduction of new brands; and
• We may be more leveraged than some of our competitors,
which may place us at a competitive disadvantage should
competition require us to devote even more care to the
“front end” of our business.
Our ability to make scheduled payments or to refinance
our obligations under our indebtedness will depend on our
financial and operating performance, which, in turn, is subject
to prevailing economic conditions and to financial, business
and some other factors beyond our control.
Our primary production facilities in the United States and
in the United Kingdom are each located at a single site, so
we could be more vulnerable than our competitors to trans-
portation disruptions, fuel increases and natural disasters.
Our primary U.S. production facilities are located in Golden,
Colorado, where we brew more than 90%, and package approxi-
mately 60% of our products sold in the Americas business. Our
primary production facilities in the United Kingdom are located
in Burton-on-Trent, England, where we brew approximately 70%
of our products sold in the Europe business.
Our centralized operations in the United States require us
to ship our products greater distances than our competitors.
If one of our plants was unable to continue production, or if
there was disruption to our transportation system, our busi-
ness and financial results could be impacted negatively.
We are significantly smaller than our two primary competitors
in the United States, and may consequently be more vulnera-
ble than our competitors to cost and price fluctuations.
The beer industry is highly competitive. At retail, our brands
compete on the basis of quality, taste, advertising, price,
packaging innovation and retail execution by our distributors.
Competition in our various markets could cause us to reduce
pricing, increase capital and other expenditures or lose mar-
ket share, any of which could have a material adverse effect
on our business and financial results.
In the United States, we compete primarily with Anheuser-
Busch and SAB Miller PLC (Miller), the top two brewers in
the United States. Both of these competitors have substan-
tially greater financial, marketing, production and distribution
resources than CBC has. Consequently, we are somewhat
disadvantaged versus their greater economies of scale.
To remain competitive, we must spend substantially
more per barrel on advertising than our competitors. The
concentration of our operations at fewer locations contributes
to higher costs per barrel than our competitors due to a
number of factors. These factors include, but are not limited
to, higher transportation costs and the need to maintain
satellite redistribution centers. Our competitors have multiple
geographically dispersed breweries and packaging facilities.
A D O L P H C O O R S C O M P A N Y A N D S U B S I D I A R I E S 41
As a result of our higher costs per barrel and resulting lower
margins, we can be more vulnerable to fluctuations in costs
such as fuel or packaging costs.
If any of our suppliers, including our joint ventures, are unable
to meet our requirements, we may be unable to promptly
obtain the materials we need to operate our business.
We purchase most of our paperboard and label packag-
ing for our U.S. products from GPIC. GPIC supplies unique
packaging to us that is not currently produced by any other
supplier. Our supply agreement expired in 2002. GPIC has
recently encountered labor issues at some of its manufactur-
ing locations. We have almost completed a new agreement
with GPIC, but the unavailability of packaging materials from
GPIC for any reason, without sufficient time to develop an
alternative source for our packaging requirements, could
have a material adverse effect on our business.
We are dependent on our suppliers for all of the raw materi-
als used in our products as well as for all packaging materials.
We currently purchase the majority of our aluminum cans in
the United States from RMMC (with Ball Corporation) and
more than half of our glass bottles from RMBC (with Owens-
Brockway Glass Container, Inc.). We also have agreements
to purchase substantially all of our remaining can and bottle
needs from these partners. CBL has only a single source for
their can supply. The inability of these suppliers to meet our
production requirements without sufficient time to develop
an alternative source could have a material adverse effect
on our business.
As with most agricultural products, the supply and price
of raw materials, including water, used to produce our prod-
ucts can be affected by a number of factors beyond our
control, including frosts, droughts, other weather conditions,
economic factors affecting growth decisions, various plant
diseases and pests. In fact, Colorado and other western
states currently have some issues with drought conditions.
To the extent that any of the foregoing affects the ingredients
we use to produce our products, our results of operations
could be materially and adversely affected.
Government regulatory authorities in the markets in which
we operate may adopt regulations that could increase our
costs or our liabilities or could limit our business activities.
Our business is highly regulated by national and local gov-
ernment entities. These regulations govern many parts of
our operations, including brewing, marketing and advertising,
transportation, distributor relationships, sales and environmen-
tal issues. We do not know that we have been or will at all
times be in compliance with all regulatory requirements or that
we will not incur material costs or liabilities in connection with
regulatory requirements. The regulations impacting the beer
industry are subject to change at any time, and it is most
likely that new rules would not be beneficial to our business.
Governmental entities also levy taxes and often require
bonds to ensure compliance with applicable laws and reg-
ulations. Various legislative authorities in both the United
States and the United Kingdom from time to time consider
various proposals to impose additional excise taxes on the
production and sale of alcohol beverages, including beer.
In the United States, the last significant increase in federal
excise taxes on beer was in 1991 when Congress doubled
the federal excise taxes on beer. In June 2002, excise taxes
on most beer in Puerto Rico increased 50%. Our products
could become subject to increased taxation by federal, state
or local authorities. Any significant increases could have
a materially adverse impact on our financial results.
Due to the scope and complexity of the income tax laws
in the many jurisdictions in which we operate, we are required
to make judgments based on our interpretation of how these
tax laws apply to our global business. While we exercise care
in making these interpretations and always seek to comply
with the tax laws, a tax authority could disagree with our views,
or changes to the tax laws could have a material negative
impact on our results.
If the social acceptability of our products declines, or if
litigation is directed at the alcohol beverage industry, our
sales volumes could decrease and our business could be
materially adversely affected.
In recent years, there has been increased social and political
attention directed to the alcohol beverage industry. We believe
that this attention is the result of public concern over alcohol-
related problems, including drunk driving, underage drinking
and health consequences from the misuse of alcohol. If the
social acceptability of beer were to decline significantly, sales
of our products could materially decrease. Similarly, recent lit-
igation against the tobacco industry has directed increased
attention to the alcohol beverage industry. If our industry were
to become involved in litigation similar to that of the tobacco
industry, our business could be materially adversely affected.
42 A D O L P H C O O R S C O M P A N Y A N D S U B S I D I A R I E S
Management’s Discussion and Analysis ofFinancial Condition and Results of Operations
A failure to successfully implement our redesigned supply
chain processes and systems in the United States in 2003
could adversely affect our ability to take distributor orders,
plan and schedule production, ship our products and bill
distributors for shipments.
During 2003, we plan to implement our redesigned supply
chain processes, including the SAP Sales and Distribution
module and other systems our customers will use to order
beer, and we will use to schedule production, track inventories
and bill our customers. Some companies have experienced
startup difficulties with similar projects. If our contingency
plans fail, we face certain risks when the system is imple-
mented, including the ability to operate cost-effectively, deliver
on customer orders, collect cash from sales and report the
results of operations. Additionally, we may not achieve the
benefits we expect from these re-engineered processes.
Any significant shift in packaging preferences in the beer
industry could disproportionately increase our costs and
could limit our ability to meet consumer demand.
Reconfiguring our packaging facilities to produce different
types or amounts of packaging than we currently produce
would likely increase our costs. In addition, we may not be
able to complete any necessary changes quickly enough to
keep pace with shifting consumer preferences. Our primary
competitors are larger and may be better able to accommo-
date a packaging preference shift. If we are not able to
respond quickly to a packaging preference shift, our sales
and market share could decline.
We depend on independent distributors in the United States
to sell our products, with no assurance that these distribu-
tors will effectively sell our products.
We sell all of our products in the United States to whole-
sale distributors for resale to retail outlets. We are highly
dependent on independently-owned distributors. Some of our
distributors are at a competitive disadvantage because they
are significantly smaller than the largest distributors in their
markets. Our distributors also sell products that compete
with our products. We cannot control or provide any assurance
that these distributors will not give our competitors’ products
higher priority, thereby reducing sales of our products. In
addition, the regulatory environment of many states makes
it very difficult to change distributors. Consequently, if we
are not allowed or are unable to replace unproductive or
inefficient distributors, our business, financial position, and
results of operation may be adversely affected.
CBL wholesales its products directly to retail outlets and,
other than for servicing independent outlets in the off-trade,
is not dependent upon wholesalers. In the United Kingdom,
CBL distributes its products through Tradeteam, its joint ven-
ture with Excel Logistics. Tradeteam operates a system of
satellite warehouses and a transportation fleet for delivery.
CBL has an exclusive arrangement with Tradeteam for these
services, and the inability of Tradeteam to provide these
services could have a materially negative impact on our
business if we were unable to timely substitute alternate
distribution arrangements.
Since our sales volume is more concentrated in a few geo-
graphic areas in the United States, a loss of market share
in these particular markets would have a material adverse
effect on our results of operations.
Although we sell beer in the United States, the United
Kingdom and in select international markets, only a few
states, California, Texas, Pennsylvania, New York and New
Jersey, together represented 44% of our total U.S. volume
in 2002. We have relatively low market share in the Midwest
and Southeast regions of the United States. Any loss of mar-
ket share in our core states could have a material adverse
effect on our results of operations.
Our success depends largely on the success of two primary
products, one in the United States and one in the United
Kingdom; the failure or weakening of either could materially
adversely affect our financial results.
Although we currently have 11 products in our U.S. portfolio,
Coors Light represented more than 70% of our Americas
sales volume for 2002. A key factor in our growth is based
on consumer taste preferences that are beyond our control.
Our primary competitors’ portfolios are more evenly diversi-
fied than ours. As a consequence, if consumer tastes shift
to another style of beer, the loss of sales from Coors Light
would have a disproportionately negative impact on our busi-
ness compared to the business of our principal competitors.
We cannot provide assurance that our acquisition of
CBL will mitigate our reliance on Coors Light. Moreover,
Carling lager is the best-selling brand in the United Kingdom
and represented approximately 66% of CBL sales volume
in the United Kingdom. Consequently, any material shift in
consumer preferences in the United Kingdom away from
Carling would have a disproportionately negative impact
on that business.
A D O L P H C O O R S C O M P A N Y A N D S U B S I D I A R I E S 43
Consolidation of pubs and growth in the size of pub
chains in the United Kingdom could result in less ability
to achieve pricing.
The trend toward consolidation of pubs, away from inde-
pendent pub and club operations, is continuing in the United
Kingdom. These larger entities could have stronger price
negotiating power, which could impact CBL’s ability to obtain
favorable pricing both On-Trade and Off-Trade (due to spillover
effect of reduced negotiating leverage) and could reduce rev-
enues and profit margins for us and industry wide for brewers.
In addition, these larger customers are beginning to purchase
directly more of the products that, in the past, we have pro-
vided as part of our factored business. This consolidation
could impact us negatively.
We are subject to environmental regulation by federal,
state and local agencies, including laws that impose
liability without regard to fault.
Our operations are subject to federal, state, local, and
foreign environmental laws and regulations regarding,
among other things, the generation, use, storage, disposal,
emission, release and remediation of hazardous and non-
hazardous substances, materials or wastes as well as the
health and safety of our employees. Under certain of these
laws, namely the Comprehensive Environmental Response,
Compensation and Liability Act and its state counterparts,
we could be held liable for investigation and remediation of
hazardous substance contamination at our currently or for-
merly owned or operated facilities or at third-party waste
disposal sites, as well as for any personal or property dam-
age arising out of such contamination regardless of fault.
From time to time, we have been notified that we are or may
be a potentially responsible party under the Comprehensive
Environmental Response, Compensation and Liability Act.
Although we believe that none of the sites where we are cur-
rently involved will materially affect our business, financial
condition or results of operations, we cannot predict with cer-
tainty the total costs of cleanup, our share of the total costs,
the extent to which contributions will be available from other
parties, the amount of time needed to complete cleanups or
insurance coverage. In addition, we could be named a poten-
tially responsible party at sites in the future and the costs
associated with such future sites could be material.
Environmental laws and regulations are complex and
change frequently. While we have budgeted for future capital
and operating expenditures to maintain compliance with these
environmental laws and regulations, we cannot be sure that
we will not incur any environmental liability, or that these envi-
ronmental laws and regulations will not change or become
more stringent in the future in a manner that could have a
material adverse effect on our business, financial condition
or results of operations.
We may experience labor disruptions in the United Kingdom.
Approximately 26% of CBL’s 3,000 employees are unionized
compared to approximately 8% of CBC’s 5,700 employees
in the United States. Although we believe relations with our
employees are very good both in the United States and in
the United Kingdom, the CBL operations could be affected
to a somewhat greater degree by labor strikes, work stop-
pages or other similar employee-related issues.
Outlook for 2003
2002 was a challenging year for our Company, the U.S. beer
industry and the U.S. economy. There were many new prod-
uct offerings within the malt beverage business in 2002,
including many flavored alcoholic beverages. We believe that
these new entrants caused distraction within the industry
and negatively impacted consumer demand for beer. Also,
as discussed under “Competitive Conditions,” the total
U.S. beer industry volume growth was approximately 1.3%
in 2002. These industry trends as well as a weak U.S. econ-
omy contributed to a challenging year for our Company. Our
outlook for 2003 is cautiously optimistic, as we believe our
advertising and sales efforts, including our NFL sponsorship,
will move us closer to our long-standing goal of growing our
annual unit volume 1% to 2% faster than the U.S. beer indus-
try. However, we have significant challenges, including higher
pension and health care expenses and higher interest expense
and principal payments on our debt, along with the inclusion
of the money-losing month of January in 2003 CBL results.
Our acquisition of CBL in February 2002 has transformed
us into a more global, diversified organization. In 2002, we
benefited significantly from the additional unit volume of our
Europe business, and we expect that this acquisition will con-
tinue to be a significant contributor to our consolidated results.
44 A D O L P H C O O R S C O M P A N Y A N D S U B S I D I A R I E S
Management’s Discussion and Analysis ofFinancial Condition and Results of Operations
Net sales and volume In 2002, net sales benefited from
strong U.S. pricing as well as reductions in price promotions
versus the prior year. This strong pricing was offset by the
effect of selling company-owned distributorships during 2001
and by a mix shift away from some of our higher net-revenue
products and geographic areas. We expect the good pricing
environment to continue into 2003. However, an increase in
promotional discounting or the degree of value-pack activity
could have an unfavorable impact on sales and margins.
Further, sales and margins could be impacted adversely if
this “negative mix shift” continues in 2003.
America’s sales volume was disappointing in 2002.
We finished the year with soft sales-to-retail trends, though
our distributors ended the year with inventory levels above
those of the prior year, ensuring that they had sufficient beer
inventories to meet demand for the NFL playoffs and the
Superbowl. We expect distributor inventories at the end of
the first quarter of 2003 to be in line with the prior year, so
our sales volume in the first quarter of 2003 is likely to lag
sales to retail. This could limit our ability to leverage fixed
costs. We anticipate that distributor inventories at the end
of 2003 will be similar to those at the end of 2002, resulting
in minimal impact of inventory changes on annual volume.
Also, our sales in Puerto Rico are likely to continue to be
under pressure through the first half of 2003, after which we
will begin lapping the impact of the very significant increase
in local beer excise tax that took effect in 2002.
In 2002, our Europe business net sales were affected
substantially by competitive off-premise price discounting
and an ongoing mix shift from On- to Off-Trade channels,
resulting in fairly flat gross margins.
Our Europe segment volume outlook is positive for
2003, although we expect significant volume shifts between
quarters compared to a year ago. For instance, the Easter
holiday will shift to the second quarter this year from first
quarter last year. This shift will benefit second quarter, but
will be offset by the lack of a World Cup soccer contest and
the Queen’s 50th Jubilee celebration, that occurred in the
second quarter last year. The third quarter should benefit
from the lack of high, prior year, post-World Cup Soccer retail
inventories, as well as the introduction of our Carling brand
in Scotland supported by a major soccer sponsorship.
Cost of goods sold Americas cost of goods sold per barrel
was significantly lower in 2002 as a result of the impact of
selling company-owned distributorships during 2001, as well
as lower packaging materials costs and lower costs resulting
from operating efficiency initiatives within our distribution
and supply chain. We anticipate challenging cost of goods
sold per barrel comparisons in 2003, but we will continue
our efforts to reduce annual costs per barrel. We believe the
following factors will be most important going forward:
• First, input costs are expected to be slightly unfavorable.
Our outlook for 2003 is for modestly higher paper and agri-
cultural commodities costs, while aluminum can costs are
expected to be lower. Diesel fuel spot prices have been
significantly higher in recent months. If these high costs
are sustained during the year, our outlook will be adversely
affected. This could become more concerning in our current
political environment.
• Second, operating efficiency initiatives resulted in significant
savings in 2002, particularly within our transportation costs
and related supply-chain work. Beginning in the fourth quar-
ter of 2002, we began to lap the first significant savings
from these efforts started over a year earlier, which made
our cost of goods per barrel comparisons more challenging
than the first three quarters of 2002. Our 2003 comparisons
will continue to be challenging, but we continue to strive for
our long-term goal of cutting at least $5–$6 per barrel from
our controllable production costs over the next several years.
• Third, labor-related costs are expected to increase in 2003,
primarily due to higher pension and health care costs.
Europe segment 2002 cost of goods sold achieved
modest savings from operating and purchasing efficiencies.
We anticipate these savings to continue in 2003, if not
accelerate, as we achieve benefits from closing our Cape
Hill brewery in the fourth quarter of 2002.
Marketing, general and administrative expenses Marketing
and sales spending in both the Americas and Europe seg-
ments is expected to increase modestly in 2003 as we plan
to continue investing behind our brands and sales efforts,
as is our philosophy and past practice. Additional sales and
marketing spending will be committed on an opportunity-by-
opportunity basis, if incremental funding becomes available.
General and administrative expense will be higher in
2003 in both the Americas and Europe due to higher labor
benefit costs, due in part to higher pension expense, as well
as spending on systems and other investments to support
our larger, global business. Beginning in 2003, we will begin
allocating certain general and administrative expenses to the
Corporate segment. These expenses will include corporate
A D O L P H C O O R S C O M P A N Y A N D S U B S I D I A R I E S 45
office costs that are not attributable to either the Americas
or Europe operating segments and include more “corporate
center” functions like legal, finance, tax, insurance and other
corporate expenses.
Interest income and expense Consolidated 2003 interest
income is expected to be fairly consistent with 2002, and
will consist primarily of U.K. trade-loan interest income.
Interest expense will increase in 2003 vs. 2002,
because we will incur a full year of interest on the debt associ-
ated with our CBL acquisition in February 2002. Our interest
expense will also be impacted by the higher-rate, long-term
debt structure that was not in place until the second quarter
of 2002. Prior to finalizing the long-term structure, we had
higher short-term borrowings at lower interest rates.
Taxes We expect our consolidated effective tax rate to be at
36% or slightly lower. The effective tax rate could differ materi-
ally from 36%, depending upon the outcome of the 1999 and
2000 Internal Revenue Service (IRS) audits scheduled to be
completed by June 2003 and the impact of further tax planning.
Other In 2003, we have planned capital expenditures
(excluding capital improvements for our container joint ven-
tures, which will be recorded on the books of the respective
joint ventures) in the range of, or slightly lower than, the
$240.0 million we spent in 2002. In the Americas segment,
these investments will continue to reduce costs and improve
productivity. In the Europe segment, the major focus in 2003
is on our Burton-on-Trent brewery where we are increasing
packaging capability and efficiency following the closure of
the brewery at Cape Hill.
Quantitative and Qualitative Disclosures About Market Risk
In the normal course of business, we are exposed to fluctua-
tions in interest rates, foreign currencies and the prices of
production and packaging materials. We have established
policies and procedures to govern the strategic management
of these exposures through a variety of financial instruments.
By policy, we do not enter into any contracts for the purpose
of trading or speculation.
Our objective in managing our exposure to fluctuations
in interest rates, foreign currency exchange rates and pro-
duction and packaging materials prices is to decrease the
volatility of our earnings and cash flows affected by poten-
tial changes in underlying rates and prices. To achieve this
objective, we enter into foreign currency forward contracts,
commodity swaps, interest rate swaps and cross currency
swaps, the values of which change in the opposite direction
of the anticipated cash flows. We do not hedge the value of
net investments in foreign-currency-denominated operations
or translated earnings of foreign subsidiaries. Our primary
foreign currency exposures are British pound sterling (GBP),
Canadian dollar (CAD) and Japanese yen (YEN).
Derivatives are either exchange-traded instruments, or
over-the-counter agreements entered into with highly rated
financial institutions. No losses on over-the-counter agree-
ments due to counterparty credit issues are anticipated. All
over-the-counter agreements are entered into with counter-
parties rated no lower than A (S&P) or A2 (Moody’s). In some
instances we and our counterparties have reciprocal collater-
alization agreements regarding fair value positions in excess
of certain thresholds. These agreements call for the posting
of collateral in the form of cash, treasury securities or letters
of credit if a fair value loss position to us or our counterpar-
ties exceeds a certain amount. At December 29, 2002, no
collateral was posted by us or our counterparties.
On February 2, 2002, we acquired 100% of the outstand-
ing shares of Bass Holdings Ltd. and certain other intangible
assets from Interbrew. We also paid off certain intercompany
loan balances with Interbrew for a total purchase price of
1.2 billion GBP (approximately $1.7 billion at prevailing
exchange rates then in existence), plus associated fees,
expenses and a restructuring provision. This business was
subsequently renamed CBL. As part of our strategy to limit
the possible effects of foreign exchange on our acquisition
of CBL and the subsequent financial structure implemented
for the acquisition, we evaluated and entered into a number
of derivative instruments.
In December 2001, we entered into a commitment with
lenders for the financing of the acquisition of CBL assets.
Embedded in the commitment letter was a foreign currency
option, purchased by us, which limited our maximum amount
of U.S. dollars required to fund the acquisition. At the time
our acquisition bid was accepted we entered into a foreign
currency forward sale agreement to fix the GBP value of
some of our cash on hand that was used to fund the acquisi-
tion. The option in the loan commitment expired on February
11, 2002, and the foreign currency forward sale settled on
January 12, 2002. These two transactions resulted in a com-
bined loss and amortization expense of $1.2 million realized
during the first quarter of 2002.
46 A D O L P H C O O R S C O M P A N Y A N D S U B S I D I A R I E S
Management’s Discussion and Analysis ofFinancial Condition and Results of Operations
In connection with our acquisition of the CBL business, we
entered into new senior unsecured credit facilities, borrowing
$800 million of 5-year term debt and $750 million of bridge
financing. These funds were subsequently exchanged for GBP
and used to close the transaction. In order to better match
our assets and liabilities the $750 million of bridge financing
was recorded as an intercompany loan of 530 million GBP.
Upon establishing the intercompany loan, we entered into
a forward sale agreement for 530 million GBP. The forward
sale agreement was made in order to hedge the effect of
fluctuations in the GBP exchange rates on the re-measure-
ment of the intercompany loan. The forward sale agreement
expired on May 7, 2002. The change in fair value of the for-
ward sale was offset largely by increases or decreases in the
value of the intercompany loan. (See “Derivative Instruments,”
Note 12 to the consolidated financial statements.)
Since the underlying financing associated with the inter-
company loan was short-term in nature (the bridge loan), and
because our forward sale agreements established as hedges
of the intercompany loan expired on May 7, 2002, we were
exposed to fluctuations of the GBP exchange rate on our
cash requirement to settle the forwards and repay the bridge
loan. Therefore, on February 2, 2002, we paid approximately
$1.7 billion for a 530 million GBP call option with a strike
rate of 1.48 U.S. dollars to GBP. This option expired May 7,
2002. This option limited the maximum amount of U.S. dol-
lars required to settle our forward sale agreement and repay
our bridge loan obligations. The cash needed to settle our
forward sale of 530 GBP, and subsequently, the $750 mil-
lion bridge loan was satisfied by our private placement of
$850 million principal amount of 63⁄8% Senior notes, due
2012 (See “Derivative Instruments,” Note 12 to the consoli-
dated financial statements) and cash on hand. Amortization
expense of approximately $1.7 million related to the call
option was recognized in the first quarter of 2002.
On May 7, 2002, we entered into certain cross currency
swaps totaling 530 million GBP (approximately $774 mil-
lion). The swaps included an initial exchange of principal
on the date of the private placement and will require final
principal exchange 10 years later. The swaps also call for
an exchange of fixed GBP interest payments for fixed U.S.
dollar interest receipts. At the initial principal exchange, we
paid U.S. dollars to a counterparty and received GBP. Upon
final exchange, we will provide GBP to the counterparty and
receive U.S. dollars. The cross currency swaps have been
designated as cash flow hedges of the changes in value of
the future GBP interest and principal receipts that resulted
from changes in the U.S. dollar to GBP exchange rates on an
intercompany loan between CBC and our Europe subsidiary.
On May 28, 2002, we entered into an interest rate swap
agreement related to $76.2 million of our 63⁄8% Senior notes
due 2012. The interest rate swap converted $76.2 million
notional amount from fixed rates to floating rates and matures
in 2012. We will receive fixed U.S. dollar interest payments
semi-annually at a rate of 63⁄8% per annum and pay a rate to
our counterparty based on a credit spread of 0.789% plus
the three-month LIBOR rate, thereby exchanging a fixed inter-
est obligation for a floating interest rate obligation. There
was no exchange of principal at the inception of the swap.
We designated the interest rate swap as a fair value hedge
of the changes in the fair value of $76.2 million of our 63⁄8%
Senior notes due 2012 attributable to changes in the LIBOR
swap rates.
We monitor foreign exchange risk, interest rate risk and
related derivatives using two techniques-sensitivity analysis
and Value-at-Risk. Our market-sensitive derivative and other
financial instruments, as defined by the SEC, are foreign
currency forward contracts, commodity swaps, interest rate
swaps, and cross currency swaps.
We use Value-at-Risk to monitor the foreign exchange
and interest rate risk of our cross-currency swaps. The Value-
at-Risk provides an estimate of the level of a one-day loss
that may be equaled or exceeded due to changes in the fair
value of these foreign exchange rate and interest rate-sensi-
tive financial instruments. The type of Value-at-Risk model
used to estimate the maximum potential one-day loss in the
fair value is a variance/covariance method. The Value-at-Risk
model assumes normal market conditions and a 95% confi-
dence level. There are various modeling techniques that can
be used to compute value at risk. The computations used
to derive our values take into account various correlations
between currency rates and interest rates. The correlations
have been determined by observing foreign exchange cur-
rency market changes and interest rate changes over the
most recent one-year period. We have excluded anticipated
transactions, firm commitments, cash balances, and accounts
receivable and payable denominated in foreign currencies
from the Value-at-Risk calculation, some of which these
instruments are intended to hedge.
The Value-at-Risk calculation is a statistical measure of
risk exposure based on probabilities and is not intended to
represent actual losses in fair value that we may incur. The
A D O L P H C O O R S C O M P A N Y A N D S U B S I D I A R I E S 47
calculated Value-at-Risk result does not represent the full
extent of the possible loss that may occur. It attempts to
represent the most likely measure of potential loss that may
be experienced 95 times out of 100 due to adverse market
events that may occur. Actual future gains and losses will dif-
fer from those estimated by Value-at-Risk because of changes
or differences in market rates and interrelationships, hedging
instruments, hedge percentages, timing and other factors.
The estimated maximum one-day loss in fair value on our
cross-currency swaps, derived using the Value-at-Risk model,
was $8.6 million at December 29, 2002. As we did not enter
into the cross currency swaps until the second quarter of
2002, there is no comparable one-day loss in fair value at
December 30, 2001. Such a hypothetical loss in fair value
is a combination of the foreign exchange and interest rate
components of the cross currency swap. Value changes due
to the foreign exchange component would be offset com-
pletely by increases in the value of our inter-company loan,
the underlying transaction being hedged. The hypothetical
loss in fair value attributable to the interest rate component
would be deferred until termination or maturity.
Details of all other market-sensitive derivative and other
financial instruments, including their fair values, are included in
the table below. These instruments include foreign currencies,
commodity swaps, interest rate swap and cross-currency swaps.
Notional principal(In thousands) amounts (USD) Fair values Maturity
December 29, 2002
Foreign currency management
Forwards $÷÷«19,655 $÷÷÷106 01/03–12/03
Cross currency swap 773,800 (43,621) 05/12
Commodity pricing management
Swaps 112,573 (4,630) 03/03–09/04
Interest rate pricing management
Interest rate swap 76,200 8,493 05/12
December 30, 2001
Foreign currency management
Option1 1,705,000 (1,023) 02/02
Forwards 217,370 2,336 01/02–04/03
Commodity pricing management
Swaps 132,477 (10,563) 02/02–02/04
1 The foreign exchange option for $1.7 billion notional was purchased to hedge our exposure to fluctuations in the GBP exchange rate related to acquisition of certain CBL assets. This option was settled in May 2002.
Maturities of derivative financial instruments held on
December 29, 2002, are as follows:
2004 and(In thousands) 20031 thereafter
$(3,747) $(35,905))
1 Amount includes the estimated deferred net loss of $4.0 million that is expected to be recognized over the next 12 months, on certain forward foreign exchange contracts andproduction and packaging materials derivative contracts, when the underlying forecastedcash flow transactions occur.
Inter-company loans are generally hedged against foreign
exchange risk through the use of cross-currency swaps with
third parties.
A sensitivity analysis has been prepared to estimate our
exposure to market risk of interest rates, foreign exchange
rates and commodity prices. The sensitivity analysis reflects
the impact of a hypothetical 10% adverse change in the
applicable market interest rates, foreign exchange rates and
commodity prices. The volatility of the applicable rates and
prices are dependent on many factors that cannot be fore-
cast with reliable accuracy. Therefore, actual changes in fair
values could differ significantly from the results presented
in the table below.
The following table presents the results of the sensitivity
analysis of our derivative and debt portfolio:
(In millions, as of) Dec. 29, 2002 Dec. 30, 2001
Estimated fair value volatility
Foreign currency risk: forwards, option $÷(2.1) $(22.2)
Interest rate risk: debt, swaps $(42.1) $««(0.4)
Commodity price risk: swaps $(10.8) $(12.2)
$ $
$ $
$ $
$ $
$ $
$ $
48 A D O L P H C O O R S C O M P A N Y A N D S U B S I D I A R I E S
Management’s Responsibility for Financial Statements
The management of Adolph Coors Company and its sub-
sidiaries has the responsibility for the preparation, integrity and
fair presentation of the accompanying financial statements.
The statements were prepared in accordance with gener-
ally accepted accounting principles applied on a consistent
basis and, in management’s opinion, are fairly presented.
The financial statements include amounts that are based
on management’s best estimates and judgments. Management
also prepared the other information in the annual report and
is responsible for its accuracy and consistency with the
financial statements.
In order to meet these responsibilities, the Company
maintains a system of internal control, which is designed to
provide reasonable assurance to management and to the
Board of Directors regarding the preparation and publication
of reliable and accurate financial statements; the safeguard-
ing of assets; the effectiveness and efficiency of operations;
and compliance with applicable laws and regulations.
The system includes, among other things, division of
responsibility, a documented organization structure, established
policies and procedures that are communicated throughout
the Company, and careful selection and training of our people.
In addition, the Company maintains an internal auditing
program that assesses the effectiveness of the internal con-
trols and recommends possible improvements. Management
has considered the internal control recommendations and has
taken actions that we believe are cost-effective and respond
appropriately to these recommendations.
The Board of Directors, operating through its Audit
Committee, which is composed of outside directors, provides
oversight to the financial reporting process.
W. Leo Kiely IIIPresident and Chief Executive Officer,Adolph Coors Company andCoors Brewing Company
Timothy V. Wolf Vice President and Chief Financial Officer,Adolph Coors CompanySenior Vice President and Chief Financial Officer,Coors Brewing Company
Report of Independent Accountants
To the Board of Directors and Shareholders
of Adolph Coors Company:
In our opinion, the accompanying consolidated balance
sheets and the related consolidated statements of income,
comprehensive income, shareholders’ equity and cash
flows present fairly, in all material respects, the financial
position of Adolph Coors Company and its subsidiaries
at December 29, 2002, and December 30, 2001, and the
results of their operations and their cash flows for each
of the three years in the period ended December 29, 2002,
in conformity with accounting principles generally accepted
in the United States of America. These financial statements
are the responsibility of the Company’s management; our
responsibility is to express an opinion on these financial
statements based on our audits. We conducted our audits
of these statements in accordance with auditing standards
generally accepted in the United States of America which
require that we plan and perform the audit to obtain reason-
able assurance about whether the financial statements are
free of material misstatement. An audit includes examining,
on a test basis, evidence supporting the amounts and disclo-
sures in the financial statements, assessing the accounting
principles used and significant estimates made by man-
agement, and evaluating the overall financial statement
presentation. We believe that our audits provide a reason-
able basis for our opinion.
PricewaterhouseCoopers LLPDenver, ColoradoFebruary 6, 2003
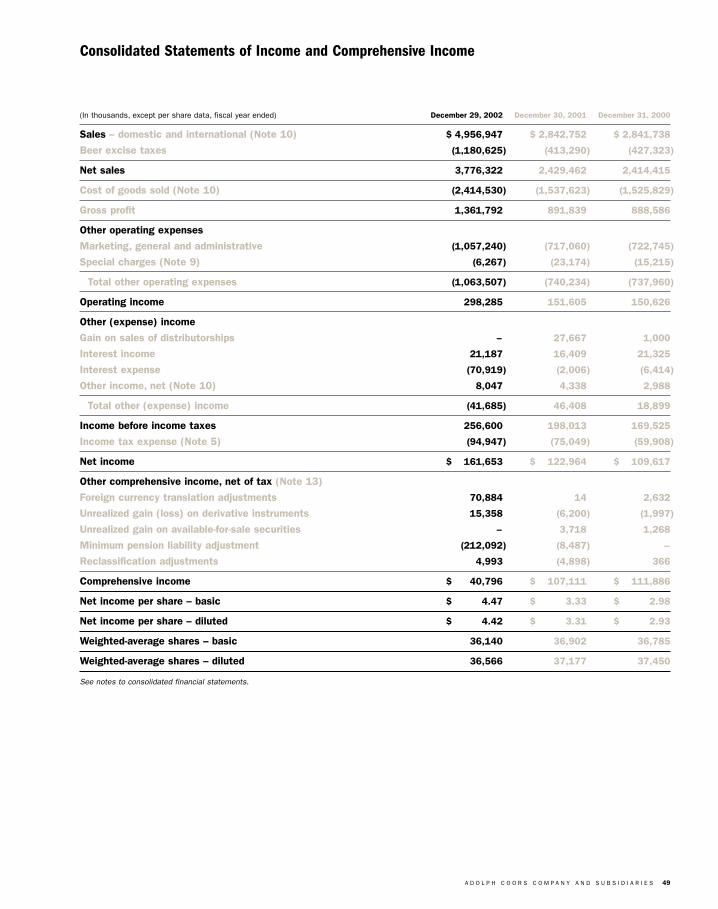
A D O L P H C O O R S C O M P A N Y A N D S U B S I D I A R I E S 49
Consolidated Statements of Income and Comprehensive Income
(In thousands, except per share data, fiscal year ended) December 29, 2002 December 30, 2001 December 31, 2000
Sales – domestic and international (Note 10) $«4,956,947 $«2,842,752 $«2,841,738
Beer excise taxes (1,180,625) (413,290) (427,323)
Net sales 3,776,322 2,429,462 2,414,415
Cost of goods sold (Note 10) (2,414,530) (1,537,623) (1,525,829)
Gross profit 1,361,792 891,839 888,586
Other operating expenses
Marketing, general and administrative (1,057,240) (717,060) (722,745)
Special charges (Note 9) (6,267) (23,174) (15,215)
Total other operating expenses (1,063,507) (740,234) (737,960)
Operating income 298,285 151,605 150,626
Other (expense) income
Gain on sales of distributorships – 27,667 1,000
Interest income 21,187 16,409 21,325
Interest expense (70,919) (2,006) (6,414)
Other income, net (Note 10) 8,047 4,338 2,988
Total other (expense) income (41,685) 46,408 18,899
Income before income taxes 256,600 198,013 169,525
Income tax expense (Note 5) (94,947) (75,049) (59,908)
Net income $÷÷161,653 $««««122,964 $««««109,617
Other comprehensive income, net of tax (Note 13)
Foreign currency translation adjustments 70,884 14 2,632
Unrealized gain (loss) on derivative instruments 15,358 (6,200) (1,997)
Unrealized gain on available-for-sale securities – 3,718 1,268
Minimum pension liability adjustment (212,092) (8,487) –
Reclassification adjustments 4,993 (4,898) 366
Comprehensive income $÷÷÷40,796 $««««107,111 $««««111,886
Net income per share – basic $÷÷÷÷÷4.47 $««««««««««3.33 $««««««««««2.98
Net income per share – diluted $÷÷÷÷÷4.42 $««««««««««3.31 $««««««««««2.93
Weighted-average shares – basic 36,140 36,902 36,785
Weighted-average shares – diluted 36,566 37,177 37,450
See notes to consolidated financial statements.
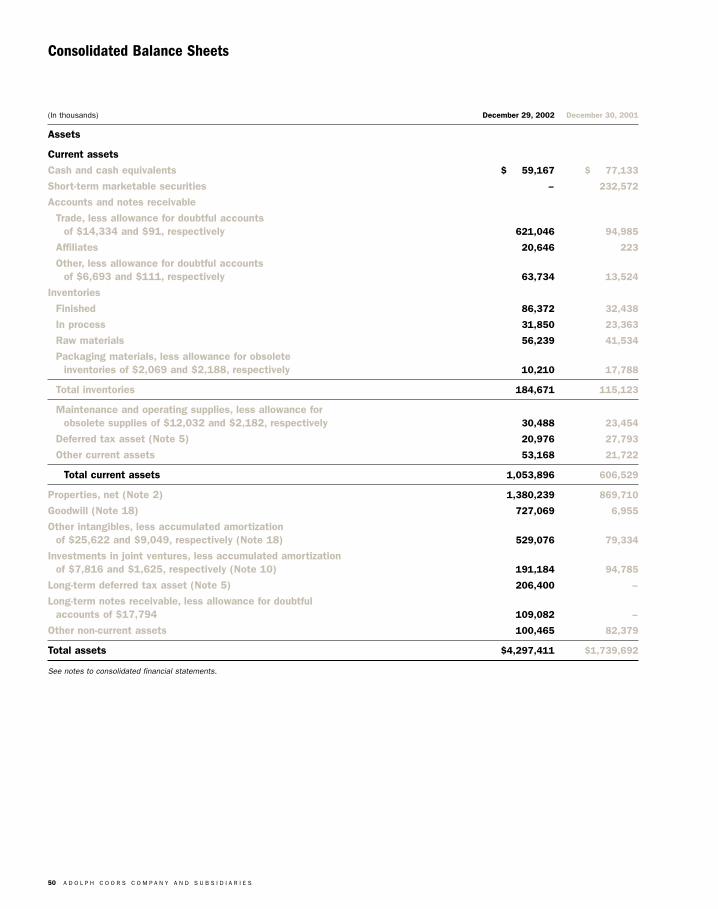
50 A D O L P H C O O R S C O M P A N Y A N D S U B S I D I A R I E S
Consolidated Balance Sheets
(In thousands) December 29, 2002 December 30, 2001
Assets
Current assets
Cash and cash equivalents $÷÷«59,167 $«««««77,133
Short-term marketable securities – 232,572
Accounts and notes receivable
Trade, less allowance for doubtful accounts of $14,334 and $91, respectively 621,046 94,985
Affiliates 20,646 223
Other, less allowance for doubtful accounts of $6,693 and $111, respectively 63,734 13,524
Inventories
Finished 86,372 32,438
In process 31,850 23,363
Raw materials 56,239 41,534
Packaging materials, less allowance for obsoleteinventories of $2,069 and $2,188, respectively 10,210 17,788
Total inventories 184,671 115,123
Maintenance and operating supplies, less allowance forobsolete supplies of $12,032 and $2,182, respectively 30,488 23,454
Deferred tax asset (Note 5) 20,976 27,793
Other current assets 53,168 21,722
Total current assets 1,053,896 606,529
Properties, net (Note 2) 1,380,239 869,710
Goodwill (Note 18) 727,069 6,955
Other intangibles, less accumulated amortization of $25,622 and $9,049, respectively (Note 18) 529,076 79,334
Investments in joint ventures, less accumulated amortization of $7,816 and $1,625, respectively (Note 10) 191,184 94,785
Long-term deferred tax asset (Note 5) 206,400 –
Long-term notes receivable, less allowance for doubtful accounts of $17,794 109,082 –
Other non-current assets 100,465 82,379
Total assets $4,297,411 $1,739,692
See notes to consolidated financial statements.
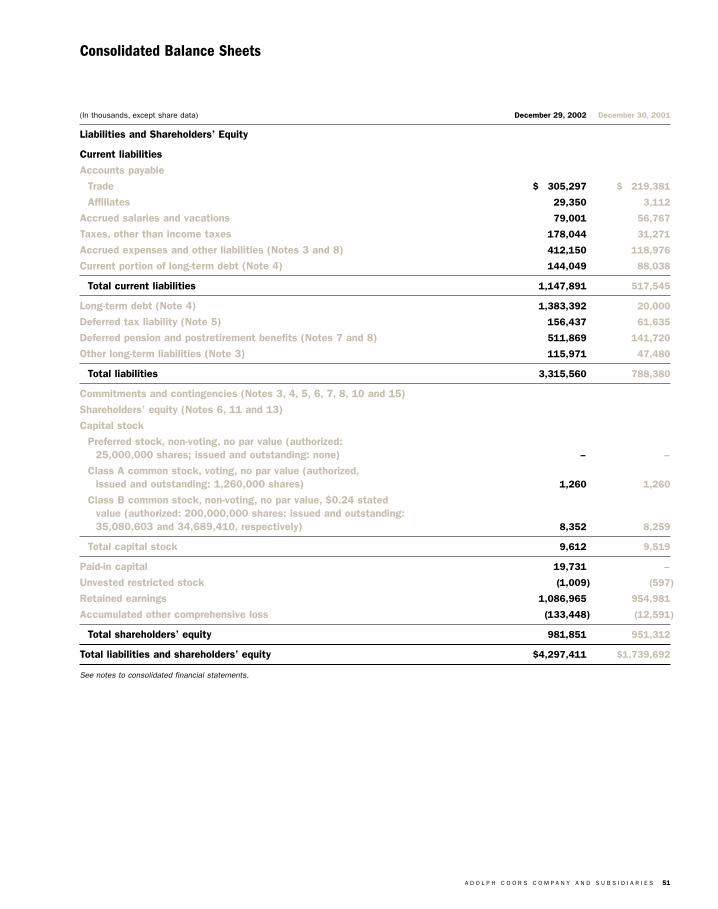
A D O L P H C O O R S C O M P A N Y A N D S U B S I D I A R I E S 51
Consolidated Balance Sheets
(In thousands, except share data) December 29, 2002 December 30, 2001
Liabilities and Shareholders’ Equity
Current liabilities
Accounts payable
Trade $÷«305,297 $«««219,381
Affiliates 29,350 3,112
Accrued salaries and vacations 79,001 56,767
Taxes, other than income taxes 178,044 31,271
Accrued expenses and other liabilities (Notes 3 and 8) 412,150 118,976
Current portion of long-term debt (Note 4) 144,049 88,038
Total current liabilities 1,147,891 517,545
Long-term debt (Note 4) 1,383,392 20,000
Deferred tax liability (Note 5) 156,437 61,635
Deferred pension and postretirement benefits (Notes 7 and 8) 511,869 141,720
Other long-term liabilities (Note 3) 115,971 47,480
Total liabilities 3,315,560 788,380
Commitments and contingencies (Notes 3, 4, 5, 6, 7, 8, 10 and 15)
Shareholders’ equity (Notes 6, 11 and 13)
Capital stock
Preferred stock, non-voting, no par value (authorized:25,000,000 shares; issued and outstanding: none) – –
Class A common stock, voting, no par value (authorized,issued and outstanding: 1,260,000 shares) 1,260 1,260
Class B common stock, non-voting, no par value, $0.24 statedvalue (authorized: 200,000,000 shares; issued and outstanding:35,080,603 and 34,689,410, respectively) 8,352 8,259
Total capital stock 9,612 9,519
Paid-in capital 19,731 –
Unvested restricted stock (1,009) (597)
Retained earnings 1,086,965 954,981
Accumulated other comprehensive loss (133,448) (12,591)
Total shareholders’ equity 981,851 951,312
Total liabilities and shareholders’ equity $4,297,411 $1,739,692
See notes to consolidated financial statements.
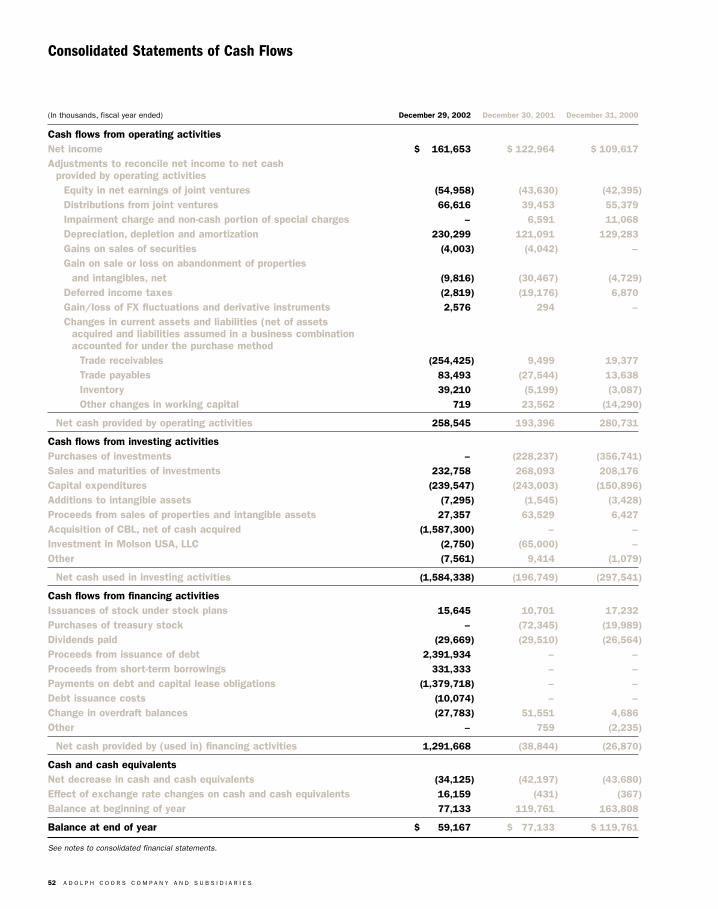
52 A D O L P H C O O R S C O M P A N Y A N D S U B S I D I A R I E S
Consolidated Statements of Cash Flows
(In thousands, fiscal year ended) December 29, 2002 December 30, 2001 December 31, 2000
Cash flows from operating activitiesNet income $÷÷161,653 $«122,964 $«109,617
Adjustments to reconcile net income to net cash provided by operating activities
Equity in net earnings of joint ventures (54,958) (43,630) (42,395)
Distributions from joint ventures 66,616 39,453 55,379
Impairment charge and non-cash portion of special charges – 6,591 11,068
Depreciation, depletion and amortization 230,299 121,091 129,283
Gains on sales of securities (4,003) (4,042) –
Gain on sale or loss on abandonment of properties and intangibles, net (9,816) (30,467) (4,729)
Deferred income taxes (2,819) (19,176) 6,870
Gain/loss of FX fluctuations and derivative instruments 2,576 294 –
Changes in current assets and liabilities (net of assets acquired and liabilities assumed in a business combination accounted for under the purchase method
Trade receivables (254,425) 9,499 19,377
Trade payables 83,493 (27,544) 13,638
Inventory 39,210 (5,199) (3,087)
Other changes in working capital 719 23,562 (14,290)
Net cash provided by operating activities 258,545 193,396 280,731
Cash flows from investing activitiesPurchases of investments – (228,237) (356,741)
Sales and maturities of investments 232,758 268,093 208,176
Capital expenditures (239,547) (243,003) (150,896)
Additions to intangible assets (7,295) (1,545) (3,428)
Proceeds from sales of properties and intangible assets 27,357 63,529 6,427
Acquisition of CBL, net of cash acquired (1,587,300) – –
Investment in Molson USA, LLC (2,750) (65,000) –
Other (7,561) 9,414 (1,079)
Net cash used in investing activities (1,584,338) (196,749) (297,541)
Cash flows from financing activitiesIssuances of stock under stock plans 15,645 10,701 17,232
Purchases of treasury stock – (72,345) (19,989)
Dividends paid (29,669) (29,510) (26,564)
Proceeds from issuance of debt 2,391,934 – –
Proceeds from short-term borrowings 331,333 – –
Payments on debt and capital lease obligations (1,379,718) – –
Debt issuance costs (10,074) – –
Change in overdraft balances (27,783) 51,551 4,686
Other – 759 (2,235)
Net cash provided by (used in) financing activities 1,291,668 (38,844) (26,870)
Cash and cash equivalentsNet decrease in cash and cash equivalents (34,125) (42,197) (43,680)
Effect of exchange rate changes on cash and cash equivalents 16,159 (431) (367)
Balance at beginning of year 77,133 119,761 163,808
Balance at end of year $÷÷÷59,167 $«««77,133 $«119,761
See notes to consolidated financial statements.
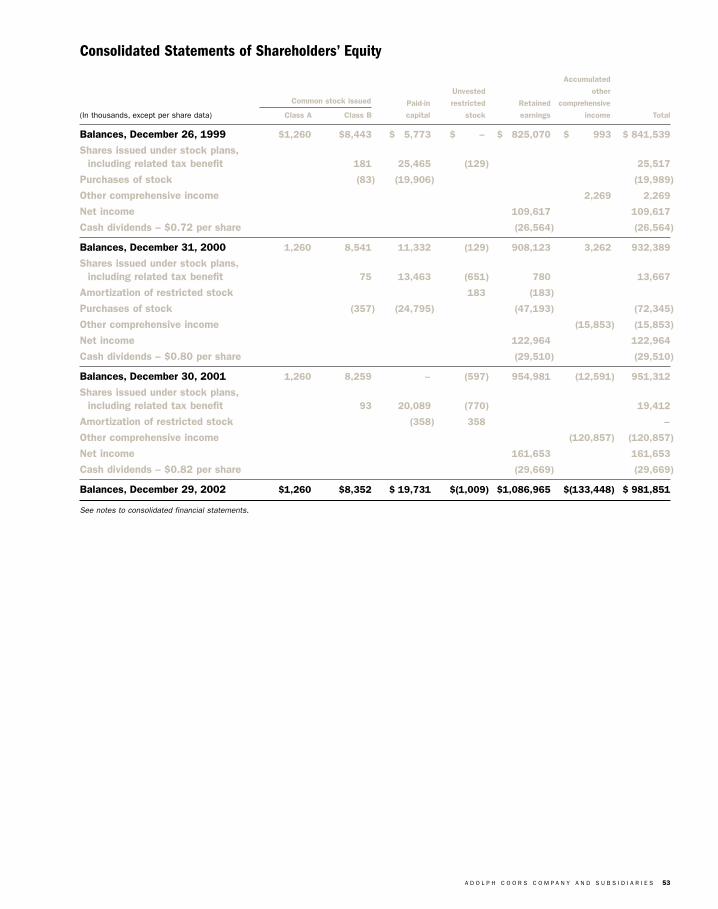
A D O L P H C O O R S C O M P A N Y A N D S U B S I D I A R I E S 53
Consolidated Statements of Shareholders’ Equity
Accumulated
Unvested otherCommon stock issued Paid-in restricted Retained comprehensive
(In thousands, except per share data) Class A Class B capital stock earnings income Total
Balances, December 26, 1999 $1,260 $8,443 $«««5,773 $÷««««««– $÷«825,070 $««««««÷993 $«841,539
Shares issued under stock plans,including related tax benefit 181 25,465 (129) 25,517
Purchases of stock (83) (19,906) (19,989)
Other comprehensive income 2,269 2,269
Net income 109,617 109,617
Cash dividends – $0.72 per share (26,564) (26,564)
Balances, December 31, 2000 1,260 8,541 11,332 «(129) 908,123 3,262 932,389
Shares issued under stock plans,including related tax benefit 75 13,463 (651) 780 13,667
Amortization of restricted stock 183 (183)
Purchases of stock (357) (24,795) (47,193) (72,345)
Other comprehensive income (15,853) (15,853)
Net income 122,964 122,964
Cash dividends – $0.80 per share (29,510) (29,510)
Balances, December 30, 2001 1,260 8,259 – (597) 954,981 (12,591) 951,312
Shares issued under stock plans,including related tax benefit 93 20,089 (770) 19,412
Amortization of restricted stock (358) 358 –
Other comprehensive income (120,857) (120,857)
Net income 161,653 161,653
Cash dividends – $0.82 per share (29,669) (29,669)
Balances, December 29, 2002 $1,260 $8,352 $«19,731 $(1,009) $1,086,965 $(133,448) $«981,851
See notes to consolidated financial statements.
54 A D O L P H C O O R S C O M P A N Y A N D S U B S I D I A R I E S
Notes to Consolidated Financial Statements
1. Summary of Significant Accounting Policies
Fiscal year Our fiscal year is a 52- or 53-week period
ending on the last Sunday in December. Fiscal years ended
December 29, 2002, and December 30, 2001, were both
52-week periods. Fiscal year ended December 31, 2000,
was a 53-week period.
Principles of consolidation Our consolidated financial
statements include our accounts and our majority-owned
and controlled domestic and foreign subsidiaries. All signif-
icant intercompany accounts and transactions have been
eliminated. The equity method of accounting is used for our
investments in affiliates where we have the ability to exer-
cise significant influence and our investment in the Colorado
Rockies Baseball Partnership is accounted for under the
cost method (see Note 10, “Investments”).
Use of estimates Our consolidated financial statements are
prepared in accordance with accounting principles generally
accepted in the United States (GAAP). These accounting prin-
ciples require us to make certain estimates, judgments and
assumptions. We believe that the estimates, judgments and
assumptions are reasonable, based on information available
at the time they are made. These estimates, judgments and
assumptions can affect the reported amounts of assets and
liabilities as of the date of the financial statements, as well
as the reported amounts of revenue and expenses during
the periods presented. We also assess potential losses in
relation to various business activities and, if a loss is consid-
ered probable and the amount can be reasonably estimated,
we recognize an expense for the estimated loss. As addi-
tional information becomes available, the potential liability is
reassessed and the estimate may be revised. To the extent
there are material differences between these estimates and
actual results, our consolidated financial statements are
affected. In many cases, the accounting treatment of a par-
ticular transaction is specifically dictated by GAAP and does
not require our judgment in its application. There are also
areas in which our judgment in selecting any available alter-
native would not produce a materially different result.
Reclassifications Certain reclassifications have been made
to the 2001 and 2000 financial statements to conform to
the 2002 presentation.
Revenue recognition Revenue is recognized when product
is shipped and the risk of loss transfers to our unrelated
customers, which are principally independent retailers in the
United Kingdom and independent distributors or wholesalers
in the United States. In the United Kingdom, excise taxes
are included in the purchase price from the vendor on bever-
ages purchased from third parties for resale (factored brands
business) and are included in our Cost of goods sold when
ultimately sold. We pass those costs onto our customers
and include the related amounts in our Net sales. The cost
of various programs, such as price promotions, rebates and
coupon programs are treated as a reduction of sales. Sales
of products are for cash or credit terms agreed to by us
based on a customer’s credit worthiness. Outside of unusual
circumstances, if product is retrieved, it is generally for fail-
ure to meet our quality standards, not caused by distributor
actions. Products that do not meet our high quality stan-
dards are retrieved and destroyed. We do not have standard
terms that permit return of product. We estimate the costs
for product retrievals and record those costs in Cost of
Goods Sold in the Consolidated Statements of Income each
period. We reduce revenue at the value of the original sales
price in the period that the product is returned.
Cost of goods sold The types of costs included in Cost
of goods sold are beer raw materials, packaging materials
(including promotional packaging), manufacturing costs, plant
administrative support and overheads, and freight and ware-
house costs (including distribution network costs). Distribution
network costs include inbound and outbound freight charges,
purchasing and receiving costs, inspection costs, warehous-
ing and internal transfer costs.
Equity method accounting We generally apply the equity
method of accounting to 20%–50% owned investments
where we exercise significant influence. These investments
primarily involve equity ownership in captive suppliers of
goods and services for our business. These investments
involve operations that manufacture bottles and cans for our
Americas business and transportation services in Europe.
They also include ventures that manufacture, distribute and
sell Coors Light in Canada, Molson branded beers in the
U.S. and Grolsch in the United Kingdom.
A D O L P H C O O R S C O M P A N Y A N D S U B S I D I A R I E S 55
We own a 50.1% interest in a non-consolidated joint
venture (Coors Canada) that we account for using the equity
method of accounting due to the effective control of the
partnership being shared equally by the partners under the
operating agreement.
There are no related parties that own interests in our
equity method investments.
Marketing, general and administrative The types of costs
included in our Marketing, general and administrative expenses
consist predominately of advertising and non-manufacturing
administrative and overhead costs. Distribution network
costs are not included in our Marketing, general and admin-
istrative expenses, but are included in Cost of goods sold
as described above. The creative portion of our advertising
activities are expensed as incurred. The costs to procure our
advertising and promotional material are generally expensed
when the advertising is first run. Cooperative advertising
expenses are included in Marketing, general and administrative
costs. Advertising expense was $586.2 million, $465.2 million
and $477.3 million for years 2002, 2001 and 2000, respec-
tively. Prepaid advertising costs of $34.0 million ($12.5 in
current and $21.5 million in long-term) and $30.4 million
($5.6 million in current and $24.8 million in long term) were
included in Other current and Other non-current assets in
the Consolidated Balance Sheets at December 29, 2002,
and December 30, 2001, respectively.
Income taxes The provision for income taxes is based on
income and expense amounts as reported in the Consolidated
Statements of Income. Deferred income taxes are recognized
for the effect of temporary differences between financial
reporting and tax filing in accordance with the requirements
of Statement of Financial Accounting Standards No. 109,
Accounting for Income Taxes (SFAS No. 109). We record a
valuation allowance to reduce our deferred tax assets to the
amount that is more likely than not to be realized. We do
not provide deferred taxes on the outside basis differences
in our acquired foreign subsidiary’s stock. This outside
basis difference is permanent in nature under Accounting
Principles Board No. 23, Accounting for Income Taxes,
Special Areas (APB No. 23), because we do not intend to
take any action that would trigger the gain inherent in the
book over tax basis difference (see Note 5, “Income Taxes,”
for additional information).
Cash and cash equivalents Cash equivalents represent
highly liquid investments with original maturities of 90 days
or less. The fair value of these investments approximates
their carrying value.
Trade loans CBL extends loans to retail outlets that sell
our brands. Some of these loans provide for no interest to
be payable, others provide for payment of a below market
interest rate. In return, the retail outlets receive smaller
discounts on beer and other beverage products purchased
from us, with the net result being CBL attaining a market
return on the outstanding loan balance.
Consistent with GAAP, we have reclassified a portion of
the beer revenue into interest income to reflect a market
rate of interest on these notes. In 2002, this amount was
$16.4 million. We have included this interest income in the
Europe segment since it is related solely to the Europe busi-
ness, even though all other interest income and expense is
reflected in the Corporate segment.
Allowance for doubtful accounts In the Americas segment,
our allowance for doubtful accounts and credit risk is insignif-
icant as the majority of the Americas accounts receivable
balance is generated from sales to independent distributors
with whom we have a predetermined collection date arranged
through electronic funds transfer. Also, in the Americas, we
secure substantially all of our product sale credit risk with
purchase money security interests in inventory and proceeds,
personal guarantees and other letters of credit.
Because the majority of CBL sales are directly to retail
customers, and because of the policy of making trade loans
to customers, our ability to manage credit risk in this busi-
ness is critical. At CBL, we provide allowances for trade
receivables and trade loans associated with the ability to col-
lect outstanding receivables from our customers. Generally,
provisions are recorded to cover the full exposure to a spe-
cific customer (total amount of trade accounts and loans
from a specific customer less the amount of security and
insurance coverage) at the point the account is considered
uncollectible. At this time, we record the provision as a bad
debt in Marketing, general and administrative expenses.
Provisions are reversed upon recoverability of the account
or relieved at the point an account is written off.
56 A D O L P H C O O R S C O M P A N Y A N D S U B S I D I A R I E S
Notes to Consolidated Financial Statements
We are not able to predict changes in financial condition
of our customers and, if circumstances related to our cus-
tomers deteriorate, our estimates of the recoverability of our
trade receivables and trade loans could be materially affected
and we may be required to record additional allowances.
Inventories Inventories are stated at the lower of cost or
market. Cost is determined by the last-in, first-out (LIFO)
method for substantially all inventories in the United States
and on the first-in, first-out (FIFO) method in the United
Kingdom. Current cost in the United States, determined on
the FIFO method, exceeded LIFO cost by $39.3 million and
$41.5 million at December 29, 2002 and December 30,
2001, respectively.
Allowance for obsolete inventory We regularly assess the
valuation of our inventories and write down those inventories
which are obsolete or in excess of our forecasted usage to
their estimated realizable value (difference between the cost
of the inventory and the estimated market value). Our esti-
mates of realizable value are based upon our analyses and
assumptions including, but not limited to, historical usage,
future demand and market requirements. If market conditions
are less favorable than our forecasts, or actual demand from
our customers is lower than our estimates, we may be required
to record additional inventory write-downs.
Properties Land, buildings and machinery and equipment
are stated at cost. Depreciation is calculated principally on
the straight-line method over the following estimated useful
lives: buildings and improvements, 10 to 40 years; and
machinery and equipment, 3 to 20 years. Certain equipment
held under capital lease is classified as equipment and
amortized using the straight-line method over the lease term
and the related obligation is recorded as a liability. Lease
amortization is included in depreciation expense. Accelerated
depreciation methods are generally used for income tax pur-
poses. Expenditures for new facilities and improvements that
substantially extend the capacity or useful life of an asset
are capitalized. Start-up costs associated with manufactur-
ing facilities, but not related to construction, are expensed
as incurred. Ordinary repairs and maintenance are expensed
as incurred.
Dispense assets CBL owns and maintains the dispense
equipment in On-Trade retail outlets. Dispense equipment,
which moves the beer from the keg in the cellar to the glass,
is capitalized at cost upon installation and depreciated on
a straight-line basis over an average life of 7 years. Labor
costs incurred and materials used in the dispense installa-
tions are capitalized and depreciated over 2 years. Dispense
equipment awaiting installation is held in inventory and
valued at the lower of cost or market. Ordinary repairs and
maintenance are expensed as incurred.
System development costs We capitalize certain system
development costs that meet established criteria, in accor-
dance with Statement of Position 98-1, Accounting for the
Costs of Computer Systems Developed or Obtained for
Internal Use (SOP 98-1). Amounts capitalized as machinery
and equipment are amortized on a straight-line basis over
three to five years. At December 29, 2002 and December 30,
2001, amounts capitalized were $3.9 million and $8.4 mil-
lion, respectively. Related amortization expense was $0.6 mil-
lion, $1.2 million and $0.8 million for fiscal years 2002,
2001 and 2000, respectively. We also capitalized $26.8 mil-
lion and $4.7 million related to our system implementation
in 2002 and 2001, respectively. These amounts are included
in our construction in progress balance as of December 29,
2002 and December 30, 2001, respectively, due to the fact
that the related asset had not yet been put into use. System
development costs not meeting the criteria in SOP 98-1,
including system reengineering, are expensed as incurred.
Goodwill and intangible asset valuation In June 2001,
the Financial Accounting Standards Board (FASB) issued
Statements of Financial Accounting Standards No. 141,
Business Combinations (SFAS No. 141), and No. 142,
Goodwill and Other Intangible Assets (SFAS No. 142).
SFAS No. 141 requires that all business combinations be
accounted for using the purchase method of accounting and
that certain intangible assets acquired in a business combi-
nation be recognized as assets apart from goodwill. SFAS
No. 141 was effective for all business combinations initiated
after June 30, 2001. SFAS No. 142 requires goodwill and
indefinite lived assets to be tested for impairment under cer-
tain circumstances, and written down when impaired, rather
than being amortized as previously required. Furthermore,
A D O L P H C O O R S C O M P A N Y A N D S U B S I D I A R I E S 57
SFAS No. 142 requires purchased intangible assets other than
goodwill to be amortized over their useful lives unless those
lives are determined to be indefinite. Purchased intangible
assets are carried at cost less accumulated amortization.
Impairment policy When events or changes in circumstances
indicate that the carrying amount of long-lived assets, includ-
ing definite lived intangible assets may not be recoverable
and at least annually, an evaluation is performed to deter-
mine if an impairment exists. We compare the carrying
amount of the assets to the undiscounted expected future
cash flows. If this comparison indicates that an impairment
exists, the assets are written down to fair value. Fair value
would typically be calculated using discounted expected
future cash flows. All relevant factors are considered in
determining whether an impairment exists in accordance
with Statement of Financial Accounting Standards No. 144,
Accounting for the Impairment or Disposal of Long-Lived
Assets (SFAS No. 144).
Contingencies, environmental and litigation reserves
When we determine that it is probable that a liability for
environmental matters or other legal actions exists and the
amount of the loss is reasonably estimable, an estimate of
the future costs are recorded as a liability in the financial
statements. Costs that extend the life, increase the capacity
or improve the safety or efficiency of company-owned assets
or are incurred to mitigate or prevent future environmental
contamination may be capitalized. Other environmental costs
are expensed when incurred.
Derivative instruments Our objective in managing our
exposure to fluctuations in interest rates, foreign currency
exchange rates and production and packaging materials
prices is to decrease the volatility of earnings and cash
flows associated with changes in the applicable rates and
prices. To achieve this objective, we primarily enter into for-
ward contracts, options and swap agreements the values
of which change in the opposite direction of the anticipated
cash flows. Derivative instruments, which we designate as
hedges of forecasted transactions and which qualify for hedge
accounting treatment under SFAS No. 133, are considered
cash flows hedges. Any gains or losses associated with the
effective portion of these hedges are included in Accumulated
other comprehensive income until earnings are affected by
the variability of cash flows. Any remaining gain or loss,
relating to the ineffective portion of the hedge, is recognized
in current earnings. In calculating effectiveness for SFAS
No. 133 purposes, we do not exclude any component of
the derivative instruments’ gain or loss from the calculation.
The cash flows of the derivative instruments are expected to
be highly effective in achieving offsetting fluctuations in the
cash flows of the hedged risk. If it becomes probable that
a forecasted transaction will no longer occur, the derivative
will continue to be carried on the balance sheet at fair value,
and the gains and losses that were accumulated in other
comprehensive income will be recognized immediately in
earnings. If the derivative instruments are terminated prior
to their expiration dates, any cumulative gains and losses
are deferred and recognized in earnings over the remaining
life of the underlying exposure. If the hedged assets or liabil-
ities are sold or extinguished, we recognize in earnings the
gain or loss on the designated financial instruments concur-
rent with the sale or extinguishment of the hedged assets
or liabilities. Cash flows from our derivative instruments are
classified in the same category as the hedged item in the
Consolidated Statements of Cash Flows. See Note 12,
“Derivative Instruments,” for additional information regard-
ing our derivative holdings.
Fair value of financial instruments The carrying amounts
of our financial instruments, including cash and cash equiva-
lents, accounts receivable, accounts payable and accrued
liabilities, approximate fair value due to the short-term
maturity of these instruments. The fair value of long-term
obligations for derivatives was estimated by discounting the
future cash flows using market interest rates and does not
differ significantly from the amounts reflected in the consoli-
dated financial statements. The fair value of long-term debt
exceeds the carrying value by approximately $62 million.
Foreign currency translation Assets and liabilities recorded
in foreign currencies that are the functional currencies for
the respective operations are translated at the prevailing
exchange rate at the balance sheet date. Revenue and
expenses are translated at the average exchange rates dur-
ing the period. Translation adjustments resulting from this
process are reported as a separate component of Other
comprehensive income.

58 A D O L P H C O O R S C O M P A N Y A N D S U B S I D I A R I E S
Notes to Consolidated Financial Statements
Recent accounting pronouncements In June 2001,
the Financial Accounting Standards Board (FASB) issued
Statement of Financial Accounting Standards No. 143,
Accounting for Asset Retirement Obligations (SFAS No. 143),
which is applicable to financial statements issued for fiscal
years beginning after June 15, 2002. Under SFAS No. 143,
the fair value of a liability for an asset retirement obligation
would be recognized in the period in which the liability is
incurred, with an offsetting increase in the carrying amount
of the related long-lived asset. Over time, the liability would
be accreted to its present value, and the capitalized cost
would be depreciated over the useful life of the related
asset. Upon settlement of the liability, an entity would either
settle the obligation for its recorded amount or incur a gain
or loss upon settlement. We adopted this standard effective
December 30, 2002, the beginning of our 2003 fiscal year.
We are still evaluating the impact SFAS No. 143 could have
on our financial statements.
In August 2001, the FASB issued Statement of Financial
Accounting Standards No. 144, Accounting for the Impairment
or Disposal of Long-Lived Assets (SFAS No. 144), which is
applicable to financial statements issued for fiscal years
beginning after December 15, 2001. This standard provides
a single accounting model for long-lived assets to be dis-
posed of by sale and establishes additional criteria that
would have to be met to classify an asset as held-for-sale.
Classification as held-for-sale is an important distinction
since such assets are not depreciated and are stated at the
lower of fair value or carrying amount. This standard also
requires expected future operating losses from discontinued
operations to be recorded in the period(s) in which the
losses are incurred, rather than as of the measurement
date, as previously required. Our adoption of SFAS No. 144
on December 31, 2001 did not have a material effect on
our operating results or financial position.
In April 2002, the FASB issued Statement of Financial
Accounting Standards No. 145, Rescission of FASB State-
ments No. 4, 44 and 64, Amendment of FASB Statement
No. 13, and Technical Corrections as of April 2002 (SFAS
No. 145), which is applicable for fiscal years beginning after
May 15, 2002. This statement eliminates the automatic
classification of gain or loss on extinguishment of debt as
an extraordinary item, and requires that such gain or loss be
evaluated for extraordinary classification under the criteria
of Accounting Principles Board No. 30, Reporting Results
Stock-based compensation We account for employee stock
options in accordance with Accounting Principles Board
No. 25, Accounting for Stock Issued to Employees (APB
No. 25), and will continue to do so going forward. Accordingly,
the Company does not recognize compensation expense
related to employee stock options, since options are always
granted at a price equal to the market price on the day of
grant. See Note 6, “Stock Option, Restricted Stock Award
and Employee Award Plans,” for additional information on
the Company’s stock options.
We use the intrinsic value method allowed under APB
No. 25 when accounting for our stock-based compensation.
The following table illustrates the effect on net income and
earnings per share if we had applied the fair value recognition
provisions of SFAS No. 123 to stock-based compensation:
(In thousands,except per share data,fiscal year ended) Dec. 29, 2002 Dec. 30, 2001 Dec. 31, 2000
Net income, as reported $161,653 $122,964 $109,617
Stock-based compensation expense included in reported net income,net of related tax effects – – –
Total stock-based compen-sation expense determined under fair value based methods for all awards,net of related tax effects (12,059) (16,544) (13,453)
Pro forma net income $149,594 $106,420 $÷96,164
Earnings per share
Basic – as reported $÷÷÷4.47 $÷÷÷3.33 $÷÷÷2.98
Basic – pro forma $÷÷÷4.14 $÷÷÷2.88 $÷÷÷2.61
Diluted – as reported $÷÷÷4.42 $÷÷÷3.31 $÷÷÷2.93
Diluted – pro forma $÷÷÷4.09 $÷÷÷2.86 $÷÷÷2.57
Statement of cash flows data The following presents our
supplemental cash flow information (in millions):
(In millions,fiscal year ended) Dec. 29, 2002 Dec. 30, 2001 Dec. 31, 2000
Cash paid for interest $64.6 $÷7.6 $÷7.7
Cash paid for income taxes $44.6 $83.2 $49.6
Issuance of restricted and common stock,net of forfeitures $÷0.8 $÷1.2 $«(5.8)
Exercise of stock options $÷3.4 $÷4.4 $14.2
A D O L P H C O O R S C O M P A N Y A N D S U B S I D I A R I E S 59
of Operations. This statement also requires sales-leaseback
accounting for certain lease modifications that have economic
effects that are similar to sales-leaseback transactions and
makes various other technical corrections to existing pro-
nouncements. Our adoption of SFAS No. 145 on December 30,
2002, the beginning of our 2003 fiscal year, did not have a
material effect on our operating results or financial position.
In June 2002, the FASB issued Statement of Financial
Accounting Standards No. 146, Accounting for Costs
Associated with Exit or Disposal Activities (SFAS No. 146),
which is applicable for exit or disposal activities initiated
after December 31, 2002. This statement requires that a
liability for a cost that is associated with an exit or disposal
activity be recognized when the liability is incurred. It nullifies
the guidance of the Emerging Issues Task Force (EITF) in EITF
Issue No. 94-3, Liability Recognition for Certain Employee
Termination Benefits and Other Costs to Exit an Activity
(including Certain Costs Incurred in a Restructuring). Under
EITF Issue No. 94-3, an entity recognized a liability for an
exit cost on the date that the entity committed itself to an
exit plan. SFAS No. 146 acknowledges that an entity’s commit-
ment to a plan does not, by itself, create a present obligation
to other parties that meets the definition of a liability. SFAS
No. 146 also establishes that fair value is the objective for
the initial measurement of the liability. Our adoption of SFAS
No. 146 on December 30, 2002, the beginning of our 2003
fiscal year, did not have a material effect on our operating
results or financial position.
In December 2002, the FASB issued Statement of
Financial Accounting Standards No. 148, Accounting for
Stock-Based Compensation – Transition and Disclosure –
an amendment of FASB Statement No. 123 (SFAS No. 148),
which is effective for financial statements related to periods
ending after December 15, 2002. SFAS No. 148 requires
expanded disclosure regarding stock-based compensation
in the Summary of Significant Accounting Policies in the
Notes to the Consolidated Financial Statements, yet does
not have a financial impact on our financial statements. We
have adopted this standard as of December 30, 2002, the
beginning of our 2003 fiscal year, and have included the
expanded disclosures in this filing.
In November 2002, the FASB issued Interpretation No.
45 (FIN No. 45), Guarantor’s Accounting and Disclosure
Requirements for Guarantees of Indebtedness of Others,
which is effective for guarantees issued after December 31,
2002. We will apply the initial recognition and measurement
provisions prospectively for all guarantees issued after
December 31, 2002. FIN No. 45 requires the recording of
the fair value of the guarantee as a liability, with the offset-
ting entry recorded based on the circumstances in which the
guarantee is issued. FIN No. 45 will have no impact on our
historical results, as existing guarantees are not subject to
the measurement provisions of FIN No. 45. The impact on
future financial statements depends on the size, nature and
extent of issued guarantees but is not expected to have a
material impact on our financial statements. We had no sig-
nificant warranties requiring disclosure as of December 29,
2002. See Note 15, “Commitments and Contingencies.”
In January 2003, the FASB issued Interpretation No. 46,
Consolidation of Variable Interest Entities (FIN No. 46), which
is effective immediately for all enterprises with variable inter-
ests in variable interest entities created after January 31,
2003. FIN No. 46 must be applied to variable interests in
variable interest entities created before February 1, 2003
beginning in the first interim period beginning after June 15,
2003, or the third quarter 2003 for us. After initial measure-
ment of all enterprises that we have a relationship with for
status as a variable interest entity, a further assessment
must be made to determine if we are the primary benefici-
ary. A primary beneficiary absorbs the majority of the entity’s
expected losses if they occur, receives a majority of the
entity’s expected residual returns if they occur, or both.
A primary beneficiary relationship requires consolidation
treatment. Where it is reasonably possible that the informa-
tion about our variable interest entity relationships must be
disclosed or consolidated, we must disclose the nature, pur-
pose, size and activity of the variable interest entity and the
maximum exposure to loss as a result of our involvement
with the variable interest entity in all financial statements
issued after January 31, 2003.
We are still assessing our relationships with variable
interest entities to determine if the adoption of FIN No. 46
will require consolidation of certain previously unconsolidated
entities because we are deemed the primary beneficiaries.
The adoption of FIN No. 46 will result in additional disclosure
about our joint venture relationships currently accounted
for under the equity method of accounting. See Note 10,
“Investments,” for related disclosures.
60 A D O L P H C O O R S C O M P A N Y A N D S U B S I D I A R I E S
Notes to Consolidated Financial Statements
2. Properties
The cost of properties and related accumulated depreciation,
depletion and amortization consists of the following:
(In thousands, as of) Dec. 29, 2002 Dec. 30, 2001
Land and improvements $÷««137,054 $«÷«««94,321
Buildings 681,584 506,537
Machinery and equipment 2,378,346 1,783,527
Natural resource properties 6,774 6,798
Construction in progress 69,916 141,663
3,273,674 2,532,846
Less accumulated depreciation,depletion and amortization (1,893,435) (1,663,136)
Net properties $«1,380,239 $«÷«869,710
We completed and occupied a new warehouse facility at
our distributor operation in Denver, CO, in 2002. We are in the
process of selling the land and buildings which previously
housed that operation. In 2001, we sold our distribution
operations in Anaheim, CA, and Oklahoma City, OK, but
retained ownership of the facilities. In 2002, we sold the
land and buildings associated with the Oklahoma City opera-
tions. We are in the process of selling the land and building
associated with the previously owned Anaheim operation
and are presently leasing that facility to the buyer.
3. Leases
We lease certain office facilities and operating equipment
under cancelable and non-cancelable agreements accounted
for as capital and operating leases. In 2001, information
and technology equipment, included in properties, totaling
$10.2 million was sold and leased back under a capital
lease agreement with EDS Information Services, LLC. Capital
lease amortization of $3.9 million and $1.8 million was
included in accumulated amortization in 2002 and 2001,
respectively. Current and long-term capital lease obligations
are included in Accrued expenses and other liabilities and
Other long-term liabilities, respectively, in the Consolidated
Balance Sheets. Future minimum lease payments under
scheduled capital and operating leases that have initial or
remaining non-cancelable terms in excess of one year are
as follows:
Capital Operating(In thousands, fiscal year) Leases Leases
2003 $«4,688 $17,757
2004 391 15,445
2005 – 12,916
2006 – 10,562
2007 – 6,677
Thereafter – 29,281
Total 5,079 $92,638
Amounts representing interest (309)
Obligations under capital lease 4,770
Obligations due within one year (4,383)
Long-term obligations under capital leases $÷««387
Total rent expense was $22.5 million, $11.8 million and
$11.5 million in 2002, 2001 and 2000, respectively.
4. Debt
Our total long-term borrowings as of December 29, 2002,
were composed of the following:
(In thousands, as of) Dec. 29, 2002 Dec. 30, 2001
Senior private placement notes $÷÷«20,000 $100,000
63⁄8% Senior notes due 2012 846,795 –
Senior Credit Facility:
USD amortizing term loan 168,000 –
GBP amortizing term loan 365,689 –
Lines of credit and other 126,957 8,038
Total debt 1,527,441 108,038
Less current portion of long-term debt (144,049) (88,038)
Total long-term debt $1,383,392 $÷20,000
The aggregate principal debt maturities of long-term debt
for the next five fiscal years are as follows:
(In thousands, fiscal year) Amount
2003 $÷«144,049
2004 96,640
2005 173,450
2006 192,394
2007 63,902
Thereafter 857,006
Total $1,527,441
Net repayments on debt during 2002 totaled $208 million.
A D O L P H C O O R S C O M P A N Y A N D S U B S I D I A R I E S 61
Interest Interest incurred, capitalized, expensed and paid
was as follows:
(In thousands,fiscal year ended) Dec. 29, 2002 Dec. 30, 2001 Dec. 31, 2000
Interest incurred $75,071 $«8,653 $«9,567
Interest capitalized (4,152) (6,647) (3,153)
Interest expensed $70,919 $«2,006 $«6,414
Senior private placement notes At December 29, 2002, we
had $20 million in unsecured Senior notes at a fixed interest
rate of 6.95% per annum. Interest on the notes is due semi-
annually in January and July. At December 29, 2002, $20
million was classified as long-term debt as this balance is
due in July 2005. In July 2002, we made an $80 million prin-
cipal payment on these notes. Our private placement notes
require that we conduct our business with certain restrictions
on indebtedness, liens, mergers, consolidations, asset sales
and certain other types of business activities in which we
can engage. We were in compliance with these requirements
at December 29, 2002.
63⁄8% Senior notes due 2012 On May 7, 2002, CBC com-
pleted a private placement of $850 million principal amount
of 63⁄8% Senior notes, due 2012, with interest payable semi-
annually. The notes were priced at 99.596% of par for
a yield to maturity of 6.43%, were unsecured, were not sub-
ject to any sinking fund provision and included a redemption
provision (make-whole provision) which allowed us to retire
the notes at whole or any time at a redemption price. The
redemption price was equal to the greater of (1) 100% of
the principal amount of the notes plus accrued and unpaid
interest and (2) the make whole amount of the notes being
redeemed, which was equal to the present value of the
principal amount of the notes and interest to be redeemed.
The notes were issued with registration rights and were
guaranteed by Adolph Coors Company and certain domestic
subsidiaries. Net proceeds from the sale of the notes, after
deducting estimated expenses and underwriting fees, were
approximately $841 million. The net proceeds were used
to (1) repay the $750 million of loans outstanding under
our senior unsecured bridge facility which we entered into
in connection with our acquisition of CBL and (2) to repay
approximately $91 million of outstanding term borrowings
under our senior unsecured credit facilities.
Simultaneously with the private placement, we entered
into a registration rights agreement pursuant to which we
exchanged the unregistered notes for substantially identical
notes registered with the SEC. The exchange of all the notes
was completed on September 16, 2002.
Under the terms of the notes, we must comply with cer-
tain restrictions. These restrictions include restrictions on
debt secured by certain types of mortgages, secured certain
threshold percentages of consolidated net tangible assets,
and restrictions on certain types of sale-leaseback transac-
tions. As of December 29, 2002, we were in compliance with
all of these restrictions.
Senior credit facility At December 29, 2002, we had
$533.7 million outstanding in unsecured Senior Credit facili-
ties consisting of a U.S. dollar denominated amortizing term
loan in an aggregate principal amount of $168 million and
a 228 million British Pound Sterling (GBP) denominated
amortizing term loan. Based on foreign exchange rates at
December 29, 2002, aggregate principal amounts outstand-
ing related to the 228 million GBP amortizing term loan
were $365.7 million.
Amounts outstanding under our term loan bear interest,
at our option, at a rate per annum equal to either an adjusted
LIBOR or an alternate base rate, in each case plus an addi-
tional margin. The additional margin is established based on
our investment grade debt rating which is BBB+ (S&P) and
Baa2 (Moody’s). If our debt rating changes, the additional
margin is subject to adjustment. Interest is payable quarterly
unless the selected LIBOR is for a time period less than
90 days, in which case the interest is payable at the end of
the time period corresponding to the selected LIBOR. The
interest rates on our U.S. and U.K. term loans were 2.3%
and 4.86%, respectively, at December 29, 2002.
Our term loan is payable quarterly in arrears beginning
June 27, 2003, and matures February 1, 2007. During the
year ended December 29, 2002, we repaid approximately
$310 million on our five-year amortizing term loan. This has
reduced the scheduled required future amortization amounts
based upon application of payments already made against
future payments due as per the terms of our loan agreement.
We and all of our existing and future, direct and indirect,
domestic subsidiaries, other than immaterial domestic
subsidiaries, have guaranteed our term loan borrowings.
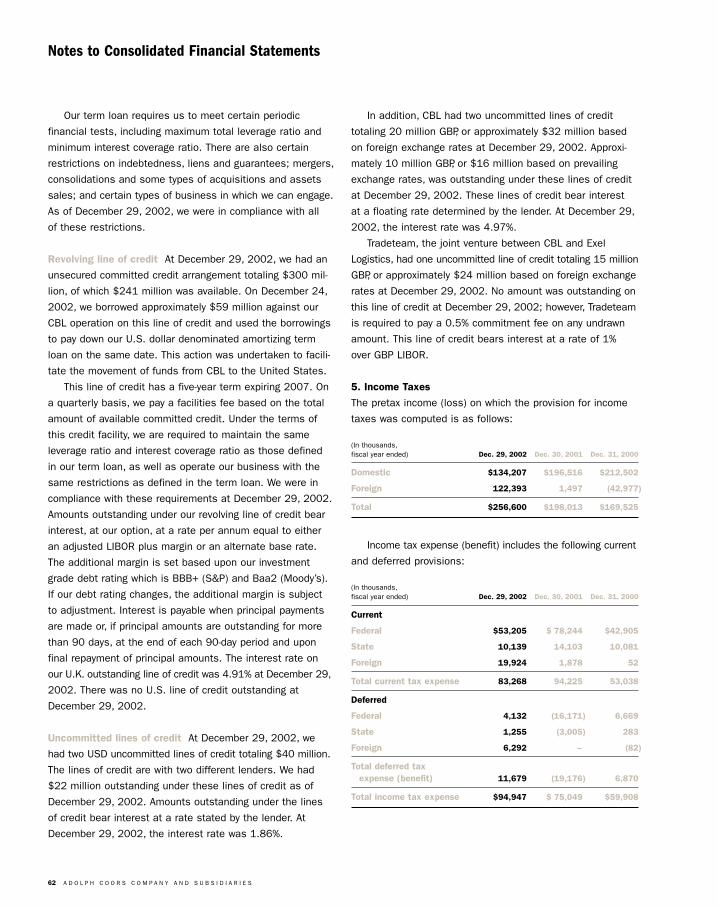
62 A D O L P H C O O R S C O M P A N Y A N D S U B S I D I A R I E S
Notes to Consolidated Financial Statements
Our term loan requires us to meet certain periodic
financial tests, including maximum total leverage ratio and
minimum interest coverage ratio. There are also certain
restrictions on indebtedness, liens and guarantees; mergers,
consolidations and some types of acquisitions and assets
sales; and certain types of business in which we can engage.
As of December 29, 2002, we were in compliance with all
of these restrictions.
Revolving line of credit At December 29, 2002, we had an
unsecured committed credit arrangement totaling $300 mil-
lion, of which $241 million was available. On December 24,
2002, we borrowed approximately $59 million against our
CBL operation on this line of credit and used the borrowings
to pay down our U.S. dollar denominated amortizing term
loan on the same date. This action was undertaken to facili-
tate the movement of funds from CBL to the United States.
This line of credit has a five-year term expiring 2007. On
a quarterly basis, we pay a facilities fee based on the total
amount of available committed credit. Under the terms of
this credit facility, we are required to maintain the same
leverage ratio and interest coverage ratio as those defined
in our term loan, as well as operate our business with the
same restrictions as defined in the term loan. We were in
compliance with these requirements at December 29, 2002.
Amounts outstanding under our revolving line of credit bear
interest, at our option, at a rate per annum equal to either
an adjusted LIBOR plus margin or an alternate base rate.
The additional margin is set based upon our investment
grade debt rating which is BBB+ (S&P) and Baa2 (Moody’s).
If our debt rating changes, the additional margin is subject
to adjustment. Interest is payable when principal payments
are made or, if principal amounts are outstanding for more
than 90 days, at the end of each 90-day period and upon
final repayment of principal amounts. The interest rate on
our U.K. outstanding line of credit was 4.91% at December 29,
2002. There was no U.S. line of credit outstanding at
December 29, 2002.
Uncommitted lines of credit At December 29, 2002, we
had two USD uncommitted lines of credit totaling $40 million.
The lines of credit are with two different lenders. We had
$22 million outstanding under these lines of credit as of
December 29, 2002. Amounts outstanding under the lines
of credit bear interest at a rate stated by the lender. At
December 29, 2002, the interest rate was 1.86%.
In addition, CBL had two uncommitted lines of credit
totaling 20 million GBP, or approximately $32 million based
on foreign exchange rates at December 29, 2002. Approxi-
mately 10 million GBP, or $16 million based on prevailing
exchange rates, was outstanding under these lines of credit
at December 29, 2002. These lines of credit bear interest
at a floating rate determined by the lender. At December 29,
2002, the interest rate was 4.97%.
Tradeteam, the joint venture between CBL and Exel
Logistics, had one uncommitted line of credit totaling 15 million
GBP, or approximately $24 million based on foreign exchange
rates at December 29, 2002. No amount was outstanding on
this line of credit at December 29, 2002; however, Tradeteam
is required to pay a 0.5% commitment fee on any undrawn
amount. This line of credit bears interest at a rate of 1%
over GBP LIBOR.
5. Income Taxes
The pretax income (loss) on which the provision for income
taxes was computed is as follows:
(In thousands,fiscal year ended) Dec. 29, 2002 Dec. 30, 2001 Dec. 31, 2000
Domestic $134,207 $196,516 $212,502
Foreign 122,393 1,497 (42,977)
Total $256,600 $198,013 $169,525
Income tax expense (benefit) includes the following current
and deferred provisions:
(In thousands,fiscal year ended) Dec. 29, 2002 Dec. 30, 2001 Dec. 31, 2000
Current
Federal $53,205 $«78,244 $42,905
State 10,139 14,103 10,081
Foreign 19,924 1,878 52
Total current tax expense 83,268 94,225 53,038
Deferred
Federal 4,132 (16,171) 6,669
State 1,255 (3,005) 283
Foreign 6,292 – (82)
Total deferred tax expense (benefit) 11,679 (19,176) 6,870
Total income tax expense $94,947 $«75,049 $59,908
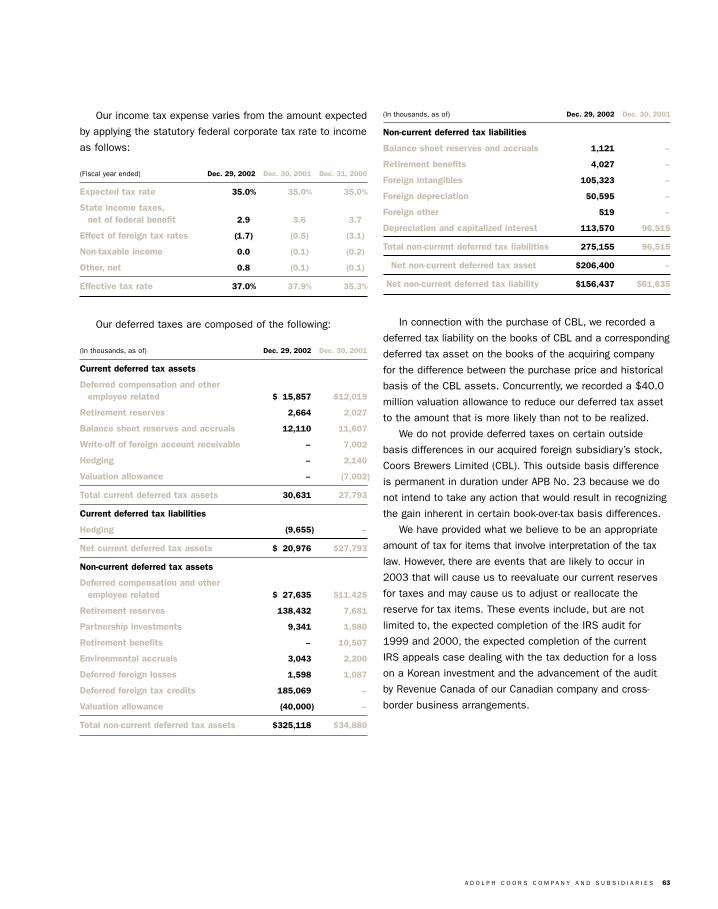
A D O L P H C O O R S C O M P A N Y A N D S U B S I D I A R I E S 63
Our income tax expense varies from the amount expected
by applying the statutory federal corporate tax rate to income
as follows:
(Fiscal year ended) Dec. 29, 2002 Dec. 30, 2001 Dec. 31, 2000
Expected tax rate 35.0% 35.0% 35.0%
State income taxes,net of federal benefit 2.9 3.6 3.7
Effect of foreign tax rates (1.7) (0.5) (3.1)
Non-taxable income 0.0 (0.1) (0.2)
Other, net 0.8 (0.1) (0.1)
Effective tax rate 37.0% 37.9% 35.3%
Our deferred taxes are composed of the following:
(In thousands, as of) Dec. 29, 2002 Dec. 30, 2001
Current deferred tax assets
Deferred compensation and other employee related $÷15,857 $12,019
Retirement reserves 2,664 2,027
Balance sheet reserves and accruals 12,110 11,607
Write-off of foreign account receivable – 7,002
Hedging – 2,140
Valuation allowance – (7,002)
Total current deferred tax assets 30,631 27,793
Current deferred tax liabilities
Hedging (9,655) –
Net current deferred tax assets $÷20,976 $27,793
Non-current deferred tax assets
Deferred compensation and other employee related $÷27,635 $11,425
Retirement reserves 138,432 7,681
Partnership investments 9,341 1,980
Retirement benefits – 10,507
Environmental accruals 3,043 2,200
Deferred foreign losses 1,598 1,087
Deferred foreign tax credits 185,069 –
Valuation allowance (40,000) –
Total non-current deferred tax assets $325,118 $34,880
(In thousands, as of) Dec. 29, 2002 Dec. 30, 2001
Non-current deferred tax liabilities
Balance sheet reserves and accruals 1,121 –
Retirement benefits 4,027 –
Foreign intangibles 105,323 –
Foreign depreciation 50,595 –
Foreign other 519 –
Depreciation and capitalized interest 113,570 96,515
Total non-current deferred tax liabilities 275,155 96,515
Net non-current deferred tax asset $206,400 –
Net non-current deferred tax liability $156,437 $61,635
In connection with the purchase of CBL, we recorded a
deferred tax liability on the books of CBL and a corresponding
deferred tax asset on the books of the acquiring company
for the difference between the purchase price and historical
basis of the CBL assets. Concurrently, we recorded a $40.0
million valuation allowance to reduce our deferred tax asset
to the amount that is more likely than not to be realized.
We do not provide deferred taxes on certain outside
basis differences in our acquired foreign subsidiary’s stock,
Coors Brewers Limited (CBL). This outside basis difference
is permanent in duration under APB No. 23 because we do
not intend to take any action that would result in recognizing
the gain inherent in certain book-over-tax basis differences.
We have provided what we believe to be an appropriate
amount of tax for items that involve interpretation of the tax
law. However, there are events that are likely to occur in
2003 that will cause us to reevaluate our current reserves
for taxes and may cause us to adjust or reallocate the
reserve for tax items. These events include, but are not
limited to, the expected completion of the IRS audit for
1999 and 2000, the expected completion of the current
IRS appeals case dealing with the tax deduction for a loss
on a Korean investment and the advancement of the audit
by Revenue Canada of our Canadian company and cross-
border business arrangements.
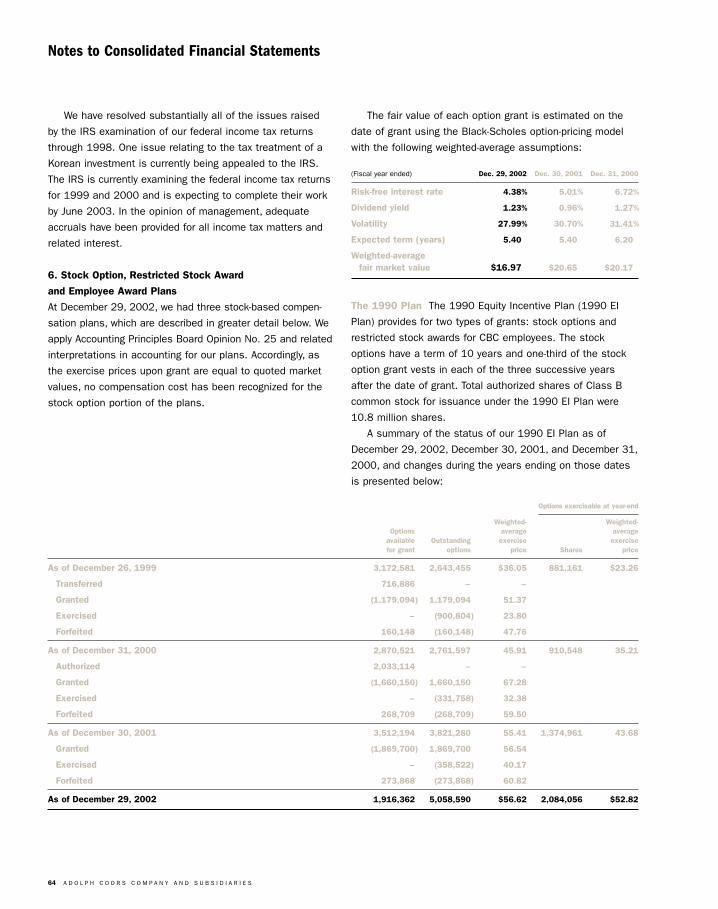
64 A D O L P H C O O R S C O M P A N Y A N D S U B S I D I A R I E S
Notes to Consolidated Financial Statements
We have resolved substantially all of the issues raised
by the IRS examination of our federal income tax returns
through 1998. One issue relating to the tax treatment of a
Korean investment is currently being appealed to the IRS.
The IRS is currently examining the federal income tax returns
for 1999 and 2000 and is expecting to complete their work
by June 2003. In the opinion of management, adequate
accruals have been provided for all income tax matters and
related interest.
6. Stock Option, Restricted Stock Award
and Employee Award Plans
At December 29, 2002, we had three stock-based compen-
sation plans, which are described in greater detail below. We
apply Accounting Principles Board Opinion No. 25 and related
interpretations in accounting for our plans. Accordingly, as
the exercise prices upon grant are equal to quoted market
values, no compensation cost has been recognized for the
stock option portion of the plans.
The fair value of each option grant is estimated on the
date of grant using the Black-Scholes option-pricing model
with the following weighted-average assumptions:
(Fiscal year ended) Dec. 29, 2002 Dec. 30, 2001 Dec. 31, 2000
Risk-free interest rate 4.38% 5.01% 6.72%
Dividend yield 1.23% 0.96% 1.27%
Volatility 27.99% 30.70% 31.41%
Expected term (years) 5.40 5.40 6.20
Weighted-average fair market value $16.97 $20.65 $20.17
The 1990 Plan The 1990 Equity Incentive Plan (1990 EI
Plan) provides for two types of grants: stock options and
restricted stock awards for CBC employees. The stock
options have a term of 10 years and one-third of the stock
option grant vests in each of the three successive years
after the date of grant. Total authorized shares of Class B
common stock for issuance under the 1990 EI Plan were
10.8 million shares.
A summary of the status of our 1990 EI Plan as of
December 29, 2002, December 30, 2001, and December 31,
2000, and changes during the years ending on those dates
is presented below:
Options exercisable at year-end
Weighted- Weighted-Options average average
available Outstanding exercise exercisefor grant options price Shares price
As of December 26, 1999 3,172,581 2,643,455 $36.05 881,161 $23.26
Transferred 716,886 – –
Granted (1,179,094) 1,179,094 51.37
Exercised – (900,804) 23.80
Forfeited 160,148 (160,148) 47.76
As of December 31, 2000 2,870,521 2,761,597 45.91 910,548 35.21
Authorized 2,033,114 – –
Granted (1,660,150) 1,660,150 67.28
Exercised – (331,758) 32.38
Forfeited 268,709 (268,709) 59.50
As of December 30, 2001 3,512,194 3,821,280 55.41 1,374,961 43.68
Granted (1,869,700) 1,869,700 56.54
Exercised – (358,522) 40.17
Forfeited 273,868 (273,868) 60.82
As of December 29, 2002 1,916,362 5,058,590 $56.62 2,084,056 $52.82
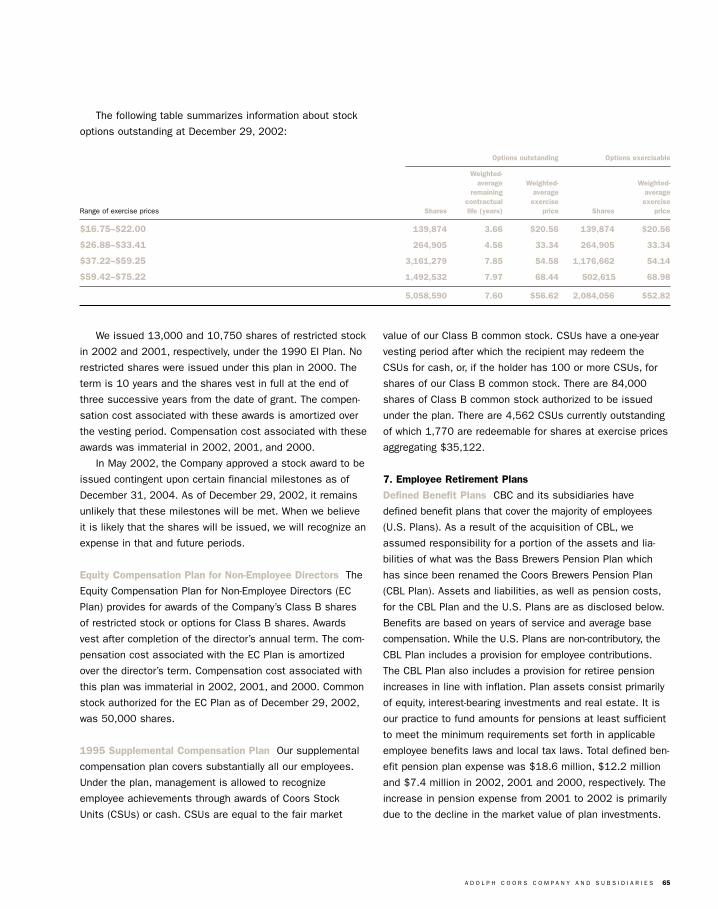
A D O L P H C O O R S C O M P A N Y A N D S U B S I D I A R I E S 65
We issued 13,000 and 10,750 shares of restricted stock
in 2002 and 2001, respectively, under the 1990 EI Plan. No
restricted shares were issued under this plan in 2000. The
term is 10 years and the shares vest in full at the end of
three successive years from the date of grant. The compen-
sation cost associated with these awards is amortized over
the vesting period. Compensation cost associated with these
awards was immaterial in 2002, 2001, and 2000.
In May 2002, the Company approved a stock award to be
issued contingent upon certain financial milestones as of
December 31, 2004. As of December 29, 2002, it remains
unlikely that these milestones will be met. When we believe
it is likely that the shares will be issued, we will recognize an
expense in that and future periods.
Equity Compensation Plan for Non-Employee Directors The
Equity Compensation Plan for Non-Employee Directors (EC
Plan) provides for awards of the Company’s Class B shares
of restricted stock or options for Class B shares. Awards
vest after completion of the director’s annual term. The com-
pensation cost associated with the EC Plan is amortized
over the director’s term. Compensation cost associated with
this plan was immaterial in 2002, 2001, and 2000. Common
stock authorized for the EC Plan as of December 29, 2002,
was 50,000 shares.
1995 Supplemental Compensation Plan Our supplemental
compensation plan covers substantially all our employees.
Under the plan, management is allowed to recognize
employee achievements through awards of Coors Stock
Units (CSUs) or cash. CSUs are equal to the fair market
value of our Class B common stock. CSUs have a one-year
vesting period after which the recipient may redeem the
CSUs for cash, or, if the holder has 100 or more CSUs, for
shares of our Class B common stock. There are 84,000
shares of Class B common stock authorized to be issued
under the plan. There are 4,562 CSUs currently outstanding
of which 1,770 are redeemable for shares at exercise prices
aggregating $35,122.
7. Employee Retirement Plans
Defined Benefit Plans CBC and its subsidiaries have
defined benefit plans that cover the majority of employees
(U.S. Plans). As a result of the acquisition of CBL, we
assumed responsibility for a portion of the assets and lia-
bilities of what was the Bass Brewers Pension Plan which
has since been renamed the Coors Brewers Pension Plan
(CBL Plan). Assets and liabilities, as well as pension costs,
for the CBL Plan and the U.S. Plans are as disclosed below.
Benefits are based on years of service and average base
compensation. While the U.S. Plans are non-contributory, the
CBL Plan includes a provision for employee contributions.
The CBL Plan also includes a provision for retiree pension
increases in line with inflation. Plan assets consist primarily
of equity, interest-bearing investments and real estate. It is
our practice to fund amounts for pensions at least sufficient
to meet the minimum requirements set forth in applicable
employee benefits laws and local tax laws. Total defined ben-
efit pension plan expense was $18.6 million, $12.2 million
and $7.4 million in 2002, 2001 and 2000, respectively. The
increase in pension expense from 2001 to 2002 is primarily
due to the decline in the market value of plan investments.
The following table summarizes information about stock
options outstanding at December 29, 2002:
Options outstanding Options exercisable
Weighted-average Weighted- Weighted-
remaining average averagecontractual exercise exercise
Range of exercise prices Shares life (years) price Shares price
$16.75–$22.00 139,874 3.66 $20.56 139,874 $20.56
$26.88–$33.41 264,905 4.56 33.34 264,905 33.34
$37.22–$59.25 3,161,279 7.85 54.58 1,176,662 54.14
$59.42–$75.22 1,492,532 7.97 68.44 502,615 68.98
5,058,590 7.60 $56.62 2,084,056 $52.82
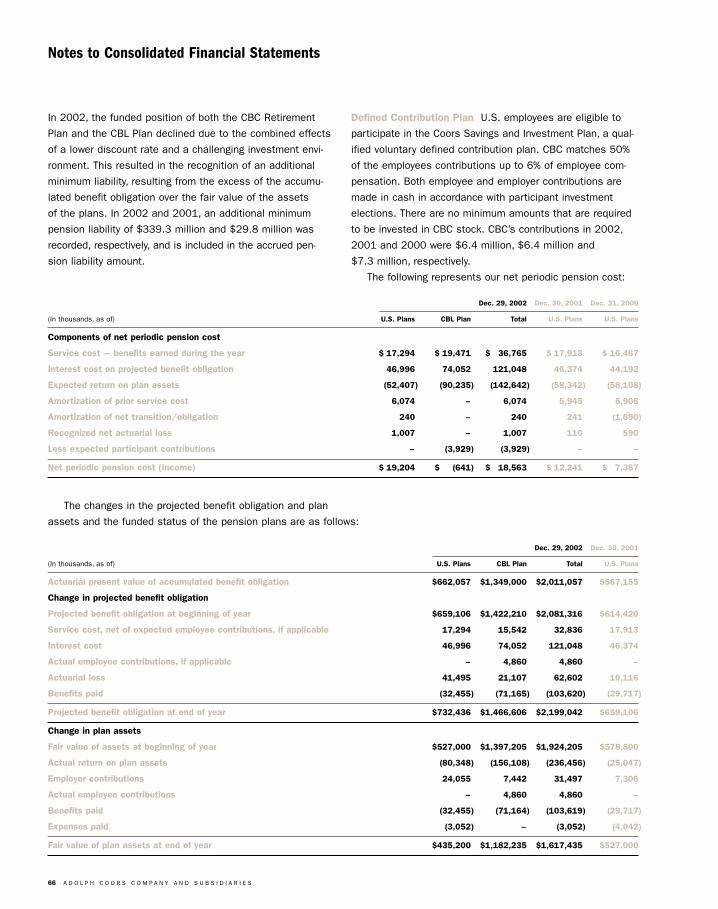
66 A D O L P H C O O R S C O M P A N Y A N D S U B S I D I A R I E S
Notes to Consolidated Financial Statements
In 2002, the funded position of both the CBC Retirement
Plan and the CBL Plan declined due to the combined effects
of a lower discount rate and a challenging investment envi-
ronment. This resulted in the recognition of an additional
minimum liability, resulting from the excess of the accumu-
lated benefit obligation over the fair value of the assets
of the plans. In 2002 and 2001, an additional minimum
pension liability of $339.3 million and $29.8 million was
recorded, respectively, and is included in the accrued pen-
sion liability amount.
Defined Contribution Plan U.S. employees are eligible to
participate in the Coors Savings and Investment Plan, a qual-
ified voluntary defined contribution plan. CBC matches 50%
of the employees contributions up to 6% of employee com-
pensation. Both employee and employer contributions are
made in cash in accordance with participant investment
elections. There are no minimum amounts that are required
to be invested in CBC stock. CBC’s contributions in 2002,
2001 and 2000 were $6.4 million, $6.4 million and
$7.3 million, respectively.
The following represents our net periodic pension cost:
Dec. 29, 2002 Dec. 30, 2001 Dec. 31, 2000
(In thousands, as of) U.S. Plans CBL Plan Total U.S. Plans U.S. Plans
Components of net periodic pension cost
Service cost -– benefits earned during the year $«17,294 $«19,471 $÷«36,765 $«17,913 $«16,467
Interest cost on projected benefit obligation 46,996 74,052 121,048 46,374 44,192
Expected return on plan assets (52,407) (90,235) (142,642) (58,342) (58,108)
Amortization of prior service cost 6,074 – 6,074 5,945 5,906
Amortization of net transition/obligation 240 – 240 241 (1,690)
Recognized net actuarial loss 1,007 – 1,007 110 590
Less expected participant contributions – (3,929) (3,929) – –
Net periodic pension cost (income) $«19,204 $÷÷«(641) $÷«18,563 $«12,241 $÷«7,357
The changes in the projected benefit obligation and plan
assets and the funded status of the pension plans are as follows:
Dec. 29, 2002 Dec. 30, 2001
(In thousands, as of) U.S. Plans CBL Plan Total U.S. Plans
Actuarial present value of accumulated benefit obligation $662,057 $1,349,000 $2,011,057 $567,155
Change in projected benefit obligation
Projected benefit obligation at beginning of year $659,106 $1,422,210 $2,081,316 $614,420
Service cost, net of expected employee contributions, if applicable 17,294 15,542 32,836 17,913
Interest cost 46,996 74,052 121,048 46,374
Actual employee contributions, if applicable – 4,860 4,860 –
Actuarial loss 41,495 21,107 62,602 10,116
Benefits paid (32,455) (71,165) (103,620) (29,717)
Projected benefit obligation at end of year $732,436 $1,466,606 $2,199,042 $659,106
Change in plan assets
Fair value of assets at beginning of year $527,000 $1,397,205 $1,924,205 $578,500
Actual return on plan assets (80,348) (156,108) (236,456) (25,047)
Employer contributions 24,055 7,442 31,497 7,306
Actual employee contributions – 4,860 4,860 –
Benefits paid (32,455) (71,164) (103,619) (29,717)
Expenses paid (3,052) – (3,052) (4,042)
Fair value of plan assets at end of year $435,200 $1,182,235 $1,617,435 $527,000
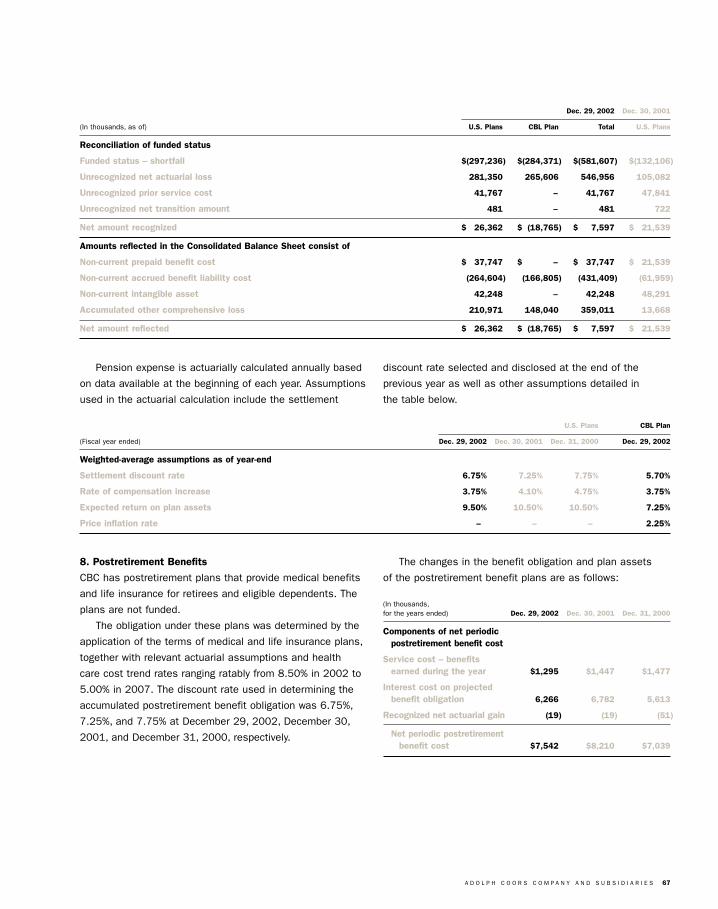
A D O L P H C O O R S C O M P A N Y A N D S U B S I D I A R I E S 67
Pension expense is actuarially calculated annually based
on data available at the beginning of each year. Assumptions
used in the actuarial calculation include the settlement
discount rate selected and disclosed at the end of the
previous year as well as other assumptions detailed in
the table below.
Dec. 29, 2002 Dec. 30, 2001
(In thousands, as of) U.S. Plans CBL Plan Total U.S. Plans
Reconciliation of funded status
Funded status – shortfall $(297,236) $(284,371) $(581,607) $(132,106)
Unrecognized net actuarial loss 281,350 265,606 546,956 105,082
Unrecognized prior service cost 41,767 – 41,767 47,841
Unrecognized net transition amount 481 – 481 722
Net amount recognized $÷«26,362 $÷(18,765) $÷÷«7,597 $÷«21,539
Amounts reflected in the Consolidated Balance Sheet consist of
Non-current prepaid benefit cost $÷«37,747 $÷÷÷÷÷÷– $÷«37,747 $÷«21,539
Non-current accrued benefit liability cost (264,604) (166,805) (431,409) (61,959)
Non-current intangible asset 42,248 – 42,248 48,291
Accumulated other comprehensive loss 210,971 148,040 359,011 13,668
Net amount reflected $÷«26,362 $÷(18,765) $÷÷«7,597 $÷«21,539
U.S. Plans CBL Plan
(Fiscal year ended) Dec. 29, 2002 Dec. 30, 2001 Dec. 31, 2000 Dec. 29, 2002
Weighted-average assumptions as of year-end
Settlement discount rate 6.75% 7.25% 7.75% 5.70%
Rate of compensation increase 3.75% 4.10% 4.75% 3.75%
Expected return on plan assets 9.50% 10.50% 10.50% 7.25%
Price inflation rate –÷ –÷ –÷ 2.25%
8. Postretirement Benefits
CBC has postretirement plans that provide medical benefits
and life insurance for retirees and eligible dependents. The
plans are not funded.
The obligation under these plans was determined by the
application of the terms of medical and life insurance plans,
together with relevant actuarial assumptions and health
care cost trend rates ranging ratably from 8.50% in 2002 to
5.00% in 2007. The discount rate used in determining the
accumulated postretirement benefit obligation was 6.75%,
7.25%, and 7.75% at December 29, 2002, December 30,
2001, and December 31, 2000, respectively.
The changes in the benefit obligation and plan assets
of the postretirement benefit plans are as follows:
(In thousands,for the years ended) Dec. 29, 2002 Dec. 30, 2001 Dec. 31, 2000
Components of net periodic postretirement benefit cost
Service cost – benefitsearned during the year $1,295 $1,447 $1,477
Interest cost on projected benefit obligation 6,266 6,782 5,613
Recognized net actuarial gain (19) (19) (51)
Net periodic postretirementbenefit cost $7,542 $8,210 $7,039
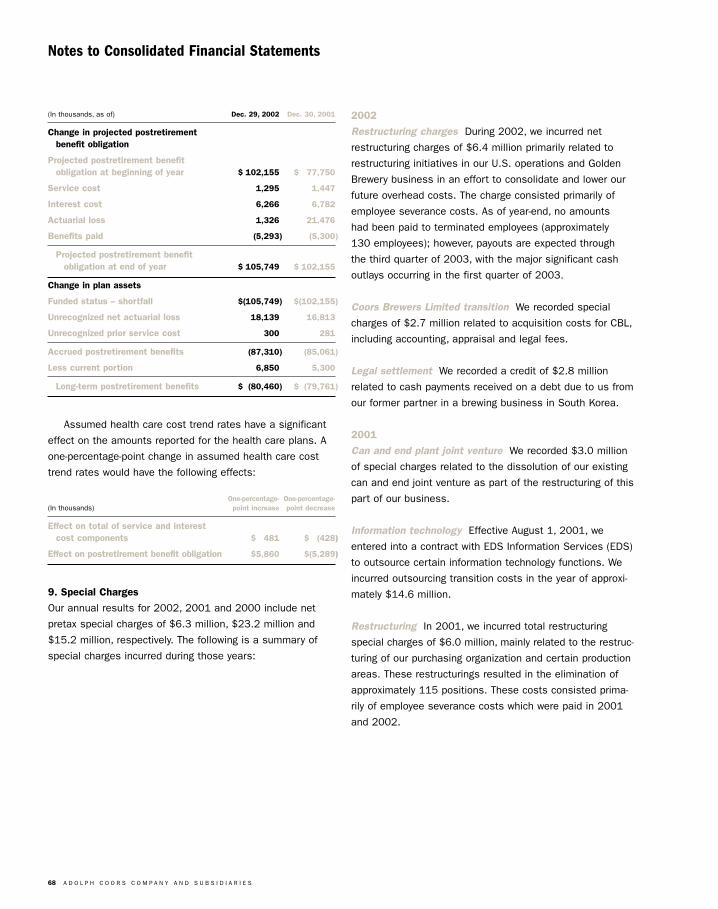
68 A D O L P H C O O R S C O M P A N Y A N D S U B S I D I A R I E S
Notes to Consolidated Financial Statements
(In thousands, as of) Dec. 29, 2002 Dec. 30, 2001
Change in projected postretirement benefit obligation
Projected postretirement benefit obligation at beginning of year $«102,155 $«««77,750
Service cost 1,295 1,447
Interest cost 6,266 6,782
Actuarial loss 1,326 21,476
Benefits paid (5,293) (5,300)
Projected postretirement benefit obligation at end of year $«105,749 $«102,155
Change in plan assets
Funded status – shortfall $(105,749) $(102,155)
Unrecognized net actuarial loss 18,139 16,813
Unrecognized prior service cost 300 281
Accrued postretirement benefits (87,310) (85,061)
Less current portion 6,850 5,300
Long-term postretirement benefits $÷(80,460) $««(79,761)
Assumed health care cost trend rates have a significant
effect on the amounts reported for the health care plans. A
one-percentage-point change in assumed health care cost
trend rates would have the following effects:
One-percentage- One-percentage-(In thousands) point increase point decrease
Effect on total of service and interest cost components $÷«481 $÷«(428))
Effect on postretirement benefit obligation $5,860 $(5,289))
9. Special Charges
Our annual results for 2002, 2001 and 2000 include net
pretax special charges of $6.3 million, $23.2 million and
$15.2 million, respectively. The following is a summary of
special charges incurred during those years:
2002
Restructuring charges During 2002, we incurred net
restructuring charges of $6.4 million primarily related to
restructuring initiatives in our U.S. operations and Golden
Brewery business in an effort to consolidate and lower our
future overhead costs. The charge consisted primarily of
employee severance costs. As of year-end, no amounts
had been paid to terminated employees (approximately
130 employees); however, payouts are expected through
the third quarter of 2003, with the major significant cash
outlays occurring in the first quarter of 2003.
Coors Brewers Limited transition We recorded special
charges of $2.7 million related to acquisition costs for CBL,
including accounting, appraisal and legal fees.
Legal settlement We recorded a credit of $2.8 million
related to cash payments received on a debt due to us from
our former partner in a brewing business in South Korea.
2001
Can and end plant joint venture We recorded $3.0 million
of special charges related to the dissolution of our existing
can and end joint venture as part of the restructuring of this
part of our business.
Information technology Effective August 1, 2001, we
entered into a contract with EDS Information Services (EDS)
to outsource certain information technology functions. We
incurred outsourcing transition costs in the year of approxi-
mately $14.6 million.
Restructuring In 2001, we incurred total restructuring
special charges of $6.0 million, mainly related to the restruc-
turing of our purchasing organization and certain production
areas. These restructurings resulted in the elimination of
approximately 115 positions. These costs consisted prima-
rily of employee severance costs which were paid in 2001
and 2002.
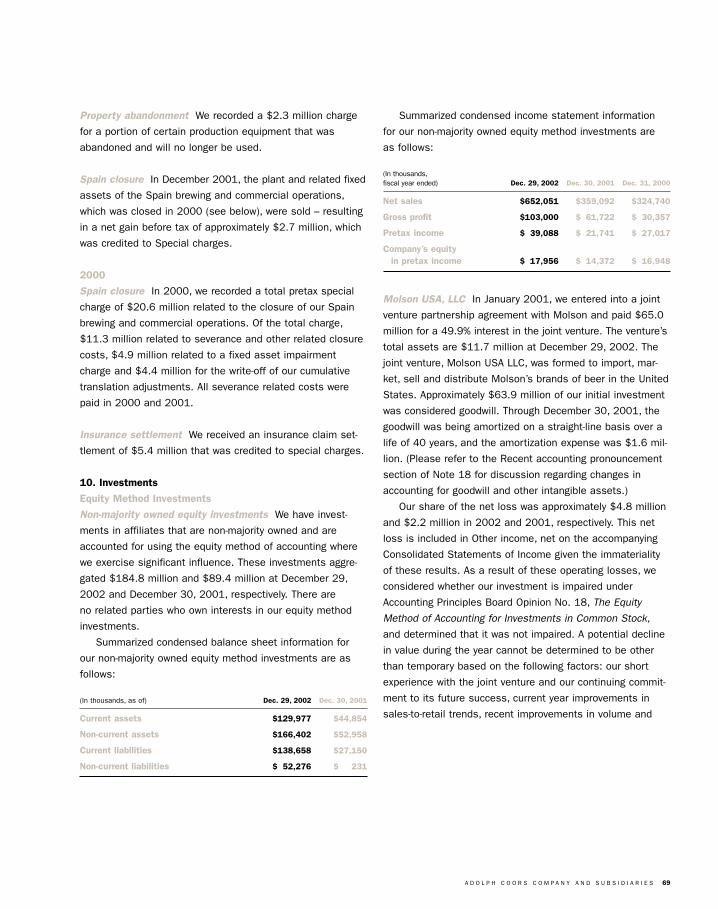
A D O L P H C O O R S C O M P A N Y A N D S U B S I D I A R I E S 69
Property abandonment We recorded a $2.3 million charge
for a portion of certain production equipment that was
abandoned and will no longer be used.
Spain closure In December 2001, the plant and related fixed
assets of the Spain brewing and commercial operations,
which was closed in 2000 (see below), were sold – resulting
in a net gain before tax of approximately $2.7 million, which
was credited to Special charges.
2000
Spain closure In 2000, we recorded a total pretax special
charge of $20.6 million related to the closure of our Spain
brewing and commercial operations. Of the total charge,
$11.3 million related to severance and other related closure
costs, $4.9 million related to a fixed asset impairment
charge and $4.4 million for the write-off of our cumulative
translation adjustments. All severance related costs were
paid in 2000 and 2001.
Insurance settlement We received an insurance claim set-
tlement of $5.4 million that was credited to special charges.
10. Investments
Equity Method Investments
Non-majority owned equity investments We have invest-
ments in affiliates that are non-majority owned and are
accounted for using the equity method of accounting where
we exercise significant influence. These investments aggre-
gated $184.8 million and $89.4 million at December 29,
2002 and December 30, 2001, respectively. There are
no related parties who own interests in our equity method
investments.
Summarized condensed balance sheet information for
our non-majority owned equity method investments are as
follows:
(In thousands, as of) Dec. 29, 2002 Dec. 30, 2001
Current assets $129,977 $44,854
Non-current assets $166,402 $52,958
Current liabilities $138,658 $27,150
Non-current liabilities $÷52,276 $÷÷«231
Summarized condensed income statement information
for our non-majority owned equity method investments are
as follows:
(In thousands,fiscal year ended) Dec. 29, 2002 Dec. 30, 2001 Dec. 31, 2000
Net sales $652,051 $359,092 $324,740
Gross profit $103,000 $÷61,722 $÷30,357
Pretax income $÷39,088 $÷21,741 $÷27,017
Company’s equity in pretax income $÷17,956 $÷14,372 $÷16,948
Molson USA, LLC In January 2001, we entered into a joint
venture partnership agreement with Molson and paid $65.0
million for a 49.9% interest in the joint venture. The venture’s
total assets are $11.7 million at December 29, 2002. The
joint venture, Molson USA LLC, was formed to import, mar-
ket, sell and distribute Molson’s brands of beer in the United
States. Approximately $63.9 million of our initial investment
was considered goodwill. Through December 30, 2001, the
goodwill was being amortized on a straight-line basis over a
life of 40 years, and the amortization expense was $1.6 mil-
lion. (Please refer to the Recent accounting pronouncement
section of Note 18 for discussion regarding changes in
accounting for goodwill and other intangible assets.)
Our share of the net loss was approximately $4.8 million
and $2.2 million in 2002 and 2001, respectively. This net
loss is included in Other income, net on the accompanying
Consolidated Statements of Income given the immateriality
of these results. As a result of these operating losses, we
considered whether our investment is impaired under
Accounting Principles Board Opinion No. 18, The Equity
Method of Accounting for Investments in Common Stock,
and determined that it was not impaired. A potential decline
in value during the year cannot be determined to be other
than temporary based on the following factors: our short
experience with the joint venture and our continuing commit-
ment to its future success, current year improvements in
sales-to-retail trends, recent improvements in volume and
70 A D O L P H C O O R S C O M P A N Y A N D S U B S I D I A R I E S
Notes to Consolidated Financial Statements
pricing trends of Canadian import brands and the fact that
the business is still being developed under this new partner-
ship. The recoverability of our investment in the joint venture
will be further evaluated during 2003. We believe it is rea-
sonably possible that Molson USA may be a variable interest
entity as defined by FIN No. 46. We believe our maximum
exposure to loss over our required ownership period to be
approximately $44 million.
Rocky Mountain Bottle Company We have a 50% interest
in a joint venture with Owens-Brockway Glass Container, Inc.
(Owens), the Rocky Mountain Bottle Company (RMBC), to pro-
duce glass bottles at our glass manufacturing facility. The
initial term of the joint venture expires in 2005 and can be
extended for additional two-year periods. RMBC has a con-
tract to supply our bottle requirements and Owens has a
contract to supply the majority of our bottles for our bottle
requirements not met by RMBC. In 2002, we purchased all
of the bottles produced by RMBC, or approximately 1.1 bil-
lion bottles. RMBC’s total assets are $56.7 million.
The purchases under this supply agreement in 2002,
2001 and 2000 were approximately $92 million, $92 million
and $86 million, respectively. Cash distributions received
from this joint venture were $18.2 million, $9.1 million and
$20.3 million in 2002, 2001 and 2000, respectively. Our
share of net income from this partnership was $13.2 mil-
lion, $10.9 million and $9.8 million in 2002, 2001 and
2000, respectively, and is included as a reduction of Cost of
goods sold on the accompanying Consolidated Statements
of Income. We believe it is reasonably possible that RMBC
may be a variable interest entity as defined in FIN No. 46,
yet we do not believe that there is a significant exposure to
loss in our current relationship.
Metal Container Partnerships
Rocky Mountain Metal Container Effective January 1, 2002,
we became an equal member with Ball Corporation (Ball) in
a Colorado limited liability company, Rocky Mountain Metal
Container, LLC (RMMC). Also effective on January 1, 2002,
we entered into a can and end supply agreement with RMMC
(the Supply Agreement). Under that Supply Agreement,
RMMC agreed to supply us with substantially all of the can
and end requirements for our Golden Brewery. RMMC will
manufacture these cans and ends at our existing manufac-
turing facilities, which RMMC is operating under a use and
license agreement. We have the right to purchase Ball’s
interest in RMMC under certain conditions. If we do not
exercise that right, Ball may have the right to purchase our
interest in RMMC. On July 1, 2002, RMMC increased its
debt obligations from $20 million to $50 million (such
debt is not included on our Consolidated Balance Sheet).
The proceeds have been used to finance planned capital
improvements (see Management’s Discussion and Analysis
of Financial Condition and Results of Operations – Debt
Obligations). RMMC’s debt is secured by its various supply
and access agreements with no recourse to CBC or Ball.
RMMC’s total assets are $81.4 million.
Purchases under this supply agreement were approxi-
mately $210 million in 2002. We recorded a loss from the
limited liability company of approximately $0.6 million and it
is included within Cost of goods sold on the accompanying
Consolidated Statements of Income. There were no distribu-
tions in 2002. Prior to January 1, 2002 we had a joint
venture with Rexam called Valley Metal Container Partnership
(see below). We believe it is reasonably possible that RMMC
may be a variable interest entity as defined in FIN No. 46,
however, we do not believe there is a significant future expo-
sure to loss in our current relationship over our expected
ownership period.
Valley Metal Container Partnership In 1994, we formed a
50/50 production joint venture with American National Can
Company (ANC), called Valley Metal Container Partnership,
to produce beverage cans and ends at our manufacturing
facilities for sale to us and outside customers. ANC was sub-
sequently acquired by Rexam LLC. We purchased Rexam’s
interest in the joint venture at the end of its term in August
2001. The aggregate amount paid to the joint venture for
cans and ends in 2001 and 2000 was approximately
$149.0 million and $230.0 million, respectively. The 2001
amount reflects only what was paid to the joint venture prior
to its expiration in August. In addition, we received cash dis-
tributions from this joint venture of $2.5 million and $8.5
million in 2001 and 2000, respectively. Our share of net
A D O L P H C O O R S C O M P A N Y A N D S U B S I D I A R I E S 71
income from this joint venture was $5.7 million in 2001
and $7.2 million in 2000, and is included as a reduction
of Cost of goods sold on the accompanying Consolidated
Statements of Income.
Tradeteam Tradeteam was formed in 1995 by CBL (then
Bass Brewers Limited) and Exel Logistics. CBL has a 49.9%
interest in this joint venture. Total assets of the venture are
$107.9 million. The joint venture operates a system of satel-
lite warehouses and a transportation fleet for deliveries
between the CBL breweries and customers. Tradeteam also
delivers products for other U.K. breweries. Purchases under
this distribution agreement in 2002 were approximately
$131 million. We received $8.4 million in distributions
and our share of pretax income from the joint venture was
$8.3 million, which is recorded as a reduction of Cost of
goods sold on the accompanying Consolidated Statements of
Income. We believe it is reasonably possible that Tradeteam
may be a variable interest entity as defined in FIN No. 46, yet
we do not believe there is a significant exposure to loss in
our current relationship over our expected ownership period.
Tradeteam had one uncommitted line of credit totaling
15 million GBP, or approximately $24 million based on for-
eign exchange rates at December 29, 2002. No amount was
outstanding on this line of credit at December 29, 2002;
however, Tradeteam is required to pay a 0.5% commitment
fee on any undrawn amount. This line of credit bears interest
at a rate of 1% over GBP LIBOR.
Grolsch CBL has a 49% interest in the joint venture
company, Grolsch UK Limited. The Grolsch joint venture
involves the marketing of Grolsch branded beer in the
United Kingdom and Republic of Ireland. The majority of the
Grolsch branded beer is manufactured by CBL, under a con-
tract brewing arrangement with the joint venture. CBL sells
the beer to the joint venture, which sells the beer back to
CBL (for onward sale to customers) for a price equal to what
it paid CBL, plus a marketing and overhead charge plus a
profit margin. Total assets of the Grolsch joint venture are
$31.4 million. The profit margin is considered a royalty paid
to the joint venture as the brand owner. In 2002, we received
$2.6 million in distributions and our share of pretax income
from the joint venture was $2.0 million, which is recorded
as a reduction of Cost of goods sold on the accompanying
Consolidated Statements of Income. The joint venture con-
tains provisions permitting the joint venture partner, Royal
Grolsch, subject to notice, to buy our interest in the joint ven-
ture. We believe it is reasonably possible that Grolsch may
be a variable interest entity as defined in FIN No. 46, yet we
do not believe there is a significant exposure to loss in our
current relationship over our expected ownership period.
Golden Properties In 1992, we spun off our wholly owned
subsidiary, ACX Technologies, Inc., which has subsequently
changed its name to Graphic Packaging International
Corporation (GPIC). We are also a limited partner in a real
estate development partnership (Golden Properties) in which
a subsidiary of GPIC is the general partner. The partnership
owns, develops, operates and sells certain real estate previ-
ously owned directly by us. We received cash distributions
of $0.5 million and $0.8 million in 2002 and 2000, respec-
tively as a return of our capital account. We did not receive
any cash distributions in 2001. We were not entitled to any
of the joint venture income in 2002, 2001 or 2000.
Majority-owned, non-consolidated equity investment We
have an investment in Coors Canada (see below), an affiliate
that is majority-owned, non-consolidated and is accounted for
using the equity method of accounting. This investment aggre-
gated $6.4 million and $5.4 million at December 29, 2002
and December 30, 2001, respectively. There are no related
parties who own interests in this equity method investment.
Summarized condensed balance sheet information for
our majority-owned equity method investment is as follows:
(In thousands, as of) Dec. 29, 2002 Dec. 30, 2001
Current assets $17,448 $14,380
Non-current assets $÷÷«266 $÷÷«349
Current liabilities $÷4,530 $÷3,881
Non-current liabilities $÷÷÷÷«– $÷÷÷÷«–
72 A D O L P H C O O R S C O M P A N Y A N D S U B S I D I A R I E S
Notes to Consolidated Financial Statements
Summarized condensed income statement information for
our majority-owned equity method investments is as follows:
(In thousands,fiscal year ended) Dec. 29, 2002 Dec. 30, 2001 Dec. 31, 2000
Revenue $111,193 $115,489 $102,448
Pretax income $÷73,856 $÷58,386 $÷50,558
Company’s equity in pretax income $÷37,002 $÷29,258 $÷25,447
Coors Canada Coors Canada, Inc. (CCI), a wholly owned
subsidiary, formed a partnership, Coors Canada, with Molson
to market and sell our products in Canada. Coors Canada
began operations January 1, 1998. CCI and Molson have a
50.1% and 49.9% interest, respectively. CCI’s investment in
the partnership is accounted for using the equity method of
accounting due to effective control of the partnership being
shared equally by its partners. The partnership agreement
has an indefinite term and can be canceled at the election
of either partner. Under the partnership agreement, Coors
Canada is responsible for marketing our products in Canada,
while the partnership contracts with Molson for brewing, dis-
tribution and sales of these brands. Coors Canada receives
an amount from Molson generally equal to net sales revenue
generated from our brands less production, distribution, sales
and overhead costs related to these sales. CCI received dis-
tributions from the partnership of a U.S. dollar equivalent of
approximately $36.0 million, $27.9 million and $25.8 million
for 2002, 2001 and 2000, respectively. Our share of pretax
income from this partnership, which was approximately
$37.0 million in 2002, $29.2 million in 2001 and $25.4 mil-
lion in 2000, is included in Sales in the accompanying
Consolidated Statements of Income. We believe it is reason-
ably possible that Coors Canada may be a variable interest
entity as defined in FIN No. 46, however, we do not believe
there is a significant exposure to loss in our current relation-
ship over the expected ownership period. Also see discussion
in Note 14, “Segment and Geographic Information.”
In December 2000, we entered into a five year brewing
and packaging arrangement with Molson in which we will
have access to some of Molson’s available production
capacity in Canada. The Molson capacity available to us
under this arrangement in 2002 and 2001 was 500,000
and 250,000 barrels, respectively, none of which was used
by us. We pay Molson a fee for holding this capacity aside
for our future use. The annual fee, starting in 2002, is 1.5
million Canadian dollars, which results in an annual commit-
ment of approximately $1.0 million. As of December 29,
2002, we are fully accrued for all fees required under the
terms of this agreement.
Cost Method Investment
Colorado Rockies Baseball Partnership In 1991, we became
a limited partner in the Colorado Baseball Partnership 1993,
Ltd. (Baseball Partnership) for an investment of $10.0 mil-
lion. This commitment was finalized upon the awarding of a
National League Baseball franchise to Colorado in 1991.
The initial investment as a limited partner has been paid. We
generally apply the cost method of accounting to less than
20% owned investments where we do not exercise signifi-
cant influence. Our use of the cost method is in accordance
with the provisions of Emerging Issues Task Force Topic D-46,
Accounting for Limited Partnership Investments (EITF D-46),
as we entered into the limited partnership agreement in
1991 prior to the effective date for the implementation of
EITF D-46, which was to be applied to all limited partnership
investments made after May 18, 1995. As a limited partner,
we take no part in control, management, direction or opera-
tion of the affairs of the Baseball Partnership and have no
power to bind the Baseball Partnership. Profit and loss from
operations of the Baseball Partnership are allocated among
the partners in accordance with their ownership ratios.
We did not receive any cash distributions or income in 2002,
2001 or 2000. We believe that the carrying amount of our
investment in the Baseball Partnership is not in excess
of fair value.
Also in 1991, we entered into an agreement with the
Colorado Rockies Baseball Club (Club) regarding a multi-year
signage and advertising package. During 1998, the agreement
was modified to extend the term and expand the conditions
of the multi-year signage and advertising package. This new
agreement was valued at $34.5 million. The recognition of
A D O L P H C O O R S C O M P A N Y A N D S U B S I D I A R I E S 73
the liability under the multi-year signage and advertising
package began in 1995 with the opening of Coors Field.
This liability is included in the total advertising and promo-
tion commitment discussed in Note 15, “Commitments
and Contingencies.”
11. Stock Activity and Earnings Per Share
Capital stock Both classes of common stock have the same
rights and privileges, except for voting, which (with certain
limited exceptions) is the sole right of the holder of Class A
common stock.
Activity in our Class A and Class B common stock, net of
forfeitures, for each of the three years ended December 29,
2002, December 30, 2001, and December 31, 2000, is
summarized below:
Common stock
Class A Class B
Balances at December 26, 1999 1,260,000 35,462,034
Shares issued under stock plans – 817,395
Purchases of stock – (408,308))
Balances at December 31, 2000 1,260,000 35,871,121
Shares issued under stock plans – 324,926
Purchases of stock – (1,506,637)
Balances at December 30, 2001 1,260,000 34,689,410
Shares issued under stock plans – 391,193
Balances at December 29, 2002 1,260,000 35,080,603
At December 29, 2002, December 30, 2001, and
December 31, 2000, 25 million shares of no par value
preferred stock were authorized but un-issued.
Pursuant to our by-laws restricted shares must first be
offered to us for repurchase. The board of directors author-
ized the repurchase of up to $40 million per year of our
outstanding Class B common stock on the open market dur-
ing 2002, 2001, and 2000. In September 2001, the board
of directors increased the authorized 2001 expenditure limit
for the repurchase of outstanding shares of Class B common
stock to $90 million for the remainder of that fiscal year.
During 2001 and 2000, 1,500,000 shares and 308,000
shares, respectively, were repurchased for approximately
$72.3 million and $17.6 million, respectively, under this
stock repurchase program. In addition to the repurchase
program, we purchased 41,845 restricted shares for
$2.4 million in 2000. No additional shares were repur-
chased during 2002.
Basic and diluted net income per common share were
arrived at using the calculations outlined below:
(In thousands,except per share data,fiscal year ended) Dec. 29, 2002 Dec. 30, 2001 Dec. 31, 2000
Net income available to common shareholders $161,653 $122,964 $109,617
Weighted-average shares for basic EPS 36,140 36,902 36,785
Effect of dilutive securities
Stock options 397 266 606
Restricted shares for basic EPS 29 9 59
Weighted-average shares for diluted EPS 36,566 37,177 37,450
Basic EPS $÷÷÷4.47 $÷÷÷3.33 $÷÷÷2.98
Diluted EPS $÷÷÷4.42 $÷÷÷3.31 $÷÷÷2.93
Anti-dilutive securities 1,384 2,199 7
The dilutive effects of stock options were determined by
applying the treasury stock method, assuming we were to
purchase common shares with the proceeds from stock
option exercises. Anti-dilutive securities were not included
because the stock options’ exercise prices were greater than
the average market price of the common shares.
12. Derivative Instruments
In the normal course of business, we are exposed to fluc-
tuations in interest rates, the value of foreign currencies
and production and packaging materials prices. We have
established policies and procedures that govern the strate-
gic management of these exposures through the use of a
variety of financial instruments. By policy, we do not enter
into such contracts for trading purposes or for the purpose
of speculation.
74 A D O L P H C O O R S C O M P A N Y A N D S U B S I D I A R I E S
Notes to Consolidated Financial Statements
Our objective in managing our exposure to fluctuations
in interest rates, foreign currency exchange rates and pro-
duction and packaging materials prices is to decrease the
volatility of our earnings and cash flows effected by changes
in the underlying rates and prices. To achieve this objective,
we enter into foreign currency forward contracts, commodity
swaps, interest rate swaps and cross currency swaps, the
values of which change in the opposite direction of the
anticipated cash flows. We do not hedge the value of net
investments in foreign-currency-denominated operations or
translated earnings of foreign subsidiaries. Our primary for-
eign currency exposures are the British Pound Sterling (GBP),
the Canadian dollar (CAD) and the Japanese yen (YEN).
Derivatives are either exchange-traded instruments, or
over-the-counter agreements entered into with highly rated
financial institutions. No losses on over-the-counter agree-
ments due to counterparty credit issues are anticipated. All
over-the-counter agreements are entered into with counter-
parties rated no lower than A (S&P) or A2 (Moody’s). In some
instances we and our counterparties have reciprocal collater-
alization agreements regarding fair value positions in excess
of certain thresholds. These agreements call for the posting
of collateral in the form of cash, treasury securities or letters
of credit if a fair value loss position to us or our counter-
parties exceeds a certain amount. At December 29, 2002,
no collateral was posted by us or our counterparties.
All derivatives are recognized on the balance sheet at
their fair value. Unrealized gain positions are recorded as
other current assets or other non-current assets. Unrealized
loss positions are recorded as other liabilities or other
long-term liabilities.
The majority of all derivatives entered into by the Company
qualify for, and are designated as, foreign-currency cash flow
hedges, commodity cash flow hedges or fair value hedges,
including those derivatives hedging foreign currency denomi-
nated firm commitments as per the definitions of Statement
of Financial Accounting Standards No. 133 (SFAS No. 133).
The Company considers whether any provisions in non-
derivative contracts represent “embedded” derivative instru-
ments as described in SFAS No. 133. As of December 29,
2002, we have concluded that no “embedded” derivative
instruments warrant separate fair value accounting under
SFAS No. 133.
Changes in fair values of outstanding derivatives that
are highly effective as per the definition of SFAS 133 are
recorded in other comprehensive income, until earnings are
affected by the variability of cash flows of the underlying
hedged transaction. In most cases amounts recorded in
other comprehensive income will be released to earnings
at maturity of the related derivative. The consolidated state-
ment of income treatment of effective hedge results offsets
the gains or losses on the underlying exposure.
We formally document all relationships between hedging
instruments and hedged items, as well as the risk-management
objective and strategy for undertaking hedge transactions.
This process includes linking all derivatives that are desig-
nated as foreign-currency cash flow hedges and commodity
cash flow hedges to either specific assets and liabilities on
the balance sheet or specific firm commitments or fore-
casted transactions. We also formally assess, both at the
hedge’s inception and on an ongoing basis, whether the
derivatives that are used in hedging transactions have been
highly effective in offsetting changes in the cash flows of
hedged items and whether those derivatives may be expected
to remain highly effective in future periods. When it is deter-
mined that a derivative is not, or has ceased to be, highly
effective as a hedge, we discontinue hedge accounting
prospectively, as discussed below.
We discontinue hedge accounting prospectively when (1)
the derivative is no longer highly effective, as per SFAS No.
133, in offsetting changes in the cash flows of a hedged
item (including hedged items such as firm commitments or
forecasted transactions); (2) the derivative expires or is sold,
terminated, or exercised; (3) it is no longer probable that
the forecasted transaction will occur; or (4) management
determines that designating the derivative as a hedging
instrument is no longer appropriate.
When we discontinue hedge accounting because it is no
longer probable that the forecasted transaction will occur in
the originally expected period, the gain or loss on the deriva-
tive remains in accumulated other comprehensive income
and is reclassified into earnings when the forecasted trans-
action affects earnings. However, if it is no longer probable
that a forecasted transaction will occur by the end of the
A D O L P H C O O R S C O M P A N Y A N D S U B S I D I A R I E S 75
originally specified time period or within an additional two-
month period of time thereafter, the gains and losses that
were accumulated in other comprehensive income will be
recognized immediately in earnings. In all situations in which
hedge accounting is discontinued and the derivative remains
outstanding, we will carry the derivative at its fair value on
the balance sheet until maturity, recognizing future changes
in the fair value in current-period earnings. Any hedge ineffec-
tiveness, as per SFAS No. 133, is recorded in current-period
earnings. During 2002, we recorded an insignificant loss
relating to such ineffectiveness of all derivatives in Other
income, net. Effectiveness is assessed based on the com-
parison of current forward rates to the rates established
on our hedges.
As of December 29, 2002, $6.4 million of deferred
net losses (net of tax) on both outstanding and matured
derivatives accumulated in other comprehensive income
are expected to be reclassified to earnings during the next
twelve months as a result of expected gains or losses on
underlying hedged transactions also being recorded in earn-
ings. Actual amounts ultimately reclassified to earnings
are dependent on the applicable rates in effect when deriva-
tives contracts that are currently outstanding mature. As of
December 29, 2002, the maximum term over which we are
hedging exposures to the variability of cash flows for all
forecasted and recorded transactions is 10 years.
We are exposed to credit-related losses in the event of
non-performance by counterparties to hedging instruments
and do not enter into master netting arrangements. The
counterparties to derivative transactions are major financial
institutions with investment grade credit ratings of at least A,
A2 or better. However, this does not eliminate our exposure
to credit risk with these institutions. This credit risk is gener-
ally limited to the unrealized gains in such contracts should
any of these counterparties fail to perform as contracted. To
manage this risk, we have established counterparty credit
guidelines that are monitored and reported to management
according to prescribed guidelines. We utilize a portfolio of
financial institutions either headquartered or operating in the
same countries we conduct our business. As a result of the
above considerations, we consider the risk of counterparty
default to be minimal.
On May 7, 2002, we entered into certain cross currency
swaps totaling 530 million GBP (approximately $774 mil-
lion). The swaps included an initial exchange of principal
on the settlement date of our 63⁄8% private placement fixed
rate debt (see Note 4, “Debt”) and will require final principal
exchange 10 years later. The swaps also call for an exchange
of fixed GBP interest payments for fixed U.S. dollar interest
receipts. At the initial principal exchange, we paid U.S. dol-
lars to a counterparty and received GBP. Upon final exchange,
we will provide GBP to the counterparty and receive U.S. dol-
lars. The cross currency swaps have been designated as
cash flow hedges of the changes in value of the future GBP
interest and principal receipts that results from changes in
the U.S. dollar to GBP exchange rates on an intercompany
loan between us and our Europe subsidiary.
On the same day as the settlement of our private place-
ment offering and initial exchange of principal amounts
associated with our swap transactions, we were required to
settle our previously established forward sale of 530 million
GBP. The settlement of all these transactions in aggregate
resulted in a foreign exchange loss of approximately $30 mil-
lion, the majority of which was offset by a foreign exchange
gain on our intercompany loan.
On May 28, 2002, we entered into an interest rate swap
agreement related to our 63⁄8% fixed rate debt. The interest
rate swap converted $76.2 million notional amount from
fixed rates to floating rates and matures in 2012. We will
receive fixed U.S. dollar interest payments semi-annually at
a rate of 63⁄8% per annum and pay a rate to our counterparty
based on a credit spread of 0.789% plus the three-month
LIBOR rate, thereby exchanging a fixed interest obligation
for a floating interest rate obligation. There was no exchange
of principal at the inception of the swap. We designated the
interest rate swap as a fair value hedge of the changes in
the fair value of the $76.2 million fixed rate debt attributable
to changes in the LIBOR swap rates.
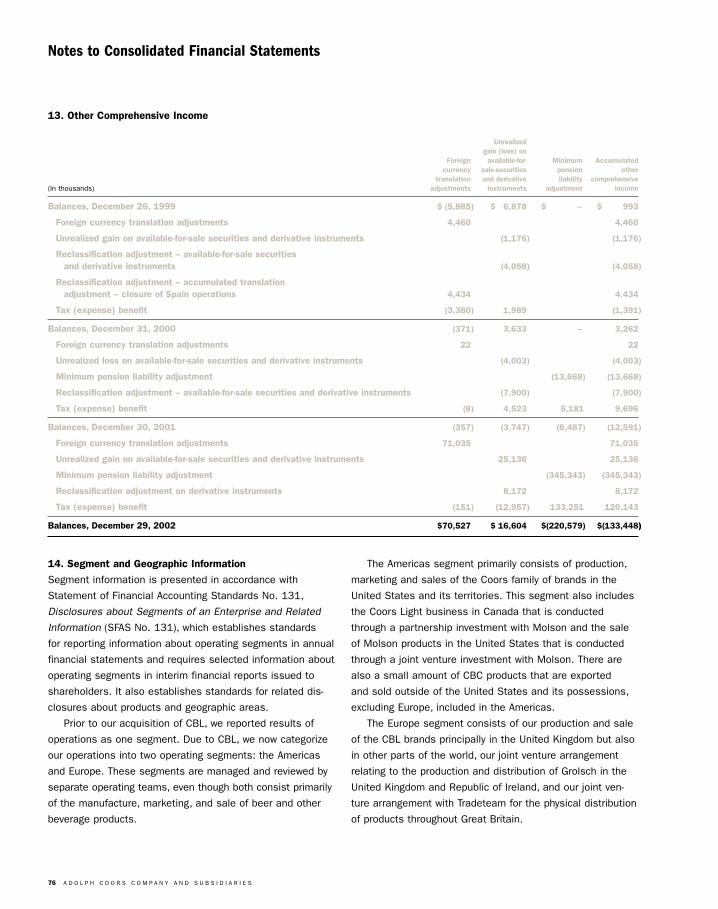
76 A D O L P H C O O R S C O M P A N Y A N D S U B S I D I A R I E S
Notes to Consolidated Financial Statements
The Americas segment primarily consists of production,
marketing and sales of the Coors family of brands in the
United States and its territories. This segment also includes
the Coors Light business in Canada that is conducted
through a partnership investment with Molson and the sale
of Molson products in the United States that is conducted
through a joint venture investment with Molson. There are
also a small amount of CBC products that are exported
and sold outside of the United States and its possessions,
excluding Europe, included in the Americas.
The Europe segment consists of our production and sale
of the CBL brands principally in the United Kingdom but also
in other parts of the world, our joint venture arrangement
relating to the production and distribution of Grolsch in the
United Kingdom and Republic of Ireland, and our joint ven-
ture arrangement with Tradeteam for the physical distribution
of products throughout Great Britain.
13. Other Comprehensive Income
Unrealizedgain (loss) on
Foreign available-for- Minimum Accumulatedcurrency sale-securities pension other
translation and derivative liability comprehensive(In thousands) adjustments instruments adjustment income
Balances, December 26, 1999 $«(5,885) $«÷6,878 $÷÷÷÷÷÷– $÷÷««««993
Foreign currency translation adjustments 4,460 4,460
Unrealized gain on available-for-sale securities and derivative instruments (1,176) (1,176)
Reclassification adjustment – available-for-sale securities and derivative instruments (4,058) (4,058)
Reclassification adjustment – accumulated translation adjustment – closure of Spain operations 4,434 4,434
Tax (expense) benefit (3,380) 1,989 (1,391)
Balances, December 31, 2000 (371) 3,633 – 3,262
Foreign currency translation adjustments 22 22
Unrealized loss on available-for-sale securities and derivative instruments (4,003) (4,003)
Minimum pension liability adjustment (13,668) (13,668)
Reclassification adjustment – available-for-sale securities and derivative instruments (7,900) (7,900)
Tax (expense) benefit (8) 4,523 5,181 9,696
Balances, December 30, 2001 (357) (3,747) (8,487) (12,591)
Foreign currency translation adjustments 71,035 71,035
Unrealized gain on available-for-sale securities and derivative instruments 25,136 25,136
Minimum pension liability adjustment (345,343) (345,343)
Reclassification adjustment on derivative instruments 8,172 8,172
Tax (expense) benefit (151) (12,957) 133,251 120,143
Balances, December 29, 2002 $70,527 $«16,604 $(220,579) $(133,448))
14. Segment and Geographic Information
Segment information is presented in accordance with
Statement of Financial Accounting Standards No. 131,
Disclosures about Segments of an Enterprise and Related
Information (SFAS No. 131), which establishes standards
for reporting information about operating segments in annual
financial statements and requires selected information about
operating segments in interim financial reports issued to
shareholders. It also establishes standards for related dis-
closures about products and geographic areas.
Prior to our acquisition of CBL, we reported results of
operations as one segment. Due to CBL, we now categorize
our operations into two operating segments: the Americas
and Europe. These segments are managed and reviewed by
separate operating teams, even though both consist primarily
of the manufacture, marketing, and sale of beer and other
beverage products.
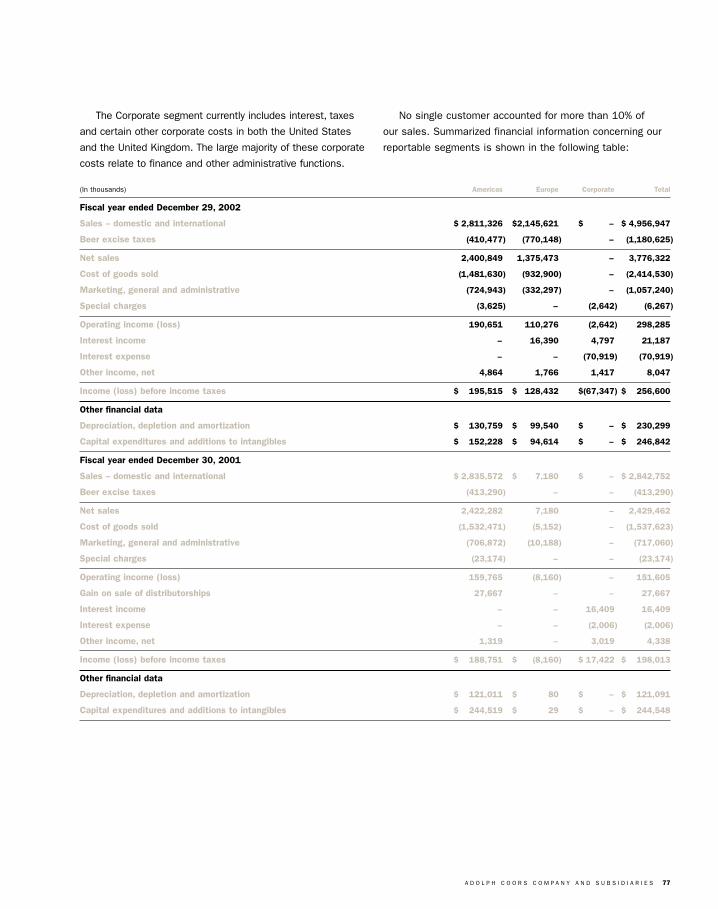
A D O L P H C O O R S C O M P A N Y A N D S U B S I D I A R I E S 77
(In thousands) Americas Europe Corporate Total
Fiscal year ended December 29, 2002
Sales – domestic and international $«2,811,326 $2,145,621 $÷÷÷÷÷– $«4,956,947
Beer excise taxes (410,477) (770,148) – (1,180,625)
Net sales 2,400,849 1,375,473 – 3,776,322
Cost of goods sold (1,481,630) (932,900) – (2,414,530)
Marketing, general and administrative (724,943) (332,297) – (1,057,240)
Special charges (3,625) – (2,642) (6,267)
Operating income (loss) 190,651 110,276 (2,642) 298,285
Interest income – 16,390 4,797 21,187
Interest expense – – (70,919) (70,919)
Other income, net 4,864 1,766 1,417 8,047
Income (loss) before income taxes $«÷«195,515 $÷«128,432 $(67,347) $÷÷256,600
Other financial data
Depreciation, depletion and amortization $÷÷130,759 $÷÷«99,540 $÷÷÷÷÷– $÷÷230,299
Capital expenditures and additions to intangibles $÷÷152,228 $÷÷«94,614 $÷÷÷÷÷– $÷÷246,842
Fiscal year ended December 30, 2001
Sales – domestic and international $«2,835,572 $÷÷÷«7,180 $«÷÷÷÷«– $«2,842,752
Beer excise taxes (413,290) – – (413,290)
Net sales 2,422,282 7,180 – 2,429,462
Cost of goods sold (1,532,471) (5,152) – (1,537,623)
Marketing, general and administrative (706,872) (10,188) – (717,060)
Special charges (23,174) – – (23,174)
Operating income (loss) 159,765 (8,160) – 151,605
Gain on sale of distributorships 27,667 – – 27,667
Interest income – – 16,409 16,409
Interest expense – – (2,006) (2,006)
Other income, net 1,319 – 3,019 4,338
Income (loss) before income taxes $÷÷188,751 $÷÷÷(8,160) $«17,422 $÷÷198,013
Other financial data
Depreciation, depletion and amortization $÷÷121,011 $÷÷÷÷÷÷80 $«÷÷÷÷«– $÷÷121,091
Capital expenditures and additions to intangibles $÷÷244,519 $÷÷÷÷÷÷29 $«÷÷÷÷«– $÷÷244,548
The Corporate segment currently includes interest, taxes
and certain other corporate costs in both the United States
and the United Kingdom. The large majority of these corporate
costs relate to finance and other administrative functions.
No single customer accounted for more than 10% of
our sales. Summarized financial information concerning our
reportable segments is shown in the following table:
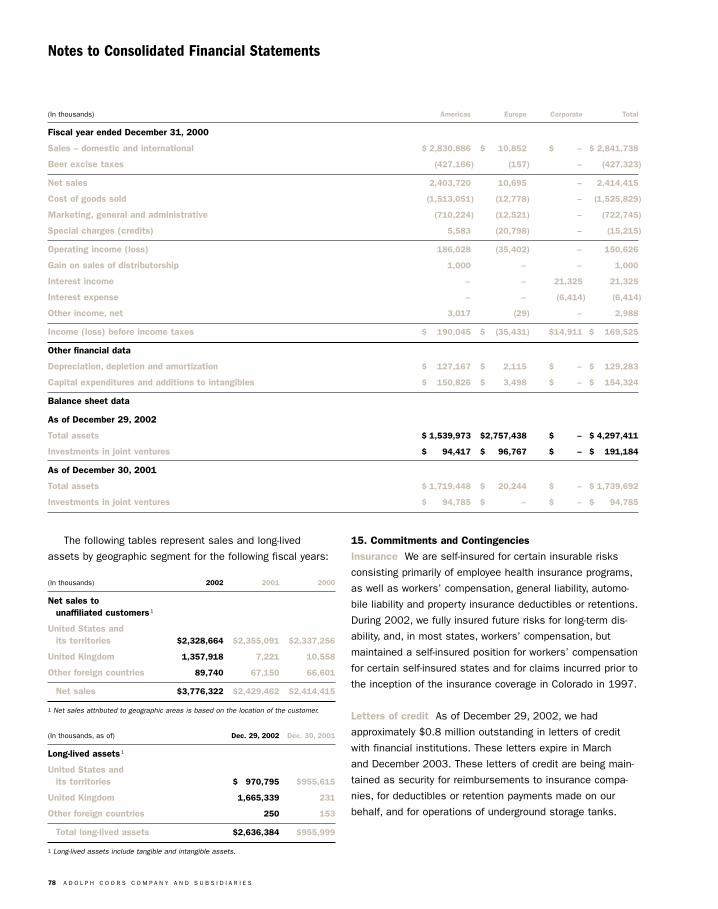
78 A D O L P H C O O R S C O M P A N Y A N D S U B S I D I A R I E S
The following tables represent sales and long-lived
assets by geographic segment for the following fiscal years:
(In thousands) 2002 2001 2000
Net sales to unaffiliated customers 1
United States and its territories $2,328,664 $2,355,091 $2,337,256
United Kingdom 1,357,918 7,221 10,558
Other foreign countries 89,740 67,150 66,601
Net sales $3,776,322 $2,429,462 $2,414,415
1 Net sales attributed to geographic areas is based on the location of the customer.
(In thousands, as of) Dec. 29, 2002 Dec. 30, 2001
Long-lived assets 1
United States and its territories $÷«970,795 $955,615
United Kingdom 1,665,339 231
Other foreign countries 250 153
Total long-lived assets $2,636,384 $955,999
1 Long-lived assets include tangible and intangible assets.
15. Commitments and Contingencies
Insurance We are self-insured for certain insurable risks
consisting primarily of employee health insurance programs,
as well as workers’ compensation, general liability, automo-
bile liability and property insurance deductibles or retentions.
During 2002, we fully insured future risks for long-term dis-
ability, and, in most states, workers’ compensation, but
maintained a self-insured position for workers’ compensation
for certain self-insured states and for claims incurred prior to
the inception of the insurance coverage in Colorado in 1997.
Letters of credit As of December 29, 2002, we had
approximately $0.8 million outstanding in letters of credit
with financial institutions. These letters expire in March
and December 2003. These letters of credit are being main-
tained as security for reimbursements to insurance compa-
nies, for deductibles or retention payments made on our
behalf, and for operations of underground storage tanks.
(In thousands) Americas Europe Corporate Total
Fiscal year ended December 31, 2000
Sales – domestic and international $«2,830,886 $÷÷«10,852 $÷÷÷÷«– $«2,841,738
Beer excise taxes (427,166) (157) – (427,323)
Net sales 2,403,720 10,695 – 2,414,415
Cost of goods sold (1,513,051) (12,778) – (1,525,829)
Marketing, general and administrative (710,224) (12,521) – (722,745)
Special charges (credits) 5,583 (20,798) – (15,215)
Operating income (loss) 186,028 (35,402) – 150,626
Gain on sales of distributorship 1,000 – – 1,000
Interest income – – 21,325 21,325
Interest expense – – (6,414) (6,414)
Other income, net 3,017 (29) – 2,988
Income (loss) before income taxes $÷÷190,045 $÷÷(35,431) $14,911 $÷÷169,525
Other financial data
Depreciation, depletion and amortization $÷÷127,167 $÷÷÷«2,115 $÷÷÷÷«– $÷÷129,283
Capital expenditures and additions to intangibles $÷÷150,826 $÷÷÷«3,498 $÷÷÷÷«– $÷÷154,324
Balance sheet data
As of December 29, 2002
Total assets $«1,539,973 $2,757,438 $÷÷÷÷«– $«4,297,411
Investments in joint ventures $÷÷÷94,417 $÷÷«96,767 $÷÷÷÷«– $÷÷191,184
As of December 30, 2001
Total assets $«1,719,448 $÷÷«20,244 $÷÷÷÷«– $«1,739,692
Investments in joint ventures $÷÷÷94,785 $÷÷÷÷÷÷÷– $÷÷÷÷«– $÷÷÷94,785
Notes to Consolidated Financial Statements
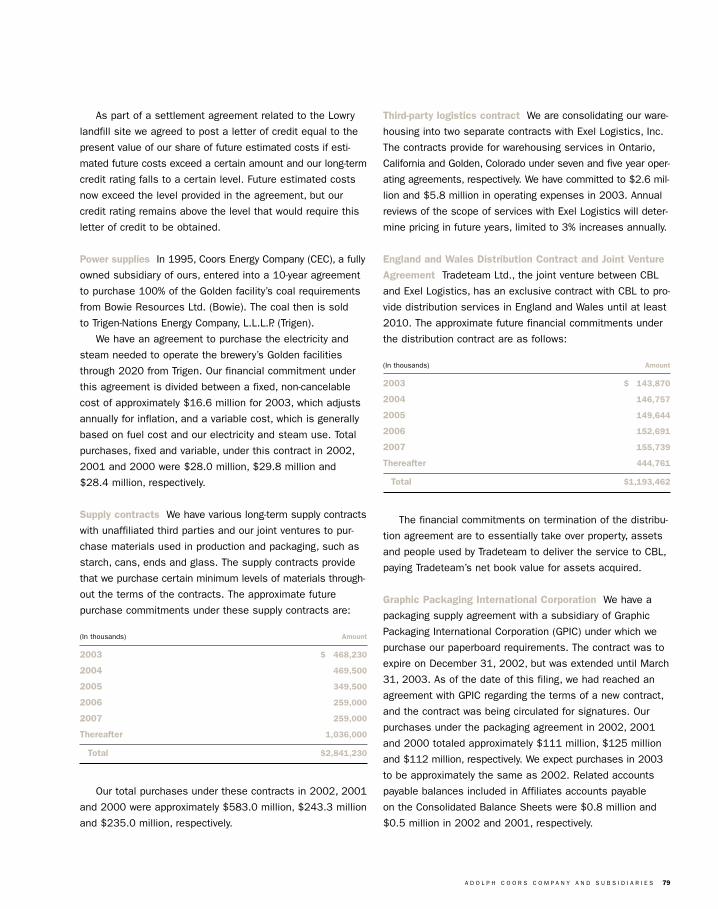
A D O L P H C O O R S C O M P A N Y A N D S U B S I D I A R I E S 79
As part of a settlement agreement related to the Lowry
landfill site we agreed to post a letter of credit equal to the
present value of our share of future estimated costs if esti-
mated future costs exceed a certain amount and our long-term
credit rating falls to a certain level. Future estimated costs
now exceed the level provided in the agreement, but our
credit rating remains above the level that would require this
letter of credit to be obtained.
Power supplies In 1995, Coors Energy Company (CEC), a fully
owned subsidiary of ours, entered into a 10-year agreement
to purchase 100% of the Golden facility’s coal requirements
from Bowie Resources Ltd. (Bowie). The coal then is sold
to Trigen-Nations Energy Company, L.L.L.P. (Trigen).
We have an agreement to purchase the electricity and
steam needed to operate the brewery’s Golden facilities
through 2020 from Trigen. Our financial commitment under
this agreement is divided between a fixed, non-cancelable
cost of approximately $16.6 million for 2003, which adjusts
annually for inflation, and a variable cost, which is generally
based on fuel cost and our electricity and steam use. Total
purchases, fixed and variable, under this contract in 2002,
2001 and 2000 were $28.0 million, $29.8 million and
$28.4 million, respectively.
Supply contracts We have various long-term supply contracts
with unaffiliated third parties and our joint ventures to pur-
chase materials used in production and packaging, such as
starch, cans, ends and glass. The supply contracts provide
that we purchase certain minimum levels of materials through-
out the terms of the contracts. The approximate future
purchase commitments under these supply contracts are:
(In thousands) Amount
2003 $÷«468,230
2004 469,500
2005 349,500
2006 259,000
2007 259,000
Thereafter 1,036,000
Total $2,841,230
Our total purchases under these contracts in 2002, 2001
and 2000 were approximately $583.0 million, $243.3 million
and $235.0 million, respectively.
Third-party logistics contract We are consolidating our ware-
housing into two separate contracts with Exel Logistics, Inc.
The contracts provide for warehousing services in Ontario,
California and Golden, Colorado under seven and five year oper-
ating agreements, respectively. We have committed to $2.6 mil-
lion and $5.8 million in operating expenses in 2003. Annual
reviews of the scope of services with Exel Logistics will deter-
mine pricing in future years, limited to 3% increases annually.
England and Wales Distribution Contract and Joint Venture
Agreement Tradeteam Ltd., the joint venture between CBL
and Exel Logistics, has an exclusive contract with CBL to pro-
vide distribution services in England and Wales until at least
2010. The approximate future financial commitments under
the distribution contract are as follows:
(In thousands) Amount
2003 $÷«143,870
2004 146,757
2005 149,644
2006 152,691
2007 155,739
Thereafter 444,761
Total $1,193,462
The financial commitments on termination of the distribu-
tion agreement are to essentially take over property, assets
and people used by Tradeteam to deliver the service to CBL,
paying Tradeteam’s net book value for assets acquired.
Graphic Packaging International Corporation We have a
packaging supply agreement with a subsidiary of Graphic
Packaging International Corporation (GPIC) under which we
purchase our paperboard requirements. The contract was to
expire on December 31, 2002, but was extended until March
31, 2003. As of the date of this filing, we had reached an
agreement with GPIC regarding the terms of a new contract,
and the contract was being circulated for signatures. Our
purchases under the packaging agreement in 2002, 2001
and 2000 totaled approximately $111 million, $125 million
and $112 million, respectively. We expect purchases in 2003
to be approximately the same as 2002. Related accounts
payable balances included in Affiliates accounts payable
on the Consolidated Balance Sheets were $0.8 million and
$0.5 million in 2002 and 2001, respectively.
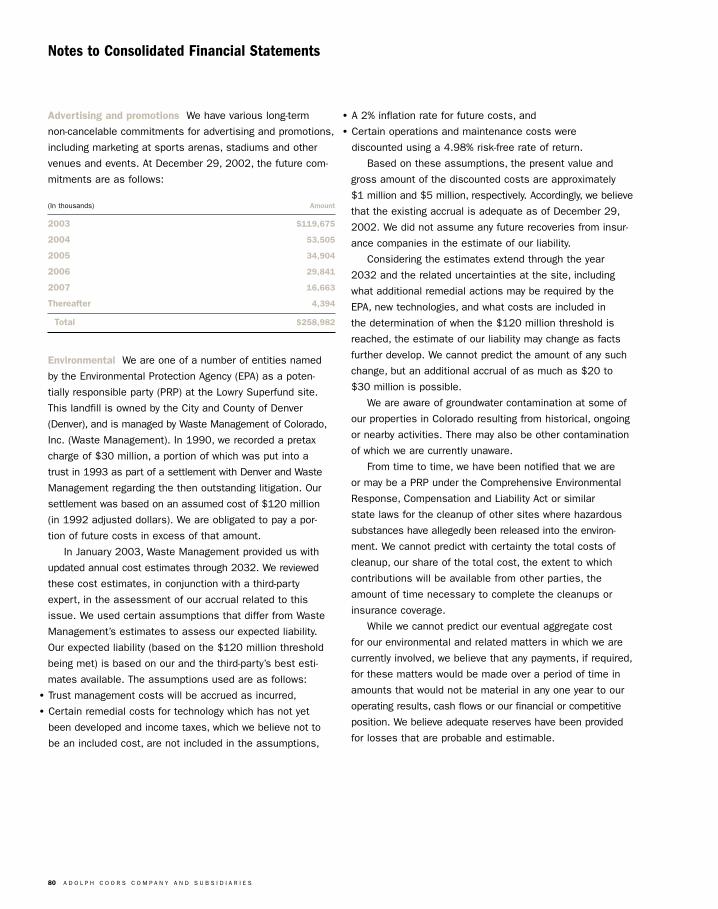
80 A D O L P H C O O R S C O M P A N Y A N D S U B S I D I A R I E S
Advertising and promotions We have various long-term
non-cancelable commitments for advertising and promotions,
including marketing at sports arenas, stadiums and other
venues and events. At December 29, 2002, the future com-
mitments are as follows:
(In thousands) Amount
2003 $119,675
2004 53,505
2005 34,904
2006 29,841
2007 16,663
Thereafter 4,394
Total $258,982
Environmental We are one of a number of entities named
by the Environmental Protection Agency (EPA) as a poten-
tially responsible party (PRP) at the Lowry Superfund site.
This landfill is owned by the City and County of Denver
(Denver), and is managed by Waste Management of Colorado,
Inc. (Waste Management). In 1990, we recorded a pretax
charge of $30 million, a portion of which was put into a
trust in 1993 as part of a settlement with Denver and Waste
Management regarding the then outstanding litigation. Our
settlement was based on an assumed cost of $120 million
(in 1992 adjusted dollars). We are obligated to pay a por-
tion of future costs in excess of that amount.
In January 2003, Waste Management provided us with
updated annual cost estimates through 2032. We reviewed
these cost estimates, in conjunction with a third-party
expert, in the assessment of our accrual related to this
issue. We used certain assumptions that differ from Waste
Management’s estimates to assess our expected liability.
Our expected liability (based on the $120 million threshold
being met) is based on our and the third-party’s best esti-
mates available. The assumptions used are as follows:
• Trust management costs will be accrued as incurred,
• Certain remedial costs for technology which has not yet
been developed and income taxes, which we believe not to
be an included cost, are not included in the assumptions,
• A 2% inflation rate for future costs, and
• Certain operations and maintenance costs were
discounted using a 4.98% risk-free rate of return.
Based on these assumptions, the present value and
gross amount of the discounted costs are approximately
$1 million and $5 million, respectively. Accordingly, we believe
that the existing accrual is adequate as of December 29,
2002. We did not assume any future recoveries from insur-
ance companies in the estimate of our liability.
Considering the estimates extend through the year
2032 and the related uncertainties at the site, including
what additional remedial actions may be required by the
EPA, new technologies, and what costs are included in
the determination of when the $120 million threshold is
reached, the estimate of our liability may change as facts
further develop. We cannot predict the amount of any such
change, but an additional accrual of as much as $20 to
$30 million is possible.
We are aware of groundwater contamination at some of
our properties in Colorado resulting from historical, ongoing
or nearby activities. There may also be other contamination
of which we are currently unaware.
From time to time, we have been notified that we are
or may be a PRP under the Comprehensive Environmental
Response, Compensation and Liability Act or similar
state laws for the cleanup of other sites where hazardous
substances have allegedly been released into the environ-
ment. We cannot predict with certainty the total costs of
cleanup, our share of the total cost, the extent to which
contributions will be available from other parties, the
amount of time necessary to complete the cleanups or
insurance coverage.
While we cannot predict our eventual aggregate cost
for our environmental and related matters in which we are
currently involved, we believe that any payments, if required,
for these matters would be made over a period of time in
amounts that would not be material in any one year to our
operating results, cash flows or our financial or competitive
position. We believe adequate reserves have been provided
for losses that are probable and estimable.
Notes to Consolidated Financial Statements
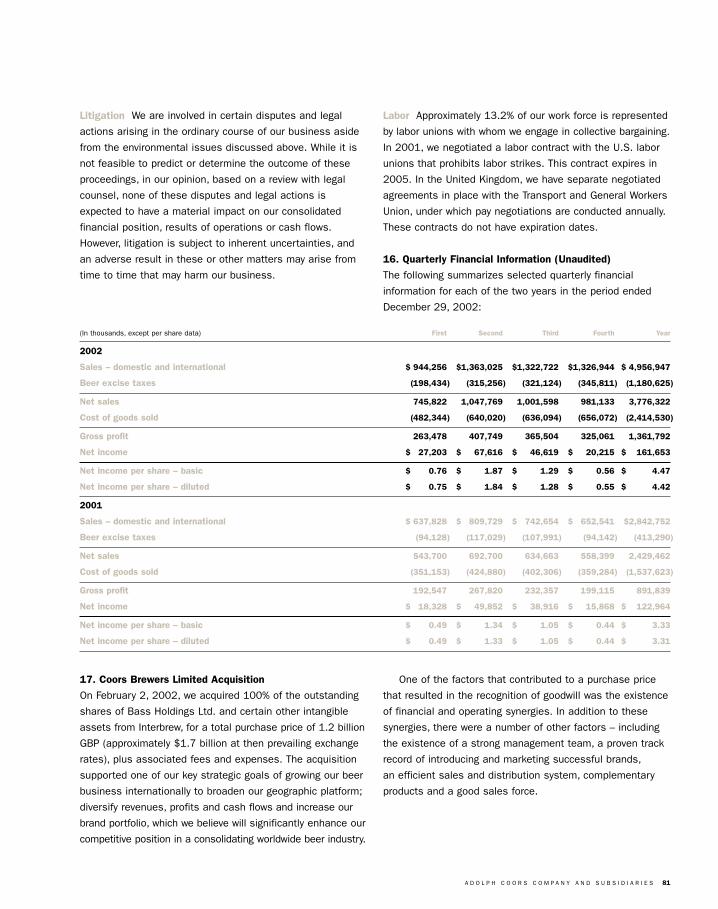
A D O L P H C O O R S C O M P A N Y A N D S U B S I D I A R I E S 81
(In thousands, except per share data) First Second Third Fourth Year
2002
Sales – domestic and international $«944,256 $1,363,025 $1,322,722 $1,326,944 $«4,956,947
Beer excise taxes (198,434) (315,256) (321,124) (345,811) (1,180,625)
Net sales 745,822 1,047,769 1,001,598 981,133 3,776,322
Cost of goods sold (482,344) (640,020) (636,094) (656,072) (2,414,530)
Gross profit 263,478 407,749 365,504 325,061 1,361,792
Net income $÷«27,203 $÷÷«67,616 $÷÷«46,619 $÷÷«20,215 $÷÷161,653
Net income per share – basic $÷÷÷«0.76 $÷÷÷÷«1.87 $÷÷÷÷«1.29 $÷÷÷÷«0.56 $÷÷÷÷÷4.47
Net income per share – diluted $÷÷÷«0.75 $÷÷÷÷«1.84 $÷÷÷÷«1.28 $÷÷÷÷«0.55 $÷÷÷÷÷4.42
2001
Sales – domestic and international $«637,828 $÷«809,729 $÷«742,654 $÷«652,541 $2,842,752
Beer excise taxes (94,128) (117,029) (107,991) (94,142) (413,290)
Net sales 543,700 692,700 634,663 558,399 2,429,462
Cost of goods sold (351,153) (424,880) (402,306) (359,284) (1,537,623)
Gross profit 192,547 267,820 232,357 199,115 891,839
Net income $÷«18,328 $÷÷«49,852 $÷÷«38,916 $÷÷«15,868 $÷÷122,964
Net income per share – basic $÷÷÷«0.49 $÷÷÷÷«1.34 $÷÷÷÷«1.05 $÷÷÷÷«0.44 $÷÷÷÷÷3.33
Net income per share – diluted $÷÷÷«0.49 $÷÷÷÷«1.33 $÷÷÷÷«1.05 $÷÷÷÷«0.44 $÷÷÷÷÷3.31
Litigation We are involved in certain disputes and legal
actions arising in the ordinary course of our business aside
from the environmental issues discussed above. While it is
not feasible to predict or determine the outcome of these
proceedings, in our opinion, based on a review with legal
counsel, none of these disputes and legal actions is
expected to have a material impact on our consolidated
financial position, results of operations or cash flows.
However, litigation is subject to inherent uncertainties, and
an adverse result in these or other matters may arise from
time to time that may harm our business.
Labor Approximately 13.2% of our work force is represented
by labor unions with whom we engage in collective bargaining.
In 2001, we negotiated a labor contract with the U.S. labor
unions that prohibits labor strikes. This contract expires in
2005. In the United Kingdom, we have separate negotiated
agreements in place with the Transport and General Workers
Union, under which pay negotiations are conducted annually.
These contracts do not have expiration dates.
16. Quarterly Financial Information (Unaudited)
The following summarizes selected quarterly financial
information for each of the two years in the period ended
December 29, 2002:
17. Coors Brewers Limited Acquisition
On February 2, 2002, we acquired 100% of the outstanding
shares of Bass Holdings Ltd. and certain other intangible
assets from Interbrew, for a total purchase price of 1.2 billion
GBP (approximately $1.7 billion at then prevailing exchange
rates), plus associated fees and expenses. The acquisition
supported one of our key strategic goals of growing our beer
business internationally to broaden our geographic platform;
diversify revenues, profits and cash flows and increase our
brand portfolio, which we believe will significantly enhance our
competitive position in a consolidating worldwide beer industry.
One of the factors that contributed to a purchase price
that resulted in the recognition of goodwill was the existence
of financial and operating synergies. In addition to these
synergies, there were a number of other factors – including
the existence of a strong management team, a proven track
record of introducing and marketing successful brands,
an efficient sales and distribution system, complementary
products and a good sales force.
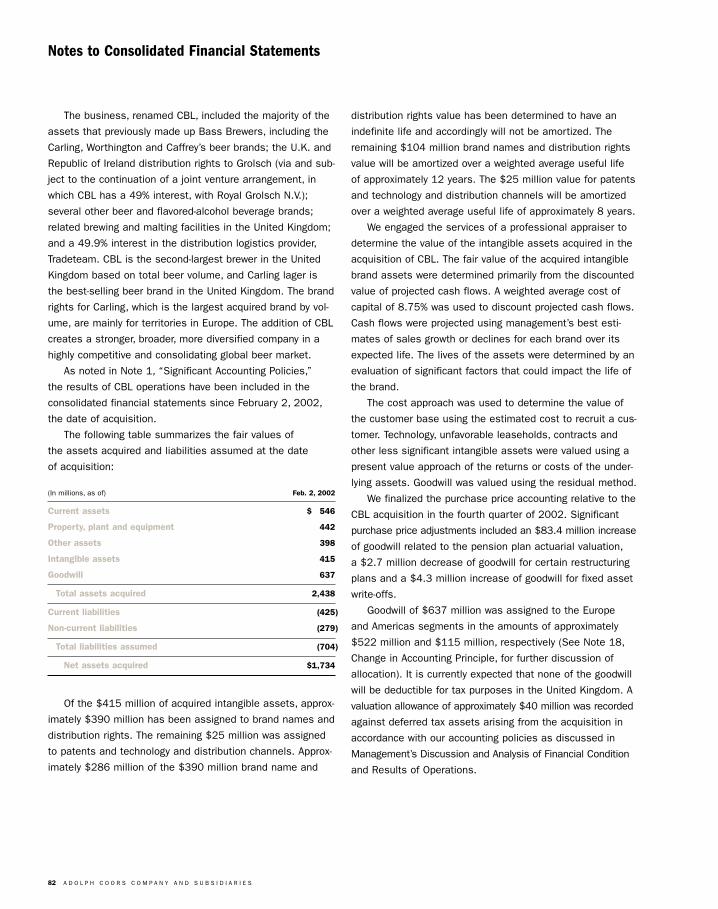
82 A D O L P H C O O R S C O M P A N Y A N D S U B S I D I A R I E S
The business, renamed CBL, included the majority of the
assets that previously made up Bass Brewers, including the
Carling, Worthington and Caffrey’s beer brands; the U.K. and
Republic of Ireland distribution rights to Grolsch (via and sub-
ject to the continuation of a joint venture arrangement, in
which CBL has a 49% interest, with Royal Grolsch N.V.);
several other beer and flavored-alcohol beverage brands;
related brewing and malting facilities in the United Kingdom;
and a 49.9% interest in the distribution logistics provider,
Tradeteam. CBL is the second-largest brewer in the United
Kingdom based on total beer volume, and Carling lager is
the best-selling beer brand in the United Kingdom. The brand
rights for Carling, which is the largest acquired brand by vol-
ume, are mainly for territories in Europe. The addition of CBL
creates a stronger, broader, more diversified company in a
highly competitive and consolidating global beer market.
As noted in Note 1, “Significant Accounting Policies,”
the results of CBL operations have been included in the
consolidated financial statements since February 2, 2002,
the date of acquisition.
The following table summarizes the fair values of
the assets acquired and liabilities assumed at the date
of acquisition:
(In millions, as of) Feb. 2, 2002
Current assets $÷«546
Property, plant and equipment 442
Other assets 398
Intangible assets 415
Goodwill 637
Total assets acquired 2,438
Current liabilities (425)
Non-current liabilities (279)
Total liabilities assumed (704)
Net assets acquired $1,734
Of the $415 million of acquired intangible assets, approx-
imately $390 million has been assigned to brand names and
distribution rights. The remaining $25 million was assigned
to patents and technology and distribution channels. Approx-
imately $286 million of the $390 million brand name and
distribution rights value has been determined to have an
indefinite life and accordingly will not be amortized. The
remaining $104 million brand names and distribution rights
value will be amortized over a weighted average useful life
of approximately 12 years. The $25 million value for patents
and technology and distribution channels will be amortized
over a weighted average useful life of approximately 8 years.
We engaged the services of a professional appraiser to
determine the value of the intangible assets acquired in the
acquisition of CBL. The fair value of the acquired intangible
brand assets were determined primarily from the discounted
value of projected cash flows. A weighted average cost of
capital of 8.75% was used to discount projected cash flows.
Cash flows were projected using management’s best esti-
mates of sales growth or declines for each brand over its
expected life. The lives of the assets were determined by an
evaluation of significant factors that could impact the life of
the brand.
The cost approach was used to determine the value of
the customer base using the estimated cost to recruit a cus-
tomer. Technology, unfavorable leaseholds, contracts and
other less significant intangible assets were valued using a
present value approach of the returns or costs of the under-
lying assets. Goodwill was valued using the residual method.
We finalized the purchase price accounting relative to the
CBL acquisition in the fourth quarter of 2002. Significant
purchase price adjustments included an $83.4 million increase
of goodwill related to the pension plan actuarial valuation,
a $2.7 million decrease of goodwill for certain restructuring
plans and a $4.3 million increase of goodwill for fixed asset
write-offs.
Goodwill of $637 million was assigned to the Europe
and Americas segments in the amounts of approximately
$522 million and $115 million, respectively (See Note 18,
Change in Accounting Principle, for further discussion of
allocation). It is currently expected that none of the goodwill
will be deductible for tax purposes in the United Kingdom. A
valuation allowance of approximately $40 million was recorded
against deferred tax assets arising from the acquisition in
accordance with our accounting policies as discussed in
Management’s Discussion and Analysis of Financial Condition
and Results of Operations.
Notes to Consolidated Financial Statements
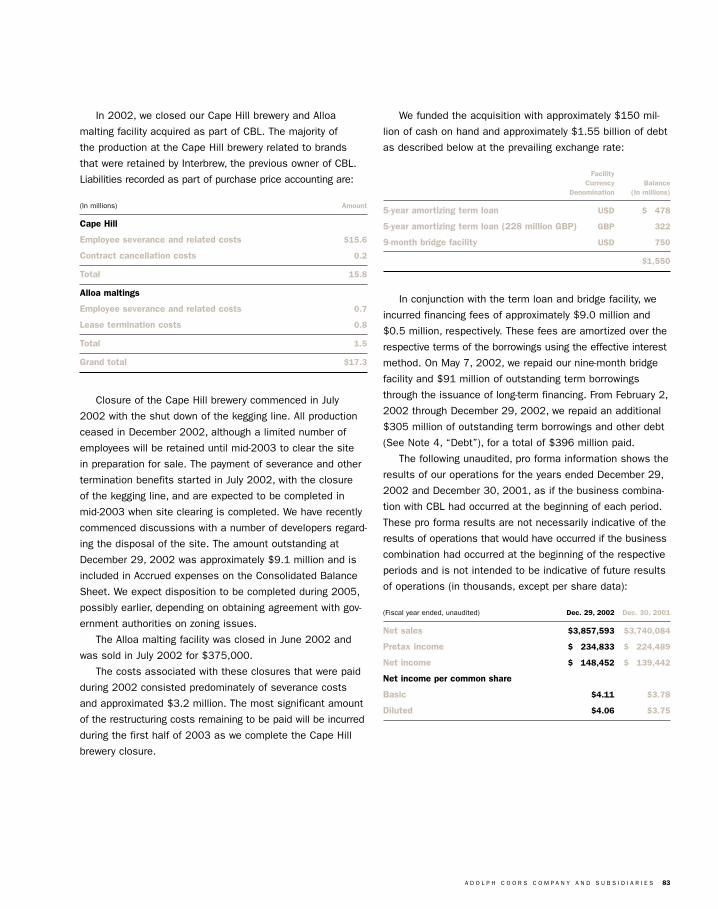
A D O L P H C O O R S C O M P A N Y A N D S U B S I D I A R I E S 83
In 2002, we closed our Cape Hill brewery and Alloa
malting facility acquired as part of CBL. The majority of
the production at the Cape Hill brewery related to brands
that were retained by Interbrew, the previous owner of CBL.
Liabilities recorded as part of purchase price accounting are:
(In millions) Amount
Cape Hill
Employee severance and related costs $15.6
Contract cancellation costs 0.2
Total 15.8
Alloa maltings
Employee severance and related costs 0.7
Lease termination costs 0.8
Total 1.5
Grand total $17.3
Closure of the Cape Hill brewery commenced in July
2002 with the shut down of the kegging line. All production
ceased in December 2002, although a limited number of
employees will be retained until mid-2003 to clear the site
in preparation for sale. The payment of severance and other
termination benefits started in July 2002, with the closure
of the kegging line, and are expected to be completed in
mid-2003 when site clearing is completed. We have recently
commenced discussions with a number of developers regard-
ing the disposal of the site. The amount outstanding at
December 29, 2002 was approximately $9.1 million and is
included in Accrued expenses on the Consolidated Balance
Sheet. We expect disposition to be completed during 2005,
possibly earlier, depending on obtaining agreement with gov-
ernment authorities on zoning issues.
The Alloa malting facility was closed in June 2002 and
was sold in July 2002 for $375,000.
The costs associated with these closures that were paid
during 2002 consisted predominately of severance costs
and approximated $3.2 million. The most significant amount
of the restructuring costs remaining to be paid will be incurred
during the first half of 2003 as we complete the Cape Hill
brewery closure.
We funded the acquisition with approximately $150 mil-
lion of cash on hand and approximately $1.55 billion of debt
as described below at the prevailing exchange rate:
FacilityCurrency Balance
Denomination (In millions)
5-year amortizing term loan USD $÷«478
5-year amortizing term loan (228 million GBP) GBP 322
9-month bridge facility USD 750
$1,550
In conjunction with the term loan and bridge facility, we
incurred financing fees of approximately $9.0 million and
$0.5 million, respectively. These fees are amortized over the
respective terms of the borrowings using the effective interest
method. On May 7, 2002, we repaid our nine-month bridge
facility and $91 million of outstanding term borrowings
through the issuance of long-term financing. From February 2,
2002 through December 29, 2002, we repaid an additional
$305 million of outstanding term borrowings and other debt
(See Note 4, “Debt”), for a total of $396 million paid.
The following unaudited, pro forma information shows the
results of our operations for the years ended December 29,
2002 and December 30, 2001, as if the business combina-
tion with CBL had occurred at the beginning of each period.
These pro forma results are not necessarily indicative of the
results of operations that would have occurred if the business
combination had occurred at the beginning of the respective
periods and is not intended to be indicative of future results
of operations (in thousands, except per share data):
(Fiscal year ended, unaudited) Dec. 29, 2002 Dec. 30, 2001
Net sales $3,857,593 $3,740,084
Pretax income $÷«234,833 $÷«224,489
Net income $÷«148,452 $÷«139,442
Net income per common share
Basic $4.11 $3.78
Diluted $4.06 $3.75
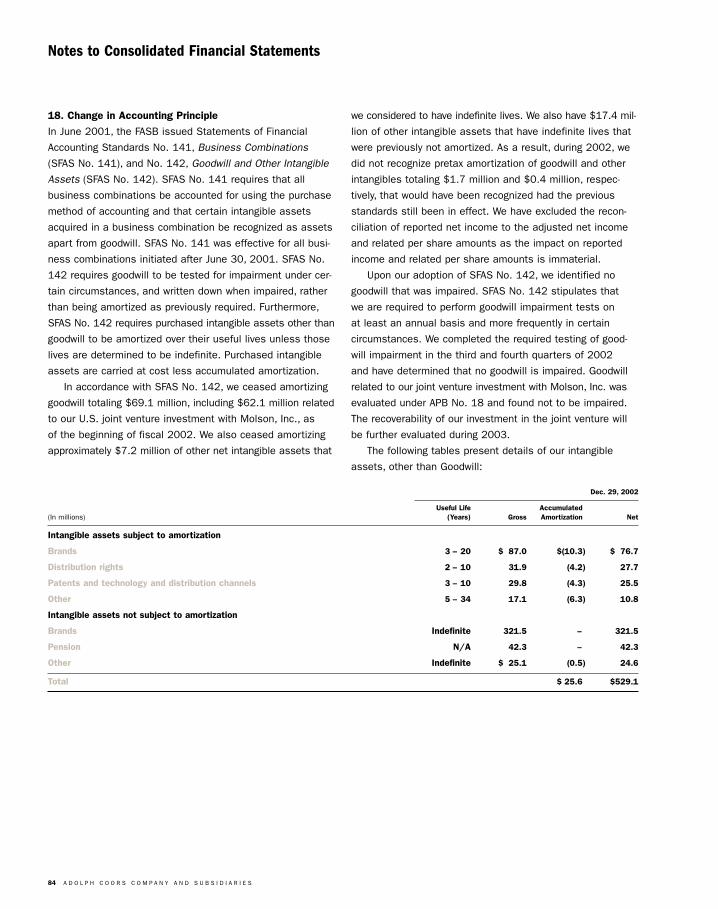
84 A D O L P H C O O R S C O M P A N Y A N D S U B S I D I A R I E S
18. Change in Accounting Principle
In June 2001, the FASB issued Statements of Financial
Accounting Standards No. 141, Business Combinations
(SFAS No. 141), and No. 142, Goodwill and Other Intangible
Assets (SFAS No. 142). SFAS No. 141 requires that all
business combinations be accounted for using the purchase
method of accounting and that certain intangible assets
acquired in a business combination be recognized as assets
apart from goodwill. SFAS No. 141 was effective for all busi-
ness combinations initiated after June 30, 2001. SFAS No.
142 requires goodwill to be tested for impairment under cer-
tain circumstances, and written down when impaired, rather
than being amortized as previously required. Furthermore,
SFAS No. 142 requires purchased intangible assets other than
goodwill to be amortized over their useful lives unless those
lives are determined to be indefinite. Purchased intangible
assets are carried at cost less accumulated amortization.
In accordance with SFAS No. 142, we ceased amortizing
goodwill totaling $69.1 million, including $62.1 million related
to our U.S. joint venture investment with Molson, Inc., as
of the beginning of fiscal 2002. We also ceased amortizing
approximately $7.2 million of other net intangible assets that
we considered to have indefinite lives. We also have $17.4 mil-
lion of other intangible assets that have indefinite lives that
were previously not amortized. As a result, during 2002, we
did not recognize pretax amortization of goodwill and other
intangibles totaling $1.7 million and $0.4 million, respec-
tively, that would have been recognized had the previous
standards still been in effect. We have excluded the recon-
ciliation of reported net income to the adjusted net income
and related per share amounts as the impact on reported
income and related per share amounts is immaterial.
Upon our adoption of SFAS No. 142, we identified no
goodwill that was impaired. SFAS No. 142 stipulates that
we are required to perform goodwill impairment tests on
at least an annual basis and more frequently in certain
circumstances. We completed the required testing of good-
will impairment in the third and fourth quarters of 2002
and have determined that no goodwill is impaired. Goodwill
related to our joint venture investment with Molson, Inc. was
evaluated under APB No. 18 and found not to be impaired.
The recoverability of our investment in the joint venture will
be further evaluated during 2003.
The following tables present details of our intangible
assets, other than Goodwill:
Dec. 29, 2002
Useful Life Accumulated(In millions) (Years) Gross Amortization Net
Intangible assets subject to amortization
Brands 3«–«20 $÷87.0 $(10.3) $÷76.7
Distribution rights 2«–«10 31.9 (4.2) 27.7
Patents and technology and distribution channels 3«–«10 29.8 (4.3) 25.5
Other 5«–«34 17.1 (6.3) 10.8
Intangible assets not subject to amortization
Brands Indefinite 321.5 – 321.5
Pension N/A 42.3 – 42.3
Other Indefinite $÷25.1 (0.5) 24.6
Total $«25.6 $529.1
Notes to Consolidated Financial Statements
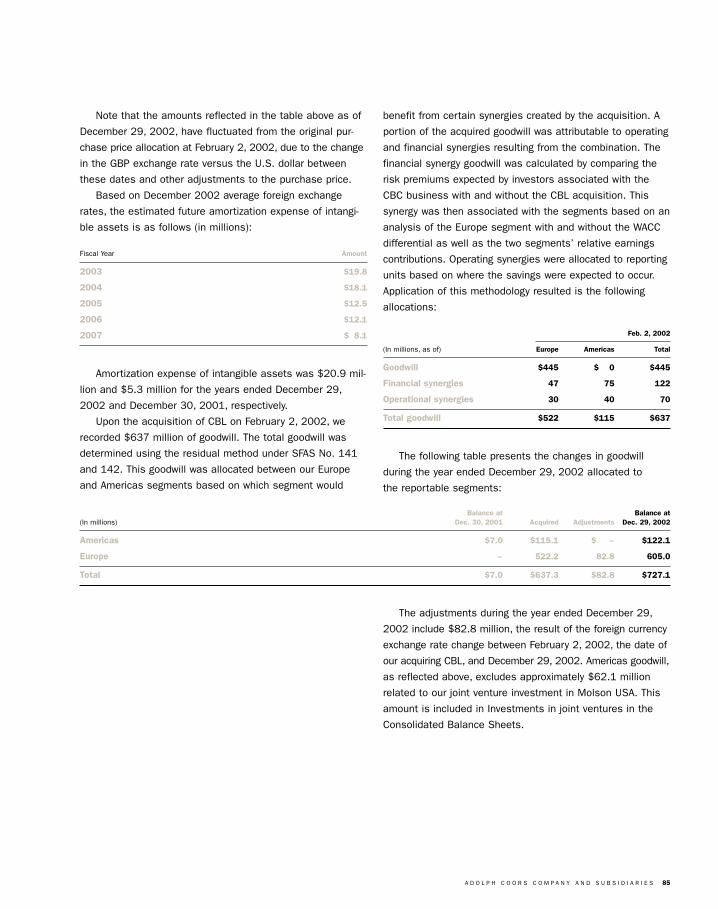
A D O L P H C O O R S C O M P A N Y A N D S U B S I D I A R I E S 85
Note that the amounts reflected in the table above as of
December 29, 2002, have fluctuated from the original pur-
chase price allocation at February 2, 2002, due to the change
in the GBP exchange rate versus the U.S. dollar between
these dates and other adjustments to the purchase price.
Based on December 2002 average foreign exchange
rates, the estimated future amortization expense of intangi-
ble assets is as follows (in millions):
Fiscal Year Amount
2003 $19.8
2004 $18.1
2005 $12.5
2006 $12.1
2007 $÷8.1
Amortization expense of intangible assets was $20.9 mil-
lion and $5.3 million for the years ended December 29,
2002 and December 30, 2001, respectively.
Upon the acquisition of CBL on February 2, 2002, we
recorded $637 million of goodwill. The total goodwill was
determined using the residual method under SFAS No. 141
and 142. This goodwill was allocated between our Europe
and Americas segments based on which segment would
benefit from certain synergies created by the acquisition. A
portion of the acquired goodwill was attributable to operating
and financial synergies resulting from the combination. The
financial synergy goodwill was calculated by comparing the
risk premiums expected by investors associated with the
CBC business with and without the CBL acquisition. This
synergy was then associated with the segments based on an
analysis of the Europe segment with and without the WACC
differential as well as the two segments’ relative earnings
contributions. Operating synergies were allocated to reporting
units based on where the savings were expected to occur.
Application of this methodology resulted is the following
allocations:
Feb. 2, 2002
(In millions, as of) Europe Americas Total
Goodwill $445 $÷÷0 $445
Financial synergies 47 75 122
Operational synergies 30 40 70
Total goodwill $522 $115 $637
The following table presents the changes in goodwill
during the year ended December 29, 2002 allocated to
the reportable segments:
Balance at Balance at (In millions) Dec. 30, 2001 Acquired Adjustments Dec. 29, 2002
Americas $7.0 $115.1 $÷÷«– $122.1
Europe – 522.2 82.8 605.0
Total $7.0 $637.3 $82.8 $727.1
The adjustments during the year ended December 29,
2002 include $82.8 million, the result of the foreign currency
exchange rate change between February 2, 2002, the date of
our acquiring CBL, and December 29, 2002. Americas goodwill,
as reflected above, excludes approximately $62.1 million
related to our joint venture investment in Molson USA. This
amount is included in Investments in joint ventures in the
Consolidated Balance Sheets.
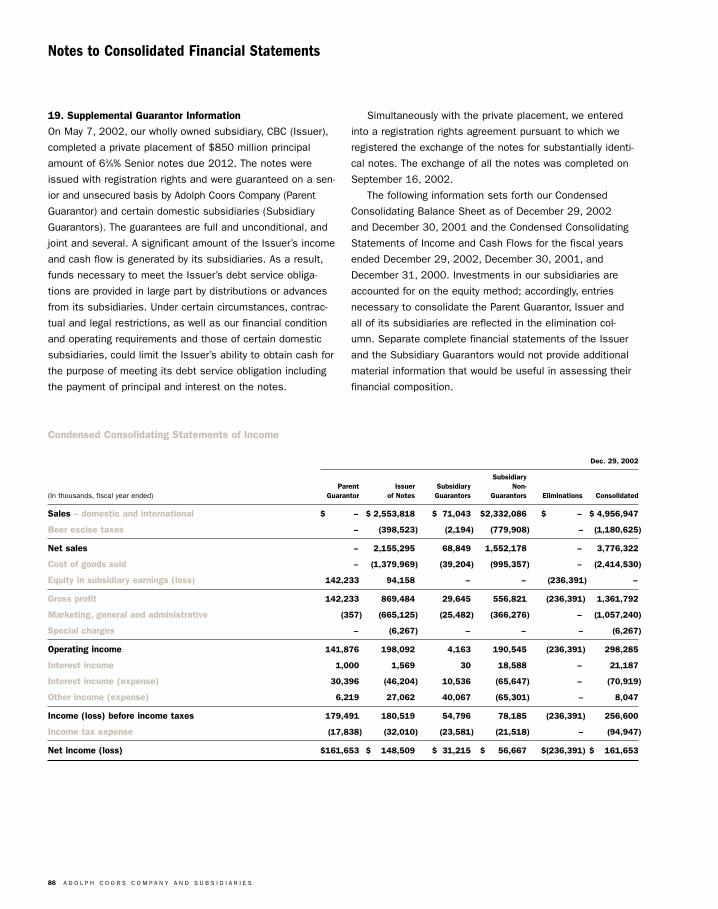
86 A D O L P H C O O R S C O M P A N Y A N D S U B S I D I A R I E S
Notes to Consolidated Financial Statements
19. Supplemental Guarantor Information
On May 7, 2002, our wholly owned subsidiary, CBC (Issuer),
completed a private placement of $850 million principal
amount of 63⁄8% Senior notes due 2012. The notes were
issued with registration rights and were guaranteed on a sen-
ior and unsecured basis by Adolph Coors Company (Parent
Guarantor) and certain domestic subsidiaries (Subsidiary
Guarantors). The guarantees are full and unconditional, and
joint and several. A significant amount of the Issuer’s income
and cash flow is generated by its subsidiaries. As a result,
funds necessary to meet the Issuer’s debt service obliga-
tions are provided in large part by distributions or advances
from its subsidiaries. Under certain circumstances, contrac-
tual and legal restrictions, as well as our financial condition
and operating requirements and those of certain domestic
subsidiaries, could limit the Issuer’s ability to obtain cash for
the purpose of meeting its debt service obligation including
the payment of principal and interest on the notes.
Simultaneously with the private placement, we entered
into a registration rights agreement pursuant to which we
registered the exchange of the notes for substantially identi-
cal notes. The exchange of all the notes was completed on
September 16, 2002.
The following information sets forth our Condensed
Consolidating Balance Sheet as of December 29, 2002
and December 30, 2001 and the Condensed Consolidating
Statements of Income and Cash Flows for the fiscal years
ended December 29, 2002, December 30, 2001, and
December 31, 2000. Investments in our subsidiaries are
accounted for on the equity method; accordingly, entries
necessary to consolidate the Parent Guarantor, Issuer and
all of its subsidiaries are reflected in the elimination col-
umn. Separate complete financial statements of the Issuer
and the Subsidiary Guarantors would not provide additional
material information that would be useful in assessing their
financial composition.
Condensed Consolidating Statements of Income
Dec. 29, 2002
SubsidiaryParent Issuer Subsidiary Non-
(In thousands, fiscal year ended) Guarantor of Notes Guarantors Guarantors Eliminations Consolidated
Sales – domestic and international $÷÷÷÷÷«– $«2,553,818 $÷71,043 $2,332,086 $÷÷÷÷÷÷– $«4,956,947
Beer excise taxes – (398,523) (2,194) (779,908) – (1,180,625)
Net sales – 2,155,295 68,849 1,552,178 – 3,776,322
Cost of goods sold – (1,379,969) (39,204) (995,357) – (2,414,530)
Equity in subsidiary earnings (loss) 142,233 94,158 – – (236,391) –
Gross profit 142,233 869,484 29,645 556,821 (236,391) 1,361,792
Marketing, general and administrative (357) (665,125) (25,482) (366,276) – (1,057,240)
Special charges – (6,267) – – – (6,267)
Operating income 141,876 198,092 4,163 190,545 (236,391) 298,285
Interest income 1,000 1,569 30 18,588 – 21,187
Interest income (expense) 30,396 (46,204) 10,536 (65,647) – (70,919)
Other income (expense) 6,219 27,062 40,067 (65,301) – 8,047
Income (loss) before income taxes 179,491 180,519 54,796 78,185 (236,391) 256,600
Income tax expense (17,838) (32,010) (23,581) (21,518) – (94,947)
Net income (loss) $161,653 $÷÷148,509 $÷31,215 $÷÷«56,667 $(236,391) $÷÷161,653
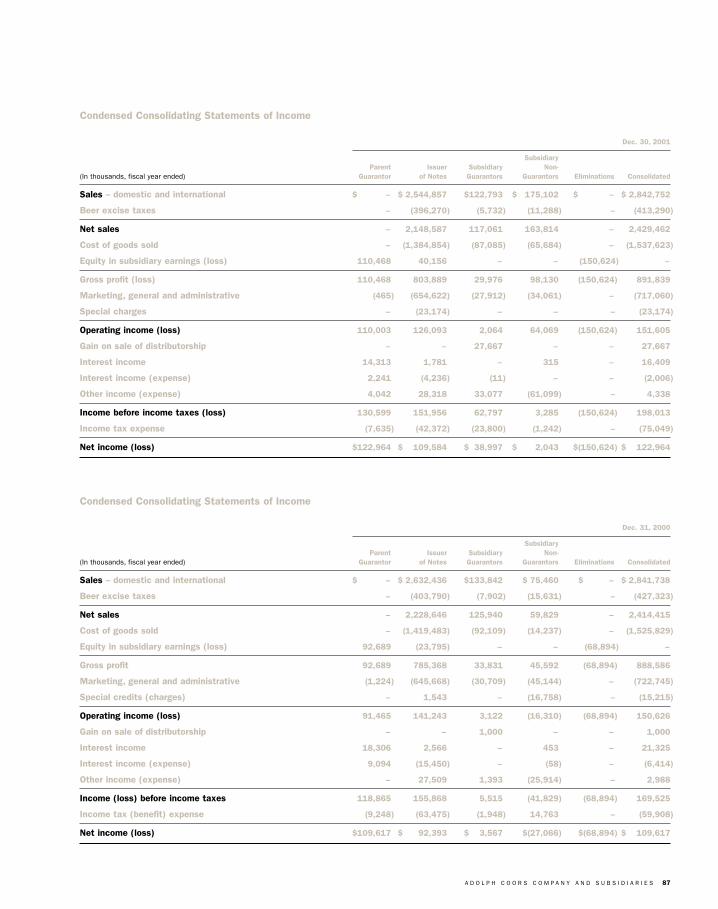
A D O L P H C O O R S C O M P A N Y A N D S U B S I D I A R I E S 87
Condensed Consolidating Statements of Income
Dec. 30, 2001
SubsidiaryParent Issuer Subsidiary Non-
(In thousands, fiscal year ended) Guarantor of Notes Guarantors Guarantors Eliminations Consolidated
Sales – domestic and international $÷÷÷÷÷«– $«2,544,857 $122,793 $÷«175,102 $÷÷÷÷÷÷– $«2,842,752
Beer excise taxes – (396,270) (5,732) (11,288) – (413,290)
Net sales – 2,148,587 117,061 163,814 – 2,429,462
Cost of goods sold – (1,384,854) (87,085) (65,684) – (1,537,623)
Equity in subsidiary earnings (loss) 110,468 40,156 – – (150,624) –
Gross profit (loss) 110,468 803,889 29,976 98,130 (150,624) 891,839
Marketing, general and administrative (465) (654,622) (27,912) (34,061) – (717,060)
Special charges – (23,174) – – – (23,174)
Operating income (loss) 110,003 126,093 2,064 64,069 (150,624) 151,605
Gain on sale of distributorship – – 27,667 – – 27,667
Interest income 14,313 1,781 – 315 – 16,409
Interest income (expense) 2,241 (4,236) (11) – – (2,006)
Other income (expense) 4,042 28,318 33,077 (61,099) – 4,338
Income before income taxes (loss) 130,599 151,956 62,797 3,285 (150,624) 198,013
Income tax expense (7,635) (42,372) (23,800) (1,242) – (75,049)
Net income (loss) $122,964 $÷÷109,584 $÷38,997 $÷÷÷«2,043 $(150,624) $÷÷122,964
Condensed Consolidating Statements of Income
Dec. 31, 2000
SubsidiaryParent Issuer Subsidiary Non-
(In thousands, fiscal year ended) Guarantor of Notes Guarantors Guarantors Eliminations Consolidated
Sales – domestic and international $÷÷÷÷÷«– $«2,632,436 $133,842 $«75,460 $÷÷÷÷÷– $«2,841,738
Beer excise taxes – (403,790) (7,902) (15,631) – (427,323)
Net sales – 2,228,646 125,940 59,829 – 2,414,415
Cost of goods sold – (1,419,483) (92,109) (14,237) – (1,525,829)
Equity in subsidiary earnings (loss) 92,689 (23,795) – – (68,894) –
Gross profit 92,689 785,368 33,831 45,592 (68,894) 888,586
Marketing, general and administrative (1,224) (645,668) (30,709) (45,144) – (722,745)
Special credits (charges) – 1,543 – (16,758) – (15,215)
Operating income (loss) 91,465 141,243 3,122 (16,310) (68,894) 150,626
Gain on sale of distributorship – – 1,000 – – 1,000
Interest income 18,306 2,566 – 453 – 21,325
Interest income (expense) 9,094 (15,450) – (58) – (6,414)
Other income (expense) – 27,509 1,393 (25,914) – 2,988
Income (loss) before income taxes 118,865 155,868 5,515 (41,829) (68,894) 169,525
Income tax (benefit) expense (9,248) (63,475) (1,948) 14,763 – (59,908)
Net income (loss) $109,617 $÷÷÷92,393 $÷÷3,567 $(27,066) $(68,894) $÷÷109,617
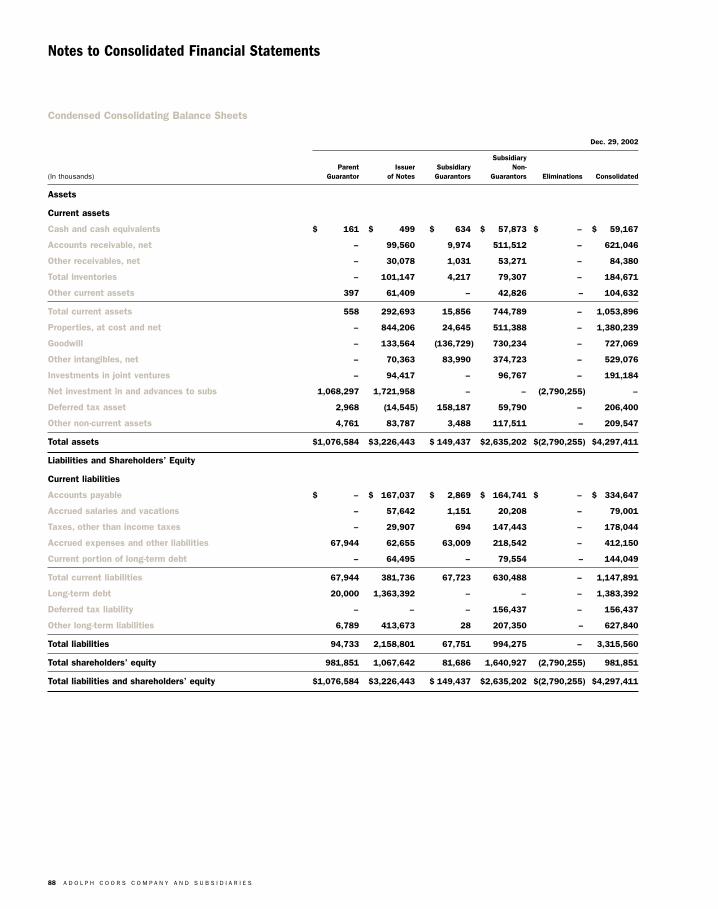
88 A D O L P H C O O R S C O M P A N Y A N D S U B S I D I A R I E S
Notes to Consolidated Financial Statements
Condensed Consolidating Balance Sheets
Dec. 29, 2002
SubsidiaryParent Issuer Subsidiary Non-
(In thousands) Guarantor of Notes Guarantors Guarantors Eliminations Consolidated
Assets
Current assets
Cash and cash equivalents $÷÷÷÷÷161 $÷÷÷÷÷499 $÷÷÷÷634 $÷÷«57,873 $÷÷÷÷÷÷÷«– $÷÷«59,167
Accounts receivable, net – 99,560 9,974 511,512 – 621,046
Other receivables, net – 30,078 1,031 53,271 – 84,380
Total inventories – 101,147 4,217 79,307 – 184,671
Other current assets 397 61,409 – 42,826 – 104,632
Total current assets 558 292,693 15,856 744,789 – 1,053,896
Properties, at cost and net – 844,206 24,645 511,388 – 1,380,239
Goodwill – 133,564 (136,729) 730,234 – 727,069
Other intangibles, net – 70,363 83,990 374,723 – 529,076
Investments in joint ventures – 94,417 – 96,767 – 191,184
Net investment in and advances to subs 1,068,297 1,721,958 – – (2,790,255) –
Deferred tax asset 2,968 (14,545) 158,187 59,790 – 206,400
Other non-current assets 4,761 83,787 3,488 117,511 – 209,547
Total assets $1,076,584 $3,226,443 $«149,437 $2,635,202 $(2,790,255) $4,297,411
Liabilities and Shareholders’ Equity
Current liabilities
Accounts payable $÷÷÷÷÷÷÷– $÷«167,037 $÷÷«2,869 $÷«164,741 $÷÷÷÷÷÷÷«– $÷«334,647
Accrued salaries and vacations – 57,642 1,151 20,208 – 79,001
Taxes, other than income taxes – 29,907 694 147,443 – 178,044
Accrued expenses and other liabilities 67,944 62,655 63,009 218,542 – 412,150
Current portion of long-term debt – 64,495 – 79,554 – 144,049
Total current liabilities 67,944 381,736 67,723 630,488 – 1,147,891
Long-term debt 20,000 1,363,392 – – – 1,383,392
Deferred tax liability – – – 156,437 – 156,437
Other long-term liabilities 6,789 413,673 28 207,350 – 627,840
Total liabilities 94,733 2,158,801 67,751 994,275 – 3,315,560
Total shareholders’ equity 981,851 1,067,642 81,686 1,640,927 (2,790,255) 981,851
Total liabilities and shareholders’ equity $1,076,584 $3,226,443 $«149,437 $2,635,202 $(2,790,255) $4,297,411
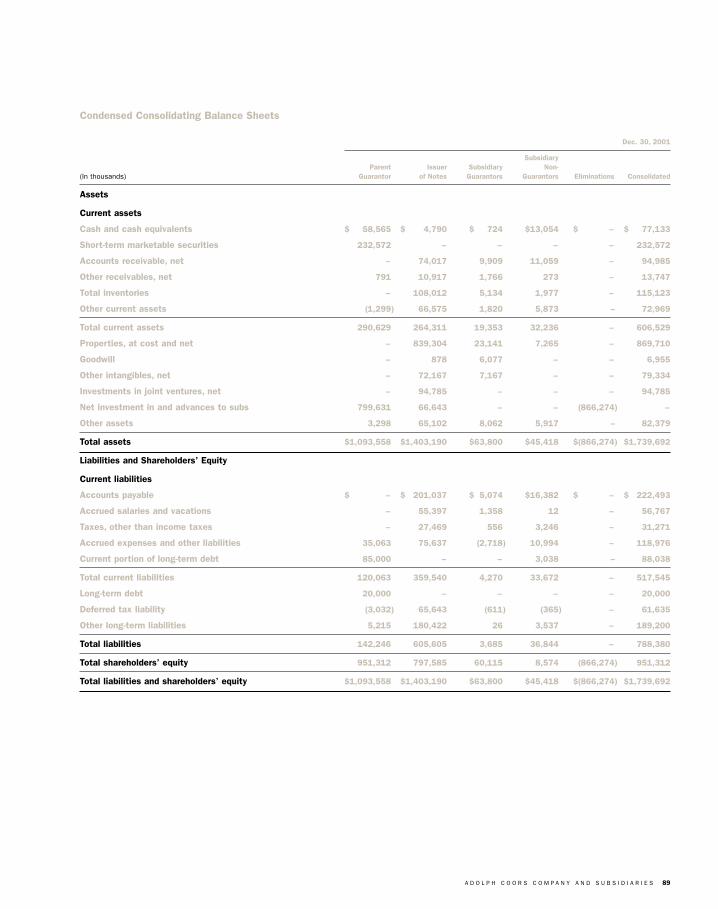
A D O L P H C O O R S C O M P A N Y A N D S U B S I D I A R I E S 89
Condensed Consolidating Balance Sheets
Dec. 30, 2001
SubsidiaryParent Issuer Subsidiary Non-
(In thousands) Guarantor of Notes Guarantors Guarantors Eliminations Consolidated
Assets
Current assets
Cash and cash equivalents $÷÷«58,565 $÷÷÷«4,790 $÷÷«724 $13,054 $÷÷÷÷÷÷– $÷÷«77,133
Short-term marketable securities 232,572 – – – – 232,572
Accounts receivable, net – 74,017 9,909 11,059 – 94,985
Other receivables, net 791 10,917 1,766 273 – 13,747
Total inventories – 108,012 5,134 1,977 – 115,123
Other current assets (1,299) 66,575 1,820 5,873 – 72,969
Total current assets 290,629 264,311 19,353 32,236 – 606,529
Properties, at cost and net – 839,304 23,141 7,265 – 869,710
Goodwill – 878 6,077 – – 6,955
Other intangibles, net – 72,167 7,167 – – 79,334
Investments in joint ventures, net – 94,785 – – – 94,785
Net investment in and advances to subs 799,631 66,643 – – (866,274) –
Other assets 3,298 65,102 8,062 5,917 – 82,379
Total assets $1,093,558 $1,403,190 $63,800 $45,418 $(866,274) $1,739,692
Liabilities and Shareholders’ Equity
Current liabilities
Accounts payable $÷÷÷÷÷÷÷– $÷«201,037 $÷5,074 $16,382 $÷÷÷÷÷÷– $÷«222,493
Accrued salaries and vacations – 55,397 1,358 12 – 56,767
Taxes, other than income taxes – 27,469 556 3,246 – 31,271
Accrued expenses and other liabilities 35,063 75,637 (2,718) 10,994 – 118,976
Current portion of long-term debt 85,000 – – 3,038 – 88,038
Total current liabilities 120,063 359,540 4,270 33,672 – 517,545
Long-term debt 20,000 – – – – 20,000
Deferred tax liability (3,032) 65,643 (611) (365) – 61,635
Other long-term liabilities 5,215 180,422 26 3,537 – 189,200
Total liabilities 142,246 605,605 3,685 36,844 – 788,380
Total shareholders’ equity 951,312 797,585 60,115 8,574 (866,274) 951,312
Total liabilities and shareholders’ equity $1,093,558 $1,403,190 $63,800 $45,418 $(866,274) $1,739,692
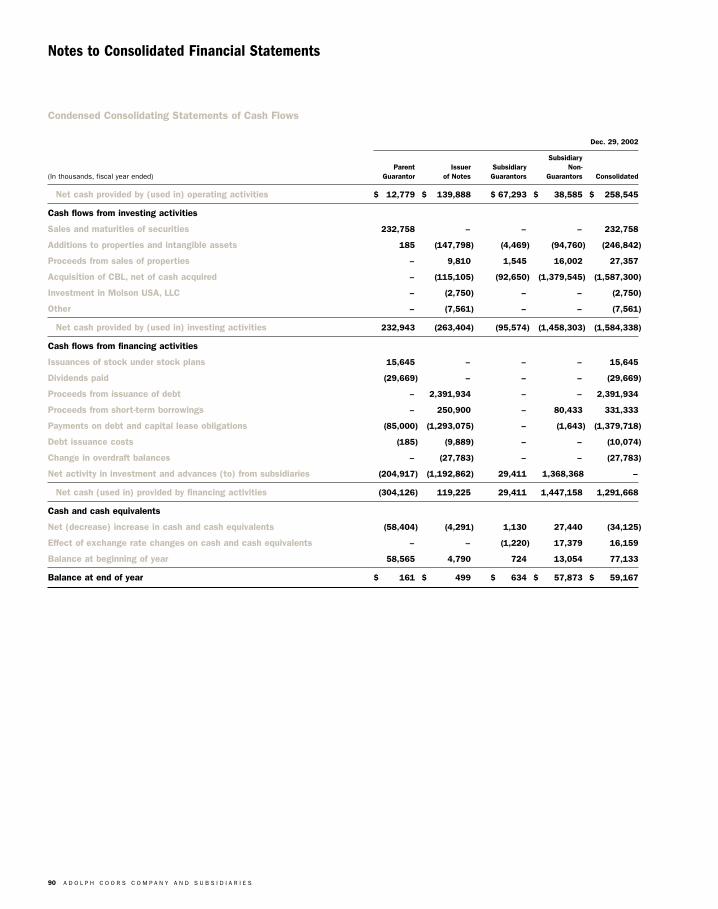
90 A D O L P H C O O R S C O M P A N Y A N D S U B S I D I A R I E S
Notes to Consolidated Financial Statements
Condensed Consolidating Statements of Cash Flows
Dec. 29, 2002
SubsidiaryParent Issuer Subsidiary Non-
(In thousands, fiscal year ended) Guarantor of Notes Guarantors Guarantors Consolidated
Net cash provided by (used in) operating activities $÷«12,779 $÷÷139,888 $«67,293 $÷÷÷38,585 $÷÷258,545
Cash flows from investing activities
Sales and maturities of securities 232,758 – – – 232,758
Additions to properties and intangible assets 185 (147,798) (4,469) (94,760) (246,842)
Proceeds from sales of properties – 9,810 1,545 16,002 27,357
Acquisition of CBL, net of cash acquired – (115,105) (92,650) (1,379,545) (1,587,300)
Investment in Molson USA, LLC – (2,750) – – (2,750)
Other – (7,561) – – (7,561)
Net cash provided by (used in) investing activities 232,943 (263,404) (95,574) (1,458,303) (1,584,338)
Cash flows from financing activities
Issuances of stock under stock plans 15,645 – – – 15,645
Dividends paid (29,669) – – – (29,669)
Proceeds from issuance of debt – 2,391,934 – – 2,391,934
Proceeds from short-term borrowings – 250,900 – 80,433 331,333
Payments on debt and capital lease obligations (85,000) (1,293,075) – (1,643) (1,379,718)
Debt issuance costs (185) (9,889) – – (10,074)
Change in overdraft balances – (27,783) – – (27,783)
Net activity in investment and advances (to) from subsidiaries (204,917) (1,192,862) 29,411 1,368,368 –
Net cash (used in) provided by financing activities (304,126) 119,225 29,411 1,447,158 1,291,668
Cash and cash equivalents
Net (decrease) increase in cash and cash equivalents (58,404) (4,291) 1,130 27,440 (34,125)
Effect of exchange rate changes on cash and cash equivalents – – (1,220) 17,379 16,159
Balance at beginning of year 58,565 4,790 724 13,054 77,133
Balance at end of year $÷÷÷÷161 $÷÷÷÷÷«499 $÷÷÷634 $÷÷÷57,873 $÷÷÷59,167
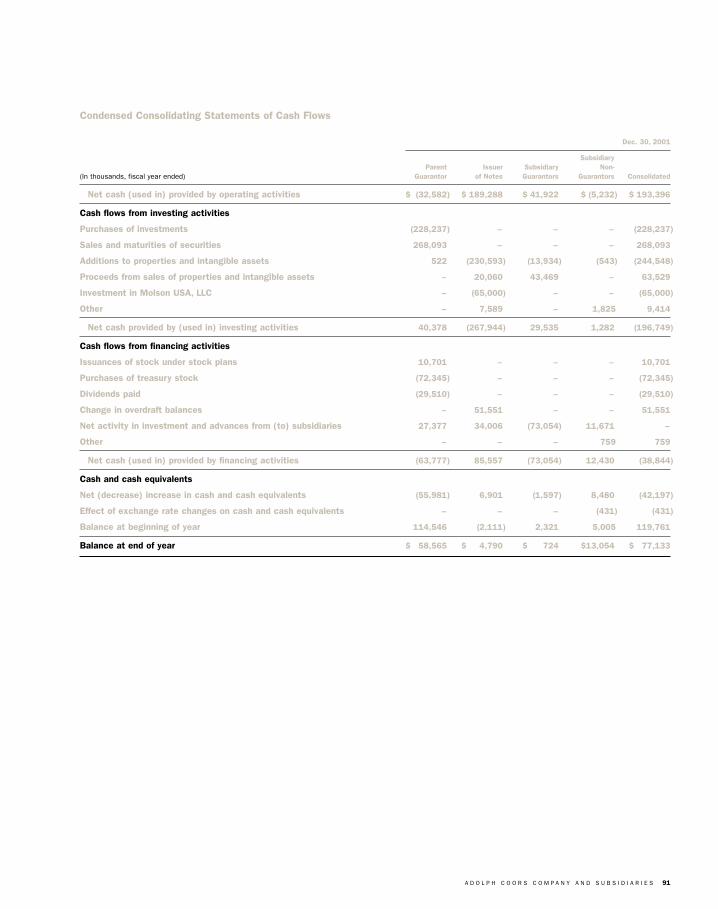
A D O L P H C O O R S C O M P A N Y A N D S U B S I D I A R I E S 91
Condensed Consolidating Statements of Cash Flows
Dec. 30, 2001
SubsidiaryParent Issuer Subsidiary Non-
(In thousands, fiscal year ended) Guarantor of Notes Guarantors Guarantors Consolidated
Net cash (used in) provided by operating activities $÷(32,582) $«189,288 $«41,922 $«(5,232) $«193,396
Cash flows from investing activities
Purchases of investments (228,237) – – – (228,237)
Sales and maturities of securities 268,093 – – – 268,093
Additions to properties and intangible assets 522 (230,593) (13,934) (543) (244,548)
Proceeds from sales of properties and intangible assets – 20,060 43,469 – 63,529
Investment in Molson USA, LLC – (65,000) – – (65,000)
Other – 7,589 – 1,825 9,414
Net cash provided by (used in) investing activities 40,378 (267,944) 29,535 1,282 (196,749)
Cash flows from financing activities
Issuances of stock under stock plans 10,701 – – – 10,701
Purchases of treasury stock (72,345) – – – (72,345)
Dividends paid (29,510) – – – (29,510)
Change in overdraft balances – 51,551 – – 51,551
Net activity in investment and advances from (to) subsidiaries 27,377 34,006 (73,054) 11,671 –
Other – – – 759 759
Net cash (used in) provided by financing activities (63,777) 85,557 (73,054) 12,430 (38,844)
Cash and cash equivalents
Net (decrease) increase in cash and cash equivalents (55,981) 6,901 (1,597) 8,480 (42,197)
Effect of exchange rate changes on cash and cash equivalents – – – (431) (431)
Balance at beginning of year 114,546 (2,111) 2,321 5,005 119,761
Balance at end of year $÷«58,565 $÷÷«4,790 $÷÷÷724 $13,054 $÷«77,133
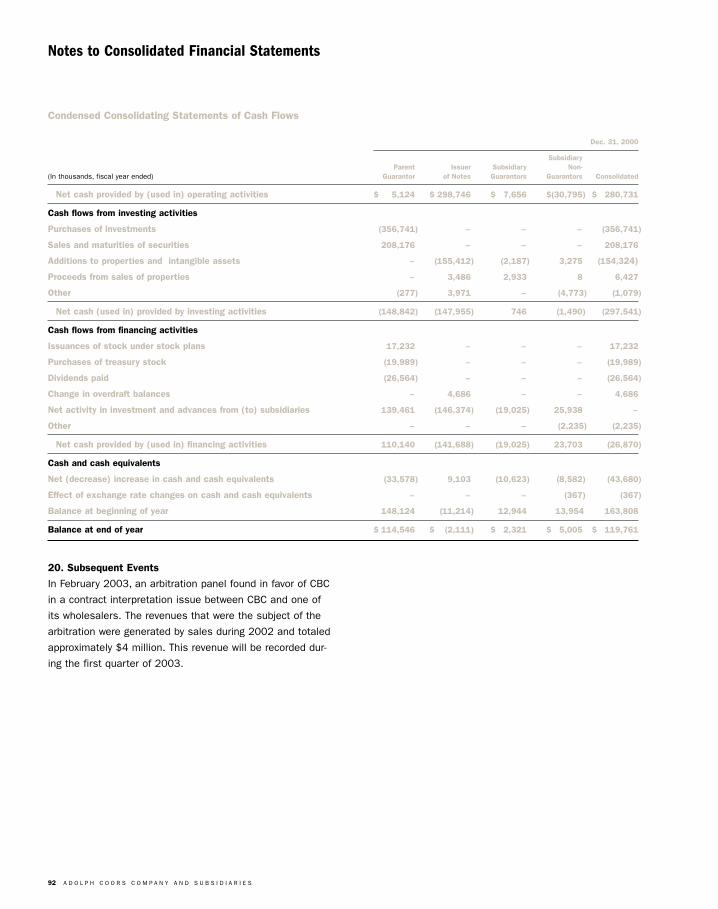
92 A D O L P H C O O R S C O M P A N Y A N D S U B S I D I A R I E S
Notes to Consolidated Financial Statements
Condensed Consolidating Statements of Cash Flows
Dec. 31, 2000
SubsidiaryParent Issuer Subsidiary Non-
(In thousands, fiscal year ended) Guarantor of Notes Guarantors Guarantors Consolidated
Net cash provided by (used in) operating activities $÷÷«5,124 $«298,746 $÷«7,656 $(30,795) $÷«280,731
Cash flows from investing activities
Purchases of investments (356,741) – – – (356,741)
Sales and maturities of securities 208,176 – – – 208,176
Additions to properties and intangible assets – (155,412) (2,187) 3,275 (154,324)
Proceeds from sales of properties – 3,486 2,933 8 6,427
Other (277) 3,971 – (4,773) (1,079)
Net cash (used in) provided by investing activities (148,842) (147,955) 746 (1,490) (297,541)
Cash flows from financing activities
Issuances of stock under stock plans 17,232 – – – 17,232
Purchases of treasury stock (19,989) – – – (19,989)
Dividends paid (26,564) – – – (26,564)
Change in overdraft balances – 4,686 – – 4,686
Net activity in investment and advances from (to) subsidiaries 139,461 (146,374) (19,025) 25,938 –
Other – – – (2,235) (2,235)
Net cash provided by (used in) financing activities 110,140 (141,688) (19,025) 23,703 (26,870)
Cash and cash equivalents
Net (decrease) increase in cash and cash equivalents (33,578) 9,103 (10,623) (8,582) (43,680)
Effect of exchange rate changes on cash and cash equivalents – – – (367) (367)
Balance at beginning of year 148,124 (11,214) 12,944 13,954 163,808
Balance at end of year $«114,546 $÷÷(2,111) $÷«2,321 $÷«5,005 $÷«119,761
20. Subsequent Events
In February 2003, an arbitration panel found in favor of CBC
in a contract interpretation issue between CBC and one of
its wholesalers. The revenues that were the subject of the
arbitration were generated by sales during 2002 and totaled
approximately $4 million. This revenue will be recorded dur-
ing the first quarter of 2003.
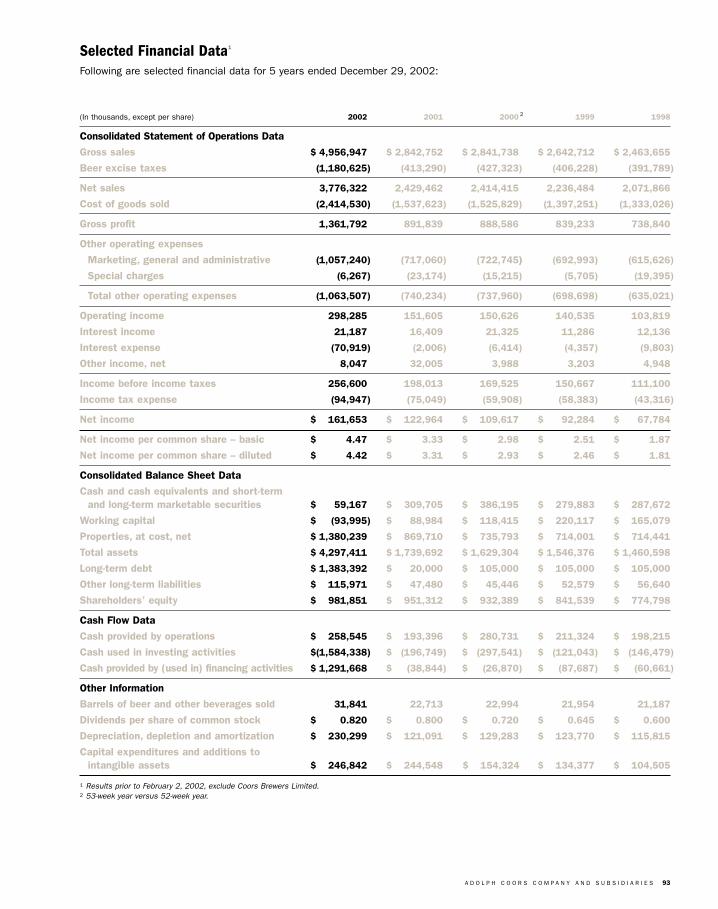
A D O L P H C O O R S C O M P A N Y A N D S U B S I D I A R I E S 93
Selected Financial Data1
Following are selected financial data for 5 years ended December 29, 2002:
(In thousands, except per share) 2002 2001 2000 2 1999 1998
Consolidated Statement of Operations Data
Gross sales $«4,956,947 $«2,842,752 $«2,841,738 $«2,642,712 $«2,463,655
Beer excise taxes (1,180,625) (413,290) (427,323) (406,228) (391,789)
Net sales 3,776,322 2,429,462 2,414,415 2,236,484 2,071,866
Cost of goods sold (2,414,530) (1,537,623) (1,525,829) (1,397,251) (1,333,026)
Gross profit 1,361,792 891,839 888,586 839,233 738,840
Other operating expenses
Marketing, general and administrative (1,057,240) (717,060) (722,745)) (692,993) (615,626)
Special charges (6,267) (23,174) (15,215) (5,705) (19,395)
Total other operating expenses (1,063,507) (740,234) (737,960) (698,698) (635,021)
Operating income 298,285 151,605 150,626 140,535 103,819
Interest income 21,187 16,409 21,325 11,286 12,136
Interest expense (70,919) (2,006) (6,414) (4,357) (9,803)
Other income, net 8,047 32,005 3,988 3,203 4,948
Income before income taxes 256,600 198,013 169,525 150,667 111,100
Income tax expense (94,947) (75,049) (59,908) (58,383) (43,316)
Net income $÷÷161,653 $÷÷122,964 $÷÷109,617 $÷÷÷92,284 $÷÷÷67,784
Net income per common share – basic $÷÷÷÷÷4.47 $÷÷÷÷÷3.33 $÷÷÷÷÷2.98 $÷÷÷÷÷2.51 $÷÷÷÷÷1.87
Net income per common share – diluted $÷÷÷÷÷4.42 $÷÷÷÷÷3.31 $÷÷÷÷÷2.93 $÷÷÷÷÷2.46 $÷÷÷÷÷1.81
Consolidated Balance Sheet Data
Cash and cash equivalents and short-term and long-term marketable securities $÷÷÷59,167 $÷÷309,705 $÷÷386,195 $÷÷279,883 $÷÷287,672
Working capital $÷÷«(93,995) $÷÷««88,984 $÷÷118,415 $÷÷220,117 $÷÷165,079
Properties, at cost, net $«1,380,239 $÷÷869,710 $÷÷735,793 $÷÷714,001 $÷÷714,441
Total assets $«4,297,411 $«1,739,692 $«1,629,304 $«1,546,376 $«1,460,598
Long-term debt $«1,383,392 $÷÷««20,000 $÷÷105,000 $÷÷105,000 $÷÷105,000
Other long-term liabilities $÷÷115,971 $÷÷÷47,480 $÷÷÷45,446 $÷÷÷52,579 $÷÷÷56,640
Shareholders’ equity $÷÷981,851 $÷÷951,312 $««««932,389 ÷÷$÷÷841,539 $÷÷774,798
Cash Flow Data
Cash provided by operations $÷÷258,545 $÷÷193,396 $÷÷280,731 $÷÷211,324 $÷÷198,215
Cash used in investing activities $(1,584,338) $÷«(196,749) $÷«(297,541) $÷«(121,043) $÷«(146,479)
Cash provided by (used in) financing activities $«1,291,668 $÷÷«(38,844) $÷÷«(26,870) $÷÷«(87,687) $÷÷«(60,661)
Other Information
Barrels of beer and other beverages sold 31,841 22,713 22,994 21,954 21,187
Dividends per share of common stock $÷÷÷÷0.820 $÷÷÷÷0.800 $÷÷÷÷0.720 $÷÷÷÷0.645 $÷÷÷÷0.600
Depreciation, depletion and amortization $÷÷230,299 $÷÷121,091 $÷÷129,283 $÷÷123,770 $÷÷115,815
Capital expenditures and additions tointangible assets $÷÷246,842 $÷÷244,548 $÷÷154,324 $÷÷134,377 $÷÷104,505
1 Results prior to February 2, 2002, exclude Coors Brewers Limited.2 53-week year versus 52-week year.
94 A D O L P H C O O R S C O M P A N Y A N D S U B S I D I A R I E S
Adolph Coors Company andCoors Brewing CompanyPeter H. CoorsChairman of the Board,Adolph Coors Company and Coors Brewing Company.Director since 1973.
William K. CoorsVice Chairman of the Board,Adolph Coors Company. Director since 1940.
W. Leo Kiely IIIPresident and Chief Executive Officer,Adolph Coors Company and Coors Brewing Company.Director since 1998.
Charles M. HeringtonPresident and Chief Executive Officer,America Online Latin America.Director since 2003.
Franklin W. “Fritz” HobbsSenior Advisor,Houlihan Lokey Howard & Zukin.Director since 2001.
Pamela H. PatsleyPresident,First Data International.Director since 1996.
Wayne R. SandersRetired Chairman and Chief Executive Officer,Kimberly-Clark Corporation.Director since 1995.
Dr. Albert C. YatesPresident,Colorado State University.Director since 1998.
Boards of Directors Officers
Coors Brewing CompanyPeter H. CoorsChairman of the Board
William K. CoorsChairman,Executive Committee
W. Leo Kiely IIIPresident and Chief Executive Officer
Ronald G. AskewSenior Vice President andChief Marketing Officer
David G. BarnesVice President, Finance
Carl L. BarnhillSenior Vice President, Sales
Michael J. GannonVice President and Treasurer
Peter M.R. KendallSenior Vice President,United Kingdom and Europe,Chief Executive Officer,Coors Brewers Limited
Robert D. KlugmanSenior Vice President,Corporate Development, andChief International Officer
Annita M. MenoganSecretary
Robert M. ReeseSenior Vice President and Chief Legal Officer
Mara E. SwanSenior Vice President andChief People Officer
Ronald A. TryggestadVice President and Controller
Timothy V. WolfSenior Vice President and Chief Financial Officer
Adolph Coors CompanyPeter H. CoorsChairman of the Board
William K. CoorsVice Chairman of the Board, Chairman,Executive Committee
W. Leo Kiely IIIPresident and Chief Executive Officer
David G. BarnesVice President, Finance
Michael J. GannonVice President and Treasurer
Peter M.R. KendallVice President,United Kingdom and Europe
Robert D. KlugmanVice President, International
Annita M. MenoganSecretary
Robert M. ReeseVice President and Chief Legal Officer
Ronald A. TryggestadController
Timothy V. WolfVice President and Chief Financial Officer
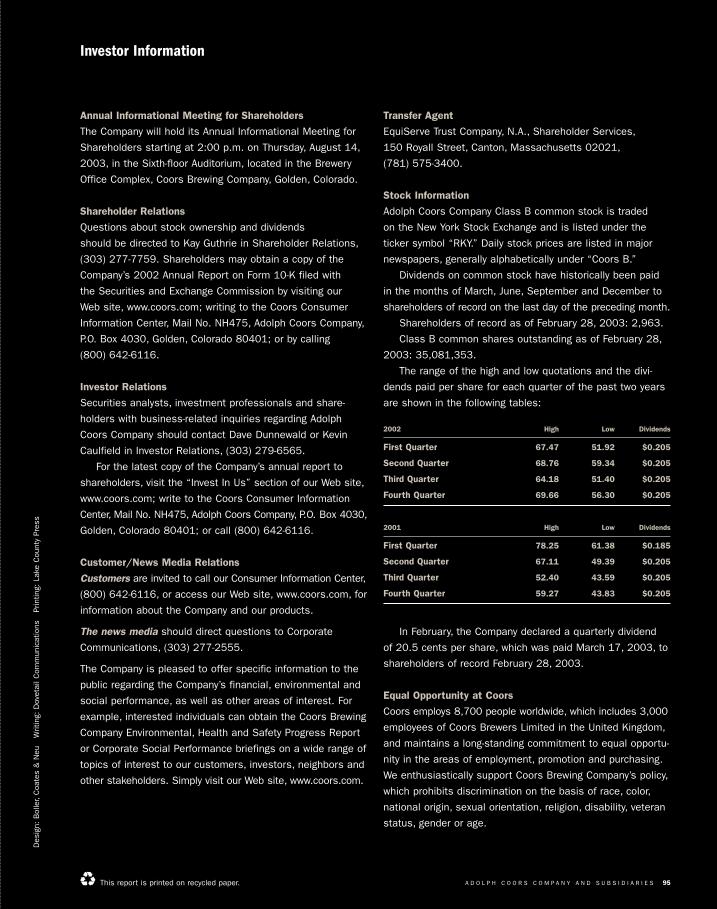
It’s like a long climb up a tall anddifficult mountain. It’s exhilarating,but it’s hard work that requiresabsolute focus.
The climb accelerated as we trans-formed Coors in several importantways in 2002. Our acquisition ofone of the U.K.’s largest beer busi-nesses dramatically increased our scale, breadth and potential.A completely new U.S. advertisingapproach launched a renewed driveto strengthen Coors Light and otherbrands. And throughout the organ-ization, we made dramatic strides in productivity improvement andcost reduction.
Even with our transformation, westill have a long way to go in ourclimb to be the best. But look how far we’ve come, just in 2002.
To be the BESTin the beer business.
A D O L P H C O O R S C O M P A N Y A N D S U B S I D I A R I E S 95
Investor Information
Annual Informational Meeting for Shareholders
The Company will hold its Annual Informational Meeting for
Shareholders starting at 2:00 p.m. on Thursday, August 14,
2003, in the Sixth-floor Auditorium, located in the Brewery
Office Complex, Coors Brewing Company, Golden, Colorado.
Shareholder Relations
Questions about stock ownership and dividends
should be directed to Kay Guthrie in Shareholder Relations,
(303) 277-7759. Shareholders may obtain a copy of the
Company’s 2002 Annual Report on Form 10-K filed with
the Securities and Exchange Commission by visiting our
Web site, www.coors.com; writing to the Coors Consumer
Information Center, Mail No. NH475, Adolph Coors Company,
P.O. Box 4030, Golden, Colorado 80401; or by calling
(800) 642-6116.
Investor Relations
Securities analysts, investment professionals and share-
holders with business-related inquiries regarding Adolph
Coors Company should contact Dave Dunnewald or Kevin
Caulfield in Investor Relations, (303) 279-6565.
For the latest copy of the Company’s annual report to
shareholders, visit the “Invest In Us” section of our Web site,
www.coors.com; write to the Coors Consumer Information
Center, Mail No. NH475, Adolph Coors Company, P.O. Box 4030,
Golden, Colorado 80401; or call (800) 642-6116.
Customer/News Media Relations
Customers are invited to call our Consumer Information Center,
(800) 642-6116, or access our Web site, www.coors.com, for
information about the Company and our products.
The news media should direct questions to Corporate
Communications, (303) 277-2555.
The Company is pleased to offer specific information to the
public regarding the Company’s financial, environmental and
social performance, as well as other areas of interest. For
example, interested individuals can obtain the Coors Brewing
Company Environmental, Health and Safety Progress Report
or Corporate Social Performance briefings on a wide range of
topics of interest to our customers, investors, neighbors and
other stakeholders. Simply visit our Web site, www.coors.com.
Transfer Agent
EquiServe Trust Company, N.A., Shareholder Services,
150 Royall Street, Canton, Massachusetts 02021,
(781) 575-3400.
Stock Information
Adolph Coors Company Class B common stock is traded
on the New York Stock Exchange and is listed under the
ticker symbol “RKY.” Daily stock prices are listed in major
newspapers, generally alphabetically under “Coors B.”
Dividends on common stock have historically been paid
in the months of March, June, September and December to
shareholders of record on the last day of the preceding month.
Shareholders of record as of February 28, 2003: 2,963.
Class B common shares outstanding as of February 28,
2003: 35,081,353.
The range of the high and low quotations and the divi-
dends paid per share for each quarter of the past two years
are shown in the following tables:
2002 High Low Dividends
First Quarter 67.47 51.92 $0.205
Second Quarter 68.76 59.34 $0.205
Third Quarter 64.18 51.40 $0.205
Fourth Quarter 69.66 56.30 $0.205
2001 High Low Dividends
First Quarter 78.25 61.38 $0.185
Second Quarter 67.11 49.39 $0.205
Third Quarter 52.40 43.59 $0.205
Fourth Quarter 59.27 43.83 $0.205
In February, the Company declared a quarterly dividend
of 20.5 cents per share, which was paid March 17, 2003, to
shareholders of record February 28, 2003.
Equal Opportunity at Coors
Coors employs 8,700 people worldwide, which includes 3,000
employees of Coors Brewers Limited in the United Kingdom,
and maintains a long-standing commitment to equal opportu-
nity in the areas of employment, promotion and purchasing.
We enthusiastically support Coors Brewing Company’s policy,
which prohibits discrimination on the basis of race, color,
national origin, sexual orientation, religion, disability, veteran
status, gender or age.
Des
ign:
Bol
ler,
Coa
tes
& N
eu
Writ
ing:
Dov
etai
l Com
mun
icat
ions
P
rintin
g: L
ake
Cou
nty
Pres
s
This report is printed on recycled paper.

A D O L P H C O O R S C O M P A N Y 1A D O L P H C O O R S C O M P A N Y 1A D O L P H C O O R S C O M P A N Y 1A D O L P H C O O R S C O M P A N Y 1A D O L P H C O O R S C O M P A N Y 1
Adolph Coors Company 2002 Annual Report
To be the
BEST
Adolph Coors CompanyGolden, Colorado 80401
(303) 279-6565www.coors.com
Adolph C
oors Com
pany2002 A
nnual Report