molson coors brewing 200710K
174
21FEB200812074757 UNITED STATES SECURITIES AND EXCHANGE COMMISSION Washington, D.C. 20549 FORM 10-K (Mark One) ፤ ANNUAL REPORT PURSUANT TO SECTION 13 OR 15(d) OF THE SECURITIES EXCHANGE ACT OF 1934 For the Fiscal year ended December 30, 2007 OR អ TRANSITION REPORT PURSUANT TO SECTION 13 OR 15(d) OF THE SECURITIES EXCHANGE ACT OF 1934 For the transition period from to . Commission File Number: 1-14829 Molson Coors Brewing Company (Exact name of registrant as specified in its charter) DELAWARE 84-0178360 (State or other jurisdiction of (I.R.S. Employer incorporation or organization) Identification No.) 1225 17 th Street, Denver, Colorado 80202 1555 Notre Dame Street East, Montr´ eal, Qu´ ebec, Canada H2L 2R5 (Address of principal executive offices) (Zip Code) 303-279-6565 (Colorado) 514-521-1786 (Qu´ ebec) (Registrant’s telephone number, including area code) Securities registered pursuant to Section 12(b) of the Act: Title of each class Name of each exchange on which registered Class A Common Stock (voting), $0.01 par value ........................ New York Stock Exchange Toronto Stock Exchange Class B Common Stock (non-voting), $0.01 par value ...................... New York Stock Exchange Toronto Stock Exchange Securities registered pursuant to Section 12(g) of the Act: Title of class None Indicate by check mark if the registrant is a well-known seasoned issuer, as defined in Rule 405 of the Securities Act. YES ፤ NO អ Indicate by check mark if the registrant is not required to file reports pursuant to Section 13 or Section 15(d) of the Act. YES អ NO ፤ Indicate by check mark whether the registrant (1) has filed all reports required to be filed by Section 13 or 15(d) of the Securities Exchange Act of 1934 during the preceding 12 months (or for such shorter period that the registrant was required to file such reports), and (2) has been subject to such filing requirements for the past 90 days. YES ፤ NO អ Indicate by check mark if disclosure of delinquent filers pursuant to Item 405 of Regulation S-K is not contained herein, and will not be contained, to the best of registrant’s knowledge, in definitive proxy or information statements incorporated by reference in Part III of this Form 10-K or any amendment to this Form 10-K. ፤ Indicate by check mark whether the registrant is a large accelerated filer, an accelerated filer, a non-accelerated filer, or a smaller reporting company. See definitions of ‘‘large accelerated filer,’’ ‘‘accelerated filer,’’ and ‘‘smaller reporting company’’ in Rule 12b-2 of the Exchange Act. (Check one): Large accelerated filer ፤ Accelerated filer អ Non-accelerated filer អ Smaller reporting company អ (Do not check if a smaller reporting company) Indicate by check mark whether the registrant is a shell company (as defined in Rule 12b-2 of the Act). YES អ NO ፤ The aggregate market value of the registrant’s publicly-traded stock held by non-affiliates of the registrant at the close of business on June 29, 2007, was $6,454,558,416 based upon the last sales price reported for such date on the New York Stock Exchange and the Toronto Stock Exchange. For purposes of this disclosure, shares of common and exchangeable stock held by persons holding more than 5% of the outstanding shares of stock and shares owned by officers and directors of the registrant as of June 29, 2007 are excluded in that such persons may be deemed to be affiliates. This determination is not necessarily conclusive of affiliate status. The number of shares outstanding of each of the registrant’s classes of common stock, as of February 15, 2008: Class A Common Stock—2,674,772 shares Class B Common Stock—149,922,749 shares Exchangeable shares: As of February 15, 2008, the following number of exchangeable shares was outstanding for Molson Coors Canada, Inc.: Class A Exchangeable Shares 3,314,100 Class B Exchangeable Shares 25,073,032 In addition, the registrant has outstanding one share each of special Class A and Class B voting stock, through which the holders of Class A exchangeable shares and Class B exchangeable shares of Molson Coors Canada Inc. (a subsidiary of the registrant), respectively, may exercise their voting rights with respect to the registrant. The special Class A and Class B voting stock are entitled to one vote for each of the exchangeable shares, respectively, excluding shares held by the registrant or its subsidiaries, and generally vote together with the Class A common stock and Class B common stock, respectively, on all matters on which the Class A common stock and Class B common stock are entitled to vote. The trustee holder of the special Class A voting stock and the special Class B voting stock has the right to cast a number of votes equal to the number of then outstanding Class A exchangeable shares and Class B exchangeable shares, respectively. Documents Incorporated by Reference: Portions of the registrant’s definitive proxy statement for the registrant’s 2008 annual meeting of stockholders are incorporated by reference under Part III of this Annual Report on Form 10-K.
-
Upload
finance46 -
Category
Economy & Finance
-
view
975 -
download
6
Transcript of molson coors brewing 200710K
21FEB200812074757
UNITED STATESSECURITIES AND EXCHANGE COMMISSION
Washington, D.C. 20549
FORM 10-K(Mark One)
� ANNUAL REPORT PURSUANT TO SECTION 13 OR 15(d) OF THE SECURITIES EXCHANGEACT OF 1934
For the Fiscal year ended December 30, 2007OR
� TRANSITION REPORT PURSUANT TO SECTION 13 OR 15(d) OF THE SECURITIESEXCHANGE ACT OF 1934
For the transition period from to .
Commission File Number: 1-14829
Molson Coors Brewing Company(Exact name of registrant as specified in its charter)
DELAWARE 84-0178360(State or other jurisdiction of (I.R.S. Employerincorporation or organization) Identification No.)
1225 17th Street, Denver, Colorado 802021555 Notre Dame Street East, Montreal, Quebec, Canada H2L 2R5
(Address of principal executive offices) (Zip Code)
303-279-6565 (Colorado)514-521-1786 (Quebec)
(Registrant’s telephone number, including area code)
Securities registered pursuant to Section 12(b) of the Act:Title of each class Name of each exchange on which registered
Class A Common Stock (voting), $0.01 par value . . . . . . . . . . . . . . . . . . . . . . . . New York Stock ExchangeToronto Stock Exchange
Class B Common Stock (non-voting), $0.01 par value . . . . . . . . . . . . . . . . . . . . . . New York Stock ExchangeToronto Stock Exchange
Securities registered pursuant to Section 12(g) of the Act:Title of class
NoneIndicate by check mark if the registrant is a well-known seasoned issuer, as defined in Rule 405 of the Securities Act. YES � NO �Indicate by check mark if the registrant is not required to file reports pursuant to Section 13 or Section 15(d) of the Act. YES � NO �Indicate by check mark whether the registrant (1) has filed all reports required to be filed by Section 13 or 15(d) of the Securities Exchange Act of
1934 during the preceding 12 months (or for such shorter period that the registrant was required to file such reports), and (2) has been subject to suchfiling requirements for the past 90 days. YES � NO �
Indicate by check mark if disclosure of delinquent filers pursuant to Item 405 of Regulation S-K is not contained herein, and will not be contained,to the best of registrant’s knowledge, in definitive proxy or information statements incorporated by reference in Part III of this Form 10-K or anyamendment to this Form 10-K. �
Indicate by check mark whether the registrant is a large accelerated filer, an accelerated filer, a non-accelerated filer, or a smaller reportingcompany. See definitions of ‘‘large accelerated filer,’’ ‘‘accelerated filer,’’ and ‘‘smaller reporting company’’ in Rule 12b-2 of the Exchange Act. (Check one):
Large accelerated filer � Accelerated filer �
Non-accelerated filer � Smaller reporting company �(Do not check if a smaller reporting company)
Indicate by check mark whether the registrant is a shell company (as defined in Rule 12b-2 of the Act). YES � NO �The aggregate market value of the registrant’s publicly-traded stock held by non-affiliates of the registrant at the close of business on June 29, 2007,
was $6,454,558,416 based upon the last sales price reported for such date on the New York Stock Exchange and the Toronto Stock Exchange. For purposesof this disclosure, shares of common and exchangeable stock held by persons holding more than 5% of the outstanding shares of stock and shares owned byofficers and directors of the registrant as of June 29, 2007 are excluded in that such persons may be deemed to be affiliates. This determination is notnecessarily conclusive of affiliate status.
The number of shares outstanding of each of the registrant’s classes of common stock, as of February 15, 2008:Class A Common Stock—2,674,772 sharesClass B Common Stock—149,922,749 sharesExchangeable shares:As of February 15, 2008, the following number of exchangeable shares was outstanding for Molson Coors Canada, Inc.:Class A Exchangeable Shares 3,314,100Class B Exchangeable Shares 25,073,032
In addition, the registrant has outstanding one share each of special Class A and Class B voting stock, through which the holders of Class A exchangeableshares and Class B exchangeable shares of Molson Coors Canada Inc. (a subsidiary of the registrant), respectively, may exercise their voting rights withrespect to the registrant. The special Class A and Class B voting stock are entitled to one vote for each of the exchangeable shares, respectively, excludingshares held by the registrant or its subsidiaries, and generally vote together with the Class A common stock and Class B common stock, respectively, on allmatters on which the Class A common stock and Class B common stock are entitled to vote. The trustee holder of the special Class A voting stock and thespecial Class B voting stock has the right to cast a number of votes equal to the number of then outstanding Class A exchangeable shares and Class Bexchangeable shares, respectively.
Documents Incorporated by Reference: Portions of the registrant’s definitive proxy statement for the registrant’s 2008 annual meeting of stockholdersare incorporated by reference under Part III of this Annual Report on Form 10-K.
MOLSON COORS BREWING COMPANY AND SUBSIDIARIESINDEX
Page(s)
PART I.
Item 1. Business . . . . . . . . . . . . . . . . . . . . . . . . . . . . . . . . . . . . . . . . . . . . . . . . . . . . . . . 3Item 1A. Risk Factors . . . . . . . . . . . . . . . . . . . . . . . . . . . . . . . . . . . . . . . . . . . . . . . . . . . . 18Item 1B. Unresolved Staff Comments . . . . . . . . . . . . . . . . . . . . . . . . . . . . . . . . . . . . . . . . 24Item 2. Properties . . . . . . . . . . . . . . . . . . . . . . . . . . . . . . . . . . . . . . . . . . . . . . . . . . . . . 25Item 3. Legal Proceedings . . . . . . . . . . . . . . . . . . . . . . . . . . . . . . . . . . . . . . . . . . . . . . . 26Item 4. Submission of Matters to a Vote of Security Holders . . . . . . . . . . . . . . . . . . . . . . 26
PART II.
Item 5. Market for the Registrant’s Common Equity and Issuer Purchases of EquitySecurities . . . . . . . . . . . . . . . . . . . . . . . . . . . . . . . . . . . . . . . . . . . . . . . . . . . . . . 27
Item 6. Selected Financial Data . . . . . . . . . . . . . . . . . . . . . . . . . . . . . . . . . . . . . . . . . . . 30Item 7. Management’s Discussion and Analysis of Financial Condition and Results of
Operations . . . . . . . . . . . . . . . . . . . . . . . . . . . . . . . . . . . . . . . . . . . . . . . . . . . . . 32Item 7A. Quantitative and Qualitative Disclosures About Market Risk . . . . . . . . . . . . . . . . 64Item 8. Financial Statements and Supplementary Data . . . . . . . . . . . . . . . . . . . . . . . . . . . 67Item 9. Changes in and Disagreements With Accountants on Accounting and Financial
Disclosure . . . . . . . . . . . . . . . . . . . . . . . . . . . . . . . . . . . . . . . . . . . . . . . . . . . . . 161Item 9A. Controls and Procedures . . . . . . . . . . . . . . . . . . . . . . . . . . . . . . . . . . . . . . . . . . . 161Item 9B. Other Information . . . . . . . . . . . . . . . . . . . . . . . . . . . . . . . . . . . . . . . . . . . . . . . 162
PART III.
Item 10. Directors, Executive Officers and Corporate Governance . . . . . . . . . . . . . . . . . . . 163Item 11. Executive Compensation . . . . . . . . . . . . . . . . . . . . . . . . . . . . . . . . . . . . . . . . . . . 163Item 12. Security Ownership of Certain Beneficial Owners and Management and Related
Stockholder Matters . . . . . . . . . . . . . . . . . . . . . . . . . . . . . . . . . . . . . . . . . . . . . . 163Item 13. Certain Relationships and Related Transactions, and Director Independence . . . . . 164Item 14. Principal Accounting Fees and Services . . . . . . . . . . . . . . . . . . . . . . . . . . . . . . . . 164
PART IV.
Item 15. Exhibits and Financial Statement Schedules . . . . . . . . . . . . . . . . . . . . . . . . . . . . . 165Signatures . . . . . . . . . . . . . . . . . . . . . . . . . . . . . . . . . . . . . . . . . . . . . . . . . . . . . . . . . . . . . . 173
2
PART I
ITEM 1. Business
Molson Coors Brewing Company (‘‘MCBC’’ or the ‘‘Company’’) is a leading global brewer ofhigh-quality beers. On February 9, 2005, Adolph Coors Company merged with Molson Inc. (the‘‘Merger’’). In connection with the Merger, Adolph Coors Company became the parent of the mergedcompany and changed its name to Molson Coors Brewing Company. Unless otherwise noted in thisreport, any description of us includes MCBC (formerly ‘‘Adolph Coors Company’’), principally aholding company, and its operating subsidiaries: Molson Canada (‘‘Molson’’), operating in Canada;Coors Brewing Company (‘‘CBC’’), operating in the United States (‘‘U.S.’’); Coors Brewers Limited(‘‘CBL’’), operating in the United Kingdom (‘‘U.K.’’); and our other corporate entities. Any referenceto ‘‘Coors’’ means the Adolph Coors Company prior to the Merger. Any reference to Molson Inc.means Molson prior to the Merger. Any reference to ‘‘Molson Coors’’ means MCBC, after the Merger.
Unless otherwise indicated, information in this report is presented in U.S. Dollars (‘‘USD’’ or ‘‘$’’).
(a) General Development of Business
Molson was founded in 1786, and Coors was founded in 1873. Since each company was founded,they have been committed to producing the highest-quality beers. Our brands are designed to appeal toa wide range of consumer tastes, styles and price preferences. Our largest markets are Canada, theUnited States and the United Kingdom.
Sale of Kaiser
On January 13, 2006, we sold a 68% equity interest in Cervejarias Kaiser Brasil S.A. (‘‘Kaiser’’) toFEMSA Cerveza S.A. de C.V. (‘‘FEMSA’’). Kaiser is the third largest brewer in Brazil. Kaiser’s keybrands include Kaiser Pilsen�, and Bavaria�. Initially, we retained a 15% ownership interest in Kaiser,which was reflected as a cost method investment for accounting purposes during most of 2006. Duringthe fourth quarter of 2006, we divested our remaining 15% interest in Kaiser by exercising a putoption. Our financial statements contained in this report present Kaiser as a discontinued operation, asdiscussed further in Note 4 to the Consolidated Financial Statements in Item 8.
Joint Ventures and Other Arrangements
Existing arrangements
To focus on our core competencies in manufacturing, marketing and selling malt beverageproducts, we have entered into joint venture arrangements with third parties over the past decade toleverage their strengths in areas such as can and bottle manufacturing, transportation and distribution.These joint ventures have historically included Rocky Mountain Metal Container (‘‘RMMC’’)(aluminum can manufacturing in the U.S.), Rocky Mountain Bottle Company (‘‘RMBC’’) (glass bottlemanufacturing in the U.S.) and Tradeteam, Ltd. (‘‘Tradeteam’’) (transportation and distribution inGreat Britain within our Europe segment).
MillerCoors joint venture
On October 9, 2007, MCBC and SABMiller plc (the investing companies) announced that theysigned a letter of intent to combine the U.S. and Puerto Rico operations of their respectivesubsidiaries, CBC and Miller Brewing Company (‘‘Miller’’), in a joint venture (‘‘MillerCoors’’).Assuming completion of the transaction, MillerCoors will have annual pro forma combined beer salesof 69 million U.S. barrels (81 million hectoliters) and net revenues of approximately $6.6 billion.MCBC and SABMiller expect the transaction to generate approximately $500 million in annual costsynergies to be delivered in full by the third full financial year of combined operations. The parties
3

signed a definitive joint venture agreement on December 20, 2007 and expect the transaction to closein mid-2008.
SABMiller and MCBC expect that the enhanced brand portfolio, scale and combined managementstrength of the joint venture will allow their businesses to compete more vigorously in the aggressiveand rapidly changing U.S marketplace and thus improve the standalone operational and financialperformance of both Miller and CBC through:
• Building a Stronger Brand Portfolio and Giving Consumers More ChoiceThe combined company will have a more complete and differentiated brand portfolio and theability to invest more effectively in marketing its brands to consumers. MillerCoors will build onthe unique attributes of both Miller Lite and Coors Light to ensure compelling differentiation.The new company will also be better positioned to meet the increasingly diverse demands ofU.S. alcohol beverage consumers through imports like Peroni, Molson and Pilsner Urquell; craftvarieties including Leinenkugel’s, Blue Moon and Henry Weinhard’s; and specialty beers likeMiller Chill, Killian’s and Sparks. MillerCoors will have more flexibility and resources for brand-building initiatives and increased levels of innovation in taste, product attributes and packaging.
• Capturing Synergies and Improving ProductivityThe combination of the businesses is expected to result in identified annual cost synergies of$500 million, to come from optimization of production over the existing brewery network,reduced shipping distances, economies of scale in brewery operations and the elimination ofduplication in corporate and marketing services. The expected timing of the synergies is$50 million in the first full financial year of combined operations; an additional annualized$350 million in Year Two; and another annualized $100 million in Year Three—for an aggregateannual total of $500 million. One-time cash outlays required to achieve these synergies areexpected to amount to a net $450 million, consisting of costs of approximately $230 million andnet capital expenditures of approximately $220 million.
• Creating a More Effective CompetitorThis deal will create a stronger U.S. brewer with the scale, operational efficiency anddistribution platform to compete more effectively in the U.S. against large-scale brewers, bothdomestic and global, craft brewers, and wine and spirits producers. The joint venture will bepositioned to respond more effectively to the needs of a consolidating distributor and retailermarket, as well as to the cost pressures in the industry.
• Improving the Route to Market and Benefiting Distributors and RetailersBy leveraging complementary geographic strengths and distribution systems, the joint venturewill be able to better align production with consumer location. Approximately 60% of thecurrent volume of the combined operation would be expected to go through a shareddistribution system, and the companies anticipate that this combined system will produceenhanced distributor effectiveness. MillerCoors will also have greater capacity to invest to meetthe diverse product, packaging and service requirements of increasingly demanding consumers,distributors and the retail trade. In addition, streamlined processes and systems and moreeffective marketing programs will improve distributors’ ability to compete and benefit retailers.
• Optimizing Organizational StrengthThe joint venture will focus on creating a high-performing, results and value-based culture whichwill take the best elements of both companies to create a competitive organization, capable ofthe highest standards of operational and service excellence in the industry. The joint venture willcontinue to comply with all provisions of existing labor agreements.
Each party will contribute its business and related operating assets and certain liabilities into anoperating joint venture company. The percentage interests in the profits of the joint venture will be
4
58% for SABMiller plc and 42% for MCBC. Voting interests will be shared 50%-50%, and eachinvesting company will have equal board representation within the joint venture company. Each partyto the joint venture has agreed not to transfer its economic or voting interests in the joint venture for aperiod of five years, and certain rights of first refusal will apply to any subsequent assignment of suchinterests.
The results and financial position of our U.S. segment will, in all material respects, bede-consolidated upon contribution to the joint venture. We will report our interest in the new combinedoperations using the equity method of accounting.
The proposed joint venture transaction has been submitted for antitrust review and clearance bythe U.S. Department of Justice under the Hart-Scott-Rodino Act of 1976, as amended, and to certainother applicable governmental authorities.
Grupo Modelo joint venture
On November 20, 2007, Molson and Grupo Modelo, S.A.B. de C.V. announced a letter of intent toestablish a long-term joint venture to import, distribute, and market the Modelo beer brand portfolioacross all Canadian provinces and territories. Effective January 1, 2008, both parties have establishedthe joint venture pursuant to executed legally binding definitive agreements. Under the newarrangement, Molson’s sales team will be responsible for selling the brands across Canada on behalf ofthe joint venture. The new alliance will enable Grupo Modelo to effectively tap into the resources andcapabilities of Molson to achieve greater distribution coverage in the Western provinces of Canada.Modelo will also benefit from Molson’s extensive sales and marketing expertise and unparalleleddistribution network in Canada.
(b) Financial Information About Segments
MCBC currently has three operating segments: Canada, the United States, and Europe. Prior tobeing segregated and reported as a discontinued operation during the fourth quarter of 2005, Brazilwas an operating segment. A separate operating team manages each segment, and each segmentmanufactures, markets and sells beer and other beverage products.
See Note 3 to the Consolidated Financial Statements in Item 8 for financial information relating toour segments and operations, including geographic information.
(c) Narrative Description of Business
Some of the following statements may describe our expectations regarding future products and businessplans, financial results, performance and events. Actual results may differ materially from any such forward-looking statements. Please see Cautionary Statement Pursuant to Safe Harbor Provisions of the PrivateSecurities Litigation Reform Act of 1995 beginning on page 18, for some of the factors that may negativelyimpact our performance. The following statements are made, expressly subject to those and other risk factors.
Our Products
Brands sold in Canada include Coors Light�, Molson Canadian�, Molson Dry�, Molson� Export,Creemore Springs�, Rickard’s Red Ale� and other Rickard’s brands, Carling� and Pilsner�. We alsobrew or distribute under license the following brands: Amstel Light� under license from AmstelBrouwerij B.V., Heineken� and Murphy’s� under license from Heineken Brouwerijen B.V., Asahi� andAsahi Select� under license from Asahi Beer U.S.A. Inc. and Asahi Breweries, Ltd., Corona� underlicense from Cerveceria Modelo S.A. De C.V. and Canacermex, Inc., Miller Lite�, Miller GenuineDraft�, Milwaukee’s Best� and Milwaukee’s Best Dry� under license from Miller Brewing Company.
5
Starting on January 1, 2008, we entered into a joint venture agreement with Grupo Modelo, to import,distribute and market the Modelo beer brand portfolio across all Canadian provinces and territories.
Brands sold in the United States include: Coors Light�, Coors�, Coors� Non-Alcoholic, BlueMoon� Belgian White Ale and seasonal Blue Moon brands, George Killian’s� Irish Red? Lager,Keystone�, Keystone� Light, Keystone� Ice, and Zima�. We also sell the Molson family of brands inthe United States.
Brands sold in the United Kingdom include: Carling�, C2�, Coors Light�, Worthington’s� ales,Caffrey’s�, Reef�, Screamers� and Stones�. We also sell Grolsch� in the United Kingdom through ajoint venture. Additionally, in order to be able to provide a full line of beer and other beverages to ouron-premise customers, we sell factored brands in our Europe segment, which are third party brands forwhich we provide distribution to retail, typically on a non-exclusive basis. Beginning in 2008, we haveentered into a contract brewing and kegging agreement with Scottish & Newcastle U.K. Ltd. for theFosters� and Kronenbourg� brands.
We sold approximately 19% of our 2007 reported volume in the Canada segment, 58% in theUnited States segment, and 23% in the Europe segment. In 2007, our largest brands accounted for thefollowing percentage of total consolidated volume: Coors Light accounted for approximately 46% ofreported volume, Carling for approximately 18%, and Keystone Light for approximately 8%.
Our sales volume from continuing operations totaled 42.1 million barrels in 2007, 42.1 millionbarrels in 2006 and 40.4 million barrels in 2005, excluding Brazil volume in discontinued operations.The barrel sales figures for periods prior to our Merger on February 9, 2005 do not include barrel salesof our products sold in Canada or the United States through the former Molson Coors Canada orMolson U.S.A. joint ventures. Our reported sales volumes also do not include the CBL factored brandsbusiness. The fiscal years ended December 30, 2007, and December 25, 2005, were 52 week periodsand fiscal year ended December 31, 2006, was a 53 week period.
No single customer accounted for more than 10% of our consolidated or segmented sales in 2007,2006 or 2005.
Canada Segment
Molson is Canada’s second largest brewer by volume and North America’s oldest beer company,with an approximate 41% market share in Canada. Molson brews, markets, sells and nationallydistributes a wide variety of beer brands. Molson’s portfolio consists of strength or leadership in allmajor product and price segments. Molson has strong market share and visibility across retail andon-premise channels. Priority focus and investment is leveraged behind key owned brands (Coors Light,Molson Canadian, Molson Dry, Molson Export and Rickard’s) and key strategic distributionpartnerships (including Heineken, Corona and Miller). Coors Light currently has a 12% market shareand is the largest-selling light beer and the second-best selling beer brand overall in Canada. MolsonCanadian currently has an 8% market share and is the third-largest selling beer in Canada.
Our Canada segment consists primarily of the production and sale of the Molson brands, CoorsLight, and partner and other brands listed above under ‘‘Our Products.’’ The Canada segment alsoincludes our partnership arrangements related to the distribution of beer in Ontario, BrewersRetail Inc. (‘‘BRI’’), and the Western provinces, Brewers’ Distributor Ltd. (‘‘BDL’’). BRI is currentlyconsolidated in our financial statements. See Note 5 to the Consolidated Financial Statements inItem 8.
6

Sales and Distribution
Canada
In Canada, provincial governments regulate the beer industry, particularly the regulation of thepricing, mark-up, container management, sale, distribution, and advertising of beer. Distribution andretailing of products containing alcohol involves a wide range and varied degree of Canadiangovernment control through their respective provincial liquor boards.
Province of Ontario
In Ontario, beer may only be purchased at retail outlets operated by BRI, at government-regulatedretail outlets operated by the Liquor Control Board of Ontario, approved agents of the Liquor ControlBoard of Ontario, or at any bar, restaurant, or tavern licensed by the Liquor Control Board of Ontarioto sell liquor for on-premise consumption. All brewers pay a service fee, based on their sales volume,through BRI. Molson, together with certain other brewers, participates in the ownership of BRI inproportion to its provincial market share relative to other brewers. Ontario brewers may deliver directlyto BRI’s outlets or may choose to use BRI’s distribution centers to access retail stores in Ontario, theLiquor Control Board of Ontario system and licensed establishments.
Province of Quebec
In Quebec, beer is distributed directly by each brewer or through independent agents. Molson isthe agent for the licensed brands it distributes. The brewer or agent distributes the products to permitholders for retail sales for on-premise consumption. Quebec retail sales for home consumption aremade through grocery and convenience stores as well as government operated stores.
Province of British Columbia
In British Columbia, the government’s Liquor Distribution Branch currently controls the regulatoryelements of distribution of all alcohol products in the province. Brewers’ Distributor Ltd. (‘‘BDL’’),which Molson co-owns with a competitor, manages the distribution of Molson’s products throughoutBritish Columbia. Consumers can purchase beer at any Liquor Distribution Branch retail outlet, at anyindependently owned and licensed wine or beer retail store or at any licensed establishment foron-premise consumption. Liquor-primary licensed establishments for on-premise consumption may alsobe licensed for off-premise consumption.
Province of Alberta
In Alberta, the distribution of beer is managed by independent private warehousing and shippingcompanies or by a government sponsored system in the case of U.S. sourced products. All sales ofliquor in Alberta are made through retail outlets licensed by the Alberta Gaming and LiquorCommission or licensees, such as bars, hotels and restaurants. BDL manages the distribution ofMolson’s products in Alberta.
Other Provinces
Molson’s products are distributed in the provinces of Manitoba and Saskatchewan through localliquor boards. Manitoba and Saskatchewan also have licensed private retailers. BDL manages thedistribution of Molson’s products in Manitoba and Saskatchewan. In the Maritime Provinces (otherthan Newfoundland), local liquor boards distribute and retail Molson’s products. Yukon, NorthwestTerritories and Nunavat manage distribution and retail through government liquor commissioners.
7
Manufacturing, Production and Packaging
Brewing Raw Materials
Molson’s goal is to procure highest quality materials and services at the lowest prices available.Molson selects global suppliers for materials and services that best meet this goal. Molson also useshedging instruments to protect from volatility in the commodities and foreign exchange markets.
Molson sources barley malt from two primary providers, with commitments through 2009. Hopsare purchased from a variety of global suppliers in the U.S., Europe, and New Zealand, withcommitments through 2008. Other starch brewing adjuncts are sourced from two main suppliers, bothin North America. We do not foresee any significant risk of disruption in the supply of theseagricultural products. Molson and CBC in the U.S. have benefited from merger-driven cost synergiesrelated to the acquisition of certain brewing materials. Water used in the brewing process is from localsources in the communities where our breweries operate.
Brewing and Packaging Facilities
Molson has six breweries, strategically located throughout Canada, which brew, bottle, package,market and distribute all owned and licensed brands sold in and exported from Canada. The breweriesare as follows: Montreal (Quebec), Toronto (Ontario), Vancouver (British Columbia), Moncton (NewBrunswick), St. John’s (Newfoundland) and Creemore (Ontario). The Montreal and Toronto breweriesaccount for approximately four-fifths of our Canada production.
Packaging Materials
Glass bottles
Molson single sourced glass bottles in 2007 and has a committed supply through 2008 from threevarious suppliers. Availability of glass bottles has not been an issue, and Molson does not expect anydifficulties in accessing them. However, the risk of glass bottle supply disruptions has increased with thereduction of local supply alternatives due to the consolidation of the glass bottle industry in NorthAmerica. The distribution systems in each province generally provide the collection network forreturnable bottles. The standard container for beer brewed in Canada is the 341 ml returnable bottle,which represents approximately 63% of domestic sales in Canada.
Aluminum cans
Molson single sources aluminum cans and has a committed supply through 2011. Availability ofaluminum cans has not been an issue, and Molson does not expect any difficulties in accessing them.The distribution systems in each province generally provide the collection network for aluminum cans.Aluminum cans account for approximately 26% of domestic sales in Canada.
Kegs
Molson sells approximately 11% of its beer volume in stainless steel kegs. A limited number ofkegs are purchased every year, and there is no long-term supply commitment.
Other packaging
Crowns, labels, corrugate, and paperboard are purchased from concentrated sources unique toeach product. Molson does not foresee difficulties in accessing these products in the near future.
8
Seasonality of Business
Total industry volume in Canada is sensitive to factors such as weather, changes in demographics,and consumer preferences. Consumption of beer in Canada is also seasonal with approximately 41% ofindustry sales volume occurring during the four months from May through August.
Competitive Conditions
2007 Canada Beer Industry Overview
Since 2001, the premium beer category in Canada has gradually lost volume to the super-premiumand ‘‘value’’ (below premium) categories. The growth of the value category slowed in 2006 and 2007,and the price gap between premium and value brands was relatively stable, although the number ofvalue brands increased. In 2007, we increased regular selling prices for our premium brands in selectmarkets, but used targeted feature price activity to generate growth.
The Canadian brewing industry is a mature market. It is characterized by aggressive competitionfor volume and market share from regional brewers, microbrewers and certain foreign brewers, as wellas Molson’s main domestic competitor. These competitive pressures require significant annualinvestment in marketing and selling activities.
There are three major beer segments based on price: super premium, which includes imports;premium, which includes the majority of domestic brands and the light sub-segment; and value.
During 2007, estimated industry sales volume in Canada, including sales of imported beers,increased by 0.9% on a year-over-year basis.
Our Competitive Position
The Canada brewing industry is comprised principally of two major brewers, Molson and Labatt,whose combined market share is approximately 84% of beer sold in Canada. The Ontario and Quebecmarkets account for approximately 62% of the total beer market in Canada.
Our malt beverages also compete with other alcohol beverages, including wine and spirits, and thusour competitive position is affected by consumer preferences between and among these othercategories. Sales of wine and spirits have grown faster than sales of beer in recent years, resulting in areduction in the beer segment’s lead in the overall alcoholic beverages market.
United States Segment
Coors Brewing Company is the third-largest brewer by volume in the United States, with anapproximate 11% market share. CBC produces, markets, and sells the Coors portfolio of brands in theUnited States and its territories and includes the results of the Rocky Mountain Metal Corporation andRocky Mountain Bottle Corporation joint ventures. The U.S. segment also includes Coors brandvolume, primarily Coors Light, that is sold outside of the United States and its territories, primarilyMexico and the Caribbean, as well as sales of Molson brand products in the United States.
On October 9, 2007, MCBC and SABMiller plc (the investing companies) announced that theysigned a letter of intent to combine the U.S. and Puerto Rico operations of their respectivesubsidiaries, CBC and Miller Brewing Company, in a joint venture (‘‘MillerCoors’’). The parties signeda definitive joint venture agreement on December 20, 2007. See discussion in this Item 1 under ‘‘JointVentures and Other Arrangements’’ for further information regarding MillerCoors.
9
Sales and Distribution
In the United States, beer is generally distributed through a three-tier system consisting ofmanufacturers, distributors and retailers. A national network of approximately 560 independentdistributors purchases our products and distributes them to retail accounts. We estimate thatapproximately 20% of our product is sold on-premise in bars and restaurants, and the other 80% issold off-premise in liquor stores, convenience stores, grocery stores, and other retail outlets. We alsoown three distributorships which collectively handled approximately 2% of our total U.S. segment’svolume in 2007. One of these owned distributors is under contract to be sold, and closing is anticipatedin March 2008. Approximately 47% of our volume passes through one of our 11 satellite re-distributioncenters throughout the United States prior to being sold to distributors. In Puerto Rico, we market andsell Coors Light through an independent distributor. Coors Light is the leading beer brand in PuertoRico. Sales in Puerto Rico represented less than 3% of our U.S. sales volume in 2007. We also sell ourproducts in several other Caribbean markets. Cerveceria Cuauhtemoc Moctezuma, S.A. de C.V., asubsidiary of FEMSA Cerveza, is the sole and exclusive importer, marketer, seller and distributor ofCoors Light in Mexico.
Manufacturing, Production and Packaging in the United States
Brewing Raw Materials
We use the highest-quality water, barley, and hops to brew our products. We malt 100% of ourproduction requirements, using barley purchased under yearly contracts from a network of independentfarmers located in five regions in the western United States. Hops and starches are purchased fromsuppliers primarily in the United States. We have acquired water rights to provide for and to sustainbrewing operations in case of a prolonged drought in Colorado. CBC also uses hedging instruments tomanage risks associated with volatility in the commodities and foreign exchange markets.
Brewing and Packaging Facilities
We have two production facilities in the United States. We own and operate the world’s largestsingle-site brewery located in Golden, Colorado. We also operate a second brewing facility located inthe Shenandoah Valley in Elkton, Virginia. The Golden brewery has the capacity to brew and package22 million barrels and 16 million barrels annually, respectively. The Shenandoah brewery has aproduction capacity of approximately 7 million barrels. The Shenandoah facility sources its barley maltfrom the Golden malting facility. All products shipped to Puerto Rico or otherwise exported outsidethe U.S. are brewed and packaged at the Shenandoah facility. The U.S. segment imports Molsonproducts and a portion of another U.S. brand volume from various Molson breweries.
Packaging Materials
Aluminum cans
Approximately 61% of our U.S. products were packaged in aluminum cans in 2007. We purchasedapproximately 80% of those cans from RMMC, our joint venture with Ball Corporation (‘‘Ball’’), whoseproduction facility is located adjacent to the brewery in Golden, Colorado. In addition to our supplyagreement with RMMC, we also have a commercial supply agreement with Ball to purchase cans andends in excess of what is supplied through RMMC. Aluminum is an exchange-traded commodity and itsprice can be volatile. We utilize hedging instruments to manage risks associated with this volatility. TheRMMC joint venture agreement is scheduled to expire in 2012.
10
Glass bottles
We packaged approximately 28% of our U.S. products in 2007 in glass bottles. RMBC, our jointventure with Owens-Brockway Glass Container, Inc. (‘‘Owens’’), produces approximately 60% of ourU.S. glass bottle requirements at our glass manufacturing facility in Wheat Ridge, Colorado. Our jointventure with Owens, as well as a supply agreement with Owens for the glass bottles we require inexcess of joint venture production, expires in 2015.
Kegs
The remaining 11% of U.S. volume we sold in 2007 was packaged in quarter, half, and one-sixthbarrel stainless steel kegs. A limited number of kegs are purchased each year, and there is nolong-term supply agreement.
Other packaging
Crowns, labels, corrugate and paperboard are purchased from concentrated sources unique to eachproduct. We purchase most of our paperboard from a subsidiary of Graphic Packaging Corporation(‘‘GPC’’), a related party discussed further in Note 20 to the Consolidated Financial Statements inItem 8. CBC does not foresee difficulties in accessing packaging products in the future.
Seasonality of the Business
Our U.S. sales volumes are normally lowest in the first and fourth quarters and highest in thesecond and third quarters.
Competitive Conditions
Known Trends and Competitive Conditions
Industry and competitive information in this section and elsewhere in this report was compiledfrom various industry sources, including beverage analyst reports (Beer Marketer’s Insights, ImpactDatabank and The Beer Institute), and distributors. While management believes that these sources arereliable, we cannot guarantee the accuracy of data and estimates obtained from these sources.
2007 U.S. Beer Industry Overview
The beer industry in the United States is highly competitive and increasingly fragmented, with aprofusion of offerings in the above-premium category. With respect to premium lager-style beer, threemajor brewers control approximately 77% of the market. Growing or even maintaining market sharehas required increasing investments in marketing and sales. U.S. beer industry shipments had an annualgrowth rate during the past 10 years of 0.9% and 1.4% in 2007. Price discounting in the U.S. beerindustry was less intense in 2007 and 2006, compared with a high level of promotions in the second halfof 2005.
Since the change in the Excise Tax structure in Puerto Rico in June 2002, the beer market therehas been in modest decline. Additionally, while this market has traditionally been split among U.S.imports, other foreign imports and local brewers, due to the tax advantage held by the local brewer, theMedalla brand has gained significant share in the past several years. Coors Light remains the marketleader in Puerto Rico with an approximate 45% market share.
Our Competitive Position
Our malt beverages compete with numerous above-premium, premium, low-calorie, popular-priced,non-alcoholic, and imported brands. These competing brands are produced by national, regional, local,
11
and international brewers. We compete most directly with Anheuser-Busch and SAB Miller (‘‘SAB’’).We also compete with imported craft beer brands. According to Beer Marketer’s Insights estimates, weare the nation’s third-largest brewer, selling approximately 11% of the total 2007 U.S. brewing industryshipments (including exports and U.S. shipments of imports). This compares to Anheuser-Busch’s 48%share and SAB’s 18% share.
Our malt beverages also compete with other alcohol beverages, including wine and spirits, and thusour competitive position is affected by consumer preferences between and among these othercategories. Sales of wine and spirits have grown faster than sales of beer in recent years, resulting in areduction in the beer segment’s lead in the overall alcoholic beverages market.
Europe Segment
Coors Brewers Limited is the United Kingdom’s second-largest beer company with unit volumesales of approximately 9.7 million U.S. barrels in 2007. CBL has an approximate 21% share of the U.K.beer market, Western Europe’s second-largest market. Sales are primarily in England and Wales, withthe Carling brand (a mainstream lager) representing more than three-fourths of CBL’s total beervolume. The Europe segment consists of our production and sale of the CBL brands principally in theU.K., our joint venture arrangement for the production and distribution of Grolsch in the U.K. andRepublic of Ireland, factored brand sales (beverage brands owned by other companies, but sold anddelivered to retail by us), and our Tradeteam joint venture arrangement with DHL (formerly ExelLogistics) for the distribution of products throughout Great Britain. Our Europe segment also managesa small volume of sales, primarily of Coors products, in Asia and other export markets.
Sales and Distribution
United Kingdom
In the U.K., beer is generally distributed through a two-tier system consisting of manufacturers andretailers. Unlike the U.S., where manufacturers are generally not permitted to distribute beer directlyto retail, the large majority of our beer in the U.K. is sold directly to retailers. It is also common in theU.K. for brewers to distribute beer, wine, spirits, and other products owned and produced by othercompanies to the on-premise channel, where products are consumed in bars and restaurants.Approximately 30% of CBL’s net sales value in 2007 was these ‘‘factored’’ brands. Factored brand salesare included in our net sales and cost of goods sold when ultimately sold but are not included in thereported volumes.
Distribution activities for CBL are conducted by Tradeteam, which operates a system of satellitewarehouses and a transportation fleet. Tradeteam also manages the transportation of malt to the CBLbreweries.
Over the past three decades, volumes have shifted from the higher margin on-premise channel,where products are consumed in pubs and restaurants, to the lower margin off-premise channel, alsoreferred to as the ‘‘take-home’’ market.
On-Premise Market Channel
The on-premise channel accounted for approximately 60% of our U.K. sales volumes in 2007. Theon-premise channel is generally segregated further into two more specific categories: multipleon-premise and free on-premise. Multiple on-premise refers to those customers that own a number ofpubs and restaurants and free on-premise refers to individual owner-operators of pubs and restaurants.The on-going market trend from the higher-margin free on-premise category to the lower-marginmultiple on-premise category places downward pressure on the profitability of our Europe segment. In2007, CBL sold approximately 70% and 30% of its on-premise volume to multiple and free on-premise
12
customers, respectively. In recent years, pricing competition in the on-premise channel has intensifiedas the retail pub chains have consolidated. As a result, the larger pub chains have been able tonegotiate lower beer prices from brewers. A smoking ban was enacted in 2007 affecting all pubs andrestaurants in the U.K., which has had an unfavorable impact on beer volume sold in this channel.
The installation and maintenance of draught beer dispensing equipment in the on-premise channelis generally the responsibility of the brewer in the U.K. Accordingly, CBL owns equipment used todispense beer from kegs to consumers. This includes beer lines, cooling equipment, taps, andcountermounts.
Similar to other U.K. brewers, CBL has traditionally used loans to secure supply relationships withcustomers in the on-premise market. Loans are normally granted at below-market rates of interest, withthe outlet purchasing beer at lower-than-average discount levels to compensate. We reclassify a portionof sales revenue as interest income to reflect the economic substance of these loans.
Off-Premise Market Channel
The off-premise channel accounted for approximately 40% of our U.K. sales volume in 2007. Theoff-premise market includes sales to supermarket chains, convenience stores, liquor store chains,distributors, and wholesalers. The off-premise channel has become increasingly concentrated among asmall number of super-store chains, placing increasing downward pressure on pricing.
Asia
We continue to develop markets in Asia, which are managed by the Europe segment’smanagement team. We have a Japanese business which is currently focused on the Zima and Coorsbrands. Our business in China is principally focused on the Coors Light brand. Product sold in Japanand China is contract brewed by a third party in China. The small amount of remaining Asia volume isexported from the U.S.
Manufacturing, Production and Packaging
Brewing Raw Materials
We use high quality water, barley and hops to brew our products. During 2007, CBL producedmore than 95% of its required malt using barley purchased from sources in the U.K. CBL does notanticipate significant challenges in procuring quality malt for the foreseeable future. Malt sourcedexternally is committed through 2008 and is produced through a toll malting agreement where CBLpurchases the required barley and pays a conversion fee to the malt vendor. Hops and adjunct starchesused in the brewing process are purchased from agricultural sources in the United Kingdom and on theEuropean continent. CBL does not anticipate difficulties in accessing these products going forwardalthough prices have risen dramatically over the past year.
We ensure high quality water by obtaining our water from private water sources that are carefullychosen for their purity and are regularly tested to ensure their ongoing purity and to confirm that allthe requirements of the U.K. private water regulations are met. Public supplies are used as back-up tothe private supplies in some breweries, and these are again tested regularly to ensure their ongoingpurity.
Brewing and Packaging Facilities
We operate three breweries in the U.K. The Burton-on-Trent brewery, located in the Midlands, isthe largest brewery in the United Kingdom and accounts for approximately two-thirds of CBL’sproduction. Smaller breweries are located in Tadcaster and Alton. Product sold in Ireland is producedby contract brewers.
13
Packaging Materials
Kegs and casks
We used kegs and casks for approximately 56% of our U.K. products in 2007, reflecting a highpercentage of product sold on-premise. In April 2007, CBL purchased the existing keg population thathad been owned and managed by a third-party service provider which was placed in receivership earlyin 2007. A limited number of additional kegs will be purchased every year, and there is no long-termsupply commitment.
Cans
Approximately 36% of our U.K. products were packaged in steel cans with aluminum ends in 2007.All of our cans are purchased through a supply contract with Ball.
Glass bottles
Approximately 5% of our U.K. products are packaged in glass bottles purchased through supplycontracts with third-party suppliers.
Other packaging
The remaining 3% of our U.K. sales are shipped in bulk tanker for other brewers to package.
Crowns, labels, corrugate, and paperboard are purchased from concentrated sources unique toeach product. CBL does not foresee difficulties in accessing these or other packaging materials in theforeseeable future.
Seasonality of Business
In the U.K., the beer industry is subject to seasonal sales fluctuations primarily influenced byholiday periods, weather and by certain major televised sporting events. Peak selling seasons occurduring the summer and during the Christmas and New Year periods. The Christmas/New Year holidaypeak is most pronounced in the off-premise channel. Consequently, our largest quarters by volume arethe second and fourth quarters, and the smallest are the first and third. Weather conditions cansignificantly impact sales volumes, as noted during 2007 when unusually cool, rainy weather in thesummer months resulted in lower sales volumes.
Competitive Conditions
2007 U.K. Beer Industry Overview
From being relatively stable between 2000 to 2003, U.K. beer consumption has since seen fouryears of decline. This has been driven by a number of factors, including changes in consumers’lifestyles, falling discretionary income and pressure from other drinks categories, notably wine. Thesefactors are expected to continue to affect the beer market in the near future. In 2007, beerconsumption declined by approximately 4%, with performance affected by a poor summer and theimpact of smoking bans in England, Wales and Northern Ireland.
On-premise sales fell by 6.5% in 2007, with the smoking bans accelerating the switch from on- tooff-premise. A widening price differential between the on-premise (higher prices) and the off-premise(lower prices) has tended to benefit off-premise. Off-premise sales in 2007 dipped into decline, down0.1%.
The industry has also experienced a steady trend away from ales and towards lager. Sales of lagersaccounted for 75% of the U.K. market in 2007. While lager volume has been growing, ales, including
14
stouts, have declined during this period, and this trend has accelerated in the last few years. The top 10beer brands now represent approximately 66% of the total market, compared to only 34% in 1995.
Our Competitive Position
Our beers compete not only with similar products from competitors, but also with other alcoholbeverages, including wines, spirits, and ciders. With the exception of stout, where we do not have ourown brand, our brand portfolio gives us strong representation in all major beer categories. Our strengthin the growing lager category with Carling, Grolsch, Coors Light, and C2 positions us well to takeadvantage of the continuing trend toward lagers. Our portfolio has been strengthened by theintroduction of a range of imported and specialty beer brands, such as Sol, Zatec, Palm, and KasteelCru.
Our principal competitors are Scottish & Newcastle U.K. Ltd., Inbev U.K. Ltd., and CarlsbergU.K. Ltd. We are the U.K.’s second-largest brewer, with a market share of approximately 21%(excluding factored brands sales), based on AC Nielsen information. This compares to Scottish &Newcastle U.K. Ltd.’s share of approximately 25%, Inbev U.K. Ltd.’s share of approximately 18%, andCarlsberg U.K. Ltd.’s share of approximately 12%. In 2007, CBL had a small decline in its share of theU.K. beer market.
Other Information
Global Intellectual Property
We own trademarks on the majority of the brands we produce and have licenses for the remainder.We also hold several patents on innovative processes related to product formula, can making, candecorating, and certain other technical operations. These patents have expiration dates through 2021.We are not reliant on royalty or other revenue from third parties for our financial success. Therefore,these expirations are not expected to have a significant impact on our business.
Inflation
Inflation is typically a factor in the segments in which we operate and we experience inflationarytrends in specific areas, such as fuel costs, which were significantly higher in 2007 when compared toprior years. Inflation in diesel fuel costs impacts the U.S. segment most significantly due to thegeographic size of the U.S. market and the concentration of production at fewer facilities. The U.S.segment is also the most exposed to inflation in aluminum prices, since it packages the majority of itsproduct in aluminum cans. Barley prices are expected to increase in 2008 as a result of lower suppliesas farmers grow an increasingly large corn crop due to the demand for ethanol.
Regulation
Canada
In Canada, provincial governments regulate the production, marketing, distribution, selling, andpricing of beer (including the establishment of minimum prices), and impose commodity taxes andlicense fees in relation to the production and sale of beer. In 2007, Canada excise taxes totaled$558 million or $68.40 per barrel sold. In addition, the federal government regulates the advertising,labeling, quality control, and international trade of beer, and also imposes commodity taxes,consumption taxes, excise taxes, and in certain instances, custom duties on imported beer. Further,certain bilateral and multilateral treaties entered into by the federal government, provincialgovernments and certain foreign governments, especially with the United States, affect the Canadianbeer industry.
15

United States
In the U.S., the beer business is regulated by federal, state, and local governments. Theseregulations govern many parts of our operations, including brewing, marketing and advertising,transportation, distributor relationships, sales, and environmental issues. To operate our facilities, wemust obtain and maintain numerous permits, licenses and approvals from various governmentalagencies, including the U.S. Treasury Department; Alcohol and Tobacco Tax and Trade Bureau; theU.S. Department of Agriculture; the U.S. Food and Drug Administration; state alcohol regulatoryagencies as well as state and federal environmental agencies.
Governmental entities also levy taxes and may require bonds to ensure compliance with applicablelaws and regulations. U.S. federal excise taxes on malt beverages are currently $18 per barrel. Stateexcise taxes also are levied at rates that ranged in 2007 from a high of $32.10 per barrel in Alaska to alow of $0.60 per barrel in Wyoming. In 2007, U.S. excise taxes totaled $437 million or $18.04 per barrelsold.
Europe
In the U.K., regulations apply to many parts of our operations and products, including brewing,food safety, labeling and packaging, marketing and advertising, environmental, health and safety,employment, and data protection regulations. To operate our breweries and carry on business in theUnited Kingdom, we must obtain and maintain numerous permits and licenses from local LicensingJustices and governmental bodies, including Her Majesty’s Revenue & Customs (‘‘HMRC’’); the Officeof Fair Trading; the Data Protection Commissioner and the Environment Agency.
The U.K. government levies excise taxes on all alcohol beverages at varying rates depending on thetype of product and its alcohol content by volume. In 2007, we incurred approximately $1.1 billion inexcise taxes on gross revenues of approximately $2.6 billion, or approximately $117.49 per barrel.
Environmental Matters
Canada
Our Canadian brewing operations are subject to provincial environmental regulations and localpermit requirements. Each of our Canadian breweries, other than the St. John’s brewery, has watertreatment facilities to pre-treat waste water before it goes to the respective local governmental facilityfor final treatment. We have environmental programs in Canada including organization, monitoring andverification, regulatory compliance, reporting, education and training, and corrective action.
Molson sold a chemical specialties business in 1996. The company is responsible for certain aspectsof environmental remediation, undertaken or planned, at those chemical specialties business locations.We have established provisions for the costs of these remediation programs.
United States
We are one of a number of entities named by the Environmental Protection Agency (‘‘EPA’’) as apotentially responsible party (‘‘PRP’’) at the Lowry Superfund site. This landfill is owned by the Cityand County of Denver (‘‘Denver’’) and is managed by Waste Management of Colorado, Inc. (‘‘WasteManagement’’). In 1990, we recorded a pretax charge of $30 million, a portion of which was put into atrust in 1993 as part of a settlement with Denver and Waste Management regarding then outstandinglitigation. Our settlement was based on an assumed remediation cost of $120 million (in 1992 adjusteddollars). The settlement requires us to pay a portion of future costs in excess of that amount.
Considering uncertainties at the site, including what additional remedial actions may be requiredby the EPA, new technologies, and what costs are included in the determination of when the$120 million threshold is reached, the estimate of our liability may change as facts further develop. Wecannot predict the amount or timing of any such change, but additional accruals could be required inthe future.
16
We are aware of groundwater contamination at some of our properties in Colorado resulting fromhistorical, ongoing, or nearby activities. There may also be other contamination of which we arecurrently unaware.
From time to time, we have been notified that we are or may be a PRP under the ComprehensiveEnvironmental Response, Compensation, and Liability Act or similar state laws for the cleanup of othersites where hazardous substances have allegedly been released into the environment. While we cannotpredict our eventual aggregate cost for the environmental and related matters in which we may be orare currently involved, we believe that any payments, if required, for these matters would be made overa period of time in amounts that would not be material in any one year to our operating results, cashflows, or our financial or competitive position. We believe adequate reserves have been provided forlosses that are probable and estimable.
Europe
We are subject to the requirements of government and local environmental and occupationalhealth and safety laws and regulations. Compliance with these laws and regulations did not materiallyaffect our 2007 capital expenditures, earnings or competitive position, and we do not anticipate thatthey will do so in 2008.
Environmental expenditures at each of our segments for 2007, 2006 and 2005 to evaluate andremediate such sites were not material.
Employees and Employee Relations
Canada
We have approximately 3,000 full-time employees in our Canada segment. Approximately 63% ofthis total workforce is represented by trade unions. Workplace change initiatives are continuing and asa result, joint union and management steering committees established in most breweries are focusingon customer service, quality, continuous improvement, employee training, and a growing degree ofemployee involvement in all areas of brewery operations. We believe that relations with our Canadaemployees are good.
United States
We have approximately 4,100 employees in our U.S. segment. Less than 1% of our U.S. work forceis represented by unions. We believe that relations with our U.S. employees are good.
Europe
We have approximately 2,600 employees in our Europe segment. Approximately 21% of this totalworkforce is represented by trade unions, primarily at our Burton-on-Trent and Tadcaster breweries.The agreements do not have expiration dates and negotiations are conducted annually. We believe thatrelations with our Europe employees are good.
(d) Financial Information about Foreign and Domestic Operations and Export Sales
See the Consolidated Financial Statements in Item 8 for discussion of sales, operating income, andidentifiable assets attributable to our country of domicile, the United States, and all foreign countries.
(e) Available Information
Our internet website is http://www.molsoncoors.com. Through a direct link to our reports at theSEC’s website at http://www.sec.gov, we make available, free of charge on our website, our annual
17
reports on Form 10-K, quarterly reports on Form 10-Q, current reports on Form 8-K and amendmentsto those reports as soon as reasonably practicable after we electronically file or furnish such materialsto the SEC.
In addition, all of Molson Coors’ directors and employees, including its Chief Executive Officer,Chief Financial Officer, and other senior financial officers, are bound by Molson Coors’ Code ofBusiness Conduct, which complies with the requirements of the New York Stock Exchange and theSEC to ensure that the business of Molson Coors is conducted in a legal and ethical manner. TheCode of Business Conduct covers all areas of professional conduct, including employment policies,conflicts of interest, fair dealing, and the protection of confidential information, as well as strictadherence to all laws and regulations applicable to the conduct of our business. Molson Coors intendsto disclose future amendments to, or waivers from, certain provisions of the Code of Business Conductfor executive officers and directors on its website within four business days following the date of suchamendment or waiver.
Cautionary Statement Pursuant to Safe Harbor Provisions of the Private Securities Litigation ReformAct of 1995
This document and the documents incorporated in this document by reference contain forward-looking statements that are subject to risks and uncertainties. All statements other than statements ofhistorical fact contained in this document and the materials accompanying this document are forward-looking statements.
Forward-looking statements are based on the beliefs of our management, as well as assumptionsmade by, and information currently available to, our management. Frequently, but not always, forward-looking statements are identified by the use of the future tense and by words such as ‘‘believes,’’‘‘expects,’’ ‘‘anticipates,’’ ‘‘intends,’’ ‘‘will,’’ ‘‘may,’’ ‘‘could,’’ ‘‘would,’’ ‘‘projects,’’ ‘‘continues,’’‘‘estimates,’’ or similar expressions. Forward-looking statements are not guarantees of futureperformance and actual results could differ materially from those indicated by forward-lookingstatements. Forward-looking statements involve known and unknown risks, uncertainties, and otherfactors that may cause our or our industry’s actual results, level of activity, performance orachievements to be materially different from any future results, levels of activity, performance orachievements expressed or implied by the forward-looking statements.
The forward-looking statements contained or incorporated by reference in this document areforward-looking statements within the meaning of Section 27A of the Securities Act of 1933 andSection 21E of the Securities Exchange Act of 1934 (the ‘‘Exchange Act’’) and are subject to the safeharbor created by the Private Securities Litigation Reform Act of 1995. These statements includedeclarations regarding our plans, intentions, beliefs, or current expectations.
Among the important factors that could cause actual results to differ materially from thoseindicated by forward-looking statements are the risks and uncertainties described under ‘‘Risk Factors’’and elsewhere in this document and in our other filings with the SEC.
Forward-looking statements are expressly qualified in their entirety by this cautionary statement.The forward-looking statements included in this document are made as of the date of this documentand we do not undertake any obligation to update forward-looking statements to reflect newinformation, subsequent events or otherwise.
ITEM 1A. Risk Factors
The reader should carefully consider the following factors and the other information containedwithin this document. The most important factors that could influence the achievement of our goals,
18
and cause actual results to differ materially from those expressed in the forward-looking statements,include, but are not limited to, the following:
Risks Specific to Our Company
If Pentland and the Coors Trust do not agree on a matter submitted to stockholders, generally the matterwill not be approved, even if beneficial to us or favored by other stockholders. Pentland Securities (acompany controlled by Eric Molson, a related party) (‘‘Pentland’’) and the Coors Trust, which togethercontrol more than two-thirds of our Class A common stock and Class A exchangeable shares, havevoting trust agreements through which they have combined their voting power over the shares of ourClass A common stock and the Class A exchangeable shares that they own. In the event that these twostockholders do not agree to vote in favor of a matter submitted to a stockholder vote (other than theelection of directors), the voting trustees will be required to vote all of the Class A common stock andClass A exchangeable shares deposited in the voting trusts against the matter. There is no othermechanism in the voting trust agreements to resolve a potential deadlock between these stockholders.Therefore, if either Pentland or the Coors Trust is unwilling to vote in favor of a transaction that issubject to a stockholder vote, we would be unable to complete the transaction even if our board,management or other stockholders believe the transaction is beneficial for Molson Coors.
Our success as an enterprise depends largely on the success of three primary products in three maturemarkets; the failure or weakening of one or more of these products or markets could materially adverselyaffect our financial results. The combination of the Molson Canadian and Coors Light brandsrepresented more than 44% of our Canada segment’s sales volume in 2007. Although we currently have14 products in our U.S. portfolio, Coors Light represented more than 66% of our U.S. segment’s salesvolume for 2007. Carling lager is the best-selling brand in the United Kingdom and represented morethan 78% of our European segment’s sales volume in 2007. Consequently, any material shift inconsumer preferences away from these brands, or from the categories in which they compete, wouldhave a disproportionately large adverse impact on our business. Moreover, each of our three majormarkets is mature, and in each we face large competitors who have greater financial, marketing, anddistribution resources and are more diverse in terms of their geographies and brand portfolios.
Poor investment performance of pension plan holdings and other factors impacting pension plan costscould unfavorably impact liquidity and results of operations. Our costs of providing defined benefitpension plans are dependent upon a number of factors, such as the rates of return on the plans’ assets,discount rates, the level of interest rates used to measure the required minimum funding levels of theplans, future government regulation, and our required and/or voluntary contributions made to theplans. While we comply with the minimum funding requirements, we have certain qualified pensionplans with obligations which exceeded the value of the plans’ assets. Without sustained growth in thepension investments over time to increase the value of the plans’ assets and depending upon the otherfactors as listed above, we could be required to fund the plans with significant amounts of cash. Suchcash funding obligations could have a material impact on our cash flows, financial position, or results ofoperations.
We rely on a small number of suppliers to obtain the packaging we need to operate our business. Theinability to obtain materials could unfavorably affect our ability to produce our products. For our U.S.business, we purchase most of our paperboard and container supplies from a single supplier or a smallnumber of suppliers. This packaging is unique and is not produced by any other supplier. Additionally,we are contractually obligated to purchase substantially all our can and bottle needs in the UnitedStates and Canada from our container joint ventures or from our partners in those ventures, BallCorporation (RMMC) and Owens-Brockway Glass Container, Inc. (RMBC). Consolidation of the glassbottle industry in North America has reduced local supply alternatives and increased risks of glassbottle supply disruptions. CBL has a single source for its can supply (Ball). The inability of any of these
19
suppliers to meet our production requirements without sufficient time to develop an alternative sourcecould have a material adverse effect on our business.
Our United States and Europe production is concentrated among a small number of production facilities,so we could be more vulnerable than our competitors to transportation disruptions, fuel increases and naturaldisasters. In the United States and Europe, respectively, we have primary production facilities inGolden, Colorado and Burton-on-Trent, England. In both segments, our competitors are moregeographically dispersed. As a result, we ship our products greater distances than some of ourcompetitors, making us more vulnerable to fluctuations in costs such as fuel, as well as the impact ofany localized natural disasters impacting these two facilities. During 2007, we brought on-line ourShenandoah brewery located in Elkton, Virginia to reduce risk in the United States segment associatedwith having a significant single site production facility.
Consolidation of brewers worldwide may lead to the termination of one or more manufacturer/distribution agreements, which could have a material adverse effect on our business. We manufactureand/or distribute products of other beverage companies, including those of one or more competitors,through various licensing, distribution or other arrangements in Canada and the United Kingdom. Beerindustry consolidation may increase the competitive environment, straining our current and futurerelationships with our partners. The loss of one or more of these arrangements could have a materialadverse effect on the results of one or more reporting segments.
Because we will continue to face intense global competition, operating results may be unfavorablyimpacted. The brewing industry is highly competitive and requires substantial human and capitalresources. Competition in our markets could require us to reduce prices or increase capital and otherexpenditures or cause us to lose sales volume, any of which could have a material adverse effect on ourbusiness and financial results. In addition, in some of our markets, our primary competitors havesubstantially greater financial, marketing, production and distribution resources than Molson Coors has.In all of the markets in which Molson Coors operates, aggressive marketing strategies by our maincompetitors could adversely affect our financial results.
We may not properly execute, or realize the anticipated $250 million of cost savings or benefits from, ourongoing strategic initiatives. Our success is partly dependent upon properly executing and realizing costsavings or other benefits from the additional cost savings initiatives identified during 2007. Theseinitiatives are primarily designed to make the company more efficient across the whole of the business,which is a necessity in our highly competitive industry. These initiatives are often complex, and a failureto implement them properly may, in addition to not meeting projected cost savings or benefits, result ina strain on the company’s sales, manufacturing, logistics, customer service, or finance and accountingfunctions. Any of these results could have a material adverse effect on the business and financial resultsof the company.
Changes in tax, environmental or other regulations or failure to comply with existing licensing, trade andother regulations could have a material adverse effect on our financial condition. Our business is highlyregulated by federal, state, provincial, and local laws and regulations in various countries regarding suchmatters as licensing requirements, trade and pricing practices, labeling, advertising, promotion andmarketing practices, relationships with distributors, environmental matters, smoking bans at on-premiselocations, and other matters. Failure to comply with these laws and regulations or changes in these lawsand regulations or in tax, environmental, excise tax levels imposed or any other laws or regulationscould result in the loss, revocation or suspension of our licenses, permits or approvals and could have amaterial adverse effect on our business, financial condition, and results of operations.
Our consolidated financial statements are subject to fluctuations in foreign exchange rates, mostsignificantly the British pound (‘‘GBP’’) and the Canadian dollar (‘‘CAD’’). We hold assets and incurliabilities, earn revenues and pay expenses in different currencies, most significantly in Canada and in
20
the United Kingdom. Since our financial statements are presented in U.S. Dollars (‘‘USD’’), we musttranslate our assets, liabilities, income and expenses into USD at current exchange rates. Increases anddecreases in the value of the USD will affect, perhaps adversely, the value of these items in ourfinancial statements, even if their local currency value has not changed. We have active hedgingprograms to address foreign exchange rate changes. However, to the extent that we fail to adequatelymanage the foregoing risks, including if our hedging arrangements do not effectively or completelyhedge changes in foreign currency rates, our results of operations may be adversely impacted.
Our operations face significant commodity price change exposure which could materially and adverselyaffect our operating results. We use a large volume of agricultural and other raw materials to produceour products, including barley, barley malt, hops, corn, other various starches, water, and packagingmaterials, including aluminum, cardboard and other paper products. We also use a significant amountof diesel fuel in our operations. The supply and price of these raw materials and commodities can beaffected by a number of factors beyond our control, including market demand, global geopoliticalevents (especially as to their impact on crude oil prices and the resulting impact on diesel fuel prices),frosts, droughts and other weather conditions, economic factors affecting growth decisions, plantdiseases, and theft. To the extent any of the foregoing factors affect the prices of ingredients orpackaging, our results of operations could be materially and adversely impacted. We have activehedging programs to address commodity price changes. However, to the extent we fail to adequatelymanage the foregoing risks, including if our hedging arrangements do not effectively or completelyhedge changes in commodity price risks, including price risk associated with diesel fuel and aluminum,both of which are at historically high price levels, our results of operations may be adversely impacted.
We could be adversely affected by overall declines in the beer market. Consumer trends in some globalmarkets indicate increases in consumer preference for wine and spirits, as well as for lower priced,value segment beer brands, which could result in loss of volume or a deterioration of operatingmargins.
The success of our business relies heavily on brand image, reputation, and product quality. Deteriorationto our brand equity may have a material effect to our operations and financial results. It is important wehave the ability to maintain and increase the image and reputation of our existing products. The imageand reputation of our products may be reduced in the future; concerns about product quality, evenwhen unsubstantiated, could be harmful to our image and reputation of our products. Restoring theimage and reputation of our operations may be costly; operations and financial results may be adverselyimpacted.
Due to a high concentration of unionized workers in the United Kingdom and Canada, we could besignificantly affected by labor strikes, work stoppages, or other employee-related issues. Approximately 63%of Molson’s total workforce and approximately 21% of CBL’s total workforce is represented by tradeunions. Although we believe relations with our employees are good, stringent labor laws in the U.K.expose us to a greater risk of loss should we experience labor disruptions in that market.
Changes to the regulation of the distribution systems for our products could adversely impact ourbusiness. In 2006, the U.S. Supreme Court ruled that certain state regulations of interstate wineshipments are unlawful. As a result of this decision, states may alter the three-tier distribution systemthat has historically applied to the distribution of our products. Changes to the three-tier distributionsystem could have a materially adverse impact on our business. Further, in certain Canadian provinces,our products are distributed through joint venture arrangements that are mandated and regulated byprovincial government regulators. If provincial regulation should change, effectively eliminating thedistribution channels, the costs to adjust our distribution methods could have a material adverse impacton our business.
21
Because of our reliance on third-party service providers for certain administrative functions, we couldexperience a disruption to our business. We rely exclusively on one information services providerworldwide for our information technology functions including network, help desk, hardware, andsoftware configuration Additionally, during the first quarter of 2008, we signed a contract with anotherthird-party service provider to outsource a significant portion of work associated with our finance andaccounting, human resources, and other information technology functions. We will begin transitioningwork to our service provider in the first half of 2008, and the transition will continue through the endof the year. If one of these service providers were to fail and we were unable to find a suitablereplacement in a timely manner, we could be unable to properly administer our information technologysystems or other administrative tasks associated with the outsourced functions.
Risks Specific to Our Discontinued Operations
Indemnities provided to the purchaser of 83% of the Cervejarias Kaiser Brasil S.A. (‘‘Kaiser’’) businessin Brazil could result in future cash outflows and statement of operations charges. In 2006, we sold our83% ownership interest in Kaiser to FEMSA Cerveza S.A. de C.V. (‘‘FEMSA’’). The terms of our 2006agreement require us to indemnify FEMSA for exposures related to certain tax, civil and laborcontingencies and certain purchased tax credits. The ultimate resolution of these claims is not underour control, and we cannot predict the outcomes of administrative and judicial proceedings that willoccur with regard to these claims. It is possible that we will have to make cash outlays to FEMSA withregard to these indemnities. While the fair values of these indemnity obligations are recorded asliabilities on our balance sheet in conjunction with the sale, we could incur future statement ofoperations charges as facts further develop resulting in changes to our fair value estimates or changesin our assessment of probability of loss on these items. Due to the uncertainty involved in the ultimateoutcome and timing of these contingencies, significant adjustments to the carrying value of ourindemnity liabilities and corresponding statement of operations charges/credits could result in thefuture.
Risks Specific to the Canada Segment
We may be required to provide funding to the entity that owns the Montreal Canadiens hockey club andcertain related entertainment businesses pursuant to the guarantees given to the National Hockey League(‘‘NHL’’). Pursuant to certain guarantees given to the NHL as a minority owner of the MontrealCanadiens professional hockey club (majority ownership was sold by Molson in 2001) and certainrelated entertainment businesses, Molson may have to provide funding to the Club (joint and severallybased on our 19.9% ownership) to meet its obligations and its operating expenses if the Club cannotmeet its obligations under various agreements.
Risks Specific to the U.S. Segment
The proposed MillerCoors joint venture transaction is subject to the receipt of consents and approvalsfrom government entities that could delay or prevent completion of the venture transaction or imposeconditions on the venture, which could result in a material adverse effect on the business or financialcondition of the joint venture as well as on our business and financial results. Completion of the jointventure transaction is conditioned upon the expiration or termination of the applicable waiting periodunder the Hart-Scott-Rodino Act, and the approval of the transaction by certain other regulatoryauthorities. If such regulatory clearances are not obtained, we will not be able to complete thetransaction, which could have a material adverse effect on our business and financial results. Inaddition, a substantial delay in obtaining satisfactory approvals or the imposition of unfavorable termsor conditions in the approvals could have a material adverse effect on the business and financial resultsof the joint venture as well as on our business and financial results.
22
We may not realize the cost savings and other benefits we currently anticipate from the MillerCoors jointventure transaction due to challenges associated with integrating operations, technologies, sales, and otheraspects of the operations. The success of the joint venture transaction, if approved, will depend in parton the success of the management of the venture in integrating the operations, technologies, andpersonnel of MCBC’s and SABMiller’s respective U.S. operations following the completion of thetransaction. The failure of the venture to integrate the two operations or otherwise to realize theanticipated benefits of the joint venture transaction, including the estimated annual cost savingsdescribed elsewhere in this document, could negatively impact the results of operations of the jointventure. In addition, the overall integration of MCBC and SABMiller’s respective U.S. operations iscomplex and, accordingly, may result in unanticipated operational problems, expenses and liabilities,and diversion of management’s attention.
The challenges involved in this integration include the following:
• integrating successfully each company’s U.S. operations, technologies, products and services;
• reducing the costs associated with each company’s U.S. operations;
• coordinating sales, distribution, and marketing efforts to effectively promote the products of thejoint venture;
• preserving distribution, marketing, or other important relationships of the U.S. operations ofboth MCBC and SABMiller and resolving potential conflicts that may arise;
• coordinating and rationalizing research and development activities to accelerate introduction ofnew products;
• assimilating the personnel and business cultures of both companies; and
• building employee morale and motivation.
We are highly dependent on independent distributors in the United States to sell our products, with noassurance that these distributors will effectively sell our products. We sell all of our products in theUnited States to distributors for resale to retail outlets. Some of our distributors are at a competitivedisadvantage because they are smaller than the largest distributors in their markets. Our distributorsalso sell products that compete with our products. These distributors may give our competitors’products higher priority, thereby reducing sales of our products. In addition, the regulatoryenvironment of many states makes it very difficult to change distributors. Consequently, if we are notallowed or are unable to replace unproductive or inefficient distributors, our business, financialposition, and results of operation may be adversely affected.
A failure to successfully upgrade certain information technology systems in early 2008 could causedisruption in our business. During early 2008, we are upgrading certain modules of key informationtechnology systems in the United States and the United Kingdom. A failure to successfully accomplishthese upgrades could adversely affect our ability to take orders, plan and schedule production, shipproducts, and bill customers for shipments.
Risks Specific to the Europe Segment
Sales volume trends in the United Kingdom brewing industry reflect movement from on-premise channelsto off-premise channels, a trend which unfavorably impacts our profitability. In recent years, beer volumesales in the U.K. have been shifting from pubs and restaurants (on-premise) to retail stores(off-premise), for the industry in general. A ban on smoking in pubs and restaurants across the wholeof the U.K. enacted in 2007 is accelerating this trend. Margins on sales to off-premise customers tendto be lower than margins on sales to on-premise customers, hence these trends could adversely impactour profitability.
23
Consolidation of pubs and growth in the size of pub chains in the United Kingdom could unfavorablyimpact pricing. The trend toward consolidation of pubs, away from independent pub and cluboperations, is continuing in the United Kingdom. These larger entities have stronger price negotiatingpower, and therefore continuation of this trend could impact CBL’s ability to obtain favorable pricingin the on-premise channel (due to the spillover effect of reduced negotiating leverage) and couldreduce our revenues and profit margins. In addition, these larger customers continue to move topurchasing directly more of the products that, in the past, we have provided as part of our factoredbusiness. Further consolidation could contribute to an adverse financial impact.
We depend exclusively on one logistics provider in England, Wales, and Scotland for distribution of ourCBL products. We are a party to a joint venture with DHL (‘‘Tradeteam’’). Tradeteam handles all ofthe physical distribution for CBL in England, Wales and Scotland, except where a different distributionsystem is requested by a customer. If Tradeteam were unable to continue distribution of our productsand we were unable to find a suitable replacement in a timely manner, we could experience significantdisruptions in our business that could have an adverse financial impact.
We may incur impairments of the carrying value of our goodwill and other intangible assets that haveindefinite useful lives. In connection with various business combinations, we have allocated materialamounts of the related purchase prices to goodwill and other intangible assets that are considered tohave indefinite useful lives. These assets are tested for impairment at least annually, using estimatesand assumptions affected by factors such as economic and industry conditions and changes in operatingperformance. In the event that the adverse financial impact of current trends with respect to our U.K.business continue and are worse than we anticipate, we may be required to record impairment charges.These charges could be material and could adversely impact our results of operations.
ITEM 1B. Unresolved Staff Comments
None.
24
ITEM 2. Properties
As of December 30, 2007, our major facilities were:
Facility Location Character
CanadaAdministrative Offices . . . . . . . . . Toronto, Ontario Canada Segment Headquarters
Montreal, Quebec Corporate Headquarters
Brewery / packaging plants . . . . . St Johns, Newfoundland Packaged malt beveragesMontreal, QuebecCreemore, OntarioMoncton, New BrunswickToronto, OntarioVancouver, British Columbia
Retail stores . . . . . . . . . . . . . . . . Ontario Province(1) Beer retail stores
Distribution warehouses . . . . . . . Quebec Province(2) Distribution centersOntario Province(3)
United States
Administrative Offices . . . . . . . . . Golden, Colorado U.S. Segment HeadquartersDenver, Colorado(4) Corporate Headquarters
Brewery / packaging plants . . . . . Golden, Colorado Malt beverages / packaged maltElkton, Virginia beverages
Can and end plant . . . . . . . . . . . Golden, Colorado Aluminum cans and ends
Bottle plant . . . . . . . . . . . . . . . . Wheat Ridge, Colorado Glass bottles
Distributorship locations . . . . . . . Meridian, Idaho(5) Wholesale beer distributionGlenwood Springs, ColoradoDenver, Colorado
Distribution warehouses . . . . . . . Golden, Colorado Distribution centersElkton, Virginia
Europe
Administrative Office . . . . . . . . . Burton-on-Trent, Staffordshire Europe Segment Headquarters
Brewery / packaging plants . . . . . Burton-on-Trent, Staffordshire Malt and spirit-based beverages /Tadcaster Brewery, Yorkshire packaged malt beveragesAlton Brewery, Hampshire
Malting / grain silos . . . . . . . . . . Burton-on-Trent, Staffordshire Malting facility
Distribution warehouse . . . . . . . . Burton-on-Trent, Staffordshire Distribution center
(1) Approximately 440 stores owned or leased by BRI joint venture in various locations in OntarioProvince.
(2) We own 18 warehouses and lease one additional distribution center in the Quebec Province.
(3) We have six warehouses owned or leased by our BRI joint venture and one warehouse owned byMolson in the Ontario Province.
25
(4) Leased facility.
(5) Facility under contract to be sold in March 2008.
We believe our facilities are well maintained and suitable for their respective operations. In 2007,our operating facilities were not capacity constrained.
ITEM 3. Legal Proceedings
Beginning in May 2005, several purported shareholder class actions were filed in the United Statesand Canada, including Federal courts in Delaware and Colorado and provincial courts in Ontario andQuebec, alleging, among other things, that the Company and its affiliated entities, includingMolson Inc., and certain officers and directors misled stockholders by failing to disclose first quarter(January-March) 2005 U.S. business trends prior to the Merger vote in January 2005. The Coloradocase has since been transferred to Delaware and consolidated with those cases. One of the lawsuitsfiled in Delaware federal court also alleges that the Company failed to comply with U.S. GAAP in itsfilings with the U.S. Securities and Exchange Commission. The Quebec Superior Court heardarguments in October 2007 regarding the plaintiffs’ motion to authorize a class in that case. Weopposed the motion. We expect a written decision in several months. The Company believes theselawsuits are without merit and will vigorously defend them.
MCBC and many other brewers and distilled spirits manufacturers were sued in various courtsregarding advertising practices and underage consumption. All of the suits were brought by the samelaw firm and allege that each defendant intentionally marketed its products to ‘‘children and otherunderage consumers.’’ In essence, each suit sought, on behalf of an undefined class of parents andguardians, an injunction and unspecified money damages. In each suit, the manufacturers advancedmotions for dismissal to the courts. All of the lawsuits have been dismissed with prejudice.
We are involved in other disputes and legal actions arising in the ordinary course of our business.While it is not feasible to predict or determine the outcome of these proceedings, in our opinion, basedon a review with legal counsel, none of these disputes and legal actions is expected to have a materialimpact on our consolidated financial position, results of operations or cash flows. However, litigation issubject to inherent uncertainties, and an adverse result in these or other matters, for example, includingthe above-described advertising practices case, may arise from time to time that may harm our business.
ITEM 4. Submission of Matters to a Vote of Security Holders
In connection with entering into the MillerCoors joint venture transaction, certain stockholdersaffiliated with members of the Coors and Molson families, and collectively owning a majority of theoutstanding Molson Coors’ Class A common and exchangeable shares, executed and deliveredstockholder consents approving the transaction. However, the Company does not expect that it willneed to rely on such consent in connection with the transaction and, in any event, will not need anyvote or consent from any other stockholders in connection with the transaction.
26
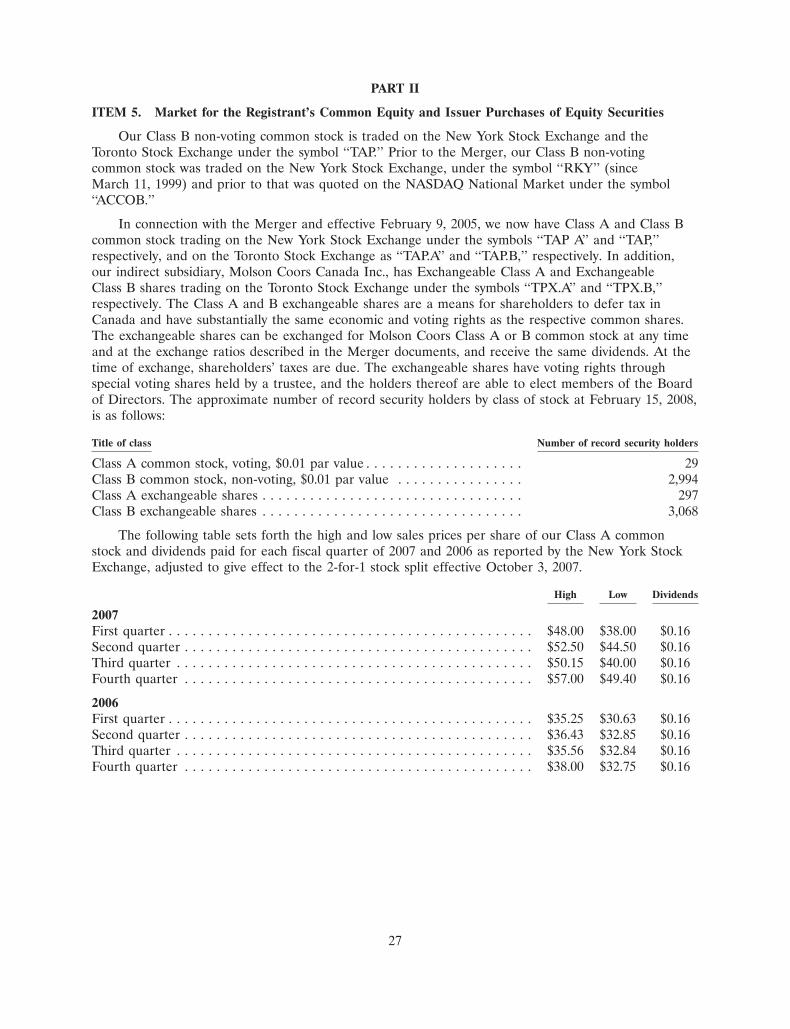
PART II
ITEM 5. Market for the Registrant’s Common Equity and Issuer Purchases of Equity Securities
Our Class B non-voting common stock is traded on the New York Stock Exchange and theToronto Stock Exchange under the symbol ‘‘TAP.’’ Prior to the Merger, our Class B non-votingcommon stock was traded on the New York Stock Exchange, under the symbol ‘‘RKY’’ (sinceMarch 11, 1999) and prior to that was quoted on the NASDAQ National Market under the symbol‘‘ACCOB.’’
In connection with the Merger and effective February 9, 2005, we now have Class A and Class Bcommon stock trading on the New York Stock Exchange under the symbols ‘‘TAP A’’ and ‘‘TAP,’’respectively, and on the Toronto Stock Exchange as ‘‘TAP.A’’ and ‘‘TAP.B,’’ respectively. In addition,our indirect subsidiary, Molson Coors Canada Inc., has Exchangeable Class A and ExchangeableClass B shares trading on the Toronto Stock Exchange under the symbols ‘‘TPX.A’’ and ‘‘TPX.B,’’respectively. The Class A and B exchangeable shares are a means for shareholders to defer tax inCanada and have substantially the same economic and voting rights as the respective common shares.The exchangeable shares can be exchanged for Molson Coors Class A or B common stock at any timeand at the exchange ratios described in the Merger documents, and receive the same dividends. At thetime of exchange, shareholders’ taxes are due. The exchangeable shares have voting rights throughspecial voting shares held by a trustee, and the holders thereof are able to elect members of the Boardof Directors. The approximate number of record security holders by class of stock at February 15, 2008,is as follows:
Title of class Number of record security holders
Class A common stock, voting, $0.01 par value . . . . . . . . . . . . . . . . . . . . 29Class B common stock, non-voting, $0.01 par value . . . . . . . . . . . . . . . . 2,994Class A exchangeable shares . . . . . . . . . . . . . . . . . . . . . . . . . . . . . . . . . 297Class B exchangeable shares . . . . . . . . . . . . . . . . . . . . . . . . . . . . . . . . . 3,068
The following table sets forth the high and low sales prices per share of our Class A commonstock and dividends paid for each fiscal quarter of 2007 and 2006 as reported by the New York StockExchange, adjusted to give effect to the 2-for-1 stock split effective October 3, 2007.
High Low Dividends
2007First quarter . . . . . . . . . . . . . . . . . . . . . . . . . . . . . . . . . . . . . . . . . . . . . . $48.00 $38.00 $0.16Second quarter . . . . . . . . . . . . . . . . . . . . . . . . . . . . . . . . . . . . . . . . . . . . $52.50 $44.50 $0.16Third quarter . . . . . . . . . . . . . . . . . . . . . . . . . . . . . . . . . . . . . . . . . . . . . $50.15 $40.00 $0.16Fourth quarter . . . . . . . . . . . . . . . . . . . . . . . . . . . . . . . . . . . . . . . . . . . . $57.00 $49.40 $0.16
2006First quarter . . . . . . . . . . . . . . . . . . . . . . . . . . . . . . . . . . . . . . . . . . . . . . $35.25 $30.63 $0.16Second quarter . . . . . . . . . . . . . . . . . . . . . . . . . . . . . . . . . . . . . . . . . . . . $36.43 $32.85 $0.16Third quarter . . . . . . . . . . . . . . . . . . . . . . . . . . . . . . . . . . . . . . . . . . . . . $35.56 $32.84 $0.16Fourth quarter . . . . . . . . . . . . . . . . . . . . . . . . . . . . . . . . . . . . . . . . . . . . $38.00 $32.75 $0.16
27
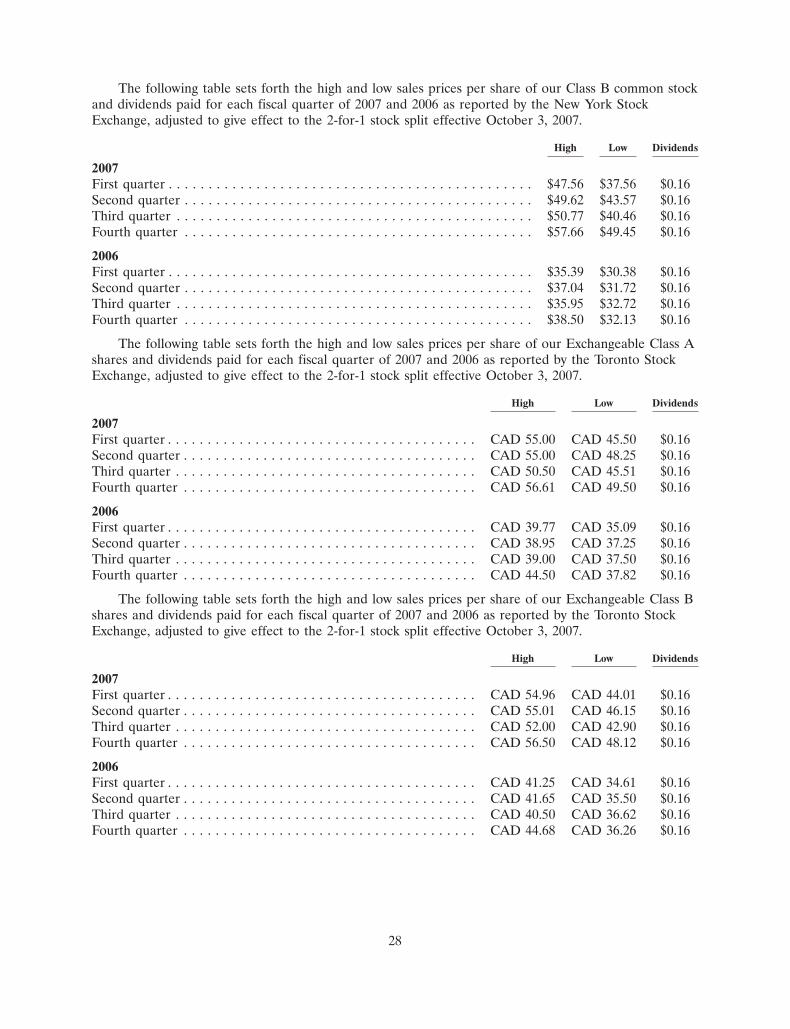
The following table sets forth the high and low sales prices per share of our Class B common stockand dividends paid for each fiscal quarter of 2007 and 2006 as reported by the New York StockExchange, adjusted to give effect to the 2-for-1 stock split effective October 3, 2007.
High Low Dividends
2007First quarter . . . . . . . . . . . . . . . . . . . . . . . . . . . . . . . . . . . . . . . . . . . . . . $47.56 $37.56 $0.16Second quarter . . . . . . . . . . . . . . . . . . . . . . . . . . . . . . . . . . . . . . . . . . . . $49.62 $43.57 $0.16Third quarter . . . . . . . . . . . . . . . . . . . . . . . . . . . . . . . . . . . . . . . . . . . . . $50.77 $40.46 $0.16Fourth quarter . . . . . . . . . . . . . . . . . . . . . . . . . . . . . . . . . . . . . . . . . . . . $57.66 $49.45 $0.16
2006First quarter . . . . . . . . . . . . . . . . . . . . . . . . . . . . . . . . . . . . . . . . . . . . . . $35.39 $30.38 $0.16Second quarter . . . . . . . . . . . . . . . . . . . . . . . . . . . . . . . . . . . . . . . . . . . . $37.04 $31.72 $0.16Third quarter . . . . . . . . . . . . . . . . . . . . . . . . . . . . . . . . . . . . . . . . . . . . . $35.95 $32.72 $0.16Fourth quarter . . . . . . . . . . . . . . . . . . . . . . . . . . . . . . . . . . . . . . . . . . . . $38.50 $32.13 $0.16
The following table sets forth the high and low sales prices per share of our Exchangeable Class Ashares and dividends paid for each fiscal quarter of 2007 and 2006 as reported by the Toronto StockExchange, adjusted to give effect to the 2-for-1 stock split effective October 3, 2007.
High Low Dividends
2007First quarter . . . . . . . . . . . . . . . . . . . . . . . . . . . . . . . . . . . . . . . CAD 55.00 CAD 45.50 $0.16Second quarter . . . . . . . . . . . . . . . . . . . . . . . . . . . . . . . . . . . . . CAD 55.00 CAD 48.25 $0.16Third quarter . . . . . . . . . . . . . . . . . . . . . . . . . . . . . . . . . . . . . . CAD 50.50 CAD 45.51 $0.16Fourth quarter . . . . . . . . . . . . . . . . . . . . . . . . . . . . . . . . . . . . . CAD 56.61 CAD 49.50 $0.16
2006First quarter . . . . . . . . . . . . . . . . . . . . . . . . . . . . . . . . . . . . . . . CAD 39.77 CAD 35.09 $0.16Second quarter . . . . . . . . . . . . . . . . . . . . . . . . . . . . . . . . . . . . . CAD 38.95 CAD 37.25 $0.16Third quarter . . . . . . . . . . . . . . . . . . . . . . . . . . . . . . . . . . . . . . CAD 39.00 CAD 37.50 $0.16Fourth quarter . . . . . . . . . . . . . . . . . . . . . . . . . . . . . . . . . . . . . CAD 44.50 CAD 37.82 $0.16
The following table sets forth the high and low sales prices per share of our Exchangeable Class Bshares and dividends paid for each fiscal quarter of 2007 and 2006 as reported by the Toronto StockExchange, adjusted to give effect to the 2-for-1 stock split effective October 3, 2007.
High Low Dividends
2007First quarter . . . . . . . . . . . . . . . . . . . . . . . . . . . . . . . . . . . . . . . CAD 54.96 CAD 44.01 $0.16Second quarter . . . . . . . . . . . . . . . . . . . . . . . . . . . . . . . . . . . . . CAD 55.01 CAD 46.15 $0.16Third quarter . . . . . . . . . . . . . . . . . . . . . . . . . . . . . . . . . . . . . . CAD 52.00 CAD 42.90 $0.16Fourth quarter . . . . . . . . . . . . . . . . . . . . . . . . . . . . . . . . . . . . . CAD 56.50 CAD 48.12 $0.16
2006First quarter . . . . . . . . . . . . . . . . . . . . . . . . . . . . . . . . . . . . . . . CAD 41.25 CAD 34.61 $0.16Second quarter . . . . . . . . . . . . . . . . . . . . . . . . . . . . . . . . . . . . . CAD 41.65 CAD 35.50 $0.16Third quarter . . . . . . . . . . . . . . . . . . . . . . . . . . . . . . . . . . . . . . CAD 40.50 CAD 36.62 $0.16Fourth quarter . . . . . . . . . . . . . . . . . . . . . . . . . . . . . . . . . . . . . CAD 44.68 CAD 36.26 $0.16
28
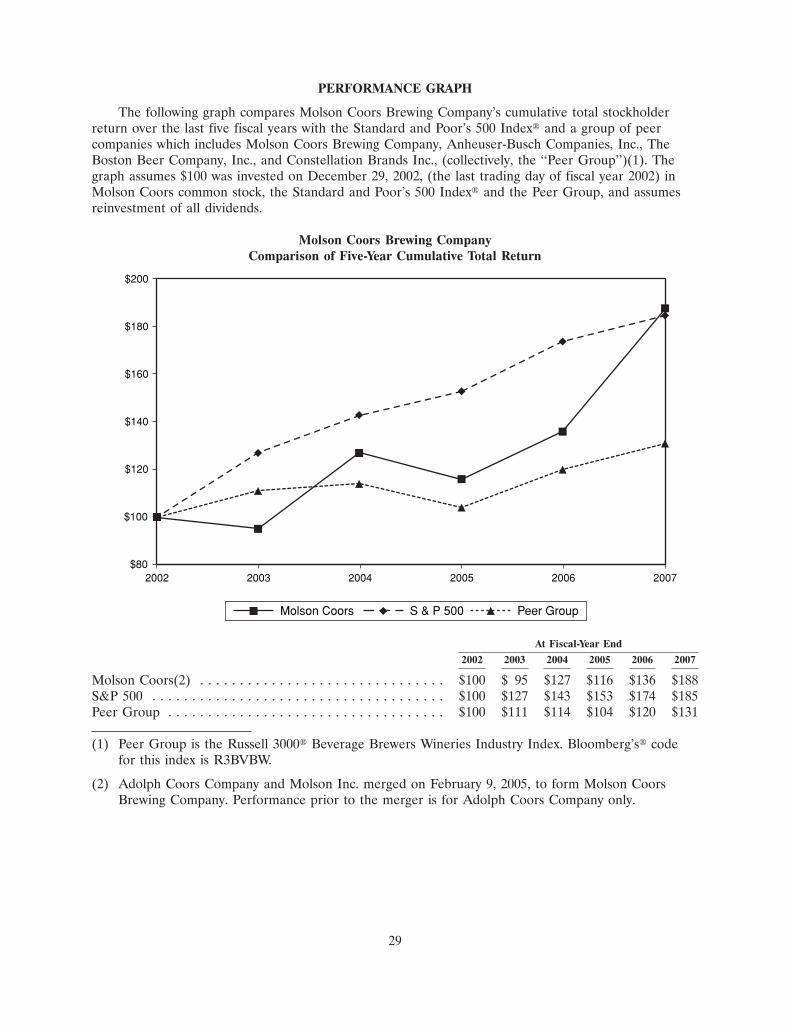
16FEB200802190955
PERFORMANCE GRAPH
The following graph compares Molson Coors Brewing Company’s cumulative total stockholderreturn over the last five fiscal years with the Standard and Poor’s 500 Index� and a group of peercompanies which includes Molson Coors Brewing Company, Anheuser-Busch Companies, Inc., TheBoston Beer Company, Inc., and Constellation Brands Inc., (collectively, the ‘‘Peer Group’’)(1). Thegraph assumes $100 was invested on December 29, 2002, (the last trading day of fiscal year 2002) inMolson Coors common stock, the Standard and Poor’s 500 Index� and the Peer Group, and assumesreinvestment of all dividends.
Molson Coors Brewing CompanyComparison of Five-Year Cumulative Total Return
2002
$200
$160
$180
$140
$120
$80
$100
2003 2004 2005 2006 2007
Peer GroupMolson Coors S & P 500
At Fiscal-Year End
2002 2003 2004 2005 2006 2007
Molson Coors(2) . . . . . . . . . . . . . . . . . . . . . . . . . . . . . . . $100 $ 95 $127 $116 $136 $188S&P 500 . . . . . . . . . . . . . . . . . . . . . . . . . . . . . . . . . . . . . $100 $127 $143 $153 $174 $185Peer Group . . . . . . . . . . . . . . . . . . . . . . . . . . . . . . . . . . . $100 $111 $114 $104 $120 $131
(1) Peer Group is the Russell 3000� Beverage Brewers Wineries Industry Index. Bloomberg’s� codefor this index is R3BVBW.
(2) Adolph Coors Company and Molson Inc. merged on February 9, 2005, to form Molson CoorsBrewing Company. Performance prior to the merger is for Adolph Coors Company only.
29
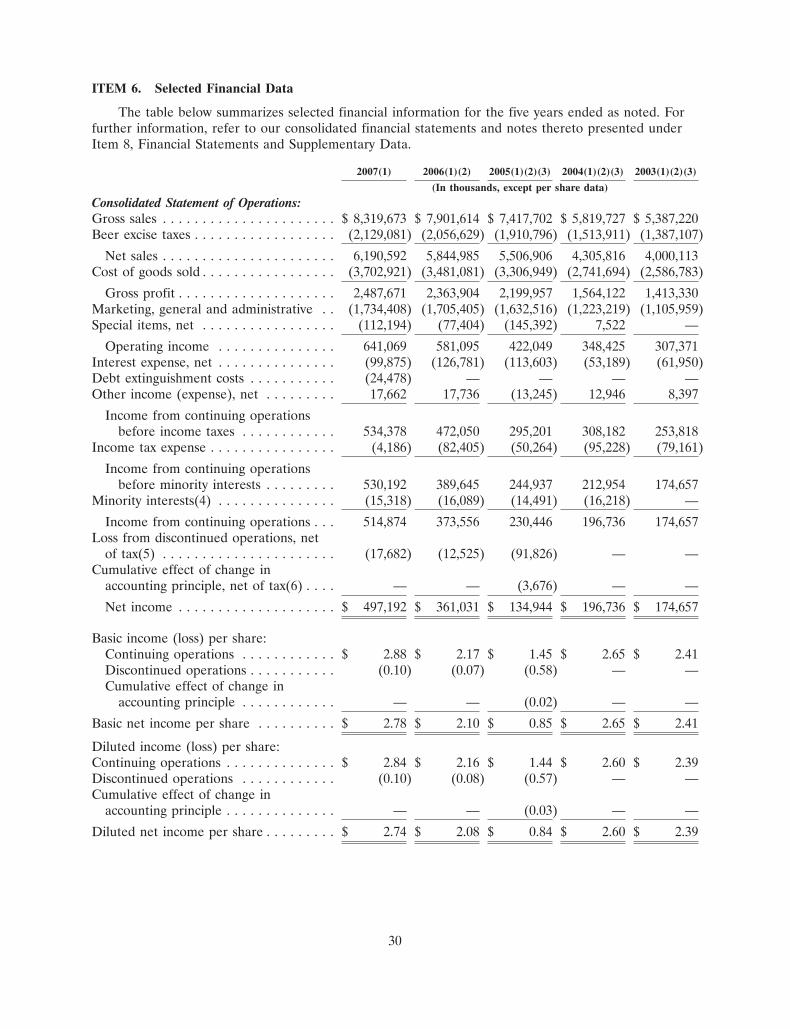
ITEM 6. Selected Financial Data
The table below summarizes selected financial information for the five years ended as noted. Forfurther information, refer to our consolidated financial statements and notes thereto presented underItem 8, Financial Statements and Supplementary Data.
2007(1) 2006(1)(2) 2005(1)(2)(3) 2004(1)(2)(3) 2003(1)(2)(3)
(In thousands, except per share data)
Consolidated Statement of Operations:Gross sales . . . . . . . . . . . . . . . . . . . . . . $ 8,319,673 $ 7,901,614 $ 7,417,702 $ 5,819,727 $ 5,387,220Beer excise taxes . . . . . . . . . . . . . . . . . . (2,129,081) (2,056,629) (1,910,796) (1,513,911) (1,387,107)
Net sales . . . . . . . . . . . . . . . . . . . . . . 6,190,592 5,844,985 5,506,906 4,305,816 4,000,113Cost of goods sold . . . . . . . . . . . . . . . . . (3,702,921) (3,481,081) (3,306,949) (2,741,694) (2,586,783)
Gross profit . . . . . . . . . . . . . . . . . . . . 2,487,671 2,363,904 2,199,957 1,564,122 1,413,330Marketing, general and administrative . . (1,734,408) (1,705,405) (1,632,516) (1,223,219) (1,105,959)Special items, net . . . . . . . . . . . . . . . . . (112,194) (77,404) (145,392) 7,522 —
Operating income . . . . . . . . . . . . . . . 641,069 581,095 422,049 348,425 307,371Interest expense, net . . . . . . . . . . . . . . . (99,875) (126,781) (113,603) (53,189) (61,950)Debt extinguishment costs . . . . . . . . . . . (24,478) — — — —Other income (expense), net . . . . . . . . . 17,662 17,736 (13,245) 12,946 8,397
Income from continuing operationsbefore income taxes . . . . . . . . . . . . 534,378 472,050 295,201 308,182 253,818
Income tax expense . . . . . . . . . . . . . . . . (4,186) (82,405) (50,264) (95,228) (79,161)
Income from continuing operationsbefore minority interests . . . . . . . . . 530,192 389,645 244,937 212,954 174,657
Minority interests(4) . . . . . . . . . . . . . . . (15,318) (16,089) (14,491) (16,218) —
Income from continuing operations . . . 514,874 373,556 230,446 196,736 174,657Loss from discontinued operations, net
of tax(5) . . . . . . . . . . . . . . . . . . . . . . (17,682) (12,525) (91,826) — —Cumulative effect of change in
accounting principle, net of tax(6) . . . . — — (3,676) — —
Net income . . . . . . . . . . . . . . . . . . . . $ 497,192 $ 361,031 $ 134,944 $ 196,736 $ 174,657
Basic income (loss) per share:Continuing operations . . . . . . . . . . . . $ 2.88 $ 2.17 $ 1.45 $ 2.65 $ 2.41Discontinued operations . . . . . . . . . . . (0.10) (0.07) (0.58) — —Cumulative effect of change in
accounting principle . . . . . . . . . . . . — — (0.02) — —
Basic net income per share . . . . . . . . . . $ 2.78 $ 2.10 $ 0.85 $ 2.65 $ 2.41
Diluted income (loss) per share:Continuing operations . . . . . . . . . . . . . . $ 2.84 $ 2.16 $ 1.44 $ 2.60 $ 2.39Discontinued operations . . . . . . . . . . . . (0.10) (0.08) (0.57) — —Cumulative effect of change in
accounting principle . . . . . . . . . . . . . . — — (0.03) — —
Diluted net income per share . . . . . . . . . $ 2.74 $ 2.08 $ 0.84 $ 2.60 $ 2.39
30

2007(1) 2006(1)(2) 2005(1)(2)(3) 2004(1)(2)(3) 2003(1)(2)(3)
(In thousands, except per share data)
Consolidated Balance Sheet data:Cash and cash equivalents . . . . . . . . . . . $ 377,023 $ 182,186 $ 39,413 $ 123,013 $ 19,440Working capital (deficit) . . . . . . . . . . . . $ 41,237 $ (341,760) $ (768,374) $ 91,319 $ (54,874)Total assets . . . . . . . . . . . . . . . . . . . . . . $13,451,566 $11,603,413 $11,799,265 $ 4,657,524 $ 4,444,740Current portion of long-term debt and
other short-term borrowings . . . . . . . . $ 4,281 $ 4,441 $ 348,102 $ 38,528 $ 91,165Long-term debt . . . . . . . . . . . . . . . . . . . $ 2,260,596 $ 2,129,845 $ 2,136,668 $ 893,678 $ 1,159,838Stockholder’s equity . . . . . . . . . . . . . . . $ 7,149,391 $ 5,817,356 $ 5,324,717 $ 1,601,166 $ 1,267,376
Consolidated Cash Flow data:Cash provided by operations . . . . . . . . . $ 616,037 $ 833,244 $ 422,275 $ 499,908 $ 528,828Cash used in investing activities . . . . . . . $ (439,147) $ (294,813) $ (312,708) $ (67,448) $ (214,614)Cash provided by (used in) financing
activities . . . . . . . . . . . . . . . . . . . . . . $ 8,435 $ (401,239) $ (188,775) $ (335,664) $ (357,393)
Other information:Barrels of beer and other beverages sold 42,051 42,143 40,431 32,703 32,735Dividends per share of common stock . . $ 0.64 $ 0.64 $ 0.64 $ 0.41 $ 0.41Depreciation and amortization . . . . . . . . $ 345,843 $ 438,354 $ 392,814 $ 265,921 $ 236,821Capital expenditures and additions to
intangible assets . . . . . . . . . . . . . . . . . $ 428,349 $ 446,376 $ 406,045 $ 211,530 $ 240,458
(1) 52-weeks reflected in 2007 and 2005 to 2003 versus 53-weeks included in 2006.
(2) Share and per share amounts have been adjusted from previously reported amounts to reflect a2-for-1 stock split issued in the form of a stock dividend effective October 3, 2007.
(3) Results prior to February 9, 2005 exclude Molson, Inc.
(4) Minority interests in net income of consolidated entities represents the minority owners’ share ofincome generated in 2007, 2006 and 2005 by BRI, RMBC, RMMC and Grolsch joint ventures andin 2004 by RMBC, RMMC and Grolsch joint ventures, which were consolidated for the first timein 2004 under FIN46R.
(5) Results of operations of our former Brazil segment in 2006 and 2005, prior to the sale in Januaryof 2006 but subsequent to the Merger in February 2005. See related Note 4 to the ConsolidatedFinancial Statements in Item 8.
(6) Effect of implementing FASB Interpretation No. 47 ‘‘Accounting for Conditional Asset RetirementObligations, an interpretation of FASB Statement No. 143’’ (‘‘FIN 47’’) in the fourth quarter of2005.
31
ITEM 7. Management’s Discussion and Analysis of Financial Condition and Results of Operations
Executive Summary
The following table highlights summarized components of our condensed consolidated summary ofoperations for the years ended December 30, 2007, December 31, 2006 and December 25, 2005.
For the Years Ended
December 30, % December 31, % December 25,2007 change 2006(1) change 2005(1)
(In thousands, except percentages and per share data)
Volume in barrels . . . . . . . . . . . . . . . . . . 42,051 (0.2)% 42,143 4.2% 40,431
Net sales . . . . . . . . . . . . . . . . . . . . . . . . $6,190,592 5.9% $5,844,985 6.1% $5,506,906
Income from continuing operations . . . . . $ 514,874 37.8% $ 373,556 62.1% $ 230,446
Diluted income per share from continuingoperations . . . . . . . . . . . . . . . . . . . . . . $ 2.84 31.5% $ 2.16 50.0% $ 1.44
(1) Per share amounts have been adjusted from previously reported amounts for the effect of our2-for-1 stock split issued in the form of a stock dividend on October 3, 2007.
The 53rd week in our fiscal 2006 increased total company sales volume by approximately 600,000barrels and increased reported pre-tax profit of $472.1 million by approximately $6 million.
2007 Key Financial Highlights:
Our performance in 2007 demonstrated that our brand growth strategies and cost-reduction effortscontinue to strengthen our competitive capabilities and financial performance. We achieved revenueand profit growth, despite substantial competitive and inflationary cost challenges in each of our majormarkets. We achieved several critical successes in 2007:
• Coors Light grew (comparable) sales to retail (‘‘STR’’) nearly 4% globally for the year—andmore than 5% for the second half of the year.
• We posted total-company net sales growth of nearly 6% in 2007, driven by brand strength,positive pricing and the benefit of favorable foreign currency.
• We grew net pricing in all three of our businesses on the strength of our brands and sales teamperformance.
• We reduced costs and improved service to our customers by closing our brewery in Edmonton,Alberta, and opening breweries in Moncton, New Brunswick, and Elkton, Virginia.
• We continued to invest at a high level in our brands and sales capabilities in each of oursegments.
• We improved our financial foundation and reduced interest and other non-operating expenses bymore than $26 million annually by refinancing one-fourth of our debt, making substantialvoluntary pension contributions, and streamlining our corporate legal structure.
• Our U.S business stayed focused and achieved favorable STRs and market-share growth fromeach of our four largest brands. Our U.S. portfolio also showed broad geographic strength bygrowing STRs in all major channels and in 45 out of 50 states.
• We grew market share in the U.S. in 2007.
32
• Our Canadian business gained market share on a full-year basis for the first time in six yearsand for only the second time in 17 years, driven by Coors Light and our other strategic brands.At the same time, we continued to strategically increase net pricing in a highly competitivemarket, based on the growing strength of our brands.
• An important achievement for future growth was the Canada team’s success in securing each ofour major partner brands in Canada for the long term. These include the three largest importbrands in Canada: Corona, Heineken and Miller Genuine Draft.
Synergies and other cost savings initiatives
First, we exceeded our three-year $175 million merger synergies target and wrapped up thisprogram with $180 million of savings delivered, including an incremental $5 million of merger-relatedsynergies in 2007. Second, we are already ahead of schedule on our three-year, $250 million Resourcesfor Growth cost reduction initiatives. We achieved $91 million of savings during 2007, the first year ofthe program, which is $25 million more than the initial 2007 target. We exceeded our first-year costtarget by more than 37% by accelerating a number of our cost reduction programs, particularly in ourNorth American supply chain. Combining both cost reduction programs, we captured $146 million intotal 2007 savings.
Components of our Statement of Operations
Net sales—Our net sales represent almost exclusively the sale of beer and other malt beverages, thevast majority of which are brands that we own and brew ourselves. We import or brew and sell certainnon-owned partner brands under licensing and related arrangements. We also sell certain ‘‘factored’’brands, as a distributor, to on-premise customers in the United Kingdom (Europe segment).
Cost of goods sold—Our cost of goods sold include costs we incur to make and ship beer. Thesecosts include brewing materials, such as barley, in the United States and United Kingdom where wemanufacture the majority of our own malt. In Canada, we purchase malt from third parties. Hops andvarious grains are other key brewing materials purchased by all of our segments. Packaging materials,including costs for glass bottles, aluminum and steel cans, and cardboard and paperboard are alsoincluded in our cost of goods sold. Our cost of goods sold also include both direct and indirect labor,freight costs, utilities, maintenance costs, and other manufacturing overheads, as well as the cost of‘‘factored’’ brands.
Marketing, general and administrative—These costs include media advertising (television, radio,print), tactical advertising (signs, banners, point-of-sale materials) and promotion costs planned andexecuted on both local and national levels within our operating segments. These costs also include oursales organizations, including labor and other overheads. This classification also includes general andadministrative costs for functions such as finance, legal, human resources and information technology,which consist primarily of labor and outside services.
Special Items—These are unique, infrequent and unusual items which affect our statement ofoperations, and are discussed in each segment’s Results of Operations discussion.
Interest expense, net—Interest costs associated with borrowings to finance our operations areclassified here. Interest income in the Europe segment is associated with trade loans receivable fromcustomers.
Debt extinguishment costs—The costs are associated with payments to settle the notes at fair valuegiven interest rates at the time of extinguishment, incentive payments to note holders for earlytendering of the notes, and a write-off of the proportionate amount of unamortized discount andissuance fees associated with the extinguished debt.
33
Other income (expense)—This classification includes primarily gains and losses associated withactivities not directly related to brewing and selling beer. For instance, gains or losses on sales ofnon-operating assets, our share of income or loss associated with our ownership in Tradeteam and theMontreal Canadiens hockey club, and certain foreign exchange gains and losses are classified here.
Discussions of statement of operations line items such as minority interests, discontinuedoperations and cumulative effect of a change in accounting principle are discussed in detail elsewherein MD&A and in the Notes to the Consolidated Financial Statements in Item 8.
Depreciation
We realized a 6% decrease related to depreciation and amortization expense of assets in 2007versus 2006 excluding special items, due to the net effect of five factors:
• Substantial existing assets became fully depreciated, so expense related to these assets wassignificantly lower in 2007 than 2006.
• Adding packaging capacity in our Toronto and Virginia facilities during 2006 and brewingcapacity in our Virginia facility in the first half of 2007.
• We evaluated the estimated useful lives of a substantial portion of our property, plant andequipment on a global basis, in light of improvements in maintenance, new technology andchanges in expected patterns of usage. The lengthening of certain depreciable asset lives as aresult of this evaluation resulted in a reduction of our consolidated depreciation expense for thefull year 2007.
• Installing cold dispense units in pubs and restaurants in the U.K. resulted in a year over yearincrease.
• Purchase of the keg population in the U.K. increased depreciation in the Europe segment.
Depreciation and amortization expense increased approximately 4% from 2005 to 2006 excludingspecial items.
Income Taxes
Our full year effective tax rate was approximately 1% in 2007 and 17% in both 2006 and 2005.Our 2007 and 2006 effective tax rates were significantly lower than the federal statutory rate of 35%primarily due to the following: lower effective income tax rates applicable to our Canadian and U.K.businesses, and one time benefits from revaluing our deferred tax assets and liabilities to give effect toreductions in foreign income tax rates and tax law changes. Our 2005 effective tax rate was lower thanthe federal statutory rate of 35% primarily due to lower income tax rates applicable to our Canadianand U.K. businesses and a one time benefit resulting from the reversal of a previously recognizeddeferred tax liability due to our election to treat our portion of all foreign subsidiary earnings throughDecember 25, 2005, as permanently reinvested under the accounting guidance of APB 23 ‘‘Accountingfor Income Taxes—Special Areas’’ and SFAS 109 ‘‘Accounting for Income Taxes.’’
Discontinued Operations
The Company’s former Brazil business, Kaiser, which was acquired as part of the Merger, isreported as a discontinued operation due to the sale of a 83% controlling interest in the business in2006. See Note 4 to the Consolidated Financial Statements in Item 8.
34
The loss from discontinued operations of $17.7 million for the year ended 2007 is composed of thefollowing components:
• A net loss of $20.4 million associated with adjustments to the indemnity liabilities due tochanges in estimates, foreign exchange losses, and accretion expense on discounted amounts.
• A gain of $2.7 million due to an income tax adjustment related to the sale of Kaiser.
The loss from discontinued operations of $12.5 million for the year ended 2006 is composed of thefollowing components:
• Losses generated by Kaiser prior to the sale of $2.3 million.
• A loss on the 2006 sale of the business of $7.2 million.
• Unfavorable adjustments to indemnity liabilities due to foreign exchange fluctuations andchanges in estimates of $3.0 million.
During 2005, Kaiser generated pre-tax losses of $91.8 million, due to operating losses and specialcharges associated with increasing reserves for contingent liabilities.
In conjunction with this transaction, the purchaser (FEMSA) assumed $63 million of financial debtand assumed contingent liabilities of approximately $260 million, related primarily to tax claims, subjectto our indemnification. We have a level of continuing potential exposure to these contingent liabilitiesof Kaiser, as well as previously disclosed but less than probable unaccrued claims, due to certainindemnities provided to FEMSA pursuant to the sales and purchase agreement. While we believe thatall significant contingencies were disclosed as part of the sale process and adequately reserved for onKaiser’s financial statements, resolution of contingencies and claims above reserved or otherwisedisclosed amounts could, under some circumstances, result in additional cash outflows for MolsonCoors because of transaction-related indemnity provisions. We have recorded these indemnity liabilitiesat fair value and have a carrying value at December 30, 2007, of $155.0 million. Due to the uncertaintyinvolved with the ultimate outcome and timing of these contingencies, there could be significantadjustments in the future.
Cumulative Effect of Change in Accounting Principle
Molson Coors has adopted Financial Accounting Standards Board Interpretation No. 47,‘‘Accounting for Conditional Asset Retirement Obligations, an interpretation of FASB Statement No. 143’’(FIN 47) under which companies must recognize potential long-term liabilities related to the eventualretirement of assets. As a result of adopting FIN 47, we recorded a cumulative non-cash expense of$3.7 million, after tax, in the 2005 fourth quarter, reported as Cumulative Effect of Change inAccounting Principle in the Company’s statement of operations. These liabilities represent accumulatedremediation and restoration costs expected to be incurred up to 30 years in the future for anticipatedasset retirements. Costs related to FIN 47 were not significant in 2007 or 2006. We do not expectFIN 47-related expense to have a significant impact on our on-going annual operating results.
Results of Operations
Canada Segment
Our Canada segment consists primarily of Molson’s beer business including the production andsale of the Molson brands, Coors Light and other licensed brands, principally in Canada. The Canadasegment also includes our joint venture arrangements related to the distribution of beer in Ontario,Brewers Retail, Inc. (‘‘BRI’’) (consolidated under FIN 46R), and in the Western provinces, Brewers’Distributor Ltd. (‘‘BDL’’).
35
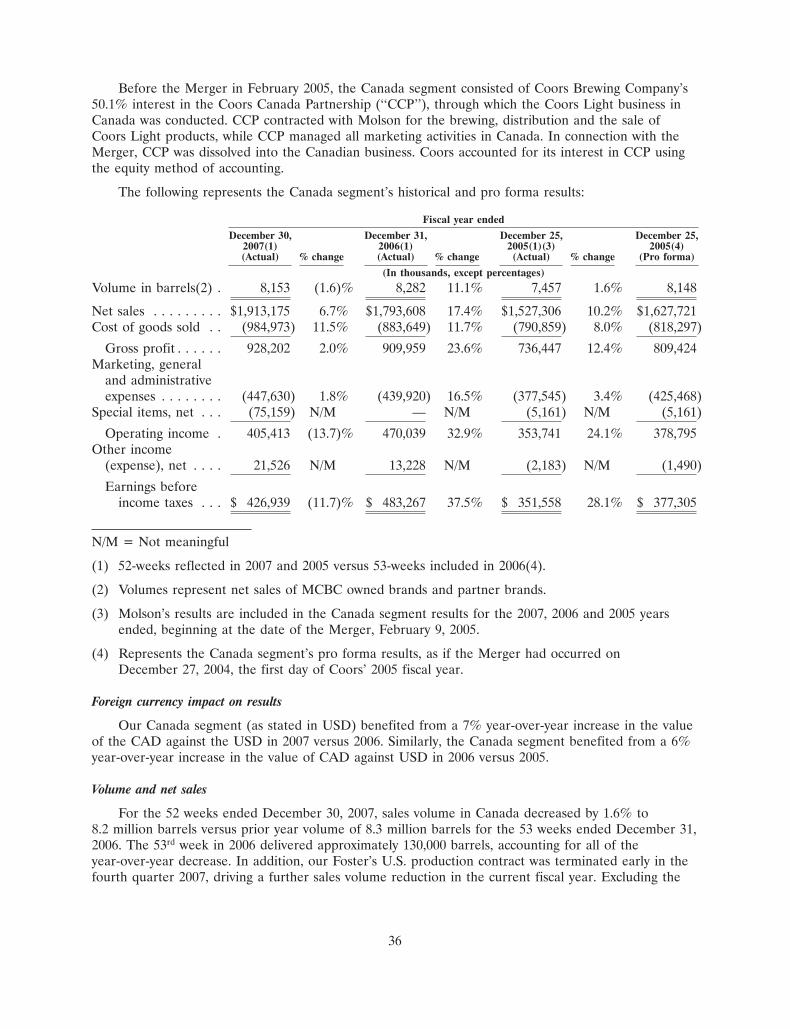
Before the Merger in February 2005, the Canada segment consisted of Coors Brewing Company’s50.1% interest in the Coors Canada Partnership (‘‘CCP’’), through which the Coors Light business inCanada was conducted. CCP contracted with Molson for the brewing, distribution and the sale ofCoors Light products, while CCP managed all marketing activities in Canada. In connection with theMerger, CCP was dissolved into the Canadian business. Coors accounted for its interest in CCP usingthe equity method of accounting.
The following represents the Canada segment’s historical and pro forma results:
Fiscal year ended
December 30, December 31, December 25, December 25,2007(1) 2006(1) 2005(1)(3) 2005(4)(Actual) % change (Actual) % change (Actual) % change (Pro forma)
(In thousands, except percentages)
Volume in barrels(2) . 8,153 (1.6)% 8,282 11.1% 7,457 1.6% 8,148
Net sales . . . . . . . . . $1,913,175 6.7% $1,793,608 17.4% $1,527,306 10.2% $1,627,721Cost of goods sold . . (984,973) 11.5% (883,649) 11.7% (790,859) 8.0% (818,297)
Gross profit . . . . . . 928,202 2.0% 909,959 23.6% 736,447 12.4% 809,424Marketing, general
and administrativeexpenses . . . . . . . . (447,630) 1.8% (439,920) 16.5% (377,545) 3.4% (425,468)
Special items, net . . . (75,159) N/M — N/M (5,161) N/M (5,161)
Operating income . 405,413 (13.7)% 470,039 32.9% 353,741 24.1% 378,795Other income
(expense), net . . . . 21,526 N/M 13,228 N/M (2,183) N/M (1,490)
Earnings beforeincome taxes . . . $ 426,939 (11.7)% $ 483,267 37.5% $ 351,558 28.1% $ 377,305
N/M = Not meaningful
(1) 52-weeks reflected in 2007 and 2005 versus 53-weeks included in 2006(4).
(2) Volumes represent net sales of MCBC owned brands and partner brands.
(3) Molson’s results are included in the Canada segment results for the 2007, 2006 and 2005 yearsended, beginning at the date of the Merger, February 9, 2005.
(4) Represents the Canada segment’s pro forma results, as if the Merger had occurred onDecember 27, 2004, the first day of Coors’ 2005 fiscal year.
Foreign currency impact on results
Our Canada segment (as stated in USD) benefited from a 7% year-over-year increase in the valueof the CAD against the USD in 2007 versus 2006. Similarly, the Canada segment benefited from a 6%year-over-year increase in the value of CAD against USD in 2006 versus 2005.
Volume and net sales
For the 52 weeks ended December 30, 2007, sales volume in Canada decreased by 1.6% to8.2 million barrels versus prior year volume of 8.3 million barrels for the 53 weeks ended December 31,2006. The 53rd week in 2006 delivered approximately 130,000 barrels, accounting for all of theyear-over-year decrease. In addition, our Foster’s U.S. production contract was terminated early in thefourth quarter 2007, driving a further sales volume reduction in the current fiscal year. Excluding the
36
impact of the 53rd week in 2006 and the volume reductions attributable to Foster’s and other exportedvolume, comparable sales volume in Canada increased by approximately 1.5% or 110,000 barrels.
Our Canada STRs for 2007 increased 1.0% versus the prior calendar year driven by mid-single-digit growth of our Molson strategic brands, lead by Coors Light, which experienced high single-digitgrowth compared to the prior year. In addition, the Rickard’s, Creemore and Carling brands, and ourpartner import brands, all grew at double-digit rates on a full year basis. These increases were partiallyoffset by declines in non-strategic brands and other premium brands.
Canada industry volumes grew an estimated 0.9% in 2007 compared to the prior calendar year. Asa result, Molson experienced a slight market share increase on a full year basis, fueled by share growthover the key summer selling period and the strength of our strategic brands. This represents the firsttime Molson has achieved share growth in the past six years.
On a full year basis, 2007 net sales revenue grew $119.6 million or 6.7% versus prior year withapproximately 2% growth in local currency on a per barrel basis.
For the full year, net sales revenue was $234.66 per barrel, an increase of 8.4% over 2006 net salesrevenue of $216.57 per barrel. An approximate 7% appreciation in the value of CAD against USDduring the year increased net sales revenue by approximately $114 million or $14.00 per barrel. Netpricing contributed half of the remaining increase with the year over year impact of modest generalprice increases being partially offset by increased price discounting in Quebec and Ontario during thepast year. Improved sales mix from increased import sales, which are at higher than average retailprices, and decreased export sales, which are at lower than average retail prices, accounted for theremaining net increase. The decrease in export sales can be attributed to the termination of ourFoster’s US production contract in the fourth quarter of 2007.
For the 53 weeks ended December 31, 2006, sales volume in Canada increased by 11.1% to8.3 million barrels versus prior year volume of 7.5 million barrels for the fiscal period beginningFebruary 9, 2005 and ended December 25, 2005. On a pro forma basis, sales volume increased 1.6% to8.3 million barrels versus 2005 pro forma volume of 8.1 million. The 53rd week in 2006 accounted forapproximately 130,000 barrels, providing the year-over-year increase.
On a pro forma basis, Molson strategic brands grew at mid-single-digit rates in 2006, lead by CoorsLight, Rickard’s and our partner import brands, all of which grew at double-digit rates on a full yearbasis. These increases were partially offset by declines in non-strategic brands and other premiumbrands, reductions in contract packaging of non-owned brands for export shipment and thediscontinuation of Molson Kick and A Marca Bavaria.
For the year ended December 31, 2006, net sales revenue was $216.57 per barrel, an increase of8.4% over comparable 2005 net sales revenue of $199.77 per barrel. An approximate 6% appreciationin the value of CAD against USD during the year increased net sales revenue by approximately$115 million. The remainder of the increase was driven by the year over year impact of modest generalprice increases and improved sales mix from increased import sales, which were at higher than averageretail prices. These improvements were partially offset by increased price discounting during the year,predominantly in Ontario and Quebec.
Cost of goods sold and gross profit
Cost of goods sold increased $101.3 million, or 11.5%, in 2007 versus prior year with approximately7% growth in local currency on a per barrel basis.
For the full year, cost of goods sold on a per barrel basis was $120.81 per barrel, an increase of13.2% over 2006 cost of goods sold of $106.70 per barrel. After adjusting for the approximate 7%appreciation in the value of CAD against USD, cost of goods sold increased by slightly less than 7% in
37
2007 in local currency. Inflationary cost increases across nearly all inputs drove approximately 3% ofthe increase in cost of goods sold per barrel, but was completely offset by the implementation ofsynergies and other cost savings initiatives in the year. The impacts of increased import sales, lowerexport sales due to the Foster’s contract termination and non-cash adjustments in both the current andprior years of certain foreign currency positions to their market values account for the increase in costof goods sold per barrel.
Cost of goods sold increased 8.0% to $883.6 million for the year ended December 31, 2006, from$818.3 million in the same period for 2005 on a pro forma basis. For the same period, in localcurrency, cost of goods sold per barrel in Canada decreased approximately 1% as inflationary and othercost increases were completely offset by the implementation of synergies and other cost savingsinitiatives, lower input costs related to favorable foreign currency, and lower employee-related expenses.
Marketing, general and administrative expenses
For the full year, marketing, general and administrative expenses were $447.6 million, an increaseof $7.7 million or 1.8% from 2006. In local currency, total marketing, general and administrativeexpenses decreased by 4% driven by lower G&A costs through reduced intangible amortization expenseand a focus on more efficient general and administrative spending, including lower employee costs andother cost savings. In addition, 2006 included certain nonrecurring costs including contract costsincurred to achieve longer term information technology synergies, and additional costs associated withthe additional week in 2006 results. Promotional spending and brand investments were relatively flat in2007 compared to the prior year.
Marketing, general and administrative expenses increased $62.4 million for 2006. This was anincrease of $14.5 million or 3.4% on a comparable, pro forma basis. In local currency, total marketing,general and administrative expenses decreased by approximately 3.5% due to lower promotionalspending and brand investments in 2006, due in part to the initial promotional launch of Molson Kickand A Marca Bavaria in 2005, and partly to offset price discounting. These costs were partially offsetby higher employee expenses and one-time costs in 2006.
Special items, net
The Canada segment recognized $75.2 million of special items expense during 2007. The specialitems represent $46.5 million relating to the Edmonton brewery closure, in which significant chargesincluded a $31.9 million impairment charge on the carrying value of the fixed assets and an additional$14.6 million charge for severance and other costs associated with closing the brewery. Current plansare to demolish the building and sell the land, which has a carrying value of $10.1 million atDecember 30, 2007. Other charges include $24.1 million relating to the Foster’s intangible assetimpairment and $4.5 million relating to employee termination costs associated with production andsales, general and administrative functions. See Note 8 to the Consolidated Financial Statements inItem 8 for further discussion.
There were no special items in 2006. Special items of $5.2 million in 2005 were attributableprimarily to restructuring the sales and marketing organizations in Canada.
Other (expense) income, net
Other income in 2007 was $8.3 million higher than the prior year largely due to a gain on the saleof our equity investment in the House of Blues Canada which resulted in an approximate $16.7 millionbenefit in the year. This was partially offset by the non-recurrence of the approximate $9.0 million gainin 2006 from the reduction of guarantee liabilities related to our investment in the Montreal Canadienshockey club in the prior year (see next paragraph).
38
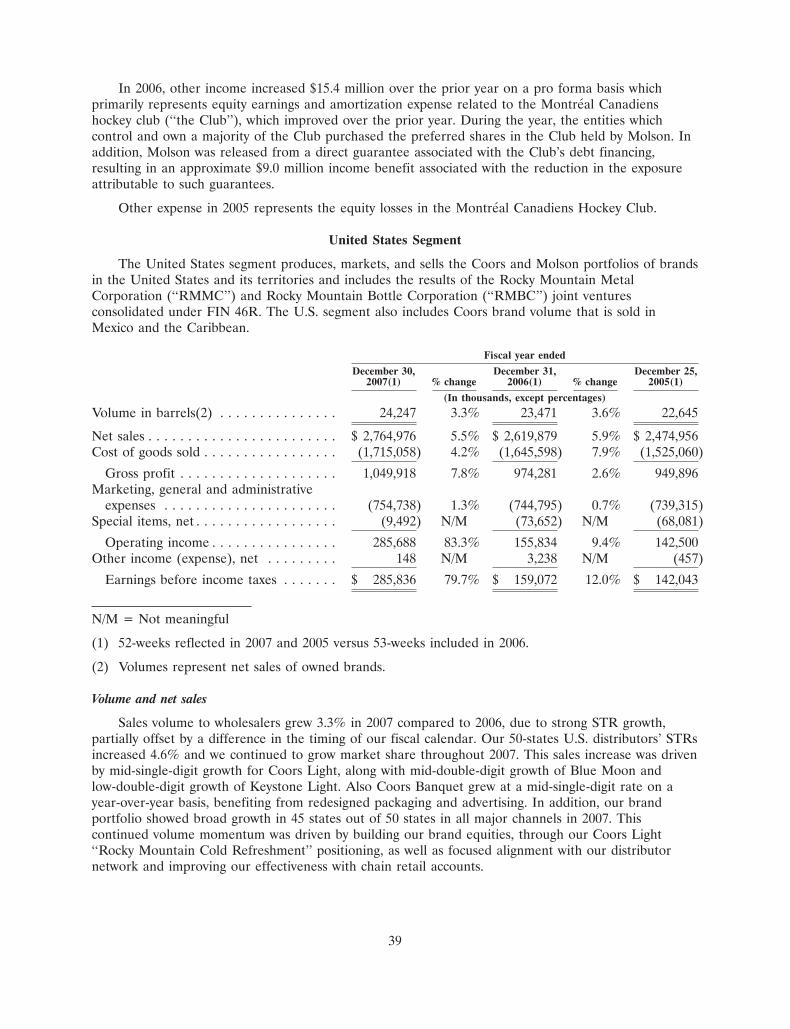
In 2006, other income increased $15.4 million over the prior year on a pro forma basis whichprimarily represents equity earnings and amortization expense related to the Montreal Canadienshockey club (‘‘the Club’’), which improved over the prior year. During the year, the entities whichcontrol and own a majority of the Club purchased the preferred shares in the Club held by Molson. Inaddition, Molson was released from a direct guarantee associated with the Club’s debt financing,resulting in an approximate $9.0 million income benefit associated with the reduction in the exposureattributable to such guarantees.
Other expense in 2005 represents the equity losses in the Montreal Canadiens Hockey Club.
United States Segment
The United States segment produces, markets, and sells the Coors and Molson portfolios of brandsin the United States and its territories and includes the results of the Rocky Mountain MetalCorporation (‘‘RMMC’’) and Rocky Mountain Bottle Corporation (‘‘RMBC’’) joint venturesconsolidated under FIN 46R. The U.S. segment also includes Coors brand volume that is sold inMexico and the Caribbean.
Fiscal year ended
December 30, December 31, December 25,2007(1) % change 2006(1) % change 2005(1)
(In thousands, except percentages)
Volume in barrels(2) . . . . . . . . . . . . . . . 24,247 3.3% 23,471 3.6% 22,645
Net sales . . . . . . . . . . . . . . . . . . . . . . . . $ 2,764,976 5.5% $ 2,619,879 5.9% $ 2,474,956Cost of goods sold . . . . . . . . . . . . . . . . . (1,715,058) 4.2% (1,645,598) 7.9% (1,525,060)
Gross profit . . . . . . . . . . . . . . . . . . . . 1,049,918 7.8% 974,281 2.6% 949,896Marketing, general and administrative
expenses . . . . . . . . . . . . . . . . . . . . . . (754,738) 1.3% (744,795) 0.7% (739,315)Special items, net . . . . . . . . . . . . . . . . . . (9,492) N/M (73,652) N/M (68,081)
Operating income . . . . . . . . . . . . . . . . 285,688 83.3% 155,834 9.4% 142,500Other income (expense), net . . . . . . . . . 148 N/M 3,238 N/M (457)
Earnings before income taxes . . . . . . . $ 285,836 79.7% $ 159,072 12.0% $ 142,043
N/M = Not meaningful
(1) 52-weeks reflected in 2007 and 2005 versus 53-weeks included in 2006.
(2) Volumes represent net sales of owned brands.
Volume and net sales
Sales volume to wholesalers grew 3.3% in 2007 compared to 2006, due to strong STR growth,partially offset by a difference in the timing of our fiscal calendar. Our 50-states U.S. distributors’ STRsincreased 4.6% and we continued to grow market share throughout 2007. This sales increase was drivenby mid-single-digit growth for Coors Light, along with mid-double-digit growth of Blue Moon andlow-double-digit growth of Keystone Light. Also Coors Banquet grew at a mid-single-digit rate on ayear-over-year basis, benefiting from redesigned packaging and advertising. In addition, our brandportfolio showed broad growth in 45 states out of 50 states in all major channels in 2007. Thiscontinued volume momentum was driven by building our brand equities, through our Coors Light‘‘Rocky Mountain Cold Refreshment’’ positioning, as well as focused alignment with our distributornetwork and improving our effectiveness with chain retail accounts.
39
Net sales per barrel increased 2.2% in 2007 due to higher base pricing and reduced discountingcompared to the level of price promotion activity we experienced during 2006 and 2005.
Sales volume to wholesalers grew 3.6% in 2006 compared to 2005. Without the 53rd week in 2006,volume growth would have been approximately 2.2%. The growth was driven by volume increases inthe Coors Light, Keystone Light and Blue Moon brands, and the addition of Molson brands sold in theUnited States. Net sales per barrel increased 2.1% from 2005 to 2006 as a result of favorable pricing.
Cost of goods sold
Cost of goods sold increased marginally to $70.73 per barrel in 2007 versus $70.11 per barrel in2006. The net increase in cost of goods sold was driven by an increase in commodity, transportationand packaging costs, more than 60% offset by our merger synergies and other operations cost-reductioninitiatives.
Cost of goods sold increased by 4.1% to $70.11 per barrel in 2006 from $67.35 per barrel in 2005.The increase in cost of goods sold per barrel was driven by higher freight, diesel fuel, packagingmaterials, and utilities costs. Inflation alone would have accounted for an increase of approximately 5%in cost of goods per barrel. However, these unfavorable factors were partially offset by favorable costtrends from supply chain cost management, labor productivity and merger synergies.
Marketing, general and administrative expenses
Marketing, general and administrative expenses increased by $9.9 million, or 1.3%, in 2007 versus2006. Marketing investments decreased at a low-single-digit rate, while general and administrativeexpenses grew at a mid-single digit rate due to higher employee incentive programs.
Marketing, general and administrative expenses increased by $5.5 million, or 0.7%, in 2006 versus2005. Our stock-based long-term incentive program primarily drove the year-over-year increase, alongwith modest increases in our advertising and sales expenses. The total increase was partially offset byreductions of certain overhead and personnel-related costs.
Special items, net
We recognized $9.5 million of special charges in 2007 compared to $73.7 million of net specialcharges in 2006. In 2007, the special charges were related to employee retention costs in anticipation ofthe proposed MillerCoors joint venture and a newly initiated program focused on long term laborsavings across the supply chain areas. Special items, net, in the U.S. segment in 2006 were associatedprimarily with the closure and sale of the Memphis brewery, completed in the third quarter of 2006. In2006, we recorded approximately $60 million in accelerated depreciation on brewery assets andimpairments of fixed assets, reflecting their sales value, $12.5 million for accruals of severance andother costs associated with the plant closure, and a $3.1 million increase in the estimate of costs towithdraw from a multi-employer pension plan benefiting former Memphis workers. Memphis-relatedaccelerated depreciation was higher in 2006 than in 2005 due to a lower sales price for the Memphisplant than our original estimate in 2005.
The 2006 special items were partially offset by the receipt of a $2.4 million cash distribution frombankruptcy proceedings of a former insurance carrier for a claim related to our environmentalobligations at the Lowry Superfund site in Denver, Colorado. We recorded the cash receipt as a specialbenefit consistent with the classification of the charge recorded in a previous year. The estimatedenvironmental liability associated with this site was not impacted by the proceeds received. See Note 8to the Consolidated Financial Statements in Item 8 for further discussion.
Special items in the U.S. segment in 2005 were associated primarily with the planned closure ofthe Memphis brewery in 2006. We recorded $33.3 million in accelerated depreciation on brewery assets,
40
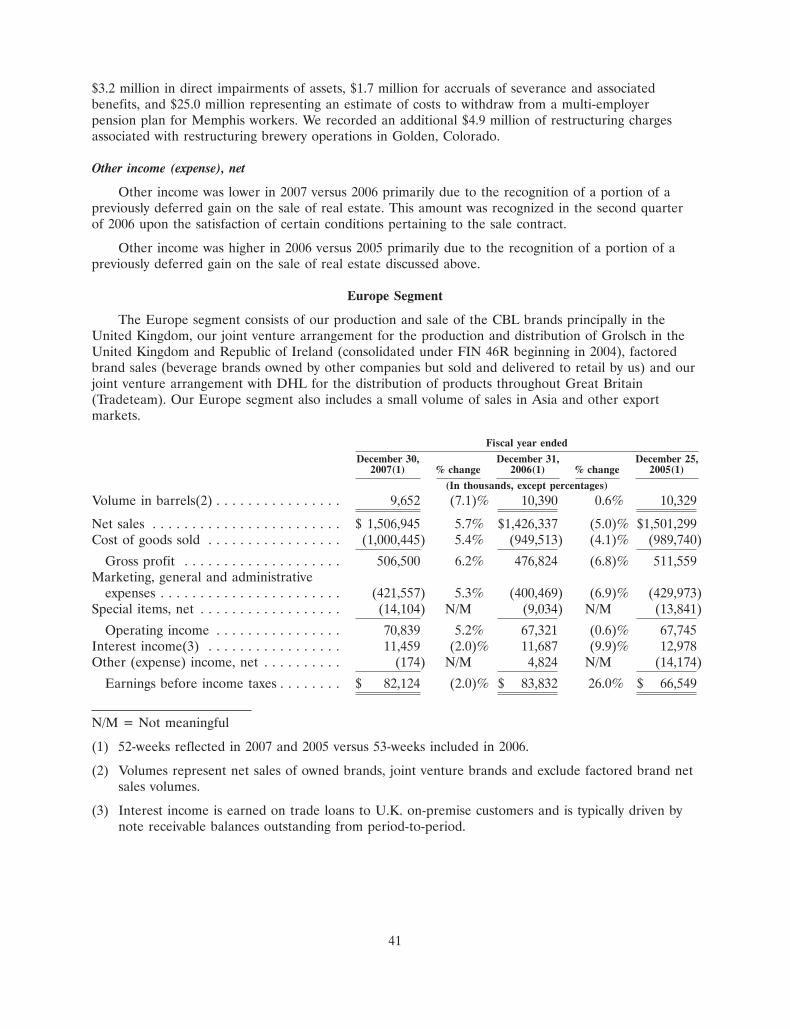
$3.2 million in direct impairments of assets, $1.7 million for accruals of severance and associatedbenefits, and $25.0 million representing an estimate of costs to withdraw from a multi-employerpension plan for Memphis workers. We recorded an additional $4.9 million of restructuring chargesassociated with restructuring brewery operations in Golden, Colorado.
Other income (expense), net
Other income was lower in 2007 versus 2006 primarily due to the recognition of a portion of apreviously deferred gain on the sale of real estate. This amount was recognized in the second quarterof 2006 upon the satisfaction of certain conditions pertaining to the sale contract.
Other income was higher in 2006 versus 2005 primarily due to the recognition of a portion of apreviously deferred gain on the sale of real estate discussed above.
Europe Segment
The Europe segment consists of our production and sale of the CBL brands principally in theUnited Kingdom, our joint venture arrangement for the production and distribution of Grolsch in theUnited Kingdom and Republic of Ireland (consolidated under FIN 46R beginning in 2004), factoredbrand sales (beverage brands owned by other companies but sold and delivered to retail by us) and ourjoint venture arrangement with DHL for the distribution of products throughout Great Britain(Tradeteam). Our Europe segment also includes a small volume of sales in Asia and other exportmarkets.
Fiscal year ended
December 30, December 31, December 25,2007(1) % change 2006(1) % change 2005(1)
(In thousands, except percentages)
Volume in barrels(2) . . . . . . . . . . . . . . . . 9,652 (7.1)% 10,390 0.6% 10,329
Net sales . . . . . . . . . . . . . . . . . . . . . . . . $ 1,506,945 5.7% $1,426,337 (5.0)% $1,501,299Cost of goods sold . . . . . . . . . . . . . . . . . (1,000,445) 5.4% (949,513) (4.1)% (989,740)
Gross profit . . . . . . . . . . . . . . . . . . . . 506,500 6.2% 476,824 (6.8)% 511,559Marketing, general and administrative
expenses . . . . . . . . . . . . . . . . . . . . . . . (421,557) 5.3% (400,469) (6.9)% (429,973)Special items, net . . . . . . . . . . . . . . . . . . (14,104) N/M (9,034) N/M (13,841)
Operating income . . . . . . . . . . . . . . . . 70,839 5.2% 67,321 (0.6)% 67,745Interest income(3) . . . . . . . . . . . . . . . . . 11,459 (2.0)% 11,687 (9.9)% 12,978Other (expense) income, net . . . . . . . . . . (174) N/M 4,824 N/M (14,174)
Earnings before income taxes . . . . . . . . $ 82,124 (2.0)% $ 83,832 26.0% $ 66,549
N/M = Not meaningful
(1) 52-weeks reflected in 2007 and 2005 versus 53-weeks included in 2006.
(2) Volumes represent net sales of owned brands, joint venture brands and exclude factored brand netsales volumes.
(3) Interest income is earned on trade loans to U.K. on-premise customers and is typically driven bynote receivable balances outstanding from period-to-period.
41
Foreign currency impact on results
Our Europe segment results were positively affected by an 8% year-over-year increase in the valueof the British Pound Sterling (GBP or £) against the USD in 2007. In 2006, the GBP strengthenedversus the USD resulting in a 1% appreciation impact to USD earnings before income taxes.
Volume and net sales
Our Europe segment owned-brand volumes decreased 7.1% on a reported 52 week versus 53 weekbasis. After excluding the 53rd week, volume decreased 5.8% due to an extended period of unusuallyrainy and cool weather conditions throughout the summer in 2007, and the impact of the enactedsmoking bans on the U.K. on-premise channel beer market in the second half of 2007.
For the year ended 2006, beer volume in our on-premise business, which representedapproximately two-thirds of our Europe volume and an even greater proportion of our margin, declinedby slightly more than 2% compared to 2005. This compared to an overall industry on-premise channeldecline of 4.3% yielding a small market share gain for CBL. Our off-premise volume for 2006 increasedby approximately 2% over 2005, with Carling accounting for most of the gain. We experienced a smalloff-premise market share decline in 2006.
As in 2006, in addition to the volume trends mentioned above, in 2005 we experienced unfavorablepricing in both the on-premise and the off-premise channels, as well as a decrease in the sales value offactored brands. These reductions were further compounded by unfavorable channel and brand mix.
Our Europe segment net revenue per barrel in local currency increased by 5% in 2007, withapproximately 3% of this change related to non-owned factored brands that we deliver to retail. Inparticular, we acquired the Cameron’s on-premise distribution business early in the third quarter. Theaddition of this business will raise our Europe net sales per barrel and cost of goods per barrel severalpercentage points for the next year, due to a step-up in our factored brand sales. U.K. owned-brandnet revenue per barrel in local currency increased nearly 3% in the year, due mainly to improvedpricing predominantly in the on-premise channel.
Net sales for the Europe segment decreased 5% in 2006, while volume increased 0.6% from 2005.The 53rd week in 2006 contributed approximately 140,000 barrels of sales volume, providing theyear-over-year increase. Net sales in local currency decreased by approximately 6.5%. The 52 weekvolume decline was driven by premium lagers, flavored alcohol beverages and ales. This decline waspartially offset by growth of the Carling brand. CBL’s overall volume increase for 2006 year drove aslight market share increase for the company versus an overall industry decline in 2005.
Cost of goods sold
Cost of goods sold per barrel in local currency increased by 5% in the year, with approximately4% of this change related to factored brand sales, including Cameron’s. Cost of goods sold for ourU.K. owned brands increased about 1% per barrel in local currency, driven by input cost inflation andthe impact of spreading the fixed costs over lower sales volume, partly offset by cost savings.
Cost of goods sold per barrel in local currency decreased approximately 6% in 2006 versus 2005.The change to net reporting for certain factored brand sales accounted for approximately $46 million ofthe decrease in the year to date cost of goods sold. The remaining decrease was driven by cost savingsfrom our supply chain restructuring initiatives begun in 2005 and lower distribution costs, partly offsetby increased energy costs.
42
Marketing, general and administrative expenses
Europe marketing, general and administrative expenses in the U.K. decreased approximately 3% inlocal currency. Marketing spending increased 2% due to the continued roll-out of our new advertisingcampaigns for Carling, C2, and re-launching Coors Light. General and administrative costs decreased6% compared to 2006 due to cost reduction programs.
In 2006, Europe marketing, general and administrative expenses decreased 6.9%, and 7.4%,respectively on a per barrel basis versus 2005. This decrease was primarily the result of cost reductioninitiatives we announced and began implementing during 2005 and rigorous cost control throughout theyear.
Special items, net
We recognized $14.1 million and $9.0 million of special charges in 2007 and 2006, respectively. The2007 items were predominately employee termination costs associated with the U.K. supply chain andback office restructuring efforts and an increased pension liability in recognition of our existing pensionbenefit in accordance with U.K. law. The 2006 items were also a result of charges recognized as part ofrestructuring the supply chain operation and back office organization, combined with costs incurred inclosing our sales operation in Russia, partly offset by the pension curtailment gain. See Note 8 to theConsolidated Financial Statements in Item 8 for further discussion.
Other (expense) income, net
We incurred net other expense of $0.2 million in 2007 as compared to a net other income of$4.8 million for the prior year. The decrease noted is due to a non-recurring gain recognized on a saleof a surplus property in 2006, partly offset by improved year-over-year profit performance by ourdistribution joint venture, Tradeteam.
Other income of $4.8 million in 2006 represented a $19.0 million improvement over 2005, drivenby improved Tradeteam profitability, our joint venture partner for the distribution of product, profits onthe sale of surplus real estate, and lower non-operating leasehold expenses.
Interest income
Interest income is earned on trade loans to U.K. on-premise customers. Interest income decreasedby 2.0% and 9.9% in 2007 and 2006, respectively, as a result of lower loan balances versus the prioryears.
Corporate
Corporate includes interest and certain other general and administrative costs that are notallocated to the operating segments. The majority of these corporate costs relates to worldwide finance
43
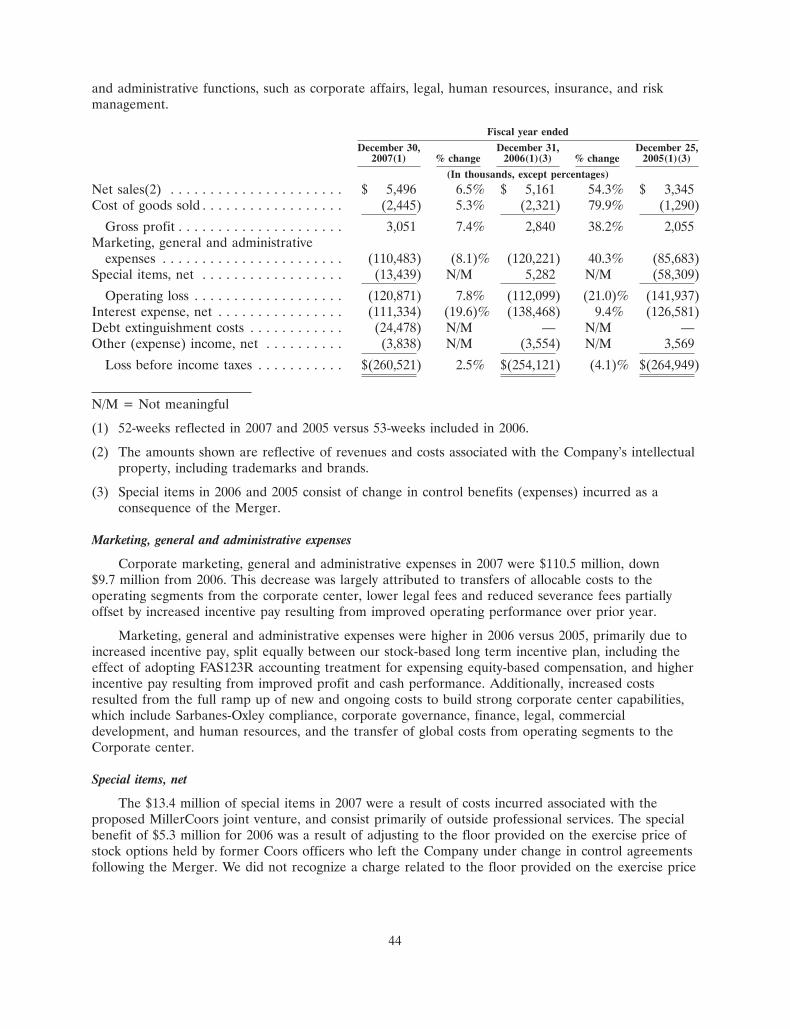
and administrative functions, such as corporate affairs, legal, human resources, insurance, and riskmanagement.
Fiscal year ended
December 30, December 31, December 25,2007(1) % change 2006(1)(3) % change 2005(1)(3)
(In thousands, except percentages)
Net sales(2) . . . . . . . . . . . . . . . . . . . . . . $ 5,496 6.5% $ 5,161 54.3% $ 3,345Cost of goods sold . . . . . . . . . . . . . . . . . . (2,445) 5.3% (2,321) 79.9% (1,290)
Gross profit . . . . . . . . . . . . . . . . . . . . . 3,051 7.4% 2,840 38.2% 2,055Marketing, general and administrative
expenses . . . . . . . . . . . . . . . . . . . . . . . (110,483) (8.1)% (120,221) 40.3% (85,683)Special items, net . . . . . . . . . . . . . . . . . . (13,439) N/M 5,282 N/M (58,309)
Operating loss . . . . . . . . . . . . . . . . . . . (120,871) 7.8% (112,099) (21.0)% (141,937)Interest expense, net . . . . . . . . . . . . . . . . (111,334) (19.6)% (138,468) 9.4% (126,581)Debt extinguishment costs . . . . . . . . . . . . (24,478) N/M — N/M —Other (expense) income, net . . . . . . . . . . (3,838) N/M (3,554) N/M 3,569
Loss before income taxes . . . . . . . . . . . $(260,521) 2.5% $(254,121) (4.1)% $(264,949)
N/M = Not meaningful
(1) 52-weeks reflected in 2007 and 2005 versus 53-weeks included in 2006.
(2) The amounts shown are reflective of revenues and costs associated with the Company’s intellectualproperty, including trademarks and brands.
(3) Special items in 2006 and 2005 consist of change in control benefits (expenses) incurred as aconsequence of the Merger.
Marketing, general and administrative expenses
Corporate marketing, general and administrative expenses in 2007 were $110.5 million, down$9.7 million from 2006. This decrease was largely attributed to transfers of allocable costs to theoperating segments from the corporate center, lower legal fees and reduced severance fees partiallyoffset by increased incentive pay resulting from improved operating performance over prior year.
Marketing, general and administrative expenses were higher in 2006 versus 2005, primarily due toincreased incentive pay, split equally between our stock-based long term incentive plan, including theeffect of adopting FAS123R accounting treatment for expensing equity-based compensation, and higherincentive pay resulting from improved profit and cash performance. Additionally, increased costsresulted from the full ramp up of new and ongoing costs to build strong corporate center capabilities,which include Sarbanes-Oxley compliance, corporate governance, finance, legal, commercialdevelopment, and human resources, and the transfer of global costs from operating segments to theCorporate center.
Special items, net
The $13.4 million of special items in 2007 were a result of costs incurred associated with theproposed MillerCoors joint venture, and consist primarily of outside professional services. The specialbenefit of $5.3 million for 2006 was a result of adjusting to the floor provided on the exercise price ofstock options held by former Coors officers who left the Company under change in control agreementsfollowing the Merger. We did not recognize a charge related to the floor provided on the exercise price
44

of the stock options as the stock price exceeded the floor price in 2007. See Note 8 to the ConsolidatedFinancial Statements in Item 8.
Interest expense, net
Corporate net interest expense totaled $111.3 million for 2007, $27.1 million lower than the prioryear. The decrease was primarily a result of lower average net debt levels outstanding. We alsorecognized a $24.5 million charge as a result of the debt extinguishment costs during 2007. See Note 13to the Consolidated Financial Statements in Item 8.
Interest expense, net was $138.5 million during 2006, versus $126.6 million during 2005. Interestexpense, net increased due to higher interest rates on permanent financing (as opposed to short-termtemporary financing in place through September 2005 following the Merger), 53rd week impact and astronger Canadian dollar and British Pound Sterling. These increased costs were partially offset by thebenefit of lower overall debt levels due to debt repayments in 2006.
Other income (expense), net
Other expense, net in 2007 increased from 2006 due to greater foreign currency exchange lossesthroughout the current year. 2006 includes primarily foreign exchange losses, while the other income,net in 2005 includes primarily foreign exchange gains.
Liquidity and Capital Resources
Our primary sources of liquidity are cash provided by operating activities, external borrowings andasset monetizations. As of December 30, 2007 and December 31, 2006, we had working capital of$41.2 million and a working capital deficit of $341.8 million, respectively. We commonly operate at alow level of working capital or working capital deficits given the relatively quick turnover of ourreceivables and inventory. Our higher net working capital at December 30, 2007 was due to higherbalances associated with cash, accounts receivable, inventories, and lower balances for accounts payableand other accrued expenses. We had total cash of $377.0 million at December 30, 2007, compared to$182.2 million at December 31, 2006. Long-term debt was $2,260.6 million and $2,129.8 million atDecember 30, 2007, and December 31, 2006, respectively. Debt as of the end of 2007 consists primarilyof bonds with longer-term maturities. We believe that cash flows from operations and cash provided byshort-term borrowings, when necessary, will be sufficient to meet our ongoing operating requirements,scheduled principal and interest payments on debt, dividend payments and anticipated capitalexpenditures. However, our liquidity could be impacted significantly by a decrease in demand for ourproducts, which could arise from competitive circumstances, a decline in the acceptability of alcoholbeverages or any of the other factors we describe in Item 1A. ‘‘Risk Factors.’’
Operating Activities
Net cash provided by operating activities of $616.0 million for the 52 weeks ended December 30,2007, was lower by $217.2 million from the 53-week period ending December 31, 2006. Net income washigher by $136.2 million in 2007 versus 2006, the reasons for which are discussed in detail in theResults of Operations discussion in this section. However, various non-cash components of net incomeresulted in a lower amount of our expenses in 2007 versus 2006 by $135.4 million. Therefore, netincome adjusted for its various non-cash components was effectively flat year over year. These non-cashcomponents consisted of depreciation and amortization (lower in 2007 by $92.5 million), amortizationof debt costs, share-based compensation and related tax benefits, gains and losses on sales of assets,impairment losses on long-lived assets, and deferred taxes. The lower operating cash flows in 2007 weretherefore due primarily to cash movements associated with working capital and other assets andliabilities. Specifically, collections on accounts receivable were lower in 2007 due primarily to lower
45
collections in the U.K., where the 53-week year in 2006 resulted in an extra week of collections in thatyear. Cash paid for inventories was higher in 2007 as our Canada segment increased finished goods andpackaging materials inventories in anticipation of an expansion of business in western Canada as aresult of a new joint venture agreement with Modelo. Cash outflows associated with accrued expensesand other liabilities were greater in 2007 versus 2006 due to higher defined benefit pensioncontributions of $47.6 million, a one-time payment to a non-employer pension plan associated with ourformer Memphis, Tennessee, brewery of $27.6 million, and higher cash taxes of $39.2 million. Offsettingthese items was lower cash paid for interest of $28.1 million.
We expect that 2008 operating cash flows will be higher than those realized in 2007. However,integration efforts associated with the proposed MillerCoors joint venture could result in unanticipatedcosts in 2008.
Our net cash provided by operating activities in 2006 was $833.2 million, an increase of$411.0 million from 2005. Net income was higher by $226.1 million in 2006 versus 2005. However, muchof the improvement from 2005 to 2006 was due to a number of unfavorable items in 2005. First, cashpaid for income taxes was lower by $162.7 million during 2006 versus 2005. Second, in early 2005 wemade a $138.0 million Canadian tax payment triggered by the Merger, a one-time liquidity event thatwas not repeated in 2006. Third, our pension funding in 2006 was lower by $55.1 million primarily dueto a special voluntary funding to the U.S. plan in 2005. Finally, we paid out $21.0 million for Merger-related costs and severance payments to officers under change in control and severance agreements of$24.0 million in 2005.
Investing Activities
Net cash used in investing activities of $439.1 million for the year ended December 30, 2007 washigher by $144.3 million compared to 2006. The primary reason for the variance between years waslower cash inflows associated with sales of assets and businesses. In 2007, these proceeds totaledapproximately $38.1 million, with the largest proceeds associated with the sale of our investment in theHouse of Blues Canada business, which resulted in $30.0 million of proceeds. However, in 2006, wecollected $145.1 million of proceeds, specifically, we collected $79.5 million from the sale of the Kaiserbusiness in Brazil, $36.5 million from the sale of our preferred equity interests in the MontrealCanadiens hockey club, and $29.1 million from various other sales. In 2007, we spent $26.7 million toacquire an on-premise distribution business in the U.K., while we had no business acquisitions in 2006,and invested $22.8 million in short-term investments, versus no such investments in 2006. Partiallyoffsetting these items in 2007 versus 2006, additions to properties and intangible assets were lower by$18.0 million due primarily to higher capital additions in 2006 associated with the build-out of theShenandoah brewery in the U.S., offset by CBL’s large purchase of kegs in April 2007 of $90.0 million.
Net cash used in investing activities of $294.8 million for the year ended December 31, 2006, waslower by $17.9 million compared to the same period in 2005. Additions to properties were higher in2006 by $40.3 million as compared to 2005, due primarily to spending in Canada and the U.S. relatedto the build-out of the Moncton, New Brunswick, and Elkton, Virginia, breweries. In 2006, werecognized proceeds of $83.7 million on the sale of the Kaiser business in Brazil, partially offset by$4.2 million of transaction costs. Proceeds from sales of properties and intangible assets were lower by$13.3 million year over year. 2005 proceeds included a significant collection of a note related to a 2004sale of property in the U.K. causing proceeds to exceed 2006 levels, which included the sale of theMemphis plant in the U.S. and various real estate sales in the U.K. On June 30, 2006, as part of ageneral refinancing of the Montreal Canadiens Hockey team (the Club), Molson sold its preferredequity interest in the Montreal Canadiens hockey club to entities which control and own a majorityinterest in the Club. Total proceeds coincident with the transaction were CAD $41.6 million (USD$36.5 million). We retain a 19.9% common equity interest in the Club as well as board representation.
46
The transaction structure is consistent with our long-term commitment to the Club and its success, andhelps to ensure the Club’s long-term presence in Montreal.
Financing Activities
Our debt position significantly affects our financing activity. See Note 13 to the ConsolidatedFinancial Statements in Item 8 of this report for a summary of our debt position at December 30, 2007and December 31, 2006.
Net cash provided by financing activities totaled $8.4 million in 2007, compared to net cash used of$401.2 million during 2006, a favorable variance of $409.7 million. We collected $126.2 million more inproceeds from employee exercises of stock options in 2007 versus 2006. During 2007, our primaryactivities involved refinancing a significant portion of our debt portfolio by issuing $575.0 million inconvertible notes, while repaying $625.0 million of our previously existing senior notes. We also spent anet $49.7 million for the purchase of a note hedge and sale of warrants associated with the convertiblenotes and $10.2 million for costs directly associated with the convertible notes offering. During 2006,most of our activity associated with debt obligations was associated with repayments, which totaled$355.4 million.
Net cash used for financing activities was $401.2 million for 2006 compared to $188.8 million ofcash used in financing activities during 2005. Net repayments of debt were approximately $356.2 millionfor 2006, encompassing all activity in our various debt and credit facilities (including those associatedwith discontinued operations). Net repayments of debt during 2005 were approximately $108.9 million(including those associated with discontinued operations). The increased levels of debt repayment weredue primarily to a higher level of operating cash flows generated by the business in 2006 versus 2005.Proceeds from stock option exercises in 2006 were $83.3 million exceeding 2005 exercises by$28.1 million. Proceeds in 2006 were impacted by significant exercises of stock options during thefourth quarter.
Capital Resources
See Note 13 to the Consolidated Financial Statements in Item 8, for a complete discussion andpresentation of all borrowings and available sources of borrowing, including lines of credit.Additionally, as discussed in the Financing Activities section above, during the second quarter of 2007,we issued $575.0 million of senior convertible notes, with a coupon rate of interest of 2.5%. In thethird quarter of 2007, we used the proceeds of the convertible notes issuance, combined with othersources of cash, to retire $625.0 million of 6.375% senior notes due 2012 and fund additional relatedcharges as noted above.
The vast majority of our remaining debt borrowings as of December 30, 2007, consist of publiclytraded notes totaling $2.1 billion principal amount, with maturities ranging from 2010 to 2015. Ourremaining debt other than the notes consists of various notes payable of $215.9 million at consolidatedjoint ventures, which mature in 2011 and 2013. We maintain two primary financing vehicles to manageshort-term liquidity requirements through periods of lower operating cash flow. First, we maintain a$500 million commercial paper program. As a back-stop for our commercial paper program wemaintain a $750 million revolving multi-currency bank credit facility. There were no outstandingborrowings under either of these financing vehicles as of December 30, 2007.
We expect to take a balanced approach to our alternatives in 2008 and beyond, which couldinclude restructuring of consolidated joint venture debt obligations, modest repurchases of stock,dividend increases, pension plan funding elections, reinvesting cash into our existing businesses andpreserving cash flexibility for potential strategic investments. Any repurchases of MCBC stock on theopen market would require a board-approved plan, which does not currently exist.
47

On February 7, 2008, we announced a tender for and repurchase of any and all principal amountof our remaining 6.375% $225 million Senior Notes due 2012, with the tender period running throughFebruary 14, 2008. The amount actually repurchased was $180.4 million. The net costs of $11.7 millionrelated to this extinguishment of debt and termination of related interest rate swaps will be recorded inthe first quarter of 2008. The debt extinguishment was funded by existing cash resources.
Credit Rating
As of February 15, 2008, our credit rating with Standard & Poor’s and Moody’s with regard to ourlong-term debt was BBB and Baa2, respectively. We had no commercial paper borrowings outstandingat December 30, 2007.
As a result of the announcement of the proposed MillerCoors joint venture, credit rating agenciesin the U.S. and Canada (Moody’s and DBRS) have placed MCBC’s credit standing in developingstatus.
Capital Expenditures
In 2007, we spent $428.3 million (including approximately $16.3 million spent at consolidated jointventures) on capital improvement projects worldwide. Of this, approximately 42% was in support of theEuropean segment, with the remainder split between the U.S. (33%), Canada (22%) and Corporate(2%) segments. The capital expenditure plan for 2008 is expected to be approximately $315 million,including approximately $35 million of spending by consolidated joint ventures. Capital expenditures in2008 are expected to be lower than 2007 primarily due to the completion of the Shenandoah brewery inthe U.S. in early 2007 and the initial $90.0 million purchase of kegs in the U.K., also in early 2007.
Contractual Obligations and Commercial Commitments
Contractual Cash Obligations as of December 30, 2007
Payments due by period
Less than More thanTotal 1 year 1-3 years 3-5 years 5 years
(In thousands)
Total debt, including currentmaturities(1) . . . . . . . . . . . . . . . . . $2,264,877 $ 4,281 $ 308,452 $ 456,452 $1,495,692
Interest payments(2) . . . . . . . . . . . . . 590,593 105,233 205,457 147,808 132,095Derivative payments(2) . . . . . . . . . . . 3,280,682 163,317 677,980 2,439,385 —Retirement plan expenditures(3) . . . . . 498,145 193,482 66,550 70,243 167,870Operating leases . . . . . . . . . . . . . . . . 323,207 77,413 109,774 59,465 76,555Capital leases . . . . . . . . . . . . . . . . . . 2,123 1,092 783 248 —Other long-term obligations(4) . . . . . . 2,873,666 1,078,821 962,844 438,154 393,847
Total obligations . . . . . . . . . . . . . . . $9,833,293 $1,623,639 $2,331,840 $3,611,755 $2,266,059
(1) Refer to debt schedule in Note 13 to the Consolidated Financial Statements Item 8.
(2) The ‘‘interest payments’’ line includes interest on our bonds and other borrowings outstanding atDecember 30, 2007, excluding the cash flow impacts of any interest rate or cross currency swaps.Current floating interest rates and currency exchange rates are assumed to be constant throughoutthe periods presented. The ‘‘derivative payments’’ line includes the floating rate paymentobligations, which are paid to counterparties under our interest rate and cross currency swapagreements, £530 million ($1,058 million at December 30, 2007 exchange rates) payment due thecross currency swap counterparty in 2012, CAD$1,201 million ($1,223 million at December 30,
48

2007 exchange rates) payment due the cross currency swap counterparty in 2012, and CAD$355 million ($362 million at December 30, 2007 exchange rates) payment due the cross currencyswap counterparty in 2010. Current floating interest rates and currency exchange rates are assumedto be constant throughout the periods presented. We anticipate receiving a total of $2,685 millionin fixed and floating rate payments from our counterparties under the swap arrangements, whichoffset the payments included in the table. As interest rates increase, payments to or receipts fromour counterparties will also increase. Net interest payments, including swap receipts and paymentsover the periods are as follows (in thousands):
Less than More thanTotal 1 year 1-3 years 3-5 years 5 years
$1,132,409 $118,831 $288,027 $593,456 $132,095
(3) Represents expected contributions under our defined benefit pension plans in the next twelvemonths and our benefits payments under retiree medical plans for all periods presented.
(4) Approximately $615 million of the total other long-term obligations relate to long-term supplycontracts with third parties to purchase raw material and energy used in production, including ourcontract with Graphic Packaging Corporation, a related party, dated March 25, 2003.Approximately $457 million relates to commitments associated with Tradeteam in the UnitedKingdom. The remaining amounts relate to sales and marketing, information technology services,open purchase orders and other commitments.
Not included in these contractual cash obligations are $285.9 million of unrecognized tax benefitsand $124.8 million of indemnities provided to FEMSA for which we are unable to make estimates fortiming of the related cash payments.
Other Commercial Commitments as of December 30, 2007
Amount of commitment expiration per period
Total amounts Less than More thancommitted 1 year 1-3 years 3-5 years 5 years
(In thousands)
Standby letters of credit . . . . . . . . . . . . . . . . . . $58,022 $57,392 $630 $— $—
Advertising and Promotions
As of December 31, 2007, our aggregate commitments for advertising and promotions, includingmarketing at sports arenas, stadiums and other venues and events, total approximately $1.1 billion overthe next five years and thereafter. Our advertising and promotions commitments are included in otherlong-term obligations in the table above.
Pension Plans
Our consolidated, unfunded pension position at the end of 2007 was approximately $175 million, adecrease of $184 million from the end of 2006. The funded positions of pension plans in each of theCanada, U.S. and U.K. businesses improved due to asset returns, higher interest rates (which have theeffect of decreasing the discounted pension liabilities), contributions to the plans, plan changes andreductions in U.K. staffing levels. Approximately $49 million of the underfunded pension position atthe end of 2007 was the responsibility of the minority owners of BRI. See discussion below regardingthe adoption of SFAS No. 158 ‘‘Employers’ Accounting for Defined Benefit Pension and OtherPostretirement Benefits—an amendment of FASB Statements No. 87, 88, 106, and 132(R).’’
We fund pension plans to meet the minimum requirements set forth in applicable employeebenefits laws. Sometimes we voluntarily increase funding levels to meet expense and asset returnforecasts in any given year. Pension contributions on a consolidated basis were $203 million in 2007,reflecting statutory contribution levels in Canada and the United Kingdom, and $1.3 million ofvoluntary contributions in the United States. We anticipate making approximately $164 million of bothstatutory and voluntary contributions to our pension plans in 2008.
49
Consolidated pension expense was $21 million in 2007, a decrease of $12 million from 2006.Decreases in the U.S. and Canada of $10 million and $2 million, respectively, were attributable mainlyto higher expected returns on plan assets in 2007. We anticipate pension expense on a consolidatedbasis for 2008 to approximate $23 million.
Postretirement Benefit Plans
Our consolidated, unfunded postretirement benefit position at the end of 2007 was approximately$470 million, an increase of $68 million from the end of 2006. Benefits paid under our postretirementbenefit plans were approximately $25 million in 2007 and $22 million in 2006. Under ourpostretirement benefit plans we expect payments of approximately $30 million in 2008. See discussionbelow regarding the adoption of SFAS No. 158 ‘‘Employers’ Accounting for Defined Benefit Pension andOther Postretirement Benefits—an amendment of FASB Statements No. 87, 88, 106, and 132(R).’’
Consolidated postretirement benefit expense was $39.3 million in 2007, an increase of $4.1 millionfrom 2006, attributable mainly to our Canada segment plans. We anticipate postretirement benefitexpense on a consolidated basis for 2008 of approximately $32 million.
Contingencies
In the ordinary course of business or in the course of the sale of a business, we enter intocontractual arrangements under which we may agree to indemnify third-parties from any losses orguarantees incurred relating to pre-existing conditions for losses or guarantees arising from certainevents as defined within the particular contract, which may include, for example, litigation or claimsrelating to past performance. Such indemnification obligations may not be subject to maximum lossclauses. See Note 20 to the Consolidated Financial Statements in Item 8 under the captions‘‘Environmental,’’ ‘‘Indemnity Obligations—Sale of Kaiser’’ and ‘‘Montreal Canadiens.’’
Off-Balance Sheet Arrangements
As of December 30, 2007, we did not have any material off-balance sheet arrangements (asdefined in Item 303(a) (4) (ii) of Regulation S-K).
Outlook for 2008
We will continue our quest to become a world-class, brand-led Company. We will promote ourstrategic brands by investing in the ‘‘front end’’ of our business—our marketing and sales activities. Wewill do so with a complete commitment to corporate social responsibility. For 2008 and beyond, we willremain focused on building brands and reducing costs in each of our segments to provide additionalresources for growth. The results are encouraging:
• In the U.S., we have strong volume and market-share momentum with our four largest brands.
• Our strategic brands in Canada are building volume momentum and taking share.
• We are maintaining pricing in Europe and helping our retail customers work through thesmoking bans.
• In all three of our segments, the strength of our brands is supporting positive pricing, and costreductions are providing resources to offset inflation and grow our businesses.
To continue our brand building progress:
• In Canada, we plan to build on the 2007 share momentum in our strategic brand portfolio andinvest in programming with the introduction of strategic SKUs and innovation. We will build on
50
the momentum of Coors Light, including leveraging the successful launch of the ‘‘ColdCertified’’ can and will introduce new advertising for all of the Molson brands.
• Our Canada segment will continue to build our super-premium owned and partner-importbrands through new programming and unique SKUs, leveraging the double-digit growth of thesebrands in 2007. Effective January 1, 2008, our Canada team established a long-term joint venturewith Grupo Modelo to import, distribute and market the Modelo beer portfolio across Canada.The joint venture builds on the previous successful relationship we had with Modelo, as we nowpick up these Super Premium brands for our portfolio in the Western provinces. The new formof our business relationship will result in our accounting for our share of the Modelo brandsbusiness in Canada under the equity method.
• In the U.S., our focus for 2008 is to maintain our strong volume and share momentum, whilecontinuing to aggressively manage costs. Coors Light, Keystone and Blue Moon will remain ourprimary focus in 2008, along with maintaining our volume and share momentum behind CoorsBanquet. We will also have initiatives to improve the trends for Killian’s and Molson Canandian.In 2008, we will continue to drive sales by growing our marketing and sales spending at amid-single-digit rate, building our key retail account business, and furthering our alignment withour distributor network.
• Our U.S. segment will continue to take a disciplined approach to both front-line pricing anddiscounting, while building our core brand equities around ‘‘Rocky Mountain Cold Refreshment’’to drive sustainable and profitable growth.
• In Europe, in addition to strong marketing investment behind Carling, we will continue tosupport the re-launch of Coors Light. We have recently secured distribution for Coors Light inJD Wetherspoon, a major on-premise customer and a particularly attractive venue for buildingbrand loyalty among our core consumers.
• In Europe, we will continue to roll-out our new cold-dispense technology and distinctiveabove-bar fonts, which support our whole portfolio via ‘‘cold’’ positioning and modern brandrepresentation. We completed 46,000 installations in 2007 and plan to install an additional40,000 in 2008.
• In Europe, we expect that our new Carling distribution contract with Marston’s, a majoron-premise customer, will drive market share in the important on-premise channel. The contractbegan in the third quarter of 2007.
There are a few additional considerations regarding sales volume in 2008:
• With the termination of our Foster’s U.S. production contract in the fourth quarter of 2007, weexpect Canada sales volume to be lower in the first three quarters of 2008 compared to 2007.The loss of this contract will result in lower reported sales volume, but will have no impact onour STRs. The Foster’s termination will continue to increase net sales per barrel and cost ofgoods sold per barrel over the next three quarters due to fixed-costs on lower productionvolumes.
• Based on the particularly strong volume momentum of our largest brands in the past severalmonths, we expect our U.S. distributors to build their inventories to a higher level in the firstquarter this year as they prepare for peak season. This will benefit our U.S. volume andfinancial results in the first quarter versus last year.
Regarding costs, our management teams continue to exceed their goals for reducing costs in eachsegment. The current inflationary environment presents a significant challenge coupled with theseasonally small profit fourth quarter, which will compound the margin impact of inflation.
51
• In Canada, we anticipate that our reported cost of goods per barrel will increase at a mid-single-digit rate in local currency for the full year 2008. Excluding mix impacts from increased partnerimport volume and lower contract brewing volume, we expect cost of goods sold per barrel toincrease at a low-single-digit rate.
• In the U.S., we currently expect our 2008 cost of goods per barrel to increase at a low-single-digit rate. We are confident that we will meet or exceed our cost-reduction goals this year viathe Resources for Growth program, which continues to be a top priority because we anticipatecost challenges again in 2008 in two main areas:
• First, based on the current outlook for commodities and other inputs, we expecttransportation and fuel costs to increase significantly in 2008, along with moderate increasesin packaging materials.
• Second, we will have higher contract-packaging fees and a full year of Shenandoah brewerydepreciation expense in 2008.
• Our Europe team will continue to reduce costs to offset input inflation and to provide resourcesfor our brand marketing investments. Additional cost-reduction initiatives are being sought, withinitiatives already underway in the supply chain and other business areas.
• We announced late in 2007 that we have entered into an agreement with Scottish & Newcastleto contract brew and keg selected Scottish & Newcastle lager brands. Brewing will begin aroundthe middle of 2008 and reach full production in 2010, when we will be producing up to2.6 million barrels (3 million hectolitres) of lager for Scottish & Newcastle annually. This willgenerate additional income and fixed cost leverage in our U.K. brewing footprint.
• Based on improved longevity projections of our retirees in the U.K., we do not expect to benefitfrom U.K. pension income in 2008, a departure from the past two years.
MillerCoors joint venture
On October 9, 2007, MCBC and SABMiller plc (the investing companies) announced that theysigned a letter of intent to combine the U.S. and Puerto Rico operations of their respectivesubsidiaries, CBC and Miller Brewing Company, in a joint venture (‘‘MillerCoors’’). Assumingcompletion of the transaction, MillerCoors will have annual pro forma combined beer sales of69 million U.S. barrels (81 million hectoliters) and net revenues of approximately $6.6 billion. MCBCand SABMiller expect the transaction to generate approximately $500 million in annual cost synergiesto be delivered in full by the third full financial year of combined operations. The parties signed adefinitive joint venture agreement on December 20, 2007 and expect the transaction to close inmid-2008. Additional information regarding the rationale for the transaction is provided in Item 1,Business, under the caption ‘‘Joint Ventures and Other Arrangements.’’
Each party will contribute its business and related operating assets and certain liabilities into anoperating joint venture company. The percentage interests in the profits of the joint venture will be58% for SABMiller plc and 42% for MCBC. Voting interests will be shared 50%-50%, and eachinvesting company will have equal board representation within the joint venture company. Each partyto the joint venture has agreed not to transfer its economic or voting interests in the joint venture for aperiod of five years, and certain rights of first refusal will apply to any subsequent assignment of suchinterests.
The results and financial position of our U.S. segment will, in all material respects, bede-consolidated upon contribution to the joint venture. We will report our interest in the new combinedoperations using the equity method of accounting.
52
The proposed joint venture transaction has been submitted for antitrust review and clearance bythe U.S. Department of Justice under the Hart-Scott-Rodino Act of 1976, as amended, and to certainother applicable governmental authorities.
Corporate
We forecast full-year 2008 corporate general and administrative expense of approximately$110 million, plus or minus $5 million. Approximately, one-fifth of this expense is related to ourResources for Growth cost-reduction program.
Goodwill
Because there is goodwill included in the carrying value of our three segments, the fair value ofthe applicable reporting unit was compared to its carrying value during the third quarter of 2007 todetermine whether there was any goodwill impairment. Most of the goodwill associated with the U.S.and Canada segments originated in the Merger. Similarly, we tested indefinite-lived intangible assets forimpairment during the third quarter of 2007, most of which relate to our Canada and Europesegments.
A portion of the Merger goodwill was allocated to the U.S. segment, based on the level of Mergersynergy savings expected to accrue to the U.S. segment over time. Our testing during the third quarterof 2007 indicated that the fair values of the reporting units in the U.S. and Canada exceeded theircarrying values, resulting in no impairments of goodwill in 2007. However, a reduction in the fair valueof the U.S. or Canada segment in the future could lead to goodwill impairment. We also havesignificant indefinite-lived intangible assets in Canada, associated primarily with core, non-core, andpartner beer brands, as well as distribution rights. These intangible assets were also evaluated forimpairment during the third quarter of 2007, and we determined that their fair values exceeded theircarrying values. A reduction in the fair values of these intangibles could lead to impairment charges inthe future. Reductions in fair value could occur for a number of reasons, including cost increases dueto inflation, an unfavorable beer pricing environment, declines in industry or company-specific beervolume sales, termination of brewing and/or distribution agreements with other brewers.
The goodwill associated with the Europe segment originated in the 2002 purchase of the CBLbusiness by Coors. Our testing during the third quarter of 2007 indicated that the fair value of the CBLreporting unit exceeded its carrying value, resulting in no impairments of goodwill. However, a slightreduction in the fair value of the CBL reporting unit in the future could lead to goodwill impairment.We also have a significant indefinite-lived intangible asset in Europe, associated with the Carling brand,which was also tested in the third quarter of 2007, and no impairment was warranted. Futurereductions in the fair value of the Europe business or of specific intangibles could occur for a numberof reasons, including cost increases due to inflation, an unfavorable beer pricing environment, anddeclines in industry or company-specific beer volume sales, which could result in possible impairment ofthese assets.
Interest
We anticipate 2008 corporate net interest expense of approximately $95 million to $100 million,excluding the debt extinguishment costs and U.K. trade loan interest income. This $13 millionreduction from 2007 is attributable to the debt repayments and debt restructurings we have undertakenin the past year to strengthen our financial foundation, partially offset by the interest cost as a result ofthe stronger CAD.
53
Tax
Our tax rate is volatile and may move up or down with changes in, among other things, theamount and source of income or loss, our ability to utilize foreign tax credits, changes in tax laws, andthe movement of liabilities established pursuant to FIN 48 for uncertain tax positions as statute oflimitations expire or positions are otherwise effectively settled. During 2008, the Company expects torecognize a $50 to $60 million income tax benefit due to a reduction in unrecognized tax benefits. Thisincome tax benefit is primarily due to penalties and interest associated with issues subject to audits thatwe believe are going to close in the next year. As a result, we anticipate that our 2008 effective tax rateon income will be in the range of 10% to 15%. We note, however, that there are other pending tax lawchanges in Canada that if enacted, would result in an approximate $120 million decrease to theunrecognized tax benefits. This one-time, non-cash income tax benefit would be recognized in thequarter in which the bill is enacted. In addition, there are other pending law changes in the U.S., U.K.,and Canada that if enacted, could have an impact on our effective tax rate.
Other
During the first quarter of 2008, we signed a contract with a third-party service provider tooutsource a significant portion of our general and administrative back office functions in all of ouroperating segments and in our corporate office. This outsourcing initiative is a key component of ourResources for Growth cost reduction program. We expect to incur both transition costs and one-timeemployee termination costs associated during 2008 with this outsourcing initiative.
Critical Accounting Policies and Estimates
Management’s discussion and analysis of our financial condition and results of operations arebased upon our consolidated financial statements, which have been prepared in accordance withaccounting principles generally accepted in the United States, or U.S. GAAP. We review our accountingpolicies on an on-going basis. The preparation of our consolidated financial statements requires us tomake estimates and judgments that affect the reported amounts of assets, liabilities, revenues andexpenses, and related disclosures of contingent assets and liabilities. We base our estimates on historicalexperience and on various other assumptions we believe to be reasonable under the circumstances. Bytheir nature, estimates are subject to uncertainty. Actual results may differ materially from theseestimates under different assumptions or conditions. We have identified the accounting estimates belowas critical to our financial condition and results of operations.
Pension and Postretirement Benefits
We have defined benefit plans that cover the majority of our employees in Canada, the UnitedStates, and the United Kingdom. We also have postretirement welfare plans in Canada and the UnitedStates that provide medical benefits for retirees and eligible dependents and life insurance for certainretirees. The accounting for these plans is subject to the guidance provided in Statement of FinancialAccounting Standards No. 87, ‘‘Employers’ Accounting for Pensions’’ (‘‘SFAS 87’’) and Statement ofFinancial Accounting Standards No. 106, ‘‘Employers’ Accounting for Postretirement Benefits Other thanPensions’’ (‘‘SFAS 106’’) and SFAS No. 158 ‘‘Employers’ Accounting for Defined Benefit Pension andOther Postretirement Benefits—an amendment of FASB Statements No. 87, 88, 106, and 132(R).’’. Thesestatements require that management make certain assumptions relating to the long-term rate of returnon plan assets, discount rates used to measure future obligations and expenses, salary increases,inflation, health care cost trend rates and other assumptions. We believe that the accounting estimatesrelated to our pension and postretirement plans are critical accounting estimates because they arehighly susceptible to change from period to period based on market conditions.
54

At the end of each fiscal year, we perform an analysis of high quality corporate bonds andcompare the results to appropriate indices and industry trends to support the discount rates used indetermining our pension liabilities in Canada, the United States, and the United Kingdom. Discountrates and expected rates of return on plan assets are selected at the end of a given fiscal year andimpact expense in the subsequent year. A 50 basis point change in certain assumptions made at thebeginning of 2007 would have had the following effects on 2007 pension expense:
Impact to 2007pension costs �50
basis points(unfavorable)
favorable
Reduction Increase
(In millions)
Description of pension sensitivity itemExpected return on Canada salary plan assets, 5.00% in 2007 . . . . . . . . . . . . . . . . . $ (1.6) $ 1.6Expected return on Canada hourly plan assets, 7.90% in 2007 . . . . . . . . . . . . . . . . $ (3.8) $ 3.8Expected return on Canada—BRI plan assets, 7.50% in 2007 . . . . . . . . . . . . . . . . $ (2.8) $ 2.8Expected return on U.S. plan assets, 8.75% in 2007 . . . . . . . . . . . . . . . . . . . . . . . . $ (4.0) $ 4.0Expected return on U.K. plan assets, 7.80% in 2007 . . . . . . . . . . . . . . . . . . . . . . . $(10.4) $10.4Discount rate on Canada salary projected benefit obligation, 5.00% in 2007 . . . . . . $ 0.6 $(0.5)Discount rate on Canada hourly projected benefit obligation, 5.00% in 2007 . . . . . . $ (1.0) $ 0.4Discount rate on Canada—BRI projected benefit obligation, 5.00% in 2007 . . . . . . $ (1.7) $ 1.2Discount rate on U.S. projected benefit obligation, 6.10% in 2007 . . . . . . . . . . . . . $ (4.4) $ 5.0Discount rate on U.K. projected benefit obligation, 5.10% in 2007 . . . . . . . . . . . . . $(15.6) $ 5.2
Assumed health care cost trend rates have a significant effect on the amounts reported for theretiree health care plan. A one-percentage-point change in assumed health care cost trend rates wouldhave the following effects:
1% point 1% pointincrease decrease
(unfavorable) favorable
(In millions)
Canada plans (Molson)Effect on total of service and interest cost components . . . . . . . . . . . . . . . . . . . $ (1.8) $ 2.0Effect on postretirement benefit obligation . . . . . . . . . . . . . . . . . . . . . . . . . . . $(19.9) $21.9
Canada plans (BRI)Effect on total of service and interest cost components . . . . . . . . . . . . . . . . . . . $ (1.0) $ 1.3Effect on postretirement benefit obligation . . . . . . . . . . . . . . . . . . . . . . . . . . . $ (9.9) $11.8
U.S. planEffect on total of service and interest cost components . . . . . . . . . . . . . . . . . . . $ (0.7) $ 0.8Effect on postretirement benefit obligation . . . . . . . . . . . . . . . . . . . . . . . . . . . $ (8.1) $ 9.0
Equity assets are well diversified between domestic and other international investments, withadditional diversification in the domestic category through allocations to large-cap, small-cap andgrowth and value investments. Relative allocations reflect the demographics of the respective plan
55
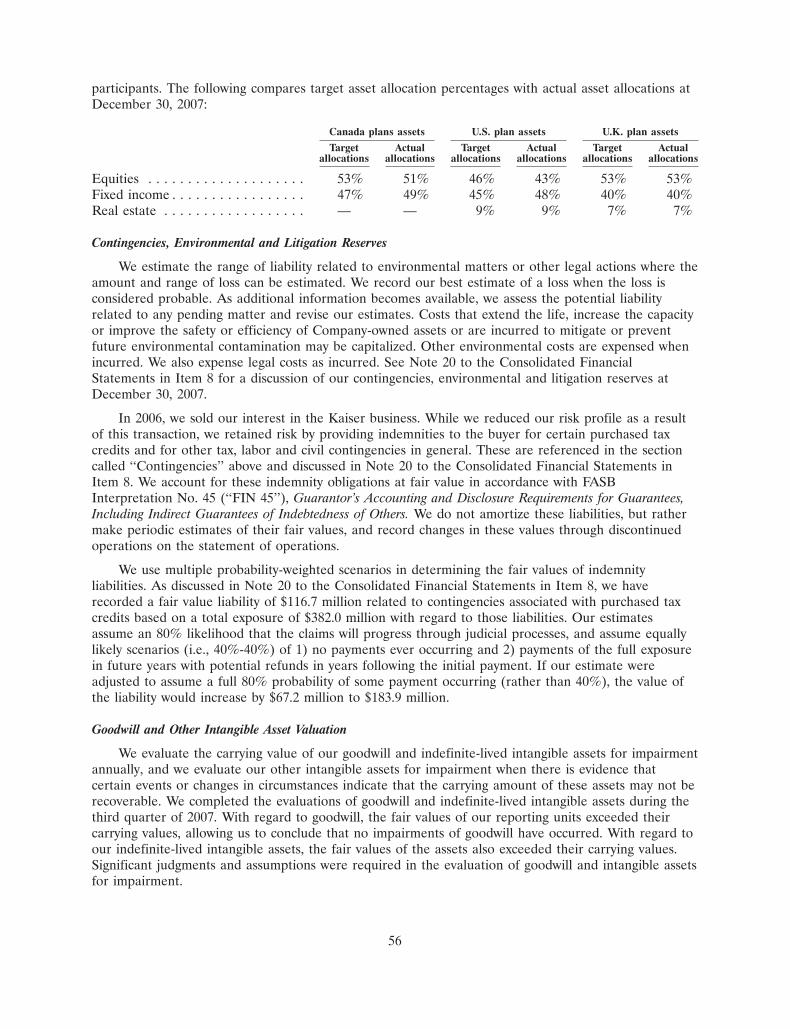
participants. The following compares target asset allocation percentages with actual asset allocations atDecember 30, 2007:
Canada plans assets U.S. plan assets U.K. plan assets
Target Actual Target Actual Target Actualallocations allocations allocations allocations allocations allocations
Equities . . . . . . . . . . . . . . . . . . . . 53% 51% 46% 43% 53% 53%Fixed income . . . . . . . . . . . . . . . . . 47% 49% 45% 48% 40% 40%Real estate . . . . . . . . . . . . . . . . . . — — 9% 9% 7% 7%
Contingencies, Environmental and Litigation Reserves
We estimate the range of liability related to environmental matters or other legal actions where theamount and range of loss can be estimated. We record our best estimate of a loss when the loss isconsidered probable. As additional information becomes available, we assess the potential liabilityrelated to any pending matter and revise our estimates. Costs that extend the life, increase the capacityor improve the safety or efficiency of Company-owned assets or are incurred to mitigate or preventfuture environmental contamination may be capitalized. Other environmental costs are expensed whenincurred. We also expense legal costs as incurred. See Note 20 to the Consolidated FinancialStatements in Item 8 for a discussion of our contingencies, environmental and litigation reserves atDecember 30, 2007.
In 2006, we sold our interest in the Kaiser business. While we reduced our risk profile as a resultof this transaction, we retained risk by providing indemnities to the buyer for certain purchased taxcredits and for other tax, labor and civil contingencies in general. These are referenced in the sectioncalled ‘‘Contingencies’’ above and discussed in Note 20 to the Consolidated Financial Statements inItem 8. We account for these indemnity obligations at fair value in accordance with FASBInterpretation No. 45 (‘‘FIN 45’’), Guarantor’s Accounting and Disclosure Requirements for Guarantees,Including Indirect Guarantees of Indebtedness of Others. We do not amortize these liabilities, but rathermake periodic estimates of their fair values, and record changes in these values through discontinuedoperations on the statement of operations.
We use multiple probability-weighted scenarios in determining the fair values of indemnityliabilities. As discussed in Note 20 to the Consolidated Financial Statements in Item 8, we haverecorded a fair value liability of $116.7 million related to contingencies associated with purchased taxcredits based on a total exposure of $382.0 million with regard to those liabilities. Our estimatesassume an 80% likelihood that the claims will progress through judicial processes, and assume equallylikely scenarios (i.e., 40%-40%) of 1) no payments ever occurring and 2) payments of the full exposurein future years with potential refunds in years following the initial payment. If our estimate wereadjusted to assume a full 80% probability of some payment occurring (rather than 40%), the value ofthe liability would increase by $67.2 million to $183.9 million.
Goodwill and Other Intangible Asset Valuation
We evaluate the carrying value of our goodwill and indefinite-lived intangible assets for impairmentannually, and we evaluate our other intangible assets for impairment when there is evidence thatcertain events or changes in circumstances indicate that the carrying amount of these assets may not berecoverable. We completed the evaluations of goodwill and indefinite-lived intangible assets during thethird quarter of 2007. With regard to goodwill, the fair values of our reporting units exceeded theircarrying values, allowing us to conclude that no impairments of goodwill have occurred. With regard toour indefinite-lived intangible assets, the fair values of the assets also exceeded their carrying values.Significant judgments and assumptions were required in the evaluation of goodwill and intangible assetsfor impairment.
56
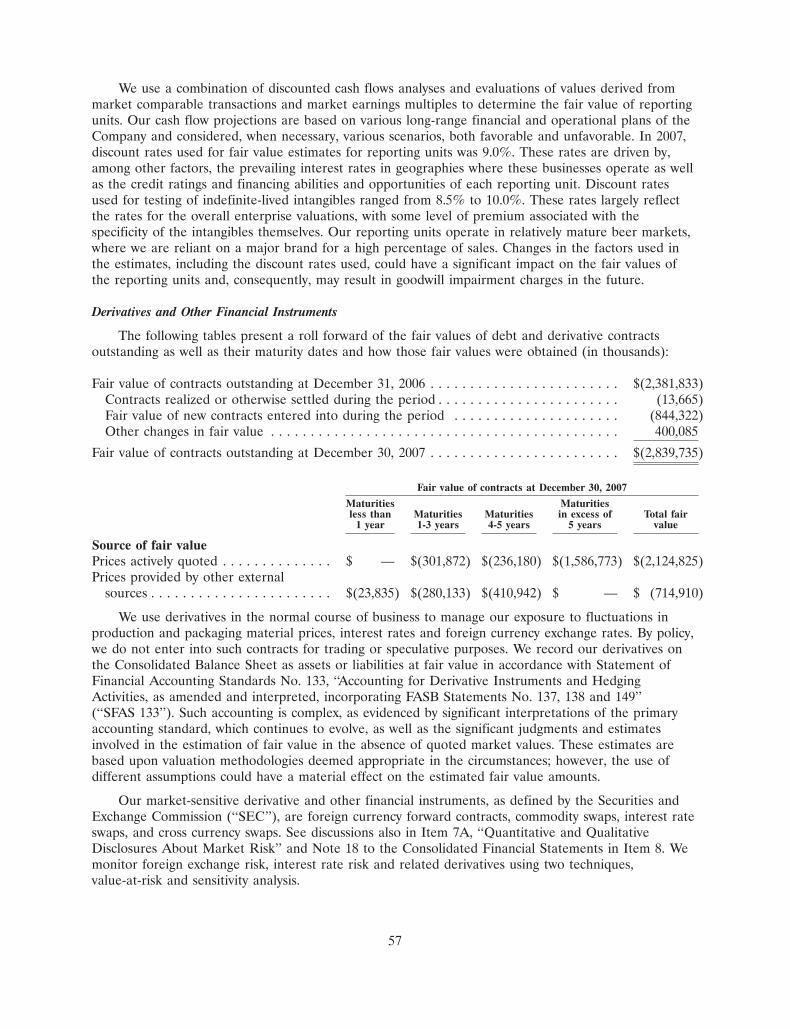
We use a combination of discounted cash flows analyses and evaluations of values derived frommarket comparable transactions and market earnings multiples to determine the fair value of reportingunits. Our cash flow projections are based on various long-range financial and operational plans of theCompany and considered, when necessary, various scenarios, both favorable and unfavorable. In 2007,discount rates used for fair value estimates for reporting units was 9.0%. These rates are driven by,among other factors, the prevailing interest rates in geographies where these businesses operate as wellas the credit ratings and financing abilities and opportunities of each reporting unit. Discount ratesused for testing of indefinite-lived intangibles ranged from 8.5% to 10.0%. These rates largely reflectthe rates for the overall enterprise valuations, with some level of premium associated with thespecificity of the intangibles themselves. Our reporting units operate in relatively mature beer markets,where we are reliant on a major brand for a high percentage of sales. Changes in the factors used inthe estimates, including the discount rates used, could have a significant impact on the fair values ofthe reporting units and, consequently, may result in goodwill impairment charges in the future.
Derivatives and Other Financial Instruments
The following tables present a roll forward of the fair values of debt and derivative contractsoutstanding as well as their maturity dates and how those fair values were obtained (in thousands):
Fair value of contracts outstanding at December 31, 2006 . . . . . . . . . . . . . . . . . . . . . . . . $(2,381,833)Contracts realized or otherwise settled during the period . . . . . . . . . . . . . . . . . . . . . . . (13,665)Fair value of new contracts entered into during the period . . . . . . . . . . . . . . . . . . . . . (844,322)Other changes in fair value . . . . . . . . . . . . . . . . . . . . . . . . . . . . . . . . . . . . . . . . . . . . 400,085
Fair value of contracts outstanding at December 30, 2007 . . . . . . . . . . . . . . . . . . . . . . . . $(2,839,735)
Fair value of contracts at December 30, 2007
Maturities Maturitiesless than Maturities Maturities in excess of Total fair
1 year 1-3 years 4-5 years 5 years value
Source of fair valuePrices actively quoted . . . . . . . . . . . . . . $ — $(301,872) $(236,180) $(1,586,773) $(2,124,825)Prices provided by other external
sources . . . . . . . . . . . . . . . . . . . . . . . $(23,835) $(280,133) $(410,942) $ — $ (714,910)
We use derivatives in the normal course of business to manage our exposure to fluctuations inproduction and packaging material prices, interest rates and foreign currency exchange rates. By policy,we do not enter into such contracts for trading or speculative purposes. We record our derivatives onthe Consolidated Balance Sheet as assets or liabilities at fair value in accordance with Statement ofFinancial Accounting Standards No. 133, ‘‘Accounting for Derivative Instruments and HedgingActivities, as amended and interpreted, incorporating FASB Statements No. 137, 138 and 149’’(‘‘SFAS 133’’). Such accounting is complex, as evidenced by significant interpretations of the primaryaccounting standard, which continues to evolve, as well as the significant judgments and estimatesinvolved in the estimation of fair value in the absence of quoted market values. These estimates arebased upon valuation methodologies deemed appropriate in the circumstances; however, the use ofdifferent assumptions could have a material effect on the estimated fair value amounts.
Our market-sensitive derivative and other financial instruments, as defined by the Securities andExchange Commission (‘‘SEC’’), are foreign currency forward contracts, commodity swaps, interest rateswaps, and cross currency swaps. See discussions also in Item 7A, ‘‘Quantitative and QualitativeDisclosures About Market Risk’’ and Note 18 to the Consolidated Financial Statements in Item 8. Wemonitor foreign exchange risk, interest rate risk and related derivatives using two techniques,value-at-risk and sensitivity analysis.
57
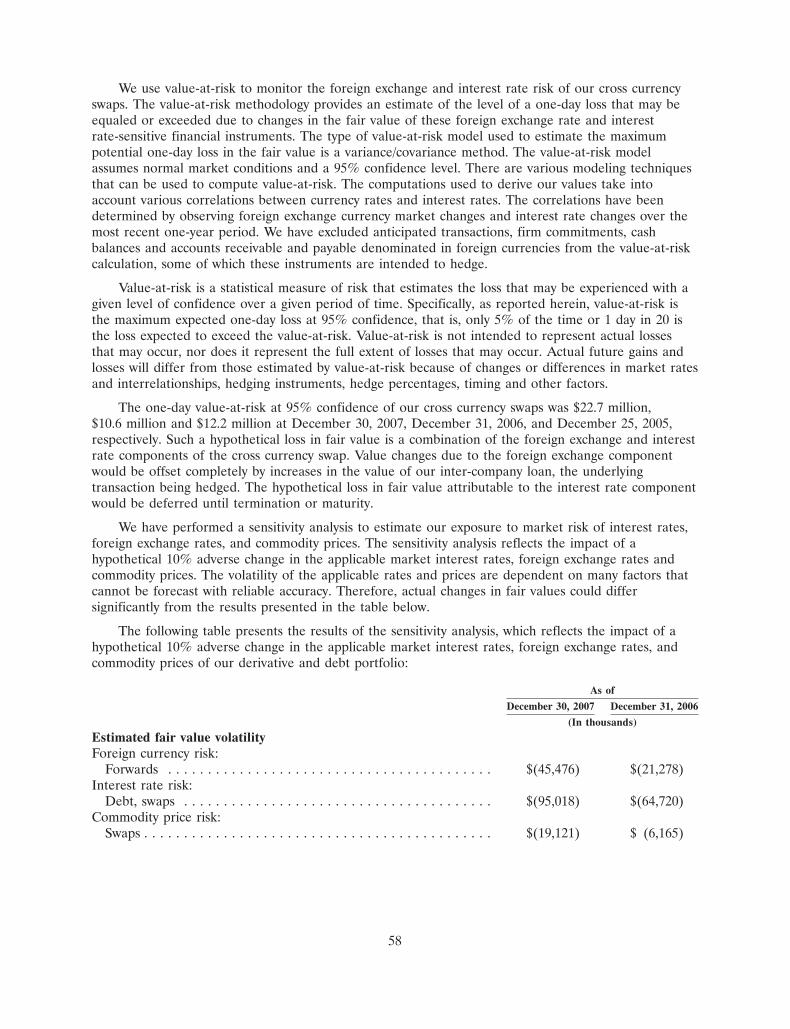
We use value-at-risk to monitor the foreign exchange and interest rate risk of our cross currencyswaps. The value-at-risk methodology provides an estimate of the level of a one-day loss that may beequaled or exceeded due to changes in the fair value of these foreign exchange rate and interestrate-sensitive financial instruments. The type of value-at-risk model used to estimate the maximumpotential one-day loss in the fair value is a variance/covariance method. The value-at-risk modelassumes normal market conditions and a 95% confidence level. There are various modeling techniquesthat can be used to compute value-at-risk. The computations used to derive our values take intoaccount various correlations between currency rates and interest rates. The correlations have beendetermined by observing foreign exchange currency market changes and interest rate changes over themost recent one-year period. We have excluded anticipated transactions, firm commitments, cashbalances and accounts receivable and payable denominated in foreign currencies from the value-at-riskcalculation, some of which these instruments are intended to hedge.
Value-at-risk is a statistical measure of risk that estimates the loss that may be experienced with agiven level of confidence over a given period of time. Specifically, as reported herein, value-at-risk isthe maximum expected one-day loss at 95% confidence, that is, only 5% of the time or 1 day in 20 isthe loss expected to exceed the value-at-risk. Value-at-risk is not intended to represent actual lossesthat may occur, nor does it represent the full extent of losses that may occur. Actual future gains andlosses will differ from those estimated by value-at-risk because of changes or differences in market ratesand interrelationships, hedging instruments, hedge percentages, timing and other factors.
The one-day value-at-risk at 95% confidence of our cross currency swaps was $22.7 million,$10.6 million and $12.2 million at December 30, 2007, December 31, 2006, and December 25, 2005,respectively. Such a hypothetical loss in fair value is a combination of the foreign exchange and interestrate components of the cross currency swap. Value changes due to the foreign exchange componentwould be offset completely by increases in the value of our inter-company loan, the underlyingtransaction being hedged. The hypothetical loss in fair value attributable to the interest rate componentwould be deferred until termination or maturity.
We have performed a sensitivity analysis to estimate our exposure to market risk of interest rates,foreign exchange rates, and commodity prices. The sensitivity analysis reflects the impact of ahypothetical 10% adverse change in the applicable market interest rates, foreign exchange rates andcommodity prices. The volatility of the applicable rates and prices are dependent on many factors thatcannot be forecast with reliable accuracy. Therefore, actual changes in fair values could differsignificantly from the results presented in the table below.
The following table presents the results of the sensitivity analysis, which reflects the impact of ahypothetical 10% adverse change in the applicable market interest rates, foreign exchange rates, andcommodity prices of our derivative and debt portfolio:
As of
December 30, 2007 December 31, 2006
(In thousands)
Estimated fair value volatilityForeign currency risk:
Forwards . . . . . . . . . . . . . . . . . . . . . . . . . . . . . . . . . . . . . . . . . $(45,476) $(21,278)Interest rate risk:
Debt, swaps . . . . . . . . . . . . . . . . . . . . . . . . . . . . . . . . . . . . . . . $(95,018) $(64,720)Commodity price risk:
Swaps . . . . . . . . . . . . . . . . . . . . . . . . . . . . . . . . . . . . . . . . . . . . $(19,121) $ (6,165)
58
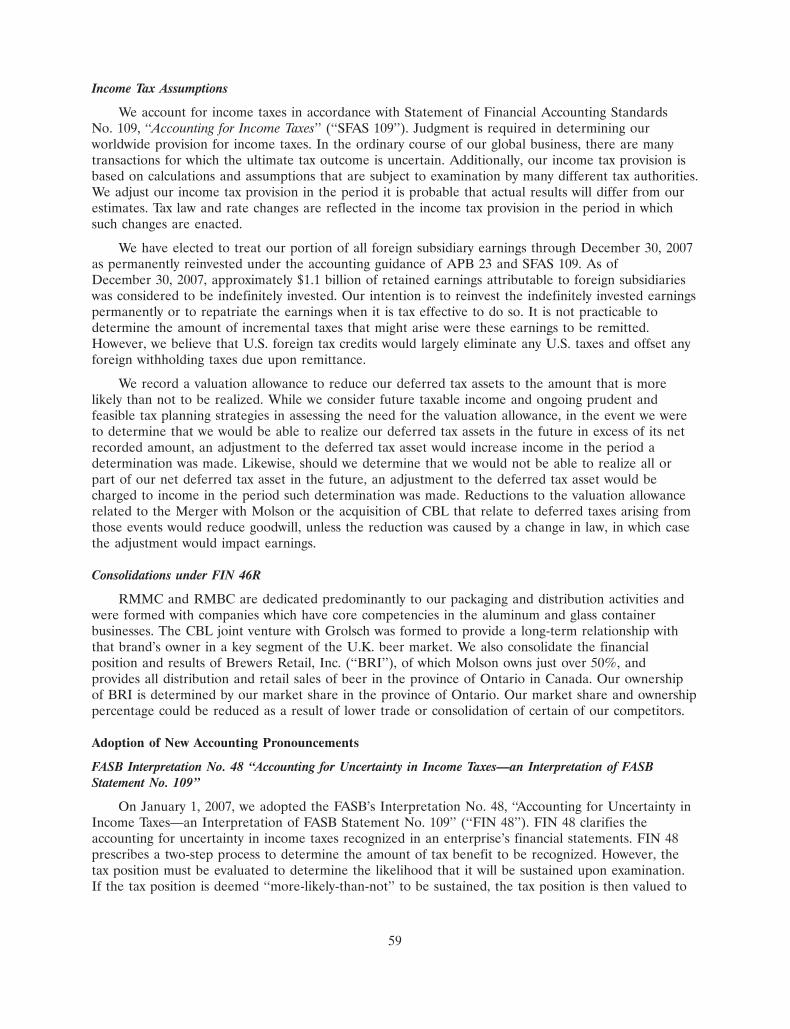
Income Tax Assumptions
We account for income taxes in accordance with Statement of Financial Accounting StandardsNo. 109, ‘‘Accounting for Income Taxes’’ (‘‘SFAS 109’’). Judgment is required in determining ourworldwide provision for income taxes. In the ordinary course of our global business, there are manytransactions for which the ultimate tax outcome is uncertain. Additionally, our income tax provision isbased on calculations and assumptions that are subject to examination by many different tax authorities.We adjust our income tax provision in the period it is probable that actual results will differ from ourestimates. Tax law and rate changes are reflected in the income tax provision in the period in whichsuch changes are enacted.
We have elected to treat our portion of all foreign subsidiary earnings through December 30, 2007as permanently reinvested under the accounting guidance of APB 23 and SFAS 109. As ofDecember 30, 2007, approximately $1.1 billion of retained earnings attributable to foreign subsidiarieswas considered to be indefinitely invested. Our intention is to reinvest the indefinitely invested earningspermanently or to repatriate the earnings when it is tax effective to do so. It is not practicable todetermine the amount of incremental taxes that might arise were these earnings to be remitted.However, we believe that U.S. foreign tax credits would largely eliminate any U.S. taxes and offset anyforeign withholding taxes due upon remittance.
We record a valuation allowance to reduce our deferred tax assets to the amount that is morelikely than not to be realized. While we consider future taxable income and ongoing prudent andfeasible tax planning strategies in assessing the need for the valuation allowance, in the event we wereto determine that we would be able to realize our deferred tax assets in the future in excess of its netrecorded amount, an adjustment to the deferred tax asset would increase income in the period adetermination was made. Likewise, should we determine that we would not be able to realize all orpart of our net deferred tax asset in the future, an adjustment to the deferred tax asset would becharged to income in the period such determination was made. Reductions to the valuation allowancerelated to the Merger with Molson or the acquisition of CBL that relate to deferred taxes arising fromthose events would reduce goodwill, unless the reduction was caused by a change in law, in which casethe adjustment would impact earnings.
Consolidations under FIN 46R
RMMC and RMBC are dedicated predominantly to our packaging and distribution activities andwere formed with companies which have core competencies in the aluminum and glass containerbusinesses. The CBL joint venture with Grolsch was formed to provide a long-term relationship withthat brand’s owner in a key segment of the U.K. beer market. We also consolidate the financialposition and results of Brewers Retail, Inc. (‘‘BRI’’), of which Molson owns just over 50%, andprovides all distribution and retail sales of beer in the province of Ontario in Canada. Our ownershipof BRI is determined by our market share in the province of Ontario. Our market share and ownershippercentage could be reduced as a result of lower trade or consolidation of certain of our competitors.
Adoption of New Accounting Pronouncements
FASB Interpretation No. 48 ‘‘Accounting for Uncertainty in Income Taxes—an Interpretation of FASBStatement No. 109’’
On January 1, 2007, we adopted the FASB’s Interpretation No. 48, ‘‘Accounting for Uncertainty inIncome Taxes—an Interpretation of FASB Statement No. 109’’ (‘‘FIN 48’’). FIN 48 clarifies theaccounting for uncertainty in income taxes recognized in an enterprise’s financial statements. FIN 48prescribes a two-step process to determine the amount of tax benefit to be recognized. However, thetax position must be evaluated to determine the likelihood that it will be sustained upon examination.If the tax position is deemed ‘‘more-likely-than-not’’ to be sustained, the tax position is then valued to
59
determine the amount of benefit to be recognized in the financial statements. As a result of theadoption of FIN 48, we increased tax-related liabilities by a total of $132.1 million and recorded$3.9 million as a current liability for unrecognized tax benefits and $128.2 million as a non-currentliability for unrecognized tax benefits. The cumulative effect of applying the new requirement has beenrecorded as a reduction to the beginning balance of retained earnings in the amount of $105.4 million,an increase to goodwill in the amount of $2.3 million and an increase to deferred tax assets of$24.4 million. The adjustment to goodwill reflects changes to liabilities for uncertain tax positionsestablished in the opening balance sheet of the acquisition of CBL in 2002 and the Merger in 2005.
As a result of the adoption of FIN 48, as of January 1, 2007, we had $297.4 million ofunrecognized tax benefits, of which approximately $257 million would, if recognized, affect our effectivetax rate.
We recognize interest and penalties related to unrecognized tax benefits as a component of incometax expense. Approximately $78 million of anticipated interest and penalty payments were accrued atJanuary 1, 2007, in unrecognized tax benefits.
SFAS No. 158 ‘‘Employers’ Accounting for Defined Benefit Pension and Other Postretirement Benefits—anamendment of FASB Statements No. 87, 88, 106, and 132(R)’’
SFAS 158 was issued in September 2006 and was effective for our annual fiscal year endingDecember 31, 2006. The standard, which is an amendment to SFAS 87, 88, 106 and 132R, requires anemployer to recognize the funded status of any defined benefit pension and/or other postretirementbenefit plans as an asset or liability in its statement of financial position. Funded status is the differencebetween the projected benefit obligation and the market value of plan assets for defined benefitpension plans, and is the difference between the accumulated benefit obligation and the market valueof plan assets (if any) for other post retirement benefit plans. SFAS 158 also requires an employer torecognize changes in that funded status in the year in which the changes occur through othercomprehensive income. As a result of the adoption of SFAS 158, liabilities related to our definedbenefit pension and postretirement plans increased by $245.0 million and our accumulated othercomprehensive income, net of related deferred income taxes, decreased by approximately $172 millionas of December 31, 2006. A portion of the change in the accumulated other comprehensive incomerelated to the adoption of SFAS 158 will be recognized in the statement of operations as a componentof net periodic pension benefit cost. See Notes 1, 16 and 17 to the Consolidated Financial Statementsin Item 8 for a detailed discussion regarding the adoption of SFAS 158.
SFAS No. 123R ‘‘Share-Based Payment’’
Statement of Financial Accounting Standard No. 123R (‘‘SFAS 123R’’) was issued in December2004 and became effective for us in the first quarter of 2006. SFAS 123R requires all share-basedpayments to qualified individuals, including grants of employee stock options, to be recognized ascompensation in the financial statements based on their grant date fair values. Prior to the adoption,under the guidance for qualifying stock option grants with no intrinsic value on the date of grant, wepresented pro forma share-based compensation expense for our stock option program in the notes toour financial statements. We have elected to use the modified prospective application method ofimplementing SFAS 123R, which does not require restatement of prior periods. Under the modifiedprospective application method, awards that are granted, modified, or settled after adoption ofSFAS 123R are prospectively measured and accounted for in accordance with SFAS 123R. Unvestedequity-classified awards that were granted prior to the adoption of SFAS 123R will continue to beaccounted for in accordance with SFAS 123, except that the fair value amounts are recognized in thestatement of operations and are subject to the forfeiture provisions of SFAS 123R. In March 2005, theSEC issued Staff Accounting Bulletin No. 107 (‘‘SAB 107’’) to assist preparers by simplifying some ofthe implementation challenges of SFAS 123R. In particular, SAB 107 provides supplemental
60
implementation guidance on SFAS 123R, including guidance on valuation methods, classification ofcompensation expense, inventory capitalization of share-based compensation cost, income tax effects,disclosures in Management’s Discussion and Analysis and several other issues. We applied theprinciples of SAB 107 in conjunction with our adoption of SFAS 123R in the first quarter of 2006.
SFAS 123R requires a calculation of the APIC Pool balance consisting of excess tax benefitsavailable to absorb related share-based compensation. FASB Staff Position FAS 123R-3, TransitionElection Related to Accounting for the Tax Effects of Share-Based Payment Awards (‘‘FSP 123R-3’’), whichwas issued on November 10, 2005, provides a practical transition election related to accounting for thetax effects of share-based payment awards to employees. Specifically, this FSP allows a company toelect the alternative or simplified method to calculate the opening APIC Pool balance. We haveadopted such alternative method provisions to calculate the beginning balance of the APIC Pool in thefinancial statements ended December 31, 2006. This adoption did not have any impact on our financialstatements.
The effect of adoption of SFAS 123R in 2006 was an additional expense of $6.1 million pretax,$4.4 million after tax, or $0.02 per diluted share. Since adoption of SFAS 123R we have evaluateddifferent types of instruments as share based awards and we currently use a combination of restrictedstock unit awards, performance share awards, deferred stock awards, and stock settled stockappreciation rights.
FASB Interpretation No. 47 ‘‘Accounting for Conditional Asset Retirement Obligations, an interpretation ofFASB Statement No. 143’’
In March 2005, the FASB issued FASB Interpretation No. 47—‘‘Accounting for Conditional AssetRetirement Obligations, an interpretation of FASB Statement No. 143’’ (‘‘FIN 47’’), which clarifies theterm ‘‘conditional asset retirement obligation’’ as used in SFAS No. 143, ‘‘Accounting for AssetRetirement Obligations’’ (‘‘SFAS 143’’). Specifically, FIN 47 provides that an asset retirement obligationis conditional when either the timing and (or) method of settling the obligation is conditioned on afuture event. Accordingly, an entity is required to recognize a liability for the fair value of a conditionalasset retirement obligation if the fair market value of the liability can be reasonably estimated.Uncertainty about the timing and (or) method of settlement of a conditional asset retirement obligationshould be factored into the measurement of the liability when sufficient information exists.
We adopted FIN 47 on December 25, 2005, which resulted in an increase to properties of$0.5 million, goodwill of $2.2 million, minority interest of $1.1 million, and liabilities of $9.6 millionrelated to asset retirement obligations. For asset retirement obligations related to the propertiesacquired in the acquisition of Molson Inc. as of February 9, 2005, such obligations increased thegoodwill amounts recognized upon the acquisition by $2.2 million as such properties were recorded atthe appraised fair market value at the acquisition date. These asset retirement obligations relateprimarily to clean-up, removal, or replacement activities and related costs for asbestos, coolants, wastewater, oils and other contaminants that may be contained within our manufacturing properties.
The adoption of FIN 47 was reflected in our financial statements as the cumulative effect of thechange in accounting principle with the catch-up adjustment of $3.7 million, net of tax benefit of$2.2 million, in the 2005 statement of operations. This adjustment represents a depreciation charge andan accretion of a liability from the time the obligation originated, which is either from the time of theacquisition or the construction of related long-lived assets, through December 25, 2005.
Inherent in the fair value calculation of asset retirement obligations are numerous assumptions andjudgments including the ultimate settlement amounts, inflation factors, credit adjusted discount rates,timing of settlement, and changes in the legal, regulatory, environmental and political environments. Tothe extent future revisions to these assumptions impact the fair value of the existing asset retirementobligation liability, a corresponding adjustment will be made to the asset balance. If the obligation is
61
settled for other than the carrying amount of the liability, we will recognize a gain or loss upon thesettlement. The net value of the asset retirement obligation liabilities calculated on a pro-forma basis asif the standard had been retrospectively applied to December 25, 2005 was $9.6 million.
New Accounting Pronouncements
SFAS No. 157 ‘‘Fair Value Measurements’’
In September 2006, the FASB issued SFAS No. 157, ‘‘Fair Value Measurements,’’ (SFAS 157) which,in part, is effective for us beginning in fiscal year 2008. This statement defines fair value, establishes aframework for measuring fair value and expands the related disclosure requirements. The statementindicates, among other things, that a fair value measurement assumes that the transaction to sell anasset or transfer a liability occurs in the principal market for the asset or liability or, in the absence ofa principal market, the most advantageous market for the asset or liability. Subsequent to the issuanceof SFAS 157, the FASB issued FASB Staff Positions (FSP) 157-1, ‘‘Application of FASB StatementNo. 157 to FASB Statement No. 13 and Other Accounting Pronouncements That Address Fair ValueMeasurements for Purposes of Lease Classification or Measurement under Statement 13’’ and FSP 157-2‘‘Effective Date of FASB Statement No. 157.’’ FSP 157-1 excludes, in certain circumstances, SFAS 13 andother accounting pronouncements that address fair value measurements for purposes of leaseclassification or measurement under Statement 13 from the provision of SFAS 157. FSP 157-2 delaysthe effective date of SFAS 157 for all nonfinancial assets and nonfinancial liabilities, except those thatare recognized or disclosed at fair value in the financial statements on a recurring basis. For theinstruments subject to the effective day delay under FSP 157-2, the effective day to adopt the fair valueprovisions for us will be the first quarter of 2009. While FSP 157-c has not been finalized or approved,it clarifies the principles in SFAS 157 on the fair value measurement of liabilities. Based upon ourevaluation of the statements and subsequent pronouncements issued to date, we believe that theadoption of the statement for financial assets and liabilities routinely measured and recorded ordisclosed at their fair values, will not have a significant impact on the determination or reporting of ourfinancial results. The company is currently evaluating the impacts, if any, the adoption of the provisionsof Statement No. 157 for non-financial assets and liabilities that are recognized or disclosed on anon-recurring basis.
SFAS No. 159 ‘‘The Fair Value Option for Financial Assets and Financial Liabilities. Including anamendment of FASB Statement No. 115’’
In February 2007, the FASB issued Statement No. 159 (‘‘SFAS 159’’). SFAS 159 permits entities tochoose to measure many financial instruments and certain other items at fair value that are notcurrently required to be measured at fair value. The objective of this Statement is to reduce bothcomplexity in accounting for financial instruments and the volatility in earnings caused by measuringrelated assets and liabilities using different measurement techniques. The fair value measurementprovisions are elective and can be applied to individual financial instruments. SFAS 159 requiresadditional disclosures related to the fair value measurements included in the entity’s financialstatements. This Statement is effective for us as of the beginning of our 2008 fiscal year. We do notintend to adopt the fair value measurement provisions of SFAS 159.
SFAS No. 141R ‘‘Business Combinations’’
In December 2007, the FASB issued SFAS No. 141 (revised 2007), ‘‘Business Combinations’’(SFAS 141R), which replaces SFAS No. 141, ‘‘Business Combinations.’’ Under the provisions ofSFAS 141R, acquisition costs will generally be expensed as incurred; noncontrolling interests will bevalued at fair value at the acquisition date; in-process research and development will be recorded atfair value as an indefinite-lived intangible asset at the acquisition date; restructuring costs associatedwith a business combination will generally be expensed subsequent to the acquisition date; and changes
62
in deferred tax asset valuation allowances and income tax uncertainties after the acquisition dategenerally will affect income tax expense. SFAS 141(R) will be effective, on a prospective basis, for allbusiness combinations for which the acquisition date is after the beginning of our fiscal year 2009, withthe exception of the accounting for valuation allowances on deferred taxes and acquired taxcontingencies for which the adoption is retrospective. We are currently evaluating the effects, if any,that SFAS 141R may have on our financial statements.
SFAS No. 160 ‘‘Noncontrolling interests in Consolidated Financial Statements’’
In December 2007, the FASB issued Financial Accounting Standards No. 160, ‘‘NoncontrollingInterests in Consolidated Financial Statements—an amendment of ARB No. 51’’ (SFAS 160) and iseffective for us beginning in fiscal year 2008. This Statement requires the recognition of anoncontrolling interest, or minority interest, as equity in the consolidated financial statements andseparate from the parent’s equity. The amount of net income attributable to the noncontrolling interestwill be included in consolidated net income on the face of the income statement. It also amends certainof ARB No. 51’s consolidation procedures for consistency with the requirements of SFAS 141(R). Thisstatement also includes expanded disclosure requirements regarding the interests of the parent and itsnoncontrolling interest. We are currently evaluating this new statement and anticipate that thestatement will not have a significant impact on the reporting of our results of operations.
Proposed Accounting Pronouncements
Proposed FASB Staff Position APB 14-a, ‘‘Accounting for Convertible Debt Instruments That May Be Settledin Cash Upon Conversion (Including Partial Cash Settlement)’’
The FASB in August 2007 proposed FASB staff position (FSP) APB 14-a, ‘‘Accounting forConvertible Debt Instruments That May Be Settled in Cash Upon Conversion (Including Partial CashSettlement)’’ (‘‘FSP APB 14-a’’). The proposed FSP specifies that issuers of such instruments shouldseparately account for the liability and equity components in a manner that will reflect the entity’snonconvertible debt borrowing rate on the instrument’s issuance date when interest cost is recognizedin subsequent periods. Our 2007 2.5% Convertible Senior Notes due July 30, 2013 are within the scopeof the proposed FSP APB 14-a; therefore if the FSP APB 14-a is issued as proposed, we would berequired to record the debt portions of our 2.5% Convertible Senior Notes at their fair value on thedate of issuance and amortize the discount into interest expense over the life of the debt. However,there would be no effect on our cash interest payments. If the FSP is issued as proposed, we expect theincrease in non-cash interest expense recognized on our consolidated financial statements to besignificant. As currently proposed, FSP APB 14-a would be applied retrospectively to all periodspresented. FSP APB 14-a is currently in redeliberations with the FASB following the end of itscomment period in October 2007. The final content and effective date of FSP APB 14-a are dependentupon future FASB action on this matter.
Related Party Transactions
Transactions with Management and Others
We employed members of the Coors and Molson families, who collectively owned 84% of thevoting A share, common and exchangeable stock of the Company throughout 2007. Hiring andplacement decisions are made based upon merit, and compensation packages offered arecommensurate with policies in place for all employees of the Company.
As of December 30, 2007, various Coors family trusts collectively owned approximately 42% of ourClass A common and exchangeable stock, approximately 13% of our Class B common andexchangeable stock, and approximately 30% of Graphic Packaging Corporation’s (‘‘GPC’’) commonstock.
63
Certain Business Relationships
We purchase a large portion of our paperboard packaging requirements from GPC, a relatedparty. Our payments under the GPC packaging agreement in 2007, 2006 and 2005 totaled $85.7 million,$74.0 million and $75.3 million, respectively. Related accounts payable balances included in AffiliatesAccounts Payable on the Consolidated Balance Sheets were $0.1 million and $0.8 million atDecember 30, 2007, and December 31, 2006, respectively.
We obtain public relations services from National Public Relations, Inc., a related party. Ourpayments as a result of the services provided in 2007, 2006 and 2005 totaled $0.5 million, $0.2 millionand $0.1 million, respectively.
ITEM 7A. Quantitative and Qualitative Disclosures About Market Risk
In the normal course of business, we are exposed to fluctuations in interest rates, foreigncurrencies, and the prices of production and packaging materials. We have established policies andprocedures to govern the strategic management of these exposures through a variety of financialinstruments. By policy, we do not enter into any contracts for the purpose of trading or speculation.
Our objective in managing our exposure to fluctuations in interest rates, foreign currency exchangerates, and production and packaging materials prices is to decrease the volatility of our earnings andcash flows affected by potential changes in underlying rates and prices. To achieve this objective, weenter into foreign currency forward contracts, commodity swaps, interest rate swaps, and cross currencyswaps, the values of which change in the opposite direction of the anticipated cash flows. We do nothedge the value of net investments in foreign-currency-denominated operations or translated earningsof foreign subsidiaries. Our primary foreign currency exposures are Canadian dollar (‘‘CAD’’), Britishpound sterling (‘‘GBP’’ or ‘‘£’’).
Derivatives are either exchange-traded instruments or over-the-counter agreements entered intowith highly rated financial institutions. No losses on over-the-counter agreements due to counterpartycredit issues are anticipated. All over-the-counter agreements are entered into with counterparties ratedno lower than A (Standard & Poor’s) or A2 (Moody’s). In some instances our counterparties and wehave reciprocal collateralization agreements regarding fair value positions in excess of certainthresholds. These agreements call for the posting of collateral in the form of cash, treasury securities orletters of credit if a fair value loss position to our counterparties or us exceeds a certain amount. AtDecember 30, 2007, no collateral was posted by our counterparties or us.
Details of all other market-sensitive derivative and other financial instruments, including their fairvalues, are included in the table below. These instruments include long-term fixed rate debt, foreign
64
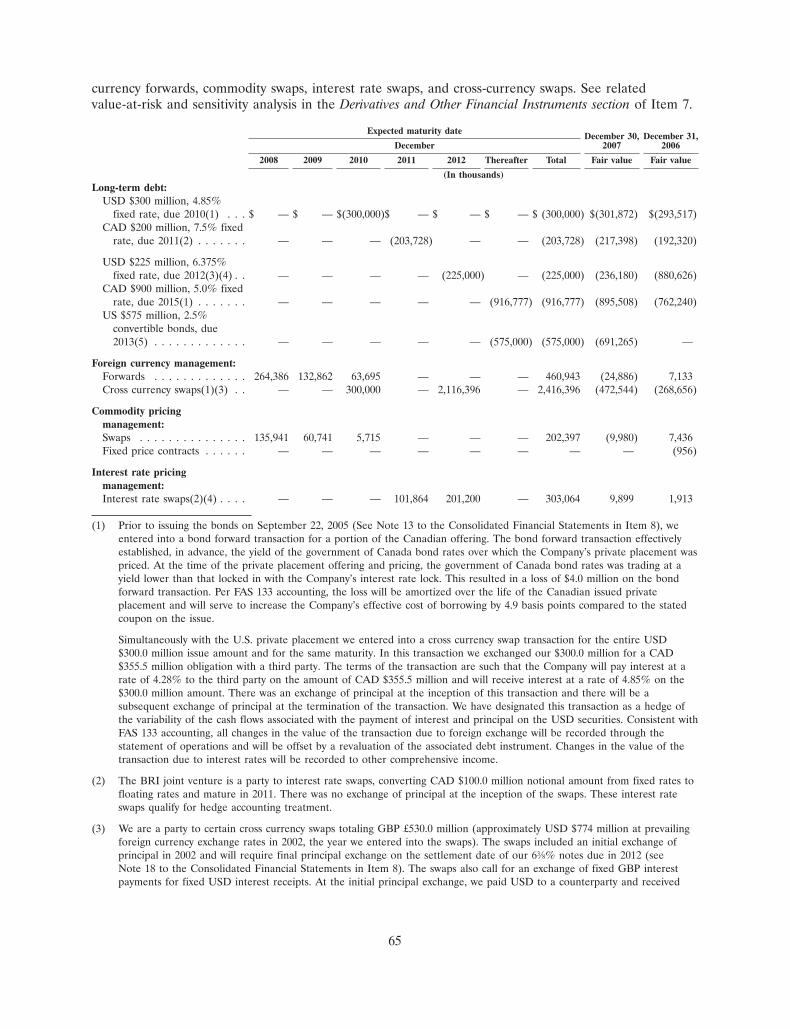
currency forwards, commodity swaps, interest rate swaps, and cross-currency swaps. See relatedvalue-at-risk and sensitivity analysis in the Derivatives and Other Financial Instruments section of Item 7.
Expected maturity date December 30, December 31,December 2007 2006
2008 2009 2010 2011 2012 Thereafter Total Fair value Fair value
(In thousands)Long-term debt:
USD $300 million, 4.85%fixed rate, due 2010(1) . . . $ — $ — $(300,000)$ — $ — $ — $ (300,000) $(301,872) $(293,517)
CAD $200 million, 7.5% fixedrate, due 2011(2) . . . . . . . — — — (203,728) — — (203,728) (217,398) (192,320)
USD $225 million, 6.375%fixed rate, due 2012(3)(4) . . — — — — (225,000) — (225,000) (236,180) (880,626)
CAD $900 million, 5.0% fixedrate, due 2015(1) . . . . . . . — — — — — (916,777) (916,777) (895,508) (762,240)
US $575 million, 2.5%convertible bonds, due2013(5) . . . . . . . . . . . . . — — — — — (575,000) (575,000) (691,265) —
Foreign currency management:Forwards . . . . . . . . . . . . . 264,386 132,862 63,695 — — — 460,943 (24,886) 7,133Cross currency swaps(1)(3) . . — — 300,000 — 2,116,396 — 2,416,396 (472,544) (268,656)
Commodity pricingmanagement:Swaps . . . . . . . . . . . . . . . 135,941 60,741 5,715 — — — 202,397 (9,980) 7,436Fixed price contracts . . . . . . — — — — — — — — (956)
Interest rate pricingmanagement:Interest rate swaps(2)(4) . . . . — — — 101,864 201,200 — 303,064 9,899 1,913
(1) Prior to issuing the bonds on September 22, 2005 (See Note 13 to the Consolidated Financial Statements in Item 8), weentered into a bond forward transaction for a portion of the Canadian offering. The bond forward transaction effectivelyestablished, in advance, the yield of the government of Canada bond rates over which the Company’s private placement waspriced. At the time of the private placement offering and pricing, the government of Canada bond rates was trading at ayield lower than that locked in with the Company’s interest rate lock. This resulted in a loss of $4.0 million on the bondforward transaction. Per FAS 133 accounting, the loss will be amortized over the life of the Canadian issued privateplacement and will serve to increase the Company’s effective cost of borrowing by 4.9 basis points compared to the statedcoupon on the issue.
Simultaneously with the U.S. private placement we entered into a cross currency swap transaction for the entire USD$300.0 million issue amount and for the same maturity. In this transaction we exchanged our $300.0 million for a CAD$355.5 million obligation with a third party. The terms of the transaction are such that the Company will pay interest at arate of 4.28% to the third party on the amount of CAD $355.5 million and will receive interest at a rate of 4.85% on the$300.0 million amount. There was an exchange of principal at the inception of this transaction and there will be asubsequent exchange of principal at the termination of the transaction. We have designated this transaction as a hedge ofthe variability of the cash flows associated with the payment of interest and principal on the USD securities. Consistent withFAS 133 accounting, all changes in the value of the transaction due to foreign exchange will be recorded through thestatement of operations and will be offset by a revaluation of the associated debt instrument. Changes in the value of thetransaction due to interest rates will be recorded to other comprehensive income.
(2) The BRI joint venture is a party to interest rate swaps, converting CAD $100.0 million notional amount from fixed rates tofloating rates and mature in 2011. There was no exchange of principal at the inception of the swaps. These interest rateswaps qualify for hedge accounting treatment.
(3) We are a party to certain cross currency swaps totaling GBP £530.0 million (approximately USD $774 million at prevailingforeign currency exchange rates in 2002, the year we entered into the swaps). The swaps included an initial exchange ofprincipal in 2002 and will require final principal exchange on the settlement date of our 63⁄8% notes due in 2012 (seeNote 18 to the Consolidated Financial Statements in Item 8). The swaps also call for an exchange of fixed GBP interestpayments for fixed USD interest receipts. At the initial principal exchange, we paid USD to a counterparty and received
65
GBP. Upon final exchange, we will provide GBP to the counterparty and receive USD. The cross currency swaps have beendesignated as cash flow hedges.
(4) We are a party to interest rate swap agreements related to our 63⁄8% fixed rate debt. The interest rate swaps convert$201.2 million notional amount from fixed rates to floating rates and mature in 2012. We will receive fixed USD interestpayments semi-annually at a rate of 63⁄8% per annum and pay a rate to our counterparty based on a credit spread plus thethree-month LIBOR rate, thereby exchanging a fixed interest obligation for a floating rate obligation. There was noexchange of principal at the inception of the swaps. We designated the interest rate swaps as fair value hedges of thechanges in the fair value of $201.2 million fixed rate debt attributable to changes in the LIBOR swap rates. See accountingmethod discussion in Note 18 to the Consolidated Financial Statements in Item 8.
(5) On June 15, 2007, MCBC issued $575 million of 2.5% Convertible Senior Notes in a public offering discussed further inNote 13 to the Consolidated Financial Statements in Item 8.
66
ITEM 8. Financial Statements and Supplementary Data
Index to Financial Statements Page
Consolidated Financial Statements:Report of Independent Registered Public Accounting Firm . . . . . . . . . . . . . . . . . . . . . . . . . . 69Consolidated Statements of Operations and Comprehensive Income for each of the three years
in the period ended December 30, 2007 . . . . . . . . . . . . . . . . . . . . . . . . . . . . . . . . . . . . . . . 70Consolidated Balance Sheets at December 30, 2007, and December 31, 2006 . . . . . . . . . . . . . . 71Consolidated Statements of Cash Flows for each of the three years in the period ended
December 30, 2007 . . . . . . . . . . . . . . . . . . . . . . . . . . . . . . . . . . . . . . . . . . . . . . . . . . . . . . 73Consolidated Statements of Stockholders’ Equity for each of the three years in the period
ended December 30, 2007 . . . . . . . . . . . . . . . . . . . . . . . . . . . . . . . . . . . . . . . . . . . . . . . . . 75Notes to Consolidated Financial Statements . . . . . . . . . . . . . . . . . . . . . . . . . . . . . . . . . . . . . 76
67
MANAGEMENT’S REPORT TO STOCKHOLDERS
The preparation, integrity and objectivity of the financial statements and all other financialinformation included in this annual report are the responsibility of the management of Molson CoorsBrewing Company. The financial statements have been prepared in accordance with generally acceptedaccounting principles, applying estimates based on management’s best judgment where necessary.Management believes that all material uncertainties have been appropriately accounted for anddisclosed.
The established system of accounting procedures and related internal controls provide reasonableassurance that the assets are safeguarded against loss and that the policies and procedures areimplemented by qualified personnel.
PricewaterhouseCoopers LLP, the Company’s independent registered public accounting firm,provides an objective, independent audit of the consolidated financial statements and internal controlover financial reporting. Their accompanying report is based upon an examination conducted inaccordance with standards of the Public Company Accounting Oversight Board (United States),including tests of accounting procedures, records and internal controls.
The Board of Directors, operating through its Audit Committee composed of independent, outsidedirectors, monitors the Company’s accounting control systems and reviews the results of the Company’sauditing activities. The Audit Committee meets at least quarterly, either separately or jointly, withrepresentatives of management, PricewaterhouseCoopers LLP, and internal auditors. To ensurecomplete independence, PricewaterhouseCoopers LLP and the Company’s internal auditors have fulland free access to the Audit Committee and may meet with or without the presence of management.
W. LEO KIELY, III TIMOTHY V. WOLFGlobal Chief Executive Officer Vice President andMolson Coors Brewing Company Global Chief Financial Officer,February 21, 2008 Molson Coors Brewing Company
February 21, 2008
68
Report of Independent Registered Public Accounting FirmTo the Board of Directors and Shareholders
of Molson Coors Brewing Company:In our opinion, the consolidated financial statements listed in the accompanying index present
fairly, in all material respects, the financial position of Molson Coors Brewing Company and itssubsidiaries at December 30, 2007 and December 31, 2006, and the results of their operations and theircash flows for each of the three years in the period ended December 30, 2007 in conformity withaccounting principles generally accepted in the United States of America. In addition, in our opinion,the financial statement schedule listed in the index appearing under Item 15(a) (2) presents fairly, in allmaterial respects, the information set forth therein when read in conjunction with the relatedconsolidated financial statements. Also in our opinion, the Company maintained, in all materialrespects, effective internal control over financial reporting as of December 30, 2007 based on criteriaestablished in Internal Control—Integrated Framework issued by the Committee of SponsoringOrganizations of the Treadway Commission (COSO). The Company’s management is responsible forthese financial statements and financial statement schedule, for maintaining effective internal controlover financial reporting and for its assessment of the effectiveness of internal control over financialreporting, included in Management’s Report on Internal Control over Financial Reporting appearingunder Item 9A. Our responsibility is to express opinions on these financial statements, on the financialstatement schedule, and on the Company’s internal control over financial reporting based on ourintegrated audits. We conducted our audits in accordance with the standards of the Public CompanyAccounting Oversight Board (United States). Those standards require that we plan and perform theaudits to obtain reasonable assurance about whether the financial statements are free of materialmisstatement and whether effective internal control over financial reporting was maintained in allmaterial respects. Our audits of the financial statements included examining, on a test basis, evidencesupporting the amounts and disclosures in the financial statements, assessing the accounting principlesused and significant estimates made by management, and evaluating the overall financial statementpresentation. Our audit of internal control over financial reporting included obtaining an understandingof internal control over financial reporting, assessing the risk that a material weakness exists, andtesting and evaluating the design and operating effectiveness of internal control based on the assessedrisk. Our audits also included performing such other procedures as we considered necessary in thecircumstances. We believe that our audits provide a reasonable basis for our opinions.
As discussed in Note 1 to the consolidated financial statements, the Company changed the mannerin which it accounts for conditional asset retirement obligations in 2005, the manner in which itaccounts for share-based compensation and defined benefit pension and other postretirement plans in2006, and the manner in which it accounts for uncertain tax positions in 2007.
A company’s internal control over financial reporting is a process designed to provide reasonableassurance regarding the reliability of financial reporting and the preparation of financial statements forexternal purposes in accordance with generally accepted accounting principles. A company’s internalcontrol over financial reporting includes those policies and procedures that (i) pertain to themaintenance of records that, in reasonable detail, accurately and fairly reflect the transactions anddispositions of the assets of the company; (ii) provide reasonable assurance that transactions arerecorded as necessary to permit preparation of financial statements in accordance with generallyaccepted accounting principles, and that receipts and expenditures of the company are being made onlyin accordance with authorizations of management and directors of the company; and (iii) providereasonable assurance regarding prevention or timely detection of unauthorized acquisition, use, ordisposition of the company’s assets that could have a material effect on the financial statements.
Because of its inherent limitations, internal control over financial reporting may not prevent ordetect misstatements. Also, projections of any evaluation of effectiveness to future periods are subjectto the risk that controls may become inadequate because of changes in conditions, or that the degreeof compliance with the policies or procedures may deteriorate.PricewaterhouseCoopers LLPDenver, ColoradoFebruary 21, 2008
69
MOLSON COORS BREWING COMPANY AND SUBSIDIARIES
CONSOLIDATED STATEMENTS OF OPERATIONSAND COMPREHENSIVE INCOME
(IN THOUSANDS, EXCEPT PER SHARE DATA)
For the Years Ended
December 30, December 31, December 25,2007 2006(1) 2005(1)
Sales . . . . . . . . . . . . . . . . . . . . . . . . . . . . . . . . . . . . . . . . . . . . . $ 8,319,673 $ 7,901,614 $ 7,417,702Excise taxes . . . . . . . . . . . . . . . . . . . . . . . . . . . . . . . . . . . . . . . . (2,129,081) (2,056,629) (1,910,796)
Net sales . . . . . . . . . . . . . . . . . . . . . . . . . . . . . . . . . . . . . . . . 6,190,592 5,844,985 5,506,906Cost of goods sold . . . . . . . . . . . . . . . . . . . . . . . . . . . . . . . . . . . (3,702,921) (3,481,081) (3,306,949)
Gross profit . . . . . . . . . . . . . . . . . . . . . . . . . . . . . . . . . . . . . . 2,487,671 2,363,904 2,199,957Marketing, general and administrative expenses . . . . . . . . . . . . . . . . (1,734,408) (1,705,405) (1,632,516)Special items, net . . . . . . . . . . . . . . . . . . . . . . . . . . . . . . . . . . . . (112,194) (77,404) (145,392)
Operating income . . . . . . . . . . . . . . . . . . . . . . . . . . . . . . . . . . 641,069 581,095 422,049Other income (expense), net
Interest expense . . . . . . . . . . . . . . . . . . . . . . . . . . . . . . . . . . . . (126,462) (143,070) (131,106)Interest income . . . . . . . . . . . . . . . . . . . . . . . . . . . . . . . . . . . . 26,587 16,289 17,503Debt extinguishment costs . . . . . . . . . . . . . . . . . . . . . . . . . . . . . (24,478) — —Other income (expense), net . . . . . . . . . . . . . . . . . . . . . . . . . . . 17,662 17,736 (13,245)Total other expense . . . . . . . . . . . . . . . . . . . . . . . . . . . . . . . . . (106,691) (109,045) (126,848)Income from continuing operations before income taxes and
minority interests . . . . . . . . . . . . . . . . . . . . . . . . . . . . . . . . . 534,378 472,050 295,201Income tax expense . . . . . . . . . . . . . . . . . . . . . . . . . . . . . . . . . . . (4,186) (82,405) (50,264)
Income from continuing operations before minority interests . . . . . 530,192 389,645 244,937Minority interests in net income of consolidated entities . . . . . . . . . . (15,318) (16,089) (14,491)
Income from continuing operations . . . . . . . . . . . . . . . . . . . . . . 514,874 373,556 230,446Loss from discontinued operations, net of tax . . . . . . . . . . . . . . . . . (17,682) (12,525) (91,826)
Income before cumulative effect of change in accounting principle . 497,192 361,031 138,620Cumulative effect of change in accounting principle, net of tax . . . . . — — (3,676)
Net income . . . . . . . . . . . . . . . . . . . . . . . . . . . . . . . . . . . . . . . $ 497,192 $ 361,031 $ 134,944
Other comprehensive income, net of tax:Foreign currency translation adjustments . . . . . . . . . . . . . . . . . . . 795,060 157,207 122,971Unrealized (loss) gain on derivative instruments . . . . . . . . . . . . . . (3,428) 18,347 (19,276)Realized loss (gain) reclassified to net income . . . . . . . . . . . . . . . 2,933 (4,605) (8,404)Pension and other other postretirement benefit adjustments . . . . . . (6,614) 131,126 (6,203)
Comprehensive income . . . . . . . . . . . . . . . . . . . . . . . . . . . . . . . . $ 1,285,143 $ 663,106 $ 224,032
Basic income (loss) per share:From continuing operations . . . . . . . . . . . . . . . . . . . . . . . . . . . . $ 2.88 $ 2.17 $ 1.45From discontinued operations . . . . . . . . . . . . . . . . . . . . . . . . . . (0.10) (0.07) (0.58)Cumulative effect of change in accounting principle . . . . . . . . . . . — — (0.02)
Basic net income per share . . . . . . . . . . . . . . . . . . . . . . . . . . . . . . $ 2.78 $ 2.10 $ 0.85
Diluted income (loss) per share:From continuing operations . . . . . . . . . . . . . . . . . . . . . . . . . . . . $ 2.84 $ 2.16 $ 1.44From discontinued operations . . . . . . . . . . . . . . . . . . . . . . . . . . (0.10) (0.08) (0.57)Cumulative effect of change in accounting principle . . . . . . . . . . . — — (0.03)
Diluted net income per share . . . . . . . . . . . . . . . . . . . . . . . . . . . . $ 2.74 $ 2.08 $ 0.84
Weighted average shares—basic . . . . . . . . . . . . . . . . . . . . . . . . . . 178,681 172,166 158,806Weighted average shares—diluted . . . . . . . . . . . . . . . . . . . . . . . . . 181,437 173,312 160,072
(1) Share and per share amounts have been adjusted from previously reported amounts to reflect a 2-for-1 stocksplit issued in the form of a stock dividend effective October 3, 2007.
See notes to consolidated financial statements
70
MOLSON COORS BREWING COMPANY AND SUBSIDIARIES
CONSOLIDATED BALANCE SHEETS
(IN THOUSANDS)
As of
December 30, 2007 December 31, 2006
AssetsCurrent assets:
Cash and cash equivalents . . . . . . . . . . . . . . . . . . . . . . . . . . . . . $ 377,023 $ 182,186Accounts and notes receivable:
Trade, less allowance for doubtful accounts of $8,827 and$10,363, respectively . . . . . . . . . . . . . . . . . . . . . . . . . . . . . . 758,526 679,507
Affiliates . . . . . . . . . . . . . . . . . . . . . . . . . . . . . . . . . . . . . . . . — 4,002Current notes receivable and other receivables, less allowance
for doubtful accounts of $3,181 and $3,439, respectively . . . . 112,626 145,090Inventories:
Finished, less allowance for obsolete inventories of $995 and$1,057, respectively . . . . . . . . . . . . . . . . . . . . . . . . . . . . . . . 163,955 138,449
In process . . . . . . . . . . . . . . . . . . . . . . . . . . . . . . . . . . . . . . . 40,673 38,692Raw materials . . . . . . . . . . . . . . . . . . . . . . . . . . . . . . . . . . . . 82,323 80,918Packaging materials, less allowance for obsolete inventories of
$579 and $1,807, respectively . . . . . . . . . . . . . . . . . . . . . . . . 82,570 61,479
Total inventories . . . . . . . . . . . . . . . . . . . . . . . . . . . . . . . . . . . . 369,521 319,538Maintenance and operating supplies, less allowance for obsolete
supplies of $10,556 and $9,554, respectively . . . . . . . . . . . . . . . 34,782 32,639Other current assets, less allowance for advertising supplies of
$948 and $871, respectively . . . . . . . . . . . . . . . . . . . . . . . . . . . 100,899 84,277Deferred tax assets . . . . . . . . . . . . . . . . . . . . . . . . . . . . . . . . . . 17,901 6,477Discontinued operations . . . . . . . . . . . . . . . . . . . . . . . . . . . . . . 5,536 4,640
Total current assets . . . . . . . . . . . . . . . . . . . . . . . . . . . . . . . . 1,776,814 1,458,356Properties, less accumulated depreciation of $2,714,170 and
$2,615,000, respectively . . . . . . . . . . . . . . . . . . . . . . . . . . . . . . . 2,696,153 2,421,484Goodwill . . . . . . . . . . . . . . . . . . . . . . . . . . . . . . . . . . . . . . . . . . . 3,346,486 2,968,676Other intangibles, less accumulated amortization of $312,067 and
$221,867, respectively . . . . . . . . . . . . . . . . . . . . . . . . . . . . . . . . . 5,039,363 4,395,294Deferred tax assets . . . . . . . . . . . . . . . . . . . . . . . . . . . . . . . . . . . . 336,907 131,349Notes receivable, less allowance for doubtful accounts of $7,930 and
$10,318, respectively . . . . . . . . . . . . . . . . . . . . . . . . . . . . . . . . . 71,239 75,243Other assets . . . . . . . . . . . . . . . . . . . . . . . . . . . . . . . . . . . . . . . . . 179,502 148,694Discontinued operations . . . . . . . . . . . . . . . . . . . . . . . . . . . . . . . . 5,102 4,317
Total assets . . . . . . . . . . . . . . . . . . . . . . . . . . . . . . . . . . . . . . . . . . $13,451,566 $11,603,413
(continued)
See notes to consolidated financial statements.
71

MOLSON COORS BREWING COMPANY AND SUBSIDIARIES
CONSOLIDATED BALANCE SHEETS
(IN THOUSANDS, EXCEPT SHARE DATA)
As of
December 30, 2007 December 31, 2006
Liabilities and stockholders’ equityCurrent liabilities:
Accounts payable:Trade . . . . . . . . . . . . . . . . . . . . . . . . . . . . . . . . . . . . . . . . . . $ 351,595 $ 388,281Affiliates . . . . . . . . . . . . . . . . . . . . . . . . . . . . . . . . . . . . . . . . 29,104 31,369
Accrued expenses and other liabilities . . . . . . . . . . . . . . . . . . . . . 1,189,134 1,225,406Deferred tax liabilities . . . . . . . . . . . . . . . . . . . . . . . . . . . . . . . . 120,605 116,329Short-term borrowings . . . . . . . . . . . . . . . . . . . . . . . . . . . . . . . . 55 432Current portion of long-term debt . . . . . . . . . . . . . . . . . . . . . . . 4,226 4,009Discontinued operations . . . . . . . . . . . . . . . . . . . . . . . . . . . . . . 40,858 34,290
Total current liabilities . . . . . . . . . . . . . . . . . . . . . . . . . . . . . . 1,735,577 1,800,116Long-term debt . . . . . . . . . . . . . . . . . . . . . . . . . . . . . . . . . . . . . . 2,260,596 2,129,845Pension and post-retirement benefits . . . . . . . . . . . . . . . . . . . . . . . 677,786 753,697Derivative hedging instruments . . . . . . . . . . . . . . . . . . . . . . . . . . . 477,450 269,253Deferred tax liabilities . . . . . . . . . . . . . . . . . . . . . . . . . . . . . . . . . . 605,377 607,000Unrecognized tax benefits . . . . . . . . . . . . . . . . . . . . . . . . . . . . . . . 285,921 —Other liabilities . . . . . . . . . . . . . . . . . . . . . . . . . . . . . . . . . . . . . . 90,926 93,721Discontinued operations . . . . . . . . . . . . . . . . . . . . . . . . . . . . . . . . 124,791 85,643
Total liabilities . . . . . . . . . . . . . . . . . . . . . . . . . . . . . . . . . . . . . . 6,258,424 5,739,275Commitments and contingencies (Note 20)Minority interests . . . . . . . . . . . . . . . . . . . . . . . . . . . . . . . . . . . . . 43,751 46,782Stockholders’ equity
Capital stock:Preferred stock, non-voting, no par value (authorized:
25,000,000 shares; none issued) . . . . . . . . . . . . . . . . . . . . . . — —Class A common stock, voting, $0.01 par value (authorized:
500,000,000 shares; issued and outstanding: 2,674,772 sharesat December 30, 2007 and December 31, 2006, respectively) . 27 27
Class B common stock, non-voting, $0.01 par value (authorized:500,000,000 shares; issued and outstanding: 149,638,230shares and 133,216,966 shares at December 30, 2007 andDecember 31, 2006, respectively) . . . . . . . . . . . . . . . . . . . . . 1,496 1,332
Class A exchangeable shares (issued and outstanding: 3,315,899shares and 3,314,250 shares at December 30, 2007 andDecember 31, 2006, respectively) . . . . . . . . . . . . . . . . . . . . . 124,760 124,699
Class B exchangeable shares (issued and outstanding:25,123,570 shares and 34,843,536 shares at December 30,2007 and December 31, 2006, respectively) . . . . . . . . . . . . . . 945,275 1,310,989
Total capital stock . . . . . . . . . . . . . . . . . . . . . . . . . . . . . . . . . 1,071,558 1,437,047Paid-in capital . . . . . . . . . . . . . . . . . . . . . . . . . . . . . . . . . . . . . . 3,022,449 2,389,876Retained earnings . . . . . . . . . . . . . . . . . . . . . . . . . . . . . . . . . . . 1,950,455 1,673,455Accumulated other comprehensive income . . . . . . . . . . . . . . . . . 1,104,929 316,978
Total stockholders’ equity . . . . . . . . . . . . . . . . . . . . . . . . . . . . 7,149,391 5,817,356
Total liabilities and stockholders’ equity . . . . . . . . . . . . . . . . . . . . . $13,451,566 $11,603,413
See notes to consolidated financial statements.
72
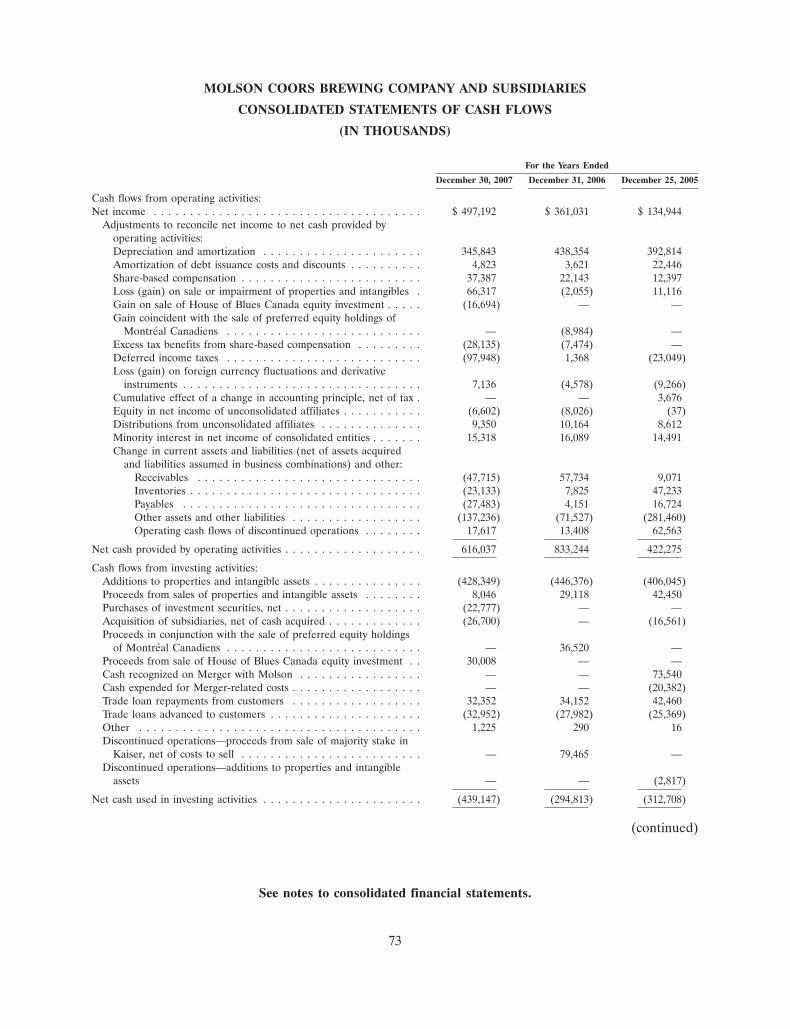
MOLSON COORS BREWING COMPANY AND SUBSIDIARIES
CONSOLIDATED STATEMENTS OF CASH FLOWS
(IN THOUSANDS)
For the Years Ended
December 30, 2007 December 31, 2006 December 25, 2005
Cash flows from operating activities:Net income . . . . . . . . . . . . . . . . . . . . . . . . . . . . . . . . . . . . . $ 497,192 $ 361,031 $ 134,944
Adjustments to reconcile net income to net cash provided byoperating activities:Depreciation and amortization . . . . . . . . . . . . . . . . . . . . . . 345,843 438,354 392,814Amortization of debt issuance costs and discounts . . . . . . . . . . 4,823 3,621 22,446Share-based compensation . . . . . . . . . . . . . . . . . . . . . . . . . 37,387 22,143 12,397Loss (gain) on sale or impairment of properties and intangibles . 66,317 (2,055) 11,116Gain on sale of House of Blues Canada equity investment . . . . . (16,694) — —Gain coincident with the sale of preferred equity holdings of
Montreal Canadiens . . . . . . . . . . . . . . . . . . . . . . . . . . . — (8,984) —Excess tax benefits from share-based compensation . . . . . . . . . (28,135) (7,474) —Deferred income taxes . . . . . . . . . . . . . . . . . . . . . . . . . . . (97,948) 1,368 (23,049)Loss (gain) on foreign currency fluctuations and derivative
instruments . . . . . . . . . . . . . . . . . . . . . . . . . . . . . . . . . 7,136 (4,578) (9,266)Cumulative effect of a change in accounting principle, net of tax . — — 3,676Equity in net income of unconsolidated affiliates . . . . . . . . . . . (6,602) (8,026) (37)Distributions from unconsolidated affiliates . . . . . . . . . . . . . . 9,350 10,164 8,612Minority interest in net income of consolidated entities . . . . . . . 15,318 16,089 14,491Change in current assets and liabilities (net of assets acquired
and liabilities assumed in business combinations) and other:Receivables . . . . . . . . . . . . . . . . . . . . . . . . . . . . . . . (47,715) 57,734 9,071Inventories . . . . . . . . . . . . . . . . . . . . . . . . . . . . . . . . (23,133) 7,825 47,233Payables . . . . . . . . . . . . . . . . . . . . . . . . . . . . . . . . . (27,483) 4,151 16,724Other assets and other liabilities . . . . . . . . . . . . . . . . . . (137,236) (71,527) (281,460)Operating cash flows of discontinued operations . . . . . . . . 17,617 13,408 62,563
Net cash provided by operating activities . . . . . . . . . . . . . . . . . . . 616,037 833,244 422,275
Cash flows from investing activities:Additions to properties and intangible assets . . . . . . . . . . . . . . . (428,349) (446,376) (406,045)Proceeds from sales of properties and intangible assets . . . . . . . . 8,046 29,118 42,450Purchases of investment securities, net . . . . . . . . . . . . . . . . . . . (22,777) — —Acquisition of subsidiaries, net of cash acquired . . . . . . . . . . . . . (26,700) — (16,561)Proceeds in conjunction with the sale of preferred equity holdings
of Montreal Canadiens . . . . . . . . . . . . . . . . . . . . . . . . . . . — 36,520 —Proceeds from sale of House of Blues Canada equity investment . . 30,008 — —Cash recognized on Merger with Molson . . . . . . . . . . . . . . . . . — — 73,540Cash expended for Merger-related costs . . . . . . . . . . . . . . . . . . — — (20,382)Trade loan repayments from customers . . . . . . . . . . . . . . . . . . 32,352 34,152 42,460Trade loans advanced to customers . . . . . . . . . . . . . . . . . . . . . (32,952) (27,982) (25,369)Other . . . . . . . . . . . . . . . . . . . . . . . . . . . . . . . . . . . . . . . 1,225 290 16Discontinued operations—proceeds from sale of majority stake in
Kaiser, net of costs to sell . . . . . . . . . . . . . . . . . . . . . . . . . — 79,465 —Discontinued operations—additions to properties and intangible
assets — — (2,817)
Net cash used in investing activities . . . . . . . . . . . . . . . . . . . . . . (439,147) (294,813) (312,708)
(continued)
See notes to consolidated financial statements.
73
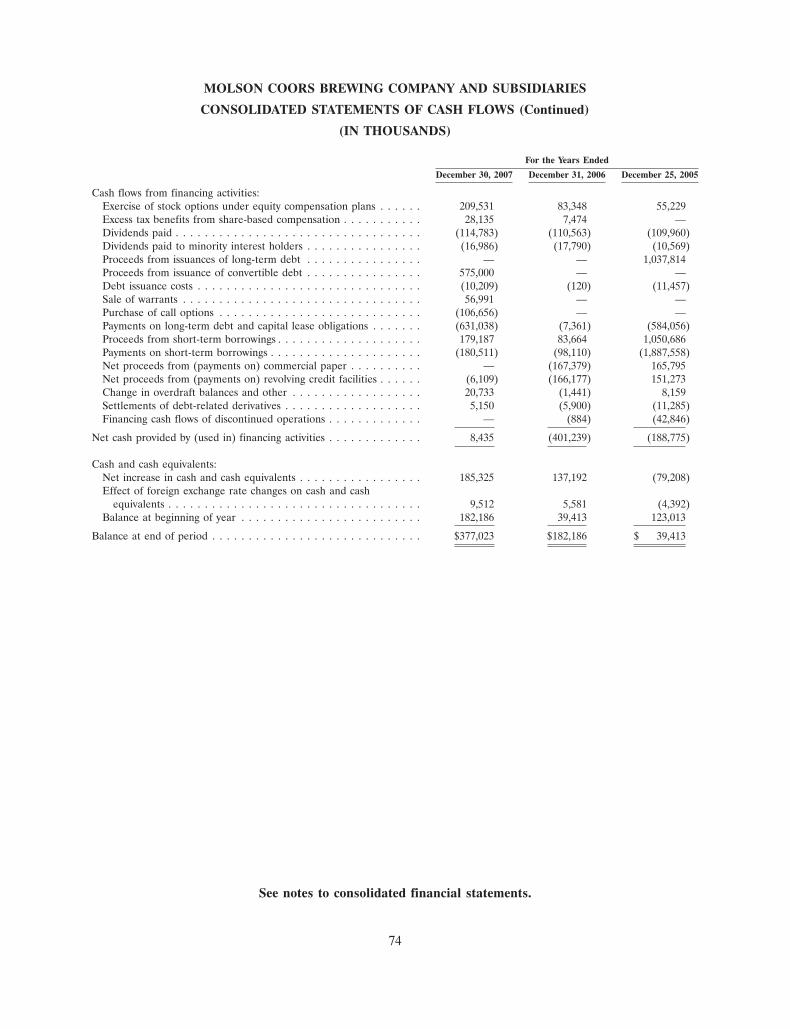
MOLSON COORS BREWING COMPANY AND SUBSIDIARIES
CONSOLIDATED STATEMENTS OF CASH FLOWS (Continued)
(IN THOUSANDS)
For the Years Ended
December 30, 2007 December 31, 2006 December 25, 2005
Cash flows from financing activities:Exercise of stock options under equity compensation plans . . . . . . 209,531 83,348 55,229Excess tax benefits from share-based compensation . . . . . . . . . . . 28,135 7,474 —Dividends paid . . . . . . . . . . . . . . . . . . . . . . . . . . . . . . . . . . (114,783) (110,563) (109,960)Dividends paid to minority interest holders . . . . . . . . . . . . . . . . (16,986) (17,790) (10,569)Proceeds from issuances of long-term debt . . . . . . . . . . . . . . . . — — 1,037,814Proceeds from issuance of convertible debt . . . . . . . . . . . . . . . . 575,000 — —Debt issuance costs . . . . . . . . . . . . . . . . . . . . . . . . . . . . . . . (10,209) (120) (11,457)Sale of warrants . . . . . . . . . . . . . . . . . . . . . . . . . . . . . . . . . 56,991 — —Purchase of call options . . . . . . . . . . . . . . . . . . . . . . . . . . . . (106,656) — —Payments on long-term debt and capital lease obligations . . . . . . . (631,038) (7,361) (584,056)Proceeds from short-term borrowings . . . . . . . . . . . . . . . . . . . . 179,187 83,664 1,050,686Payments on short-term borrowings . . . . . . . . . . . . . . . . . . . . . (180,511) (98,110) (1,887,558)Net proceeds from (payments on) commercial paper . . . . . . . . . . — (167,379) 165,795Net proceeds from (payments on) revolving credit facilities . . . . . . (6,109) (166,177) 151,273Change in overdraft balances and other . . . . . . . . . . . . . . . . . . 20,733 (1,441) 8,159Settlements of debt-related derivatives . . . . . . . . . . . . . . . . . . . 5,150 (5,900) (11,285)Financing cash flows of discontinued operations . . . . . . . . . . . . . — (884) (42,846)
Net cash provided by (used in) financing activities . . . . . . . . . . . . . 8,435 (401,239) (188,775)
Cash and cash equivalents:Net increase in cash and cash equivalents . . . . . . . . . . . . . . . . . 185,325 137,192 (79,208)Effect of foreign exchange rate changes on cash and cash
equivalents . . . . . . . . . . . . . . . . . . . . . . . . . . . . . . . . . . . 9,512 5,581 (4,392)Balance at beginning of year . . . . . . . . . . . . . . . . . . . . . . . . . 182,186 39,413 123,013
Balance at end of period . . . . . . . . . . . . . . . . . . . . . . . . . . . . . $377,023 $182,186 $ 39,413
See notes to consolidated financial statements.
74

MOLSON COORS BREWING COMPANY AND SUBSIDIARIES
CONSOLIDATED STATEMENTS OF STOCKHOLDERS’ EQUITY
(IN THOUSANDS)
AccumulatedCommon stock Exchangeable shares otherissued issued Paid-in Retained comprehensiveClass A Class B Class A Class B capital earnings income Total
Balances at December 26, 2004 . . . . . . $26 $ 728 $ — $ — $ 104,508 $1,398,003 $ 97,901 $1,601,166Shares issued under equity
compensation plans, includingrelated tax benefit . . . . . . . . . . . — 24 — — 84,999 — — 85,023
Shares issued in the Merger withMolson Inc. . . . . . . . . . . . . . . . 2 242 183,384 2,420,040 917,898 — — 3,521,566
Exchange of shares . . . . . . . . . . . . — 242 (38,378) (867,557) 905,693 — — —Amortization of restricted stock . . . . — — — — 2,890 — — 2,890Other comprehensive income, net of
tax . . . . . . . . . . . . . . . . . . . . . — — — — — — 89,088 89,088Net income . . . . . . . . . . . . . . . . . — — — — — 134,944 — 134,944Cash dividends—$0.41 per share . . . . — — — — — (109,960) — (109,960)
Balances at December 25, 2005 . . . . . . 28 1,236 145,006 1,552,483 2,015,988 1,422,987 186,989 5,324,717Shares issued under equity
compensation plans, includingrelated tax benefit . . . . . . . . . . . — 28 — — 84,227 — — 84,255
Exchange of shares . . . . . . . . . . . . (1) 68 (20,307) (241,494) 261,734 — — —Amortization of stock based
compensation . . . . . . . . . . . . . . — — — — 27,927 — — 27,927Other comprehensive income, net of
tax . . . . . . . . . . . . . . . . . . . . . — — — — — — 302,075 302,075Adjustment to adopt SFAS 158, net
of tax (Note 1) . . . . . . . . . . . . . — — — — — — (172,086) (172,086)Net income . . . . . . . . . . . . . . . . . — — — — — 361,031 — 361,031Cash dividends—$0.64 per share . . . . — — — — — (110,563) — (110,563)
Balances at December 31, 2006 . . . . . . 27 1,332 124,699 1,310,989 2,389,876 1,673,455 316,978 5,817,356Shares issued under equity
compensation plans, includingrelated tax benefit . . . . . . . . . . . — 67 — — 238,674 — — 238,741
Exchange of shares . . . . . . . . . . . . — 97 61 (365,714) 365,556 — — —Amortization of stock based
compensation . . . . . . . . . . . . . . — — — — 37,387 — — 37,387Other comprehensive income, net of
tax . . . . . . . . . . . . . . . . . . . . . — — — — — — 787,951 787,951Adjustment to adopt FIN 48 (Note 1) — — — — — (105,409) — (105,409)Sale of warrants . . . . . . . . . . . . . . — — — — 56,991 — — 56,991Purchase of call options, net of tax . . — — — — (66,035) — — (66,035)Net income . . . . . . . . . . . . . . . . . — — — — — 497,192 — 497,192Cash dividends—$0.64 per share . . . . — — — — — (114,783) — (114,783)
Balances at December 30, 2007 . . . . . . $27 $1,496 $124,760 $ 945,275 $3,022,449 $1,950,455 $1,104,929 $7,149,391
See notes to consolidated financial statements.
75
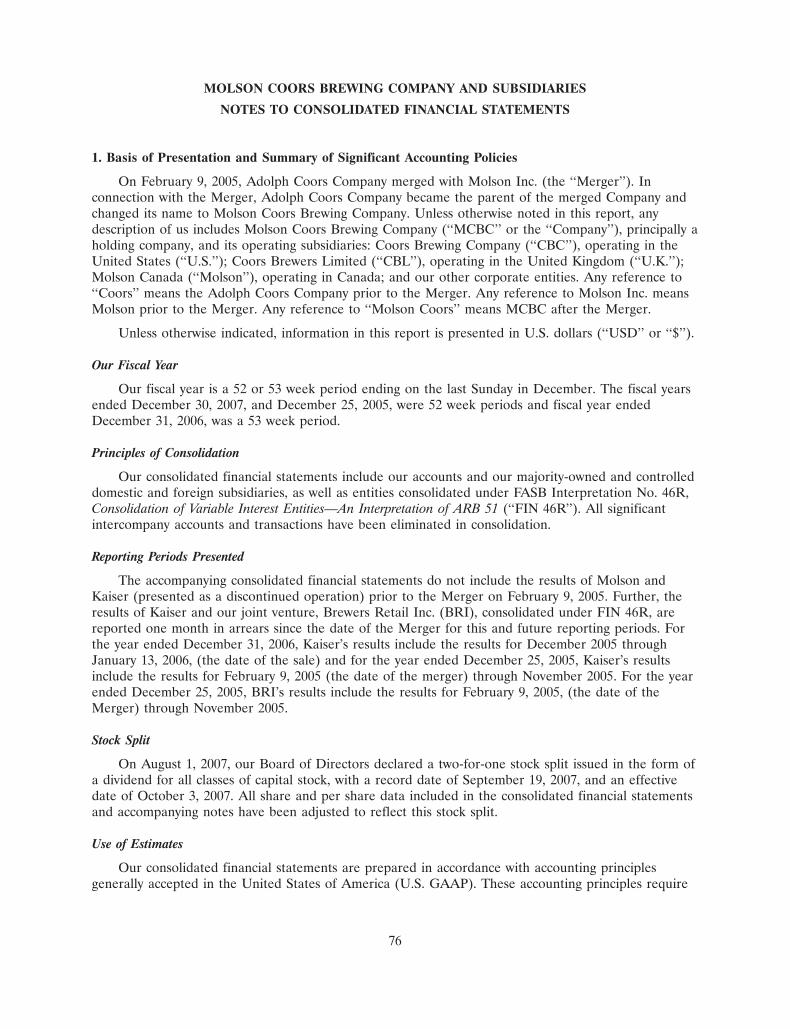
MOLSON COORS BREWING COMPANY AND SUBSIDIARIES
NOTES TO CONSOLIDATED FINANCIAL STATEMENTS
1. Basis of Presentation and Summary of Significant Accounting Policies
On February 9, 2005, Adolph Coors Company merged with Molson Inc. (the ‘‘Merger’’). Inconnection with the Merger, Adolph Coors Company became the parent of the merged Company andchanged its name to Molson Coors Brewing Company. Unless otherwise noted in this report, anydescription of us includes Molson Coors Brewing Company (‘‘MCBC’’ or the ‘‘Company’’), principally aholding company, and its operating subsidiaries: Coors Brewing Company (‘‘CBC’’), operating in theUnited States (‘‘U.S.’’); Coors Brewers Limited (‘‘CBL’’), operating in the United Kingdom (‘‘U.K.’’);Molson Canada (‘‘Molson’’), operating in Canada; and our other corporate entities. Any reference to‘‘Coors’’ means the Adolph Coors Company prior to the Merger. Any reference to Molson Inc. meansMolson prior to the Merger. Any reference to ‘‘Molson Coors’’ means MCBC after the Merger.
Unless otherwise indicated, information in this report is presented in U.S. dollars (‘‘USD’’ or ‘‘$’’).
Our Fiscal Year
Our fiscal year is a 52 or 53 week period ending on the last Sunday in December. The fiscal yearsended December 30, 2007, and December 25, 2005, were 52 week periods and fiscal year endedDecember 31, 2006, was a 53 week period.
Principles of Consolidation
Our consolidated financial statements include our accounts and our majority-owned and controlleddomestic and foreign subsidiaries, as well as entities consolidated under FASB Interpretation No. 46R,Consolidation of Variable Interest Entities—An Interpretation of ARB 51 (‘‘FIN 46R’’). All significantintercompany accounts and transactions have been eliminated in consolidation.
Reporting Periods Presented
The accompanying consolidated financial statements do not include the results of Molson andKaiser (presented as a discontinued operation) prior to the Merger on February 9, 2005. Further, theresults of Kaiser and our joint venture, Brewers Retail Inc. (BRI), consolidated under FIN 46R, arereported one month in arrears since the date of the Merger for this and future reporting periods. Forthe year ended December 31, 2006, Kaiser’s results include the results for December 2005 throughJanuary 13, 2006, (the date of the sale) and for the year ended December 25, 2005, Kaiser’s resultsinclude the results for February 9, 2005 (the date of the merger) through November 2005. For the yearended December 25, 2005, BRI’s results include the results for February 9, 2005, (the date of theMerger) through November 2005.
Stock Split
On August 1, 2007, our Board of Directors declared a two-for-one stock split issued in the form ofa dividend for all classes of capital stock, with a record date of September 19, 2007, and an effectivedate of October 3, 2007. All share and per share data included in the consolidated financial statementsand accompanying notes have been adjusted to reflect this stock split.
Use of Estimates
Our consolidated financial statements are prepared in accordance with accounting principlesgenerally accepted in the United States of America (U.S. GAAP). These accounting principles require
76
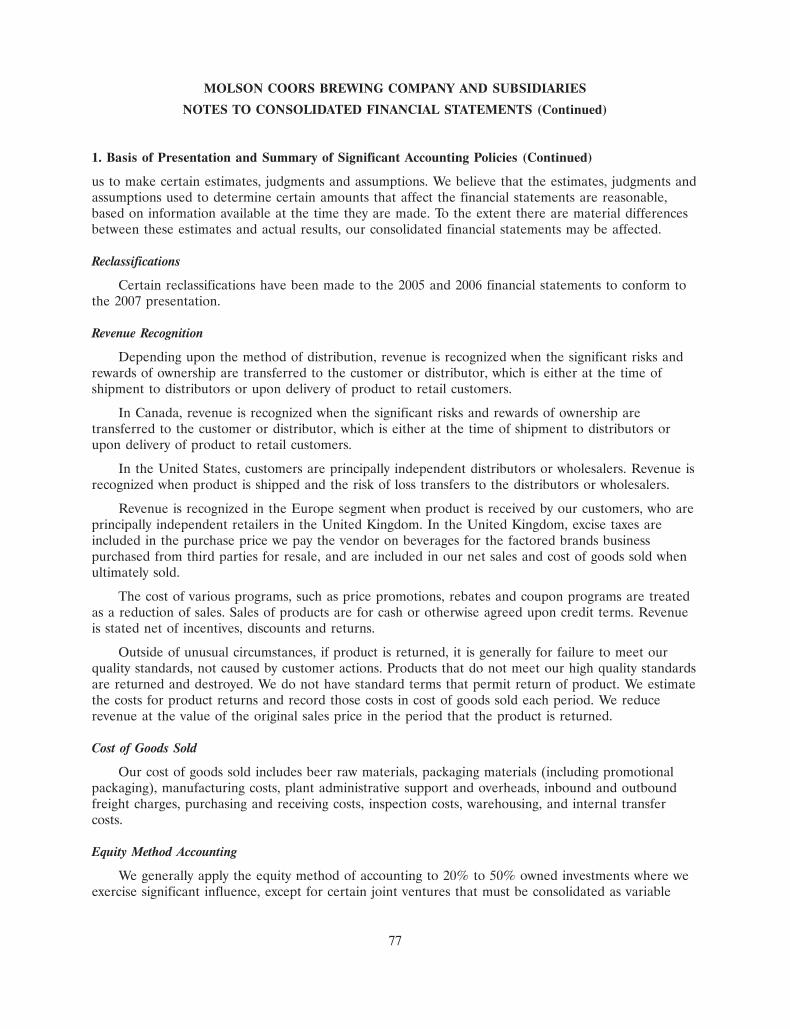
MOLSON COORS BREWING COMPANY AND SUBSIDIARIES
NOTES TO CONSOLIDATED FINANCIAL STATEMENTS (Continued)
1. Basis of Presentation and Summary of Significant Accounting Policies (Continued)
us to make certain estimates, judgments and assumptions. We believe that the estimates, judgments andassumptions used to determine certain amounts that affect the financial statements are reasonable,based on information available at the time they are made. To the extent there are material differencesbetween these estimates and actual results, our consolidated financial statements may be affected.
Reclassifications
Certain reclassifications have been made to the 2005 and 2006 financial statements to conform tothe 2007 presentation.
Revenue Recognition
Depending upon the method of distribution, revenue is recognized when the significant risks andrewards of ownership are transferred to the customer or distributor, which is either at the time ofshipment to distributors or upon delivery of product to retail customers.
In Canada, revenue is recognized when the significant risks and rewards of ownership aretransferred to the customer or distributor, which is either at the time of shipment to distributors orupon delivery of product to retail customers.
In the United States, customers are principally independent distributors or wholesalers. Revenue isrecognized when product is shipped and the risk of loss transfers to the distributors or wholesalers.
Revenue is recognized in the Europe segment when product is received by our customers, who areprincipally independent retailers in the United Kingdom. In the United Kingdom, excise taxes areincluded in the purchase price we pay the vendor on beverages for the factored brands businesspurchased from third parties for resale, and are included in our net sales and cost of goods sold whenultimately sold.
The cost of various programs, such as price promotions, rebates and coupon programs are treatedas a reduction of sales. Sales of products are for cash or otherwise agreed upon credit terms. Revenueis stated net of incentives, discounts and returns.
Outside of unusual circumstances, if product is returned, it is generally for failure to meet ourquality standards, not caused by customer actions. Products that do not meet our high quality standardsare returned and destroyed. We do not have standard terms that permit return of product. We estimatethe costs for product returns and record those costs in cost of goods sold each period. We reducerevenue at the value of the original sales price in the period that the product is returned.
Cost of Goods Sold
Our cost of goods sold includes beer raw materials, packaging materials (including promotionalpackaging), manufacturing costs, plant administrative support and overheads, inbound and outboundfreight charges, purchasing and receiving costs, inspection costs, warehousing, and internal transfercosts.
Equity Method Accounting
We generally apply the equity method of accounting to 20% to 50% owned investments where weexercise significant influence, except for certain joint ventures that must be consolidated as variable
77
MOLSON COORS BREWING COMPANY AND SUBSIDIARIES
NOTES TO CONSOLIDATED FINANCIAL STATEMENTS (Continued)
1. Basis of Presentation and Summary of Significant Accounting Policies (Continued)
interest entities under FIN 46R. These investments primarily involve equity ownership in transportationservices in our Europe segment (Tradeteam) and an investment in the Montreal Canadiens in Canada.
There are no related parties that own interests in our equity method investments as ofDecember 30, 2007.
Marketing, General and Administrative Expenses
Our marketing, general and administrative expenses consist predominately of advertising, sales staffcosts, and non-manufacturing administrative, and overhead costs. The creative portion of ouradvertising activities is expensed as incurred. Production costs are generally expensed when theadvertising is first run. Advertising expense was $858.1 million, $906.9 million, and $729.1 million foryears 2007, 2006, and 2005, respectively. Prepaid advertising costs of $27.3 million, entirely recorded incurrent and $46.8 million ($43.8 million in current and $3.0 million in non-current) were included inother current assets and other non-current assets in the Consolidated Balance Sheets at December 30,2007, and December 31, 2006, respectively.
Trade Loans
CBL extends loans to retail outlets that sell our brands. Some of these loans provide for nointerest to be payable, and others provide for payment of a below market interest rate. In return, theretail outlets receive smaller discounts on beer and other beverage products purchased from us, withthe net result being CBL attaining a market return on the outstanding loan balance. We thereforereclassify a portion of beer revenue into interest income to reflect a market rate of interest on theseloans. In 2007, 2006 and 2005, these amounts were $11.5 million, $11.7 million and $13.1 million,respectively. We have included this interest income in the Europe segment since it is related solely toCBL.
Trade loan receivables are classified as either other receivables or non-current notes receivable inour Consolidated Balance Sheets. At December 30, 2007, and December 31, 2006, total loansoutstanding, net of allowances, were $98.4 million and $99.7 million, respectively.
Allowance for Doubtful Accounts
Canada’s distribution channels are highly regulated by provincial regulation and experience fewcollectibility problems. However, Canada does have direct sales to retail customers for which anallowance is recorded based upon expected collectibility and historical experience.
In the U.S. segment, our allowance for doubtful accounts and customer credit risk are insignificant,as the majority of the U.S. segment accounts receivable balance is generated from sales to independentdistributors with whom collection occurs through electronic funds transfer. Also, in the United States,we secure substantially all of our product sale credit risk with purchase money security interests ininventory and proceeds, personal guarantees and other letters of credit.
Because the majority of CBL sales are directly to retail customers, and because of the industrypractice of making trade loans to customers, our ability to manage credit risk in this business is critical.At CBL, we provide allowances for trade receivables and trade loans associated with the ability tocollect outstanding receivables from our customers. Generally, provisions are recorded to cover the fullexposure to a specific customer at the point the account is considered uncollectible. Accounts are
78
MOLSON COORS BREWING COMPANY AND SUBSIDIARIES
NOTES TO CONSOLIDATED FINANCIAL STATEMENTS (Continued)
1. Basis of Presentation and Summary of Significant Accounting Policies (Continued)
typically deemed uncollectible based on the sales channel, after becoming either one hundred twentydays or one hundred eighty days overdue. We record the provision in marketing, general andadministrative expenses. Provisions are reversed upon recoverability of the account or at the point anaccount is written off.
We are not able to predict changes in financial condition of our customers, and if circumstancesrelated to our customers deteriorate, our estimates of the recoverability of our trade receivables andtrade loans could be materially affected.
Inventories
Inventories are stated at the lower of cost or market. Cost is determined by the first-in, first-out(‘‘FIFO’’) method in Europe and Canada and on the last-in, first-out (‘‘LIFO’’) method forsubstantially all inventories in the United States. As of December 30, 2007 and December 31, 2006, thepercentage of total inventories on the LIFO method was approximately 25% and 30%, respectively.Current cost in the United States, determined on the FIFO method, exceeded LIFO cost by$47.9 million and $43.9 million at December 30, 2007, and December 31, 2006, respectively.
We regularly assess the shelf-life of our inventories and reserve for those inventories when itbecomes apparent the product will not be sold within our freshness specifications.
Fair Value of Financial Instruments
The carrying amounts of our cash and cash equivalents, short-term investments, accountsreceivable, accounts payable and accrued liabilities, approximate fair value as recorded due to theshort-term maturity of these instruments. The fair value of long-term obligations for derivatives wasestimated by discounting the future cash flows using market interest rates. Assuming current marketrates for similar instruments, the fair value of long-term debt exceeds the carrying value byapproximately $104.7 million and $26.7 million at December 30, 2007 and December 31, 2006,respectively.
Foreign Currency Translation
Assets and liabilities recorded in foreign currencies that are the functional currencies for therespective operations are translated at the prevailing exchange rate at the balance sheet date. Revenueand expenses are translated at the average exchange rates during the period. Translation adjustmentsresulting from this process are reported as a separate component of other comprehensive income.
Factored Brands
In addition to supplying our own brands, CBL sells other beverage companies’ products toon-premise customers to provide them with a full range of products for their retail outlets. Thesefactored brand sales are included in our financial results, but the related volume is not included in ourreported sales volumes. We refer to this as the ‘‘factored brand business.’’ In the factored brandbusiness, CBL normally purchases factored brand inventory, taking orders from customers for suchbrands, and invoicing customers for the product and related costs of delivery. In accordance withEITF 99-19, ‘‘Reporting Revenue Gross as a Principal Versus Net as an Agent,’’ sales under the factoredbrands are generally reported on a gross income basis. However, CBL’s relationship with a large
79
MOLSON COORS BREWING COMPANY AND SUBSIDIARIES
NOTES TO CONSOLIDATED FINANCIAL STATEMENTS (Continued)
1. Basis of Presentation and Summary of Significant Accounting Policies (Continued)
on-premise customer changed in 2005, resulting in net reporting of sales and cost of sales as an agentfor that customer in our consolidated statement of operations on a prospective basis from the date ofchange in our contract terms. The change in accounting recognition from gross to net reporting reflectsa change in the substance of CBL’s status as transaction agent whereby there has been a transfer ofcredit risk from CBL to the owner and supplier of the factored brands effective in 2005.
Goodwill and Other Intangible Asset Valuation
We evaluate the carrying value of our goodwill and indefinite-lived intangible assets for impairmentat least annually, and we evaluate our other intangible assets for impairment when there is evidencethat certain events or changes in circumstances indicate that the carrying amount of these assets maynot be recoverable. Significant judgments and assumptions are required in the evaluation of goodwilland intangible assets for impairment. See Note 12.
Statement of Cash Flows Data
Cash equivalents represent highly liquid investments with original maturities of 90 days or less. Thefair value of these investments approximates their carrying value. The following presents oursupplemental cash flow information:
For the fiscal years ended
December 30, 2007 December 31, 2006 December 25, 2005
(In millions)
Cash paid for interest(1) . . . . . . . . . . . . . . . . . . . $104.4 $132.5 $109.9Cash paid for taxes . . . . . . . . . . . . . . . . . . . . . . . $ 77.6 $ 38.4 $202.1Receipt of note upon sale of property . . . . . . . . . $ — $ 1.7 $ —Issuance of restricted stock, net of forfeitures . . . . $ 11.1 $ 11.3 $ 9.9Issuance of performance shares, net of forfeitures $ 1.6 $ 65.3 $ —Tax benefit from exercise of stock options . . . . . . $ 28.1 $ 7.4 $ 6.7
(1) 2007 includes cash paid for interest of $6.2 million associated with debt extinguishment costs.
Adoption of New Accounting Pronouncements
FASB Interpretation No. 48 ‘‘Accounting for Uncertainty in Income Taxes—an Interpretation of FASBStatement No. 109’’
On January 1, 2007, we adopted the FASB’s Interpretation No. 48, ‘‘Accounting for Uncertainty inIncome Taxes—an Interpretation of FASB Statement No. 109’’ (‘‘FIN 48’’). FIN 48 clarifies theaccounting for uncertainty in income taxes recognized in an enterprise’s financial statements. FIN 48prescribes a two-step process to determine the amount of tax benefit to be recognized. However, thetax position must be evaluated to determine the likelihood that it will be sustained upon examination.If the tax position is deemed ‘‘more-likely-than-not’’ to be sustained, the tax position is then valued todetermine the amount of benefit to be recognized in the financial statements. As a result of theadoption of FIN 48, we increased tax-related liabilities by a total of $132.1 million and recorded$3.9 million as a current liability for unrecognized tax benefits and $128.2 million as a non-currentliability for unrecognized tax benefits. The cumulative effect of applying the new requirement has been
80
MOLSON COORS BREWING COMPANY AND SUBSIDIARIES
NOTES TO CONSOLIDATED FINANCIAL STATEMENTS (Continued)
1. Basis of Presentation and Summary of Significant Accounting Policies (Continued)
recorded as a reduction to the beginning balance of retained earnings in the amount of $105.4 million,an increase to goodwill in the amount of $2.3 million (See Note 12) and an increase to deferred taxassets of $24.4 million. The adjustment to goodwill reflects changes to liabilities for uncertain taxpositions established in the opening balance sheet of the acquisition of CBL in 2002 and the Merger in2005. See Note 7 for further discussion.
SFAS No. 158 ‘‘Employers’ Accounting for Defined Benefit Pension and Other Postretirement Benefits—anamendment of FASB Statements No. 87, 88, 106, and 132(R)’’
SFAS 158 was issued in September 2006 and was effective for our annual fiscal year endingDecember 31, 2006. The standard, which is an amendment to SFAS 87, 88, 106, and 132(R), requiresan employer to recognize the funded status of any defined benefit pension and/or other postretirementbenefit plans as an asset or liability in its statement of financial position. Funded status is the differencebetween the projected benefit obligation and the market value of plan assets for defined benefitpension plans, and is the difference between the accumulated benefit obligation and the market valueof plan assets (if any) for other postretirement benefit plans. SFAS 158 also requires an employer torecognize changes in that funded status in the year in which the changes occur through othercomprehensive income. As a result of the adoption of SFAS 158, liabilities related to our definedbenefit pension and postretirement benefit plans increased by $245 million and our accumulated othercomprehensive income, net of related deferred income taxes, decreased by approximately $172 millionas of December 31, 2006. A portion of the change in accumulated other comprehensive income relatedto the adoption of SFAS 158 will be recognized in the statement of operations as a component of netperiodic pension benefit cost in future periods. See Notes 16 and 17 for a detailed discussion regardingthe adoption of SFAS 158.
In addition, this statement requires companies to measure plan assets and obligations at the dateof their year-end statement of financial position, with limited exceptions. This measurement dateprovision will be effective for our annual 2008 year end and will not have an impact on the Company’sfinancial statements as we currently measure plan assets and obligations as of our fiscal year-end.
81
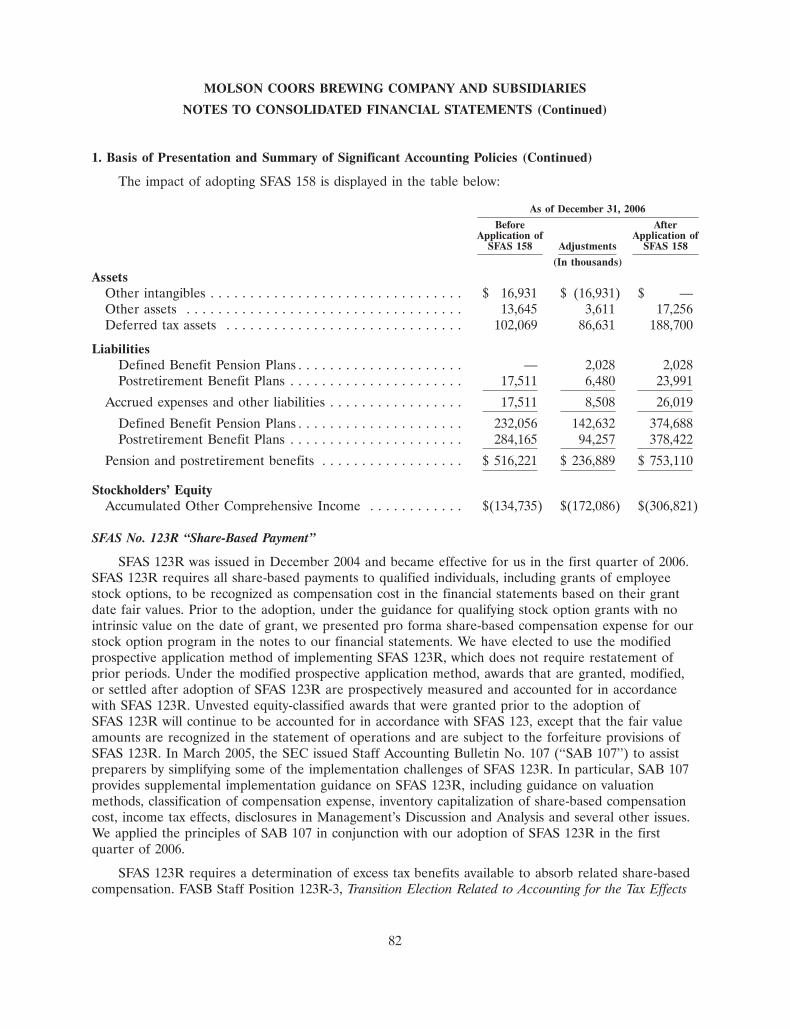
MOLSON COORS BREWING COMPANY AND SUBSIDIARIES
NOTES TO CONSOLIDATED FINANCIAL STATEMENTS (Continued)
1. Basis of Presentation and Summary of Significant Accounting Policies (Continued)
The impact of adopting SFAS 158 is displayed in the table below:
As of December 31, 2006
Before AfterApplication of Application of
SFAS 158 Adjustments SFAS 158
(In thousands)
AssetsOther intangibles . . . . . . . . . . . . . . . . . . . . . . . . . . . . . . . . $ 16,931 $ (16,931) $ —Other assets . . . . . . . . . . . . . . . . . . . . . . . . . . . . . . . . . . . 13,645 3,611 17,256Deferred tax assets . . . . . . . . . . . . . . . . . . . . . . . . . . . . . . 102,069 86,631 188,700
LiabilitiesDefined Benefit Pension Plans . . . . . . . . . . . . . . . . . . . . . — 2,028 2,028Postretirement Benefit Plans . . . . . . . . . . . . . . . . . . . . . . 17,511 6,480 23,991
Accrued expenses and other liabilities . . . . . . . . . . . . . . . . . 17,511 8,508 26,019
Defined Benefit Pension Plans . . . . . . . . . . . . . . . . . . . . . 232,056 142,632 374,688Postretirement Benefit Plans . . . . . . . . . . . . . . . . . . . . . . 284,165 94,257 378,422
Pension and postretirement benefits . . . . . . . . . . . . . . . . . . $ 516,221 $ 236,889 $ 753,110
Stockholders’ EquityAccumulated Other Comprehensive Income . . . . . . . . . . . . $(134,735) $(172,086) $(306,821)
SFAS No. 123R ‘‘Share-Based Payment’’
SFAS 123R was issued in December 2004 and became effective for us in the first quarter of 2006.SFAS 123R requires all share-based payments to qualified individuals, including grants of employeestock options, to be recognized as compensation cost in the financial statements based on their grantdate fair values. Prior to the adoption, under the guidance for qualifying stock option grants with nointrinsic value on the date of grant, we presented pro forma share-based compensation expense for ourstock option program in the notes to our financial statements. We have elected to use the modifiedprospective application method of implementing SFAS 123R, which does not require restatement ofprior periods. Under the modified prospective application method, awards that are granted, modified,or settled after adoption of SFAS 123R are prospectively measured and accounted for in accordancewith SFAS 123R. Unvested equity-classified awards that were granted prior to the adoption ofSFAS 123R will continue to be accounted for in accordance with SFAS 123, except that the fair valueamounts are recognized in the statement of operations and are subject to the forfeiture provisions ofSFAS 123R. In March 2005, the SEC issued Staff Accounting Bulletin No. 107 (‘‘SAB 107’’) to assistpreparers by simplifying some of the implementation challenges of SFAS 123R. In particular, SAB 107provides supplemental implementation guidance on SFAS 123R, including guidance on valuationmethods, classification of compensation expense, inventory capitalization of share-based compensationcost, income tax effects, disclosures in Management’s Discussion and Analysis and several other issues.We applied the principles of SAB 107 in conjunction with our adoption of SFAS 123R in the firstquarter of 2006.
SFAS 123R requires a determination of excess tax benefits available to absorb related share-basedcompensation. FASB Staff Position 123R-3, Transition Election Related to Accounting for the Tax Effects
82
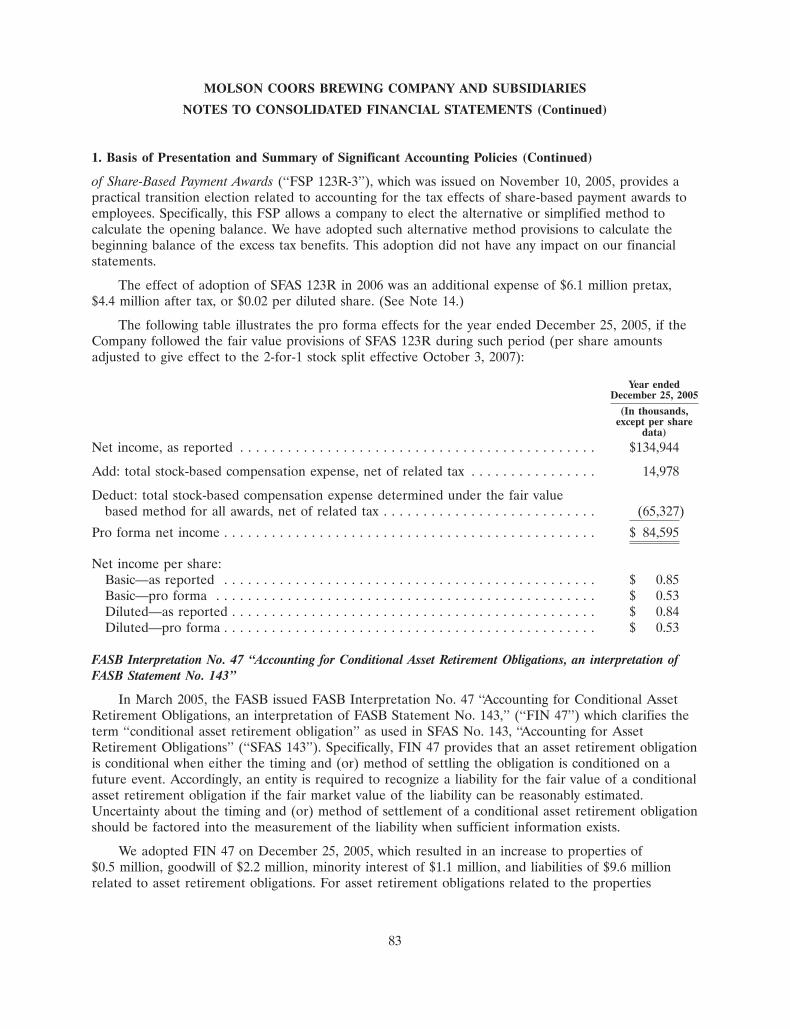
MOLSON COORS BREWING COMPANY AND SUBSIDIARIES
NOTES TO CONSOLIDATED FINANCIAL STATEMENTS (Continued)
1. Basis of Presentation and Summary of Significant Accounting Policies (Continued)
of Share-Based Payment Awards (‘‘FSP 123R-3’’), which was issued on November 10, 2005, provides apractical transition election related to accounting for the tax effects of share-based payment awards toemployees. Specifically, this FSP allows a company to elect the alternative or simplified method tocalculate the opening balance. We have adopted such alternative method provisions to calculate thebeginning balance of the excess tax benefits. This adoption did not have any impact on our financialstatements.
The effect of adoption of SFAS 123R in 2006 was an additional expense of $6.1 million pretax,$4.4 million after tax, or $0.02 per diluted share. (See Note 14.)
The following table illustrates the pro forma effects for the year ended December 25, 2005, if theCompany followed the fair value provisions of SFAS 123R during such period (per share amountsadjusted to give effect to the 2-for-1 stock split effective October 3, 2007):
Year endedDecember 25, 2005
(In thousands,except per share
data)
Net income, as reported . . . . . . . . . . . . . . . . . . . . . . . . . . . . . . . . . . . . . . . . . . . . . $134,944
Add: total stock-based compensation expense, net of related tax . . . . . . . . . . . . . . . . 14,978
Deduct: total stock-based compensation expense determined under the fair valuebased method for all awards, net of related tax . . . . . . . . . . . . . . . . . . . . . . . . . . . (65,327)
Pro forma net income . . . . . . . . . . . . . . . . . . . . . . . . . . . . . . . . . . . . . . . . . . . . . . . $ 84,595
Net income per share:Basic—as reported . . . . . . . . . . . . . . . . . . . . . . . . . . . . . . . . . . . . . . . . . . . . . . . $ 0.85Basic—pro forma . . . . . . . . . . . . . . . . . . . . . . . . . . . . . . . . . . . . . . . . . . . . . . . . $ 0.53Diluted—as reported . . . . . . . . . . . . . . . . . . . . . . . . . . . . . . . . . . . . . . . . . . . . . . $ 0.84Diluted—pro forma . . . . . . . . . . . . . . . . . . . . . . . . . . . . . . . . . . . . . . . . . . . . . . . $ 0.53
FASB Interpretation No. 47 ‘‘Accounting for Conditional Asset Retirement Obligations, an interpretation ofFASB Statement No. 143’’
In March 2005, the FASB issued FASB Interpretation No. 47 ‘‘Accounting for Conditional AssetRetirement Obligations, an interpretation of FASB Statement No. 143,’’ (‘‘FIN 47’’) which clarifies theterm ‘‘conditional asset retirement obligation’’ as used in SFAS No. 143, ‘‘Accounting for AssetRetirement Obligations’’ (‘‘SFAS 143’’). Specifically, FIN 47 provides that an asset retirement obligationis conditional when either the timing and (or) method of settling the obligation is conditioned on afuture event. Accordingly, an entity is required to recognize a liability for the fair value of a conditionalasset retirement obligation if the fair market value of the liability can be reasonably estimated.Uncertainty about the timing and (or) method of settlement of a conditional asset retirement obligationshould be factored into the measurement of the liability when sufficient information exists.
We adopted FIN 47 on December 25, 2005, which resulted in an increase to properties of$0.5 million, goodwill of $2.2 million, minority interest of $1.1 million, and liabilities of $9.6 millionrelated to asset retirement obligations. For asset retirement obligations related to the properties
83
MOLSON COORS BREWING COMPANY AND SUBSIDIARIES
NOTES TO CONSOLIDATED FINANCIAL STATEMENTS (Continued)
1. Basis of Presentation and Summary of Significant Accounting Policies (Continued)
acquired in the acquisition of Molson Inc. as of February 9, 2005, such obligations increased thegoodwill amounts recognized upon the acquisition by $2.2 million as such properties were recorded atthe appraised fair market value at the acquisition date. These asset retirement obligations relateprimarily to clean-up, removal, or replacement activities and related costs for asbestos, coolants, wastewater, oils and other contaminants contained that maybe within our manufacturing properties.
The adoption of FIN 47 was reflected in our financial statements as the cumulative effect of thechange in accounting principle with the catch-up adjustment of $3.7 million, net of tax benefit of$2.2 million, in the 2005 statement of operations. This adjustment represents a depreciation charge andan accretion of a liability from the time the obligation originated, which is either from the time of theacquisition or the construction of related long-lived assets, through December 25, 2005.
Inherent in the fair value calculation of asset retirement obligations are numerous assumptions andjudgments including the ultimate settlement amounts, inflation factors, credit adjusted discount rates,timing of settlement, and changes in the legal, regulatory, environmental and political environments. Tothe extent future revisions to these assumptions impact the fair value of the existing asset retirementobligation liability, a corresponding adjustment will be made to the asset balance. If the obligation issettled for other than the carrying amount of the liability, we will recognize a gain or loss upon thesettlement.
New Accounting Pronouncements
SFAS No. 157 ‘‘Fair Value Measurements’’
In September 2006, the FASB issued SFAS No. 157, ‘‘Fair Value Measurements,’’ (SFAS 157) which,in part, is effective for us beginning in fiscal year 2008. This statement defines fair value, establishes aframework for measuring fair value and expands the related disclosure requirements. The statementindicates, among other things, that a fair value measurement assumes that the transaction to sell anasset or transfer a liability occurs in the principal market for the asset or liability or, in the absence ofa principal market, the most advantageous market for the asset or liability. Subsequent to the issuanceof SFAS 157, the FASB issued FASB Staff Positions (FSP) 157-1, ‘‘Application of FASB StatementNo. 157 to FASB Statement No. 13 and Other Accounting Pronouncements That Address Fair ValueMeasurements for Purposes of Lease Classification or Measurement under Statement 13’’ and FSP 157-2‘‘Effective Date of FASB Statement No. 157.’’ FSP 157-1 excludes, in certain circumstances, SFAS 13 andother accounting pronouncements that address fair value measurements for purposes of leaseclassification or measurement under Statement 13 from the provision of SFAS 157. FSP 157-2 delaysthe effective date of SFAS 157 for all nonfinancial assets and nonfinancial liabilities, except those thatare recognized or disclosed at fair value in the financial statements on a recurring basis. For theinstruments subject to the effective day delay under FSP 157-2, the effective day to adopt the fair valueprovisions for us will be the first quarter of 2009. While FSP 157-c has not been finalized or approved,it clarifies the principles in SFAS 157 on the fair value measurement of liabilities. Based upon ourevaluation of the statements and subsequent pronouncements issued to date, we believe that theadoption of the statement for financial assets and liabilities routinely measured and recorded ordisclosed at their fair values, will not have a significant impact on the determination or reporting of ourfinancial results. The company is currently evaluating the impacts, if any, the adoption of the provisionsof Statement No. 157 for non-financial assets and liabilities that are recognized or disclosed on anon-recurring basis.
84
MOLSON COORS BREWING COMPANY AND SUBSIDIARIES
NOTES TO CONSOLIDATED FINANCIAL STATEMENTS (Continued)
1. Basis of Presentation and Summary of Significant Accounting Policies (Continued)
SFAS No. 159 ‘‘The Fair Value Option for Financial Assets and Financial Liabilities. Including anamendment of FASB Statement No. 115’’
In February 2007, the FASB issued Statement No. 159 (‘‘SFAS 159’’). SFAS 159 permits entities tochoose to measure many financial instruments and certain other items at fair value that are notcurrently required to be measured at fair value. The objective of this Statement is to reduce bothcomplexity in accounting for financial instruments and the volatility in earnings caused by measuringrelated assets and liabilities using different measurement techniques. The fair value measurementprovisions are elective and can be applied to individual financial instruments. SFAS 159 requiresadditional disclosures related to the fair value measurements included in the entity’s financialstatements. This Statement is effective for us as of the beginning of our 2008 fiscal year. We do notintend to adopt the fair value measurement provisions of SFAS 159.
SFAS No. 141R ‘‘Business Combinations’’
In December 2007, the FASB issued SFAS No. 141 (revised 2007), ‘‘Business Combinations’’(‘‘SFAS 141R’’), which replaces SFAS No. 141, ‘‘Business Combinations.’’ Under the provisions ofSFAS 141R, acquisition costs will generally be expensed as incurred; noncontrolling interests will bevalued at fair value at the acquisition date; in-process research and development will be recorded atfair value as an indefinite-lived intangible asset at the acquisition date; restructuring costs associatedwith a business combination will generally be expensed subsequent to the acquisition date; and changesin deferred tax asset valuation allowances and income tax uncertainties after the acquisition dategenerally will affect income tax expense. SFAS 141(R) will be effective, on a prospective basis, for allbusiness combinations for which the acquisition date is after the beginning of our fiscal year 2009, withthe exception of the accounting for valuation allowances on deferred taxes and acquired taxcontingencies for which the adoption is retrospective. We are currently evaluating the effects, if any,that SFAS 141R may have on our financial statements.
SFAS No. 160 ‘‘Noncontrolling interests in Consolidated Financial Statements’’
In December 2007, the FASB issued Financial Accounting Standards No. 160, ‘‘NoncontrollingInterests in Consolidated Financial Statements—an amendment of ARB No. 51’’ (‘‘SFAS 160’’) and iseffective for us beginning in fiscal year 2008. This Statement requires the recognition of anoncontrolling interest, or minority interest, as equity in the consolidated financial statements andseparate from the parent’s equity. The amount of net income attributable to the noncontrolling interestwill be included in consolidated net income on the face of the income statement. It also amends certainof ARB No. 51’s consolidation procedures for consistency with the requirements of SFAS 141(R). Thisstatement also includes expanded disclosure requirements regarding the interests of the parent and itsnoncontrolling interest. We are currently evaluating this new statement and anticipate that thestatement will not have a significant impact on the reporting of our results of operations.
Proposed Accounting Pronouncements
Proposed FASB Staff Position APB 14-a, ‘‘Accounting for Convertible Debt Instruments That May Be Settledin Cash Upon Conversion (Including Partial Cash Settlement)’’
The FASB in August 2007 proposed FASB Staff Position APB 14-a, ‘‘Accounting for ConvertibleDebt Instruments That May Be Settled in Cash Upon Conversion (Including Partial Cash Settlement)’’
85
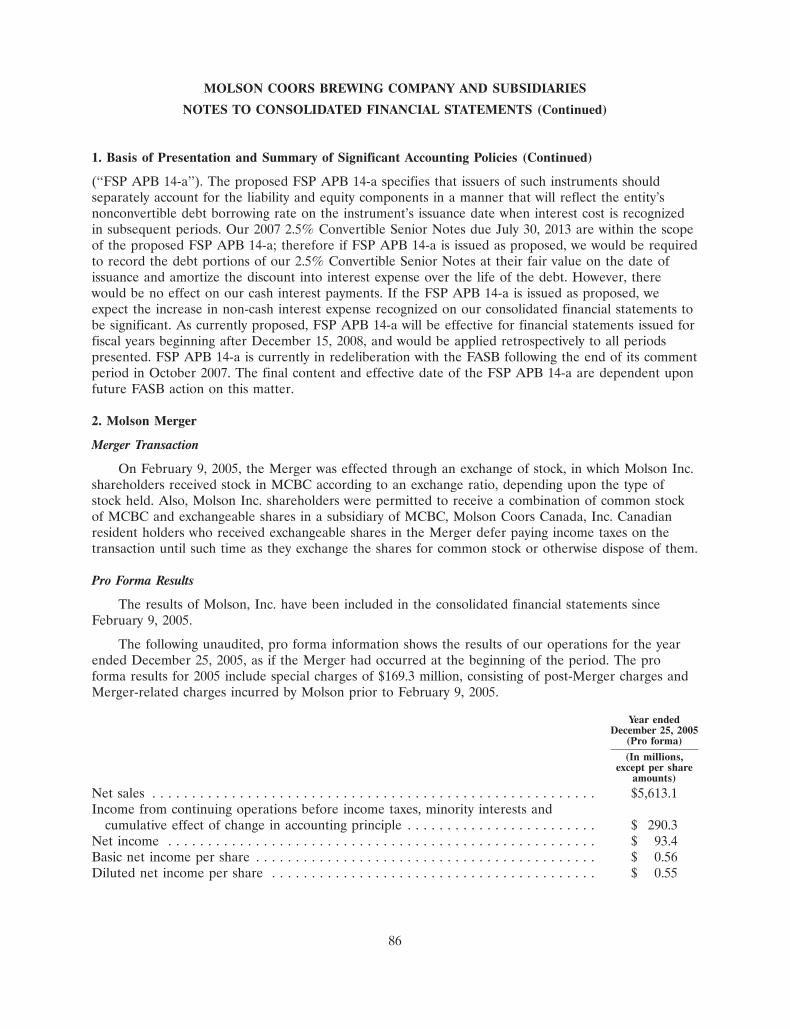
MOLSON COORS BREWING COMPANY AND SUBSIDIARIES
NOTES TO CONSOLIDATED FINANCIAL STATEMENTS (Continued)
1. Basis of Presentation and Summary of Significant Accounting Policies (Continued)
(‘‘FSP APB 14-a’’). The proposed FSP APB 14-a specifies that issuers of such instruments shouldseparately account for the liability and equity components in a manner that will reflect the entity’snonconvertible debt borrowing rate on the instrument’s issuance date when interest cost is recognizedin subsequent periods. Our 2007 2.5% Convertible Senior Notes due July 30, 2013 are within the scopeof the proposed FSP APB 14-a; therefore if FSP APB 14-a is issued as proposed, we would be requiredto record the debt portions of our 2.5% Convertible Senior Notes at their fair value on the date ofissuance and amortize the discount into interest expense over the life of the debt. However, therewould be no effect on our cash interest payments. If the FSP APB 14-a is issued as proposed, weexpect the increase in non-cash interest expense recognized on our consolidated financial statements tobe significant. As currently proposed, FSP APB 14-a will be effective for financial statements issued forfiscal years beginning after December 15, 2008, and would be applied retrospectively to all periodspresented. FSP APB 14-a is currently in redeliberation with the FASB following the end of its commentperiod in October 2007. The final content and effective date of the FSP APB 14-a are dependent uponfuture FASB action on this matter.
2. Molson Merger
Merger Transaction
On February 9, 2005, the Merger was effected through an exchange of stock, in which Molson Inc.shareholders received stock in MCBC according to an exchange ratio, depending upon the type ofstock held. Also, Molson Inc. shareholders were permitted to receive a combination of common stockof MCBC and exchangeable shares in a subsidiary of MCBC, Molson Coors Canada, Inc. Canadianresident holders who received exchangeable shares in the Merger defer paying income taxes on thetransaction until such time as they exchange the shares for common stock or otherwise dispose of them.
Pro Forma Results
The results of Molson, Inc. have been included in the consolidated financial statements sinceFebruary 9, 2005.
The following unaudited, pro forma information shows the results of our operations for the yearended December 25, 2005, as if the Merger had occurred at the beginning of the period. The proforma results for 2005 include special charges of $169.3 million, consisting of post-Merger charges andMerger-related charges incurred by Molson prior to February 9, 2005.
Year endedDecember 25, 2005
(Pro forma)
(In millions,except per share
amounts)
Net sales . . . . . . . . . . . . . . . . . . . . . . . . . . . . . . . . . . . . . . . . . . . . . . . . . . . . . . . . $5,613.1Income from continuing operations before income taxes, minority interests and
cumulative effect of change in accounting principle . . . . . . . . . . . . . . . . . . . . . . . . $ 290.3Net income . . . . . . . . . . . . . . . . . . . . . . . . . . . . . . . . . . . . . . . . . . . . . . . . . . . . . . $ 93.4Basic net income per share . . . . . . . . . . . . . . . . . . . . . . . . . . . . . . . . . . . . . . . . . . . $ 0.56Diluted net income per share . . . . . . . . . . . . . . . . . . . . . . . . . . . . . . . . . . . . . . . . . $ 0.55
86
MOLSON COORS BREWING COMPANY AND SUBSIDIARIES
NOTES TO CONSOLIDATED FINANCIAL STATEMENTS (Continued)
2. Molson Merger (Continued)
Allocation of Purchase Price
The Merger’s equity consideration was valued at $3.6 billion, including the exchange of93.4 million equivalent shares of stock at a market price of $37.63 per share, the exchange of stockoptions valued at $4.0 million, and Merger-related costs incurred by Coors, of which $16.0 million wasincurred prior to the Merger. Coors was considered the accounting acquirer in the Merger, requiringthe purchase consideration to be allocated to Molson’s and Kaiser’s (now presented as discontinuedoperations) assets and liabilities based upon their fair values, with the residual to goodwill.
3. Segment and Geographic Information
Our reporting segments are driven by geographic regions, which are the basis on which our chiefoperating decision maker evaluates the performance of the business. The Company operates in thereporting segments listed below. Our Brazil segment, which was composed of Kaiser, was sold in 2006,and is reflected as a discontinued operation.
Canada
The Canada segment consists of our production, marketing and sales of the Molson and CoorsLight brands, principally in Canada; our joint venture arrangement related to the distribution and retailsale of beer in Ontario, BRI (consolidated under FIN 46R); and our joint venture arrangement(accounted as an equity investment) related to the distribution of beer in the western provinces,Brewers’ Distributor Ltd. (‘‘BDL’’). The Canada segment also includes our equity interest in theMontreal Canadiens Hockey Club.
We have an agreement with Heineken N.V. (Netherlands) that grants us the right to import,market, and sell Heineken products throughout Canada and with Miller Brewing Co., to brew, market,and sell several Miller brands, and distribute and sell imported Miller brands. We also have the right tocontract brew and package Asahi for the U.S. market.
On November 20, 2007, Molson and Grupo Modelo, S.A.B. de C.V. announced that they signed aletter of intent to establish a long-term joint venture to import, distribute, and market the Modelo beerbrand portfolio across all Canadian provinces and territories. Effective January 1, 2008, both partieshave established the joint venture pursuant to executed legally binding definitive agreements. Under thenew arrangement, Molson’s sales team will be responsible for selling the brands across Canada onbehalf of the joint venture. The new alliance will enable Grupo Modelo to effectively tap into theresources and capabilities of Molson to achieve greater distribution coverage in the Western provincesof Canada. Modelo will also benefit from Molson’s extensive sales and marketing expertise andunparalleled distribution network in Canada.
United States (U.S.)
The U.S. segment consists of the production, marketing, and sales of the Coors and Molsonportfolios of brands in the United States and its territories, its military bases worldwide, Mexico, andthe Caribbean; Coors Distributing Company, which consists of Company-owned beer distributorships inColorado and Idaho; and Rocky Mountain Metal Container (‘‘RMMC’’) and Rocky Mountain BottleCompany (‘‘RMBC’’) joint ventures consolidated under FIN 46R.
87
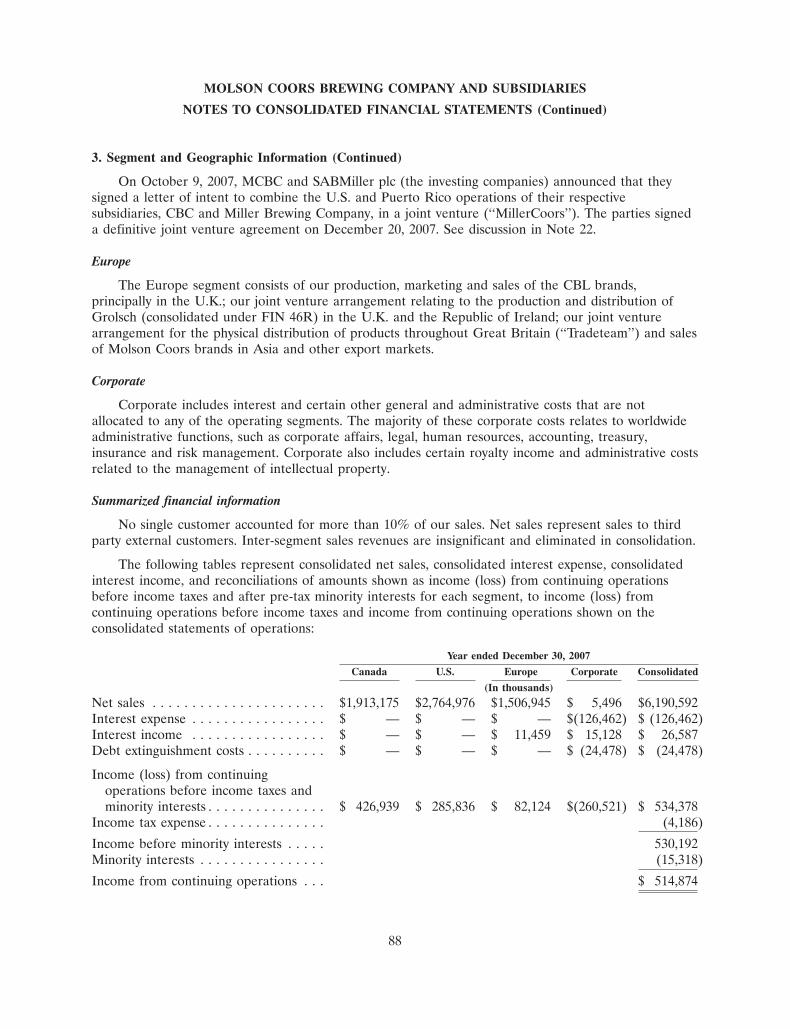
MOLSON COORS BREWING COMPANY AND SUBSIDIARIES
NOTES TO CONSOLIDATED FINANCIAL STATEMENTS (Continued)
3. Segment and Geographic Information (Continued)
On October 9, 2007, MCBC and SABMiller plc (the investing companies) announced that theysigned a letter of intent to combine the U.S. and Puerto Rico operations of their respectivesubsidiaries, CBC and Miller Brewing Company, in a joint venture (‘‘MillerCoors’’). The parties signeda definitive joint venture agreement on December 20, 2007. See discussion in Note 22.
Europe
The Europe segment consists of our production, marketing and sales of the CBL brands,principally in the U.K.; our joint venture arrangement relating to the production and distribution ofGrolsch (consolidated under FIN 46R) in the U.K. and the Republic of Ireland; our joint venturearrangement for the physical distribution of products throughout Great Britain (‘‘Tradeteam’’) and salesof Molson Coors brands in Asia and other export markets.
Corporate
Corporate includes interest and certain other general and administrative costs that are notallocated to any of the operating segments. The majority of these corporate costs relates to worldwideadministrative functions, such as corporate affairs, legal, human resources, accounting, treasury,insurance and risk management. Corporate also includes certain royalty income and administrative costsrelated to the management of intellectual property.
Summarized financial information
No single customer accounted for more than 10% of our sales. Net sales represent sales to thirdparty external customers. Inter-segment sales revenues are insignificant and eliminated in consolidation.
The following tables represent consolidated net sales, consolidated interest expense, consolidatedinterest income, and reconciliations of amounts shown as income (loss) from continuing operationsbefore income taxes and after pre-tax minority interests for each segment, to income (loss) fromcontinuing operations before income taxes and income from continuing operations shown on theconsolidated statements of operations:
Year ended December 30, 2007
Canada U.S. Europe Corporate Consolidated
(In thousands)
Net sales . . . . . . . . . . . . . . . . . . . . . . $1,913,175 $2,764,976 $1,506,945 $ 5,496 $6,190,592Interest expense . . . . . . . . . . . . . . . . . $ — $ — $ — $(126,462) $ (126,462)Interest income . . . . . . . . . . . . . . . . . $ — $ — $ 11,459 $ 15,128 $ 26,587Debt extinguishment costs . . . . . . . . . . $ — $ — $ — $ (24,478) $ (24,478)
Income (loss) from continuingoperations before income taxes andminority interests . . . . . . . . . . . . . . . $ 426,939 $ 285,836 $ 82,124 $(260,521) $ 534,378
Income tax expense . . . . . . . . . . . . . . . (4,186)
Income before minority interests . . . . . 530,192Minority interests . . . . . . . . . . . . . . . . (15,318)
Income from continuing operations . . . $ 514,874
88
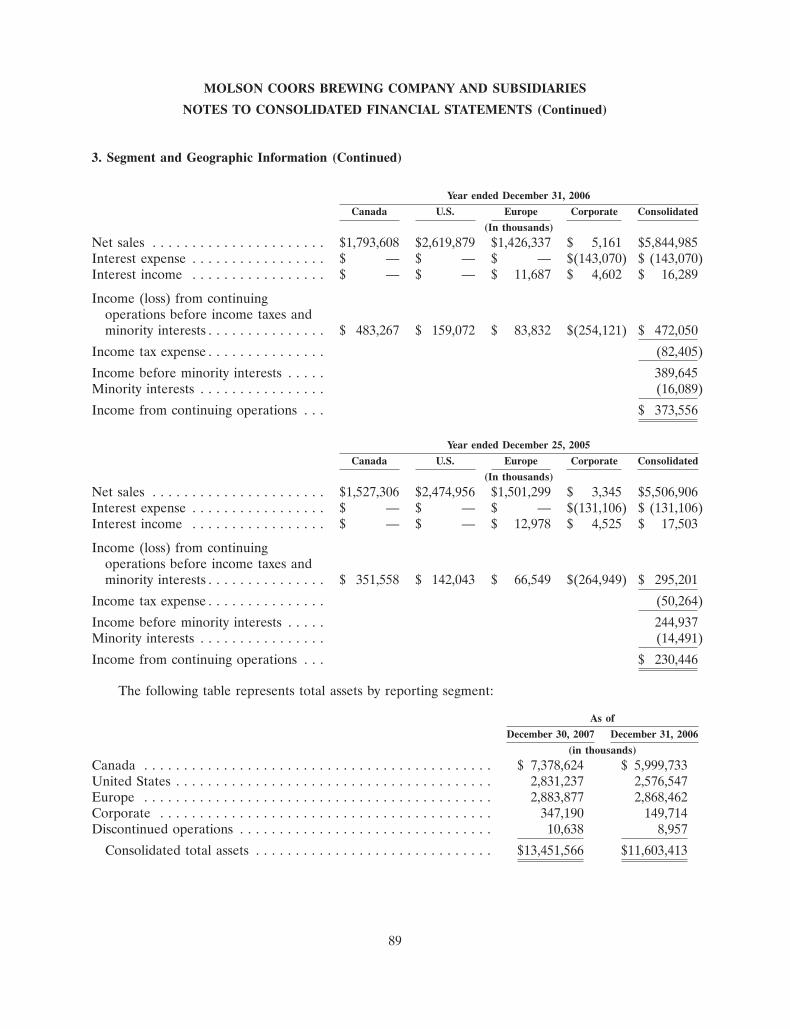
MOLSON COORS BREWING COMPANY AND SUBSIDIARIES
NOTES TO CONSOLIDATED FINANCIAL STATEMENTS (Continued)
3. Segment and Geographic Information (Continued)
Year ended December 31, 2006
Canada U.S. Europe Corporate Consolidated
(In thousands)
Net sales . . . . . . . . . . . . . . . . . . . . . . $1,793,608 $2,619,879 $1,426,337 $ 5,161 $5,844,985Interest expense . . . . . . . . . . . . . . . . . $ — $ — $ — $(143,070) $ (143,070)Interest income . . . . . . . . . . . . . . . . . $ — $ — $ 11,687 $ 4,602 $ 16,289
Income (loss) from continuingoperations before income taxes andminority interests . . . . . . . . . . . . . . . $ 483,267 $ 159,072 $ 83,832 $(254,121) $ 472,050
Income tax expense . . . . . . . . . . . . . . . (82,405)
Income before minority interests . . . . . 389,645Minority interests . . . . . . . . . . . . . . . . (16,089)
Income from continuing operations . . . $ 373,556
Year ended December 25, 2005
Canada U.S. Europe Corporate Consolidated
(In thousands)
Net sales . . . . . . . . . . . . . . . . . . . . . . $1,527,306 $2,474,956 $1,501,299 $ 3,345 $5,506,906Interest expense . . . . . . . . . . . . . . . . . $ — $ — $ — $(131,106) $ (131,106)Interest income . . . . . . . . . . . . . . . . . $ — $ — $ 12,978 $ 4,525 $ 17,503
Income (loss) from continuingoperations before income taxes andminority interests . . . . . . . . . . . . . . . $ 351,558 $ 142,043 $ 66,549 $(264,949) $ 295,201
Income tax expense . . . . . . . . . . . . . . . (50,264)
Income before minority interests . . . . . 244,937Minority interests . . . . . . . . . . . . . . . . (14,491)
Income from continuing operations . . . $ 230,446
The following table represents total assets by reporting segment:
As of
December 30, 2007 December 31, 2006
(in thousands)
Canada . . . . . . . . . . . . . . . . . . . . . . . . . . . . . . . . . . . . . . . . . . . . $ 7,378,624 $ 5,999,733United States . . . . . . . . . . . . . . . . . . . . . . . . . . . . . . . . . . . . . . . . 2,831,237 2,576,547Europe . . . . . . . . . . . . . . . . . . . . . . . . . . . . . . . . . . . . . . . . . . . . 2,883,877 2,868,462Corporate . . . . . . . . . . . . . . . . . . . . . . . . . . . . . . . . . . . . . . . . . . 347,190 149,714Discontinued operations . . . . . . . . . . . . . . . . . . . . . . . . . . . . . . . . 10,638 8,957
Consolidated total assets . . . . . . . . . . . . . . . . . . . . . . . . . . . . . . $13,451,566 $11,603,413
89
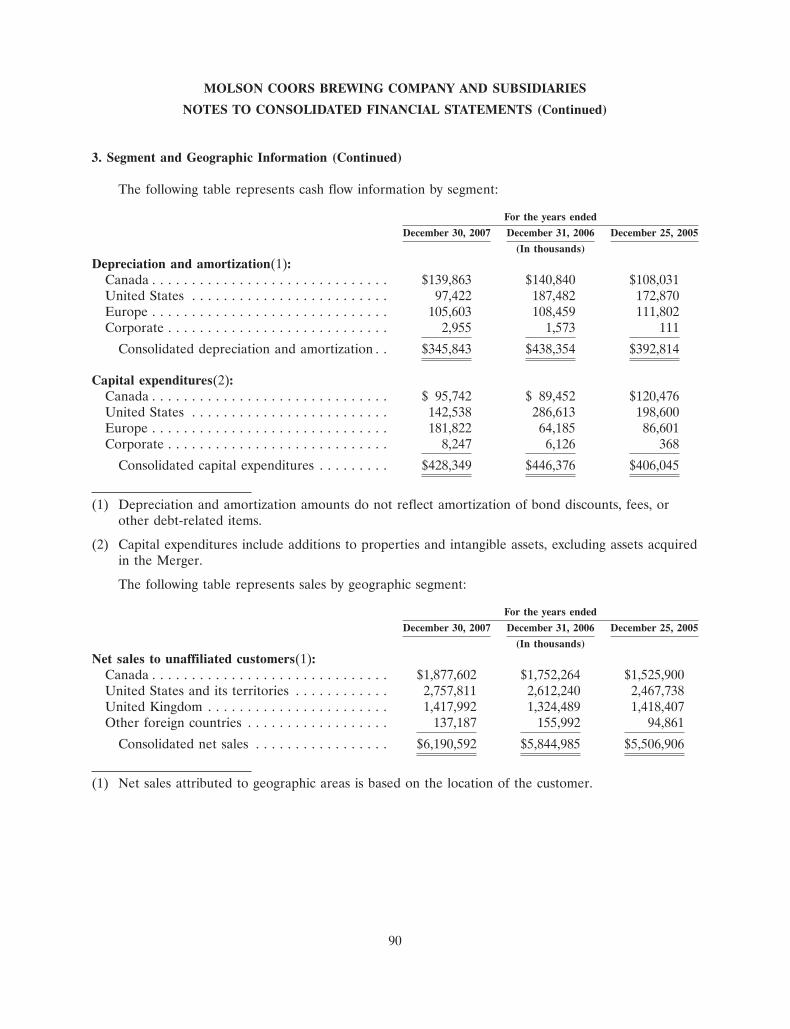
MOLSON COORS BREWING COMPANY AND SUBSIDIARIES
NOTES TO CONSOLIDATED FINANCIAL STATEMENTS (Continued)
3. Segment and Geographic Information (Continued)
The following table represents cash flow information by segment:
For the years ended
December 30, 2007 December 31, 2006 December 25, 2005
(In thousands)
Depreciation and amortization(1):Canada . . . . . . . . . . . . . . . . . . . . . . . . . . . . . . $139,863 $140,840 $108,031United States . . . . . . . . . . . . . . . . . . . . . . . . . 97,422 187,482 172,870Europe . . . . . . . . . . . . . . . . . . . . . . . . . . . . . . 105,603 108,459 111,802Corporate . . . . . . . . . . . . . . . . . . . . . . . . . . . . 2,955 1,573 111
Consolidated depreciation and amortization . . $345,843 $438,354 $392,814
Capital expenditures(2):Canada . . . . . . . . . . . . . . . . . . . . . . . . . . . . . . $ 95,742 $ 89,452 $120,476United States . . . . . . . . . . . . . . . . . . . . . . . . . 142,538 286,613 198,600Europe . . . . . . . . . . . . . . . . . . . . . . . . . . . . . . 181,822 64,185 86,601Corporate . . . . . . . . . . . . . . . . . . . . . . . . . . . . 8,247 6,126 368
Consolidated capital expenditures . . . . . . . . . $428,349 $446,376 $406,045
(1) Depreciation and amortization amounts do not reflect amortization of bond discounts, fees, orother debt-related items.
(2) Capital expenditures include additions to properties and intangible assets, excluding assets acquiredin the Merger.
The following table represents sales by geographic segment:
For the years ended
December 30, 2007 December 31, 2006 December 25, 2005
(In thousands)
Net sales to unaffiliated customers(1):Canada . . . . . . . . . . . . . . . . . . . . . . . . . . . . . . $1,877,602 $1,752,264 $1,525,900United States and its territories . . . . . . . . . . . . 2,757,811 2,612,240 2,467,738United Kingdom . . . . . . . . . . . . . . . . . . . . . . . 1,417,992 1,324,489 1,418,407Other foreign countries . . . . . . . . . . . . . . . . . . 137,187 155,992 94,861
Consolidated net sales . . . . . . . . . . . . . . . . . $6,190,592 $5,844,985 $5,506,906
(1) Net sales attributed to geographic areas is based on the location of the customer.
90
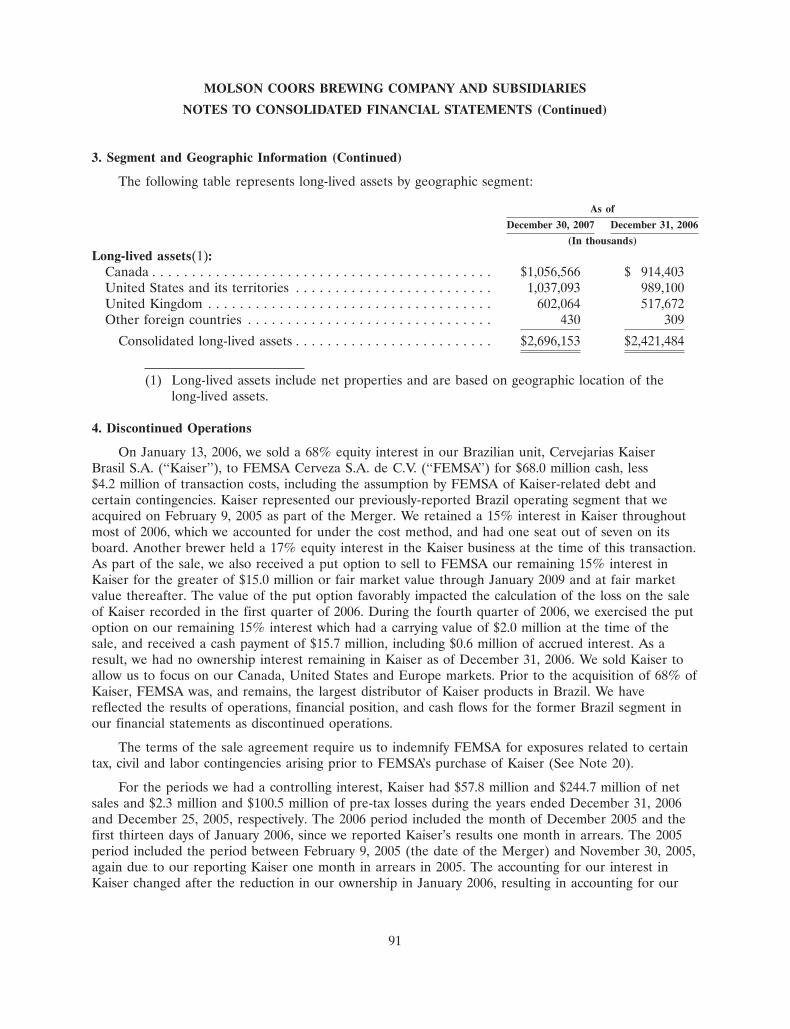
MOLSON COORS BREWING COMPANY AND SUBSIDIARIES
NOTES TO CONSOLIDATED FINANCIAL STATEMENTS (Continued)
3. Segment and Geographic Information (Continued)
The following table represents long-lived assets by geographic segment:
As of
December 30, 2007 December 31, 2006
(In thousands)
Long-lived assets(1):Canada . . . . . . . . . . . . . . . . . . . . . . . . . . . . . . . . . . . . . . . . . . . $1,056,566 $ 914,403United States and its territories . . . . . . . . . . . . . . . . . . . . . . . . . 1,037,093 989,100United Kingdom . . . . . . . . . . . . . . . . . . . . . . . . . . . . . . . . . . . . 602,064 517,672Other foreign countries . . . . . . . . . . . . . . . . . . . . . . . . . . . . . . . 430 309
Consolidated long-lived assets . . . . . . . . . . . . . . . . . . . . . . . . . $2,696,153 $2,421,484
(1) Long-lived assets include net properties and are based on geographic location of thelong-lived assets.
4. Discontinued Operations
On January 13, 2006, we sold a 68% equity interest in our Brazilian unit, Cervejarias KaiserBrasil S.A. (‘‘Kaiser’’), to FEMSA Cerveza S.A. de C.V. (‘‘FEMSA’’) for $68.0 million cash, less$4.2 million of transaction costs, including the assumption by FEMSA of Kaiser-related debt andcertain contingencies. Kaiser represented our previously-reported Brazil operating segment that weacquired on February 9, 2005 as part of the Merger. We retained a 15% interest in Kaiser throughoutmost of 2006, which we accounted for under the cost method, and had one seat out of seven on itsboard. Another brewer held a 17% equity interest in the Kaiser business at the time of this transaction.As part of the sale, we also received a put option to sell to FEMSA our remaining 15% interest inKaiser for the greater of $15.0 million or fair market value through January 2009 and at fair marketvalue thereafter. The value of the put option favorably impacted the calculation of the loss on the saleof Kaiser recorded in the first quarter of 2006. During the fourth quarter of 2006, we exercised the putoption on our remaining 15% interest which had a carrying value of $2.0 million at the time of thesale, and received a cash payment of $15.7 million, including $0.6 million of accrued interest. As aresult, we had no ownership interest remaining in Kaiser as of December 31, 2006. We sold Kaiser toallow us to focus on our Canada, United States and Europe markets. Prior to the acquisition of 68% ofKaiser, FEMSA was, and remains, the largest distributor of Kaiser products in Brazil. We havereflected the results of operations, financial position, and cash flows for the former Brazil segment inour financial statements as discontinued operations.
The terms of the sale agreement require us to indemnify FEMSA for exposures related to certaintax, civil and labor contingencies arising prior to FEMSA’s purchase of Kaiser (See Note 20).
For the periods we had a controlling interest, Kaiser had $57.8 million and $244.7 million of netsales and $2.3 million and $100.5 million of pre-tax losses during the years ended December 31, 2006and December 25, 2005, respectively. The 2006 period included the month of December 2005 and thefirst thirteen days of January 2006, since we reported Kaiser’s results one month in arrears. The 2005period included the period between February 9, 2005 (the date of the Merger) and November 30, 2005,again due to our reporting Kaiser one month in arrears in 2005. The accounting for our interest inKaiser changed after the reduction in our ownership in January 2006, resulting in accounting for our
91
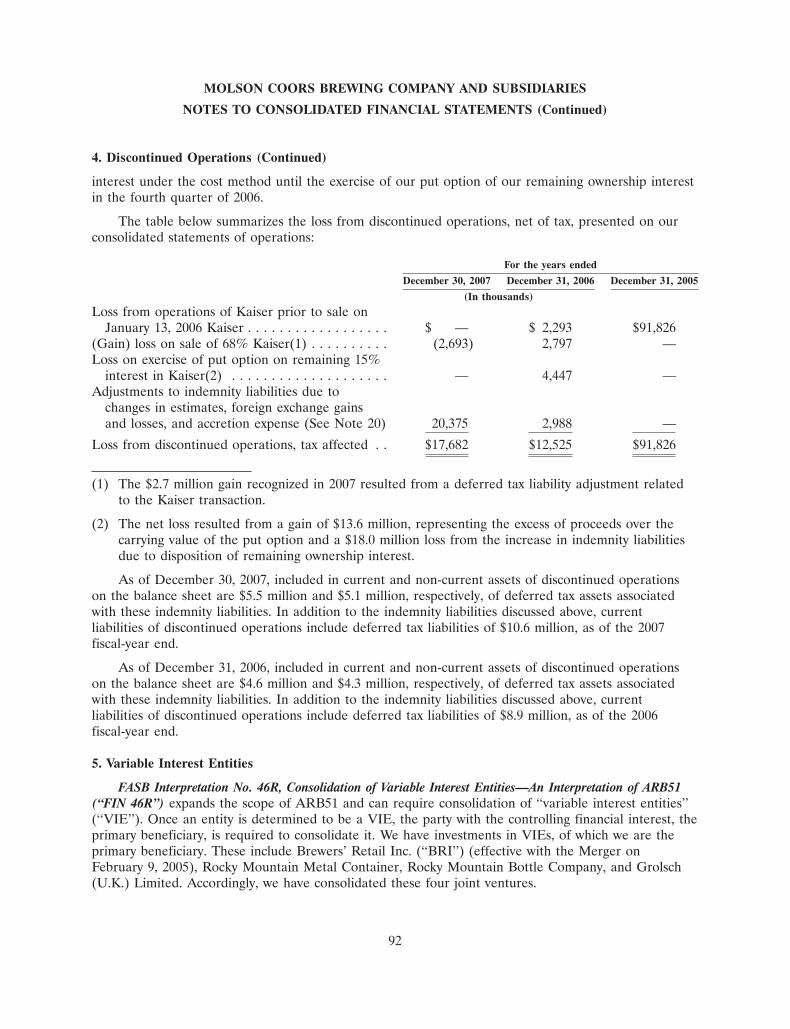
MOLSON COORS BREWING COMPANY AND SUBSIDIARIES
NOTES TO CONSOLIDATED FINANCIAL STATEMENTS (Continued)
4. Discontinued Operations (Continued)
interest under the cost method until the exercise of our put option of our remaining ownership interestin the fourth quarter of 2006.
The table below summarizes the loss from discontinued operations, net of tax, presented on ourconsolidated statements of operations:
For the years ended
December 30, 2007 December 31, 2006 December 31, 2005
(In thousands)
Loss from operations of Kaiser prior to sale onJanuary 13, 2006 Kaiser . . . . . . . . . . . . . . . . . . $ — $ 2,293 $91,826
(Gain) loss on sale of 68% Kaiser(1) . . . . . . . . . . (2,693) 2,797 —Loss on exercise of put option on remaining 15%
interest in Kaiser(2) . . . . . . . . . . . . . . . . . . . . — 4,447 —Adjustments to indemnity liabilities due to
changes in estimates, foreign exchange gainsand losses, and accretion expense (See Note 20) 20,375 2,988 —
Loss from discontinued operations, tax affected . . $17,682 $12,525 $91,826
(1) The $2.7 million gain recognized in 2007 resulted from a deferred tax liability adjustment relatedto the Kaiser transaction.
(2) The net loss resulted from a gain of $13.6 million, representing the excess of proceeds over thecarrying value of the put option and a $18.0 million loss from the increase in indemnity liabilitiesdue to disposition of remaining ownership interest.
As of December 30, 2007, included in current and non-current assets of discontinued operationson the balance sheet are $5.5 million and $5.1 million, respectively, of deferred tax assets associatedwith these indemnity liabilities. In addition to the indemnity liabilities discussed above, currentliabilities of discontinued operations include deferred tax liabilities of $10.6 million, as of the 2007fiscal-year end.
As of December 31, 2006, included in current and non-current assets of discontinued operationson the balance sheet are $4.6 million and $4.3 million, respectively, of deferred tax assets associatedwith these indemnity liabilities. In addition to the indemnity liabilities discussed above, currentliabilities of discontinued operations include deferred tax liabilities of $8.9 million, as of the 2006fiscal-year end.
5. Variable Interest Entities
FASB Interpretation No. 46R, Consolidation of Variable Interest Entities—An Interpretation of ARB51(‘‘FIN 46R’’) expands the scope of ARB51 and can require consolidation of ‘‘variable interest entities’’(‘‘VIE’’). Once an entity is determined to be a VIE, the party with the controlling financial interest, theprimary beneficiary, is required to consolidate it. We have investments in VIEs, of which we are theprimary beneficiary. These include Brewers’ Retail Inc. (‘‘BRI’’) (effective with the Merger onFebruary 9, 2005), Rocky Mountain Metal Container, Rocky Mountain Bottle Company, and Grolsch(U.K.) Limited. Accordingly, we have consolidated these four joint ventures.
92

MOLSON COORS BREWING COMPANY AND SUBSIDIARIES
NOTES TO CONSOLIDATED FINANCIAL STATEMENTS (Continued)
5. Variable Interest Entities (Continued)
Brewers’ Retail Inc.
Brewers’ Retail Inc. is a joint venture beer distribution and retail network for the Ontario regionof Canada, owned by Molson, Labatt and Sleeman brewers. Ownership percentages fluctuate with salesvolumes. At December 30, 2007, our ownership percentage was approximately 52%. BRI operates on abreakeven basis. The three owners guarantee BRI’s debt of approximately $215 million and$184 million and pension liabilities of approximately $42 million and $49 million, respectively, atDecember 30, 2007 and December 31, 2006, respectively.
Rocky Mountain Metal Container
RMMC, a Colorado limited liability company, is a joint venture with Ball Corporation in which wehold a 50% interest. We have a can and end supply agreement with RMMC. Under this agreement,RMMC supplies us with substantially all the can and end requirements for our Golden brewery.RMMC manufactures these cans and ends at our manufacturing facilities, which RMMC is operatingunder a use and license agreement. RMMC is a non-taxable entity. Accordingly, income tax expense onthe accompanying statements of operations only includes taxes related to our share of the joint ventureincome or loss. The Company is the guarantor of approximately $27.3 million and $32.0 million ofRMMC debt at December 30, 2007 and December 31, 2006, respectively.
Rocky Mountain Bottle Company
RMBC, a Colorado limited liability company, is a joint venture with Owens-Brockway GlassContainer, Inc. (‘‘Owens’’) in which we hold a 50% interest. RMBC produces glass bottles at our glassmanufacturing facility for use at our Golden brewery. Under this agreement, RMBC supplies our bottlerequirements, and Owens has a contract to supply the majority of our bottle requirements not met byRMBC. RMBC is a non-taxable entity. Accordingly, income tax expense in our consolidated statementsof operations only includes taxes related to our share of the joint venture income or loss.
Grolsch
Grolsch is a joint venture between CBL and Royal Grolsch N.V. in which we hold a 49% interest.The Grolsch joint venture markets Grolsch branded beer in the United Kingdom and the Republic ofIreland. The majority of the Grolsch branded beer is produced by CBL under a contract brewingarrangement with the joint venture. CBL and Royal Grolsch N.V. sell beer to the joint venture, whichsells the beer back to CBL (for onward sale to customers) for a price equal to what it paid, plus amarketing and overhead charge and a profit margin. Grolsch is a taxable entity in the United Kingdom.Accordingly, income tax expense in our Consolidated Statements of Operations includes taxes relatedto the entire income of the joint venture.
93
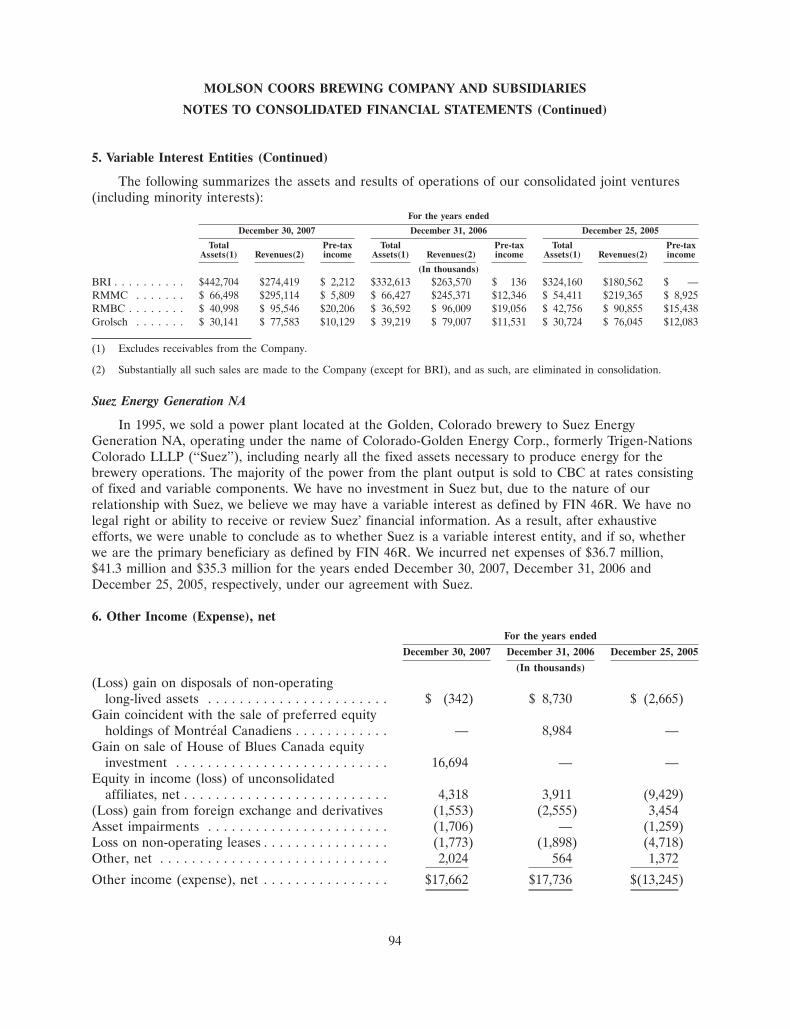
MOLSON COORS BREWING COMPANY AND SUBSIDIARIES
NOTES TO CONSOLIDATED FINANCIAL STATEMENTS (Continued)
5. Variable Interest Entities (Continued)
The following summarizes the assets and results of operations of our consolidated joint ventures(including minority interests):
For the years ended
December 30, 2007 December 31, 2006 December 25, 2005
Total Pre-tax Total Pre-tax Total Pre-taxAssets(1) Revenues(2) income Assets(1) Revenues(2) income Assets(1) Revenues(2) income
(In thousands)BRI . . . . . . . . . . $442,704 $274,419 $ 2,212 $332,613 $263,570 $ 136 $324,160 $180,562 $ —RMMC . . . . . . . $ 66,498 $295,114 $ 5,809 $ 66,427 $245,371 $12,346 $ 54,411 $219,365 $ 8,925RMBC . . . . . . . . $ 40,998 $ 95,546 $20,206 $ 36,592 $ 96,009 $19,056 $ 42,756 $ 90,855 $15,438Grolsch . . . . . . . $ 30,141 $ 77,583 $10,129 $ 39,219 $ 79,007 $11,531 $ 30,724 $ 76,045 $12,083
(1) Excludes receivables from the Company.
(2) Substantially all such sales are made to the Company (except for BRI), and as such, are eliminated in consolidation.
Suez Energy Generation NA
In 1995, we sold a power plant located at the Golden, Colorado brewery to Suez EnergyGeneration NA, operating under the name of Colorado-Golden Energy Corp., formerly Trigen-NationsColorado LLLP (‘‘Suez’’), including nearly all the fixed assets necessary to produce energy for thebrewery operations. The majority of the power from the plant output is sold to CBC at rates consistingof fixed and variable components. We have no investment in Suez but, due to the nature of ourrelationship with Suez, we believe we may have a variable interest as defined by FIN 46R. We have nolegal right or ability to receive or review Suez’ financial information. As a result, after exhaustiveefforts, we were unable to conclude as to whether Suez is a variable interest entity, and if so, whetherwe are the primary beneficiary as defined by FIN 46R. We incurred net expenses of $36.7 million,$41.3 million and $35.3 million for the years ended December 30, 2007, December 31, 2006 andDecember 25, 2005, respectively, under our agreement with Suez.
6. Other Income (Expense), netFor the years ended
December 30, 2007 December 31, 2006 December 25, 2005
(In thousands)
(Loss) gain on disposals of non-operatinglong-lived assets . . . . . . . . . . . . . . . . . . . . . . . $ (342) $ 8,730 $ (2,665)
Gain coincident with the sale of preferred equityholdings of Montreal Canadiens . . . . . . . . . . . . — 8,984 —
Gain on sale of House of Blues Canada equityinvestment . . . . . . . . . . . . . . . . . . . . . . . . . . . 16,694 — —
Equity in income (loss) of unconsolidatedaffiliates, net . . . . . . . . . . . . . . . . . . . . . . . . . . 4,318 3,911 (9,429)
(Loss) gain from foreign exchange and derivatives (1,553) (2,555) 3,454Asset impairments . . . . . . . . . . . . . . . . . . . . . . . (1,706) — (1,259)Loss on non-operating leases . . . . . . . . . . . . . . . . (1,773) (1,898) (4,718)Other, net . . . . . . . . . . . . . . . . . . . . . . . . . . . . . 2,024 564 1,372
Other income (expense), net . . . . . . . . . . . . . . . . $17,662 $17,736 $(13,245)
94
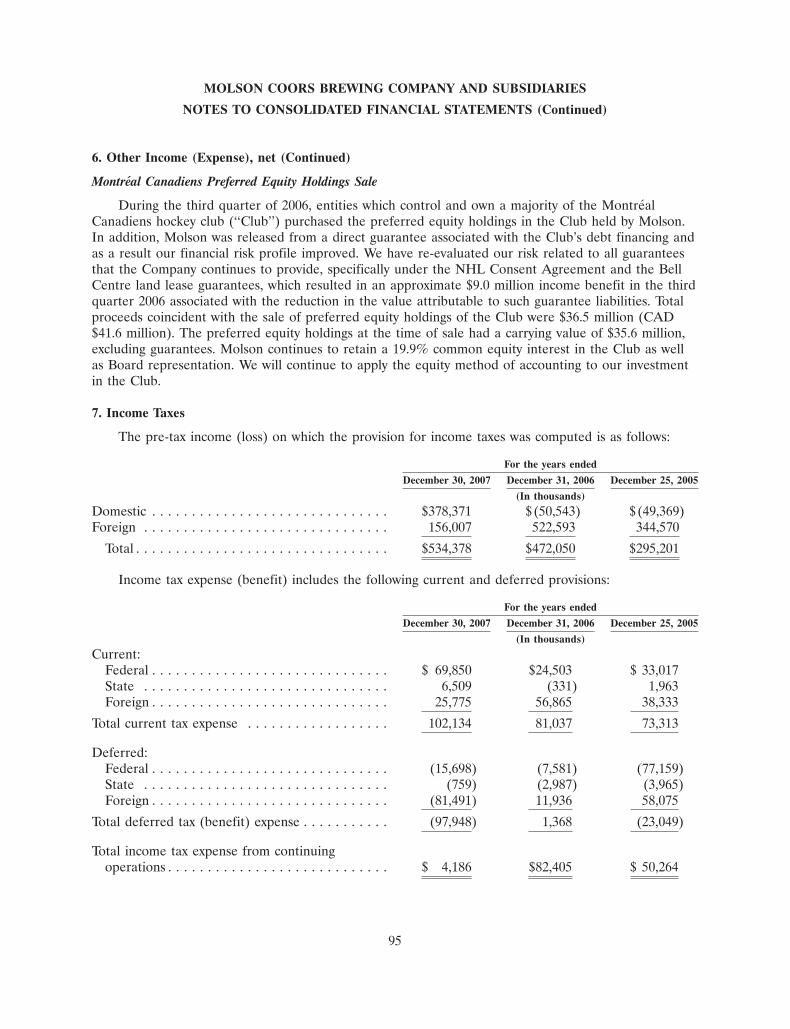
MOLSON COORS BREWING COMPANY AND SUBSIDIARIES
NOTES TO CONSOLIDATED FINANCIAL STATEMENTS (Continued)
6. Other Income (Expense), net (Continued)
Montreal Canadiens Preferred Equity Holdings Sale
During the third quarter of 2006, entities which control and own a majority of the MontrealCanadiens hockey club (‘‘Club’’) purchased the preferred equity holdings in the Club held by Molson.In addition, Molson was released from a direct guarantee associated with the Club’s debt financing andas a result our financial risk profile improved. We have re-evaluated our risk related to all guaranteesthat the Company continues to provide, specifically under the NHL Consent Agreement and the BellCentre land lease guarantees, which resulted in an approximate $9.0 million income benefit in the thirdquarter 2006 associated with the reduction in the value attributable to such guarantee liabilities. Totalproceeds coincident with the sale of preferred equity holdings of the Club were $36.5 million (CAD$41.6 million). The preferred equity holdings at the time of sale had a carrying value of $35.6 million,excluding guarantees. Molson continues to retain a 19.9% common equity interest in the Club as wellas Board representation. We will continue to apply the equity method of accounting to our investmentin the Club.
7. Income Taxes
The pre-tax income (loss) on which the provision for income taxes was computed is as follows:
For the years ended
December 30, 2007 December 31, 2006 December 25, 2005
(In thousands)
Domestic . . . . . . . . . . . . . . . . . . . . . . . . . . . . . . $378,371 $(50,543) $(49,369)Foreign . . . . . . . . . . . . . . . . . . . . . . . . . . . . . . . 156,007 522,593 344,570
Total . . . . . . . . . . . . . . . . . . . . . . . . . . . . . . . . $534,378 $472,050 $295,201
Income tax expense (benefit) includes the following current and deferred provisions:
For the years ended
December 30, 2007 December 31, 2006 December 25, 2005
(In thousands)
Current:Federal . . . . . . . . . . . . . . . . . . . . . . . . . . . . . . $ 69,850 $24,503 $ 33,017State . . . . . . . . . . . . . . . . . . . . . . . . . . . . . . . 6,509 (331) 1,963Foreign . . . . . . . . . . . . . . . . . . . . . . . . . . . . . . 25,775 56,865 38,333
Total current tax expense . . . . . . . . . . . . . . . . . . 102,134 81,037 73,313
Deferred:Federal . . . . . . . . . . . . . . . . . . . . . . . . . . . . . . (15,698) (7,581) (77,159)State . . . . . . . . . . . . . . . . . . . . . . . . . . . . . . . (759) (2,987) (3,965)Foreign . . . . . . . . . . . . . . . . . . . . . . . . . . . . . . (81,491) 11,936 58,075
Total deferred tax (benefit) expense . . . . . . . . . . . (97,948) 1,368 (23,049)
Total income tax expense from continuingoperations . . . . . . . . . . . . . . . . . . . . . . . . . . . . $ 4,186 $82,405 $ 50,264
95
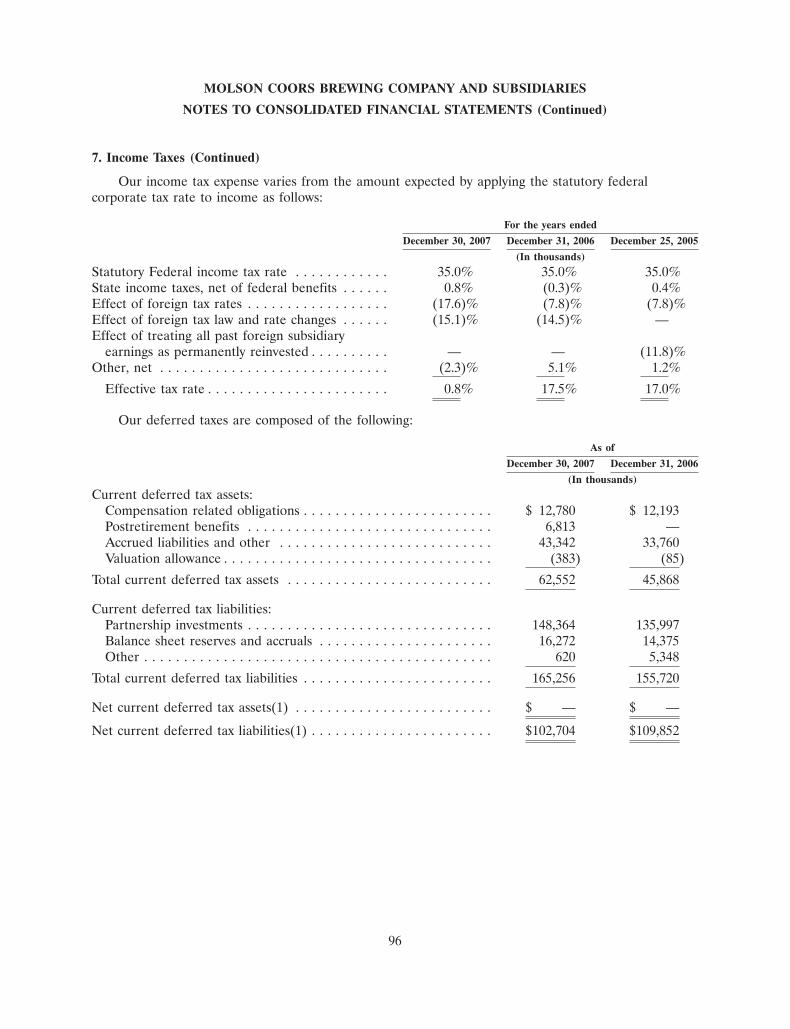
MOLSON COORS BREWING COMPANY AND SUBSIDIARIES
NOTES TO CONSOLIDATED FINANCIAL STATEMENTS (Continued)
7. Income Taxes (Continued)
Our income tax expense varies from the amount expected by applying the statutory federalcorporate tax rate to income as follows:
For the years ended
December 30, 2007 December 31, 2006 December 25, 2005
(In thousands)
Statutory Federal income tax rate . . . . . . . . . . . . 35.0% 35.0% 35.0%State income taxes, net of federal benefits . . . . . . 0.8% (0.3)% 0.4%Effect of foreign tax rates . . . . . . . . . . . . . . . . . . (17.6)% (7.8)% (7.8)%Effect of foreign tax law and rate changes . . . . . . (15.1)% (14.5)% —Effect of treating all past foreign subsidiary
earnings as permanently reinvested . . . . . . . . . . — — (11.8)%Other, net . . . . . . . . . . . . . . . . . . . . . . . . . . . . . (2.3)% 5.1% 1.2%
Effective tax rate . . . . . . . . . . . . . . . . . . . . . . . 0.8% 17.5% 17.0%
Our deferred taxes are composed of the following:
As of
December 30, 2007 December 31, 2006
(In thousands)
Current deferred tax assets:Compensation related obligations . . . . . . . . . . . . . . . . . . . . . . . . $ 12,780 $ 12,193Postretirement benefits . . . . . . . . . . . . . . . . . . . . . . . . . . . . . . . 6,813 —Accrued liabilities and other . . . . . . . . . . . . . . . . . . . . . . . . . . . 43,342 33,760Valuation allowance . . . . . . . . . . . . . . . . . . . . . . . . . . . . . . . . . . (383) (85)
Total current deferred tax assets . . . . . . . . . . . . . . . . . . . . . . . . . . 62,552 45,868
Current deferred tax liabilities:Partnership investments . . . . . . . . . . . . . . . . . . . . . . . . . . . . . . . 148,364 135,997Balance sheet reserves and accruals . . . . . . . . . . . . . . . . . . . . . . 16,272 14,375Other . . . . . . . . . . . . . . . . . . . . . . . . . . . . . . . . . . . . . . . . . . . . 620 5,348
Total current deferred tax liabilities . . . . . . . . . . . . . . . . . . . . . . . . 165,256 155,720
Net current deferred tax assets(1) . . . . . . . . . . . . . . . . . . . . . . . . . $ — $ —
Net current deferred tax liabilities(1) . . . . . . . . . . . . . . . . . . . . . . . $102,704 $109,852
96
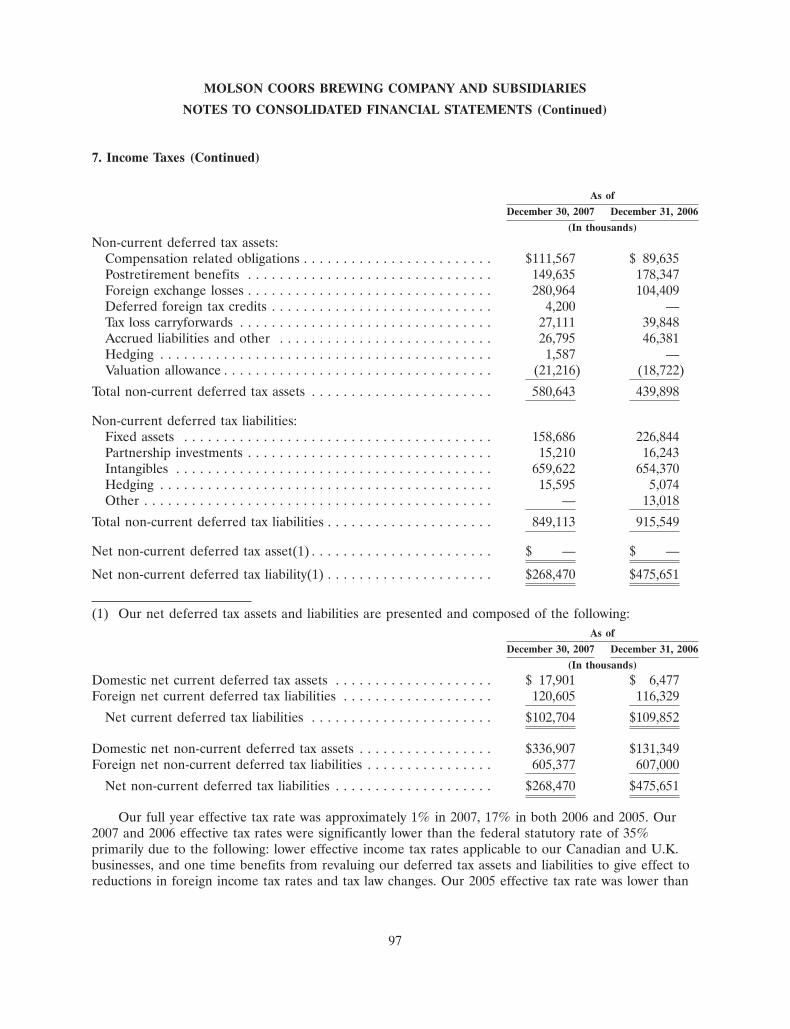
MOLSON COORS BREWING COMPANY AND SUBSIDIARIES
NOTES TO CONSOLIDATED FINANCIAL STATEMENTS (Continued)
7. Income Taxes (Continued)
As of
December 30, 2007 December 31, 2006
(In thousands)
Non-current deferred tax assets:Compensation related obligations . . . . . . . . . . . . . . . . . . . . . . . . $111,567 $ 89,635Postretirement benefits . . . . . . . . . . . . . . . . . . . . . . . . . . . . . . . 149,635 178,347Foreign exchange losses . . . . . . . . . . . . . . . . . . . . . . . . . . . . . . . 280,964 104,409Deferred foreign tax credits . . . . . . . . . . . . . . . . . . . . . . . . . . . . 4,200 —Tax loss carryforwards . . . . . . . . . . . . . . . . . . . . . . . . . . . . . . . . 27,111 39,848Accrued liabilities and other . . . . . . . . . . . . . . . . . . . . . . . . . . . 26,795 46,381Hedging . . . . . . . . . . . . . . . . . . . . . . . . . . . . . . . . . . . . . . . . . . 1,587 —Valuation allowance . . . . . . . . . . . . . . . . . . . . . . . . . . . . . . . . . . (21,216) (18,722)
Total non-current deferred tax assets . . . . . . . . . . . . . . . . . . . . . . . 580,643 439,898
Non-current deferred tax liabilities:Fixed assets . . . . . . . . . . . . . . . . . . . . . . . . . . . . . . . . . . . . . . . 158,686 226,844Partnership investments . . . . . . . . . . . . . . . . . . . . . . . . . . . . . . . 15,210 16,243Intangibles . . . . . . . . . . . . . . . . . . . . . . . . . . . . . . . . . . . . . . . . 659,622 654,370Hedging . . . . . . . . . . . . . . . . . . . . . . . . . . . . . . . . . . . . . . . . . . 15,595 5,074Other . . . . . . . . . . . . . . . . . . . . . . . . . . . . . . . . . . . . . . . . . . . . — 13,018
Total non-current deferred tax liabilities . . . . . . . . . . . . . . . . . . . . . 849,113 915,549
Net non-current deferred tax asset(1) . . . . . . . . . . . . . . . . . . . . . . . $ — $ —
Net non-current deferred tax liability(1) . . . . . . . . . . . . . . . . . . . . . $268,470 $475,651
(1) Our net deferred tax assets and liabilities are presented and composed of the following:As of
December 30, 2007 December 31, 2006
(In thousands)
Domestic net current deferred tax assets . . . . . . . . . . . . . . . . . . . . $ 17,901 $ 6,477Foreign net current deferred tax liabilities . . . . . . . . . . . . . . . . . . . 120,605 116,329
Net current deferred tax liabilities . . . . . . . . . . . . . . . . . . . . . . . $102,704 $109,852
Domestic net non-current deferred tax assets . . . . . . . . . . . . . . . . . $336,907 $131,349Foreign net non-current deferred tax liabilities . . . . . . . . . . . . . . . . 605,377 607,000
Net non-current deferred tax liabilities . . . . . . . . . . . . . . . . . . . . $268,470 $475,651
Our full year effective tax rate was approximately 1% in 2007, 17% in both 2006 and 2005. Our2007 and 2006 effective tax rates were significantly lower than the federal statutory rate of 35%primarily due to the following: lower effective income tax rates applicable to our Canadian and U.K.businesses, and one time benefits from revaluing our deferred tax assets and liabilities to give effect toreductions in foreign income tax rates and tax law changes. Our 2005 effective tax rate was lower than
97

MOLSON COORS BREWING COMPANY AND SUBSIDIARIES
NOTES TO CONSOLIDATED FINANCIAL STATEMENTS (Continued)
7. Income Taxes (Continued)
the federal statutory rate of 35% primarily due to lower income tax rates applicable to our Canadianand U.K. businesses and a one time benefit resulting from the reversal of a previously recognizeddeferred tax liability due to our election to treat our portion of all foreign subsidiary earnings throughDecember 25, 2005, as permanently reinvested under the accounting guidance of APB 23 ‘‘Accountingfor Income Taxes-Special Areas’’ and SFAS 109 ‘‘Accounting for Income Taxes.’’
The Company has U.S. federal and state net operating losses and foreign tax credit carryforwards.The tax effect of these attributes is $7.0 million at December 30, 2007, and $2.7 million atDecember 31, 2006, which will expire between 2008 and 2028. The Company believes that a portion ofthe deferred tax asset attributable to these losses and credit carryforwards is not, more likely than not,to be realized and has established a valuation allowance in the amount of $6.9 million and $1.3 millionat December 30, 2007, and December 31, 2006, respectively. The change in valuation allowance fromDecember 31, 2006 to December 30, 2007, is primarily attributable to the limitation of foreign taxcredits resulting from unrecognized tax benefits. In addition, the Company has Canadian federal andprovincial net operating loss and capital loss carryforwards. The tax effect of these attributes is$12.4 million at December 30, 2007 and $25 million at December 31, 2006. The Canadian losscarryforwards will expire between 2013 through 2027. The Company believes that a portion of thedeferred tax asset attributable to the Canadian loss carryforwards is not, more likely than not, to berealized and has established a valuation allowance in the amount of $2.7 million and $5.3 million andDecember 30, 2007 and December 31, 2006, respectively. The change from December 31, 2006 toDecember 30, 2007, is attributable to the closing of the federal audit and revaluing the deferred taxasset accordingly. In addition, the Company has U.K. capital loss carryforwards. The tax effect of theseattributes was $12.0 million at December 30, 2007, and $12.2 million at December 31, 2006. The U.K.capital loss carryforwards do not have a limit in time to be used; however, the Company believes thatthe deferred tax asset associated with these U.K. loss carryforwards is not, more likely than not, to berealized and has established a valuation allowance for the full amount, $12.0 million and $12.2 millionat December 30, 2007 and December 31, 2006, respectively. The change from December 31, 2006 toDecember 30, 2007, is attributable to revaluing the deferred tax asset associated with the capital losscarryforwards as a result of the U.K. income tax rate reduction.
Annual tax provisions include amounts considered sufficient to pay assessments that may resultfrom examination of prior year tax returns; however, the amount ultimately paid upon resolution ofissues may differ materially from the amount accrued. On January 1, 2007, we adopted the provisionsof FIN 48, and we recognized an approximate $132.1 million increase in liabilities for uncertain taxpositions. As a result, as of January 1, 2007, we had $297.4 million of unrecognized tax benefits. SinceJanuary 1, 2007, unrecognized tax benefits decreased by $11.2 million. This reduction represents the netof increases due to fluctuation in foreign exchange rates, additional unrecognized tax benefits, accruedpenalties, and interest accrued for the current year and decreases primarily due to tax years closing orbeing effectively settled and payments made to tax authorities with regard to unrecognized tax benefitsduring 2007, resulting in total unrecognized tax benefits of $286.2 million as of December 30, 2007.Approximately $267 million would, if recognized, affect the effective tax rate. During 2008, theCompany expects to recognize a $50 to $60 million income tax benefit due to a reduction inunrecognized tax benefits. This income tax benefit is primarily due to penalties and interest associatedwith issues subject to audits that we believe are going to close in the next year. We note, however, thatthere are other pending tax law changes in Canada that if enacted, would result in an approximate$120 million decrease to the unrecognized tax benefits. This one-time, non-cash income tax benefit
98
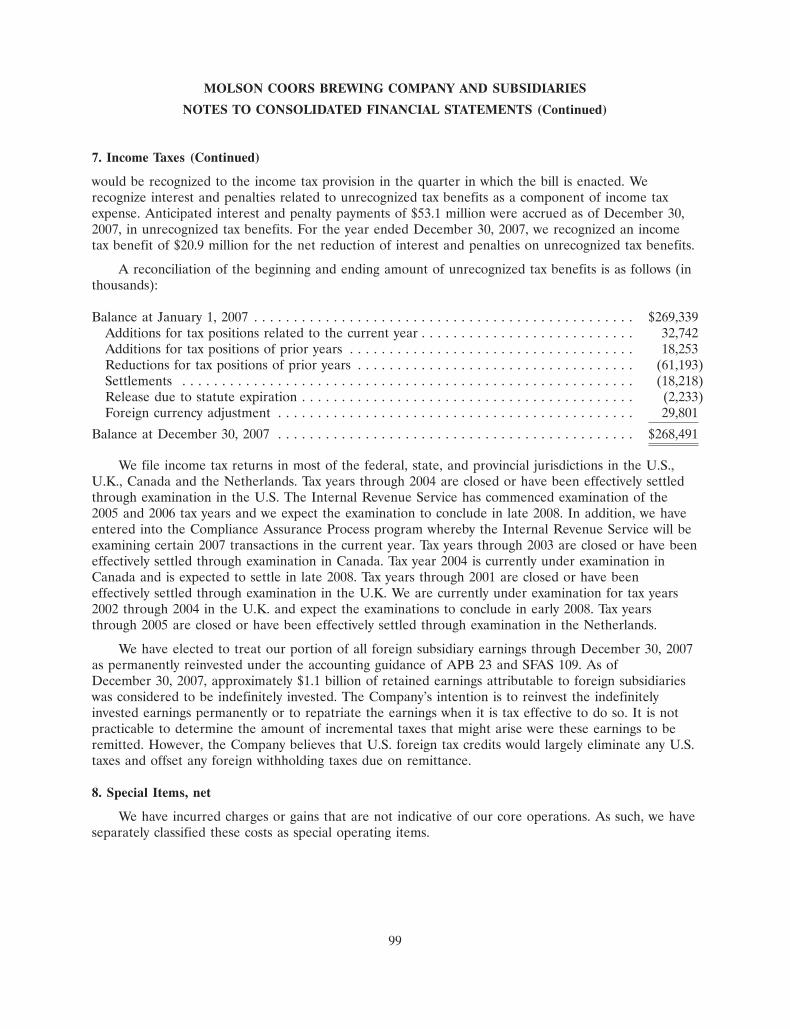
MOLSON COORS BREWING COMPANY AND SUBSIDIARIES
NOTES TO CONSOLIDATED FINANCIAL STATEMENTS (Continued)
7. Income Taxes (Continued)
would be recognized to the income tax provision in the quarter in which the bill is enacted. Werecognize interest and penalties related to unrecognized tax benefits as a component of income taxexpense. Anticipated interest and penalty payments of $53.1 million were accrued as of December 30,2007, in unrecognized tax benefits. For the year ended December 30, 2007, we recognized an incometax benefit of $20.9 million for the net reduction of interest and penalties on unrecognized tax benefits.
A reconciliation of the beginning and ending amount of unrecognized tax benefits is as follows (inthousands):
Balance at January 1, 2007 . . . . . . . . . . . . . . . . . . . . . . . . . . . . . . . . . . . . . . . . . . . . . . . . $269,339Additions for tax positions related to the current year . . . . . . . . . . . . . . . . . . . . . . . . . . . 32,742Additions for tax positions of prior years . . . . . . . . . . . . . . . . . . . . . . . . . . . . . . . . . . . . 18,253Reductions for tax positions of prior years . . . . . . . . . . . . . . . . . . . . . . . . . . . . . . . . . . . (61,193)Settlements . . . . . . . . . . . . . . . . . . . . . . . . . . . . . . . . . . . . . . . . . . . . . . . . . . . . . . . . . (18,218)Release due to statute expiration . . . . . . . . . . . . . . . . . . . . . . . . . . . . . . . . . . . . . . . . . . (2,233)Foreign currency adjustment . . . . . . . . . . . . . . . . . . . . . . . . . . . . . . . . . . . . . . . . . . . . . 29,801
Balance at December 30, 2007 . . . . . . . . . . . . . . . . . . . . . . . . . . . . . . . . . . . . . . . . . . . . . $268,491
We file income tax returns in most of the federal, state, and provincial jurisdictions in the U.S.,U.K., Canada and the Netherlands. Tax years through 2004 are closed or have been effectively settledthrough examination in the U.S. The Internal Revenue Service has commenced examination of the2005 and 2006 tax years and we expect the examination to conclude in late 2008. In addition, we haveentered into the Compliance Assurance Process program whereby the Internal Revenue Service will beexamining certain 2007 transactions in the current year. Tax years through 2003 are closed or have beeneffectively settled through examination in Canada. Tax year 2004 is currently under examination inCanada and is expected to settle in late 2008. Tax years through 2001 are closed or have beeneffectively settled through examination in the U.K. We are currently under examination for tax years2002 through 2004 in the U.K. and expect the examinations to conclude in early 2008. Tax yearsthrough 2005 are closed or have been effectively settled through examination in the Netherlands.
We have elected to treat our portion of all foreign subsidiary earnings through December 30, 2007as permanently reinvested under the accounting guidance of APB 23 and SFAS 109. As ofDecember 30, 2007, approximately $1.1 billion of retained earnings attributable to foreign subsidiarieswas considered to be indefinitely invested. The Company’s intention is to reinvest the indefinitelyinvested earnings permanently or to repatriate the earnings when it is tax effective to do so. It is notpracticable to determine the amount of incremental taxes that might arise were these earnings to beremitted. However, the Company believes that U.S. foreign tax credits would largely eliminate any U.S.taxes and offset any foreign withholding taxes due on remittance.
8. Special Items, net
We have incurred charges or gains that are not indicative of our core operations. As such, we haveseparately classified these costs as special operating items.
99
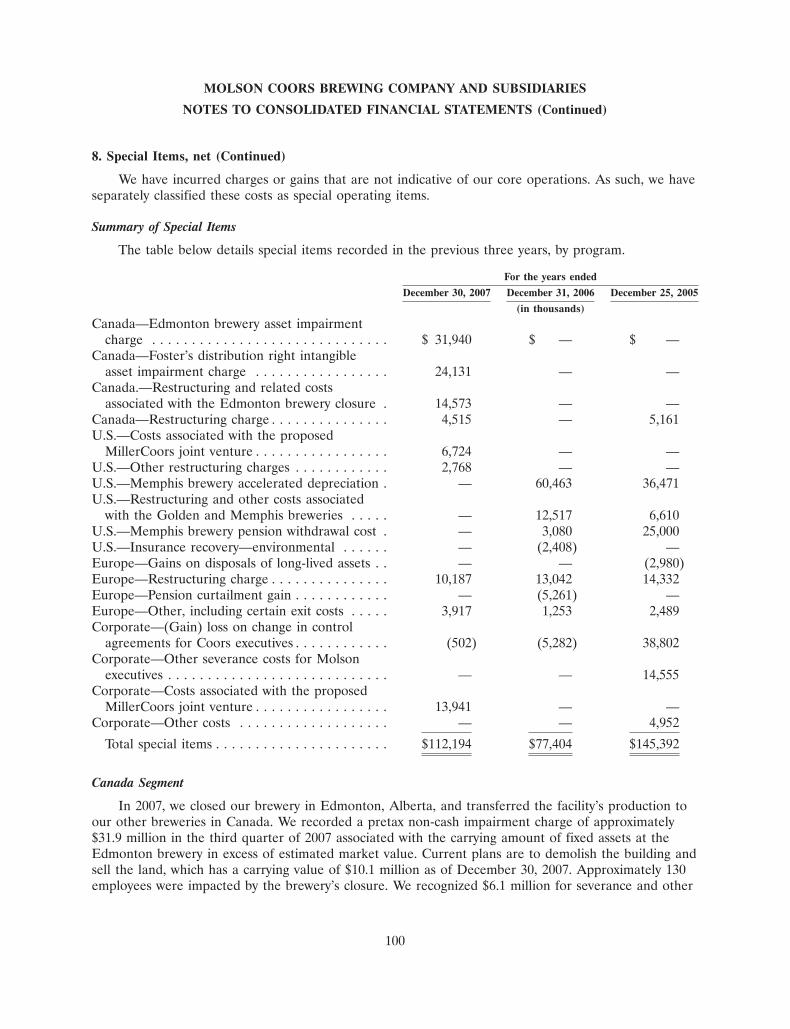
MOLSON COORS BREWING COMPANY AND SUBSIDIARIES
NOTES TO CONSOLIDATED FINANCIAL STATEMENTS (Continued)
8. Special Items, net (Continued)
We have incurred charges or gains that are not indicative of our core operations. As such, we haveseparately classified these costs as special operating items.
Summary of Special Items
The table below details special items recorded in the previous three years, by program.
For the years ended
December 30, 2007 December 31, 2006 December 25, 2005
(in thousands)
Canada—Edmonton brewery asset impairmentcharge . . . . . . . . . . . . . . . . . . . . . . . . . . . . . . $ 31,940 $ — $ —
Canada—Foster’s distribution right intangibleasset impairment charge . . . . . . . . . . . . . . . . . 24,131 — —
Canada.—Restructuring and related costsassociated with the Edmonton brewery closure . 14,573 — —
Canada—Restructuring charge . . . . . . . . . . . . . . . 4,515 — 5,161U.S.—Costs associated with the proposed
MillerCoors joint venture . . . . . . . . . . . . . . . . . 6,724 — —U.S.—Other restructuring charges . . . . . . . . . . . . 2,768 — —U.S.—Memphis brewery accelerated depreciation . — 60,463 36,471U.S.—Restructuring and other costs associated
with the Golden and Memphis breweries . . . . . — 12,517 6,610U.S.—Memphis brewery pension withdrawal cost . — 3,080 25,000U.S.—Insurance recovery—environmental . . . . . . — (2,408) —Europe—Gains on disposals of long-lived assets . . — — (2,980)Europe—Restructuring charge . . . . . . . . . . . . . . . 10,187 13,042 14,332Europe—Pension curtailment gain . . . . . . . . . . . . — (5,261) —Europe—Other, including certain exit costs . . . . . 3,917 1,253 2,489Corporate—(Gain) loss on change in control
agreements for Coors executives . . . . . . . . . . . . (502) (5,282) 38,802Corporate—Other severance costs for Molson
executives . . . . . . . . . . . . . . . . . . . . . . . . . . . . — — 14,555Corporate—Costs associated with the proposed
MillerCoors joint venture . . . . . . . . . . . . . . . . . 13,941 — —Corporate—Other costs . . . . . . . . . . . . . . . . . . . — — 4,952
Total special items . . . . . . . . . . . . . . . . . . . . . . $112,194 $77,404 $145,392
Canada Segment
In 2007, we closed our brewery in Edmonton, Alberta, and transferred the facility’s production toour other breweries in Canada. We recorded a pretax non-cash impairment charge of approximately$31.9 million in the third quarter of 2007 associated with the carrying amount of fixed assets at theEdmonton brewery in excess of estimated market value. Current plans are to demolish the building andsell the land, which has a carrying value of $10.1 million as of December 30, 2007. Approximately 130employees were impacted by the brewery’s closure. We recognized $6.1 million for severance and other
100
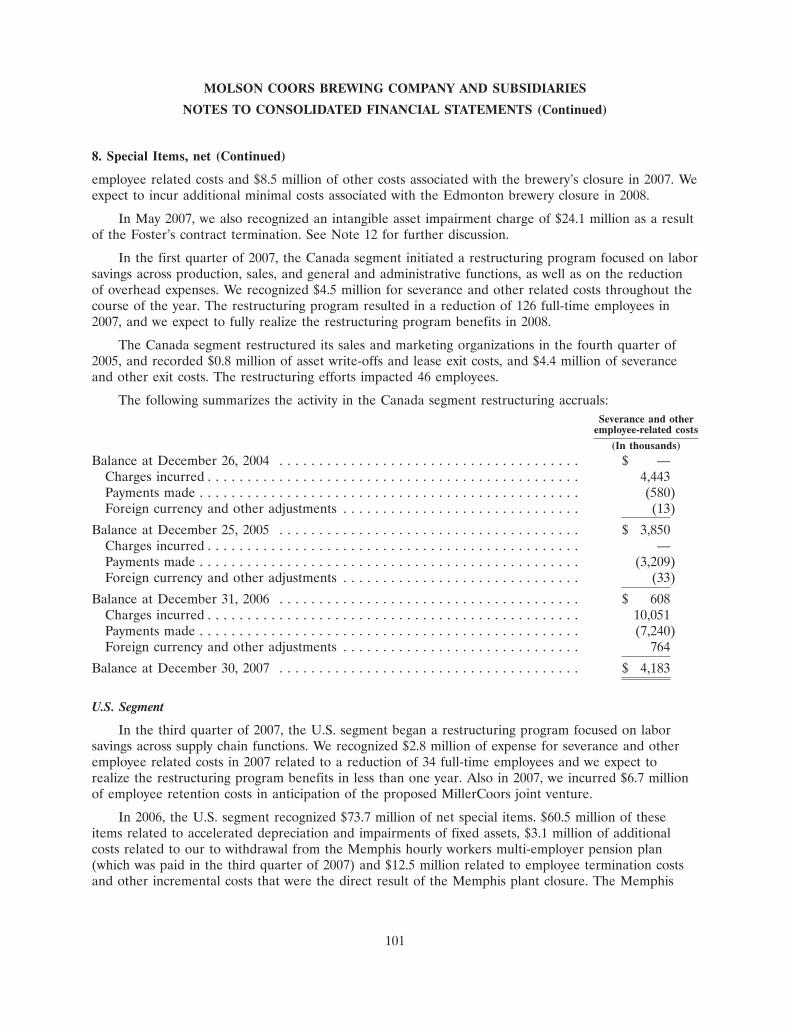
MOLSON COORS BREWING COMPANY AND SUBSIDIARIES
NOTES TO CONSOLIDATED FINANCIAL STATEMENTS (Continued)
8. Special Items, net (Continued)
employee related costs and $8.5 million of other costs associated with the brewery’s closure in 2007. Weexpect to incur additional minimal costs associated with the Edmonton brewery closure in 2008.
In May 2007, we also recognized an intangible asset impairment charge of $24.1 million as a resultof the Foster’s contract termination. See Note 12 for further discussion.
In the first quarter of 2007, the Canada segment initiated a restructuring program focused on laborsavings across production, sales, and general and administrative functions, as well as on the reductionof overhead expenses. We recognized $4.5 million for severance and other related costs throughout thecourse of the year. The restructuring program resulted in a reduction of 126 full-time employees in2007, and we expect to fully realize the restructuring program benefits in 2008.
The Canada segment restructured its sales and marketing organizations in the fourth quarter of2005, and recorded $0.8 million of asset write-offs and lease exit costs, and $4.4 million of severanceand other exit costs. The restructuring efforts impacted 46 employees.
The following summarizes the activity in the Canada segment restructuring accruals:Severance and other
employee-related costs
(In thousands)
Balance at December 26, 2004 . . . . . . . . . . . . . . . . . . . . . . . . . . . . . . . . . . . . . . $ —Charges incurred . . . . . . . . . . . . . . . . . . . . . . . . . . . . . . . . . . . . . . . . . . . . . . . 4,443Payments made . . . . . . . . . . . . . . . . . . . . . . . . . . . . . . . . . . . . . . . . . . . . . . . . (580)Foreign currency and other adjustments . . . . . . . . . . . . . . . . . . . . . . . . . . . . . . (13)
Balance at December 25, 2005 . . . . . . . . . . . . . . . . . . . . . . . . . . . . . . . . . . . . . . $ 3,850Charges incurred . . . . . . . . . . . . . . . . . . . . . . . . . . . . . . . . . . . . . . . . . . . . . . . —Payments made . . . . . . . . . . . . . . . . . . . . . . . . . . . . . . . . . . . . . . . . . . . . . . . . (3,209)Foreign currency and other adjustments . . . . . . . . . . . . . . . . . . . . . . . . . . . . . . (33)
Balance at December 31, 2006 . . . . . . . . . . . . . . . . . . . . . . . . . . . . . . . . . . . . . . $ 608Charges incurred . . . . . . . . . . . . . . . . . . . . . . . . . . . . . . . . . . . . . . . . . . . . . . . 10,051Payments made . . . . . . . . . . . . . . . . . . . . . . . . . . . . . . . . . . . . . . . . . . . . . . . . (7,240)Foreign currency and other adjustments . . . . . . . . . . . . . . . . . . . . . . . . . . . . . . 764
Balance at December 30, 2007 . . . . . . . . . . . . . . . . . . . . . . . . . . . . . . . . . . . . . . $ 4,183
U.S. Segment
In the third quarter of 2007, the U.S. segment began a restructuring program focused on laborsavings across supply chain functions. We recognized $2.8 million of expense for severance and otheremployee related costs in 2007 related to a reduction of 34 full-time employees and we expect torealize the restructuring program benefits in less than one year. Also in 2007, we incurred $6.7 millionof employee retention costs in anticipation of the proposed MillerCoors joint venture.
In 2006, the U.S. segment recognized $73.7 million of net special items. $60.5 million of theseitems related to accelerated depreciation and impairments of fixed assets, $3.1 million of additionalcosts related to our to withdrawal from the Memphis hourly workers multi-employer pension plan(which was paid in the third quarter of 2007) and $12.5 million related to employee termination costsand other incremental costs that were the direct result of the Memphis plant closure. The Memphis
101
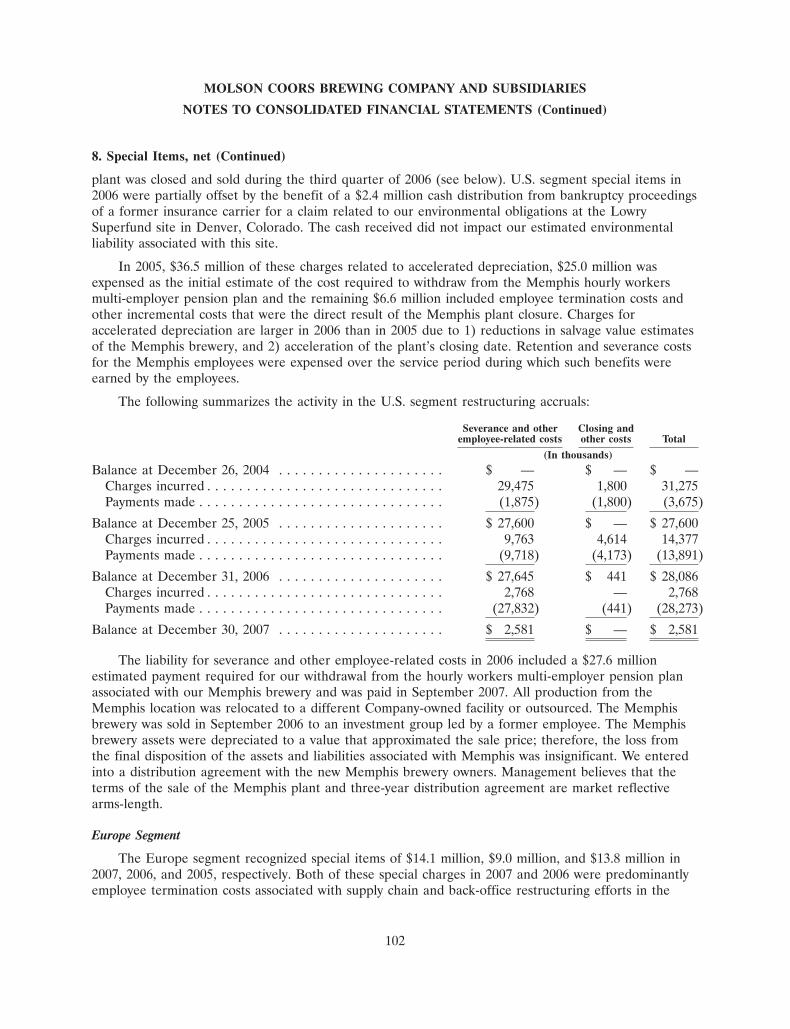
MOLSON COORS BREWING COMPANY AND SUBSIDIARIES
NOTES TO CONSOLIDATED FINANCIAL STATEMENTS (Continued)
8. Special Items, net (Continued)
plant was closed and sold during the third quarter of 2006 (see below). U.S. segment special items in2006 were partially offset by the benefit of a $2.4 million cash distribution from bankruptcy proceedingsof a former insurance carrier for a claim related to our environmental obligations at the LowrySuperfund site in Denver, Colorado. The cash received did not impact our estimated environmentalliability associated with this site.
In 2005, $36.5 million of these charges related to accelerated depreciation, $25.0 million wasexpensed as the initial estimate of the cost required to withdraw from the Memphis hourly workersmulti-employer pension plan and the remaining $6.6 million included employee termination costs andother incremental costs that were the direct result of the Memphis plant closure. Charges foraccelerated depreciation are larger in 2006 than in 2005 due to 1) reductions in salvage value estimatesof the Memphis brewery, and 2) acceleration of the plant’s closing date. Retention and severance costsfor the Memphis employees were expensed over the service period during which such benefits wereearned by the employees.
The following summarizes the activity in the U.S. segment restructuring accruals:
Severance and other Closing andemployee-related costs other costs Total
(In thousands)
Balance at December 26, 2004 . . . . . . . . . . . . . . . . . . . . . $ — $ — $ —Charges incurred . . . . . . . . . . . . . . . . . . . . . . . . . . . . . . 29,475 1,800 31,275Payments made . . . . . . . . . . . . . . . . . . . . . . . . . . . . . . . (1,875) (1,800) (3,675)
Balance at December 25, 2005 . . . . . . . . . . . . . . . . . . . . . $ 27,600 $ — $ 27,600Charges incurred . . . . . . . . . . . . . . . . . . . . . . . . . . . . . . 9,763 4,614 14,377Payments made . . . . . . . . . . . . . . . . . . . . . . . . . . . . . . . (9,718) (4,173) (13,891)
Balance at December 31, 2006 . . . . . . . . . . . . . . . . . . . . . $ 27,645 $ 441 $ 28,086Charges incurred . . . . . . . . . . . . . . . . . . . . . . . . . . . . . . 2,768 — 2,768Payments made . . . . . . . . . . . . . . . . . . . . . . . . . . . . . . . (27,832) (441) (28,273)
Balance at December 30, 2007 . . . . . . . . . . . . . . . . . . . . . $ 2,581 $ — $ 2,581
The liability for severance and other employee-related costs in 2006 included a $27.6 millionestimated payment required for our withdrawal from the hourly workers multi-employer pension planassociated with our Memphis brewery and was paid in September 2007. All production from theMemphis location was relocated to a different Company-owned facility or outsourced. The Memphisbrewery was sold in September 2006 to an investment group led by a former employee. The Memphisbrewery assets were depreciated to a value that approximated the sale price; therefore, the loss fromthe final disposition of the assets and liabilities associated with Memphis was insignificant. We enteredinto a distribution agreement with the new Memphis brewery owners. Management believes that theterms of the sale of the Memphis plant and three-year distribution agreement are market reflectivearms-length.
Europe Segment
The Europe segment recognized special items of $14.1 million, $9.0 million, and $13.8 million in2007, 2006, and 2005, respectively. Both of these special charges in 2007 and 2006 were predominantlyemployee termination costs associated with supply chain and back-office restructuring efforts in the
102
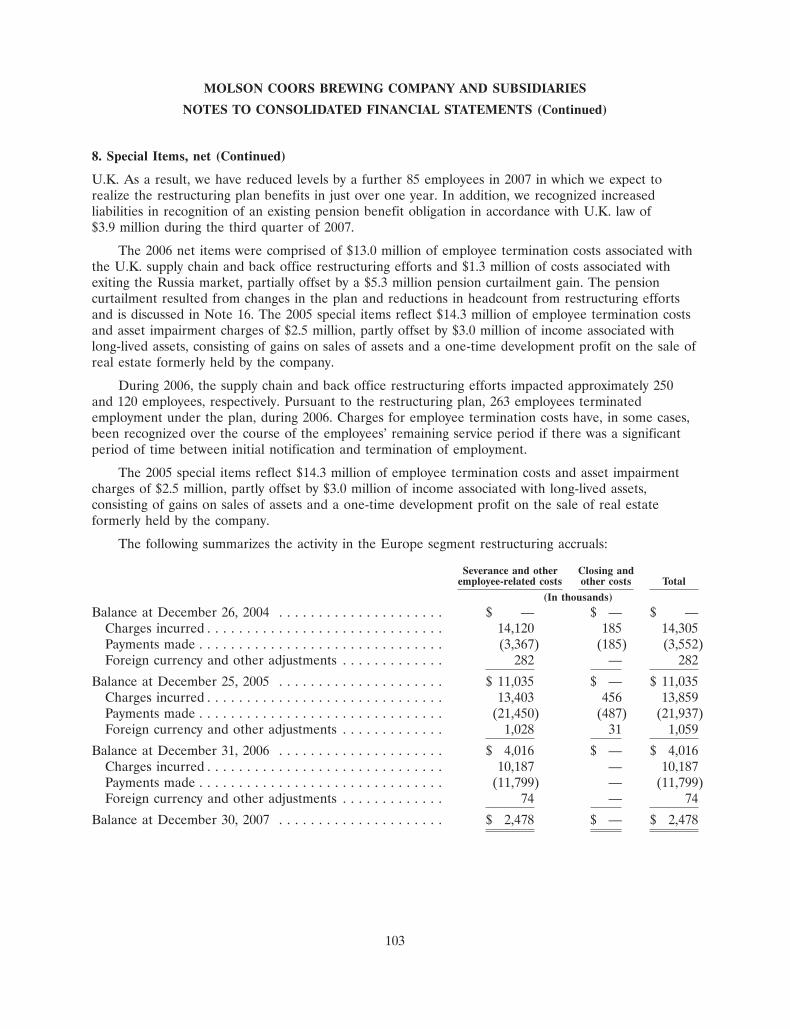
MOLSON COORS BREWING COMPANY AND SUBSIDIARIES
NOTES TO CONSOLIDATED FINANCIAL STATEMENTS (Continued)
8. Special Items, net (Continued)
U.K. As a result, we have reduced levels by a further 85 employees in 2007 in which we expect torealize the restructuring plan benefits in just over one year. In addition, we recognized increasedliabilities in recognition of an existing pension benefit obligation in accordance with U.K. law of$3.9 million during the third quarter of 2007.
The 2006 net items were comprised of $13.0 million of employee termination costs associated withthe U.K. supply chain and back office restructuring efforts and $1.3 million of costs associated withexiting the Russia market, partially offset by a $5.3 million pension curtailment gain. The pensioncurtailment resulted from changes in the plan and reductions in headcount from restructuring effortsand is discussed in Note 16. The 2005 special items reflect $14.3 million of employee termination costsand asset impairment charges of $2.5 million, partly offset by $3.0 million of income associated withlong-lived assets, consisting of gains on sales of assets and a one-time development profit on the sale ofreal estate formerly held by the company.
During 2006, the supply chain and back office restructuring efforts impacted approximately 250and 120 employees, respectively. Pursuant to the restructuring plan, 263 employees terminatedemployment under the plan, during 2006. Charges for employee termination costs have, in some cases,been recognized over the course of the employees’ remaining service period if there was a significantperiod of time between initial notification and termination of employment.
The 2005 special items reflect $14.3 million of employee termination costs and asset impairmentcharges of $2.5 million, partly offset by $3.0 million of income associated with long-lived assets,consisting of gains on sales of assets and a one-time development profit on the sale of real estateformerly held by the company.
The following summarizes the activity in the Europe segment restructuring accruals:
Severance and other Closing andemployee-related costs other costs Total
(In thousands)
Balance at December 26, 2004 . . . . . . . . . . . . . . . . . . . . . $ — $ — $ —Charges incurred . . . . . . . . . . . . . . . . . . . . . . . . . . . . . . 14,120 185 14,305Payments made . . . . . . . . . . . . . . . . . . . . . . . . . . . . . . . (3,367) (185) (3,552)Foreign currency and other adjustments . . . . . . . . . . . . . 282 — 282
Balance at December 25, 2005 . . . . . . . . . . . . . . . . . . . . . $ 11,035 $ — $ 11,035Charges incurred . . . . . . . . . . . . . . . . . . . . . . . . . . . . . . 13,403 456 13,859Payments made . . . . . . . . . . . . . . . . . . . . . . . . . . . . . . . (21,450) (487) (21,937)Foreign currency and other adjustments . . . . . . . . . . . . . 1,028 31 1,059
Balance at December 31, 2006 . . . . . . . . . . . . . . . . . . . . . $ 4,016 $ — $ 4,016Charges incurred . . . . . . . . . . . . . . . . . . . . . . . . . . . . . . 10,187 — 10,187Payments made . . . . . . . . . . . . . . . . . . . . . . . . . . . . . . . (11,799) — (11,799)Foreign currency and other adjustments . . . . . . . . . . . . . 74 — 74
Balance at December 30, 2007 . . . . . . . . . . . . . . . . . . . . . $ 2,478 $ — $ 2,478
103
MOLSON COORS BREWING COMPANY AND SUBSIDIARIES
NOTES TO CONSOLIDATED FINANCIAL STATEMENTS (Continued)
8. Special Items, net (Continued)
Corporate Costs
The Corporate segment recognized net special expenses of $13.4 million, a special benefit of$5.3 million and special charges of $58.3 million in 2007,2006 and 2005, respectively. The costs reportedas special items recorded in 2007 are associated with the proposed MillerCoors joint venture, andconsist primarily of outside professional services. These charges were partially offset by a reversal of anexcise tax accrual for an employee that exercised options under the control agreement following theMerger. The special items for 2006 were a result of adjusting to the floor provided on the exerciseprice of stock options held by former Coors officers who left the Company under change in controlagreements following the Merger. We did not recognize a charge related to the floor provided on theexercise price of the stock options, as the stock price exceeded the floor price throughout 2007.
Coors had agreements with executive officers, and certain other members of management, relatingto a change of control of Coors (referred to above). The Merger, which occurred on February 9, 2005,constituted a change in control of Coors under these agreements. These employees were entitled toseverance benefits if triggering events specified in the agreement occurred. Upon a triggering event, theofficer would receive a multiple of annual salary and bonus and continued health, pension and lifeinsurance benefits. For terminated officers, stock option exercises are subject to a floor market priceequal to the price of Coors’ stock on the date of the change of control ($36.75). This potential cashaward is recorded as a liability and is marked to market each period with the change in MCBC’s stockprice, up to the price at the date of the Merger and has a five year term from February 2005 toFebruary 2010. When the price of the Company’s stock rises to the option floor, it results in areduction of this liability. To the extent the Company’s stock price falls below the Merger price,additional charges are necessary. We recorded zero and $5.9 million liability as of December 31, 2006and December 25, 2005, respectively, related to stock option floor. The cost or benefit associated withthe stock option exercise price floor is included in the statement of cash flows as share-basedcompensation as a non-cash increase or decrease to net income in determining cash flows fromoperating activities.
The 2005 special items were associated with $31.8 million of severance and other benefits paid totwelve former Coors officers who exercised change in control rights, $6.9 million were a result ofproviding an exercise price floor on stock options, including additional payroll related taxes to be paidon behalf of a former Coors officer that exercised stock options under the change in control agreementassociated with these potential awards, $14.6 million of severance and share-based compensation andbenefits paid to two former Molson officers who left the Company during the second quarter of 2005following the Merger, and $5.0 million of merger-related costs that did not qualify for capitalizationunder purchase accounting.
104
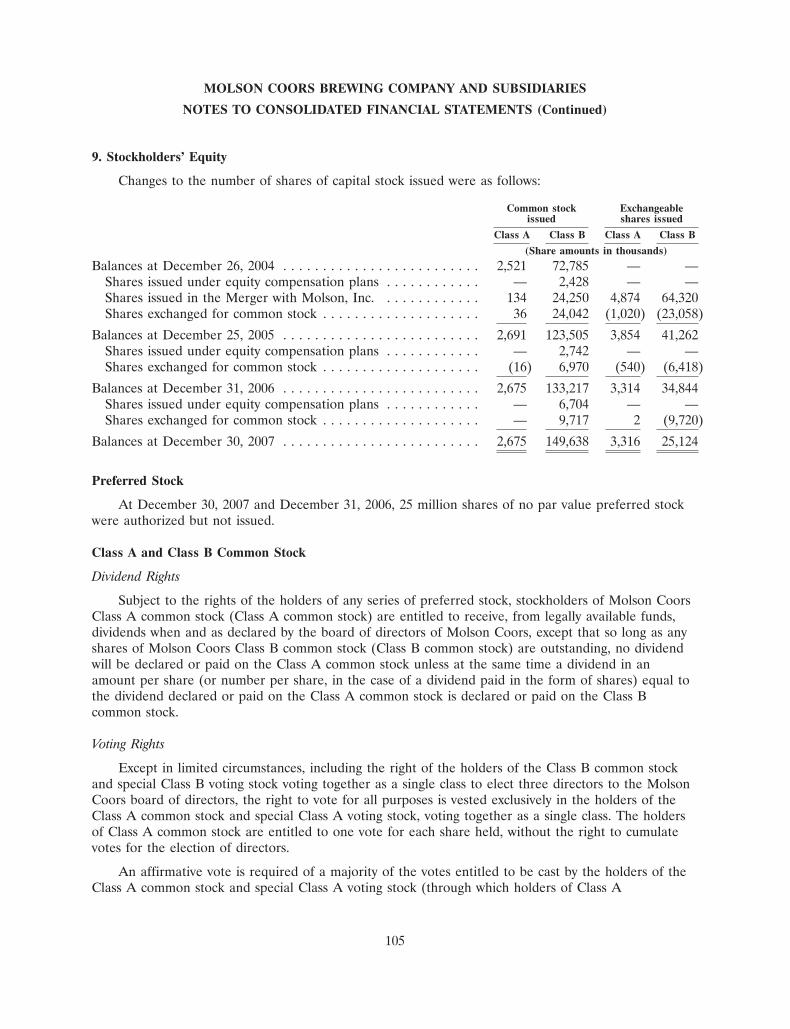
MOLSON COORS BREWING COMPANY AND SUBSIDIARIES
NOTES TO CONSOLIDATED FINANCIAL STATEMENTS (Continued)
9. Stockholders’ Equity
Changes to the number of shares of capital stock issued were as follows:
Common stock Exchangeableissued shares issued
Class A Class B Class A Class B
(Share amounts in thousands)
Balances at December 26, 2004 . . . . . . . . . . . . . . . . . . . . . . . . . 2,521 72,785 — —Shares issued under equity compensation plans . . . . . . . . . . . . — 2,428 — —Shares issued in the Merger with Molson, Inc. . . . . . . . . . . . . 134 24,250 4,874 64,320Shares exchanged for common stock . . . . . . . . . . . . . . . . . . . . 36 24,042 (1,020) (23,058)
Balances at December 25, 2005 . . . . . . . . . . . . . . . . . . . . . . . . . 2,691 123,505 3,854 41,262Shares issued under equity compensation plans . . . . . . . . . . . . — 2,742 — —Shares exchanged for common stock . . . . . . . . . . . . . . . . . . . . (16) 6,970 (540) (6,418)
Balances at December 31, 2006 . . . . . . . . . . . . . . . . . . . . . . . . . 2,675 133,217 3,314 34,844Shares issued under equity compensation plans . . . . . . . . . . . . — 6,704 — —Shares exchanged for common stock . . . . . . . . . . . . . . . . . . . . — 9,717 2 (9,720)
Balances at December 30, 2007 . . . . . . . . . . . . . . . . . . . . . . . . . 2,675 149,638 3,316 25,124
Preferred Stock
At December 30, 2007 and December 31, 2006, 25 million shares of no par value preferred stockwere authorized but not issued.
Class A and Class B Common Stock
Dividend Rights
Subject to the rights of the holders of any series of preferred stock, stockholders of Molson CoorsClass A common stock (Class A common stock) are entitled to receive, from legally available funds,dividends when and as declared by the board of directors of Molson Coors, except that so long as anyshares of Molson Coors Class B common stock (Class B common stock) are outstanding, no dividendwill be declared or paid on the Class A common stock unless at the same time a dividend in anamount per share (or number per share, in the case of a dividend paid in the form of shares) equal tothe dividend declared or paid on the Class A common stock is declared or paid on the Class Bcommon stock.
Voting Rights
Except in limited circumstances, including the right of the holders of the Class B common stockand special Class B voting stock voting together as a single class to elect three directors to the MolsonCoors board of directors, the right to vote for all purposes is vested exclusively in the holders of theClass A common stock and special Class A voting stock, voting together as a single class. The holdersof Class A common stock are entitled to one vote for each share held, without the right to cumulatevotes for the election of directors.
An affirmative vote is required of a majority of the votes entitled to be cast by the holders of theClass A common stock and special Class A voting stock (through which holders of Class A
105
MOLSON COORS BREWING COMPANY AND SUBSIDIARIES
NOTES TO CONSOLIDATED FINANCIAL STATEMENTS (Continued)
9. Stockholders’ Equity (Continued)
exchangeable shares vote), voting together as a single class, prior to the taking of certain actions,including:
• the issuance of any shares of Class A common stock or securities convertible into Class Acommon stock (other than upon the conversion of Class B common stock under circumstancesprovided in the certificate of incorporation or the exchange or redemption of Class Aexchangeable shares in accordance with the terms of those exchangeable shares) or securities(other than Class B common stock) convertible into or exercisable for Class A common stock;
• the issuance of shares of Class B common stock (other than upon the conversion of Class Acommon stock under circumstances provided in the certificate of incorporation or the exchangeor redemption of Class B exchangeable shares in accordance with the terms of thoseexchangeable shares) or securities (other than Class A common stock) that are convertible intoor exercisable for Class B common stock, if the number of shares to be issued is equal to orgreater than 20% of the number of outstanding shares of Class B common stock;
• the issuance of any preferred stock having voting rights other than those expressly required byDelaware law;
• the sale, transfer or other disposition of any capital stock (or securities convertible into orexchangeable for capital stock) of subsidiaries;
• the sale, transfer or other disposition of all or substantially all of the assets of the Company; and
• any decrease in the number of members of the Molson Coors board of directors to a numberbelow 15.
Pentland and the Coors Trust, which together control more than two-thirds of the Company’sClass A common and exchangeable stock, have voting trust agreements through which they havecombined their voting power over the shares of our Class A common stock and the Class Aexchangeable shares that they own. However, in the event that these two stockholders do not agree tovote in favor of a matter submitted to a stockholder vote (other than the election of directors), thevoting trustees will be required to vote all of the Class A common stock and Class A exchangeableshares deposited in the voting trusts against the matter. There is no other mechanism in the votingtrust agreements to resolve a potential deadlock between these stockholders.
The Molson Coors certificate of incorporation provides the holders of Class B common stock andspecial Class B voting stock (through which holders of Class B exchangeable shares vote), votingtogether as a single class, the right to elect three directors to the Molson Coors board of directors. Inaddition, the holders of Class B common stock and special Class B voting stock, voting together as asingle class, have the right to vote on specified transactional actions. Except in the limitedcircumstances provided in the certificate of incorporation, the right to vote for all other purposes isvested exclusively in the holders of the Class A common stock and special Class A voting stock, votingtogether as a single class. The holders of Class B common stock are entitled to one vote for each shareheld with respect to each matter on which holders of the Class B common stock are entitled to vote,without the right to cumulate votes for the election of directors.
106
MOLSON COORS BREWING COMPANY AND SUBSIDIARIES
NOTES TO CONSOLIDATED FINANCIAL STATEMENTS (Continued)
9. Stockholders’ Equity (Continued)
Rights Upon Dissolution or Wind Up
If Molson Coors liquidates, dissolves or winds up its affairs, the holders of Class A common stock,together with the holders of the Class B common stock, would be entitled to receive, after MolsonCoors’ creditors have been paid and the holders of any then outstanding series of preferred stock havereceived their liquidation preferences, all of the remaining assets of Molson Coors in proportion totheir share holdings. Holders of Class A and Class B common stock would not have pre-emptive rightsto acquire any securities of Molson Coors. The outstanding shares of Class A and Class B commonstock would be fully paid and non-assessable.
Conversion Rights
The Molson Coors certificate of incorporation provides for the right of holders of Class Acommon stock to convert their stock into Class B common stock on a one-for-one basis at any time.
Exchangeable Shares
The Class A exchangeable shares and Class B exchangeable shares were issued by Molson CoorsCanada Inc. (‘‘MCCI’’) a wholly-owned subsidiary. The exchangeable shares are substantially theeconomic equivalent of the corresponding shares of Class A and Class B common stock that a Molsonshareholder in the Merger would have received if the holder had elected to receive shares of MolsonCoors common stock. Holders of exchangeable shares also receive, through a voting trust, the benefitof Molson Coors voting rights, entitling the holder to one vote on the same basis and in the samecircumstances as one corresponding share of Molson Coors common stock.
The exchangeable shares are exchangeable at any time, at the option of the holder on aone-for-one basis for corresponding shares of Molson Coors common stock.
Holders of exchangeable shares are entitled to receive, subject to applicable law, dividends asfollows:
• in the case of a cash dividend declared on a corresponding share of Molson Coors commonstock, an amount in cash for each exchangeable share corresponding to the cash dividenddeclared on each corresponding share of Molson Coors common stock in USD or in anequivalent amount in CAD;
• in the case of a stock dividend declared on a corresponding share of Molson Coors commonstock to be paid in shares of Molson Coors common stock, in the number of exchangeableshares of the relevant class for each exchangeable share that is equal to the number of shares ofcorresponding Molson Coors common stock to be paid on each corresponding share of MolsonCoors common stock; or
• in the case of a dividend declared on a corresponding share of Molson Coors common stock inany other type of property, in the type and amount of property as is economically equivalent asdetermined by MCCI’s board of directors to the type and amount of property to be paid oneach corresponding share of Molson Coors common stock.
The declaration dates, record dates and payment dates for dividends on the exchangeable sharesare the same as the relevant dates for the dividends on the shares of corresponding Molson Coorscommon stock.
107
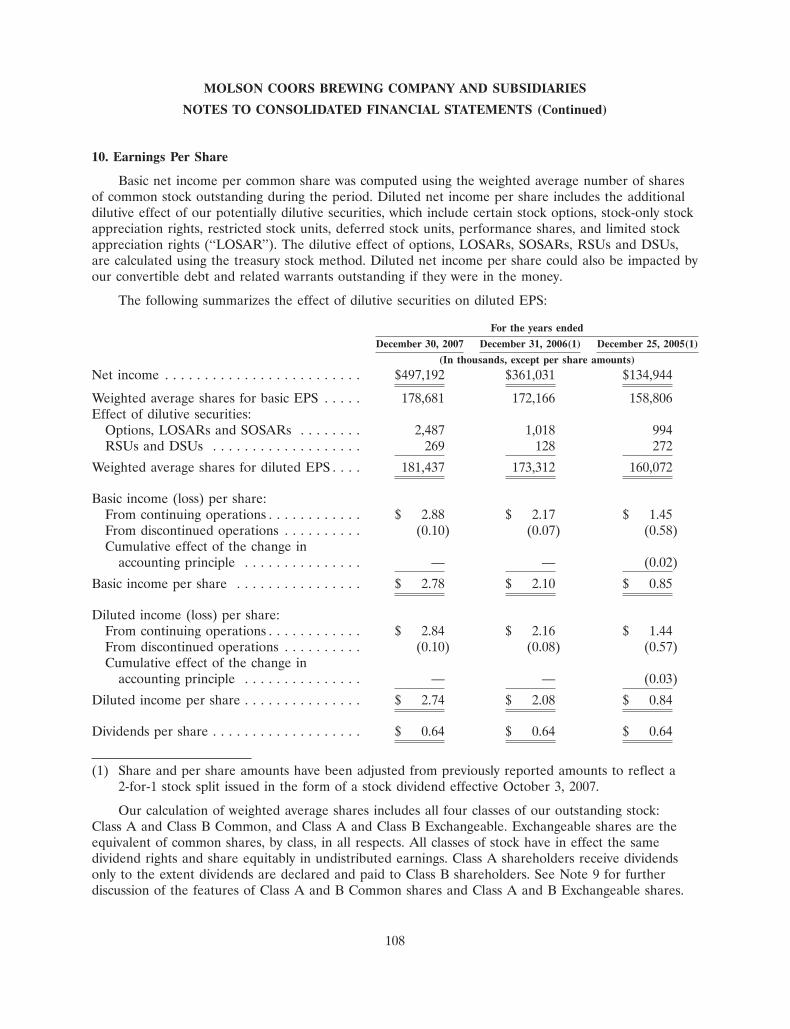
MOLSON COORS BREWING COMPANY AND SUBSIDIARIES
NOTES TO CONSOLIDATED FINANCIAL STATEMENTS (Continued)
10. Earnings Per Share
Basic net income per common share was computed using the weighted average number of sharesof common stock outstanding during the period. Diluted net income per share includes the additionaldilutive effect of our potentially dilutive securities, which include certain stock options, stock-only stockappreciation rights, restricted stock units, deferred stock units, performance shares, and limited stockappreciation rights (‘‘LOSAR’’). The dilutive effect of options, LOSARs, SOSARs, RSUs and DSUs,are calculated using the treasury stock method. Diluted net income per share could also be impacted byour convertible debt and related warrants outstanding if they were in the money.
The following summarizes the effect of dilutive securities on diluted EPS:
For the years ended
December 30, 2007 December 31, 2006(1) December 25, 2005(1)
(In thousands, except per share amounts)
Net income . . . . . . . . . . . . . . . . . . . . . . . . . $497,192 $361,031 $134,944
Weighted average shares for basic EPS . . . . . 178,681 172,166 158,806Effect of dilutive securities:
Options, LOSARs and SOSARs . . . . . . . . 2,487 1,018 994RSUs and DSUs . . . . . . . . . . . . . . . . . . . 269 128 272
Weighted average shares for diluted EPS . . . . 181,437 173,312 160,072
Basic income (loss) per share:From continuing operations . . . . . . . . . . . . $ 2.88 $ 2.17 $ 1.45From discontinued operations . . . . . . . . . . (0.10) (0.07) (0.58)Cumulative effect of the change in
accounting principle . . . . . . . . . . . . . . . — — (0.02)
Basic income per share . . . . . . . . . . . . . . . . $ 2.78 $ 2.10 $ 0.85
Diluted income (loss) per share:From continuing operations . . . . . . . . . . . . $ 2.84 $ 2.16 $ 1.44From discontinued operations . . . . . . . . . . (0.10) (0.08) (0.57)Cumulative effect of the change in
accounting principle . . . . . . . . . . . . . . . — — (0.03)
Diluted income per share . . . . . . . . . . . . . . . $ 2.74 $ 2.08 $ 0.84
Dividends per share . . . . . . . . . . . . . . . . . . . $ 0.64 $ 0.64 $ 0.64
(1) Share and per share amounts have been adjusted from previously reported amounts to reflect a2-for-1 stock split issued in the form of a stock dividend effective October 3, 2007.
Our calculation of weighted average shares includes all four classes of our outstanding stock:Class A and Class B Common, and Class A and Class B Exchangeable. Exchangeable shares are theequivalent of common shares, by class, in all respects. All classes of stock have in effect the samedividend rights and share equitably in undistributed earnings. Class A shareholders receive dividendsonly to the extent dividends are declared and paid to Class B shareholders. See Note 9 for furtherdiscussion of the features of Class A and B Common shares and Class A and B Exchangeable shares.
108
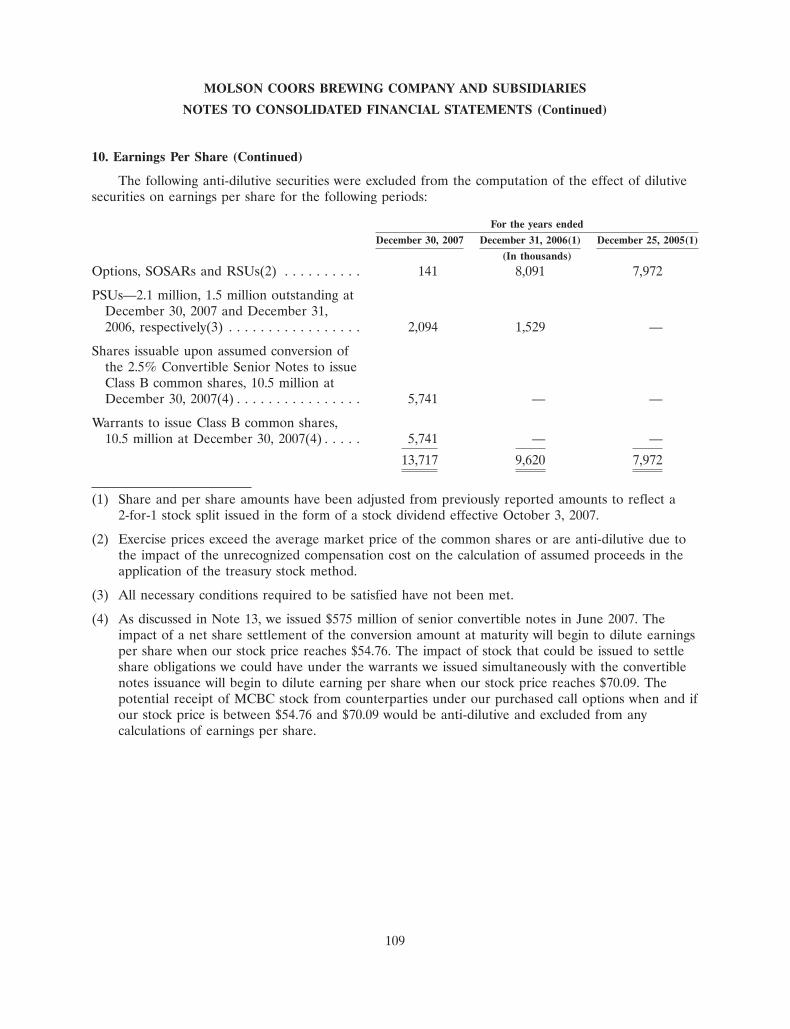
MOLSON COORS BREWING COMPANY AND SUBSIDIARIES
NOTES TO CONSOLIDATED FINANCIAL STATEMENTS (Continued)
10. Earnings Per Share (Continued)
The following anti-dilutive securities were excluded from the computation of the effect of dilutivesecurities on earnings per share for the following periods:
For the years ended
December 30, 2007 December 31, 2006(1) December 25, 2005(1)
(In thousands)
Options, SOSARs and RSUs(2) . . . . . . . . . . 141 8,091 7,972
PSUs—2.1 million, 1.5 million outstanding atDecember 30, 2007 and December 31,2006, respectively(3) . . . . . . . . . . . . . . . . . 2,094 1,529 —
Shares issuable upon assumed conversion ofthe 2.5% Convertible Senior Notes to issueClass B common shares, 10.5 million atDecember 30, 2007(4) . . . . . . . . . . . . . . . . 5,741 — —
Warrants to issue Class B common shares,10.5 million at December 30, 2007(4) . . . . . 5,741 — —
13,717 9,620 7,972
(1) Share and per share amounts have been adjusted from previously reported amounts to reflect a2-for-1 stock split issued in the form of a stock dividend effective October 3, 2007.
(2) Exercise prices exceed the average market price of the common shares or are anti-dilutive due tothe impact of the unrecognized compensation cost on the calculation of assumed proceeds in theapplication of the treasury stock method.
(3) All necessary conditions required to be satisfied have not been met.
(4) As discussed in Note 13, we issued $575 million of senior convertible notes in June 2007. Theimpact of a net share settlement of the conversion amount at maturity will begin to dilute earningsper share when our stock price reaches $54.76. The impact of stock that could be issued to settleshare obligations we could have under the warrants we issued simultaneously with the convertiblenotes issuance will begin to dilute earning per share when our stock price reaches $70.09. Thepotential receipt of MCBC stock from counterparties under our purchased call options when and ifour stock price is between $54.76 and $70.09 would be anti-dilutive and excluded from anycalculations of earnings per share.
109
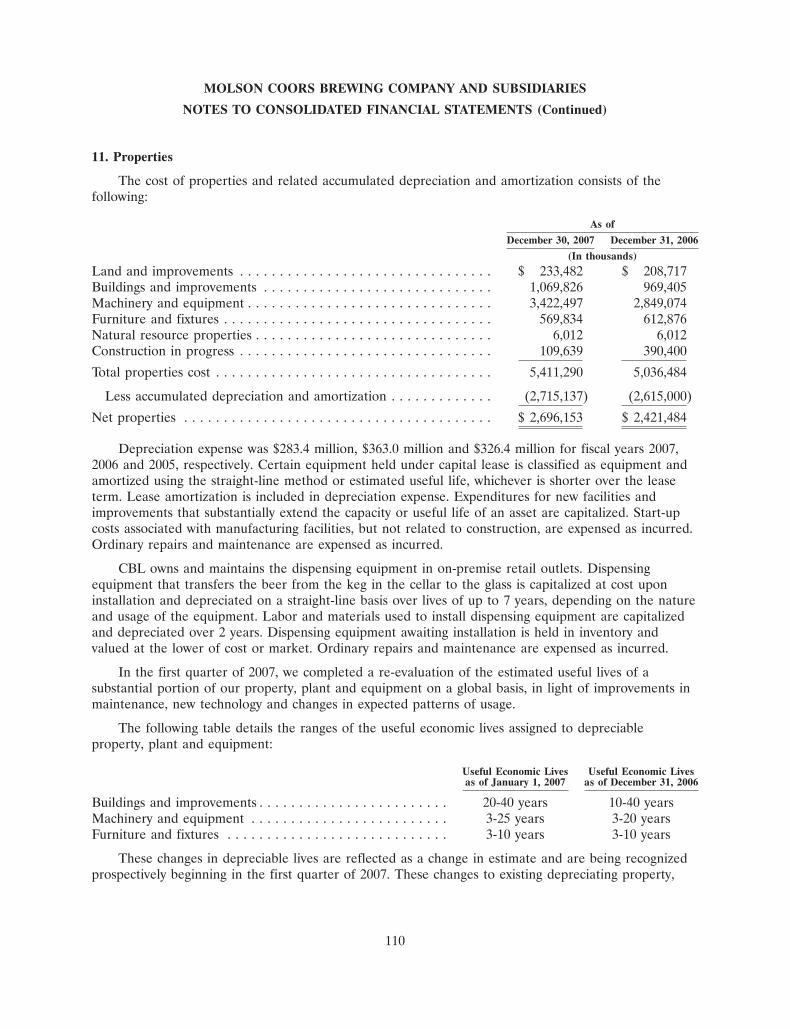
MOLSON COORS BREWING COMPANY AND SUBSIDIARIES
NOTES TO CONSOLIDATED FINANCIAL STATEMENTS (Continued)
11. Properties
The cost of properties and related accumulated depreciation and amortization consists of thefollowing:
As of
December 30, 2007 December 31, 2006
(In thousands)
Land and improvements . . . . . . . . . . . . . . . . . . . . . . . . . . . . . . . . $ 233,482 $ 208,717Buildings and improvements . . . . . . . . . . . . . . . . . . . . . . . . . . . . . 1,069,826 969,405Machinery and equipment . . . . . . . . . . . . . . . . . . . . . . . . . . . . . . . 3,422,497 2,849,074Furniture and fixtures . . . . . . . . . . . . . . . . . . . . . . . . . . . . . . . . . . 569,834 612,876Natural resource properties . . . . . . . . . . . . . . . . . . . . . . . . . . . . . . 6,012 6,012Construction in progress . . . . . . . . . . . . . . . . . . . . . . . . . . . . . . . . 109,639 390,400
Total properties cost . . . . . . . . . . . . . . . . . . . . . . . . . . . . . . . . . . . 5,411,290 5,036,484
Less accumulated depreciation and amortization . . . . . . . . . . . . . (2,715,137) (2,615,000)
Net properties . . . . . . . . . . . . . . . . . . . . . . . . . . . . . . . . . . . . . . . $ 2,696,153 $ 2,421,484
Depreciation expense was $283.4 million, $363.0 million and $326.4 million for fiscal years 2007,2006 and 2005, respectively. Certain equipment held under capital lease is classified as equipment andamortized using the straight-line method or estimated useful life, whichever is shorter over the leaseterm. Lease amortization is included in depreciation expense. Expenditures for new facilities andimprovements that substantially extend the capacity or useful life of an asset are capitalized. Start-upcosts associated with manufacturing facilities, but not related to construction, are expensed as incurred.Ordinary repairs and maintenance are expensed as incurred.
CBL owns and maintains the dispensing equipment in on-premise retail outlets. Dispensingequipment that transfers the beer from the keg in the cellar to the glass is capitalized at cost uponinstallation and depreciated on a straight-line basis over lives of up to 7 years, depending on the natureand usage of the equipment. Labor and materials used to install dispensing equipment are capitalizedand depreciated over 2 years. Dispensing equipment awaiting installation is held in inventory andvalued at the lower of cost or market. Ordinary repairs and maintenance are expensed as incurred.
In the first quarter of 2007, we completed a re-evaluation of the estimated useful lives of asubstantial portion of our property, plant and equipment on a global basis, in light of improvements inmaintenance, new technology and changes in expected patterns of usage.
The following table details the ranges of the useful economic lives assigned to depreciableproperty, plant and equipment:
Useful Economic Lives Useful Economic Livesas of January 1, 2007 as of December 31, 2006
Buildings and improvements . . . . . . . . . . . . . . . . . . . . . . . . 20-40 years 10-40 yearsMachinery and equipment . . . . . . . . . . . . . . . . . . . . . . . . . 3-25 years 3-20 yearsFurniture and fixtures . . . . . . . . . . . . . . . . . . . . . . . . . . . . 3-10 years 3-10 years
These changes in depreciable lives are reflected as a change in estimate and are being recognizedprospectively beginning in the first quarter of 2007. These changes to existing depreciating property,
110
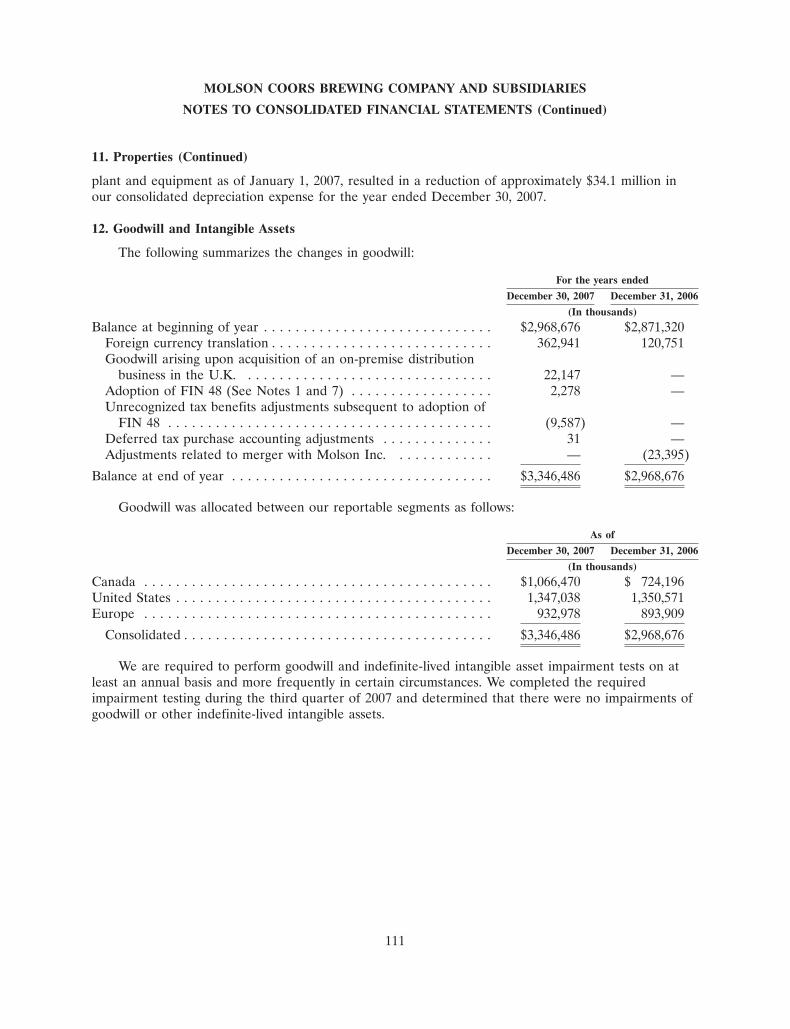
MOLSON COORS BREWING COMPANY AND SUBSIDIARIES
NOTES TO CONSOLIDATED FINANCIAL STATEMENTS (Continued)
11. Properties (Continued)
plant and equipment as of January 1, 2007, resulted in a reduction of approximately $34.1 million inour consolidated depreciation expense for the year ended December 30, 2007.
12. Goodwill and Intangible Assets
The following summarizes the changes in goodwill:
For the years ended
December 30, 2007 December 31, 2006
(In thousands)
Balance at beginning of year . . . . . . . . . . . . . . . . . . . . . . . . . . . . . $2,968,676 $2,871,320Foreign currency translation . . . . . . . . . . . . . . . . . . . . . . . . . . . . 362,941 120,751Goodwill arising upon acquisition of an on-premise distribution
business in the U.K. . . . . . . . . . . . . . . . . . . . . . . . . . . . . . . . 22,147 —Adoption of FIN 48 (See Notes 1 and 7) . . . . . . . . . . . . . . . . . . 2,278 —Unrecognized tax benefits adjustments subsequent to adoption of
FIN 48 . . . . . . . . . . . . . . . . . . . . . . . . . . . . . . . . . . . . . . . . . (9,587) —Deferred tax purchase accounting adjustments . . . . . . . . . . . . . . 31 —Adjustments related to merger with Molson Inc. . . . . . . . . . . . . — (23,395)
Balance at end of year . . . . . . . . . . . . . . . . . . . . . . . . . . . . . . . . . $3,346,486 $2,968,676
Goodwill was allocated between our reportable segments as follows:
As of
December 30, 2007 December 31, 2006
(In thousands)
Canada . . . . . . . . . . . . . . . . . . . . . . . . . . . . . . . . . . . . . . . . . . . . $1,066,470 $ 724,196United States . . . . . . . . . . . . . . . . . . . . . . . . . . . . . . . . . . . . . . . . 1,347,038 1,350,571Europe . . . . . . . . . . . . . . . . . . . . . . . . . . . . . . . . . . . . . . . . . . . . 932,978 893,909
Consolidated . . . . . . . . . . . . . . . . . . . . . . . . . . . . . . . . . . . . . . . $3,346,486 $2,968,676
We are required to perform goodwill and indefinite-lived intangible asset impairment tests on atleast an annual basis and more frequently in certain circumstances. We completed the requiredimpairment testing during the third quarter of 2007 and determined that there were no impairments ofgoodwill or other indefinite-lived intangible assets.
111
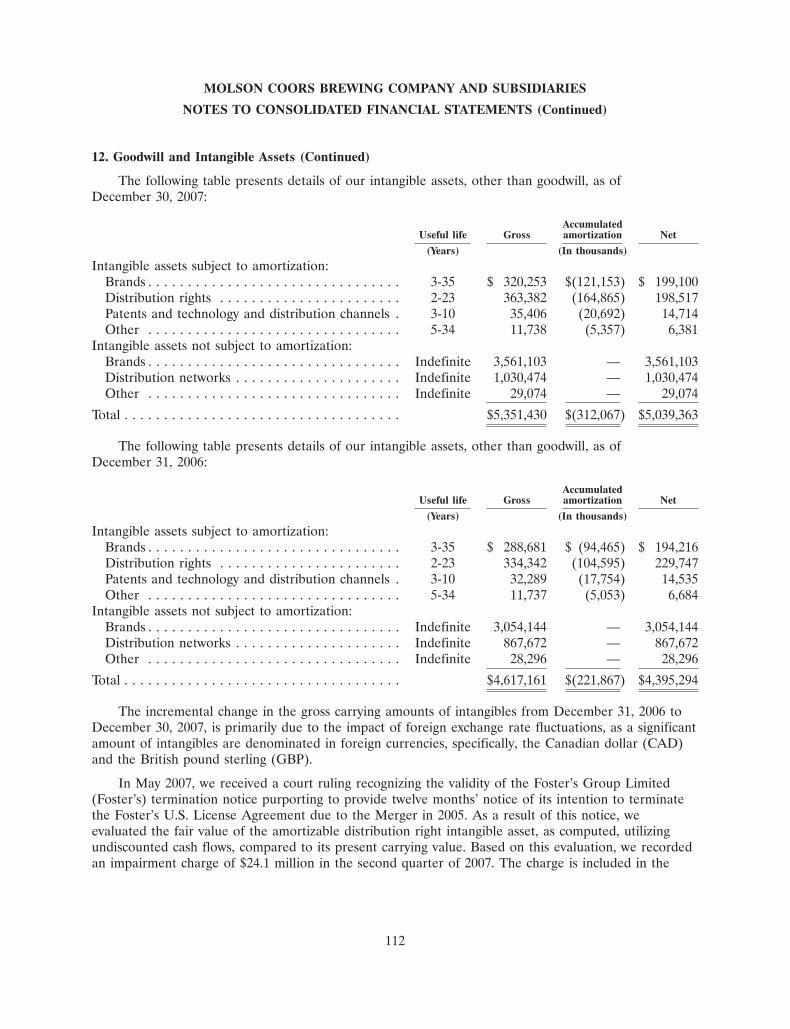
MOLSON COORS BREWING COMPANY AND SUBSIDIARIES
NOTES TO CONSOLIDATED FINANCIAL STATEMENTS (Continued)
12. Goodwill and Intangible Assets (Continued)
The following table presents details of our intangible assets, other than goodwill, as ofDecember 30, 2007:
AccumulatedUseful life Gross amortization Net
(Years) (In thousands)
Intangible assets subject to amortization:Brands . . . . . . . . . . . . . . . . . . . . . . . . . . . . . . . . 3-35 $ 320,253 $(121,153) $ 199,100Distribution rights . . . . . . . . . . . . . . . . . . . . . . . 2-23 363,382 (164,865) 198,517Patents and technology and distribution channels . 3-10 35,406 (20,692) 14,714Other . . . . . . . . . . . . . . . . . . . . . . . . . . . . . . . . 5-34 11,738 (5,357) 6,381
Intangible assets not subject to amortization:Brands . . . . . . . . . . . . . . . . . . . . . . . . . . . . . . . . Indefinite 3,561,103 — 3,561,103Distribution networks . . . . . . . . . . . . . . . . . . . . . Indefinite 1,030,474 — 1,030,474Other . . . . . . . . . . . . . . . . . . . . . . . . . . . . . . . . Indefinite 29,074 — 29,074
Total . . . . . . . . . . . . . . . . . . . . . . . . . . . . . . . . . . . $5,351,430 $(312,067) $5,039,363
The following table presents details of our intangible assets, other than goodwill, as ofDecember 31, 2006:
AccumulatedUseful life Gross amortization Net
(Years) (In thousands)
Intangible assets subject to amortization:Brands . . . . . . . . . . . . . . . . . . . . . . . . . . . . . . . . 3-35 $ 288,681 $ (94,465) $ 194,216Distribution rights . . . . . . . . . . . . . . . . . . . . . . . 2-23 334,342 (104,595) 229,747Patents and technology and distribution channels . 3-10 32,289 (17,754) 14,535Other . . . . . . . . . . . . . . . . . . . . . . . . . . . . . . . . 5-34 11,737 (5,053) 6,684
Intangible assets not subject to amortization:Brands . . . . . . . . . . . . . . . . . . . . . . . . . . . . . . . . Indefinite 3,054,144 — 3,054,144Distribution networks . . . . . . . . . . . . . . . . . . . . . Indefinite 867,672 — 867,672Other . . . . . . . . . . . . . . . . . . . . . . . . . . . . . . . . Indefinite 28,296 — 28,296
Total . . . . . . . . . . . . . . . . . . . . . . . . . . . . . . . . . . . $4,617,161 $(221,867) $4,395,294
The incremental change in the gross carrying amounts of intangibles from December 31, 2006 toDecember 30, 2007, is primarily due to the impact of foreign exchange rate fluctuations, as a significantamount of intangibles are denominated in foreign currencies, specifically, the Canadian dollar (CAD)and the British pound sterling (GBP).
In May 2007, we received a court ruling recognizing the validity of the Foster’s Group Limited(Foster’s) termination notice purporting to provide twelve months’ notice of its intention to terminatethe Foster’s U.S. License Agreement due to the Merger in 2005. As a result of this notice, weevaluated the fair value of the amortizable distribution right intangible asset, as computed, utilizingundiscounted cash flows, compared to its present carrying value. Based on this evaluation, we recordedan impairment charge of $24.1 million in the second quarter of 2007. The charge is included in the
112
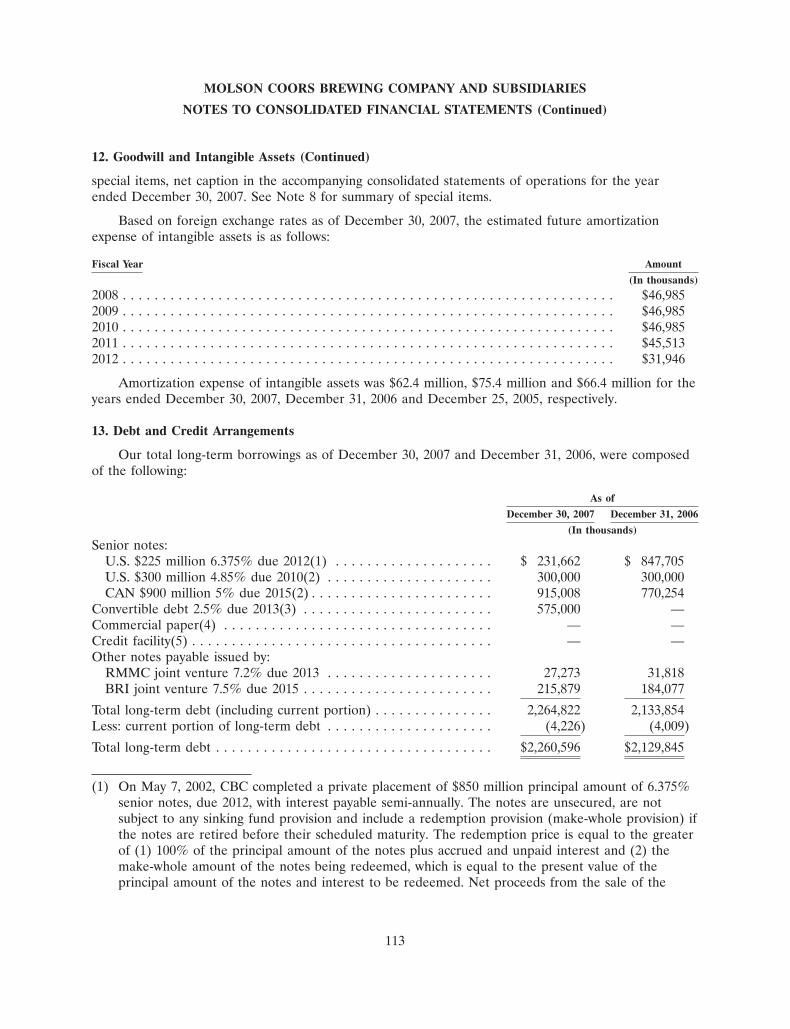
MOLSON COORS BREWING COMPANY AND SUBSIDIARIES
NOTES TO CONSOLIDATED FINANCIAL STATEMENTS (Continued)
12. Goodwill and Intangible Assets (Continued)
special items, net caption in the accompanying consolidated statements of operations for the yearended December 30, 2007. See Note 8 for summary of special items.
Based on foreign exchange rates as of December 30, 2007, the estimated future amortizationexpense of intangible assets is as follows:
Fiscal Year Amount
(In thousands)
2008 . . . . . . . . . . . . . . . . . . . . . . . . . . . . . . . . . . . . . . . . . . . . . . . . . . . . . . . . . . . . . . $46,9852009 . . . . . . . . . . . . . . . . . . . . . . . . . . . . . . . . . . . . . . . . . . . . . . . . . . . . . . . . . . . . . . $46,9852010 . . . . . . . . . . . . . . . . . . . . . . . . . . . . . . . . . . . . . . . . . . . . . . . . . . . . . . . . . . . . . . $46,9852011 . . . . . . . . . . . . . . . . . . . . . . . . . . . . . . . . . . . . . . . . . . . . . . . . . . . . . . . . . . . . . . $45,5132012 . . . . . . . . . . . . . . . . . . . . . . . . . . . . . . . . . . . . . . . . . . . . . . . . . . . . . . . . . . . . . . $31,946
Amortization expense of intangible assets was $62.4 million, $75.4 million and $66.4 million for theyears ended December 30, 2007, December 31, 2006 and December 25, 2005, respectively.
13. Debt and Credit Arrangements
Our total long-term borrowings as of December 30, 2007 and December 31, 2006, were composedof the following:
As of
December 30, 2007 December 31, 2006
(In thousands)
Senior notes:U.S. $225 million 6.375% due 2012(1) . . . . . . . . . . . . . . . . . . . . $ 231,662 $ 847,705U.S. $300 million 4.85% due 2010(2) . . . . . . . . . . . . . . . . . . . . . 300,000 300,000CAN $900 million 5% due 2015(2) . . . . . . . . . . . . . . . . . . . . . . . 915,008 770,254
Convertible debt 2.5% due 2013(3) . . . . . . . . . . . . . . . . . . . . . . . . 575,000 —Commercial paper(4) . . . . . . . . . . . . . . . . . . . . . . . . . . . . . . . . . . — —Credit facility(5) . . . . . . . . . . . . . . . . . . . . . . . . . . . . . . . . . . . . . . — —Other notes payable issued by:
RMMC joint venture 7.2% due 2013 . . . . . . . . . . . . . . . . . . . . . 27,273 31,818BRI joint venture 7.5% due 2015 . . . . . . . . . . . . . . . . . . . . . . . . 215,879 184,077
Total long-term debt (including current portion) . . . . . . . . . . . . . . . 2,264,822 2,133,854Less: current portion of long-term debt . . . . . . . . . . . . . . . . . . . . . (4,226) (4,009)
Total long-term debt . . . . . . . . . . . . . . . . . . . . . . . . . . . . . . . . . . . $2,260,596 $2,129,845
(1) On May 7, 2002, CBC completed a private placement of $850 million principal amount of 6.375%senior notes, due 2012, with interest payable semi-annually. The notes are unsecured, are notsubject to any sinking fund provision and include a redemption provision (make-whole provision) ifthe notes are retired before their scheduled maturity. The redemption price is equal to the greaterof (1) 100% of the principal amount of the notes plus accrued and unpaid interest and (2) themake-whole amount of the notes being redeemed, which is equal to the present value of theprincipal amount of the notes and interest to be redeemed. Net proceeds from the sale of the
113
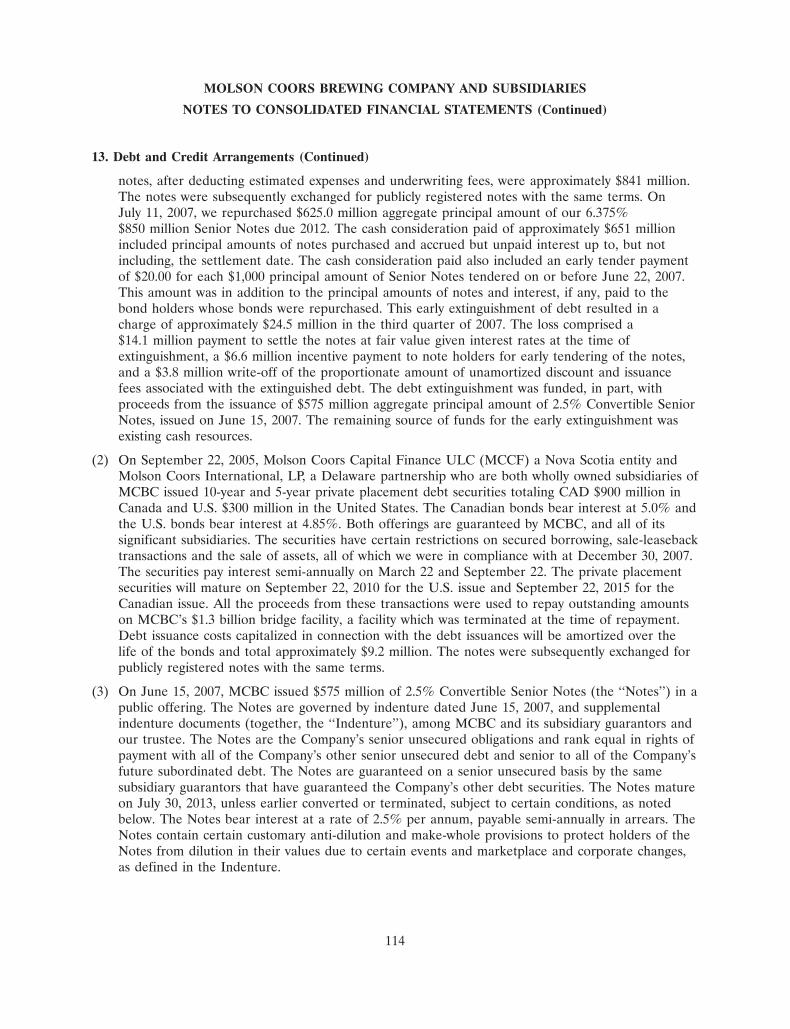
MOLSON COORS BREWING COMPANY AND SUBSIDIARIES
NOTES TO CONSOLIDATED FINANCIAL STATEMENTS (Continued)
13. Debt and Credit Arrangements (Continued)
notes, after deducting estimated expenses and underwriting fees, were approximately $841 million.The notes were subsequently exchanged for publicly registered notes with the same terms. OnJuly 11, 2007, we repurchased $625.0 million aggregate principal amount of our 6.375%$850 million Senior Notes due 2012. The cash consideration paid of approximately $651 millionincluded principal amounts of notes purchased and accrued but unpaid interest up to, but notincluding, the settlement date. The cash consideration paid also included an early tender paymentof $20.00 for each $1,000 principal amount of Senior Notes tendered on or before June 22, 2007.This amount was in addition to the principal amounts of notes and interest, if any, paid to thebond holders whose bonds were repurchased. This early extinguishment of debt resulted in acharge of approximately $24.5 million in the third quarter of 2007. The loss comprised a$14.1 million payment to settle the notes at fair value given interest rates at the time ofextinguishment, a $6.6 million incentive payment to note holders for early tendering of the notes,and a $3.8 million write-off of the proportionate amount of unamortized discount and issuancefees associated with the extinguished debt. The debt extinguishment was funded, in part, withproceeds from the issuance of $575 million aggregate principal amount of 2.5% Convertible SeniorNotes, issued on June 15, 2007. The remaining source of funds for the early extinguishment wasexisting cash resources.
(2) On September 22, 2005, Molson Coors Capital Finance ULC (MCCF) a Nova Scotia entity andMolson Coors International, LP, a Delaware partnership who are both wholly owned subsidiaries ofMCBC issued 10-year and 5-year private placement debt securities totaling CAD $900 million inCanada and U.S. $300 million in the United States. The Canadian bonds bear interest at 5.0% andthe U.S. bonds bear interest at 4.85%. Both offerings are guaranteed by MCBC, and all of itssignificant subsidiaries. The securities have certain restrictions on secured borrowing, sale-leasebacktransactions and the sale of assets, all of which we were in compliance with at December 30, 2007.The securities pay interest semi-annually on March 22 and September 22. The private placementsecurities will mature on September 22, 2010 for the U.S. issue and September 22, 2015 for theCanadian issue. All the proceeds from these transactions were used to repay outstanding amountson MCBC’s $1.3 billion bridge facility, a facility which was terminated at the time of repayment.Debt issuance costs capitalized in connection with the debt issuances will be amortized over thelife of the bonds and total approximately $9.2 million. The notes were subsequently exchanged forpublicly registered notes with the same terms.
(3) On June 15, 2007, MCBC issued $575 million of 2.5% Convertible Senior Notes (the ‘‘Notes’’) in apublic offering. The Notes are governed by indenture dated June 15, 2007, and supplementalindenture documents (together, the ‘‘Indenture’’), among MCBC and its subsidiary guarantors andour trustee. The Notes are the Company’s senior unsecured obligations and rank equal in rights ofpayment with all of the Company’s other senior unsecured debt and senior to all of the Company’sfuture subordinated debt. The Notes are guaranteed on a senior unsecured basis by the samesubsidiary guarantors that have guaranteed the Company’s other debt securities. The Notes matureon July 30, 2013, unless earlier converted or terminated, subject to certain conditions, as notedbelow. The Notes bear interest at a rate of 2.5% per annum, payable semi-annually in arrears. TheNotes contain certain customary anti-dilution and make-whole provisions to protect holders of theNotes from dilution in their values due to certain events and marketplace and corporate changes,as defined in the Indenture.
114
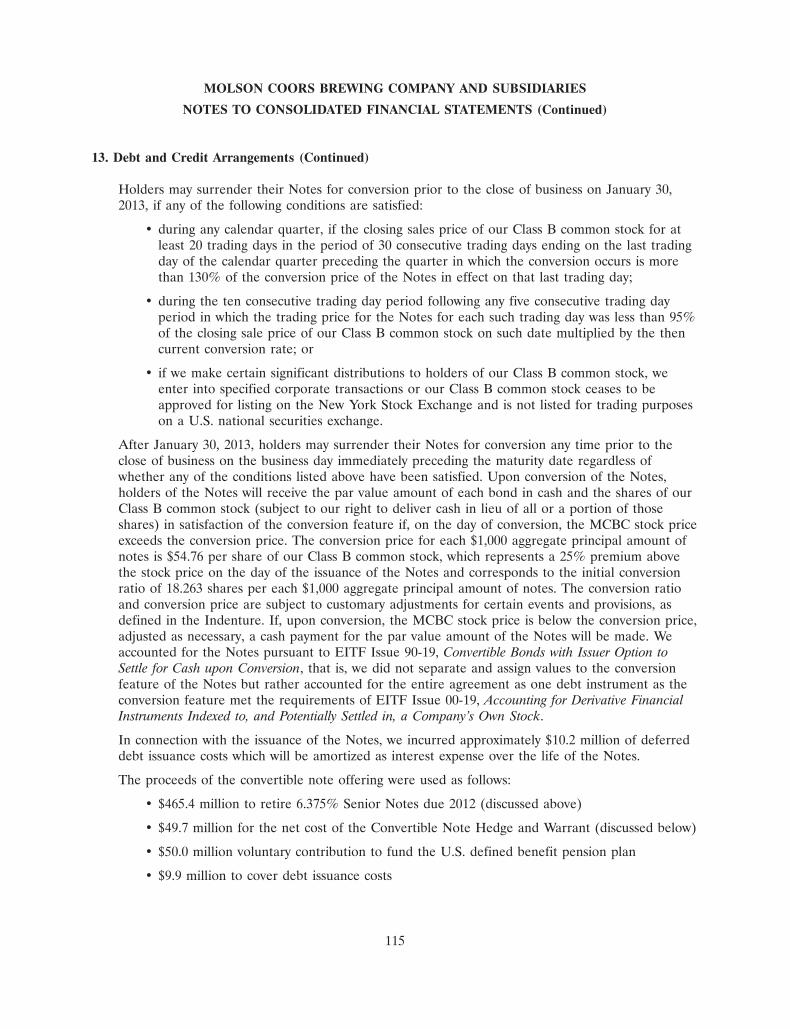
MOLSON COORS BREWING COMPANY AND SUBSIDIARIES
NOTES TO CONSOLIDATED FINANCIAL STATEMENTS (Continued)
13. Debt and Credit Arrangements (Continued)
Holders may surrender their Notes for conversion prior to the close of business on January 30,2013, if any of the following conditions are satisfied:
• during any calendar quarter, if the closing sales price of our Class B common stock for atleast 20 trading days in the period of 30 consecutive trading days ending on the last tradingday of the calendar quarter preceding the quarter in which the conversion occurs is morethan 130% of the conversion price of the Notes in effect on that last trading day;
• during the ten consecutive trading day period following any five consecutive trading dayperiod in which the trading price for the Notes for each such trading day was less than 95%of the closing sale price of our Class B common stock on such date multiplied by the thencurrent conversion rate; or
• if we make certain significant distributions to holders of our Class B common stock, weenter into specified corporate transactions or our Class B common stock ceases to beapproved for listing on the New York Stock Exchange and is not listed for trading purposeson a U.S. national securities exchange.
After January 30, 2013, holders may surrender their Notes for conversion any time prior to theclose of business on the business day immediately preceding the maturity date regardless ofwhether any of the conditions listed above have been satisfied. Upon conversion of the Notes,holders of the Notes will receive the par value amount of each bond in cash and the shares of ourClass B common stock (subject to our right to deliver cash in lieu of all or a portion of thoseshares) in satisfaction of the conversion feature if, on the day of conversion, the MCBC stock priceexceeds the conversion price. The conversion price for each $1,000 aggregate principal amount ofnotes is $54.76 per share of our Class B common stock, which represents a 25% premium abovethe stock price on the day of the issuance of the Notes and corresponds to the initial conversionratio of 18.263 shares per each $1,000 aggregate principal amount of notes. The conversion ratioand conversion price are subject to customary adjustments for certain events and provisions, asdefined in the Indenture. If, upon conversion, the MCBC stock price is below the conversion price,adjusted as necessary, a cash payment for the par value amount of the Notes will be made. Weaccounted for the Notes pursuant to EITF Issue 90-19, Convertible Bonds with Issuer Option toSettle for Cash upon Conversion, that is, we did not separate and assign values to the conversionfeature of the Notes but rather accounted for the entire agreement as one debt instrument as theconversion feature met the requirements of EITF Issue 00-19, Accounting for Derivative FinancialInstruments Indexed to, and Potentially Settled in, a Company’s Own Stock.
In connection with the issuance of the Notes, we incurred approximately $10.2 million of deferreddebt issuance costs which will be amortized as interest expense over the life of the Notes.
The proceeds of the convertible note offering were used as follows:
• $465.4 million to retire 6.375% Senior Notes due 2012 (discussed above)
• $49.7 million for the net cost of the Convertible Note Hedge and Warrant (discussed below)
• $50.0 million voluntary contribution to fund the U.S. defined benefit pension plan
• $9.9 million to cover debt issuance costs
115
MOLSON COORS BREWING COMPANY AND SUBSIDIARIES
NOTES TO CONSOLIDATED FINANCIAL STATEMENTS (Continued)
13. Debt and Credit Arrangements (Continued)
Convertible Note Hedge and Warrants:
In connection with the issuance of the Notes, we entered into a privately-negotiated convertiblenote hedge transaction. The convertible note hedge (the ‘‘purchased call options’’) will cover up toapproximately 10.5 million shares of our Class B common stock. The purchased call options, ifexercised by us, require the counterparty to deliver to us shares of MCBC Class B common stockadequate to meet our net share settlement obligations under the convertible notes and areexpected to reduce the potential dilution to our Class B common stock to be issued uponconversion of the Notes, if any. Separately and concurrently, we also entered into warranttransactions with respect to our Class B common stock pursuant to which we may be required toissue to the counterparty up to approximately 10.5 million shares of our Class B common stock.The warrant price is $70.09 which represents a 60% premium above the stock price on the date ofthe warrant transaction. The warrants expire on February 20, 2014.
We used approximately $50 million of the net proceeds from the issuance of the 2.5% ConvertibleSenior Notes, to pay for the cost to us of the purchased call options, partially offset by theproceeds to us from the warrant transaction. The net cost of these transactions, net of tax, wasrecorded in the Stockholder’s Equity section of the balance sheet as of December 30, 2007.
The purchased call options and warrants are separate transactions entered into by the Company,and they are not part of the terms of the Notes and do not affect the holders’ rights under theNotes.
(4) We maintain a $500 million commercial paper program and as of December 30, 2007, there wereno outstanding borrowings under this program. Also, December 30, 2007 there were nooutstanding borrowings on our total $750 million unsecured committed credit arrangement. Thisfacility is used as a backstop for our commercial paper program [see (5) below]. This credit facilityhas a five-year term expiring 2011.
(5) In March 2005, we entered into a $1.4 billion revolving multicurrency bank credit facility. Amountsdrawn against the credit facility accrue interest at variable rates, which are based upon LIBOR orCDOR, plus a spread based upon Molson Coors’ long-term bond rating and facility utilization. InAugust 2006, the amount of the credit line was reduced to $750 million and the expiration datewas extended to August 2011. There were no outstanding borrowings on this credit facility as ofDecember 30, 2007.
116
MOLSON COORS BREWING COMPANY AND SUBSIDIARIES
NOTES TO CONSOLIDATED FINANCIAL STATEMENTS (Continued)
13. Debt and Credit Arrangements (Continued)
Our total short-term borrowings consist of various uncommitted lines of credits, short-term bankloans, and overdraft facilities as summarized below:
As of
December 30, 2007 December 31, 2006
(In thousands)
U.S. lines of creditThree lines totaling $50 millionInterest rates at 5.90% . . . . . . . . . . . . . . . . . . . . . . . . . . . . . . . $ — $ —
Canadian bank overdraft facilitiesTwo lines totaling $40 million ($27 million)Interest rates at U.S. Prime and Cdn Prime . . . . . . . . . . . . . . . . — 180
British Pound lines of credit and bank overdraft facilityThree lines totaling £30 million ($57 million)Interest rates at 6.60% . . . . . . . . . . . . . . . . . . . . . . . . . . . . . . . — 59
Japanese Yen lines of creditTwo lines totaling 1.1 billion Yen ($9 million)Interest rates at <1.00% . . . . . . . . . . . . . . . . . . . . . . . . . . . . . . 55 193
Total short-term borrowings . . . . . . . . . . . . . . . . . . . . . . . . . . . . . . $ 55 $432
As of December 30, 2007, the aggregate principal debt maturities of long-term debt and short-termborrowings for the next five fiscal years are as follows:
Amount
(In thousands)
2008 . . . . . . . . . . . . . . . . . . . . . . . . . . . . . . . . . . . . . . . . . . . . . . . . . . . . . . . . . . . . . . $ 4,2812009 . . . . . . . . . . . . . . . . . . . . . . . . . . . . . . . . . . . . . . . . . . . . . . . . . . . . . . . . . . . . . . 4,2262010 . . . . . . . . . . . . . . . . . . . . . . . . . . . . . . . . . . . . . . . . . . . . . . . . . . . . . . . . . . . . . . 304,2262011 . . . . . . . . . . . . . . . . . . . . . . . . . . . . . . . . . . . . . . . . . . . . . . . . . . . . . . . . . . . . . . 220,1062012 . . . . . . . . . . . . . . . . . . . . . . . . . . . . . . . . . . . . . . . . . . . . . . . . . . . . . . . . . . . . . . 236,346Thereafter . . . . . . . . . . . . . . . . . . . . . . . . . . . . . . . . . . . . . . . . . . . . . . . . . . . . . . . . . 1,495,692
Total . . . . . . . . . . . . . . . . . . . . . . . . . . . . . . . . . . . . . . . . . . . . . . . . . . . . . . . . . . . . $2,264,877
Under the terms of some of our debt facilities, we must comply with certain restrictions. Theserestrictions include restrictions on debt secured by certain types of mortgages, certain thresholdpercentages of secured consolidated net tangible assets, and restrictions on certain types of salelease-back transactions. As of December 30, 2007, we were in compliance with all of these restrictions.
117
MOLSON COORS BREWING COMPANY AND SUBSIDIARIES
NOTES TO CONSOLIDATED FINANCIAL STATEMENTS (Continued)
13. Debt and Credit Arrangements (Continued)
Interest
Interest incurred, capitalized and expensed were as follows:
For the years ended
December 30, 2007 December 31, 2006 December 25, 2005
(In thousands)
Interest incurred . . . . . . . . . . . . . . . . . . . . . . . . . $135,952 $156,793 $137,601Interest capitalized . . . . . . . . . . . . . . . . . . . . . . . (9,490) (13,723) (6,495)
Interest expensed . . . . . . . . . . . . . . . . . . . . . . . . $126,462 $143,070 $131,106
14. Share-Based Payments
In the first quarter of 2006, we adopted the Financial Accounting Standards Board StatementNo. 123, ‘‘Share-Based Payment’’ (‘‘SFAS 123R’’). The Company adopted SFAS 123R using themodified prospective method of adoption, which does not require restatement of prior periods.
SFAS 123R requires a determination of excess tax benefits available to absorb related share—based compensation. FASB Staff Position 123R-3, Transition Election Related to Accounting for the TaxEffects of Share-Based Payment Awards (‘‘FSP 123R-3’’), which was issued on November 10, 2005,provides a practical transition election related to accounting for the tax effects of share-based paymentawards to employees. Specifically, this FSP allows a company to elect the alternative or simplifiedmethod to calculate the opening excess tax benefits balance. We adopted such alternative methodprovisions to calculate the beginning balance of the excess tax benefit in the financial statements endedDecember 31, 2006. Under the new standard, excess income tax benefits, if any, from share-basedcompensation are presented as financing activities rather than operating activities in the statements ofcash flows. This adoption did not have any impact on our financial statements.
At December 30, 2007, we had three stock-based compensation plans.
The 1990 Equity Incentive Plan
The 1990 Equity Incentive Plan (‘‘EI Plan’’) generally provides for two types of grants for ouremployees: stock options and restricted stock awards. The stock options have a term of 10 years andone-third of the stock option award vests in each of the three successive years after the date of grant.There were no awards granted under the Company’s EI Plan in 2007, and we are not expecting togrant any new awards under this plan.
Equity Compensation Plan for Non-Employee Directors
The Equity Compensation Plan for Non-Employee Directors (‘‘EC Plan’’) provides for awards ofthe Company’s Class B shares of restricted stock or options for Class B shares. Awards vest aftercompletion of the director’s annual term. The compensation cost associated with the EC plan isamortized over the directors’ term. There were no awards granted under the Company’s EC Plan in2007, and we are not expecting to grant any new awards under this plan.
118
MOLSON COORS BREWING COMPANY AND SUBSIDIARIES
NOTES TO CONSOLIDATED FINANCIAL STATEMENTS (Continued)
14. Share-Based Payments (Continued)
Molson Coors Brewing Company Incentive Compensation Plan
During 2007 and 2006, we issued the following awards related to Class B common shares tocertain directors, officers, and other eligible employees, pursuant to the Molson Coors BrewingCompany Incentive Compensation Plan (‘‘MCBC IC Plan’’): stock options (‘‘options’’), stock-only stockappreciation rights (‘‘SOSAR’’), restricted stock units (‘‘RSU’’), deferred stock units (‘‘DSU’’),performance shares (‘‘PSU’’), and limited stock appreciation rights (‘‘LOSAR’’).
Options are granted with an exercise price equal to the market value of a share of common stockon the date of grant. Stock options have a term of 10 years and generally vest over three years. Nooptions were granted in 2007.
SOSARs were granted for the first time in the fifty-two weeks ended December 30, 2007. SOSARswere granted with an exercise price equal to the market value of a share of common stock on the dateof grant. The SOSARs entitle the award recipient to receive shares of the Company’s stock with a fairmarket value equal to the excess of the trading price over the exercise price of such shares on the dateof the exercise. SOSARs have a term of ten years and generally vest over three years. During thefifty-two weeks ended December 30, 2007, we granted 957,646 SOSARs with a weighted-average fairmarket value of $13.23 each.
RSU awards are issued at the market value equal to the price of our stock at the date of the grantand vest over the period of three years. In 2007, we granted 256,408 RSUs with a weighted-averagemarket value of $46.24 each. In 2006, we granted 364,220 RSUs with a weighted-average marketedvalue of $34.35 each.
DSU awards, under the Directors’ Stock Plan pursuant to the MCBC IC Plan, are elected by thenon-employee directors of Molson Coors Brewing Company by enabling them to receive all or one-halfof their annual cash retainer payments in our stock. The deferred stock unit awards are issued at themarket value equal to the average day’s price on the date of the grant and generally vest over theannual service period. In 2007, we granted 9,746 DSUs with the weighted-average market value of$48.66 each. In 2006, we granted 5,962 DSUs with the weighted-average market value of $36.20 each.
PSU awards are earned over the estimated expected term to achieve projected financial targetsestablished at the time of the grant. As of December 30, 2007, these financial targets were expected tobe achieved by the end of our first half of fiscal year 2009 at which point these shares will fully vest.The estimated date of achievement of these financial targets could be accelerated in to 2008 as ourplans are refined and financial results become available. Performance shares are granted at the marketvalue of our stock at the date of the grant and have a term of five years. In 2007, 176,081 shares weregranted under this plan at the weighted-average market value of $44.31 per share. In 2006, we granted2,147,676 PSUs with the weighted-average market value of $34.55 each.
LOSARs entitle the employee to receive shares of MCBC Class B common shares with a fairmarket value equal to the excess of the trading price of such shares on the date of the exercise, but notto exceed a pre-determined ceiling, and the trading price on the date of the grant. No LOSARs weregranted in 2007.
As of December 30, 2007, there were 2,562,144 shares of the Company’s stock available for theissuance of the options, SOSAR, RSU, DSU, PSU, and LOSAR awards under the MCBC IC Plan.
119
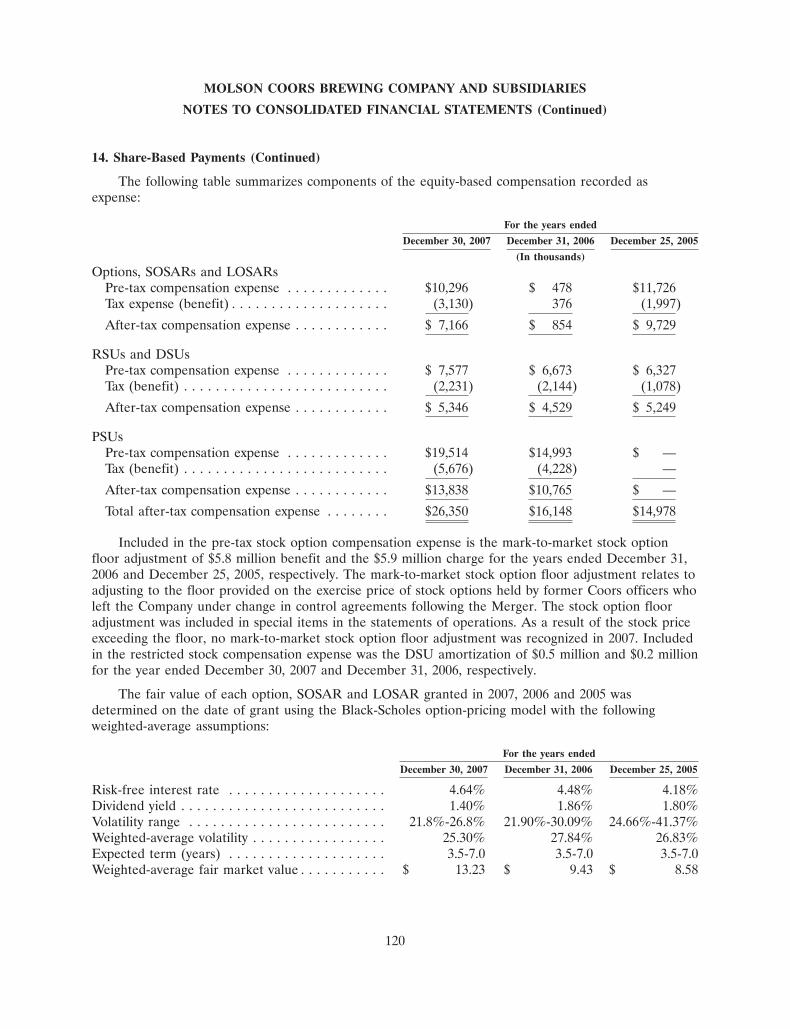
MOLSON COORS BREWING COMPANY AND SUBSIDIARIES
NOTES TO CONSOLIDATED FINANCIAL STATEMENTS (Continued)
14. Share-Based Payments (Continued)
The following table summarizes components of the equity-based compensation recorded asexpense:
For the years ended
December 30, 2007 December 31, 2006 December 25, 2005
(In thousands)
Options, SOSARs and LOSARsPre-tax compensation expense . . . . . . . . . . . . . $10,296 $ 478 $11,726Tax expense (benefit) . . . . . . . . . . . . . . . . . . . . (3,130) 376 (1,997)
After-tax compensation expense . . . . . . . . . . . . $ 7,166 $ 854 $ 9,729
RSUs and DSUsPre-tax compensation expense . . . . . . . . . . . . . $ 7,577 $ 6,673 $ 6,327Tax (benefit) . . . . . . . . . . . . . . . . . . . . . . . . . . (2,231) (2,144) (1,078)
After-tax compensation expense . . . . . . . . . . . . $ 5,346 $ 4,529 $ 5,249
PSUsPre-tax compensation expense . . . . . . . . . . . . . $19,514 $14,993 $ —Tax (benefit) . . . . . . . . . . . . . . . . . . . . . . . . . . (5,676) (4,228) —
After-tax compensation expense . . . . . . . . . . . . $13,838 $10,765 $ —
Total after-tax compensation expense . . . . . . . . $26,350 $16,148 $14,978
Included in the pre-tax stock option compensation expense is the mark-to-market stock optionfloor adjustment of $5.8 million benefit and the $5.9 million charge for the years ended December 31,2006 and December 25, 2005, respectively. The mark-to-market stock option floor adjustment relates toadjusting to the floor provided on the exercise price of stock options held by former Coors officers wholeft the Company under change in control agreements following the Merger. The stock option flooradjustment was included in special items in the statements of operations. As a result of the stock priceexceeding the floor, no mark-to-market stock option floor adjustment was recognized in 2007. Includedin the restricted stock compensation expense was the DSU amortization of $0.5 million and $0.2 millionfor the year ended December 30, 2007 and December 31, 2006, respectively.
The fair value of each option, SOSAR and LOSAR granted in 2007, 2006 and 2005 wasdetermined on the date of grant using the Black-Scholes option-pricing model with the followingweighted-average assumptions:
For the years ended
December 30, 2007 December 31, 2006 December 25, 2005
Risk-free interest rate . . . . . . . . . . . . . . . . . . . . 4.64% 4.48% 4.18%Dividend yield . . . . . . . . . . . . . . . . . . . . . . . . . . 1.40% 1.86% 1.80%Volatility range . . . . . . . . . . . . . . . . . . . . . . . . . 21.8%-26.8% 21.90%-30.09% 24.66%-41.37%Weighted-average volatility . . . . . . . . . . . . . . . . . 25.30% 27.84% 26.83%Expected term (years) . . . . . . . . . . . . . . . . . . . . 3.5-7.0 3.5-7.0 3.5-7.0Weighted-average fair market value . . . . . . . . . . . $ 13.23 $ 9.43 $ 8.58
120
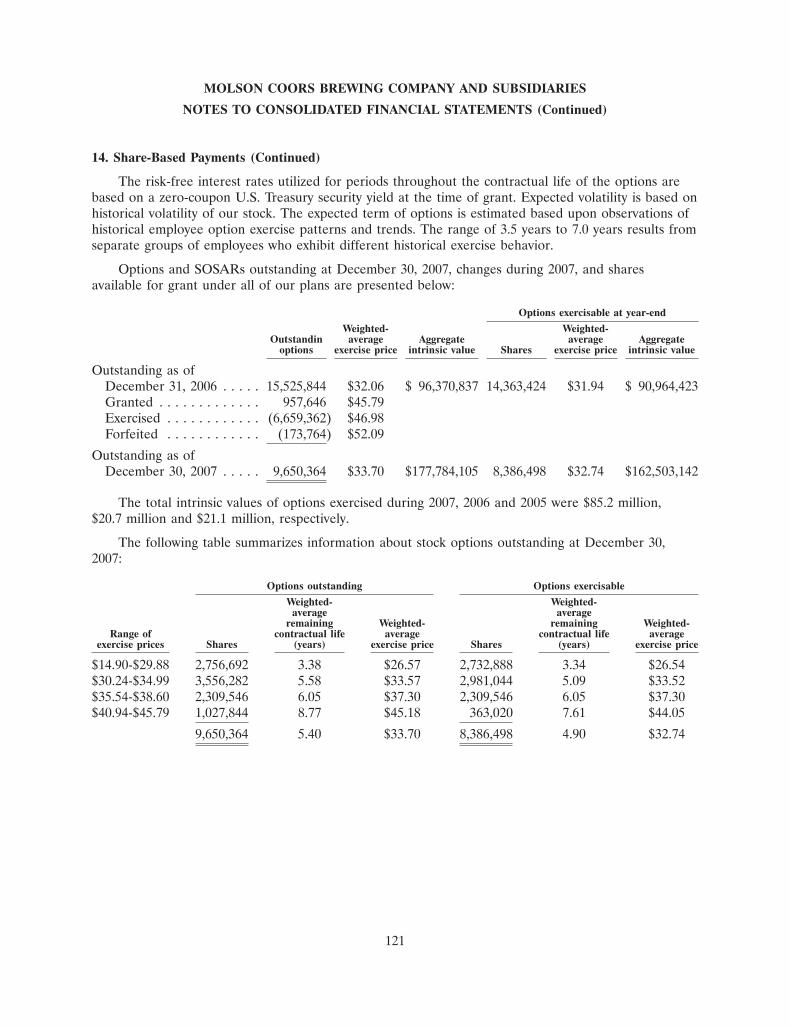
MOLSON COORS BREWING COMPANY AND SUBSIDIARIES
NOTES TO CONSOLIDATED FINANCIAL STATEMENTS (Continued)
14. Share-Based Payments (Continued)
The risk-free interest rates utilized for periods throughout the contractual life of the options arebased on a zero-coupon U.S. Treasury security yield at the time of grant. Expected volatility is based onhistorical volatility of our stock. The expected term of options is estimated based upon observations ofhistorical employee option exercise patterns and trends. The range of 3.5 years to 7.0 years results fromseparate groups of employees who exhibit different historical exercise behavior.
Options and SOSARs outstanding at December 30, 2007, changes during 2007, and sharesavailable for grant under all of our plans are presented below:
Options exercisable at year-end
Weighted- Weighted-Outstandin average Aggregate average Aggregate
options exercise price intrinsic value Shares exercise price intrinsic value
Outstanding as ofDecember 31, 2006 . . . . . 15,525,844 $32.06 $ 96,370,837 14,363,424 $31.94 $ 90,964,423Granted . . . . . . . . . . . . . 957,646 $45.79Exercised . . . . . . . . . . . . (6,659,362) $46.98Forfeited . . . . . . . . . . . . (173,764) $52.09
Outstanding as ofDecember 30, 2007 . . . . . 9,650,364 $33.70 $177,784,105 8,386,498 $32.74 $162,503,142
The total intrinsic values of options exercised during 2007, 2006 and 2005 were $85.2 million,$20.7 million and $21.1 million, respectively.
The following table summarizes information about stock options outstanding at December 30,2007:
Options outstanding Options exercisable
Weighted- Weighted-average average
remaining Weighted- remaining Weighted-Range of contractual life average contractual life average
exercise prices Shares (years) exercise price Shares (years) exercise price
$14.90-$29.88 2,756,692 3.38 $26.57 2,732,888 3.34 $26.54$30.24-$34.99 3,556,282 5.58 $33.57 2,981,044 5.09 $33.52$35.54-$38.60 2,309,546 6.05 $37.30 2,309,546 6.05 $37.30$40.94-$45.79 1,027,844 8.77 $45.18 363,020 7.61 $44.05
9,650,364 5.40 $33.70 8,386,498 4.90 $32.74
121

MOLSON COORS BREWING COMPANY AND SUBSIDIARIES
NOTES TO CONSOLIDATED FINANCIAL STATEMENTS (Continued)
14. Share-Based Payments (Continued)
The summary of activity of unvested restricted stock units, deferred stock units and performanceshares during 2007 is presented below:
Weighted-averageShares grant date fair value
Non-vested as of December 31, 2006 . . . . . . . . . . . . . . . . . . . . . . . . . . 2,620,480 $34.24Granted . . . . . . . . . . . . . . . . . . . . . . . . . . . . . . . . . . . . . . . . . . . . . 442,235 $45.53Vested . . . . . . . . . . . . . . . . . . . . . . . . . . . . . . . . . . . . . . . . . . . . . . . (91,494) $33.36Forfeited . . . . . . . . . . . . . . . . . . . . . . . . . . . . . . . . . . . . . . . . . . . . . (253,131) $35.56
Non-vested as of December 30, 2007 . . . . . . . . . . . . . . . . . . . . . . . . . . 2,718,090 $35.98
The total fair values of restricted stock units and deferred stock units vested during 2007, 2006 and2005 were $3.4 million, $2.4 million and $8.9 million, respectively. As of December 30, 2007, there was$59 million of total unrecognized compensation cost from all share-based compensation arrangementsgranted under the plans, related to unvested shares. This compensation is expected to be recognizedover a weighted-average period of approximately 1.7 years. During 2007, cash received from stockoptions exercises was $209 million and the total tax benefit to be realized for the tax deductions fromthese option exercises was $29.8 million.
122
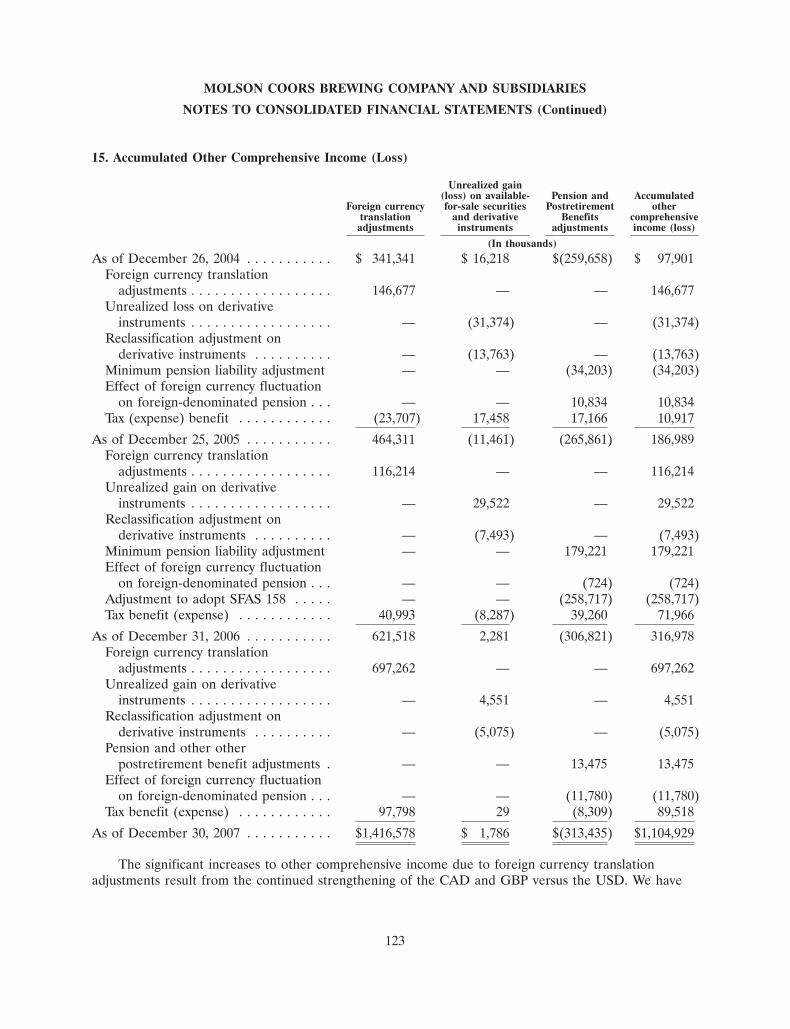
MOLSON COORS BREWING COMPANY AND SUBSIDIARIES
NOTES TO CONSOLIDATED FINANCIAL STATEMENTS (Continued)
15. Accumulated Other Comprehensive Income (Loss)
Unrealized gain(loss) on available- Pension and Accumulated
Foreign currency for-sale securities Postretirement othertranslation and derivative Benefits comprehensive
adjustments instruments adjustments income (loss)
(In thousands)
As of December 26, 2004 . . . . . . . . . . . $ 341,341 $ 16,218 $(259,658) $ 97,901Foreign currency translation
adjustments . . . . . . . . . . . . . . . . . . 146,677 — — 146,677Unrealized loss on derivative
instruments . . . . . . . . . . . . . . . . . . — (31,374) — (31,374)Reclassification adjustment on
derivative instruments . . . . . . . . . . — (13,763) — (13,763)Minimum pension liability adjustment — — (34,203) (34,203)Effect of foreign currency fluctuation
on foreign-denominated pension . . . — — 10,834 10,834Tax (expense) benefit . . . . . . . . . . . . (23,707) 17,458 17,166 10,917
As of December 25, 2005 . . . . . . . . . . . 464,311 (11,461) (265,861) 186,989Foreign currency translation
adjustments . . . . . . . . . . . . . . . . . . 116,214 — — 116,214Unrealized gain on derivative
instruments . . . . . . . . . . . . . . . . . . — 29,522 — 29,522Reclassification adjustment on
derivative instruments . . . . . . . . . . — (7,493) — (7,493)Minimum pension liability adjustment — — 179,221 179,221Effect of foreign currency fluctuation
on foreign-denominated pension . . . — — (724) (724)Adjustment to adopt SFAS 158 . . . . . — — (258,717) (258,717)Tax benefit (expense) . . . . . . . . . . . . 40,993 (8,287) 39,260 71,966
As of December 31, 2006 . . . . . . . . . . . 621,518 2,281 (306,821) 316,978Foreign currency translation
adjustments . . . . . . . . . . . . . . . . . . 697,262 — — 697,262Unrealized gain on derivative
instruments . . . . . . . . . . . . . . . . . . — 4,551 — 4,551Reclassification adjustment on
derivative instruments . . . . . . . . . . — (5,075) — (5,075)Pension and other other
postretirement benefit adjustments . — — 13,475 13,475Effect of foreign currency fluctuation
on foreign-denominated pension . . . — — (11,780) (11,780)Tax benefit (expense) . . . . . . . . . . . . 97,798 29 (8,309) 89,518
As of December 30, 2007 . . . . . . . . . . . $1,416,578 $ 1,786 $(313,435) $1,104,929
The significant increases to other comprehensive income due to foreign currency translationadjustments result from the continued strengthening of the CAD and GBP versus the USD. We have
123
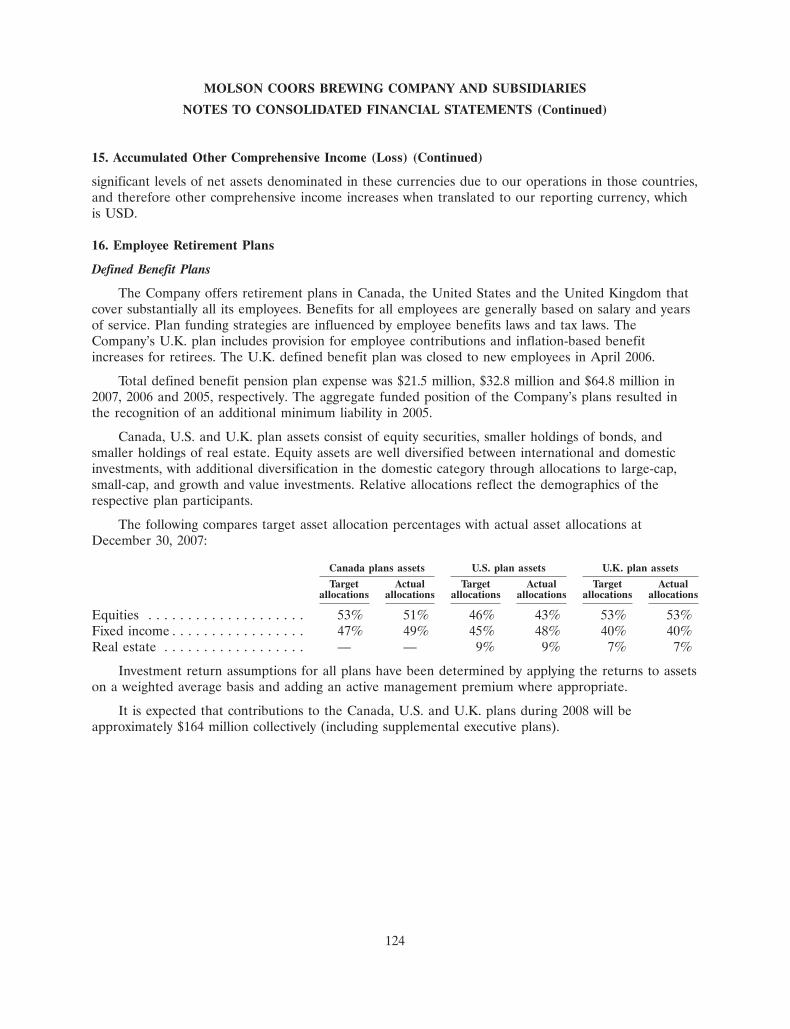
MOLSON COORS BREWING COMPANY AND SUBSIDIARIES
NOTES TO CONSOLIDATED FINANCIAL STATEMENTS (Continued)
15. Accumulated Other Comprehensive Income (Loss) (Continued)
significant levels of net assets denominated in these currencies due to our operations in those countries,and therefore other comprehensive income increases when translated to our reporting currency, whichis USD.
16. Employee Retirement Plans
Defined Benefit Plans
The Company offers retirement plans in Canada, the United States and the United Kingdom thatcover substantially all its employees. Benefits for all employees are generally based on salary and yearsof service. Plan funding strategies are influenced by employee benefits laws and tax laws. TheCompany’s U.K. plan includes provision for employee contributions and inflation-based benefitincreases for retirees. The U.K. defined benefit plan was closed to new employees in April 2006.
Total defined benefit pension plan expense was $21.5 million, $32.8 million and $64.8 million in2007, 2006 and 2005, respectively. The aggregate funded position of the Company’s plans resulted inthe recognition of an additional minimum liability in 2005.
Canada, U.S. and U.K. plan assets consist of equity securities, smaller holdings of bonds, andsmaller holdings of real estate. Equity assets are well diversified between international and domesticinvestments, with additional diversification in the domestic category through allocations to large-cap,small-cap, and growth and value investments. Relative allocations reflect the demographics of therespective plan participants.
The following compares target asset allocation percentages with actual asset allocations atDecember 30, 2007:
Canada plans assets U.S. plan assets U.K. plan assets
Target Actual Target Actual Target Actualallocations allocations allocations allocations allocations allocations
Equities . . . . . . . . . . . . . . . . . . . . 53% 51% 46% 43% 53% 53%Fixed income . . . . . . . . . . . . . . . . . 47% 49% 45% 48% 40% 40%Real estate . . . . . . . . . . . . . . . . . . — — 9% 9% 7% 7%
Investment return assumptions for all plans have been determined by applying the returns to assetson a weighted average basis and adding an active management premium where appropriate.
It is expected that contributions to the Canada, U.S. and U.K. plans during 2008 will beapproximately $164 million collectively (including supplemental executive plans).
124
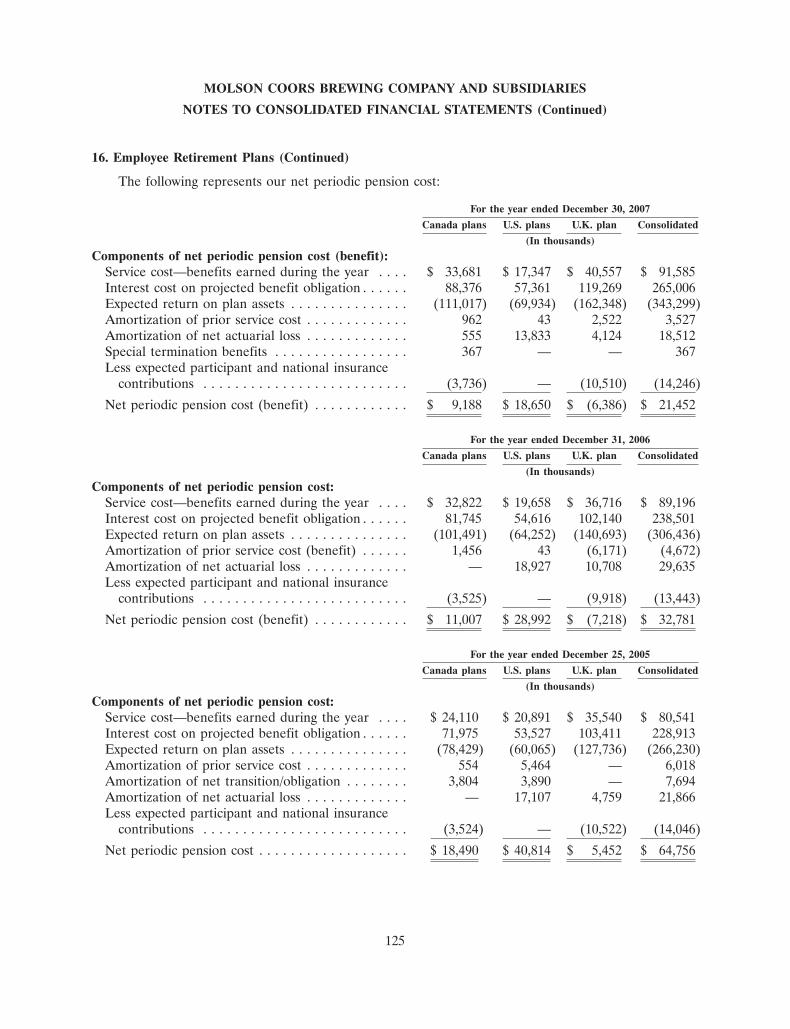
MOLSON COORS BREWING COMPANY AND SUBSIDIARIES
NOTES TO CONSOLIDATED FINANCIAL STATEMENTS (Continued)
16. Employee Retirement Plans (Continued)
The following represents our net periodic pension cost:
For the year ended December 30, 2007
Canada plans U.S. plans U.K. plan Consolidated
(In thousands)
Components of net periodic pension cost (benefit):Service cost—benefits earned during the year . . . . $ 33,681 $ 17,347 $ 40,557 $ 91,585Interest cost on projected benefit obligation . . . . . . 88,376 57,361 119,269 265,006Expected return on plan assets . . . . . . . . . . . . . . . (111,017) (69,934) (162,348) (343,299)Amortization of prior service cost . . . . . . . . . . . . . 962 43 2,522 3,527Amortization of net actuarial loss . . . . . . . . . . . . . 555 13,833 4,124 18,512Special termination benefits . . . . . . . . . . . . . . . . . 367 — — 367Less expected participant and national insurance
contributions . . . . . . . . . . . . . . . . . . . . . . . . . . (3,736) — (10,510) (14,246)
Net periodic pension cost (benefit) . . . . . . . . . . . . $ 9,188 $ 18,650 $ (6,386) $ 21,452
For the year ended December 31, 2006
Canada plans U.S. plans U.K. plan Consolidated
(In thousands)
Components of net periodic pension cost:Service cost—benefits earned during the year . . . . $ 32,822 $ 19,658 $ 36,716 $ 89,196Interest cost on projected benefit obligation . . . . . . 81,745 54,616 102,140 238,501Expected return on plan assets . . . . . . . . . . . . . . . (101,491) (64,252) (140,693) (306,436)Amortization of prior service cost (benefit) . . . . . . 1,456 43 (6,171) (4,672)Amortization of net actuarial loss . . . . . . . . . . . . . — 18,927 10,708 29,635Less expected participant and national insurance
contributions . . . . . . . . . . . . . . . . . . . . . . . . . . (3,525) — (9,918) (13,443)
Net periodic pension cost (benefit) . . . . . . . . . . . . $ 11,007 $ 28,992 $ (7,218) $ 32,781
For the year ended December 25, 2005
Canada plans U.S. plans U.K. plan Consolidated
(In thousands)
Components of net periodic pension cost:Service cost—benefits earned during the year . . . . $ 24,110 $ 20,891 $ 35,540 $ 80,541Interest cost on projected benefit obligation . . . . . . 71,975 53,527 103,411 228,913Expected return on plan assets . . . . . . . . . . . . . . . (78,429) (60,065) (127,736) (266,230)Amortization of prior service cost . . . . . . . . . . . . . 554 5,464 — 6,018Amortization of net transition/obligation . . . . . . . . 3,804 3,890 — 7,694Amortization of net actuarial loss . . . . . . . . . . . . . — 17,107 4,759 21,866Less expected participant and national insurance
contributions . . . . . . . . . . . . . . . . . . . . . . . . . . (3,524) — (10,522) (14,046)
Net periodic pension cost . . . . . . . . . . . . . . . . . . . $ 18,490 $ 40,814 $ 5,452 $ 64,756
125
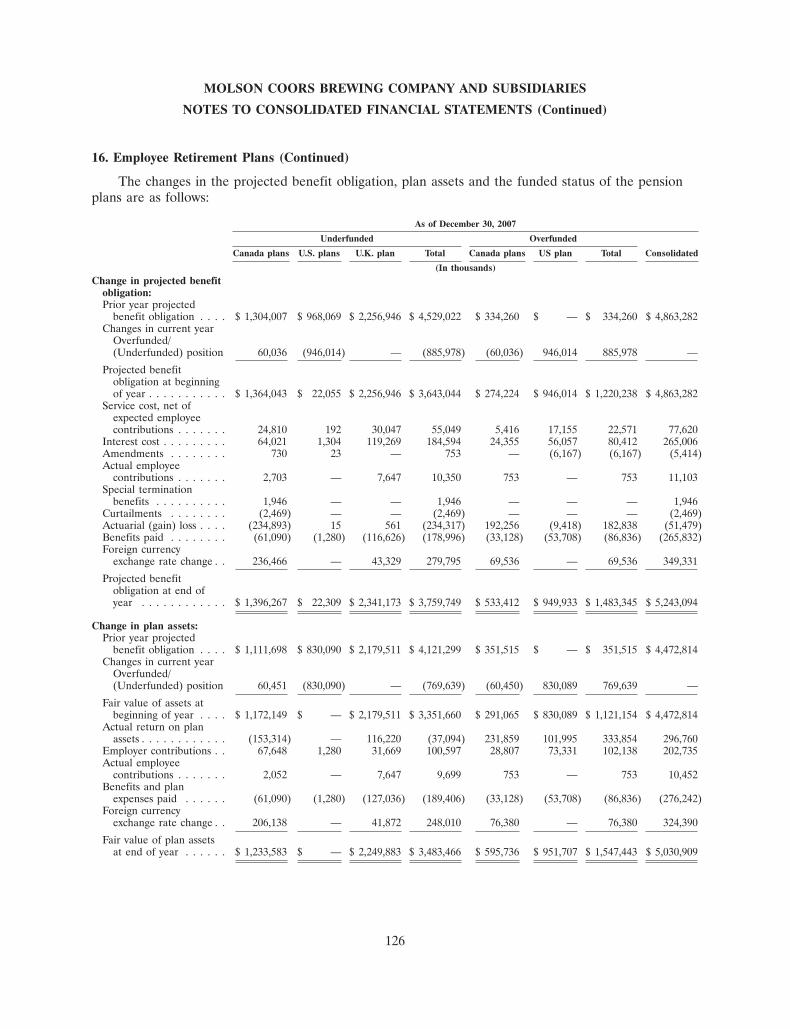
MOLSON COORS BREWING COMPANY AND SUBSIDIARIES
NOTES TO CONSOLIDATED FINANCIAL STATEMENTS (Continued)
16. Employee Retirement Plans (Continued)
The changes in the projected benefit obligation, plan assets and the funded status of the pensionplans are as follows:
As of December 30, 2007
Underfunded Overfunded
Canada plans U.S. plans U.K. plan Total Canada plans US plan Total Consolidated
(In thousands)Change in projected benefit
obligation:Prior year projected
benefit obligation . . . . $ 1,304,007 $ 968,069 $ 2,256,946 $ 4,529,022 $ 334,260 $ — $ 334,260 $ 4,863,282Changes in current year
Overfunded/(Underfunded) position 60,036 (946,014) — (885,978) (60,036) 946,014 885,978 —
Projected benefitobligation at beginningof year . . . . . . . . . . . $ 1,364,043 $ 22,055 $ 2,256,946 $ 3,643,044 $ 274,224 $ 946,014 $ 1,220,238 $ 4,863,282
Service cost, net ofexpected employeecontributions . . . . . . . 24,810 192 30,047 55,049 5,416 17,155 22,571 77,620
Interest cost . . . . . . . . . 64,021 1,304 119,269 184,594 24,355 56,057 80,412 265,006Amendments . . . . . . . . 730 23 — 753 — (6,167) (6,167) (5,414)Actual employee
contributions . . . . . . . 2,703 — 7,647 10,350 753 — 753 11,103Special termination
benefits . . . . . . . . . . 1,946 — — 1,946 — — — 1,946Curtailments . . . . . . . . (2,469) — — (2,469) — — — (2,469)Actuarial (gain) loss . . . . (234,893) 15 561 (234,317) 192,256 (9,418) 182,838 (51,479)Benefits paid . . . . . . . . (61,090) (1,280) (116,626) (178,996) (33,128) (53,708) (86,836) (265,832)Foreign currency
exchange rate change . . 236,466 — 43,329 279,795 69,536 — 69,536 349,331
Projected benefitobligation at end ofyear . . . . . . . . . . . . $ 1,396,267 $ 22,309 $ 2,341,173 $ 3,759,749 $ 533,412 $ 949,933 $ 1,483,345 $ 5,243,094
Change in plan assets:Prior year projected
benefit obligation . . . . $ 1,111,698 $ 830,090 $ 2,179,511 $ 4,121,299 $ 351,515 $ — $ 351,515 $ 4,472,814Changes in current year
Overfunded/(Underfunded) position 60,451 (830,090) — (769,639) (60,450) 830,089 769,639 —
Fair value of assets atbeginning of year . . . . $ 1,172,149 $ — $ 2,179,511 $ 3,351,660 $ 291,065 $ 830,089 $ 1,121,154 $ 4,472,814
Actual return on planassets . . . . . . . . . . . . (153,314) — 116,220 (37,094) 231,859 101,995 333,854 296,760
Employer contributions . . 67,648 1,280 31,669 100,597 28,807 73,331 102,138 202,735Actual employee
contributions . . . . . . . 2,052 — 7,647 9,699 753 — 753 10,452Benefits and plan
expenses paid . . . . . . (61,090) (1,280) (127,036) (189,406) (33,128) (53,708) (86,836) (276,242)Foreign currency
exchange rate change . . 206,138 — 41,872 248,010 76,380 — 76,380 324,390
Fair value of plan assetsat end of year . . . . . . $ 1,233,583 $ — $ 2,249,883 $ 3,483,466 $ 595,736 $ 951,707 $ 1,547,443 $ 5,030,909
126
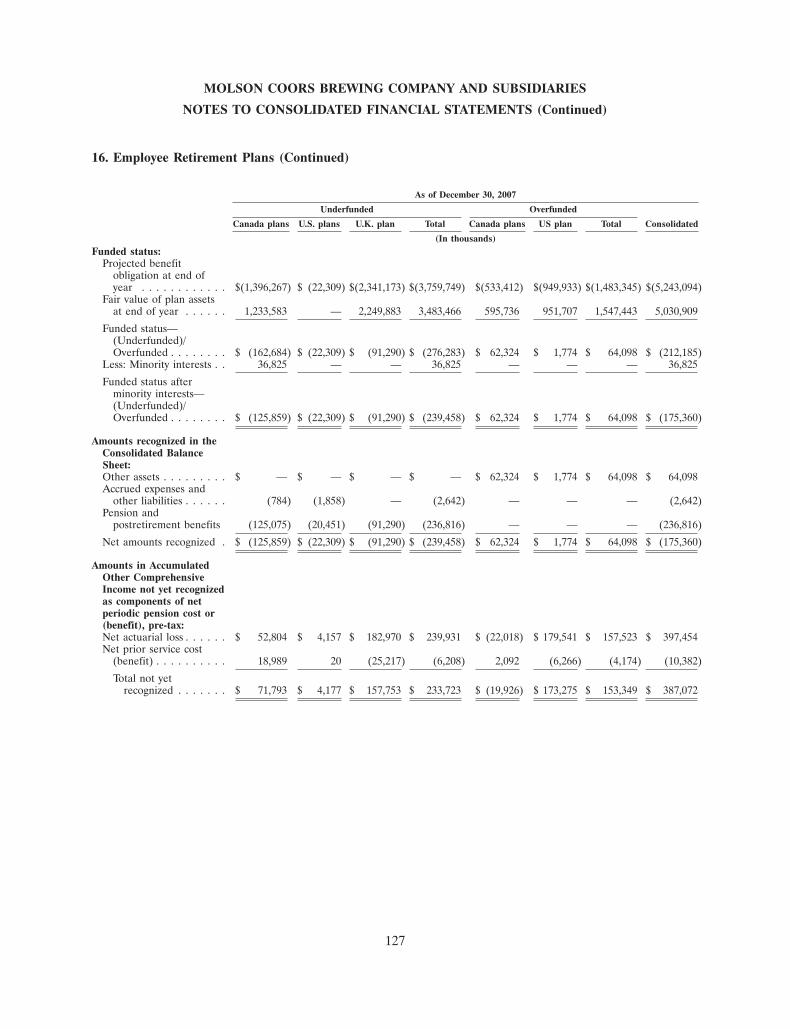
MOLSON COORS BREWING COMPANY AND SUBSIDIARIES
NOTES TO CONSOLIDATED FINANCIAL STATEMENTS (Continued)
16. Employee Retirement Plans (Continued)
As of December 30, 2007
Underfunded Overfunded
Canada plans U.S. plans U.K. plan Total Canada plans US plan Total Consolidated
(In thousands)Funded status:
Projected benefitobligation at end ofyear . . . . . . . . . . . . $(1,396,267) $ (22,309) $(2,341,173) $(3,759,749) $(533,412) $(949,933) $(1,483,345) $(5,243,094)
Fair value of plan assetsat end of year . . . . . . 1,233,583 — 2,249,883 3,483,466 595,736 951,707 1,547,443 5,030,909
Funded status—(Underfunded)/Overfunded . . . . . . . . $ (162,684) $ (22,309) $ (91,290) $ (276,283) $ 62,324 $ 1,774 $ 64,098 $ (212,185)
Less: Minority interests . . 36,825 — — 36,825 — — — 36,825
Funded status afterminority interests—(Underfunded)/Overfunded . . . . . . . . $ (125,859) $ (22,309) $ (91,290) $ (239,458) $ 62,324 $ 1,774 $ 64,098 $ (175,360)
Amounts recognized in theConsolidated BalanceSheet:Other assets . . . . . . . . . $ — $ — $ — $ — $ 62,324 $ 1,774 $ 64,098 $ 64,098Accrued expenses and
other liabilities . . . . . . (784) (1,858) — (2,642) — — — (2,642)Pension and
postretirement benefits (125,075) (20,451) (91,290) (236,816) — — — (236,816)
Net amounts recognized . $ (125,859) $ (22,309) $ (91,290) $ (239,458) $ 62,324 $ 1,774 $ 64,098 $ (175,360)
Amounts in AccumulatedOther ComprehensiveIncome not yet recognizedas components of netperiodic pension cost or(benefit), pre-tax:Net actuarial loss . . . . . . $ 52,804 $ 4,157 $ 182,970 $ 239,931 $ (22,018) $ 179,541 $ 157,523 $ 397,454Net prior service cost
(benefit) . . . . . . . . . . 18,989 20 (25,217) (6,208) 2,092 (6,266) (4,174) (10,382)
Total not yetrecognized . . . . . . . $ 71,793 $ 4,177 $ 157,753 $ 233,723 $ (19,926) $ 173,275 $ 153,349 $ 387,072
127
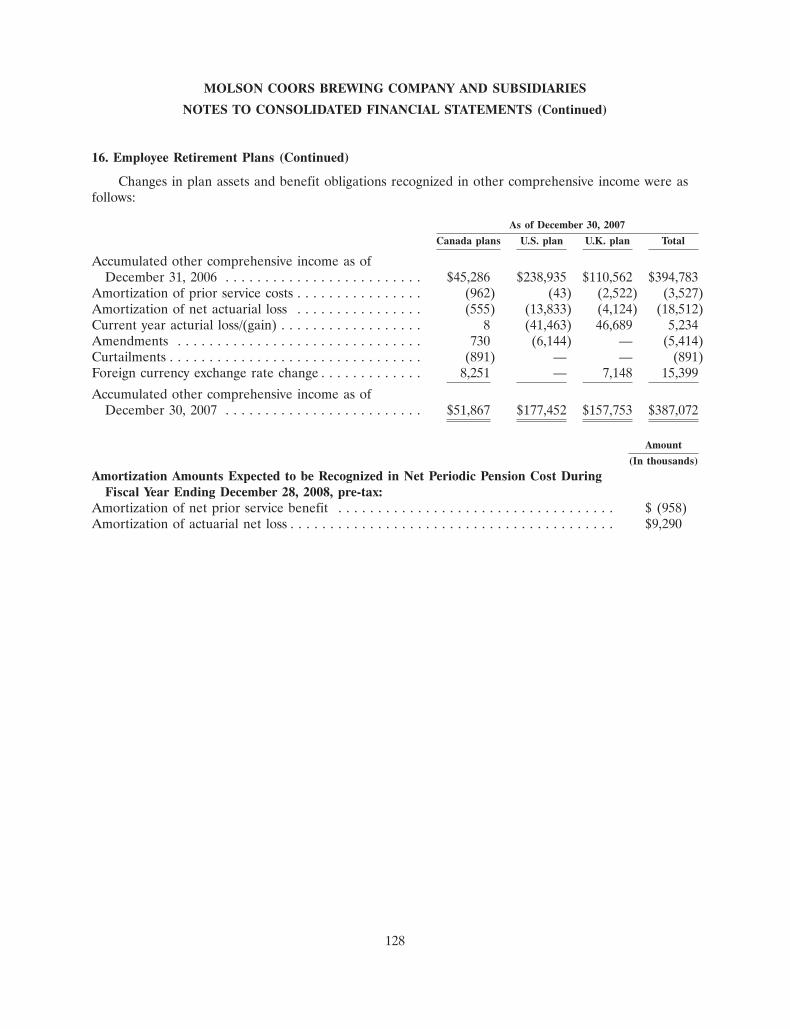
MOLSON COORS BREWING COMPANY AND SUBSIDIARIES
NOTES TO CONSOLIDATED FINANCIAL STATEMENTS (Continued)
16. Employee Retirement Plans (Continued)
Changes in plan assets and benefit obligations recognized in other comprehensive income were asfollows:
As of December 30, 2007
Canada plans U.S. plan U.K. plan Total
Accumulated other comprehensive income as ofDecember 31, 2006 . . . . . . . . . . . . . . . . . . . . . . . . . $45,286 $238,935 $110,562 $394,783
Amortization of prior service costs . . . . . . . . . . . . . . . . (962) (43) (2,522) (3,527)Amortization of net actuarial loss . . . . . . . . . . . . . . . . (555) (13,833) (4,124) (18,512)Current year acturial loss/(gain) . . . . . . . . . . . . . . . . . . 8 (41,463) 46,689 5,234Amendments . . . . . . . . . . . . . . . . . . . . . . . . . . . . . . . 730 (6,144) — (5,414)Curtailments . . . . . . . . . . . . . . . . . . . . . . . . . . . . . . . . (891) — — (891)Foreign currency exchange rate change . . . . . . . . . . . . . 8,251 — 7,148 15,399
Accumulated other comprehensive income as ofDecember 30, 2007 . . . . . . . . . . . . . . . . . . . . . . . . . $51,867 $177,452 $157,753 $387,072
Amount
(In thousands)
Amortization Amounts Expected to be Recognized in Net Periodic Pension Cost DuringFiscal Year Ending December 28, 2008, pre-tax:
Amortization of net prior service benefit . . . . . . . . . . . . . . . . . . . . . . . . . . . . . . . . . . . $ (958)Amortization of actuarial net loss . . . . . . . . . . . . . . . . . . . . . . . . . . . . . . . . . . . . . . . . . $9,290
128
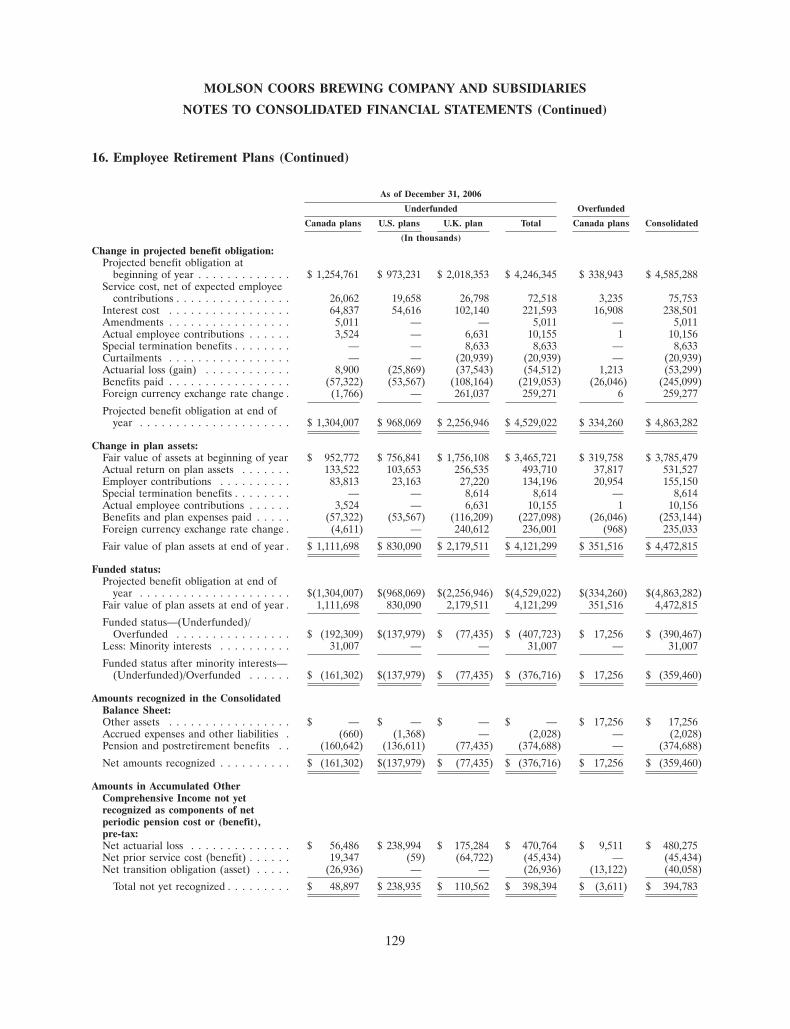
MOLSON COORS BREWING COMPANY AND SUBSIDIARIES
NOTES TO CONSOLIDATED FINANCIAL STATEMENTS (Continued)
16. Employee Retirement Plans (Continued)
As of December 31, 2006
Underfunded Overfunded
Canada plans U.S. plans U.K. plan Total Canada plans Consolidated
(In thousands)Change in projected benefit obligation:
Projected benefit obligation atbeginning of year . . . . . . . . . . . . . $ 1,254,761 $ 973,231 $ 2,018,353 $ 4,246,345 $ 338,943 $ 4,585,288
Service cost, net of expected employeecontributions . . . . . . . . . . . . . . . . 26,062 19,658 26,798 72,518 3,235 75,753
Interest cost . . . . . . . . . . . . . . . . . 64,837 54,616 102,140 221,593 16,908 238,501Amendments . . . . . . . . . . . . . . . . . 5,011 — — 5,011 — 5,011Actual employee contributions . . . . . . 3,524 — 6,631 10,155 1 10,156Special termination benefits . . . . . . . . — — 8,633 8,633 — 8,633Curtailments . . . . . . . . . . . . . . . . . — — (20,939) (20,939) — (20,939)Actuarial loss (gain) . . . . . . . . . . . . 8,900 (25,869) (37,543) (54,512) 1,213 (53,299)Benefits paid . . . . . . . . . . . . . . . . . (57,322) (53,567) (108,164) (219,053) (26,046) (245,099)Foreign currency exchange rate change . (1,766) — 261,037 259,271 6 259,277
Projected benefit obligation at end ofyear . . . . . . . . . . . . . . . . . . . . . $ 1,304,007 $ 968,069 $ 2,256,946 $ 4,529,022 $ 334,260 $ 4,863,282
Change in plan assets:Fair value of assets at beginning of year $ 952,772 $ 756,841 $ 1,756,108 $ 3,465,721 $ 319,758 $ 3,785,479Actual return on plan assets . . . . . . . 133,522 103,653 256,535 493,710 37,817 531,527Employer contributions . . . . . . . . . . 83,813 23,163 27,220 134,196 20,954 155,150Special termination benefits . . . . . . . . — — 8,614 8,614 — 8,614Actual employee contributions . . . . . . 3,524 — 6,631 10,155 1 10,156Benefits and plan expenses paid . . . . . (57,322) (53,567) (116,209) (227,098) (26,046) (253,144)Foreign currency exchange rate change . (4,611) — 240,612 236,001 (968) 235,033
Fair value of plan assets at end of year . $ 1,111,698 $ 830,090 $ 2,179,511 $ 4,121,299 $ 351,516 $ 4,472,815
Funded status:Projected benefit obligation at end of
year . . . . . . . . . . . . . . . . . . . . . $(1,304,007) $(968,069) $(2,256,946) $(4,529,022) $(334,260) $(4,863,282)Fair value of plan assets at end of year . 1,111,698 830,090 2,179,511 4,121,299 351,516 4,472,815
Funded status—(Underfunded)/Overfunded . . . . . . . . . . . . . . . . $ (192,309) $(137,979) $ (77,435) $ (407,723) $ 17,256 $ (390,467)
Less: Minority interests . . . . . . . . . . 31,007 — — 31,007 — 31,007
Funded status after minority interests—(Underfunded)/Overfunded . . . . . . $ (161,302) $(137,979) $ (77,435) $ (376,716) $ 17,256 $ (359,460)
Amounts recognized in the ConsolidatedBalance Sheet:Other assets . . . . . . . . . . . . . . . . . $ — $ — $ — $ — $ 17,256 $ 17,256Accrued expenses and other liabilities . (660) (1,368) — (2,028) — (2,028)Pension and postretirement benefits . . (160,642) (136,611) (77,435) (374,688) — (374,688)
Net amounts recognized . . . . . . . . . . $ (161,302) $(137,979) $ (77,435) $ (376,716) $ 17,256 $ (359,460)
Amounts in Accumulated OtherComprehensive Income not yetrecognized as components of netperiodic pension cost or (benefit),pre-tax:Net actuarial loss . . . . . . . . . . . . . . $ 56,486 $ 238,994 $ 175,284 $ 470,764 $ 9,511 $ 480,275Net prior service cost (benefit) . . . . . . 19,347 (59) (64,722) (45,434) — (45,434)Net transition obligation (asset) . . . . . (26,936) — — (26,936) (13,122) (40,058)
Total not yet recognized . . . . . . . . . $ 48,897 $ 238,935 $ 110,562 $ 398,394 $ (3,611) $ 394,783
129
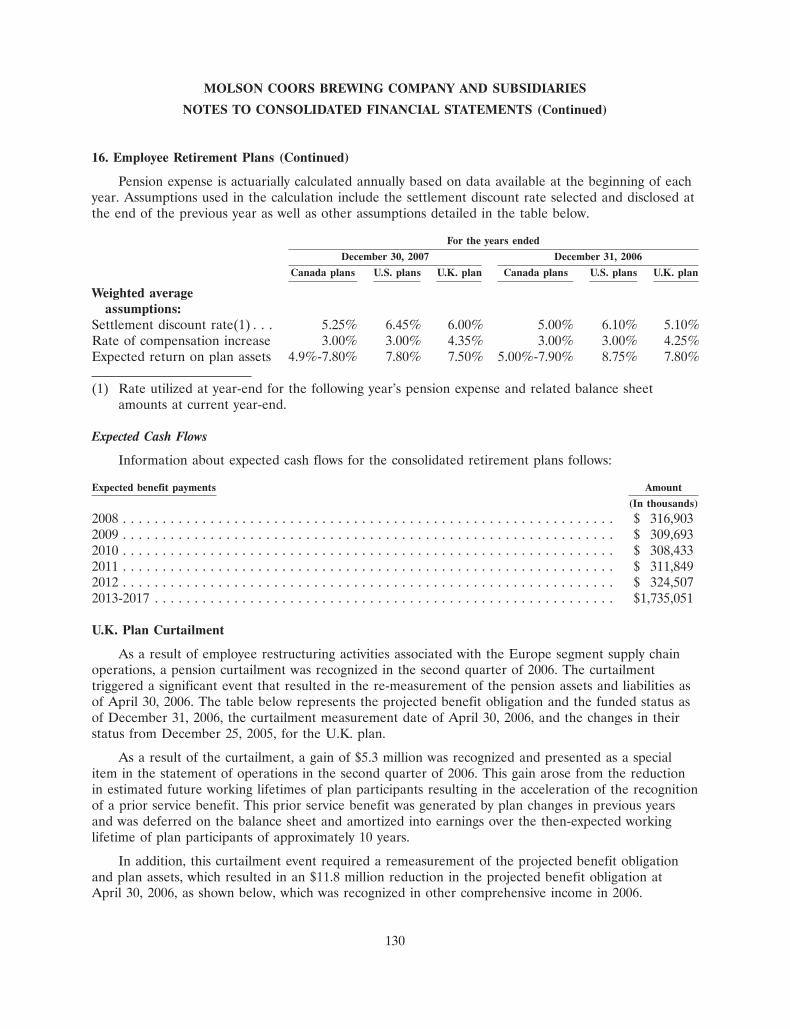
MOLSON COORS BREWING COMPANY AND SUBSIDIARIES
NOTES TO CONSOLIDATED FINANCIAL STATEMENTS (Continued)
16. Employee Retirement Plans (Continued)
Pension expense is actuarially calculated annually based on data available at the beginning of eachyear. Assumptions used in the calculation include the settlement discount rate selected and disclosed atthe end of the previous year as well as other assumptions detailed in the table below.
For the years ended
December 30, 2007 December 31, 2006
Canada plans U.S. plans U.K. plan Canada plans U.S. plans U.K. plan
Weighted averageassumptions:
Settlement discount rate(1) . . . 5.25% 6.45% 6.00% 5.00% 6.10% 5.10%Rate of compensation increase 3.00% 3.00% 4.35% 3.00% 3.00% 4.25%Expected return on plan assets 4.9%-7.80% 7.80% 7.50% 5.00%-7.90% 8.75% 7.80%
(1) Rate utilized at year-end for the following year’s pension expense and related balance sheetamounts at current year-end.
Expected Cash Flows
Information about expected cash flows for the consolidated retirement plans follows:
Expected benefit payments Amount
(In thousands)
2008 . . . . . . . . . . . . . . . . . . . . . . . . . . . . . . . . . . . . . . . . . . . . . . . . . . . . . . . . . . . . . . $ 316,9032009 . . . . . . . . . . . . . . . . . . . . . . . . . . . . . . . . . . . . . . . . . . . . . . . . . . . . . . . . . . . . . . $ 309,6932010 . . . . . . . . . . . . . . . . . . . . . . . . . . . . . . . . . . . . . . . . . . . . . . . . . . . . . . . . . . . . . . $ 308,4332011 . . . . . . . . . . . . . . . . . . . . . . . . . . . . . . . . . . . . . . . . . . . . . . . . . . . . . . . . . . . . . . $ 311,8492012 . . . . . . . . . . . . . . . . . . . . . . . . . . . . . . . . . . . . . . . . . . . . . . . . . . . . . . . . . . . . . . $ 324,5072013-2017 . . . . . . . . . . . . . . . . . . . . . . . . . . . . . . . . . . . . . . . . . . . . . . . . . . . . . . . . . . $1,735,051
U.K. Plan Curtailment
As a result of employee restructuring activities associated with the Europe segment supply chainoperations, a pension curtailment was recognized in the second quarter of 2006. The curtailmenttriggered a significant event that resulted in the re-measurement of the pension assets and liabilities asof April 30, 2006. The table below represents the projected benefit obligation and the funded status asof December 31, 2006, the curtailment measurement date of April 30, 2006, and the changes in theirstatus from December 25, 2005, for the U.K. plan.
As a result of the curtailment, a gain of $5.3 million was recognized and presented as a specialitem in the statement of operations in the second quarter of 2006. This gain arose from the reductionin estimated future working lifetimes of plan participants resulting in the acceleration of the recognitionof a prior service benefit. This prior service benefit was generated by plan changes in previous yearsand was deferred on the balance sheet and amortized into earnings over the then-expected workinglifetime of plan participants of approximately 10 years.
In addition, this curtailment event required a remeasurement of the projected benefit obligationand plan assets, which resulted in an $11.8 million reduction in the projected benefit obligation atApril 30, 2006, as shown below, which was recognized in other comprehensive income in 2006.
130
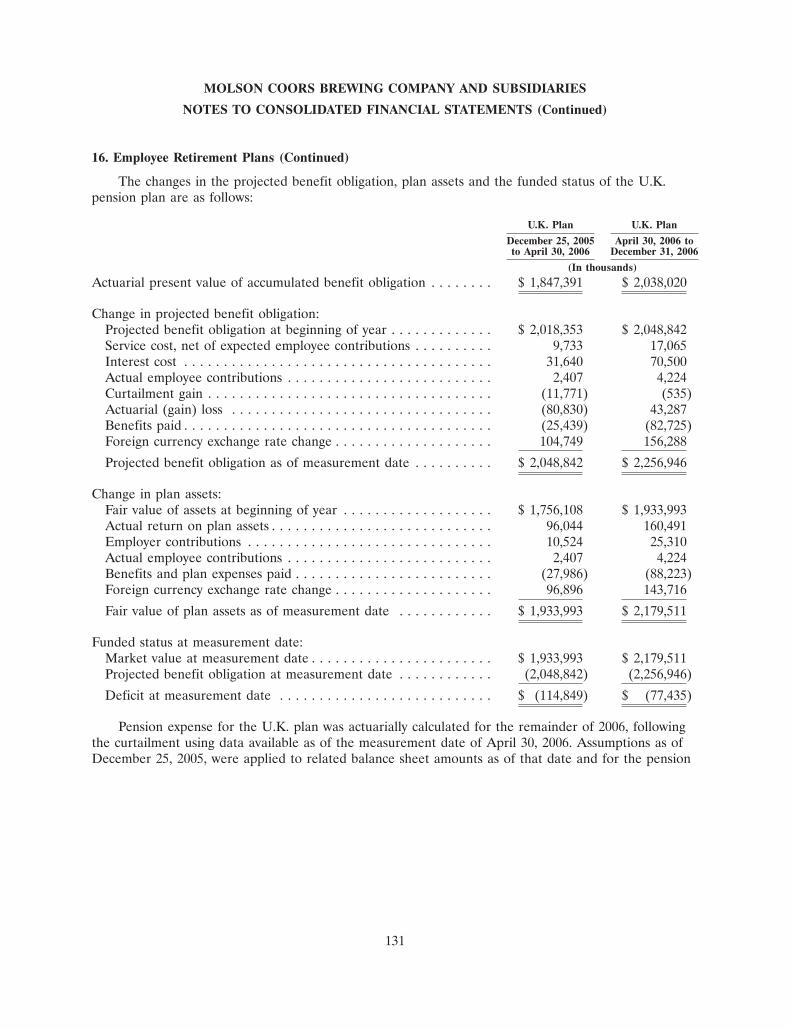
MOLSON COORS BREWING COMPANY AND SUBSIDIARIES
NOTES TO CONSOLIDATED FINANCIAL STATEMENTS (Continued)
16. Employee Retirement Plans (Continued)
The changes in the projected benefit obligation, plan assets and the funded status of the U.K.pension plan are as follows:
U.K. Plan U.K. Plan
December 25, 2005 April 30, 2006 toto April 30, 2006 December 31, 2006
(In thousands)
Actuarial present value of accumulated benefit obligation . . . . . . . . $ 1,847,391 $ 2,038,020
Change in projected benefit obligation:Projected benefit obligation at beginning of year . . . . . . . . . . . . . $ 2,018,353 $ 2,048,842Service cost, net of expected employee contributions . . . . . . . . . . 9,733 17,065Interest cost . . . . . . . . . . . . . . . . . . . . . . . . . . . . . . . . . . . . . . . 31,640 70,500Actual employee contributions . . . . . . . . . . . . . . . . . . . . . . . . . . 2,407 4,224Curtailment gain . . . . . . . . . . . . . . . . . . . . . . . . . . . . . . . . . . . . (11,771) (535)Actuarial (gain) loss . . . . . . . . . . . . . . . . . . . . . . . . . . . . . . . . . (80,830) 43,287Benefits paid . . . . . . . . . . . . . . . . . . . . . . . . . . . . . . . . . . . . . . . (25,439) (82,725)Foreign currency exchange rate change . . . . . . . . . . . . . . . . . . . . 104,749 156,288
Projected benefit obligation as of measurement date . . . . . . . . . . $ 2,048,842 $ 2,256,946
Change in plan assets:Fair value of assets at beginning of year . . . . . . . . . . . . . . . . . . . $ 1,756,108 $ 1,933,993Actual return on plan assets . . . . . . . . . . . . . . . . . . . . . . . . . . . . 96,044 160,491Employer contributions . . . . . . . . . . . . . . . . . . . . . . . . . . . . . . . 10,524 25,310Actual employee contributions . . . . . . . . . . . . . . . . . . . . . . . . . . 2,407 4,224Benefits and plan expenses paid . . . . . . . . . . . . . . . . . . . . . . . . . (27,986) (88,223)Foreign currency exchange rate change . . . . . . . . . . . . . . . . . . . . 96,896 143,716
Fair value of plan assets as of measurement date . . . . . . . . . . . . $ 1,933,993 $ 2,179,511
Funded status at measurement date:Market value at measurement date . . . . . . . . . . . . . . . . . . . . . . . $ 1,933,993 $ 2,179,511Projected benefit obligation at measurement date . . . . . . . . . . . . (2,048,842) (2,256,946)
Deficit at measurement date . . . . . . . . . . . . . . . . . . . . . . . . . . . $ (114,849) $ (77,435)
Pension expense for the U.K. plan was actuarially calculated for the remainder of 2006, followingthe curtailment using data available as of the measurement date of April 30, 2006. Assumptions as ofDecember 25, 2005, were applied to related balance sheet amounts as of that date and for the pension
131
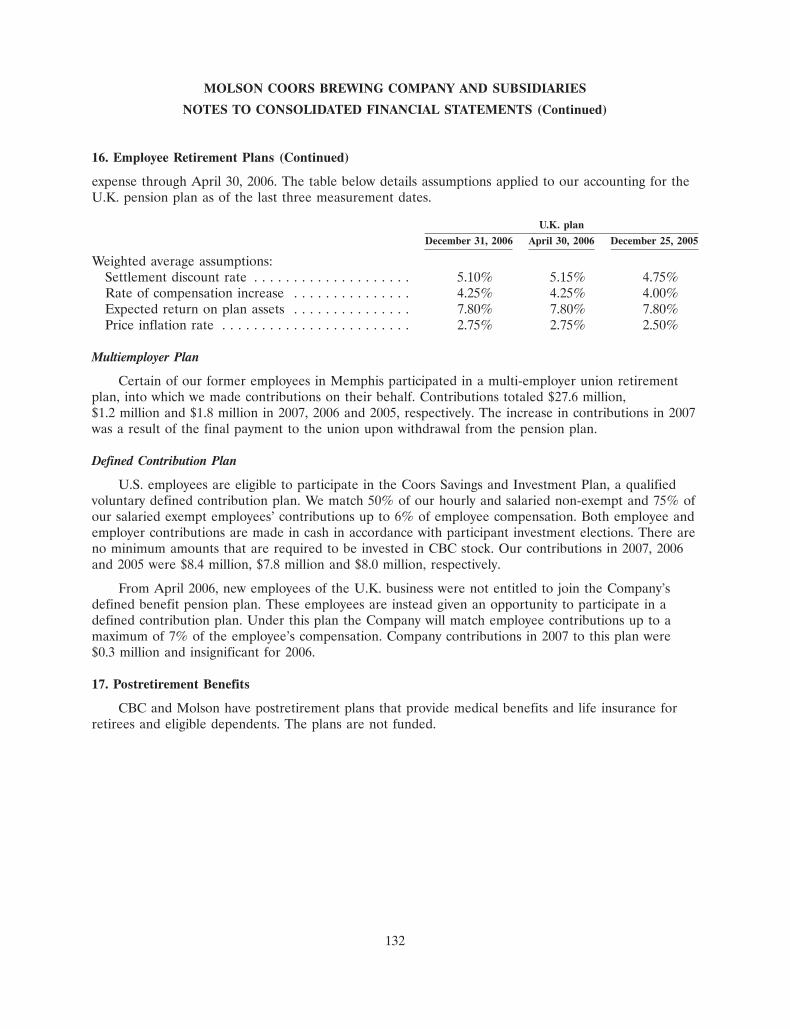
MOLSON COORS BREWING COMPANY AND SUBSIDIARIES
NOTES TO CONSOLIDATED FINANCIAL STATEMENTS (Continued)
16. Employee Retirement Plans (Continued)
expense through April 30, 2006. The table below details assumptions applied to our accounting for theU.K. pension plan as of the last three measurement dates.
U.K. plan
December 31, 2006 April 30, 2006 December 25, 2005
Weighted average assumptions:Settlement discount rate . . . . . . . . . . . . . . . . . . . . 5.10% 5.15% 4.75%Rate of compensation increase . . . . . . . . . . . . . . . 4.25% 4.25% 4.00%Expected return on plan assets . . . . . . . . . . . . . . . 7.80% 7.80% 7.80%Price inflation rate . . . . . . . . . . . . . . . . . . . . . . . . 2.75% 2.75% 2.50%
Multiemployer Plan
Certain of our former employees in Memphis participated in a multi-employer union retirementplan, into which we made contributions on their behalf. Contributions totaled $27.6 million,$1.2 million and $1.8 million in 2007, 2006 and 2005, respectively. The increase in contributions in 2007was a result of the final payment to the union upon withdrawal from the pension plan.
Defined Contribution Plan
U.S. employees are eligible to participate in the Coors Savings and Investment Plan, a qualifiedvoluntary defined contribution plan. We match 50% of our hourly and salaried non-exempt and 75% ofour salaried exempt employees’ contributions up to 6% of employee compensation. Both employee andemployer contributions are made in cash in accordance with participant investment elections. There areno minimum amounts that are required to be invested in CBC stock. Our contributions in 2007, 2006and 2005 were $8.4 million, $7.8 million and $8.0 million, respectively.
From April 2006, new employees of the U.K. business were not entitled to join the Company’sdefined benefit pension plan. These employees are instead given an opportunity to participate in adefined contribution plan. Under this plan the Company will match employee contributions up to amaximum of 7% of the employee’s compensation. Company contributions in 2007 to this plan were$0.3 million and insignificant for 2006.
17. Postretirement Benefits
CBC and Molson have postretirement plans that provide medical benefits and life insurance forretirees and eligible dependents. The plans are not funded.
132
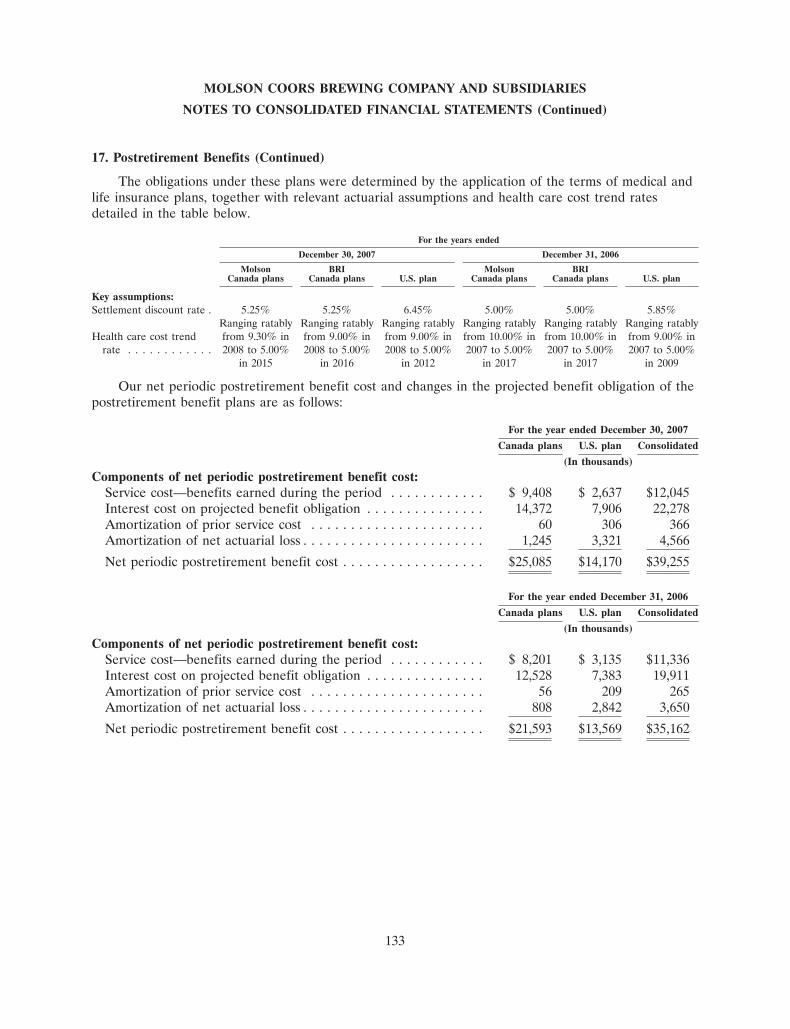
MOLSON COORS BREWING COMPANY AND SUBSIDIARIES
NOTES TO CONSOLIDATED FINANCIAL STATEMENTS (Continued)
17. Postretirement Benefits (Continued)
The obligations under these plans were determined by the application of the terms of medical andlife insurance plans, together with relevant actuarial assumptions and health care cost trend ratesdetailed in the table below.
For the years ended
December 30, 2007 December 31, 2006
Molson BRI Molson BRICanada plans Canada plans U.S. plan Canada plans Canada plans U.S. plan
Key assumptions:Settlement discount rate . 5.25% 5.25% 6.45% 5.00% 5.00% 5.85%
Ranging ratably Ranging ratably Ranging ratably Ranging ratably Ranging ratably Ranging ratablyHealth care cost trend from 9.30% in from 9.00% in from 9.00% in from 10.00% in from 10.00% in from 9.00% in
rate . . . . . . . . . . . . 2008 to 5.00% 2008 to 5.00% 2008 to 5.00% 2007 to 5.00% 2007 to 5.00% 2007 to 5.00%in 2015 in 2016 in 2012 in 2017 in 2017 in 2009
Our net periodic postretirement benefit cost and changes in the projected benefit obligation of thepostretirement benefit plans are as follows:
For the year ended December 30, 2007
Canada plans U.S. plan Consolidated
(In thousands)
Components of net periodic postretirement benefit cost:Service cost—benefits earned during the period . . . . . . . . . . . . $ 9,408 $ 2,637 $12,045Interest cost on projected benefit obligation . . . . . . . . . . . . . . . 14,372 7,906 22,278Amortization of prior service cost . . . . . . . . . . . . . . . . . . . . . . 60 306 366Amortization of net actuarial loss . . . . . . . . . . . . . . . . . . . . . . . 1,245 3,321 4,566
Net periodic postretirement benefit cost . . . . . . . . . . . . . . . . . . $25,085 $14,170 $39,255
For the year ended December 31, 2006
Canada plans U.S. plan Consolidated
(In thousands)
Components of net periodic postretirement benefit cost:Service cost—benefits earned during the period . . . . . . . . . . . . $ 8,201 $ 3,135 $11,336Interest cost on projected benefit obligation . . . . . . . . . . . . . . . 12,528 7,383 19,911Amortization of prior service cost . . . . . . . . . . . . . . . . . . . . . . 56 209 265Amortization of net actuarial loss . . . . . . . . . . . . . . . . . . . . . . . 808 2,842 3,650
Net periodic postretirement benefit cost . . . . . . . . . . . . . . . . . . $21,593 $13,569 $35,162
133
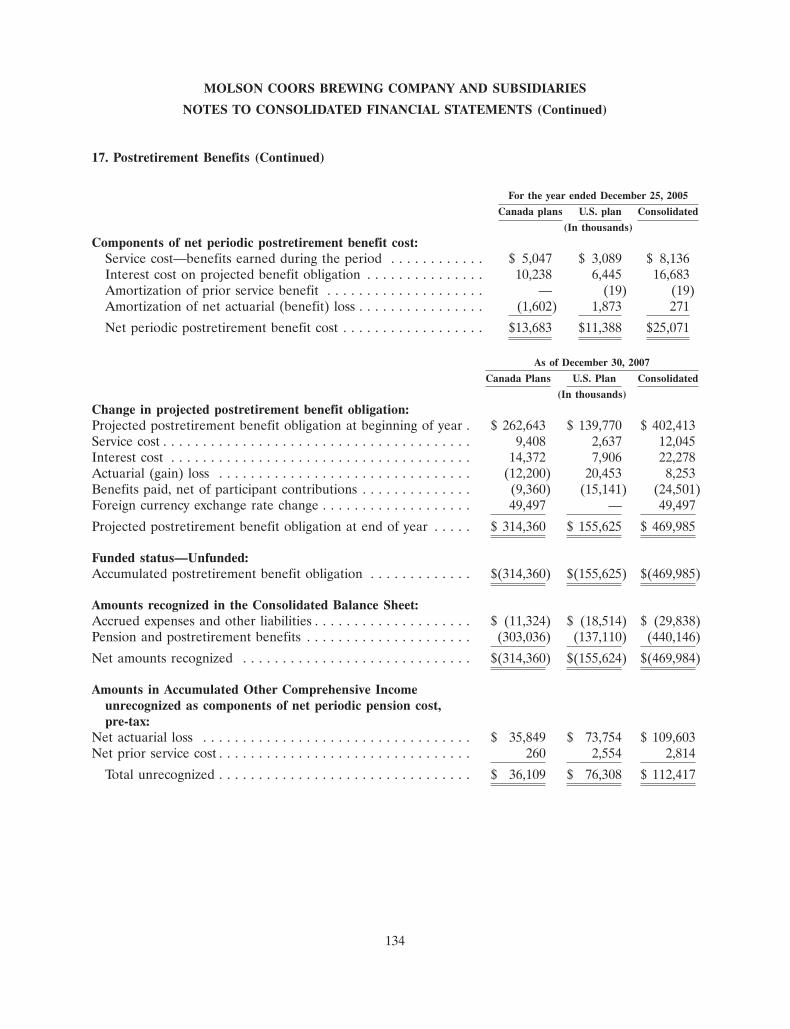
MOLSON COORS BREWING COMPANY AND SUBSIDIARIES
NOTES TO CONSOLIDATED FINANCIAL STATEMENTS (Continued)
17. Postretirement Benefits (Continued)
For the year ended December 25, 2005
Canada plans U.S. plan Consolidated
(In thousands)
Components of net periodic postretirement benefit cost:Service cost—benefits earned during the period . . . . . . . . . . . . $ 5,047 $ 3,089 $ 8,136Interest cost on projected benefit obligation . . . . . . . . . . . . . . . 10,238 6,445 16,683Amortization of prior service benefit . . . . . . . . . . . . . . . . . . . . — (19) (19)Amortization of net actuarial (benefit) loss . . . . . . . . . . . . . . . . (1,602) 1,873 271
Net periodic postretirement benefit cost . . . . . . . . . . . . . . . . . . $13,683 $11,388 $25,071
As of December 30, 2007
Canada Plans U.S. Plan Consolidated
(In thousands)
Change in projected postretirement benefit obligation:Projected postretirement benefit obligation at beginning of year . $ 262,643 $ 139,770 $ 402,413Service cost . . . . . . . . . . . . . . . . . . . . . . . . . . . . . . . . . . . . . . . 9,408 2,637 12,045Interest cost . . . . . . . . . . . . . . . . . . . . . . . . . . . . . . . . . . . . . . 14,372 7,906 22,278Actuarial (gain) loss . . . . . . . . . . . . . . . . . . . . . . . . . . . . . . . . (12,200) 20,453 8,253Benefits paid, net of participant contributions . . . . . . . . . . . . . . (9,360) (15,141) (24,501)Foreign currency exchange rate change . . . . . . . . . . . . . . . . . . . 49,497 — 49,497
Projected postretirement benefit obligation at end of year . . . . . $ 314,360 $ 155,625 $ 469,985
Funded status—Unfunded:Accumulated postretirement benefit obligation . . . . . . . . . . . . . $(314,360) $(155,625) $(469,985)
Amounts recognized in the Consolidated Balance Sheet:Accrued expenses and other liabilities . . . . . . . . . . . . . . . . . . . . $ (11,324) $ (18,514) $ (29,838)Pension and postretirement benefits . . . . . . . . . . . . . . . . . . . . . (303,036) (137,110) (440,146)
Net amounts recognized . . . . . . . . . . . . . . . . . . . . . . . . . . . . . $(314,360) $(155,624) $(469,984)
Amounts in Accumulated Other Comprehensive Incomeunrecognized as components of net periodic pension cost,pre-tax:
Net actuarial loss . . . . . . . . . . . . . . . . . . . . . . . . . . . . . . . . . . $ 35,849 $ 73,754 $ 109,603Net prior service cost . . . . . . . . . . . . . . . . . . . . . . . . . . . . . . . . 260 2,554 2,814
Total unrecognized . . . . . . . . . . . . . . . . . . . . . . . . . . . . . . . . $ 36,109 $ 76,308 $ 112,417
134
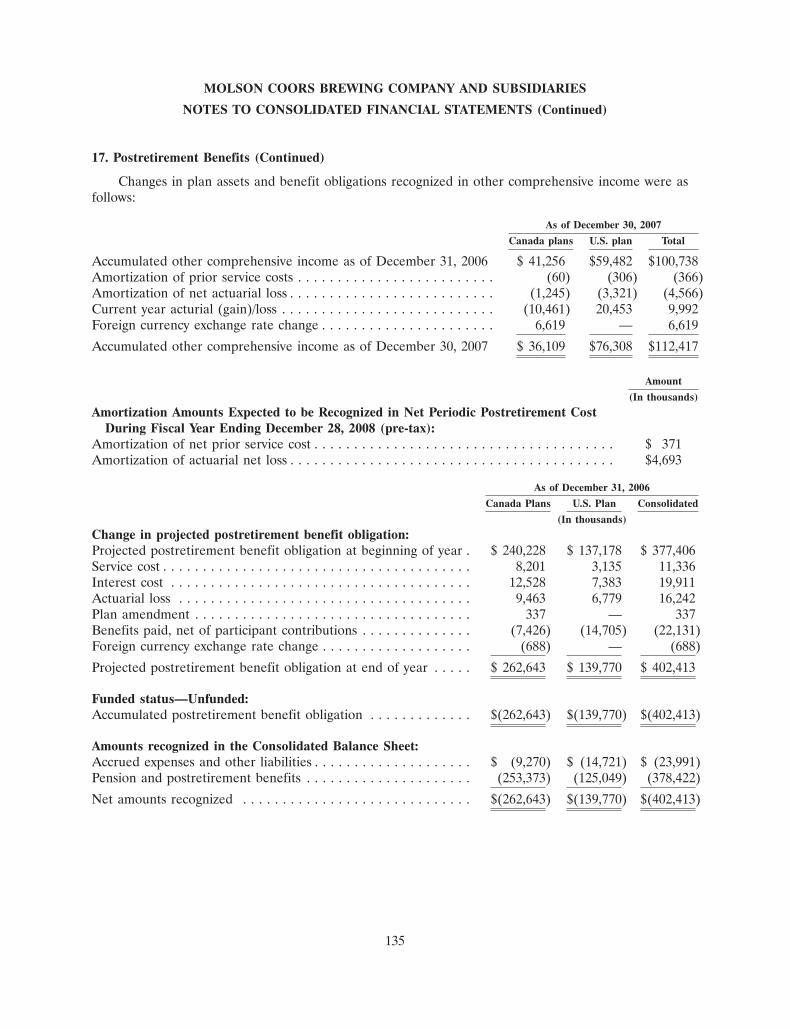
MOLSON COORS BREWING COMPANY AND SUBSIDIARIES
NOTES TO CONSOLIDATED FINANCIAL STATEMENTS (Continued)
17. Postretirement Benefits (Continued)
Changes in plan assets and benefit obligations recognized in other comprehensive income were asfollows:
As of December 30, 2007
Canada plans U.S. plan Total
Accumulated other comprehensive income as of December 31, 2006 $ 41,256 $59,482 $100,738Amortization of prior service costs . . . . . . . . . . . . . . . . . . . . . . . . . (60) (306) (366)Amortization of net actuarial loss . . . . . . . . . . . . . . . . . . . . . . . . . . (1,245) (3,321) (4,566)Current year acturial (gain)/loss . . . . . . . . . . . . . . . . . . . . . . . . . . . (10,461) 20,453 9,992Foreign currency exchange rate change . . . . . . . . . . . . . . . . . . . . . . 6,619 — 6,619
Accumulated other comprehensive income as of December 30, 2007 $ 36,109 $76,308 $112,417
Amount
(In thousands)
Amortization Amounts Expected to be Recognized in Net Periodic Postretirement CostDuring Fiscal Year Ending December 28, 2008 (pre-tax):
Amortization of net prior service cost . . . . . . . . . . . . . . . . . . . . . . . . . . . . . . . . . . . . . . $ 371Amortization of actuarial net loss . . . . . . . . . . . . . . . . . . . . . . . . . . . . . . . . . . . . . . . . . $4,693
As of December 31, 2006
Canada Plans U.S. Plan Consolidated
(In thousands)
Change in projected postretirement benefit obligation:Projected postretirement benefit obligation at beginning of year . $ 240,228 $ 137,178 $ 377,406Service cost . . . . . . . . . . . . . . . . . . . . . . . . . . . . . . . . . . . . . . . 8,201 3,135 11,336Interest cost . . . . . . . . . . . . . . . . . . . . . . . . . . . . . . . . . . . . . . 12,528 7,383 19,911Actuarial loss . . . . . . . . . . . . . . . . . . . . . . . . . . . . . . . . . . . . . 9,463 6,779 16,242Plan amendment . . . . . . . . . . . . . . . . . . . . . . . . . . . . . . . . . . . 337 — 337Benefits paid, net of participant contributions . . . . . . . . . . . . . . (7,426) (14,705) (22,131)Foreign currency exchange rate change . . . . . . . . . . . . . . . . . . . (688) — (688)
Projected postretirement benefit obligation at end of year . . . . . $ 262,643 $ 139,770 $ 402,413
Funded status—Unfunded:Accumulated postretirement benefit obligation . . . . . . . . . . . . . $(262,643) $(139,770) $(402,413)
Amounts recognized in the Consolidated Balance Sheet:Accrued expenses and other liabilities . . . . . . . . . . . . . . . . . . . . $ (9,270) $ (14,721) $ (23,991)Pension and postretirement benefits . . . . . . . . . . . . . . . . . . . . . (253,373) (125,049) (378,422)
Net amounts recognized . . . . . . . . . . . . . . . . . . . . . . . . . . . . . $(262,643) $(139,770) $(402,413)
135
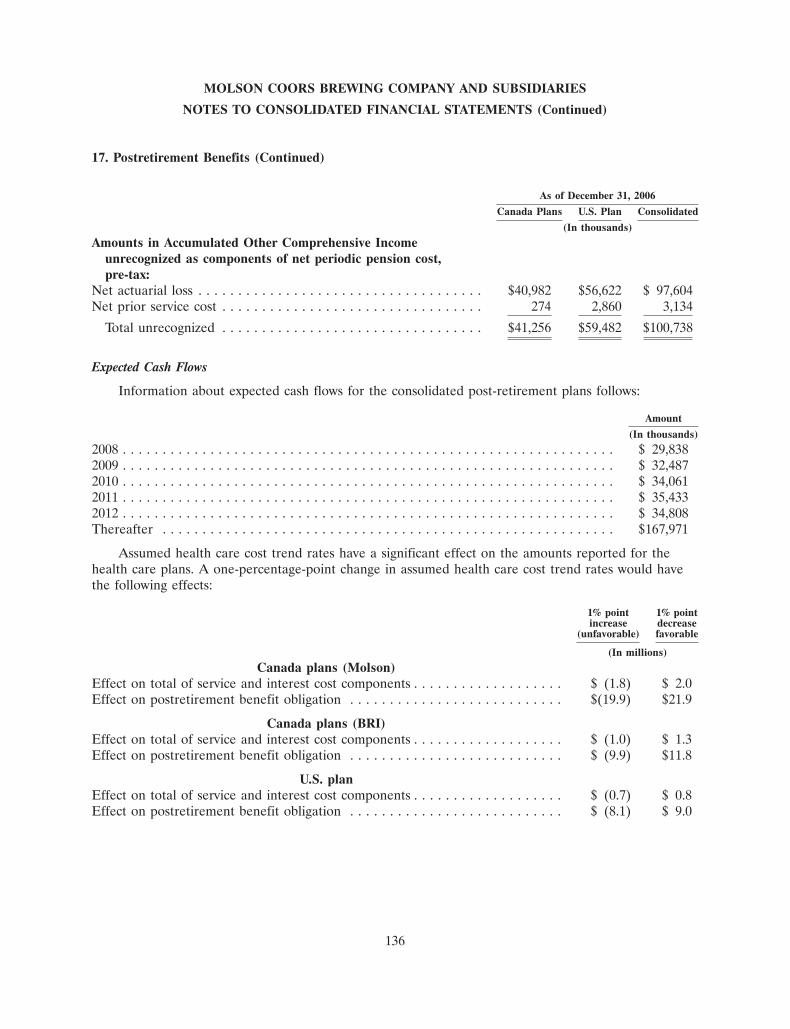
MOLSON COORS BREWING COMPANY AND SUBSIDIARIES
NOTES TO CONSOLIDATED FINANCIAL STATEMENTS (Continued)
17. Postretirement Benefits (Continued)
As of December 31, 2006
Canada Plans U.S. Plan Consolidated
(In thousands)
Amounts in Accumulated Other Comprehensive Incomeunrecognized as components of net periodic pension cost,pre-tax:
Net actuarial loss . . . . . . . . . . . . . . . . . . . . . . . . . . . . . . . . . . . . $40,982 $56,622 $ 97,604Net prior service cost . . . . . . . . . . . . . . . . . . . . . . . . . . . . . . . . . 274 2,860 3,134
Total unrecognized . . . . . . . . . . . . . . . . . . . . . . . . . . . . . . . . . $41,256 $59,482 $100,738
Expected Cash Flows
Information about expected cash flows for the consolidated post-retirement plans follows:
Amount
(In thousands)
2008 . . . . . . . . . . . . . . . . . . . . . . . . . . . . . . . . . . . . . . . . . . . . . . . . . . . . . . . . . . . . . . $ 29,8382009 . . . . . . . . . . . . . . . . . . . . . . . . . . . . . . . . . . . . . . . . . . . . . . . . . . . . . . . . . . . . . . $ 32,4872010 . . . . . . . . . . . . . . . . . . . . . . . . . . . . . . . . . . . . . . . . . . . . . . . . . . . . . . . . . . . . . . $ 34,0612011 . . . . . . . . . . . . . . . . . . . . . . . . . . . . . . . . . . . . . . . . . . . . . . . . . . . . . . . . . . . . . . $ 35,4332012 . . . . . . . . . . . . . . . . . . . . . . . . . . . . . . . . . . . . . . . . . . . . . . . . . . . . . . . . . . . . . . $ 34,808Thereafter . . . . . . . . . . . . . . . . . . . . . . . . . . . . . . . . . . . . . . . . . . . . . . . . . . . . . . . . . $167,971
Assumed health care cost trend rates have a significant effect on the amounts reported for thehealth care plans. A one-percentage-point change in assumed health care cost trend rates would havethe following effects:
1% point 1% pointincrease decrease
(unfavorable) favorable
(In millions)
Canada plans (Molson)Effect on total of service and interest cost components . . . . . . . . . . . . . . . . . . . $ (1.8) $ 2.0Effect on postretirement benefit obligation . . . . . . . . . . . . . . . . . . . . . . . . . . . $(19.9) $21.9
Canada plans (BRI)Effect on total of service and interest cost components . . . . . . . . . . . . . . . . . . . $ (1.0) $ 1.3Effect on postretirement benefit obligation . . . . . . . . . . . . . . . . . . . . . . . . . . . $ (9.9) $11.8
U.S. planEffect on total of service and interest cost components . . . . . . . . . . . . . . . . . . . $ (0.7) $ 0.8Effect on postretirement benefit obligation . . . . . . . . . . . . . . . . . . . . . . . . . . . $ (8.1) $ 9.0
136
MOLSON COORS BREWING COMPANY AND SUBSIDIARIES
NOTES TO CONSOLIDATED FINANCIAL STATEMENTS (Continued)
18. Derivative Instruments
Market Risk Management Policies
In the normal course of business, we are exposed to fluctuations in interest rates, the value offoreign currencies and production and packaging materials prices. We have established policies andprocedures that govern the strategic management of these exposures through the use of a variety offinancial instruments. By policy, we do not enter into such contracts for trading purposes or for thepurpose of speculation.
Our objective in managing our exposure to fluctuations in interest rates, foreign currency exchangerates and production and packaging materials prices is to decrease the volatility of our earnings andcash flows affected by changes in the underlying rates and prices. To achieve this objective, we enterinto foreign currency forward contracts, commodity swaps, interest rate swaps, and cross currencyswaps, the values of which change in the opposite direction of the anticipated cash flows. Our primaryforeign currency exposures are the Canadian dollar (‘‘CAD’’), the British Pound Sterling (‘‘GBP’’ or‘‘£’’).
Derivatives are either exchange-traded instruments or over-the-counter agreements entered intowith highly rated financial institutions. We are exposed to credit-related losses in the event ofnon-performance by counterparties to hedging instruments and do not enter into master nettingarrangements. The counterparties to derivative transactions are major financial institutions withinvestment grade credit ratings of at least A (Standard & Poor’s), A2 (Moody’s) or better. However,this does not eliminate our exposure to credit risk with these institutions. This credit risk is generallylimited to the unrealized gains in such contracts should any of these counterparties fail to perform ascontracted. To manage this risk, we have established counterparty credit guidelines that are monitoredand reported to management according to prescribed guidelines. We utilize a portfolio of financialinstitutions either headquartered or operating in the same countries we conduct our business. As aresult of the above considerations, we consider the risk of counterparty default to be minimal. In someinstances our counterparties and we have reciprocal collateralization agreements regarding fair valuepositions in excess of certain thresholds. These agreements call for the posting of collateral in the formof cash, treasury securities or letters of credit if a fair value loss position to our counterparties or usexceeds a certain amount. At December 30, 2007, no collateral was posted by our counterparties or us.
Derivative Accounting Policies
The majority of all derivatives entered into by the Company qualify for, and are designated as,foreign-currency cash flow hedges, commodity cash flow hedges or fair value hedges, including thosederivatives hedging foreign currency denominated firm commitments as per the definitions of Statementof Financial Accounting Standards No. 133, ‘‘Accounting for Derivative Instruments and HedgingActivities, as amended and interpreted, incorporating FASB Statements No. 137, 138 and 149’’ (‘‘SFASNo. 133’’).
The Company considers whether any provisions in non-derivative contracts represent ‘‘embedded’’derivative instruments as described in SFAS No. 133. As of December 30, 2007, we have concluded thatno ‘‘embedded’’ derivative instruments warrant separate fair value accounting under SFAS No. 133.
All derivatives are recognized on the balance sheet at their fair value. Unrealized gain positionsare recorded as other current assets or other non-current assets. Unrealized loss positions are recordedas other liabilities or other non-current liabilities. Changes in unrealized gains and losses from fair
137
MOLSON COORS BREWING COMPANY AND SUBSIDIARIES
NOTES TO CONSOLIDATED FINANCIAL STATEMENTS (Continued)
18. Derivative Instruments (Continued)
value hedges are classified in the statement of operations consistent with the classification of thecorresponding income or expense line item being hedged. Changes in fair values of outstanding cashflow hedges that are highly effective as per the definition of SFAS 133 are recorded in othercomprehensive income, until earnings are affected by the variability of cash flows of the underlyinghedged transaction. In most cases amounts recorded in other comprehensive income will be released toearnings at maturity of the related derivative. The recognition of effective hedge results in theconsolidated statement of income offsets the gains or losses on the underlying exposure. Cash flowsfrom derivative transactions are classified according to the nature of the risk being hedged.
We formally document all relationships between hedging instruments and hedged items, as well asthe risk-management objective and strategy for undertaking hedge transactions. This process includeslinking all derivatives either to specific assets and liabilities on the balance sheet or specific firmcommitments or forecasted transactions. We also formally assess, both at the hedge’s inception and onan ongoing basis, whether the derivatives that are used in hedging transactions have been highlyeffective in offsetting changes in the cash flows of hedged items and whether those derivatives may beexpected to remain highly effective in future periods. When it is determined that a derivative is not, orhas ceased to be, highly effective as a hedge, we discontinue hedge accounting prospectively, asdiscussed below.
We discontinue hedge accounting prospectively, as per SFAS No. 133, when (1) the derivative is nolonger highly effective in offsetting changes in the cash flows of a hedged item (including hedged itemssuch as firm commitments or forecasted transactions); (2) the derivative expires or is sold, terminated,or exercised; (3) it is no longer probable that the forecasted transaction will occur; or (4) managementdetermines that designating the derivative as a hedging instrument is no longer appropriate.
When we discontinue hedge accounting but it continues to be probable that the forecastedtransaction will occur in the originally expected period, the gain or loss on the derivative remains inaccumulated other comprehensive income and is reclassified into earnings when the forecastedtransaction affects earnings. However, if it is no longer probable that a forecasted transaction will occurby the end of the originally specified time period or within an additional two-month period of timethereafter, the gains and losses that were accumulated in other comprehensive income will berecognized immediately in earnings. In all situations in which hedge accounting is discontinued and thederivative remains outstanding, we will carry the derivative at its fair value on the balance sheet untilmaturity, recognizing future changes in the fair value in current-period earnings. Any hedgeineffectiveness, as per SFAS No. 133, is recorded in current-period earnings in other expense (income),net. Effectiveness is assessed based on the comparison of current forward rates to the rates establishedon our hedges.
138
MOLSON COORS BREWING COMPANY AND SUBSIDIARIES
NOTES TO CONSOLIDATED FINANCIAL STATEMENTS (Continued)
18. Derivative Instruments (Continued)
Following are the notional transaction amounts and fair values for our outstanding derivatives,summarized by risk category and instrument type.
For the years ended
December 30, 2007 December 31, 2006
Notional Fair Notional FairAmount Value Amount Value
(In thousands)
Foreign CurrencyForwards . . . . . . . . . . . . . . . . . . . . . . . . . . . . . . . $ 460,943 $ (24,886) $ 220,455 $ 7,133Swaps . . . . . . . . . . . . . . . . . . . . . . . . . . . . . . . . . 2,416,396 (472,544) 1,411,704 (268,656)
Total foreign currency . . . . . . . . . . . . . . . . . . . . . . . 2,877,339 (497,430) 1,632,159 (261,523)Interest rate:
Swaps . . . . . . . . . . . . . . . . . . . . . . . . . . . . . . . . . 303,064 9,899 286,971 1,913Commodity price:
Swaps . . . . . . . . . . . . . . . . . . . . . . . . . . . . . . . . . 202,397 (9,980) 49,723 7,436Fixed price contracts . . . . . . . . . . . . . . . . . . . . . . — — 4,125 (956)
Total commodity price . . . . . . . . . . . . . . . . . . . . . . . 202,397 (9,980) 53,848 6,480
Total outstanding derivatives . . . . . . . . . . . . . . . . . . $3,382,800 $(497,511) $1,972,978 $(253,130)
The table below shows pre-tax derivative gains and losses deferred in other comprehensive incomein shareholders equity as of December 30, 2007, December 31, 2006 and December 25, 2005. Gains andlosses deferred as of December 30, 2007 are generally expected to be recognized as the underlyingtransactions occur. The amounts ultimately recognized may differ, favorably or unfavorably, from thoseshown due to the fact that some of our derivative positions are not yet settled and therefore remainsubject to ongoing market price fluctuations. As noted, effective gains and losses are deferred over timeand recognized simultaneously with the impact of the underlying transactions. The ineffective gains andlosses are recognized immediately when it was evident they did not precisely offset changes in theunderlying transaction.
For the years ended
December 30, 2007 December 31, 2006 December 25, 2005
(In thousands)
Net deferred (gain) loss . . . . . . . . . . . . . . . . . . . $(8,669) $(9,364) $11,922Net ineffective loss (gain) . . . . . . . . . . . . . . . . . . $ 1,313 $(3,050) $ (15)
Significant Hedged Positions
Upon the Merger and in connection with our debt offerings (Note 13), we added various derivativeinstruments held by Molson that hedged currency, commodity, and interest rate risk in a similarmanner as Coors.
Prior to issuing the notes on September 22, 2005 (See Note 13), we entered into a bond forwardtransaction for a portion of the Canadian offering. The bond forward transaction effectively established,in advance, the yield of the government of Canada bond rates over which the Company’s privateplacement was priced. At the time of the private placement offering and pricing, the government of
139
MOLSON COORS BREWING COMPANY AND SUBSIDIARIES
NOTES TO CONSOLIDATED FINANCIAL STATEMENTS (Continued)
18. Derivative Instruments (Continued)
Canada bond rate was trading at a yield lower than that locked in with the Company’s interest ratelock. This resulted in a loss of $4.0 million on the bond forward transaction. Per FAS 133 accounting,the loss will be amortized over the life of the Canadian issued private placement and will serve toincrease the Company’s effective cost of borrowing by 4.9 basis points compared to the stated couponon the issue.
Simultaneously with the September 22, 2005, U.S. private placement (See Note 13), we enteredinto a cross currency swap transaction for the entire USD $300.0 million issue amount and for thesame maturity. In this transaction we exchanged our USD $300.0 million for a CAD $355.5 millionobligation with a third party. The terms of the transaction are such that the Company will pay interestat a rate of 4.28% to the third party on the amount of CAD $355.5 million and will receive interest ata rate of 4.85% on the USD $300.0 million amount. There was an exchange of principal at theinception of this transaction, and there will be a subsequent exchange of principal at the termination ofthe transaction. We have designated this transaction as a hedge of the variability of the cash flowsassociated with the payment of interest and principal on the USD securities. Consistent with FAS 133accounting, all changes in the value of the transaction due to foreign exchange will be recorded inearnings and will be offset by a revaluation of the associated debt instrument. Changes in the value ofthe transaction due to interest rates will be recorded to other comprehensive income.
As of December 30, 2007, we are a party to other cross currency swaps totaling GBP£530.0 million (USD $774.0 million at the date of entering the transaction). The swaps included aninitial exchange of principal on the settlement date of our 6.375% private placement fixed rate debt(see Note 13) and will require final principal exchange in May 2012. The swaps also call for anexchange of fixed GBP interest payments for fixed USD interest receipts. At the initial principalexchange, we paid USD to a counterparty and received GBP. Upon final exchange, we will provideGBP to the counterparty and receive USD. The cross currency swaps have been designated as cashflow hedges of the changes in value of the future GBP interest and principal receipts that results fromchanges in the USD to GBP exchange rates on an intercompany loan between our Europe subsidiaryand U.S. subsidiary.
We entered into interest rate swap agreements related to our 6.375% fixed rate debt. Theseinterest rate swaps convert $201.2 million notional amount from fixed rates to floating rates and maturein 2012. We will receive fixed USD interest payments semi-annually at a rate of 6.375% per annum andpay a rate to our counterparty based on a credit spread plus the three-month LIBOR rate, therebyexchanging a fixed interest obligation for a floating interest rate obligation. There was no exchange ofprincipal at the inception of the swaps. We designated the interest rate swaps as a fair value hedge ofthe changes in the fair value of the $201.2 million fixed rate debt attributable to changes in the LIBORswap rates.
The BRI joint venture is a party to interest rate swaps, converting CAD $100.0 million notionalamount of the CAD $200.0 million 7.5% fixed rate debt. The interest rate swaps convert the CAD$100.0 million to floating rates and mature in 2011. There was no exchange of principal at theinception of the swaps. During July 2006, we entered into and designated the interest rate swaps as afair value hedge of the changes in the fair value of the CAD $100.0 million fixed rate debt attributableto changes in the LIBOR swap rates. Prior to the inception of this fair value hedge, the interest rateswaps held by BRI were the only Molson Inc. derivative instruments that did not qualify for hedge
140

MOLSON COORS BREWING COMPANY AND SUBSIDIARIES
NOTES TO CONSOLIDATED FINANCIAL STATEMENTS (Continued)
18. Derivative Instruments (Continued)
accounting under SFAS 133. Mark-to-market changes on these interest rate swaps were recorded asinterest expense.
On April 10, 2007, we undertook an internal reorganization resulting in certain transfers andrealignment of assets, liabilities and consolidated subsidiaries. These changes had no impact on ourconsolidated financial statements. Concurrent with the realignment, we entered into several crosscurrency swaps to hedge the foreign currency impact of inter-company British pound (GBP) debt in aCanadian dollar (CAD) functional currency subsidiary. The cross currency swaps are designated as cashflow hedges of forecasted CAD cash flows related to GBP interest and principal payments on the inter-company loans that may fluctuate or be uncertain due to changes in the GBP to CAD exchange rate.The notional amount of the swaps is GBP 530 million. The fair value of the new cross currency swapsdepends on the relationship between GBP and CAD foreign exchange rates and interest rates.Generally, the fair value of the new cross currency swaps will be stated as a liability if CAD strengthensagainst GBP, and will be stated as an asset if CAD weakens against GBP. The net effect of this swapeliminates our external GBP interest expense, replacing it with CAD interest expense.
As of December 30, 2007, $20.9 million of deferred losses on both outstanding and maturedderivatives accumulated in other comprehensive income are expected to be reclassified to earningsduring the next twelve months as a result of expected gains or losses on underlying hedged transactionsalso being recorded in earnings. Actual amounts ultimately reclassified to earnings are dependent onthe applicable rates in effect when derivatives contracts that are currently outstanding mature. As ofDecember 30, 2007, the maximum term over which we are hedging exposures to the variability of cashflows for all forecasted and recorded transactions is 10 years.
19. Accrued expenses and other liabilities
As of
December 30, 2007 December 31, 2006
(In thousands)
Accrued compensation . . . . . . . . . . . . . . . . . . . . . . . . . . . . . . . . . $ 171,034 $ 155,508Accrued excise taxes . . . . . . . . . . . . . . . . . . . . . . . . . . . . . . . . . . . 292,640 295,556Accrued selling and marketing costs . . . . . . . . . . . . . . . . . . . . . . . . 155,173 147,576Accrued brewing operations costs . . . . . . . . . . . . . . . . . . . . . . . . . 341,779 324,601Accrued income taxes payable . . . . . . . . . . . . . . . . . . . . . . . . . . . . — 132,780Other . . . . . . . . . . . . . . . . . . . . . . . . . . . . . . . . . . . . . . . . . . . . . . 228,508 169,385
Accrued expenses and other liabilities . . . . . . . . . . . . . . . . . . . . . $1,189,134 $1,225,406
Accrued brewing operations costs consist of amounts owed for beer raw materials, packagingmaterials, freight charges, utilities, and other manufacturing and distribution costs.
20. Commitments and Contingencies
Letters of Credit
As of December 30, 2007, we had approximately $58.0 million outstanding in letters of credit withfinancial institutions. These letters expire at different points in 2008 and 2009. Approximately$16.7 million of the letters contain a feature that automatically renews the letter for an additional year
141
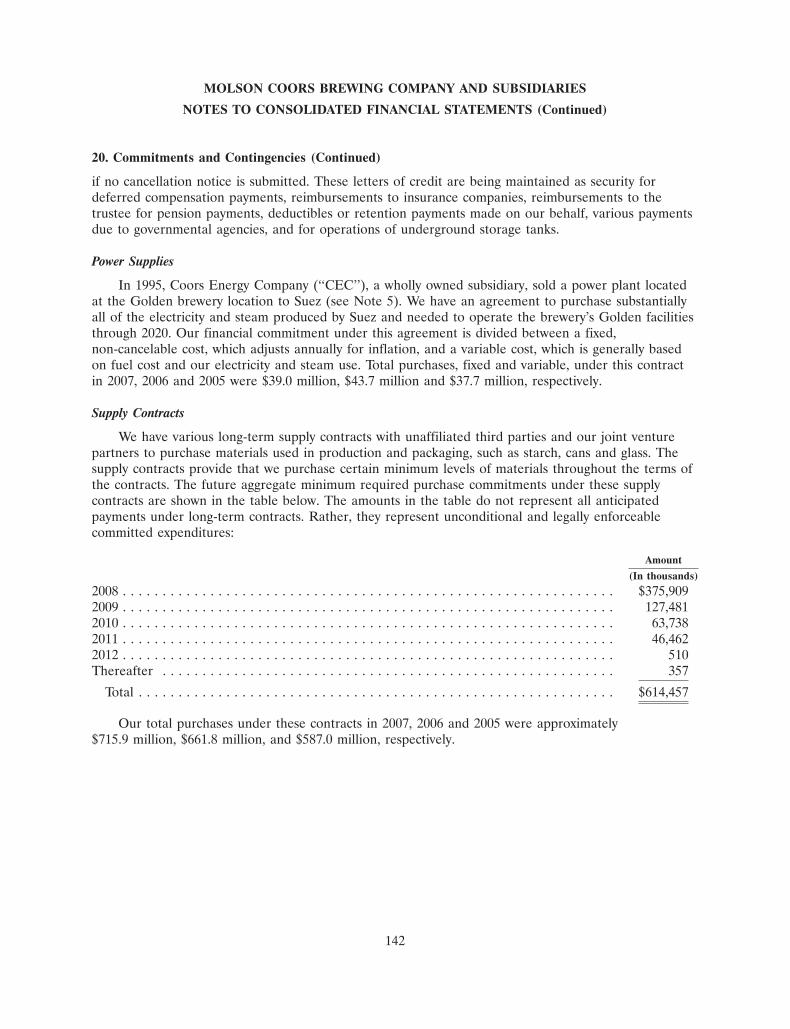
MOLSON COORS BREWING COMPANY AND SUBSIDIARIES
NOTES TO CONSOLIDATED FINANCIAL STATEMENTS (Continued)
20. Commitments and Contingencies (Continued)
if no cancellation notice is submitted. These letters of credit are being maintained as security fordeferred compensation payments, reimbursements to insurance companies, reimbursements to thetrustee for pension payments, deductibles or retention payments made on our behalf, various paymentsdue to governmental agencies, and for operations of underground storage tanks.
Power Supplies
In 1995, Coors Energy Company (‘‘CEC’’), a wholly owned subsidiary, sold a power plant locatedat the Golden brewery location to Suez (see Note 5). We have an agreement to purchase substantiallyall of the electricity and steam produced by Suez and needed to operate the brewery’s Golden facilitiesthrough 2020. Our financial commitment under this agreement is divided between a fixed,non-cancelable cost, which adjusts annually for inflation, and a variable cost, which is generally basedon fuel cost and our electricity and steam use. Total purchases, fixed and variable, under this contractin 2007, 2006 and 2005 were $39.0 million, $43.7 million and $37.7 million, respectively.
Supply Contracts
We have various long-term supply contracts with unaffiliated third parties and our joint venturepartners to purchase materials used in production and packaging, such as starch, cans and glass. Thesupply contracts provide that we purchase certain minimum levels of materials throughout the terms ofthe contracts. The future aggregate minimum required purchase commitments under these supplycontracts are shown in the table below. The amounts in the table do not represent all anticipatedpayments under long-term contracts. Rather, they represent unconditional and legally enforceablecommitted expenditures:
Amount
(In thousands)
2008 . . . . . . . . . . . . . . . . . . . . . . . . . . . . . . . . . . . . . . . . . . . . . . . . . . . . . . . . . . . . . . $375,9092009 . . . . . . . . . . . . . . . . . . . . . . . . . . . . . . . . . . . . . . . . . . . . . . . . . . . . . . . . . . . . . . 127,4812010 . . . . . . . . . . . . . . . . . . . . . . . . . . . . . . . . . . . . . . . . . . . . . . . . . . . . . . . . . . . . . . 63,7382011 . . . . . . . . . . . . . . . . . . . . . . . . . . . . . . . . . . . . . . . . . . . . . . . . . . . . . . . . . . . . . . 46,4622012 . . . . . . . . . . . . . . . . . . . . . . . . . . . . . . . . . . . . . . . . . . . . . . . . . . . . . . . . . . . . . . 510Thereafter . . . . . . . . . . . . . . . . . . . . . . . . . . . . . . . . . . . . . . . . . . . . . . . . . . . . . . . . . 357
Total . . . . . . . . . . . . . . . . . . . . . . . . . . . . . . . . . . . . . . . . . . . . . . . . . . . . . . . . . . . . $614,457
Our total purchases under these contracts in 2007, 2006 and 2005 were approximately$715.9 million, $661.8 million, and $587.0 million, respectively.
142
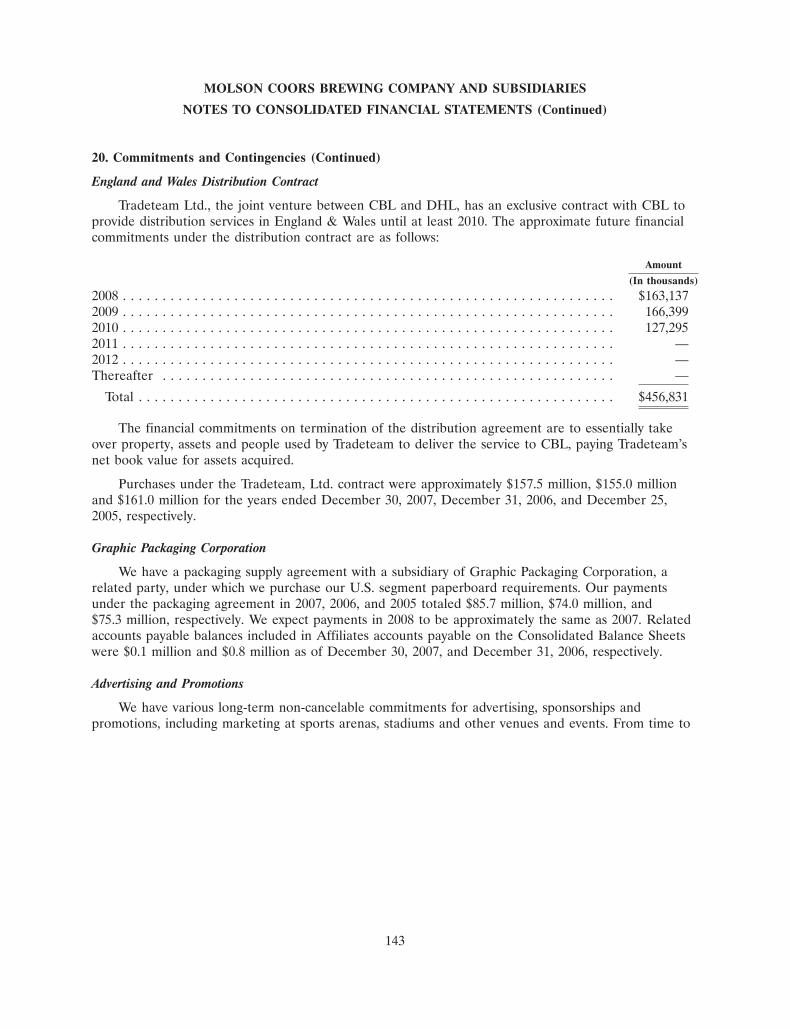
MOLSON COORS BREWING COMPANY AND SUBSIDIARIES
NOTES TO CONSOLIDATED FINANCIAL STATEMENTS (Continued)
20. Commitments and Contingencies (Continued)
England and Wales Distribution Contract
Tradeteam Ltd., the joint venture between CBL and DHL, has an exclusive contract with CBL toprovide distribution services in England & Wales until at least 2010. The approximate future financialcommitments under the distribution contract are as follows:
Amount
(In thousands)
2008 . . . . . . . . . . . . . . . . . . . . . . . . . . . . . . . . . . . . . . . . . . . . . . . . . . . . . . . . . . . . . . $163,1372009 . . . . . . . . . . . . . . . . . . . . . . . . . . . . . . . . . . . . . . . . . . . . . . . . . . . . . . . . . . . . . . 166,3992010 . . . . . . . . . . . . . . . . . . . . . . . . . . . . . . . . . . . . . . . . . . . . . . . . . . . . . . . . . . . . . . 127,2952011 . . . . . . . . . . . . . . . . . . . . . . . . . . . . . . . . . . . . . . . . . . . . . . . . . . . . . . . . . . . . . . —2012 . . . . . . . . . . . . . . . . . . . . . . . . . . . . . . . . . . . . . . . . . . . . . . . . . . . . . . . . . . . . . . —Thereafter . . . . . . . . . . . . . . . . . . . . . . . . . . . . . . . . . . . . . . . . . . . . . . . . . . . . . . . . . —
Total . . . . . . . . . . . . . . . . . . . . . . . . . . . . . . . . . . . . . . . . . . . . . . . . . . . . . . . . . . . . $456,831
The financial commitments on termination of the distribution agreement are to essentially takeover property, assets and people used by Tradeteam to deliver the service to CBL, paying Tradeteam’snet book value for assets acquired.
Purchases under the Tradeteam, Ltd. contract were approximately $157.5 million, $155.0 millionand $161.0 million for the years ended December 30, 2007, December 31, 2006, and December 25,2005, respectively.
Graphic Packaging Corporation
We have a packaging supply agreement with a subsidiary of Graphic Packaging Corporation, arelated party, under which we purchase our U.S. segment paperboard requirements. Our paymentsunder the packaging agreement in 2007, 2006, and 2005 totaled $85.7 million, $74.0 million, and$75.3 million, respectively. We expect payments in 2008 to be approximately the same as 2007. Relatedaccounts payable balances included in Affiliates accounts payable on the Consolidated Balance Sheetswere $0.1 million and $0.8 million as of December 30, 2007, and December 31, 2006, respectively.
Advertising and Promotions
We have various long-term non-cancelable commitments for advertising, sponsorships andpromotions, including marketing at sports arenas, stadiums and other venues and events. From time to
143
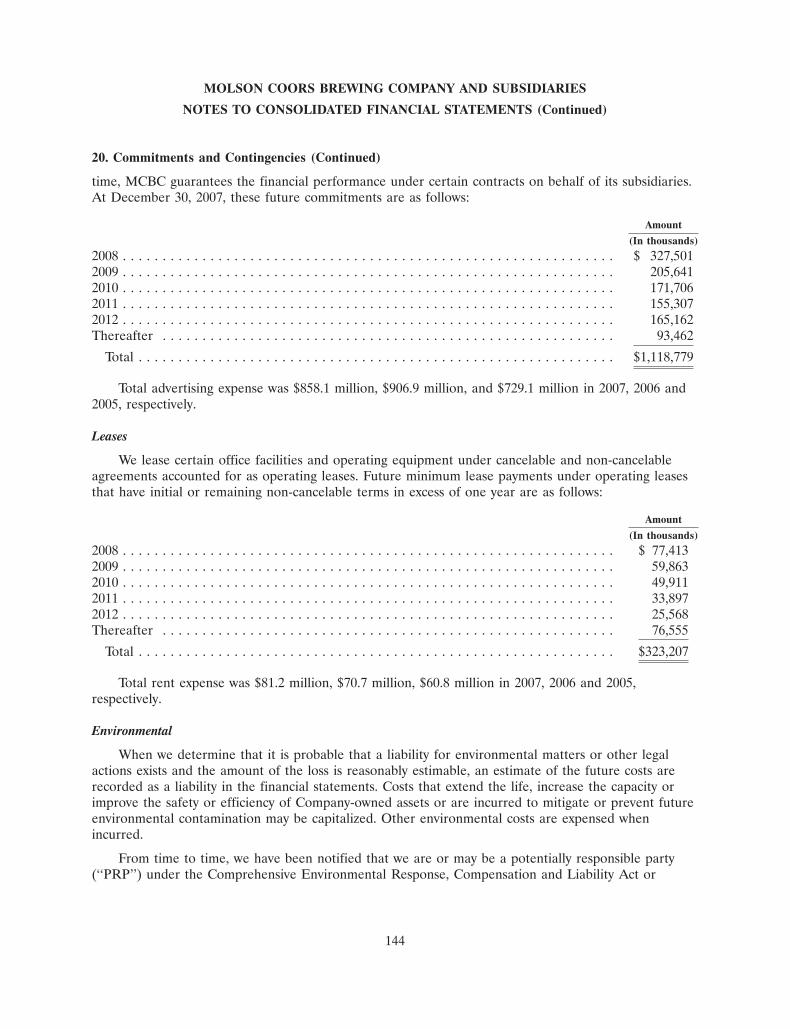
MOLSON COORS BREWING COMPANY AND SUBSIDIARIES
NOTES TO CONSOLIDATED FINANCIAL STATEMENTS (Continued)
20. Commitments and Contingencies (Continued)
time, MCBC guarantees the financial performance under certain contracts on behalf of its subsidiaries.At December 30, 2007, these future commitments are as follows:
Amount
(In thousands)
2008 . . . . . . . . . . . . . . . . . . . . . . . . . . . . . . . . . . . . . . . . . . . . . . . . . . . . . . . . . . . . . . $ 327,5012009 . . . . . . . . . . . . . . . . . . . . . . . . . . . . . . . . . . . . . . . . . . . . . . . . . . . . . . . . . . . . . . 205,6412010 . . . . . . . . . . . . . . . . . . . . . . . . . . . . . . . . . . . . . . . . . . . . . . . . . . . . . . . . . . . . . . 171,7062011 . . . . . . . . . . . . . . . . . . . . . . . . . . . . . . . . . . . . . . . . . . . . . . . . . . . . . . . . . . . . . . 155,3072012 . . . . . . . . . . . . . . . . . . . . . . . . . . . . . . . . . . . . . . . . . . . . . . . . . . . . . . . . . . . . . . 165,162Thereafter . . . . . . . . . . . . . . . . . . . . . . . . . . . . . . . . . . . . . . . . . . . . . . . . . . . . . . . . . 93,462
Total . . . . . . . . . . . . . . . . . . . . . . . . . . . . . . . . . . . . . . . . . . . . . . . . . . . . . . . . . . . . $1,118,779
Total advertising expense was $858.1 million, $906.9 million, and $729.1 million in 2007, 2006 and2005, respectively.
Leases
We lease certain office facilities and operating equipment under cancelable and non-cancelableagreements accounted for as operating leases. Future minimum lease payments under operating leasesthat have initial or remaining non-cancelable terms in excess of one year are as follows:
Amount
(In thousands)
2008 . . . . . . . . . . . . . . . . . . . . . . . . . . . . . . . . . . . . . . . . . . . . . . . . . . . . . . . . . . . . . . $ 77,4132009 . . . . . . . . . . . . . . . . . . . . . . . . . . . . . . . . . . . . . . . . . . . . . . . . . . . . . . . . . . . . . . 59,8632010 . . . . . . . . . . . . . . . . . . . . . . . . . . . . . . . . . . . . . . . . . . . . . . . . . . . . . . . . . . . . . . 49,9112011 . . . . . . . . . . . . . . . . . . . . . . . . . . . . . . . . . . . . . . . . . . . . . . . . . . . . . . . . . . . . . . 33,8972012 . . . . . . . . . . . . . . . . . . . . . . . . . . . . . . . . . . . . . . . . . . . . . . . . . . . . . . . . . . . . . . 25,568Thereafter . . . . . . . . . . . . . . . . . . . . . . . . . . . . . . . . . . . . . . . . . . . . . . . . . . . . . . . . . 76,555
Total . . . . . . . . . . . . . . . . . . . . . . . . . . . . . . . . . . . . . . . . . . . . . . . . . . . . . . . . . . . . $323,207
Total rent expense was $81.2 million, $70.7 million, $60.8 million in 2007, 2006 and 2005,respectively.
Environmental
When we determine that it is probable that a liability for environmental matters or other legalactions exists and the amount of the loss is reasonably estimable, an estimate of the future costs arerecorded as a liability in the financial statements. Costs that extend the life, increase the capacity orimprove the safety or efficiency of Company-owned assets or are incurred to mitigate or prevent futureenvironmental contamination may be capitalized. Other environmental costs are expensed whenincurred.
From time to time, we have been notified that we are or may be a potentially responsible party(‘‘PRP’’) under the Comprehensive Environmental Response, Compensation and Liability Act or
144
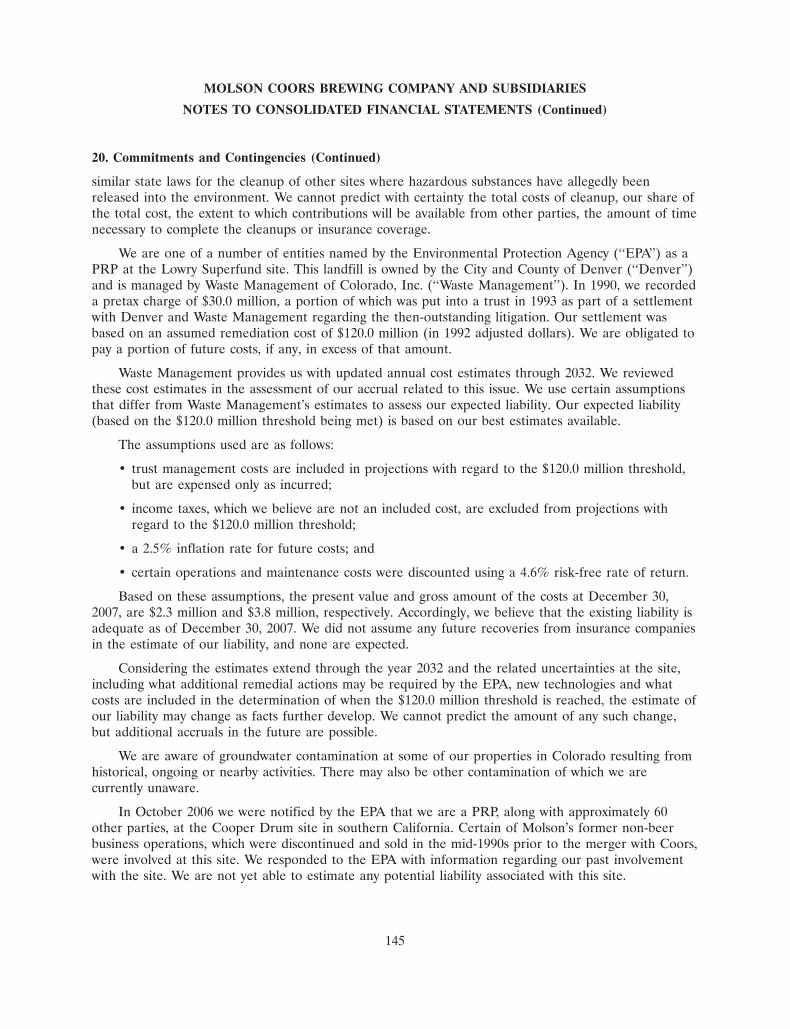
MOLSON COORS BREWING COMPANY AND SUBSIDIARIES
NOTES TO CONSOLIDATED FINANCIAL STATEMENTS (Continued)
20. Commitments and Contingencies (Continued)
similar state laws for the cleanup of other sites where hazardous substances have allegedly beenreleased into the environment. We cannot predict with certainty the total costs of cleanup, our share ofthe total cost, the extent to which contributions will be available from other parties, the amount of timenecessary to complete the cleanups or insurance coverage.
We are one of a number of entities named by the Environmental Protection Agency (‘‘EPA’’) as aPRP at the Lowry Superfund site. This landfill is owned by the City and County of Denver (‘‘Denver’’)and is managed by Waste Management of Colorado, Inc. (‘‘Waste Management’’). In 1990, we recordeda pretax charge of $30.0 million, a portion of which was put into a trust in 1993 as part of a settlementwith Denver and Waste Management regarding the then-outstanding litigation. Our settlement wasbased on an assumed remediation cost of $120.0 million (in 1992 adjusted dollars). We are obligated topay a portion of future costs, if any, in excess of that amount.
Waste Management provides us with updated annual cost estimates through 2032. We reviewedthese cost estimates in the assessment of our accrual related to this issue. We use certain assumptionsthat differ from Waste Management’s estimates to assess our expected liability. Our expected liability(based on the $120.0 million threshold being met) is based on our best estimates available.
The assumptions used are as follows:
• trust management costs are included in projections with regard to the $120.0 million threshold,but are expensed only as incurred;
• income taxes, which we believe are not an included cost, are excluded from projections withregard to the $120.0 million threshold;
• a 2.5% inflation rate for future costs; and
• certain operations and maintenance costs were discounted using a 4.6% risk-free rate of return.
Based on these assumptions, the present value and gross amount of the costs at December 30,2007, are $2.3 million and $3.8 million, respectively. Accordingly, we believe that the existing liability isadequate as of December 30, 2007. We did not assume any future recoveries from insurance companiesin the estimate of our liability, and none are expected.
Considering the estimates extend through the year 2032 and the related uncertainties at the site,including what additional remedial actions may be required by the EPA, new technologies and whatcosts are included in the determination of when the $120.0 million threshold is reached, the estimate ofour liability may change as facts further develop. We cannot predict the amount of any such change,but additional accruals in the future are possible.
We are aware of groundwater contamination at some of our properties in Colorado resulting fromhistorical, ongoing or nearby activities. There may also be other contamination of which we arecurrently unaware.
In October 2006 we were notified by the EPA that we are a PRP, along with approximately 60other parties, at the Cooper Drum site in southern California. Certain of Molson’s former non-beerbusiness operations, which were discontinued and sold in the mid-1990s prior to the merger with Coors,were involved at this site. We responded to the EPA with information regarding our past involvementwith the site. We are not yet able to estimate any potential liability associated with this site.
145

MOLSON COORS BREWING COMPANY AND SUBSIDIARIES
NOTES TO CONSOLIDATED FINANCIAL STATEMENTS (Continued)
20. Commitments and Contingencies (Continued)
While we cannot predict the eventual aggregate cost for environmental and related matters inwhich we are currently involved, we believe that any payments, if required, for these matters would bemade over a period of time in amounts that would not be material in any one year to our operatingresults, cash flows or our financial or competitive position. We believe adequate reserves have beenprovided for losses that are probable and estimable.
Indemnity Obligations—Sale of Kaiser
As discussed in Note 6, we sold our entire equity interest in Kaiser during 2006 to FEMSA. Theterms of the sale agreement require us to indemnify FEMSA for certain exposures related to tax, civil,and labor contingencies arising prior to FEMSA’s purchase of Kaiser. First, we provided an indemnityfor losses Kaiser may incur with respect to tax claims associated with certain previously utilizedpurchased tax credits. The maximum potential claims amount in this regard, including estimatedaccumulated legal, penalties and interest, was $382.0 million as of December 30, 2007. This amountincreased by $135.0 million from 2006, due primarily to an increase of $85.7 million related toaccumulated legal, penalty, and, interest fees. The remaining increase of $49.3 million is the result ofthe weakening USD relative to the Brazilian Real. Our estimate of the fair value of the indemnityliability associated with the purchased tax credits as of December 30, 2007 was $116.8 million,$4.8 million of which was classified as a current liability and $112.0 million of which was classified asnon-current. Our fair value estimates consider a number of scenarios for the ultimate resolution ofthese issues, the probabilities of which are influenced not only by legal developments in Brazil but alsoby management’s intentions with regard to various alternatives that could present themselves leading tothe ultimate resolution of these issues. Our indemnity obligations (at estimated fair value) related topreviously purchased tax credits increased by $39.1 million during 2007 due primarily to an increase inaccumulated legal, penalty, and interest fees. The liabilities are also impacted by changes in estimatesregarding amounts that could be paid, the timing of such payments and adjustments to the probabilitiesassigned to various scenarios.
We also provided indemnity related to all other tax, civil, and labor contingencies existing as of thedate of sale. In this regard, however, FEMSA assumed their full share of all of these contingentliabilities that had been previously recorded and disclosed by us prior to the sale on January 13, 2006.However, we may have to provide indemnity to FEMSA if those contingencies settle at amountsgreater than those amounts previously recorded or disclosed by us. We will be able to offset anyindemnity exposures in these circumstances with amounts that settle favorably to amounts previouslyrecorded. Our exposure related to these indemnity claims is capped at the amount of the sales price ofthe 68% equity interest of Kaiser, which was $68.0 million. As a result of these contract provisions, ourfair value estimates include not only probability-weighted potential cash outflows associated withindemnity provisions, but also probability-weighted cash inflows that could result from favorablesettlements, which could occur through negotiation or settlement programs that could arise from thefederal or any of the various state governments in Brazil. The recorded fair value of the total tax, civil,and labor indemnity liability was $38.2 million as of December 30, 2007, $25.4 million of which isclassified as a current liability and $12.8 million of which is classified as non-current.
Future settlement procedures and related negotiation activities associated with these contingenciesare largely outside of our control. The sale agreement requires annual cash settlements relating to thetax, civil, and labor indemnities, the first of which we expect to occur during the first quarter of 2008.Indemnity obligations related to purchased tax credits must be settled upon notification of FEMSA’s
146

MOLSON COORS BREWING COMPANY AND SUBSIDIARIES
NOTES TO CONSOLIDATED FINANCIAL STATEMENTS (Continued)
20. Commitments and Contingencies (Continued)
settlement. Due to the uncertainty involved with the ultimate outcome and timing of thesecontingencies, significant adjustments to the carrying values of the indemnity obligations have beenrecorded to date, and additional future adjustments may be required. These liabilities are denominatedin Brazilian Reals and have been stated at present value and will, therefore, be subject in the future toforeign exchange gains or losses and to accretion cost, both of which will be recognized in thediscontinued operations section of the statement of operations.
The table below provides a summary of contingency reserve balances from December 25, 2005,through December 30, 2007:
Purchased tax credits Tax, civil and labor Total indemnityindemnity reserve indemnity reserve reserves
(In thousands)
Balance at December 25, 2005 . . . . . . . . . . . . . . $ — $ — $ —Provision upon sale of 68% ownership . . . . . . . 52,397 42,910 95,307Exercise of put option on remaining ownership
interest . . . . . . . . . . . . . . . . . . . . . . . . . . . . 12,546 5,470 18,016Changes in liability estimates . . . . . . . . . . . . . . 12,772 (15,120) (2,348)
Balance at December 31, 2006 . . . . . . . . . . . . . . $ 77,715 $ 33,260 $110,975Adjustments to indemnity liabilities due to
changes in estimates and accretion expense . . 21,056 (1,257) 19,799Foreign exchange impact . . . . . . . . . . . . . . . . . 18,001 6,236 24,237
Balance at December 30, 2007 . . . . . . . . . . . . . . $116,772 $ 38,239 $155,011
Current liabilities of discontinued operations include current tax liabilities of $10.6 million and$9.0 million as of December 30, 2007 and December 31, 2006, respectively. Included in current andnon-current assets of discontinued operations as of December 30, 2007 are $5.5 million and$5.1 million, respectively, of deferred tax assets associated with the indemnity liabilities.
Montreal Canadiens
Molson Canada owns a 19.9% common ownership interest in the Montreal Canadiens professionalhockey club (the ‘‘Club’’) and, prior to June 30, 2006, Molson also owned a preferred interest. OnJune 30, 2006, entities which control and own a majority of the Club purchased the preferred equityheld by Molson Canada. Subsequent to the transaction, Molson Canada still retains 19.9% commonequity interest in the Club, as well as Board representation at the Club and related entities.
Also, coincident with the disposition of our preferred interest, Molson Canada was released from adirect guarantee of the Club’s debt financing. The shareholders of the Club (the majority owner andMolson Canada) and the National Hockey League (‘‘NHL’’) are parties to a consent agreement, whichrequires the purchaser and Molson to abide by funding requirements included in the terms of theshareholders’ agreement. In addition, Molson Canada continues to be a guarantor of the majorityowner’s obligations under a land lease. We have evaluated our risk exposure related to these financialguarantees and recorded the fair values of these guarantees accordingly.
147
MOLSON COORS BREWING COMPANY AND SUBSIDIARIES
NOTES TO CONSOLIDATED FINANCIAL STATEMENTS (Continued)
20. Commitments and Contingencies (Continued)
Litigation and Other Disputes
Beginning in May 2005, several purported shareholder class actions were filed in the United Statesand Canada, including Federal courts in Delaware and Colorado and provincial courts in Ontario andQuebec, alleging, among other things, that the Company and its affiliated entities, includingMolson Inc., and certain officers and directors misled stockholders by failing to disclose first quarter(January-March) 2005 U.S. business trends prior to the Merger vote in January 2005. The Coloradocase has since been transferred to Delaware and consolidated with those cases. One of the lawsuitsfiled in Delaware federal court also alleges that the Company failed to comply with U.S. GAAP in itsfilings with the U.S. Securities and Exchange Commission. The Quebec Superior Court heardarguments in October 2007 regarding the plaintiffs’ motion to authorize a class in that case. Weopposed the motion. We expect a written decision in several months. The Company believes theselawsuits are without merit and will vigorously defend them.
MCBC and many other brewers and distilled spirits manufacturers were sued in various courtsregarding advertising practices and underage consumption. All of the suits were brought by the samelaw firm and allege that each defendant intentionally marketed its products to ‘‘children and otherunderage consumers.’’ In essence, each suit sought, on behalf of an undefined class of parents andguardians, an injunction and unspecified money damages. In each suit, the manufacturers advancedmotions for dismissal to the courts. All of the lawsuits have been dismissed with prejudice.
We are involved in other disputes and legal actions arising in the ordinary course of our business.While it is not feasible to predict or determine the outcome of these proceedings, in our opinion, basedon a review with legal counsel, none of these disputes and legal actions is expected to have a materialimpact on our consolidated financial position, results of operations or cash flows. However, litigation issubject to inherent uncertainties, and an adverse result in these or other matters, for example, includingthe above-described advertising practices case, may arise from time to time that may harm our business.
Insurance
We are self-insured for certain insurable risks consisting primarily of employee health insuranceprograms, as well as workers’ compensation, general liability, automobile liability, and propertyinsurance deductibles or retentions. During 2005 we fully insured future risks for long-term disability,and, in most states, workers’ compensation, but maintained a self-insured position for workers’compensation for certain self-insured states and for claims incurred prior to the inception of theinsurance coverage in Colorado in 1997. Our reserves accrued at December 30, 2007, andDecember 31, 2006, were $15.4 million and $18.5 million, respectively.
21. MillerCoors joint venture
On October 9, 2007, MCBC and SABMiller plc (the investing companies) announced that theysigned a letter of intent to combine the U.S. and Puerto Rico operations of their respectivesubsidiaries, Coors Brewing Company and Miller Brewing Company, in a joint venture (‘‘MillerCoors’’).Assuming completion of the transaction, MillerCoors will have annual pro forma combined beer salesof 69 million U.S. barrels (81 million hectoliters) and pro forma net revenues of approximately$6.6 billion. Molson Coors and SABMiller expect the transaction to generate approximately$500 million in annual cost synergies to be delivered in full by the third full financial year of combined
148
MOLSON COORS BREWING COMPANY AND SUBSIDIARIES
NOTES TO CONSOLIDATED FINANCIAL STATEMENTS (Continued)
21. MillerCoors joint venture (Continued)
operations. The parties signed a definitive joint venture agreement on December 20, 2007 and expectthe transaction to close in mid-2008.
Each party will contribute its business and related operating assets and certain liabilities into anoperating joint venture company. The percentage interests in the profits of the joint venture will be58% for SABMiller plc and 42% for MCBC. Voting interests will be shared 50%-50%, and eachinvesting company will have equal board representation within the joint venture company. Each partyto the joint venture has agreed not to transfer its economic or voting interests in the joint venture for aperiod of five years, and certain rights of first refusal will apply to any subsequent assignment of suchinterests.
The results and financial position of our U.S. segment will, in all material respects, bede-consolidated upon contribution to the joint venture, and our interest in the new combinedoperations will be accounted for by us under the equity method of accounting.
The proposed joint venture transaction has been submitted for antitrust review and clearance bythe U.S. Department of Justice under the Hart-Scott-Rodino Act of 1976, as amended, and to certainother applicable governmental authorities.
22. Subsequent Events
The tender for and repurchase of 6.375% Senior Notes due 2012 (‘‘tender offer’’)
On February 7, 2008, we announced a tender for and repurchase of any and all principal amountof our remaining 6.375% $225 million Senior Notes due 2012, with the tender period running throughFebruary 14, 2008. The amount actually repurchased was $180.4 million. The net costs of $11.7 millionrelated to this extinguishment of debt and termination of related interest rate swaps will be recorded inthe first quarter of 2008. The debt extinguishment was funded by existing cash resources.
Outsourcing Agreement
During the first quarter of 2008, we signed a contract with a third party service provider tooutsource a significant portion of our general and administrative back office functions in all of ouroperating segments and in our corporate office. This outsourcing initiative is a key component of ourResources for Growth cost reduction program. We expect to incur both transition costs and one-timeemployee termination costs associated during 2008 with this outsourcing initiative.
23. Supplemental Guarantor Information
MCBC (Parent Guarantor and 2007 Issuer) issued $575.0 million of 2.5% Convertible SeniorNotes due July 30, 2013 in a registered offering on June 15, 2007 (see Note 10). The convertible notesare guaranteed on a senior unsecured basis by CBC (2002 Issuer), Molson Coors International, LP andMolson Coors Capital Finance ULC (together the 2005 Issuers) and certain significant subsidiaries(Subsidiary Guarantors).
On May 7, 2002, the 2002 Issuer completed a public offering of $850.0 million principal amount of6.375% Senior notes due 2012. During the third quarter of 2007, $625.0 million of the Senior notes wasextinguished by the proceeds received from the 2.5% Convertible Senior Notes issued June 15, 2007and cash on hand. The remaining outstanding Senior notes are guaranteed on a senior and unsecured
149
MOLSON COORS BREWING COMPANY AND SUBSIDIARIES
NOTES TO CONSOLIDATED FINANCIAL STATEMENTS (Continued)
23. Supplemental Guarantor Information (Continued)
basis by the Parent Guarantor and 2007 Issuer, 2005 Issuers and Subsidiary Guarantors. The guaranteesare full and unconditional and joint and several.
On September 22, 2005, the 2005 Issuers completed a public offering of $1.1 billion principalamount of Senior notes composed of USD $300 million 4.85% notes due 2010 and CAD $900.0 million5.00% notes due 2015. The notes were issued with registration rights and are guaranteed on a seniorand unsecured basis by Parent Guarantor and 2007 Issuer, 2002 Issuer and Subsidiary Guarantors. Theguarantees are full and unconditional and joint and several. Funds necessary to meet the 2005 Issuers’debt service obligations are provided in large part by distributions or advances from MCBC’s othersubsidiaries, including Molson, a non-guarantor. Under certain circumstances, contractual and legalrestrictions, as well as our financial condition and operating requirements, could limit the 2005 Issuersability to obtain cash for the purpose of meeting its debt service obligation, including the payment ofprincipal and interest on the notes.
On April 10, 2007, we undertook an internal reorganization resulting in certain transfers andrealignment of assets, liabilities and subsidiaries. As a result of these changes, as well as amendmentsto the indentures covered, the $1.1 billion senior notes issued in 2005 are now also a liability of a newsubsidiary, Molson Coors International, LP. The internal reorganization changed the legal structure ofthe guarantees, mainly affecting the presentation of the 2002 Issuer, the 2005 Issuers, SubsidiaryGuarantors, and Subsidiary Non-Guarantors. While there were no significant changes with regard tothe status of any entity as a guarantor or non-guarantor, the internal ownership changes resulted in ourCanadian and U.K. businesses, which were formally owned by 2002 Issuer, now being majority-ownedby a 2005 Issuer. Prior period amounts have not been restated to reflect the new ownership structurewhich did not exist in prior periods. Any changes to the status of a subsidiary as a guarantor ornon-guarantor were not material.
The following information sets forth Condensed Consolidating Statements of Operations for theyears ended December 30, 2007, December 31, 2006, and December 25, 2005, CondensedConsolidating Balance Sheets as of December 30, 2007, and December 31, 2006, and CondensedConsolidating Statements of Cash Flows for the years ended December 30, 2007, December 31, 2006,and December 25, 2005. Investments in subsidiaries are accounted for on the equity method;accordingly, entries necessary to consolidate the Parent Guarantor, the Issuers and all of oursubsidiaries are reflected in the eliminations column. In the opinion of management, separate completefinancial statements of the Issuers and the Subsidiary Guarantors would not provide additional materialinformation that would be useful in assessing their financial composition.
Consolidated stockholders’ equity is equal to that of MCBC, which is the Parent Guarantor and2007 Issuer, and of Molson Coors Canada, Inc., which is a Subsidiary Non-Guarantor. Molson CoorsCanada, Inc. is the issuer of exchangeable shares, which former Molson shareholders received in theMerger.
150
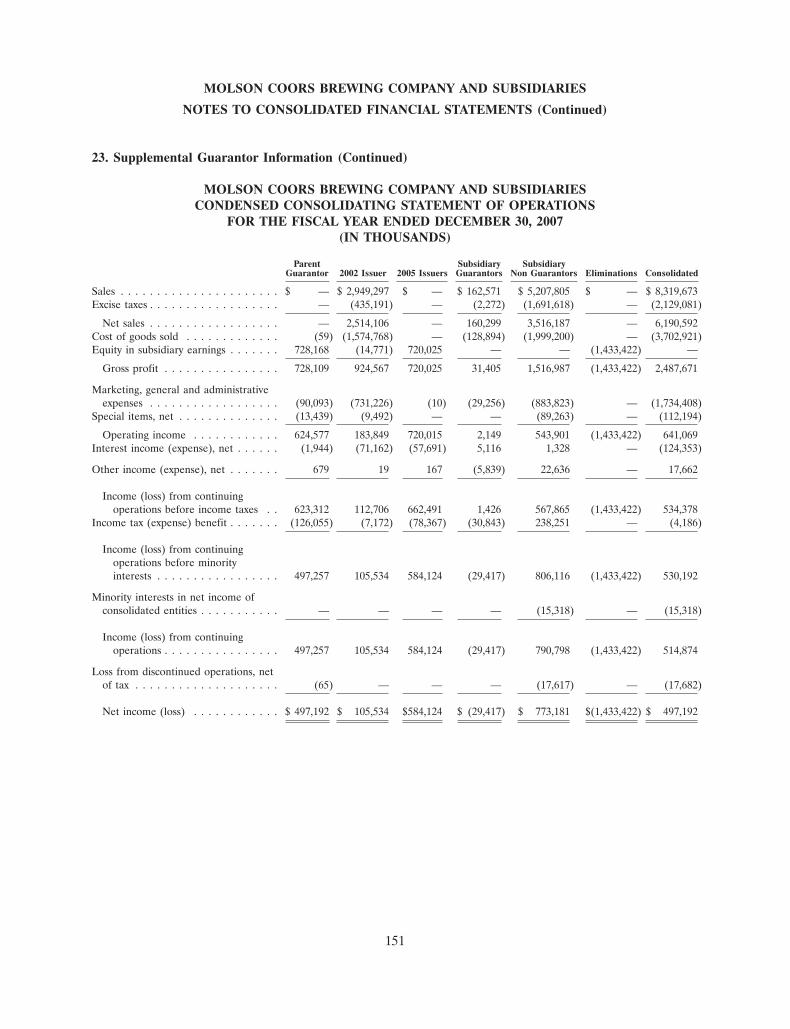
MOLSON COORS BREWING COMPANY AND SUBSIDIARIES
NOTES TO CONSOLIDATED FINANCIAL STATEMENTS (Continued)
23. Supplemental Guarantor Information (Continued)
MOLSON COORS BREWING COMPANY AND SUBSIDIARIESCONDENSED CONSOLIDATING STATEMENT OF OPERATIONS
FOR THE FISCAL YEAR ENDED DECEMBER 30, 2007(IN THOUSANDS)
Parent Subsidiary SubsidiaryGuarantor 2002 Issuer 2005 Issuers Guarantors Non Guarantors Eliminations Consolidated
Sales . . . . . . . . . . . . . . . . . . . . . . $ — $ 2,949,297 $ — $ 162,571 $ 5,207,805 $ — $ 8,319,673Excise taxes . . . . . . . . . . . . . . . . . . — (435,191) — (2,272) (1,691,618) — (2,129,081)
Net sales . . . . . . . . . . . . . . . . . . — 2,514,106 — 160,299 3,516,187 — 6,190,592Cost of goods sold . . . . . . . . . . . . . (59) (1,574,768) — (128,894) (1,999,200) — (3,702,921)Equity in subsidiary earnings . . . . . . . 728,168 (14,771) 720,025 — — (1,433,422) —
Gross profit . . . . . . . . . . . . . . . . 728,109 924,567 720,025 31,405 1,516,987 (1,433,422) 2,487,671
Marketing, general and administrativeexpenses . . . . . . . . . . . . . . . . . . (90,093) (731,226) (10) (29,256) (883,823) — (1,734,408)
Special items, net . . . . . . . . . . . . . . (13,439) (9,492) — — (89,263) — (112,194)
Operating income . . . . . . . . . . . . 624,577 183,849 720,015 2,149 543,901 (1,433,422) 641,069Interest income (expense), net . . . . . . (1,944) (71,162) (57,691) 5,116 1,328 — (124,353)
Other income (expense), net . . . . . . . 679 19 167 (5,839) 22,636 — 17,662
Income (loss) from continuingoperations before income taxes . . 623,312 112,706 662,491 1,426 567,865 (1,433,422) 534,378
Income tax (expense) benefit . . . . . . . (126,055) (7,172) (78,367) (30,843) 238,251 — (4,186)
Income (loss) from continuingoperations before minorityinterests . . . . . . . . . . . . . . . . . 497,257 105,534 584,124 (29,417) 806,116 (1,433,422) 530,192
Minority interests in net income ofconsolidated entities . . . . . . . . . . . — — — — (15,318) — (15,318)
Income (loss) from continuingoperations . . . . . . . . . . . . . . . . 497,257 105,534 584,124 (29,417) 790,798 (1,433,422) 514,874
Loss from discontinued operations, netof tax . . . . . . . . . . . . . . . . . . . . (65) — — — (17,617) — (17,682)
Net income (loss) . . . . . . . . . . . . $ 497,192 $ 105,534 $584,124 $ (29,417) $ 773,181 $(1,433,422) $ 497,192
151
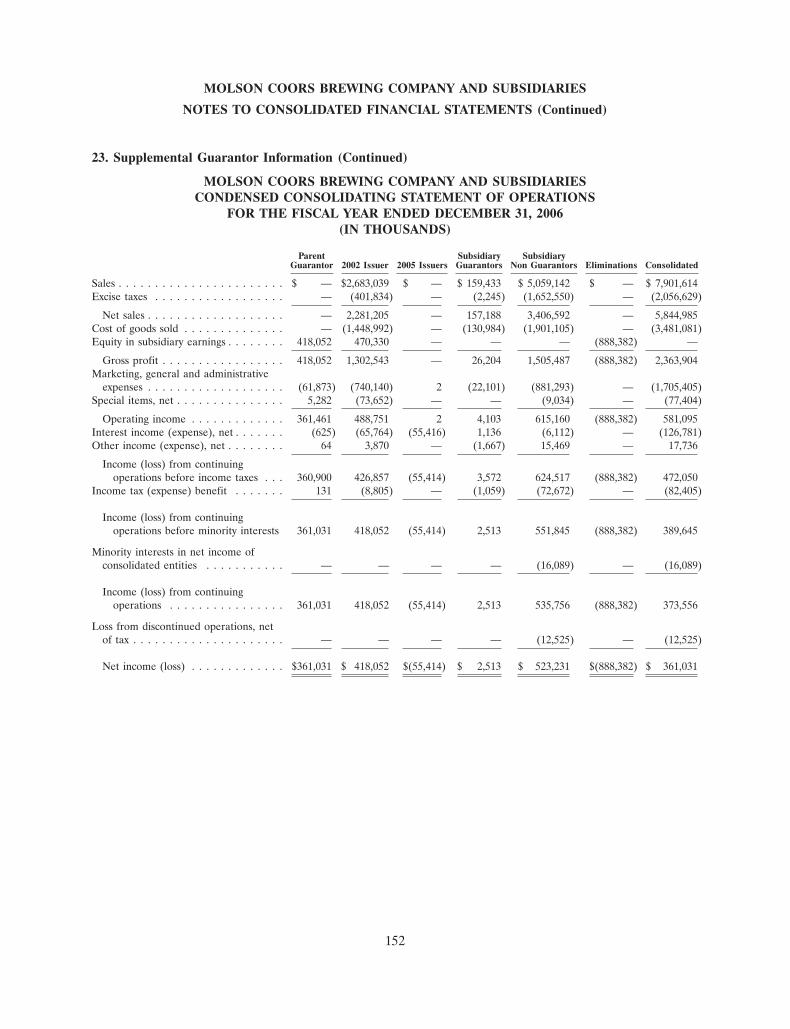
MOLSON COORS BREWING COMPANY AND SUBSIDIARIES
NOTES TO CONSOLIDATED FINANCIAL STATEMENTS (Continued)
23. Supplemental Guarantor Information (Continued)
MOLSON COORS BREWING COMPANY AND SUBSIDIARIESCONDENSED CONSOLIDATING STATEMENT OF OPERATIONS
FOR THE FISCAL YEAR ENDED DECEMBER 31, 2006(IN THOUSANDS)
Parent Subsidiary SubsidiaryGuarantor 2002 Issuer 2005 Issuers Guarantors Non Guarantors Eliminations Consolidated
Sales . . . . . . . . . . . . . . . . . . . . . . . $ — $2,683,039 $ — $ 159,433 $ 5,059,142 $ — $ 7,901,614Excise taxes . . . . . . . . . . . . . . . . . . — (401,834) — (2,245) (1,652,550) — (2,056,629)
Net sales . . . . . . . . . . . . . . . . . . . — 2,281,205 — 157,188 3,406,592 — 5,844,985Cost of goods sold . . . . . . . . . . . . . . — (1,448,992) — (130,984) (1,901,105) — (3,481,081)Equity in subsidiary earnings . . . . . . . . 418,052 470,330 — — — (888,382) —
Gross profit . . . . . . . . . . . . . . . . . 418,052 1,302,543 — 26,204 1,505,487 (888,382) 2,363,904Marketing, general and administrative
expenses . . . . . . . . . . . . . . . . . . . (61,873) (740,140) 2 (22,101) (881,293) — (1,705,405)Special items, net . . . . . . . . . . . . . . . 5,282 (73,652) — — (9,034) — (77,404)
Operating income . . . . . . . . . . . . . 361,461 488,751 2 4,103 615,160 (888,382) 581,095Interest income (expense), net . . . . . . . (625) (65,764) (55,416) 1,136 (6,112) — (126,781)Other income (expense), net . . . . . . . . 64 3,870 — (1,667) 15,469 — 17,736
Income (loss) from continuingoperations before income taxes . . . 360,900 426,857 (55,414) 3,572 624,517 (888,382) 472,050
Income tax (expense) benefit . . . . . . . 131 (8,805) — (1,059) (72,672) — (82,405)
Income (loss) from continuingoperations before minority interests 361,031 418,052 (55,414) 2,513 551,845 (888,382) 389,645
Minority interests in net income ofconsolidated entities . . . . . . . . . . . — — — — (16,089) — (16,089)
Income (loss) from continuingoperations . . . . . . . . . . . . . . . . 361,031 418,052 (55,414) 2,513 535,756 (888,382) 373,556
Loss from discontinued operations, netof tax . . . . . . . . . . . . . . . . . . . . . — — — — (12,525) — (12,525)
Net income (loss) . . . . . . . . . . . . . $361,031 $ 418,052 $(55,414) $ 2,513 $ 523,231 $(888,382) $ 361,031
152
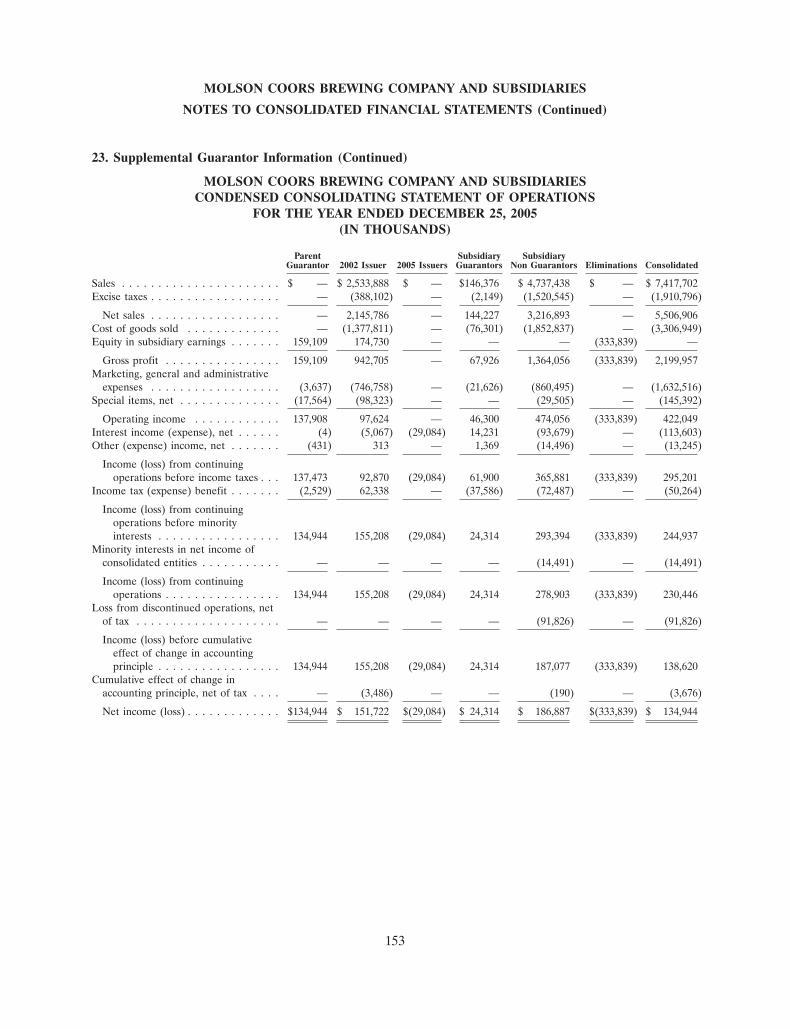
MOLSON COORS BREWING COMPANY AND SUBSIDIARIES
NOTES TO CONSOLIDATED FINANCIAL STATEMENTS (Continued)
23. Supplemental Guarantor Information (Continued)
MOLSON COORS BREWING COMPANY AND SUBSIDIARIESCONDENSED CONSOLIDATING STATEMENT OF OPERATIONS
FOR THE YEAR ENDED DECEMBER 25, 2005(IN THOUSANDS)
Parent Subsidiary SubsidiaryGuarantor 2002 Issuer 2005 Issuers Guarantors Non Guarantors Eliminations Consolidated
Sales . . . . . . . . . . . . . . . . . . . . . . $ — $ 2,533,888 $ — $146,376 $ 4,737,438 $ — $ 7,417,702Excise taxes . . . . . . . . . . . . . . . . . . — (388,102) — (2,149) (1,520,545) — (1,910,796)
Net sales . . . . . . . . . . . . . . . . . . — 2,145,786 — 144,227 3,216,893 — 5,506,906Cost of goods sold . . . . . . . . . . . . . — (1,377,811) — (76,301) (1,852,837) — (3,306,949)Equity in subsidiary earnings . . . . . . . 159,109 174,730 — — — (333,839) —
Gross profit . . . . . . . . . . . . . . . . 159,109 942,705 — 67,926 1,364,056 (333,839) 2,199,957Marketing, general and administrative
expenses . . . . . . . . . . . . . . . . . . (3,637) (746,758) — (21,626) (860,495) — (1,632,516)Special items, net . . . . . . . . . . . . . . (17,564) (98,323) — — (29,505) — (145,392)
Operating income . . . . . . . . . . . . 137,908 97,624 — 46,300 474,056 (333,839) 422,049Interest income (expense), net . . . . . . (4) (5,067) (29,084) 14,231 (93,679) — (113,603)Other (expense) income, net . . . . . . . (431) 313 — 1,369 (14,496) — (13,245)
Income (loss) from continuingoperations before income taxes . . . 137,473 92,870 (29,084) 61,900 365,881 (333,839) 295,201
Income tax (expense) benefit . . . . . . . (2,529) 62,338 — (37,586) (72,487) — (50,264)
Income (loss) from continuingoperations before minorityinterests . . . . . . . . . . . . . . . . . 134,944 155,208 (29,084) 24,314 293,394 (333,839) 244,937
Minority interests in net income ofconsolidated entities . . . . . . . . . . . — — — — (14,491) — (14,491)
Income (loss) from continuingoperations . . . . . . . . . . . . . . . . 134,944 155,208 (29,084) 24,314 278,903 (333,839) 230,446
Loss from discontinued operations, netof tax . . . . . . . . . . . . . . . . . . . . — — — — (91,826) — (91,826)
Income (loss) before cumulativeeffect of change in accountingprinciple . . . . . . . . . . . . . . . . . 134,944 155,208 (29,084) 24,314 187,077 (333,839) 138,620
Cumulative effect of change inaccounting principle, net of tax . . . . — (3,486) — — (190) — (3,676)
Net income (loss) . . . . . . . . . . . . . $134,944 $ 151,722 $(29,084) $ 24,314 $ 186,887 $(333,839) $ 134,944
153
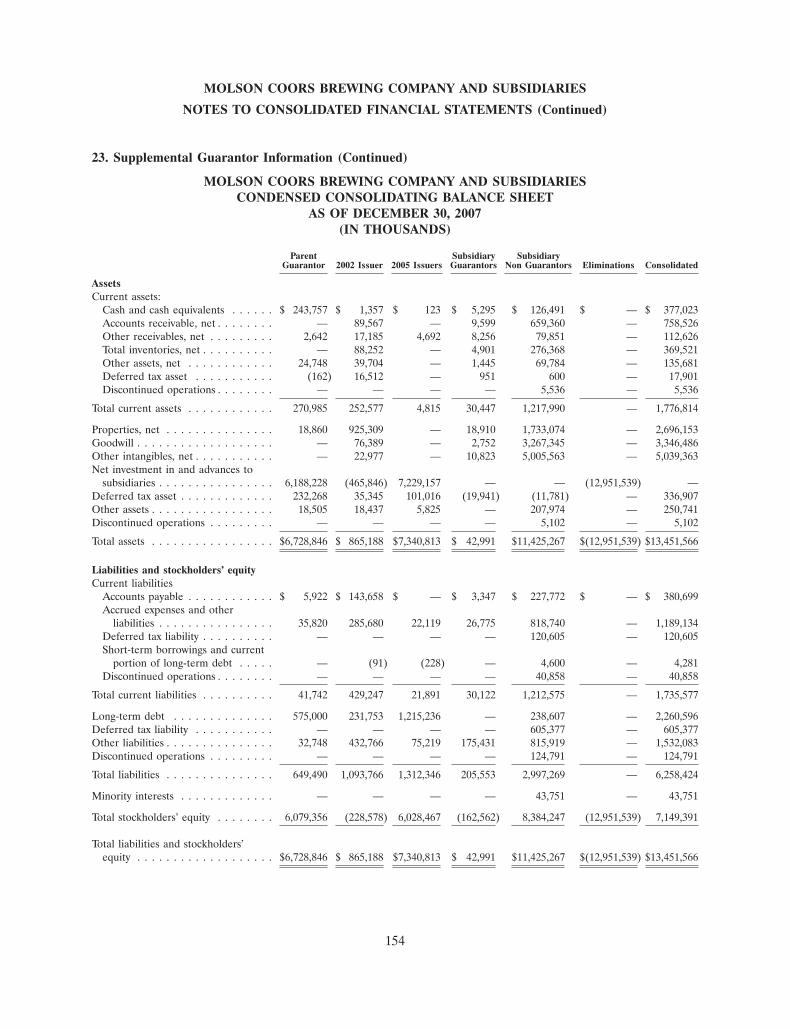
MOLSON COORS BREWING COMPANY AND SUBSIDIARIES
NOTES TO CONSOLIDATED FINANCIAL STATEMENTS (Continued)
23. Supplemental Guarantor Information (Continued)
MOLSON COORS BREWING COMPANY AND SUBSIDIARIESCONDENSED CONSOLIDATING BALANCE SHEET
AS OF DECEMBER 30, 2007(IN THOUSANDS)
Parent Subsidiary SubsidiaryGuarantor 2002 Issuer 2005 Issuers Guarantors Non Guarantors Eliminations Consolidated
AssetsCurrent assets:
Cash and cash equivalents . . . . . . $ 243,757 $ 1,357 $ 123 $ 5,295 $ 126,491 $ — $ 377,023Accounts receivable, net . . . . . . . . — 89,567 — 9,599 659,360 — 758,526Other receivables, net . . . . . . . . . 2,642 17,185 4,692 8,256 79,851 — 112,626Total inventories, net . . . . . . . . . . — 88,252 — 4,901 276,368 — 369,521Other assets, net . . . . . . . . . . . . 24,748 39,704 — 1,445 69,784 — 135,681Deferred tax asset . . . . . . . . . . . (162) 16,512 — 951 600 — 17,901Discontinued operations . . . . . . . . — — — — 5,536 — 5,536
Total current assets . . . . . . . . . . . . 270,985 252,577 4,815 30,447 1,217,990 — 1,776,814
Properties, net . . . . . . . . . . . . . . . 18,860 925,309 — 18,910 1,733,074 — 2,696,153Goodwill . . . . . . . . . . . . . . . . . . . — 76,389 — 2,752 3,267,345 — 3,346,486Other intangibles, net . . . . . . . . . . . — 22,977 — 10,823 5,005,563 — 5,039,363Net investment in and advances to
subsidiaries . . . . . . . . . . . . . . . . 6,188,228 (465,846) 7,229,157 — — (12,951,539) —Deferred tax asset . . . . . . . . . . . . . 232,268 35,345 101,016 (19,941) (11,781) — 336,907Other assets . . . . . . . . . . . . . . . . . 18,505 18,437 5,825 — 207,974 — 250,741Discontinued operations . . . . . . . . . — — — — 5,102 — 5,102
Total assets . . . . . . . . . . . . . . . . . $6,728,846 $ 865,188 $7,340,813 $ 42,991 $11,425,267 $(12,951,539) $13,451,566
Liabilities and stockholders’ equityCurrent liabilities
Accounts payable . . . . . . . . . . . . $ 5,922 $ 143,658 $ — $ 3,347 $ 227,772 $ — $ 380,699Accrued expenses and other
liabilities . . . . . . . . . . . . . . . . 35,820 285,680 22,119 26,775 818,740 — 1,189,134Deferred tax liability . . . . . . . . . . — — — — 120,605 — 120,605Short-term borrowings and current
portion of long-term debt . . . . . — (91) (228) — 4,600 — 4,281Discontinued operations . . . . . . . . — — — — 40,858 — 40,858
Total current liabilities . . . . . . . . . . 41,742 429,247 21,891 30,122 1,212,575 — 1,735,577
Long-term debt . . . . . . . . . . . . . . 575,000 231,753 1,215,236 — 238,607 — 2,260,596Deferred tax liability . . . . . . . . . . . — — — — 605,377 — 605,377Other liabilities . . . . . . . . . . . . . . . 32,748 432,766 75,219 175,431 815,919 — 1,532,083Discontinued operations . . . . . . . . . — — — — 124,791 — 124,791
Total liabilities . . . . . . . . . . . . . . . 649,490 1,093,766 1,312,346 205,553 2,997,269 — 6,258,424
Minority interests . . . . . . . . . . . . . — — — — 43,751 — 43,751
Total stockholders’ equity . . . . . . . . 6,079,356 (228,578) 6,028,467 (162,562) 8,384,247 (12,951,539) 7,149,391
Total liabilities and stockholders’equity . . . . . . . . . . . . . . . . . . . $6,728,846 $ 865,188 $7,340,813 $ 42,991 $11,425,267 $(12,951,539) $13,451,566
154
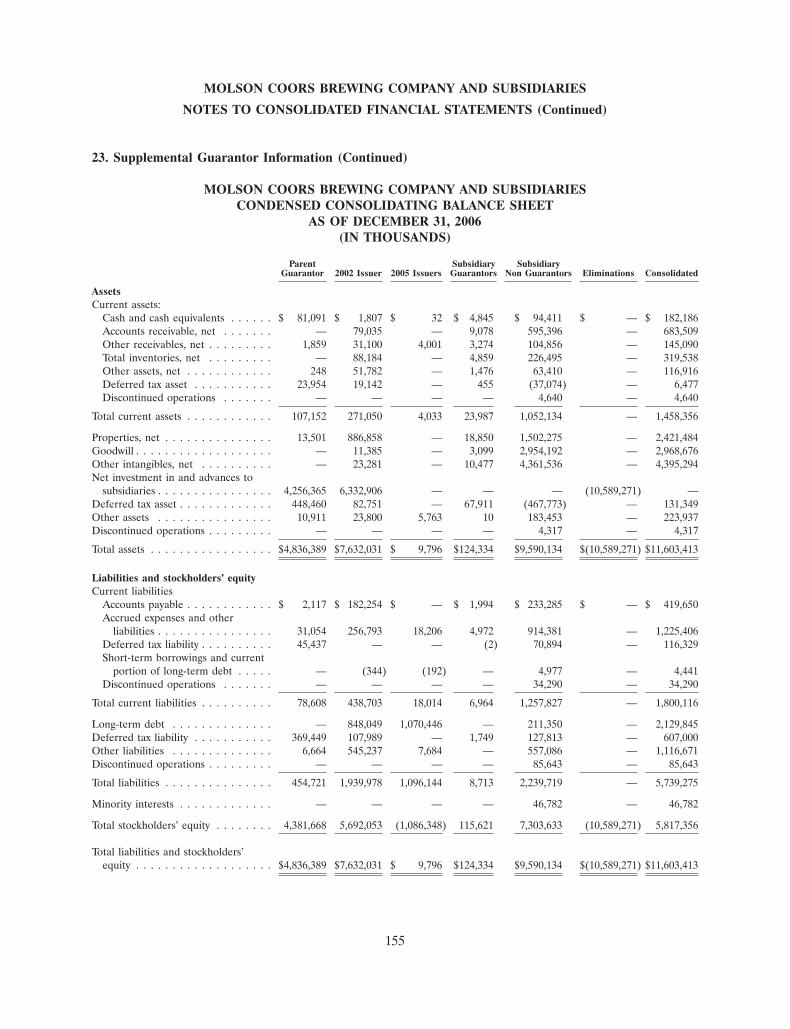
MOLSON COORS BREWING COMPANY AND SUBSIDIARIES
NOTES TO CONSOLIDATED FINANCIAL STATEMENTS (Continued)
23. Supplemental Guarantor Information (Continued)
MOLSON COORS BREWING COMPANY AND SUBSIDIARIESCONDENSED CONSOLIDATING BALANCE SHEET
AS OF DECEMBER 31, 2006(IN THOUSANDS)
Parent Subsidiary SubsidiaryGuarantor 2002 Issuer 2005 Issuers Guarantors Non Guarantors Eliminations Consolidated
AssetsCurrent assets:
Cash and cash equivalents . . . . . . $ 81,091 $ 1,807 $ 32 $ 4,845 $ 94,411 $ — $ 182,186Accounts receivable, net . . . . . . . — 79,035 — 9,078 595,396 — 683,509Other receivables, net . . . . . . . . . 1,859 31,100 4,001 3,274 104,856 — 145,090Total inventories, net . . . . . . . . . — 88,184 — 4,859 226,495 — 319,538Other assets, net . . . . . . . . . . . . 248 51,782 — 1,476 63,410 — 116,916Deferred tax asset . . . . . . . . . . . 23,954 19,142 — 455 (37,074) — 6,477Discontinued operations . . . . . . . — — — — 4,640 — 4,640
Total current assets . . . . . . . . . . . . 107,152 271,050 4,033 23,987 1,052,134 — 1,458,356
Properties, net . . . . . . . . . . . . . . . 13,501 886,858 — 18,850 1,502,275 — 2,421,484Goodwill . . . . . . . . . . . . . . . . . . . — 11,385 — 3,099 2,954,192 — 2,968,676Other intangibles, net . . . . . . . . . . — 23,281 — 10,477 4,361,536 — 4,395,294Net investment in and advances to
subsidiaries . . . . . . . . . . . . . . . . 4,256,365 6,332,906 — — — (10,589,271) —Deferred tax asset . . . . . . . . . . . . . 448,460 82,751 — 67,911 (467,773) — 131,349Other assets . . . . . . . . . . . . . . . . 10,911 23,800 5,763 10 183,453 — 223,937Discontinued operations . . . . . . . . . — — — — 4,317 — 4,317
Total assets . . . . . . . . . . . . . . . . . $4,836,389 $7,632,031 $ 9,796 $124,334 $9,590,134 $(10,589,271) $11,603,413
Liabilities and stockholders’ equityCurrent liabilities
Accounts payable . . . . . . . . . . . . $ 2,117 $ 182,254 $ — $ 1,994 $ 233,285 $ — $ 419,650Accrued expenses and other
liabilities . . . . . . . . . . . . . . . . 31,054 256,793 18,206 4,972 914,381 — 1,225,406Deferred tax liability . . . . . . . . . . 45,437 — — (2) 70,894 — 116,329Short-term borrowings and current
portion of long-term debt . . . . . — (344) (192) — 4,977 — 4,441Discontinued operations . . . . . . . — — — — 34,290 — 34,290
Total current liabilities . . . . . . . . . . 78,608 438,703 18,014 6,964 1,257,827 — 1,800,116
Long-term debt . . . . . . . . . . . . . . — 848,049 1,070,446 — 211,350 — 2,129,845Deferred tax liability . . . . . . . . . . . 369,449 107,989 — 1,749 127,813 — 607,000Other liabilities . . . . . . . . . . . . . . 6,664 545,237 7,684 — 557,086 — 1,116,671Discontinued operations . . . . . . . . . — — — — 85,643 — 85,643
Total liabilities . . . . . . . . . . . . . . . 454,721 1,939,978 1,096,144 8,713 2,239,719 — 5,739,275
Minority interests . . . . . . . . . . . . . — — — — 46,782 — 46,782
Total stockholders’ equity . . . . . . . . 4,381,668 5,692,053 (1,086,348) 115,621 7,303,633 (10,589,271) 5,817,356
Total liabilities and stockholders’equity . . . . . . . . . . . . . . . . . . . $4,836,389 $7,632,031 $ 9,796 $124,334 $9,590,134 $(10,589,271) $11,603,413
155
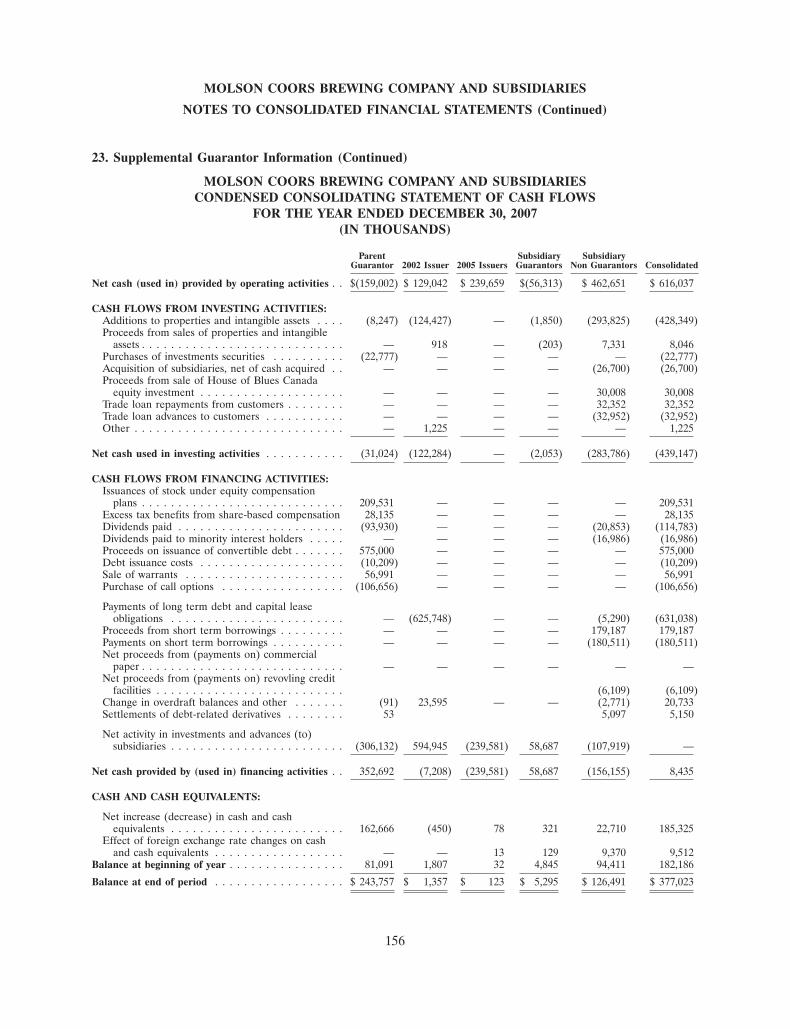
MOLSON COORS BREWING COMPANY AND SUBSIDIARIES
NOTES TO CONSOLIDATED FINANCIAL STATEMENTS (Continued)
23. Supplemental Guarantor Information (Continued)
MOLSON COORS BREWING COMPANY AND SUBSIDIARIESCONDENSED CONSOLIDATING STATEMENT OF CASH FLOWS
FOR THE YEAR ENDED DECEMBER 30, 2007(IN THOUSANDS)
Parent Subsidiary SubsidiaryGuarantor 2002 Issuer 2005 Issuers Guarantors Non Guarantors Consolidated
Net cash (used in) provided by operating activities . . $(159,002) $ 129,042 $ 239,659 $(56,313) $ 462,651 $ 616,037
CASH FLOWS FROM INVESTING ACTIVITIES:Additions to properties and intangible assets . . . . (8,247) (124,427) — (1,850) (293,825) (428,349)Proceeds from sales of properties and intangible
assets . . . . . . . . . . . . . . . . . . . . . . . . . . . . — 918 — (203) 7,331 8,046Purchases of investments securities . . . . . . . . . . (22,777) — — — — (22,777)Acquisition of subsidiaries, net of cash acquired . . — — — — (26,700) (26,700)Proceeds from sale of House of Blues Canada
equity investment . . . . . . . . . . . . . . . . . . . . — — — — 30,008 30,008Trade loan repayments from customers . . . . . . . . — — — — 32,352 32,352Trade loan advances to customers . . . . . . . . . . . — — — — (32,952) (32,952)Other . . . . . . . . . . . . . . . . . . . . . . . . . . . . . — 1,225 — — — 1,225
Net cash used in investing activities . . . . . . . . . . . (31,024) (122,284) — (2,053) (283,786) (439,147)
CASH FLOWS FROM FINANCING ACTIVITIES:Issuances of stock under equity compensation
plans . . . . . . . . . . . . . . . . . . . . . . . . . . . . 209,531 — — — — 209,531Excess tax benefits from share-based compensation 28,135 — — — — 28,135Dividends paid . . . . . . . . . . . . . . . . . . . . . . . (93,930) — — — (20,853) (114,783)Dividends paid to minority interest holders . . . . . — — — — (16,986) (16,986)Proceeds on issuance of convertible debt . . . . . . . 575,000 — — — — 575,000Debt issuance costs . . . . . . . . . . . . . . . . . . . . (10,209) — — — — (10,209)Sale of warrants . . . . . . . . . . . . . . . . . . . . . . 56,991 — — — — 56,991Purchase of call options . . . . . . . . . . . . . . . . . (106,656) — — — — (106,656)
Payments of long term debt and capital leaseobligations . . . . . . . . . . . . . . . . . . . . . . . . — (625,748) — — (5,290) (631,038)
Proceeds from short term borrowings . . . . . . . . . — — — — 179,187 179,187Payments on short term borrowings . . . . . . . . . . — — — — (180,511) (180,511)Net proceeds from (payments on) commercial
paper . . . . . . . . . . . . . . . . . . . . . . . . . . . . — — — — — —Net proceeds from (payments on) revovling credit
facilities . . . . . . . . . . . . . . . . . . . . . . . . . . (6,109) (6,109)Change in overdraft balances and other . . . . . . . (91) 23,595 — — (2,771) 20,733Settlements of debt-related derivatives . . . . . . . . 53 5,097 5,150
Net activity in investments and advances (to)subsidiaries . . . . . . . . . . . . . . . . . . . . . . . . (306,132) 594,945 (239,581) 58,687 (107,919) —
Net cash provided by (used in) financing activities . . 352,692 (7,208) (239,581) 58,687 (156,155) 8,435
CASH AND CASH EQUIVALENTS:
Net increase (decrease) in cash and cashequivalents . . . . . . . . . . . . . . . . . . . . . . . . 162,666 (450) 78 321 22,710 185,325
Effect of foreign exchange rate changes on cashand cash equivalents . . . . . . . . . . . . . . . . . . — — 13 129 9,370 9,512
Balance at beginning of year . . . . . . . . . . . . . . . . 81,091 1,807 32 4,845 94,411 182,186
Balance at end of period . . . . . . . . . . . . . . . . . . $ 243,757 $ 1,357 $ 123 $ 5,295 $ 126,491 $ 377,023
156
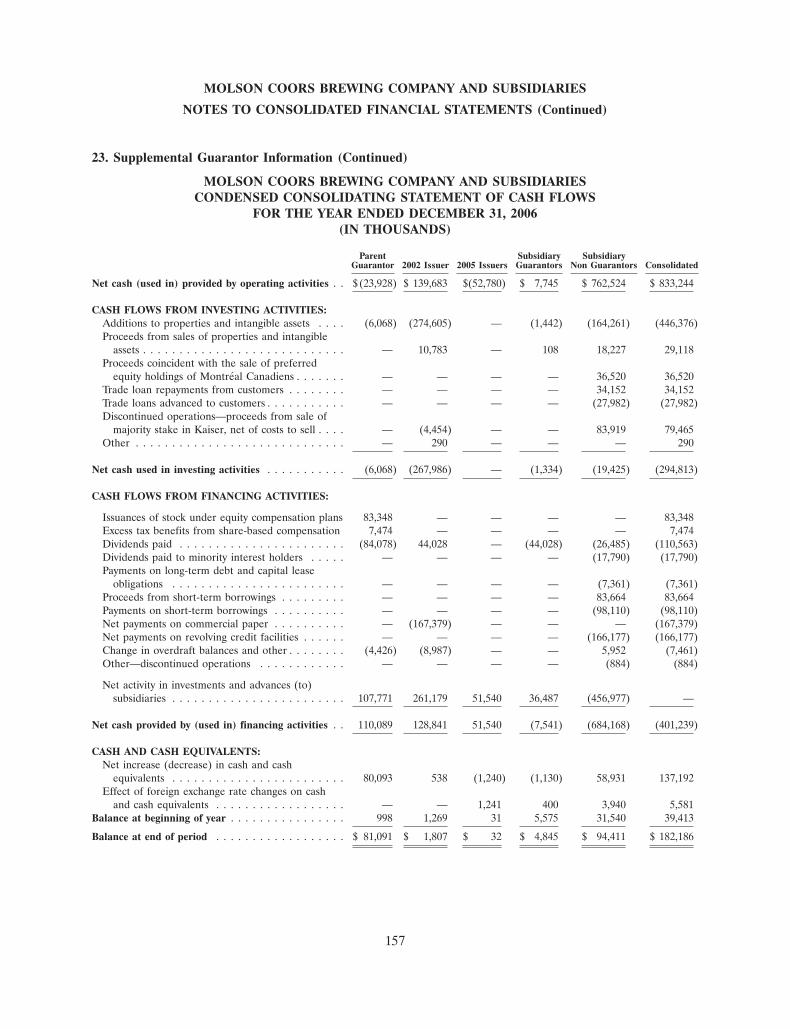
MOLSON COORS BREWING COMPANY AND SUBSIDIARIES
NOTES TO CONSOLIDATED FINANCIAL STATEMENTS (Continued)
23. Supplemental Guarantor Information (Continued)
MOLSON COORS BREWING COMPANY AND SUBSIDIARIESCONDENSED CONSOLIDATING STATEMENT OF CASH FLOWS
FOR THE YEAR ENDED DECEMBER 31, 2006(IN THOUSANDS)
Parent Subsidiary SubsidiaryGuarantor 2002 Issuer 2005 Issuers Guarantors Non Guarantors Consolidated
Net cash (used in) provided by operating activities . . $ (23,928) $ 139,683 $(52,780) $ 7,745 $ 762,524 $ 833,244
CASH FLOWS FROM INVESTING ACTIVITIES:Additions to properties and intangible assets . . . . (6,068) (274,605) — (1,442) (164,261) (446,376)Proceeds from sales of properties and intangible
assets . . . . . . . . . . . . . . . . . . . . . . . . . . . . — 10,783 — 108 18,227 29,118Proceeds coincident with the sale of preferred
equity holdings of Montreal Canadiens . . . . . . . — — — — 36,520 36,520Trade loan repayments from customers . . . . . . . . — — — — 34,152 34,152Trade loans advanced to customers . . . . . . . . . . . — — — — (27,982) (27,982)Discontinued operations—proceeds from sale of
majority stake in Kaiser, net of costs to sell . . . . — (4,454) — — 83,919 79,465Other . . . . . . . . . . . . . . . . . . . . . . . . . . . . . — 290 — — — 290
Net cash used in investing activities . . . . . . . . . . . (6,068) (267,986) — (1,334) (19,425) (294,813)
CASH FLOWS FROM FINANCING ACTIVITIES:
Issuances of stock under equity compensation plans 83,348 — — — — 83,348Excess tax benefits from share-based compensation 7,474 — — — — 7,474Dividends paid . . . . . . . . . . . . . . . . . . . . . . . (84,078) 44,028 — (44,028) (26,485) (110,563)Dividends paid to minority interest holders . . . . . — — — — (17,790) (17,790)Payments on long-term debt and capital lease
obligations . . . . . . . . . . . . . . . . . . . . . . . . — — — — (7,361) (7,361)Proceeds from short-term borrowings . . . . . . . . . — — — — 83,664 83,664Payments on short-term borrowings . . . . . . . . . . — — — — (98,110) (98,110)Net payments on commercial paper . . . . . . . . . . — (167,379) — — — (167,379)Net payments on revolving credit facilities . . . . . . — — — — (166,177) (166,177)Change in overdraft balances and other . . . . . . . . (4,426) (8,987) — — 5,952 (7,461)Other—discontinued operations . . . . . . . . . . . . — — — — (884) (884)
Net activity in investments and advances (to)subsidiaries . . . . . . . . . . . . . . . . . . . . . . . . 107,771 261,179 51,540 36,487 (456,977) —
Net cash provided by (used in) financing activities . . 110,089 128,841 51,540 (7,541) (684,168) (401,239)
CASH AND CASH EQUIVALENTS:Net increase (decrease) in cash and cash
equivalents . . . . . . . . . . . . . . . . . . . . . . . . 80,093 538 (1,240) (1,130) 58,931 137,192Effect of foreign exchange rate changes on cash
and cash equivalents . . . . . . . . . . . . . . . . . . — — 1,241 400 3,940 5,581Balance at beginning of year . . . . . . . . . . . . . . . . 998 1,269 31 5,575 31,540 39,413
Balance at end of period . . . . . . . . . . . . . . . . . . $ 81,091 $ 1,807 $ 32 $ 4,845 $ 94,411 $ 182,186
157
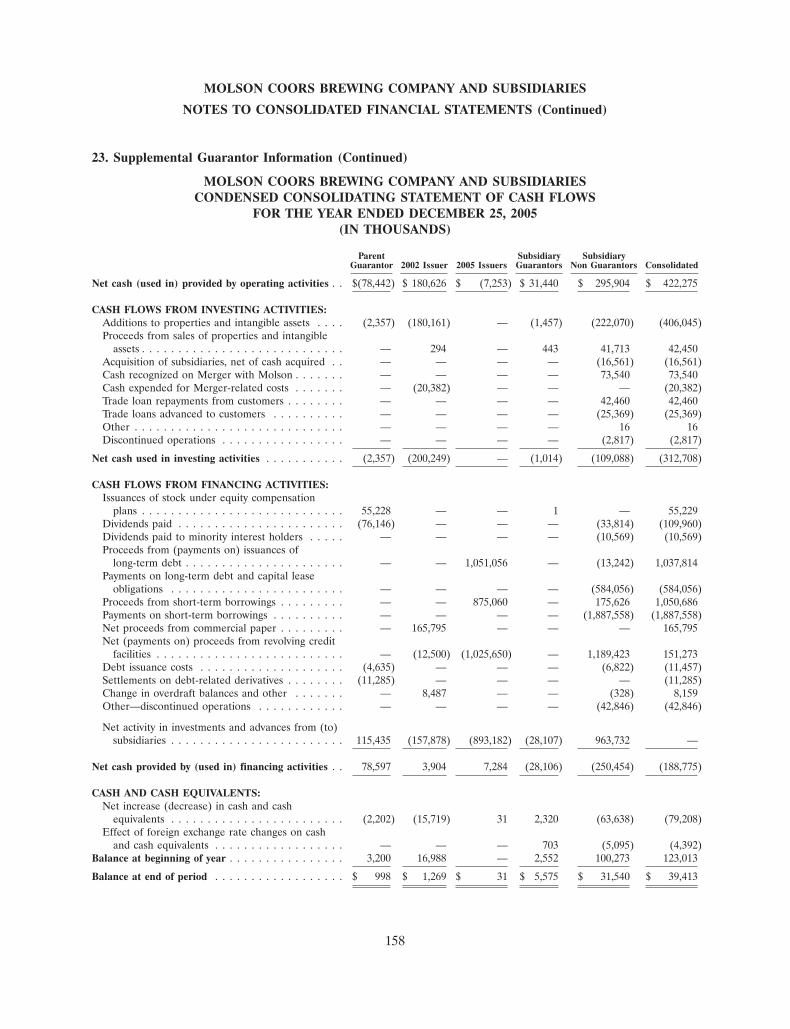
MOLSON COORS BREWING COMPANY AND SUBSIDIARIES
NOTES TO CONSOLIDATED FINANCIAL STATEMENTS (Continued)
23. Supplemental Guarantor Information (Continued)
MOLSON COORS BREWING COMPANY AND SUBSIDIARIESCONDENSED CONSOLIDATING STATEMENT OF CASH FLOWS
FOR THE YEAR ENDED DECEMBER 25, 2005(IN THOUSANDS)
Parent Subsidiary SubsidiaryGuarantor 2002 Issuer 2005 Issuers Guarantors Non Guarantors Consolidated
Net cash (used in) provided by operating activities . . $(78,442) $ 180,626 $ (7,253) $ 31,440 $ 295,904 $ 422,275
CASH FLOWS FROM INVESTING ACTIVITIES:Additions to properties and intangible assets . . . . (2,357) (180,161) — (1,457) (222,070) (406,045)Proceeds from sales of properties and intangible
assets . . . . . . . . . . . . . . . . . . . . . . . . . . . . — 294 — 443 41,713 42,450Acquisition of subsidiaries, net of cash acquired . . — — — — (16,561) (16,561)Cash recognized on Merger with Molson . . . . . . . — — — — 73,540 73,540Cash expended for Merger-related costs . . . . . . . — (20,382) — — — (20,382)Trade loan repayments from customers . . . . . . . . — — — — 42,460 42,460Trade loans advanced to customers . . . . . . . . . . — — — — (25,369) (25,369)Other . . . . . . . . . . . . . . . . . . . . . . . . . . . . . — — — — 16 16Discontinued operations . . . . . . . . . . . . . . . . . — — — — (2,817) (2,817)
Net cash used in investing activities . . . . . . . . . . . (2,357) (200,249) — (1,014) (109,088) (312,708)
CASH FLOWS FROM FINANCING ACTIVITIES:Issuances of stock under equity compensation
plans . . . . . . . . . . . . . . . . . . . . . . . . . . . . 55,228 — — 1 — 55,229Dividends paid . . . . . . . . . . . . . . . . . . . . . . . (76,146) — — — (33,814) (109,960)Dividends paid to minority interest holders . . . . . — — — — (10,569) (10,569)Proceeds from (payments on) issuances of
long-term debt . . . . . . . . . . . . . . . . . . . . . . — — 1,051,056 — (13,242) 1,037,814Payments on long-term debt and capital lease
obligations . . . . . . . . . . . . . . . . . . . . . . . . — — — — (584,056) (584,056)Proceeds from short-term borrowings . . . . . . . . . — — 875,060 — 175,626 1,050,686Payments on short-term borrowings . . . . . . . . . . — — — — (1,887,558) (1,887,558)Net proceeds from commercial paper . . . . . . . . . — 165,795 — — — 165,795Net (payments on) proceeds from revolving credit
facilities . . . . . . . . . . . . . . . . . . . . . . . . . . — (12,500) (1,025,650) — 1,189,423 151,273Debt issuance costs . . . . . . . . . . . . . . . . . . . . (4,635) — — — (6,822) (11,457)Settlements on debt-related derivatives . . . . . . . . (11,285) — — — — (11,285)Change in overdraft balances and other . . . . . . . — 8,487 — — (328) 8,159Other—discontinued operations . . . . . . . . . . . . — — — — (42,846) (42,846)
Net activity in investments and advances from (to)subsidiaries . . . . . . . . . . . . . . . . . . . . . . . . 115,435 (157,878) (893,182) (28,107) 963,732 —
Net cash provided by (used in) financing activities . . 78,597 3,904 7,284 (28,106) (250,454) (188,775)
CASH AND CASH EQUIVALENTS:Net increase (decrease) in cash and cash
equivalents . . . . . . . . . . . . . . . . . . . . . . . . (2,202) (15,719) 31 2,320 (63,638) (79,208)Effect of foreign exchange rate changes on cash
and cash equivalents . . . . . . . . . . . . . . . . . . — — — 703 (5,095) (4,392)Balance at beginning of year . . . . . . . . . . . . . . . . 3,200 16,988 — 2,552 100,273 123,013
Balance at end of period . . . . . . . . . . . . . . . . . . $ 998 $ 1,269 $ 31 $ 5,575 $ 31,540 $ 39,413
158
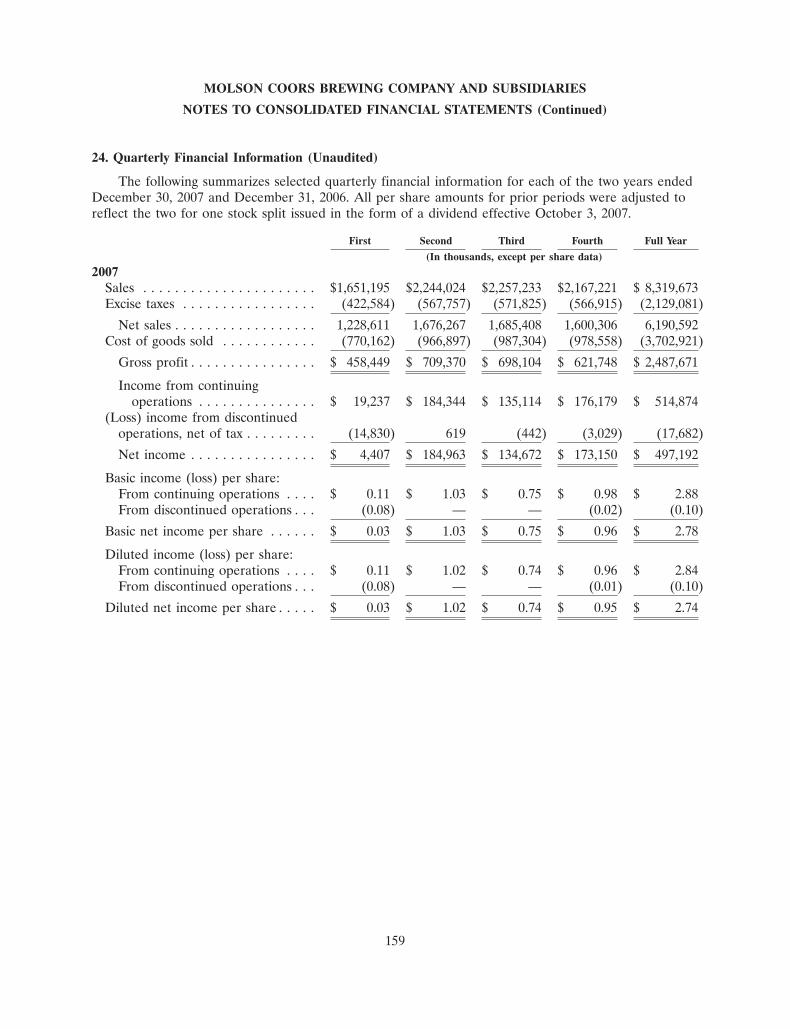
MOLSON COORS BREWING COMPANY AND SUBSIDIARIES
NOTES TO CONSOLIDATED FINANCIAL STATEMENTS (Continued)
24. Quarterly Financial Information (Unaudited)
The following summarizes selected quarterly financial information for each of the two years endedDecember 30, 2007 and December 31, 2006. All per share amounts for prior periods were adjusted toreflect the two for one stock split issued in the form of a dividend effective October 3, 2007.
First Second Third Fourth Full Year
(In thousands, except per share data)
2007Sales . . . . . . . . . . . . . . . . . . . . . . $1,651,195 $2,244,024 $2,257,233 $2,167,221 $ 8,319,673Excise taxes . . . . . . . . . . . . . . . . . (422,584) (567,757) (571,825) (566,915) (2,129,081)
Net sales . . . . . . . . . . . . . . . . . . 1,228,611 1,676,267 1,685,408 1,600,306 6,190,592Cost of goods sold . . . . . . . . . . . . (770,162) (966,897) (987,304) (978,558) (3,702,921)
Gross profit . . . . . . . . . . . . . . . . $ 458,449 $ 709,370 $ 698,104 $ 621,748 $ 2,487,671
Income from continuingoperations . . . . . . . . . . . . . . . $ 19,237 $ 184,344 $ 135,114 $ 176,179 $ 514,874
(Loss) income from discontinuedoperations, net of tax . . . . . . . . . (14,830) 619 (442) (3,029) (17,682)
Net income . . . . . . . . . . . . . . . . $ 4,407 $ 184,963 $ 134,672 $ 173,150 $ 497,192
Basic income (loss) per share:From continuing operations . . . . $ 0.11 $ 1.03 $ 0.75 $ 0.98 $ 2.88From discontinued operations . . . (0.08) — — (0.02) (0.10)
Basic net income per share . . . . . . $ 0.03 $ 1.03 $ 0.75 $ 0.96 $ 2.78
Diluted income (loss) per share:From continuing operations . . . . $ 0.11 $ 1.02 $ 0.74 $ 0.96 $ 2.84From discontinued operations . . . (0.08) — — (0.01) (0.10)
Diluted net income per share . . . . . $ 0.03 $ 1.02 $ 0.74 $ 0.95 $ 2.74
159
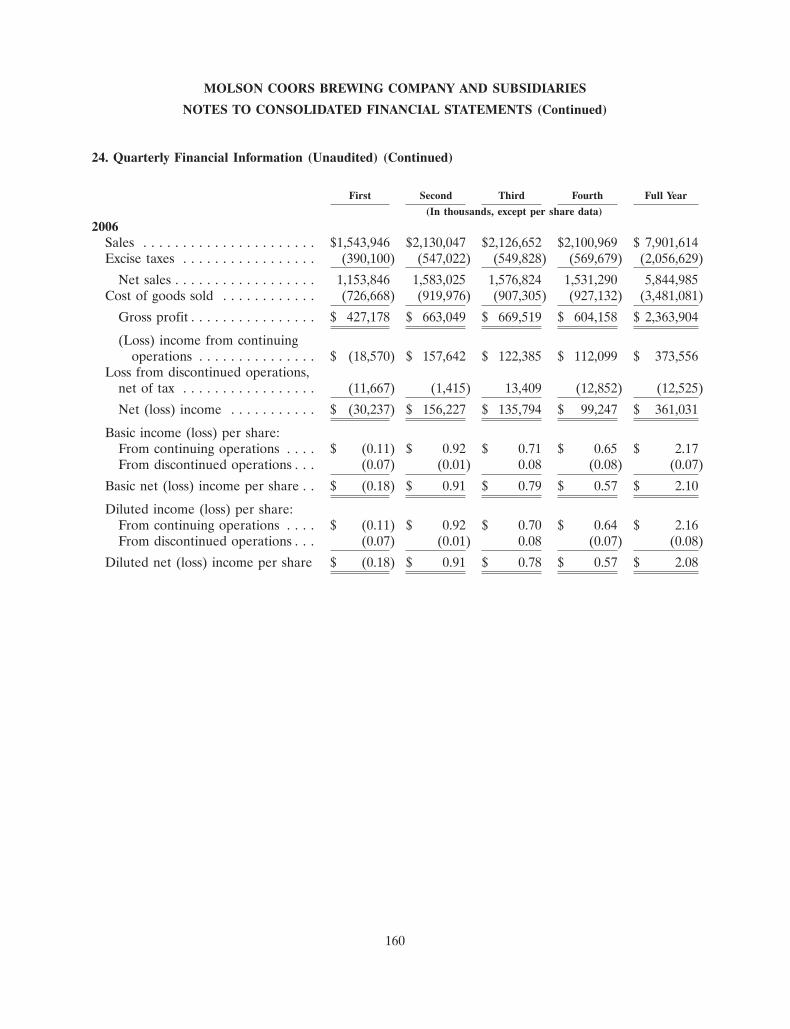
MOLSON COORS BREWING COMPANY AND SUBSIDIARIES
NOTES TO CONSOLIDATED FINANCIAL STATEMENTS (Continued)
24. Quarterly Financial Information (Unaudited) (Continued)
First Second Third Fourth Full Year
(In thousands, except per share data)
2006Sales . . . . . . . . . . . . . . . . . . . . . . $1,543,946 $2,130,047 $2,126,652 $2,100,969 $ 7,901,614Excise taxes . . . . . . . . . . . . . . . . . (390,100) (547,022) (549,828) (569,679) (2,056,629)
Net sales . . . . . . . . . . . . . . . . . . 1,153,846 1,583,025 1,576,824 1,531,290 5,844,985Cost of goods sold . . . . . . . . . . . . (726,668) (919,976) (907,305) (927,132) (3,481,081)
Gross profit . . . . . . . . . . . . . . . . $ 427,178 $ 663,049 $ 669,519 $ 604,158 $ 2,363,904
(Loss) income from continuingoperations . . . . . . . . . . . . . . . $ (18,570) $ 157,642 $ 122,385 $ 112,099 $ 373,556
Loss from discontinued operations,net of tax . . . . . . . . . . . . . . . . . (11,667) (1,415) 13,409 (12,852) (12,525)
Net (loss) income . . . . . . . . . . . $ (30,237) $ 156,227 $ 135,794 $ 99,247 $ 361,031
Basic income (loss) per share:From continuing operations . . . . $ (0.11) $ 0.92 $ 0.71 $ 0.65 $ 2.17From discontinued operations . . . (0.07) (0.01) 0.08 (0.08) (0.07)
Basic net (loss) income per share . . $ (0.18) $ 0.91 $ 0.79 $ 0.57 $ 2.10
Diluted income (loss) per share:From continuing operations . . . . $ (0.11) $ 0.92 $ 0.70 $ 0.64 $ 2.16From discontinued operations . . . (0.07) (0.01) 0.08 (0.07) (0.08)
Diluted net (loss) income per share $ (0.18) $ 0.91 $ 0.78 $ 0.57 $ 2.08
160

ITEM 9. Changes in and Disagreements with Accountants on Accounting and Financial Disclosure
None.
ITEM 9A. CONTROLS AND PROCEDURES
Evaluation of Disclosure Controls and Procedures
Our disclosure controls and procedures are designed to ensure that information required to bedisclosed in the reports that we file or submit under the Securities Exchange Act of 1934, as amended(the ‘‘Exchange Act’’) is recorded, processed, summarized and reported within the time periodsspecified in the rules and forms of the Securities and Exchange Commission, and that such informationis accumulated and communicated to the Company’s management, including our Global ChiefExecutive Officer and Global Chief Financial Officer, as appropriate, to allow timely decisionsregarding required disclosure. Management necessarily applies its judgment in assessing the costs andbenefits of such controls and procedures that, by their nature, can only provide reasonable assuranceregarding management’s control objectives. Also, we have investments in certain unconsolidated entitiesthat we do not control or manage. Consequently, our disclosure controls and procedures with respect tosuch entities are necessarily substantially more limited than those we maintain with respect to ourconsolidated subsidiaries.
The Global Chief Executive Officer and the Global Chief Financial Officer, with assistance fromother members of management, have evaluated the effectiveness of the design and operation of ourdisclosure controls and procedures as defined in Rules 13a-15(e) and 15d-15(e) under the ExchangeAct, as of December 30, 2007 and, based on their evaluation, have concluded that our disclosurecontrols and procedures were effective.
The certifications attached as Exhibits 31 and 32 hereto should be read in conjunction with thedisclosures set forth herein.
Management’s Report on Internal Control over Financial Reporting
Our management is responsible for establishing and maintaining adequate internal control overfinancial reporting as such term is defined in the Exchange Act Rule 13a—15(f). The Company’sinternal control over financial reporting is a process designed to provide reasonable assurance regardingthe reliability of financial reporting and the preparation of financial statements for external purposes inaccordance with U. S. generally accepted accounting principles. A company’s internal control overfinancial reporting includes those policies and procedures that (i) pertain to the maintenance of recordsthat, in reasonable detail, accurately and fairly reflect the transactions and dispositions of the assets ofthe company; (ii) provide reasonable assurance that transactions are recorded as necessary to permitpreparation of financial statements in accordance with generally accepted accounting principles, andthat receipts and expenditures of the company are being made only in accordance with authorizationsof management and directors of the company; and (iii) provide reasonable assurance regardingprevention or timely detection of unauthorized acquisition, use, or disposition of the company’s assetsthat could have a material effect on the financial statements.
Because of the inherent limitations, internal control over financial reporting may not prevent ordetect misstatements. Also, projections of any evaluation of effectiveness to future periods are subjectto the risk that controls may become inadequate due to changes in conditions, or that the degree ofcompliance with the policies or procedures may deteriorate.
The Global Chief Executive Officer and the Global Chief Financial Officer, with assistance fromother members of management, assessed the effectiveness of internal control over financial reporting asof December 30, 2007, based on the criteria established in Internal Control—Integrated Frameworkissued by the Committee of Sponsoring Organizations of the Treadway Commission. Based on its
161
evaluation, management has concluded that our internal control over financial reporting was effectiveas of December 30, 2007.
The Company’s independent registered public accounting firm has audited the effectiveness of theCompany’s internal control over financial reporting as of December 30, 2007, as stated in the reportwhich appears herein.
Changes in Internal Control over Financial Reporting
There were no other changes in internal control over financial reporting during the quarter endedDecember 30, 2007, that have materially affected, or are reasonably likely to materially affect theCompany’s internal control over financial reporting.
During the first quarter of 2008, the Company signed a contract with a third-party service providerto outsource a significant portion of work associated with our finance and accounting, informationtechnology and human resources functions. The outsourcing arrangements impact all three of ouroperating segments and our corporate headquarters. We will begin transitioning work to the serviceprovider in the first half of 2008, and the transition will continue through to the end of the year. Theoutsourcing arrangements are expected to enhance the cost efficiency of these administrative functions.The outsourcing of these functions will have an immediate effect with regard to the responsibilities forthe performance of certain processes and internal controls over financial reporting. We anticipate thatinternal controls over financial reporting could be further impacted in the future as many of ouroutsourced functions benefit from expected innovations and improvements from our service provider.
The Company has announced the planned MillerCoors joint venture, pending government reviewand approval. We intend to account for our interest in MillerCoors under the equity method, and as aresult, the existence of MillerCoors will potentially impact the scope of the Company’s internal controlsover financial reporting. In addition, the formation of MillerCoors will involve significant integration ofthe prospective owners’ current processes and controls over their businesses in the United States andPuerto Rico, many of which involve complex systems. Last, the Company’s corporate headquartersshares a significant portion of its systems and administrative infrastructure with the Unites Statesbusiness (which is being contributed to MillerCoors), and as a result, will have to adapt certain systems,processes and controls to the change brought about by the formation of MillerCoors
ITEM 9B. Other Information
None.
162
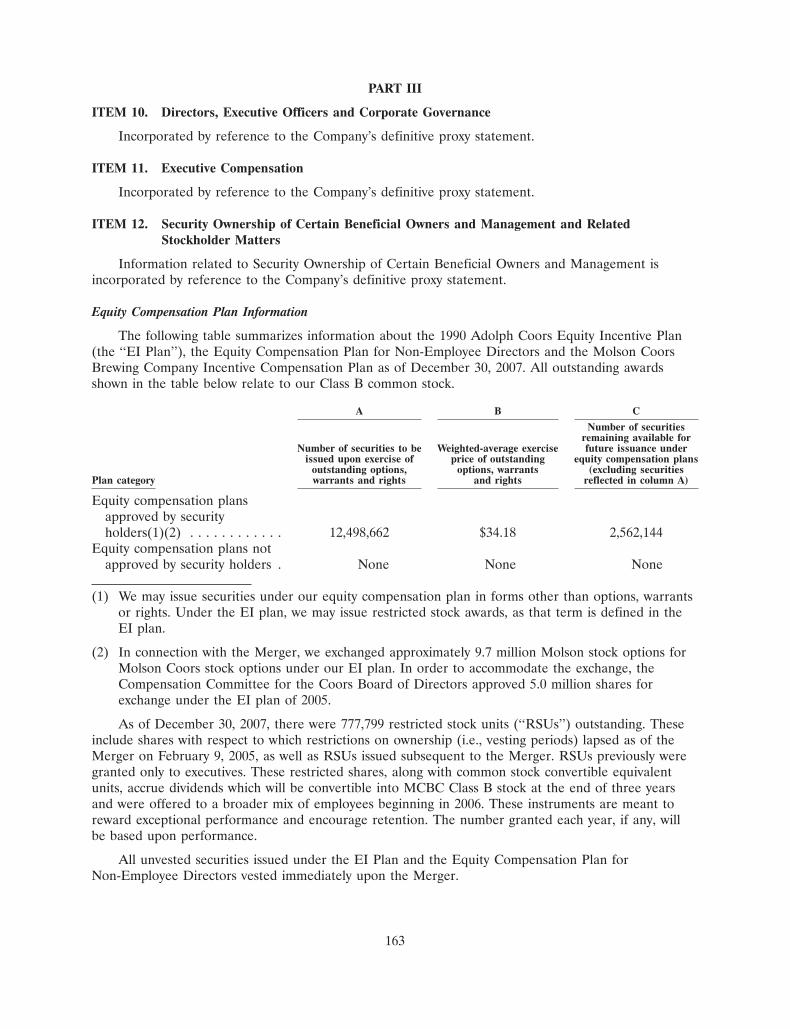
PART III
ITEM 10. Directors, Executive Officers and Corporate Governance
Incorporated by reference to the Company’s definitive proxy statement.
ITEM 11. Executive Compensation
Incorporated by reference to the Company’s definitive proxy statement.
ITEM 12. Security Ownership of Certain Beneficial Owners and Management and RelatedStockholder Matters
Information related to Security Ownership of Certain Beneficial Owners and Management isincorporated by reference to the Company’s definitive proxy statement.
Equity Compensation Plan Information
The following table summarizes information about the 1990 Adolph Coors Equity Incentive Plan(the ‘‘EI Plan’’), the Equity Compensation Plan for Non-Employee Directors and the Molson CoorsBrewing Company Incentive Compensation Plan as of December 30, 2007. All outstanding awardsshown in the table below relate to our Class B common stock.
A B C
Number of securitiesremaining available for
Number of securities to be Weighted-average exercise future issuance underissued upon exercise of price of outstanding equity compensation plans
outstanding options, options, warrants (excluding securitiesPlan category warrants and rights and rights reflected in column A)
Equity compensation plansapproved by securityholders(1)(2) . . . . . . . . . . . . 12,498,662 $34.18 2,562,144
Equity compensation plans notapproved by security holders . None None None
(1) We may issue securities under our equity compensation plan in forms other than options, warrantsor rights. Under the EI plan, we may issue restricted stock awards, as that term is defined in theEI plan.
(2) In connection with the Merger, we exchanged approximately 9.7 million Molson stock options forMolson Coors stock options under our EI plan. In order to accommodate the exchange, theCompensation Committee for the Coors Board of Directors approved 5.0 million shares forexchange under the EI plan of 2005.
As of December 30, 2007, there were 777,799 restricted stock units (‘‘RSUs’’) outstanding. Theseinclude shares with respect to which restrictions on ownership (i.e., vesting periods) lapsed as of theMerger on February 9, 2005, as well as RSUs issued subsequent to the Merger. RSUs previously weregranted only to executives. These restricted shares, along with common stock convertible equivalentunits, accrue dividends which will be convertible into MCBC Class B stock at the end of three yearsand were offered to a broader mix of employees beginning in 2006. These instruments are meant toreward exceptional performance and encourage retention. The number granted each year, if any, willbe based upon performance.
All unvested securities issued under the EI Plan and the Equity Compensation Plan forNon-Employee Directors vested immediately upon the Merger.
163
ITEM 13. Certain Relationships and Related Transactions, and Director Independence
Incorporated by reference to the Company’s definitive proxy statement.
ITEM 14. Principal Accountant Fees and Services
Incorporated by reference to the Company’s definitive proxy statement.
164
PART IV
ITEM 15. Exhibits and Financial Statement Schedules
(a) Financial Statements, Financial Statement Schedules and Exhibits
The following are filed as a part of this Report on Form 10-K
(1) Management’s Report to Stockholders
Report of Independent Registered Public Accounting Firm
Consolidated Statements of Income and Comprehensive Income for the period endedDecember 30, 2007
Consolidated Balance Sheets at December 30, 2007
Consolidated Statements of Cash Flows for the period ended December 30, 2007
Consolidated Statements of Stockholders’ Equity for the period ended December 30, 2007
Notes to Consolidated Financial Statements
(2) Schedule II—Valuation and Qualifying Accounts for each of the three years in the periodended December 30, 2007, December 31, 2006, and December 25, 2005
(3) Exhibit list
Incorporated by ReferenceExhibit FiledNumber Document Description Form Exhibit Filing Date Herewith
1.1 Underwriting Agreement, dated as of June 11, 2007, among 8-K 1.1 June 15, 2007Molson Coors Brewing Company, the guarantors party thereto,and Deutsche Bank Securities Inc. and Citigroup GlobalMarkets Inc.
2.1 Share Purchase Agreement between Coors Worldwide, Inc. and 8-K/A 2.1 April 18, 2002Adolph Coors Company and Interbrew, S.A., Interbrew U.K.Holdings Limited, Brandbrew S.A., and Golden AcquisitionLimited dated December 24, 2001 and amended February 1,2002.
2.2 Agreement and Plan of Merger dated August 14, 2003 by and 8-K 2.1 October 6, 2003between Adolph Coors Company, a Colorado corporation, andAdolph Coors Company, a Delaware corporation.
2.3 Combination Agreement, dated as of July 21, 2004, by and 8-K 2.1 January 14, 2005among Adolph Coors Company, Coors Canada Inc. andMolson Inc., together with the exhibits U.C. theretoincorporated by reference to Exhibit 2.1 of our Current Reporton Form 8-K filed August 4, 2004 as amended by AmendmentNo. 1 thereto (incorporated by reference to B-II of the JointProxy Statement/Management Information Circular onSchedule 14A, filed with the SEC on December 10, 2004) andby Amendment No. 2 thereto.
2.4 Plan of Arrangement Including Appendices. Schedule 14A Annex D December 10, 2004
2.5 Joint Venture Agreement, dated as of December 20, 2007, by 8-K 10.1 December 21, 2007and among Molson Coors Brewing Company, Coors BrewingCompany, SABMiller plc, Miller Brewing Company, andMillerCoors, LLC.
3.1 Restated Certificate of Incorporation of Molson Coors Brewing Schedule 14A Annex G December 9, 2004Company.
165
Incorporated by ReferenceExhibit FiledNumber Document Description Form Exhibit Filing Date Herewith
3.3 Second Amended and Restated Bylaws of Molson Coors 10-Q 3.2 August 7, 2007Brewing Company.
4.1 Indenture, dated as of May 7, 2002, by and among the Issuer, 10-Q 4.1 May 15, 2002the Guarantors and Deutsche Bank Trust Company Americas,as trustee.
4.2 First Supplemental Indenture, dated as of May 7, 2002 by and 10-Q 4.2 May 15, 2002among the issuer, the Guarantors and Deutsche Bank TrustCompany Americas, as trustee.
4.3 Fourth Supplemental Indenture, dated as of April 10, 2007, by 10-Q 4.1 August 7, 2007and among the issuer, the Guarantors and Deutsche Bank TrustCompany Americas, as trustee.
4.4 Fifth Supplemental Indenture, dated as of February 1, 2008 by Xand among the issuer, the Guarantors and Deutsche Bank TrustCompany Americas, as trustee.
4.5 Registration Rights Agreement, dated as of February 9, 2005, 8-K 99.2 February 15, 2005among Adolph Coors Company, Pentland Securities (1981) Inc.,4280661 Canada Inc., Nooya Investments Ltd., LincolnshireHoldings Limited, 4198832 Canada Inc., BAX InvestmentsLimited, 6339522 Canada Inc., Barleycorn Investments Ltd.,DJS Holdings Ltd., 6339549 Canada Inc., HoopoeHoldings Ltd., 6339603 Canada Inc., and The Adolph Coors, Jr.Trust dated September 12, 1969.
4.6 Molson Inc. 1988 Canadian Stock Option Plan, as revised. S-8 4.3 February 8, 2005
4.7 Molson Coors Brewing Company Incentive Compensation Plan. S-8 4.3 April 18, 2005
4.8 Indenture dated as of September 22, 2005, among Molson S-4 4.1 October 19, 2005Coors Capital Finance ULC, Molson Coors Brewing Company,Coors Brewing Company, Coors Distributing Company, CoorsInternational Market Development, L.L.L.P., CoorsWorldwide, Inc., Coors Global Properties, Inc., CoorsIntercontinental, Inc., and Coors Brewing CompanyInternational, Inc. and TD Banknorth, National Association andthe Canada Trust Company as co-trustees.
4.9 First Supplemental Indenture dated as of September 22, 2005, S-4 4.2 October 19, 2005among Molson Coors Capital Finance ULC, Molson CoorsBrewing Company, Coors Brewing Company, CoorsDistributing Company, Coors International MarketDevelopment, L.L.L.P., Coors Worldwide, Inc., Coors GlobalProperties, Inc., Coors Intercontinental, Inc., and CoorsBrewing Company International, Inc. and TD Banknorth,National Association as trustee.
4.10 Second Supplemental Indenture dated as of September 22, S-4 4-3 October 19, 20052005, among Molson Coors Capital Finance ULC, MolsonCoors Brewing Company, Coors Brewing Company, CoorsDistributing Company, Coors International MarketDevelopment, L.L.L.P., Coors Worldwide, Inc., Coors GlobalProperties, Inc., Coors Intercontinental, Inc., and CoorsBrewing Company International, Inc. and The Canada TrustCompany as trustee.
166
Incorporated by ReferenceExhibit FiledNumber Document Description Form Exhibit Filing Date Herewith
4.11 Third Supplemental Indenture dated as of April 10, 2007, 10-Q 4.2 August 7, 2007among Molson Coors Capital Finance ULC, Molson CoorsBrewing Company, Coors Brewing Company, CoorsDistributing Company, Coors International MarketDevelopment, L.L.L.P., Coors Worldwide, Inc., Coors GlobalProperties, Inc., Coors Intercontinental, Inc., and CoorsBrewing Company International, Inc. and The Canada TrustCompany as trustee.
4.12 Fourth Supplemental Indenture dated as of February 1, 2008, Xamong Molson Coors Capital Finance ULC, Molson CoorsBrewing Company, Coors Brewing Company, CoorsDistributing Company, Coors International MarketDevelopment, L.L.L.P., Coors Worldwide, Inc., Coors GlobalProperties, Inc., Coors Intercontinental, Inc., and CoorsBrewing Company International, Inc. and The Canada TrustCompany as trustee.
4.13 U.S. $300,000,000 in aggregate principal amount of 4.85% S-4 4.4 October 19, 2005Notes due 2010.
4.14 CAD $900,000,000 in aggregate principal amount of 5.00% 10-Q 4.5 November 4, 2005Notes due 2015.
4.15 Registration Rights Agreement dated as of September 22, 2005, S-4 4.5 October 19, 2005among Molson Coors Capital Finance ULC, Molson CoorsBrewing Company, Coors Brewing Company, CoorsDistributing Company, Coors International MarketDevelopment, L.L.L.P., Coors Worldwide, Inc., Coors GlobalProperties, Inc., Coors Intercontinental, Inc., and CoorsBrewing Company International, Inc. and J.P. MorganSecurities Inc. and Morgan Stanley & Co. Incorporated asrepresentatives of the several initial purchasers named in therelated Purchase Agreement.
4.16 Exchange Offer Agreement dated as of September 22, 2005, 10-Q 4.7 November 4, 2005among Molson Coors Capital Finance ULC, Molson CoorsBrewing Company, Coors Brewing Company, CoorsDistributing Company, Coors International MarketDevelopment, L.L.L.P., Coors Worldwide, Inc., Coors GlobalProperties, Inc., Coors Intercontinental, Inc., and CoorsBrewing Company International, Inc. and BMO NesbittBurns Inc., TD Securities Inc., J.P. Morgan Securities Inc.,Morgan Stanley & Co. Incorporated, Deutsche BankSecurities Inc., Deutsche Bank Securities Limited, J.P. MorganSecurities Canada Inc., and Morgan Stanley Canada Limited, asthe initial purchasers named in the related Canadian PurchaseAgreement.
4.17 Indenture, dated as of June 15, 2007, among Molson Coors 8-K 4.1 June 21, 2007Brewing Company, the guarantors party thereto, and DeutscheBank Trust Company Americas, as Trustee.
4.18 First Supplemental Indenture, dated as of June 15, 2007, among 8-K 4.2 June 21, 2007Molson Coors Brewing Company, the guarantors party thereto,and Deutsche Bank Trust Company Americas, as Trustee.
4.19 Second Supplemental Indenture, dated as of January 31, 2008, Xamong Molson Coors Brewing Company, the guarantors partythereto, and Deutsche Bank Trust Company Americas, asTrustee.
167
Incorporated by ReferenceExhibit FiledNumber Document Description Form Exhibit Filing Date Herewith
4.20 Third Supplemental Indenture, dated as of February 1, 2008, Xamong Molson Coors Brewing Company, the guarantors partythereto, and Deutsche Bank Trust Company Americas, asTrustee.
10.1* Adolph Coors Company 1990 Equity Incentive Plan effective 10-Q 10.1 August 5, 2004August 14, 2003, As Corrected and Conformed June 30, 2004.
10.2 Form of CBC Distributorship Agreement. 10-K 10.20 March 28, 1997
10.3* Adolph Coors Company Equity Compensation Plan for 10-Q 10.3 August 5, 2004Non-Employee Directors, Amended and Restated effectiveNovember 13, 2003, As Corrected and Conformed June 30,2004.
10.4 Distribution Agreement, dated as of October 5, 1992, between 10 2 October 6, 1992the Company and ACX Technologies, Inc. (incorporated herein 19.1by reference to the Distribution Agreement included as 19.1AExhibits 2, 19.1 and 19.1A to the Registration Statement onForm 10 filed by ACX Technologies, Inc. (file No. 0-20704)with the SEC on October 6, 1992, as amended).
10.5* Adolph Coors Company Stock Unit Plan and 1999 Amendment. 10-K 10.16 March 30, 1998
10.6 Adolph Coors Company Water Augmentation Plan. 10-K 10.12 December 31, 1989
10.7 Supply agreement between CBC and Ball Metal Beverage 10-K 10.12 March 29, 2002Container Corp. dated November 12, 2001
10.8 Supply Agreement between Rocky Mountain Metal 8-K/A 10.13 April 18, 2002Container, LLC and CBC dated November 12, 2001.
10.9* Adolph Coors Company Deferred Compensation Plan, As 10-Q 10.16 August 5, 2004Amended and Restated effective January 1, 2002, As Correctedand Conformed June 30, 2004.
10.10 Purchase and sale agreement by and between Graphic 8-K 99.1 March 25, 2003Packaging Corporation and Coors Brewing Company(incorporated by reference to Exhibit 99.1 to the Form 8-Kdated March 25, 2003, filed by Graphic Packaging InternationalCorporation).
10.11 Supply agreement between CBC and Owens-Brockway, Inc. 10-Q 10.20 November 12, 2003dated July 29, 2003, effective August 1, 2003.
10.12 Commercial Agreement (Packaging Purchasing) by and between 10-Q 10.21 November 12, 2003Owens-Brockway Glass Container Inc. and Coors BrewingCompany effective August 1, 2003.
10.13 U.S. Purchase Agreement dated as of September 15, 2005, 10-Q 10.1 November 4, 2005among Molson Coors Capital Finance ULC, Molson CoorsBrewing Company, Coors Brewing Company, CoorsDistributing Company, Coors International MarketDevelopment, L.L.L.P., Coors Worldwide, Inc., Coors GlobalProperties, Inc., Coors Intercontinental, Inc., and CoorsBrewing Company International, Inc. and J.P. MorganSecurities Inc. and Morgan Stanley & Co. Incorporated asrepresentatives of the several initial purchasers named therein.
168
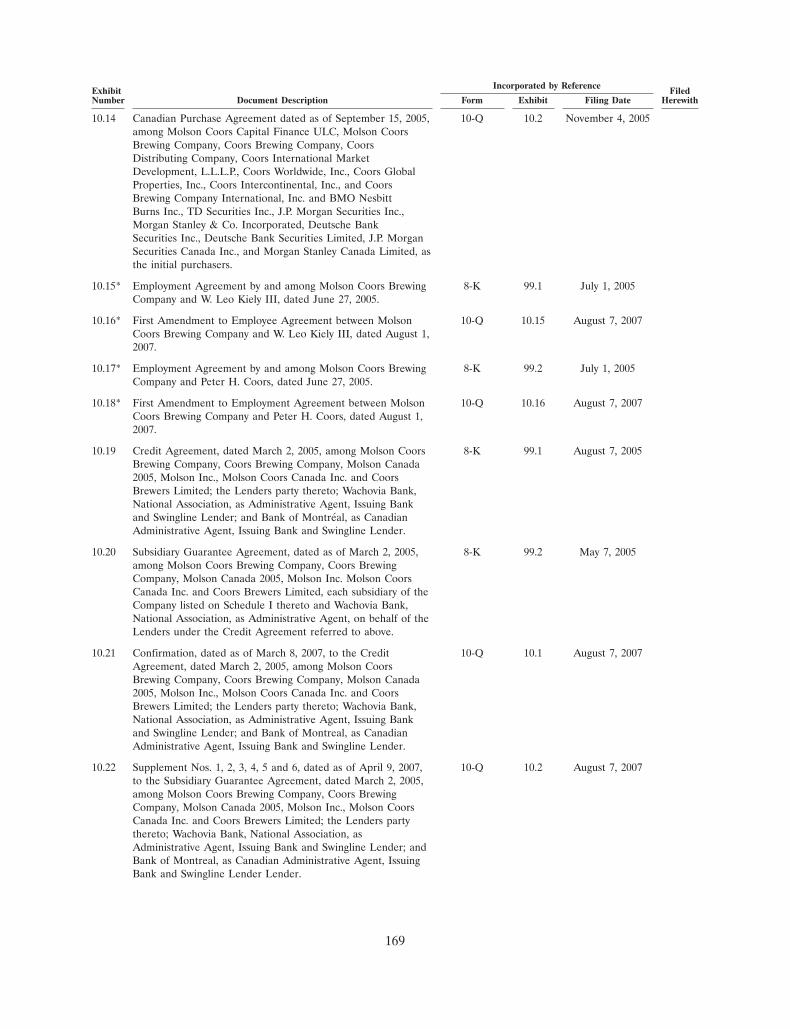
Incorporated by ReferenceExhibit FiledNumber Document Description Form Exhibit Filing Date Herewith
10.14 Canadian Purchase Agreement dated as of September 15, 2005, 10-Q 10.2 November 4, 2005among Molson Coors Capital Finance ULC, Molson CoorsBrewing Company, Coors Brewing Company, CoorsDistributing Company, Coors International MarketDevelopment, L.L.L.P., Coors Worldwide, Inc., Coors GlobalProperties, Inc., Coors Intercontinental, Inc., and CoorsBrewing Company International, Inc. and BMO NesbittBurns Inc., TD Securities Inc., J.P. Morgan Securities Inc.,Morgan Stanley & Co. Incorporated, Deutsche BankSecurities Inc., Deutsche Bank Securities Limited, J.P. MorganSecurities Canada Inc., and Morgan Stanley Canada Limited, asthe initial purchasers.
10.15* Employment Agreement by and among Molson Coors Brewing 8-K 99.1 July 1, 2005Company and W. Leo Kiely III, dated June 27, 2005.
10.16* First Amendment to Employee Agreement between Molson 10-Q 10.15 August 7, 2007Coors Brewing Company and W. Leo Kiely III, dated August 1,2007.
10.17* Employment Agreement by and among Molson Coors Brewing 8-K 99.2 July 1, 2005Company and Peter H. Coors, dated June 27, 2005.
10.18* First Amendment to Employment Agreement between Molson 10-Q 10.16 August 7, 2007Coors Brewing Company and Peter H. Coors, dated August 1,2007.
10.19 Credit Agreement, dated March 2, 2005, among Molson Coors 8-K 99.1 August 7, 2005Brewing Company, Coors Brewing Company, Molson Canada2005, Molson Inc., Molson Coors Canada Inc. and CoorsBrewers Limited; the Lenders party thereto; Wachovia Bank,National Association, as Administrative Agent, Issuing Bankand Swingline Lender; and Bank of Montreal, as CanadianAdministrative Agent, Issuing Bank and Swingline Lender.
10.20 Subsidiary Guarantee Agreement, dated as of March 2, 2005, 8-K 99.2 May 7, 2005among Molson Coors Brewing Company, Coors BrewingCompany, Molson Canada 2005, Molson Inc. Molson CoorsCanada Inc. and Coors Brewers Limited, each subsidiary of theCompany listed on Schedule I thereto and Wachovia Bank,National Association, as Administrative Agent, on behalf of theLenders under the Credit Agreement referred to above.
10.21 Confirmation, dated as of March 8, 2007, to the Credit 10-Q 10.1 August 7, 2007Agreement, dated March 2, 2005, among Molson CoorsBrewing Company, Coors Brewing Company, Molson Canada2005, Molson Inc., Molson Coors Canada Inc. and CoorsBrewers Limited; the Lenders party thereto; Wachovia Bank,National Association, as Administrative Agent, Issuing Bankand Swingline Lender; and Bank of Montreal, as CanadianAdministrative Agent, Issuing Bank and Swingline Lender.
10.22 Supplement Nos. 1, 2, 3, 4, 5 and 6, dated as of April 9, 2007, 10-Q 10.2 August 7, 2007to the Subsidiary Guarantee Agreement, dated March 2, 2005,among Molson Coors Brewing Company, Coors BrewingCompany, Molson Canada 2005, Molson Inc., Molson CoorsCanada Inc. and Coors Brewers Limited; the Lenders partythereto; Wachovia Bank, National Association, asAdministrative Agent, Issuing Bank and Swingline Lender; andBank of Montreal, as Canadian Administrative Agent, IssuingBank and Swingline Lender Lender.
169
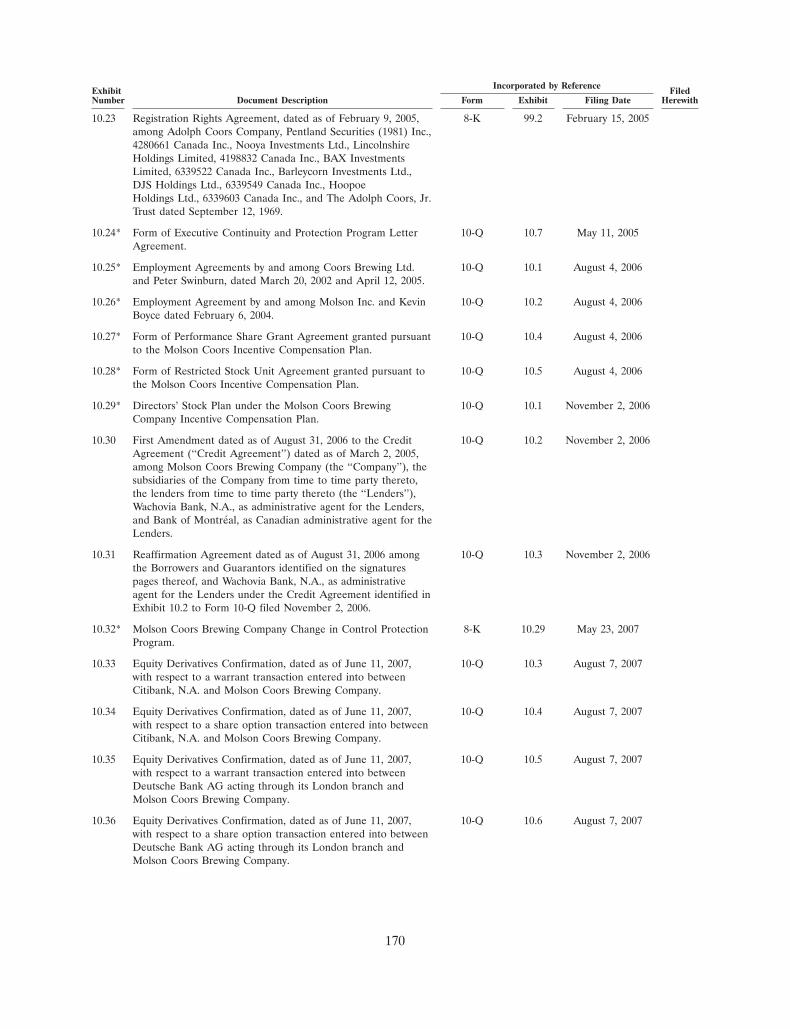
Incorporated by ReferenceExhibit FiledNumber Document Description Form Exhibit Filing Date Herewith
10.23 Registration Rights Agreement, dated as of February 9, 2005, 8-K 99.2 February 15, 2005among Adolph Coors Company, Pentland Securities (1981) Inc.,4280661 Canada Inc., Nooya Investments Ltd., LincolnshireHoldings Limited, 4198832 Canada Inc., BAX InvestmentsLimited, 6339522 Canada Inc., Barleycorn Investments Ltd.,DJS Holdings Ltd., 6339549 Canada Inc., HoopoeHoldings Ltd., 6339603 Canada Inc., and The Adolph Coors, Jr.Trust dated September 12, 1969.
10.24* Form of Executive Continuity and Protection Program Letter 10-Q 10.7 May 11, 2005Agreement.
10.25* Employment Agreements by and among Coors Brewing Ltd. 10-Q 10.1 August 4, 2006and Peter Swinburn, dated March 20, 2002 and April 12, 2005.
10.26* Employment Agreement by and among Molson Inc. and Kevin 10-Q 10.2 August 4, 2006Boyce dated February 6, 2004.
10.27* Form of Performance Share Grant Agreement granted pursuant 10-Q 10.4 August 4, 2006to the Molson Coors Incentive Compensation Plan.
10.28* Form of Restricted Stock Unit Agreement granted pursuant to 10-Q 10.5 August 4, 2006the Molson Coors Incentive Compensation Plan.
10.29* Directors’ Stock Plan under the Molson Coors Brewing 10-Q 10.1 November 2, 2006Company Incentive Compensation Plan.
10.30 First Amendment dated as of August 31, 2006 to the Credit 10-Q 10.2 November 2, 2006Agreement (‘‘Credit Agreement’’) dated as of March 2, 2005,among Molson Coors Brewing Company (the ‘‘Company’’), thesubsidiaries of the Company from time to time party thereto,the lenders from time to time party thereto (the ‘‘Lenders’’),Wachovia Bank, N.A., as administrative agent for the Lenders,and Bank of Montreal, as Canadian administrative agent for theLenders.
10.31 Reaffirmation Agreement dated as of August 31, 2006 among 10-Q 10.3 November 2, 2006the Borrowers and Guarantors identified on the signaturespages thereof, and Wachovia Bank, N.A., as administrativeagent for the Lenders under the Credit Agreement identified inExhibit 10.2 to Form 10-Q filed November 2, 2006.
10.32* Molson Coors Brewing Company Change in Control Protection 8-K 10.29 May 23, 2007Program.
10.33 Equity Derivatives Confirmation, dated as of June 11, 2007, 10-Q 10.3 August 7, 2007with respect to a warrant transaction entered into betweenCitibank, N.A. and Molson Coors Brewing Company.
10.34 Equity Derivatives Confirmation, dated as of June 11, 2007, 10-Q 10.4 August 7, 2007with respect to a share option transaction entered into betweenCitibank, N.A. and Molson Coors Brewing Company.
10.35 Equity Derivatives Confirmation, dated as of June 11, 2007, 10-Q 10.5 August 7, 2007with respect to a warrant transaction entered into betweenDeutsche Bank AG acting through its London branch andMolson Coors Brewing Company.
10.36 Equity Derivatives Confirmation, dated as of June 11, 2007, 10-Q 10.6 August 7, 2007with respect to a share option transaction entered into betweenDeutsche Bank AG acting through its London branch andMolson Coors Brewing Company.
170
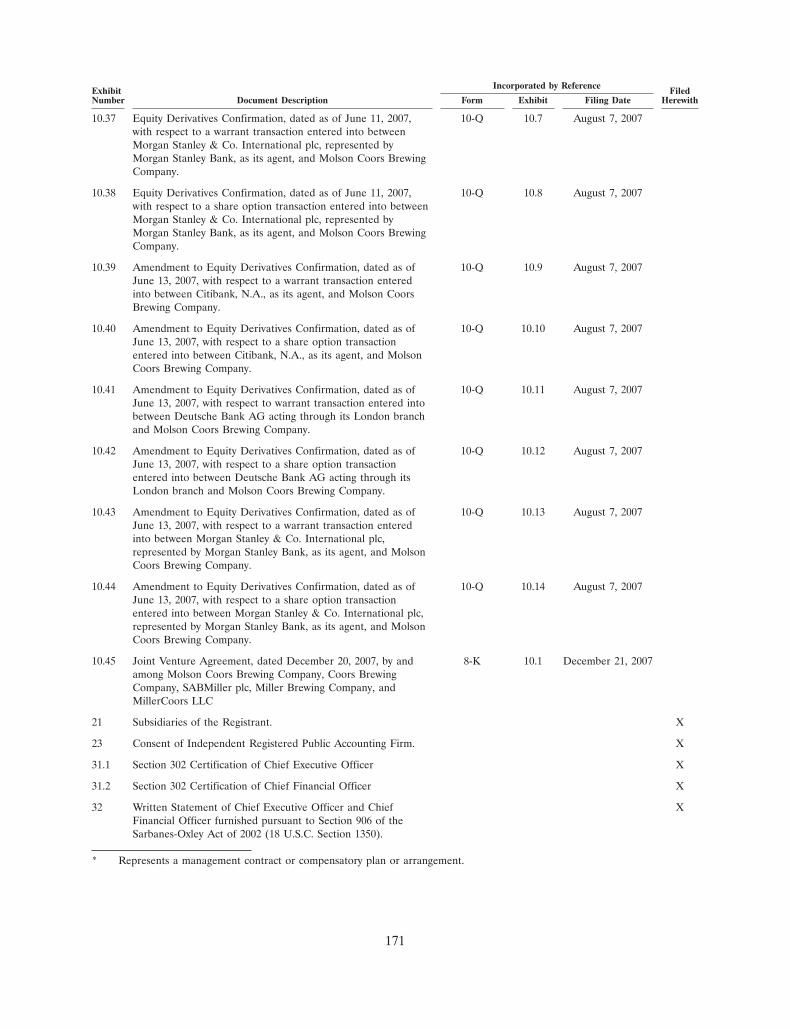
Incorporated by ReferenceExhibit FiledNumber Document Description Form Exhibit Filing Date Herewith
10.37 Equity Derivatives Confirmation, dated as of June 11, 2007, 10-Q 10.7 August 7, 2007with respect to a warrant transaction entered into betweenMorgan Stanley & Co. International plc, represented byMorgan Stanley Bank, as its agent, and Molson Coors BrewingCompany.
10.38 Equity Derivatives Confirmation, dated as of June 11, 2007, 10-Q 10.8 August 7, 2007with respect to a share option transaction entered into betweenMorgan Stanley & Co. International plc, represented byMorgan Stanley Bank, as its agent, and Molson Coors BrewingCompany.
10.39 Amendment to Equity Derivatives Confirmation, dated as of 10-Q 10.9 August 7, 2007June 13, 2007, with respect to a warrant transaction enteredinto between Citibank, N.A., as its agent, and Molson CoorsBrewing Company.
10.40 Amendment to Equity Derivatives Confirmation, dated as of 10-Q 10.10 August 7, 2007June 13, 2007, with respect to a share option transactionentered into between Citibank, N.A., as its agent, and MolsonCoors Brewing Company.
10.41 Amendment to Equity Derivatives Confirmation, dated as of 10-Q 10.11 August 7, 2007June 13, 2007, with respect to warrant transaction entered intobetween Deutsche Bank AG acting through its London branchand Molson Coors Brewing Company.
10.42 Amendment to Equity Derivatives Confirmation, dated as of 10-Q 10.12 August 7, 2007June 13, 2007, with respect to a share option transactionentered into between Deutsche Bank AG acting through itsLondon branch and Molson Coors Brewing Company.
10.43 Amendment to Equity Derivatives Confirmation, dated as of 10-Q 10.13 August 7, 2007June 13, 2007, with respect to a warrant transaction enteredinto between Morgan Stanley & Co. International plc,represented by Morgan Stanley Bank, as its agent, and MolsonCoors Brewing Company.
10.44 Amendment to Equity Derivatives Confirmation, dated as of 10-Q 10.14 August 7, 2007June 13, 2007, with respect to a share option transactionentered into between Morgan Stanley & Co. International plc,represented by Morgan Stanley Bank, as its agent, and MolsonCoors Brewing Company.
10.45 Joint Venture Agreement, dated December 20, 2007, by and 8-K 10.1 December 21, 2007among Molson Coors Brewing Company, Coors BrewingCompany, SABMiller plc, Miller Brewing Company, andMillerCoors LLC
21 Subsidiaries of the Registrant. X
23 Consent of Independent Registered Public Accounting Firm. X
31.1 Section 302 Certification of Chief Executive Officer X
31.2 Section 302 Certification of Chief Financial Officer X
32 Written Statement of Chief Executive Officer and Chief XFinancial Officer furnished pursuant to Section 906 of theSarbanes-Oxley Act of 2002 (18 U.S.C. Section 1350).
* Represents a management contract or compensatory plan or arrangement.
171
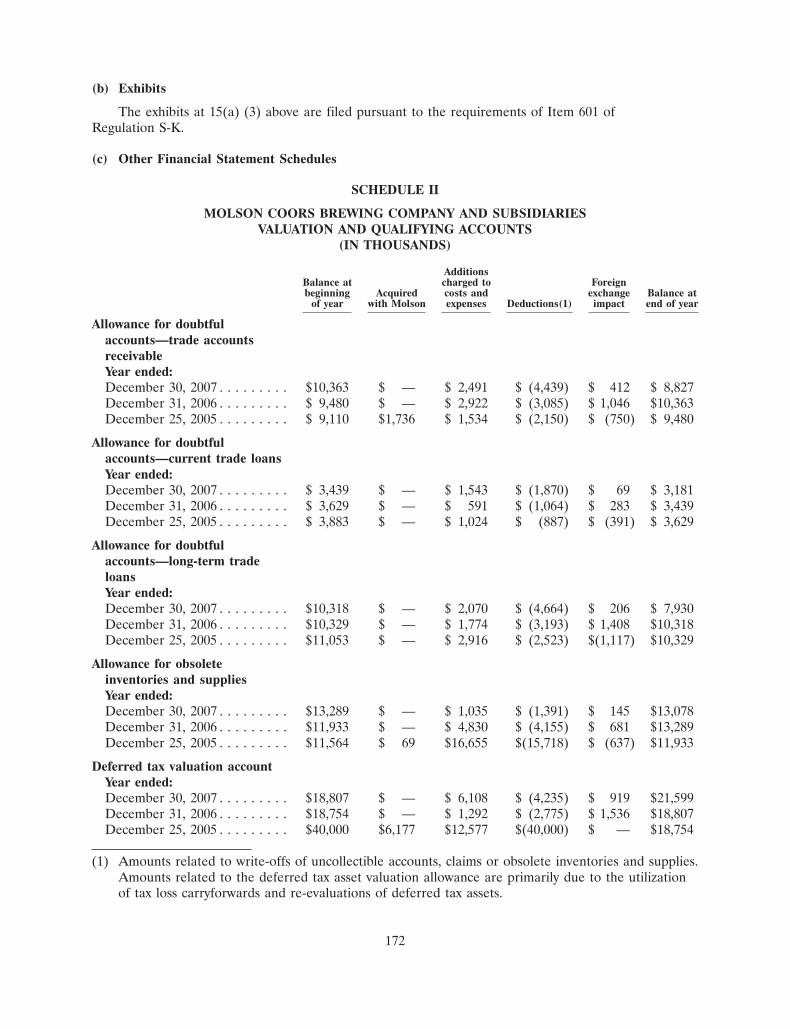
(b) Exhibits
The exhibits at 15(a) (3) above are filed pursuant to the requirements of Item 601 ofRegulation S-K.
(c) Other Financial Statement Schedules
SCHEDULE II
MOLSON COORS BREWING COMPANY AND SUBSIDIARIESVALUATION AND QUALIFYING ACCOUNTS
(IN THOUSANDS)
AdditionsBalance at charged to Foreignbeginning Acquired costs and exchange Balance at
of year with Molson expenses Deductions(1) impact end of year
Allowance for doubtfulaccounts—trade accountsreceivableYear ended:December 30, 2007 . . . . . . . . . $10,363 $ — $ 2,491 $ (4,439) $ 412 $ 8,827December 31, 2006 . . . . . . . . . $ 9,480 $ — $ 2,922 $ (3,085) $ 1,046 $10,363December 25, 2005 . . . . . . . . . $ 9,110 $1,736 $ 1,534 $ (2,150) $ (750) $ 9,480
Allowance for doubtfulaccounts—current trade loansYear ended:December 30, 2007 . . . . . . . . . $ 3,439 $ — $ 1,543 $ (1,870) $ 69 $ 3,181December 31, 2006 . . . . . . . . . $ 3,629 $ — $ 591 $ (1,064) $ 283 $ 3,439December 25, 2005 . . . . . . . . . $ 3,883 $ — $ 1,024 $ (887) $ (391) $ 3,629
Allowance for doubtfulaccounts—long-term tradeloansYear ended:December 30, 2007 . . . . . . . . . $10,318 $ — $ 2,070 $ (4,664) $ 206 $ 7,930December 31, 2006 . . . . . . . . . $10,329 $ — $ 1,774 $ (3,193) $ 1,408 $10,318December 25, 2005 . . . . . . . . . $11,053 $ — $ 2,916 $ (2,523) $(1,117) $10,329
Allowance for obsoleteinventories and suppliesYear ended:December 30, 2007 . . . . . . . . . $13,289 $ — $ 1,035 $ (1,391) $ 145 $13,078December 31, 2006 . . . . . . . . . $11,933 $ — $ 4,830 $ (4,155) $ 681 $13,289December 25, 2005 . . . . . . . . . $11,564 $ 69 $16,655 $(15,718) $ (637) $11,933
Deferred tax valuation accountYear ended:December 30, 2007 . . . . . . . . . $18,807 $ — $ 6,108 $ (4,235) $ 919 $21,599December 31, 2006 . . . . . . . . . $18,754 $ — $ 1,292 $ (2,775) $ 1,536 $18,807December 25, 2005 . . . . . . . . . $40,000 $6,177 $12,577 $(40,000) $ — $18,754
(1) Amounts related to write-offs of uncollectible accounts, claims or obsolete inventories and supplies.Amounts related to the deferred tax asset valuation allowance are primarily due to the utilizationof tax loss carryforwards and re-evaluations of deferred tax assets.
172
SIGNATURES
Pursuant to the requirements of Section 13 or 15(d) of the Securities Exchange Act of 1934, theRegistrant has duly caused this report to be signed on its behalf by the undersigned, thereunto dulyauthorized.
MOLSON COORS BREWING COMPANY
By /s/ W. LEO KIELY III President, Global Chief Executive Officer andDirector (Principal Executive Officer)W. Leo Kiely III
By /s/ TIMOTHY V. WOLF Global Chief Financial Officer (PrincipalFinancial Officer)Timothy V. Wolf
By /s/ MARTIN L. MILLER Vice President and Global Controller (ChiefAccounting Officer)Martin L. Miller
Pursuant to the requirements of the Securities Exchange Act of 1934, this report has been signedbelow by the following directors on behalf of the Registrant and in the capacities and on the dateindicated.
By /s/ ERIC H. MOLSON Chairman
Eric H. Molson
By /s/ PETER H. COORS Vice Chairman
Peter H. Coors
By /s/ FRANCESCO BELLINI Director
Francesco Bellini
By /s/ ROSALIND G. BREWER Director
Rosalind G. Brewer
By /s/ JOHN E. CLEGHORN Director
John E. Cleghorn
By /s/ MELISSA E. COORS OSBORN Director
Melissa E. Coors Osborn
By /s/ CHARLES M. HERINGTON Director
Charles M. Herington
By /s/ FRANKLIN W. HOBBS Director
Franklin W. Hobbs
173
By /s/ ANDREW T. MOLSON Director
Andrew T. Molson
By /s/ DAVID P. O’BRIEN Director
David P. O’Brien
By /s/ PAMELA H. PATSLEY Director
Pamela H. Patsley
By /s/ H. SANFORD RILEY Director
H. Sanford Riley
February 21, 2008
174