molson coors brewing 2005_AR_ENG
142
PASSION Molson Coors Brewing Company 2005 Annual Report
-
Upload
finance46 -
Category
Economy & Finance
-
view
873 -
download
1
description
Transcript of molson coors brewing 2005_AR_ENG

PASSION
Molson Coors Brewing Company 2005 Annual Report

PRIDE

HERITAGE

2 M O L S O N C O O R S B R E W I N G C O M P A N Y
You can’t buy passion, pride and
that dwell in flesh and blood.
over generations. These are key
foundation of our future.
But come to think of it, there is
pride and heritage…

M O L S O N C O O R S B R E W I N G C O M P A N Y 3
heritage. These are qualities
These are attributes that form
Molson Coors strengths and the
one way you can buy passion,

4 M O L S O N C O O R S B R E W I N G C O M P A N Y
In our beers. Every beer we brew reflects our passion, our pride and our heritage. A combination
of great taste and superb quality, our beers are as unique as our history – and set
us apart in today’s highly competitive and consolidating global beer marketplace.
But we know that everywhere in the world, to win in the beer business we must also
be great brand-builders, solid business strategists and aggressive, agile implementers.
That’s our focus at Molson Coors.
Corona Extra, Heineken and Miller Genuine Draft are partner brands in Canada. Grolsch is a partner brand in the United Kingdom.

6 M O L S O N C O O R S B R E W I N G C O M P A N Y
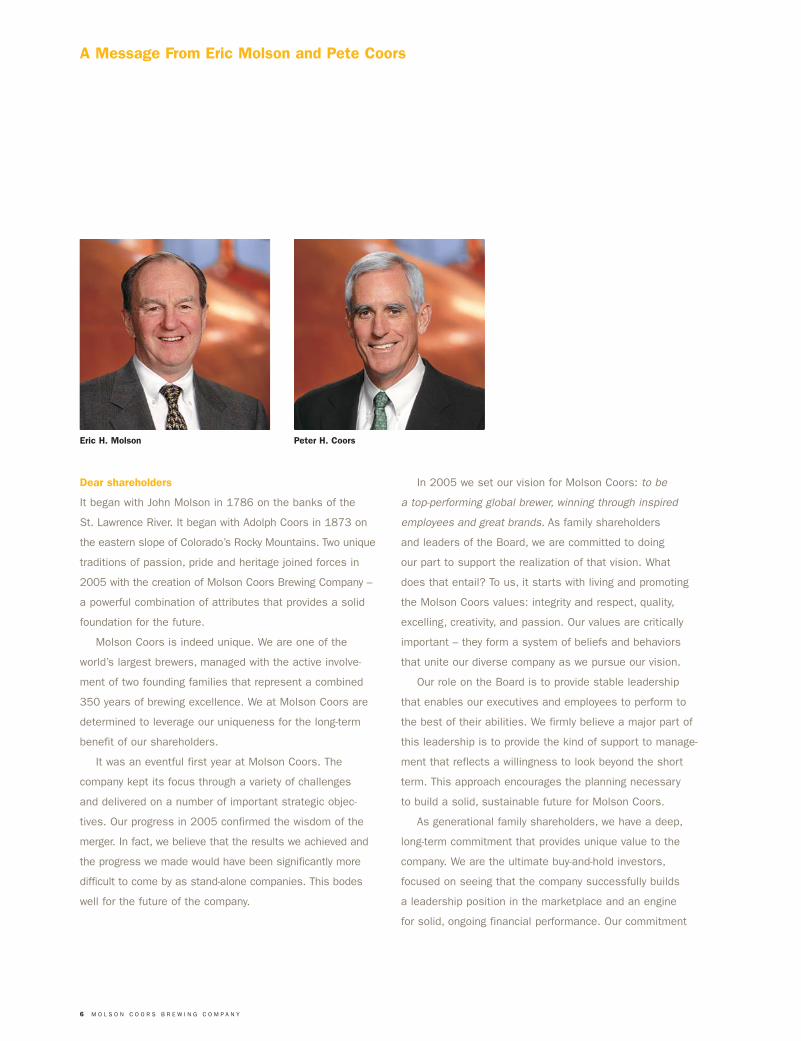
Dear shareholders
It began with John Molson in 1786 on the banks of the
St. Lawrence River. It began with Adolph Coors in 1873 on
the eastern slope of Colorado’s Rocky Mountains. Two unique
traditions of passion, pride and heritage joined forces in
2005 with the creation of Molson Coors Brewing Company –
a powerful combination of attributes that provides a solid
foundation for the future.
Molson Coors is indeed unique. We are one of the
world’s largest brewers, managed with the active involve-
ment of two founding families that represent a combined
350 years of brewing excellence. We at Molson Coors are
determined to leverage our uniqueness for the long-term
benefit of our shareholders.
It was an eventful first year at Molson Coors. The
company kept its focus through a variety of challenges
and delivered on a number of important strategic objec-
tives. Our progress in 2005 confirmed the wisdom of the
merger. In fact, we believe that the results we achieved and
the progress we made would have been significantly more
difficult to come by as stand-alone companies. This bodes
well for the future of the company.
A Message From Eric Molson and Pete Coors
In 2005 we set our vision for Molson Coors: to be
a top-performing global brewer, winning through inspired
employees and great brands. As family shareholders
and leaders of the Board, we are committed to doing
our part to support the realization of that vision. What
does that entail? To us, it starts with living and promoting
the Molson Coors values: integrity and respect, quality,
excelling, creativity, and passion. Our values are critically
important – they form a system of beliefs and behaviors
that unite our diverse company as we pursue our vision.
Our role on the Board is to provide stable leadership
that enables our executives and employees to perform to
the best of their abilities. We firmly believe a major part of
this leadership is to provide the kind of support to manage-
ment that reflects a willingness to look beyond the short
term. This approach encourages the planning necessary
to build a solid, sustainable future for Molson Coors.
As generational family shareholders, we have a deep,
long-term commitment that provides unique value to the
company. We are the ultimate buy-and-hold investors,
focused on seeing that the company successfully builds
a leadership position in the marketplace and an engine
for solid, ongoing financial performance. Our commitment
Eric H. Molson Peter H. Coors
M O L S O N C O O R S B R E W I N G C O M P A N Y 7
Peter H. Coors
Vice Chairman
Molson Coors Brewing Company
Eric H. Molson
Chairman of the Board
Molson Coors Brewing Company
It was an eventful first year as Molson Coors. The company kept its focus
through a variety of challenges and delivered on a number of important strategic
objectives. Our progress in 2005 confirmed the wisdom of the merger.
requires us to be knowledgeable and informed, joining
our generations of brewing expertise with a thirst to build
upon our knowledge of the current marketplace. We also
are committed to the highest standards of ethics and to
the betterment of our communities.
As family shareholders, we will seek always to do what
we believe is in the interests of long-term investors in this
great company. That is why we have formed the Board as
we have. It is a strong Board, with expertise and experi-
ence that is broad and deep. With each meeting, we have
grown stronger as a team, and we have accomplished a
great deal during our first year together, including updating
our Board committee charters in 2005. With a goal to be
nothing short of best in class in corporate governance, we
will reassess our practices on an ongoing basis.
During the course of the last year, the Board held sev-
eral of its meetings close to our breweries in order to build
meaningful firsthand knowledge of the global business and
the markets in which we operate. We acknowledge their
commitment and hard work.
We welcomed a new Director, Gary Matthews, who brings
to the Board his past experience as an executive at Bristol-
Myers Squibb Company, Pepsico and Procter & Gamble,
as well as Diageo, where he was President of Guinness
Import Company and Managing Director of Guinness U.K.
More recently, we also were very fortunate to have Rosalind
G. Brewer from Kimberly-Clark join our Board. Ms. Brewer
has a wealth of experience with consumer brands, as well as
significant manufacturing and industrial process knowledge.
We created this company to achieve great things and
we thank our shareholders who, like us, believe in the
vision of this new company. We are confident that, as the
global beer industry continues to evolve, Molson Coors will
successfully apply its passion, pride and heritage to be
one of the top performers for a long time to come.
Sincerely,

M O L S O N C O O R S B R E W I N G C O M P A N Y 9
Dear shareholders and friends
2005 was an incredible year. Tough and tiring, but exciting
and exhilarating. As I look at the year, my view tends to
be divided into three blocks: the important merger-related
pieces that fell into place; business milestones; and the
ways we reshaped the enterprise for the future.
Key merger-related accomplishments
Last year, I outlined three initial objectives for Molson Coors
out of the gate: one, realize $175 million in merger-related
synergies within three years, including $50 million the first
year; two, address key top-line challenges, including restoring
growth for Molson Canadian in Canada and for Coors Light
in the United States; and three, accelerate the pace of
cost reduction across the company.
We made solid progress in all three areas, including
surpassing our first year’s synergy objective by nearly 20 per-
cent. Also in 2005, we surpassed our debt repayment
goal and restructured the remaining Molson debt through
a highly successful cross-border offering of senior notes –
as we said we would do. Last but not least, we solidified
our management team throughout the year, both at the
corporate and operational levels.
From Leo Kiely: The CEO’s Perspective
Business milestones in a challenging global marketplace
As I mentioned, our business faced significant challenges in
all three of our major markets. In Canada, we saw continued
competition from the “value segment”, which put pressure
on premium brands’ volumes and margins. In the United
States, we fought a two-front battle against rising input
costs and the most intense competitive price discounting
we’ve seen in years. The U.K. market was very competitive
as well, with widespread price discounting in the growing
off-trade channel and consolidation in the on-trade channel,
which created larger customers and pressured margins.
Our overall financial results reflected these challenges.
Consolidated sales volume on a pro forma basis for 2005,
excluding Brazil, was 41.2 million barrels (48.3 million
hectoliters), which was a 1.4 percent decline on a compa-
rable basis from the previous year. In 2005, sales to retail
were down 1.1 percent compared with 2004. Net sales
from continuing operations on a pro forma basis were
$5.61 billion in 2005, a 4.4 percent decrease from 2004.
After-tax pro forma income from continuing operations
excluding special items declined 22.6 percent from
2004 pro forma earnings.
Molson Coors, year one. Big headwinds in all our markets – widespread price
discounting; heavy competition, both from other brewers and other beverage
categories; increasing input costs – you name it, we dealt with it. Yet we
persevered, and made significant progress across our business. While we
aren’t satisfied yet, we’re certainly encouraged. We have a lot of work yet
to do, but we got a lot of good work done.
10 M O L S O N C O O R S B R E W I N G C O M P A N Y
There were a number of bright spots. In Canada, we
accelerated Coors Light momentum, delivering double-digit
sales growth. Our strategies to reverse negative trends for
Molson Canadian showed sequential improvement in the
second, third and fourth quarters. And new marketing efforts
lifted Rickard’s, our brand in the fast-growing, higher-margin
specialty super-premium category.
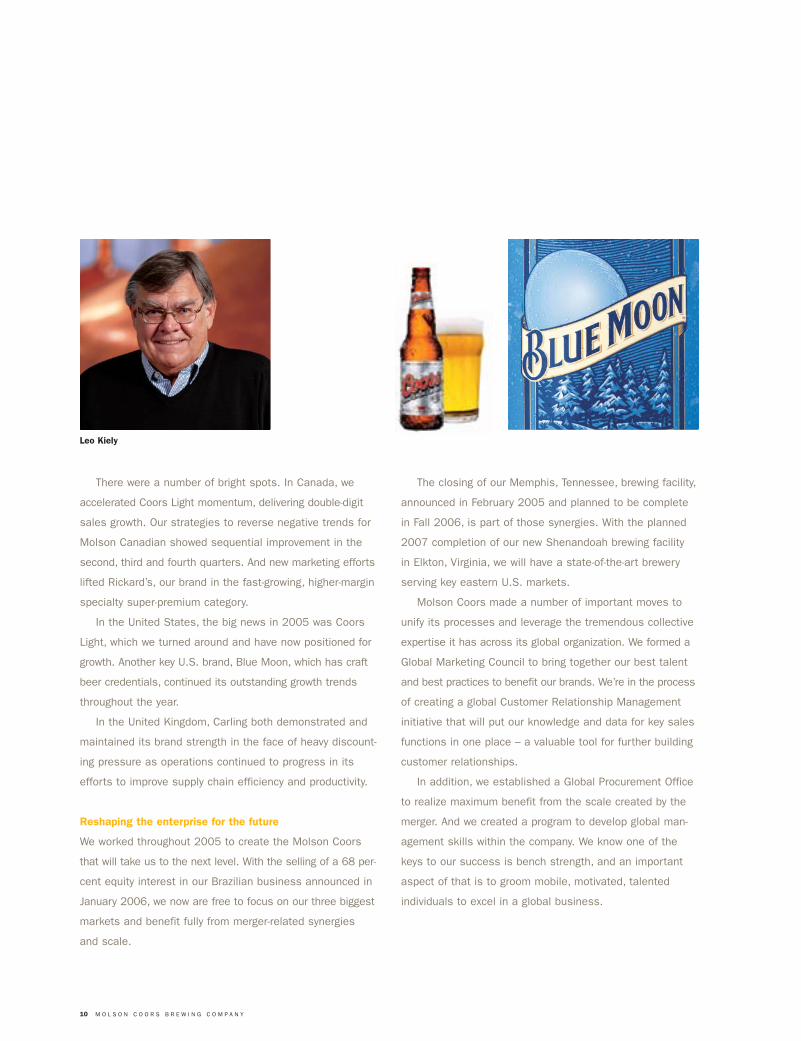
In the United States, the big news in 2005 was Coors
Light, which we turned around and have now positioned for
growth. Another key U.S. brand, Blue Moon, which has craft
beer credentials, continued its outstanding growth trends
throughout the year.
In the United Kingdom, Carling both demonstrated and
maintained its brand strength in the face of heavy discount-
ing pressure as operations continued to progress in its
efforts to improve supply chain efficiency and productivity.
Reshaping the enterprise for the future
We worked throughout 2005 to create the Molson Coors
that will take us to the next level. With the selling of a 68 per-
cent equity interest in our Brazilian business announced in
January 2006, we now are free to focus on our three biggest
markets and benefit fully from merger-related synergies
and scale.
The closing of our Memphis, Tennessee, brewing facility,
announced in February 2005 and planned to be complete
in Fall 2006, is part of those synergies. With the planned
2007 completion of our new Shenandoah brewing facility
in Elkton, Virginia, we will have a state-of-the-art brewery
serving key eastern U.S. markets.
Molson Coors made a number of important moves to
unify its processes and leverage the tremendous collective
expertise it has across its global organization. We formed a
Global Marketing Council to bring together our best talent
and best practices to benefit our brands. We’re in the process
of creating a global Customer Relationship Management
initiative that will put our knowledge and data for key sales
functions in one place – a valuable tool for further building
customer relationships.
In addition, we established a Global Procurement Office
to realize maximum benefit from the scale created by the
merger. And we created a program to develop global man-
agement skills within the company. We know one of the
keys to our success is bench strength, and an important
aspect of that is to groom mobile, motivated, talented
individuals to excel in a global business.
Leo Kiely

M O L S O N C O O R S B R E W I N G C O M P A N Y 11
Moving forward
We intend to thrive and grow. In order to do that, we
must first make significant gains in our efforts to improve
profitability and deliver sustained top-line performance.
Longer term, we see four global trends that will deter-
mine who will emerge as the next major players in the
beer business: the growing role of strong brands as drivers
of greater differentiation and profitability; the increasing
popularity of cold, refreshing, light lagers worldwide; the
importance of market-building acumen – quality, distribution,
innovation – to winning; and the need for scale to effec-
tively compete.
As a result, our focus on 2006 will be in these key
areas. First, we will intensify our efforts to build our
brands. We have to grow our big brands in big markets,
and be highly disciplined in how we promote our other
brands, from Keystone to Rickard’s. Second, we will
continue to strengthen our financial capacity, working
to reduce costs and generate cash in order to pay down
debt and invest in growth. Third, we will expand our global
competitive capabilities. And, the final area of focus is
and always will be culture. As I have said nearly every
year in my letter to you: initiatives and strategies don’t
produce results, people do.
Doing our part to promote responsible drinking and
discourage harmful consumption remains a priority across
our organization, underscored by our adoption of a Global
Alcohol Policy in 2005. We have enhanced our work with
other global industry players and within our markets to pro-
mote an effective balance between government oversight
and industry self-regulation. We proactively manage our
sales and marketing activities to ensure that they meet or
exceed company and market responsibility codes. And we
work to reduce underage and irresponsible drinking through
support of innovative programs like MVParents.com in the
United States, 1-888-TAXIGUY in Canada, and Drinkaware
in the United Kingdom.
Passion. Pride. Heritage. I have never been more
confident that we have what it takes – and will do what it
takes – to win in the beer business. Here’s to a great future.
Sincerely,
Moving forward, we intend to thrive and grow. In order to do that, we must
first make significant gains in our efforts to improve profitability and deliver
sustained top-line performance.
Leo Kiely
Chief Executive Officer
Molson Coors Brewing Company
12 M O L S O N C O O R S B R E W I N G C O M P A N Y
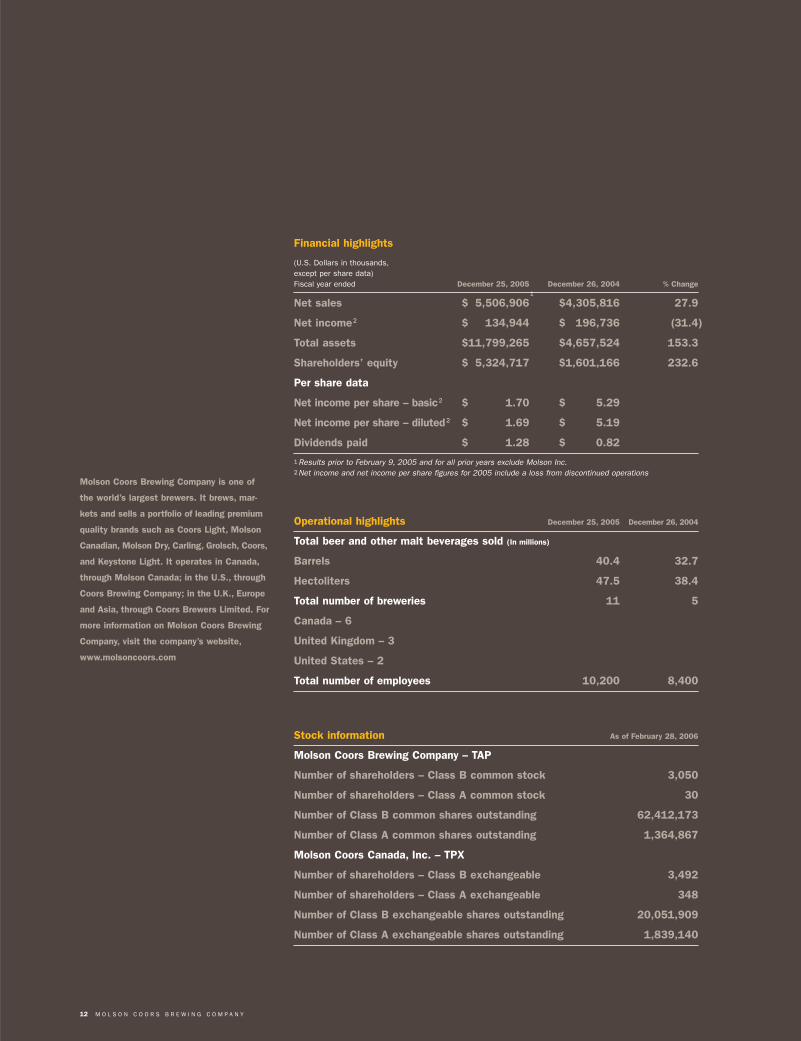
Financial highlights
(U.S. Dollars in thousands,except per share data) Fiscal year ended December 25, 2005 December 26, 2004 % Change
Net sales $÷5,506,906 $4,305,816 27.9
Net income2 $÷÷«134,944 $÷«196,736 (31.4)
Total assets $11,799,265 $4,657,524 153.3
Shareholders’ equity $÷5,324,717 $1,601,166 232.6
Per share data
Net income per share – basic2 $÷÷÷÷÷«1.70 $÷÷÷÷«5.29
Net income per share – diluted 2 $÷÷÷÷÷«1.69 $÷÷÷÷«5.19
Dividends paid $÷÷÷÷÷«1.28 $÷÷÷÷«0.82
1Results prior to February 9, 2005 and for all prior years exclude Molson Inc.2Net income and net income per share figures for 2005 include a loss from discontinued operations
Operational highlights December 25, 2005 December 26, 2004
Total beer and other malt beverages sold (In millions)
Barrels 40.4 32.7
Hectoliters 47.5 38.4
Total number of breweries 11 5
Canada – 6
United Kingdom – 3
United States – 2
Total number of employees 10,200 8,400
Stock information As of February 28, 2006
Molson Coors Brewing Company – TAP
Number of shareholders – Class B common stock 3,050
Number of shareholders – Class A common stock 30
Number of Class B common shares outstanding 62,412,173
Number of Class A common shares outstanding 1,364,867
Molson Coors Canada, Inc. – TPX
Number of shareholders – Class B exchangeable 3,492
Number of shareholders – Class A exchangeable 348
Number of Class B exchangeable shares outstanding 20,051,909
Number of Class A exchangeable shares outstanding 1,839,140
Molson Coors Brewing Company is one of
the world’s largest brewers. It brews, mar-
kets and sells a portfolio of leading premium
quality brands such as Coors Light, Molson
Canadian, Molson Dry, Carling, Grolsch, Coors,
and Keystone Light. It operates in Canada,
through Molson Canada; in the U.S., through
Coors Brewing Company; in the U.K., Europe
and Asia, through Coors Brewers Limited. For
more information on Molson Coors Brewing
Company, visit the company’s website,
www.molsoncoors.com
1

M O L S O N C O O R S B R E W I N G C O M P A N Y 13
Dear shareholders
In the face of significant challenges in all of our markets,
Molson Coors ended its first year as a merged company
in a solid position:
• We performed well on cost-saving synergies, surpassing our
first-year goal; an additional $75 million in cost-reduction
opportunities – beyond the planned $175 million in
synergies – are being developed.
• We delivered solid and credible cash-generating perform-
ance despite reduced earnings caused by difficult market
conditions and merger-related costs.
• Our balance sheet is stronger and our debt structure is
more streamlined than it was a year ago.
• Our discipline and focus around costs, capital expenditures
and cash are strong and becoming even more so – which
promises to contribute to even stronger cash generation
going forward.
From a financial perspective, we made progress in
several critical areas, including solidifying the top line in
Canada and strengthening the volume and cost structure
in our U.S. business, driven by merger synergies and
underlying cost initiatives.
A Message From CFO Tim Wolf
In fact, our U.S. team achieved a double digit increase in
operating earnings, excluding special items – encouraging
in light of the cost and discounting backdrop.
Solid cash generation in a difficult environment
The tough pricing and cost environment challenged our ability
to meet cash-generation objectives. Lower pro forma profit
reduced free cash generation by approximately $100 million
in 2005. Other cash uses included dividends, cash interest,
excess pension contributions and cash taxes, in addition
to merger-related costs.
Through great effort from our team, we more than offset
the profit shortfalls and achieved substantial pro forma
free cash flow available for debt repayment.
A stronger and more streamlined balance sheet
We transformed and strengthened our balance sheet in
2005 with the refinancing of the pre-merger Molson debt,
the reduction of the number of individual debt tranches by
nearly half and the repayment of debt. In early 2006, we
also sold most of our Brazil business, which removed debt
and contingent liabilities from our balance sheet.
Timothy V. Wolf
14 M O L S O N C O O R S B R E W I N G C O M P A N Y
Our net debt at the end of 2005 totaled $2.4 billion,
excluding the Brazil debt. After completing the merger, one
of our top priorities was to rapidly reduce special dividend
debt and we paid down approximately $360 million of it,
partially assisted by cash from some of our re-financing.
As of year-end 2005, the special dividend debt balance
was $163 million, and we expect to pay it off completely
by mid-summer of 2006, about six months ahead of our
original schedule.
Looking ahead: improved discipline and focus
around cost, capital spending and cash
In 2006, we are taking steps across our businesses to
drive improved profitability, generate free cash and repay
debt. Here are some highlights:
First, our objective is to grow earnings at a meaningful
rate in 2006. To accomplish this, we are attacking costs
aggressively in all areas of our company while maintaining
strong investment behind our sales and brand-building capa-
bilities and in value-generating capital projects. Second, we
will strive to generate $300 million of free cash flow available
for debt repayment in 2006. Third, our goal is to use free
cash flow to reduce our net debt by more than $360 million
in 2006, including the elimination of $60 million of Brazil
debt achieved by the sale of our controlling interest in Kaiser.
On a foreign-exchange-neutral basis, this would leave net
debt of approximately $2.1 billion at the end of 2006, and
well within range of our $2 billion steady-state goal for debt.
A bright future for Molson Coors
We have a focused team with an ability to deliver the cost
synergies and leverage other cost-reducing ideas that we did
not conceive before the merger. We are building our global
capabilities, as well as a winning and inspired culture.
Despite the recent challenges in the beer industry
across the globe, we are encouraged by the potential we
see in our company and the energy and focus that our team
is bringing to harvest that potential. This is great work, and
I believe strongly that we are up to the challenge.
Sincerely,
We are investing to build brands in all of our markets and capitalize on
our top-line momentum. At the same time, we are striving to go beyond what
we envisioned a year ago to reduce costs, streamline processes and systems,
tighten financial disciplines, grow profits, generate free cash and de-leverage
our balance sheet to support profitable growth in the future.
Timothy V. Wolf
Global Chief Financial Officer
Molson Coors Brewing Company

M O L S O N C O O R S B R E W I N G C O M P A N Y 15
Officers
W. Leo Kiely IIIPresident and Chief Executive Officer
Kevin T. BoycePresident and Chief Executive Officer,Molson Canada
Ralph HargrowGlobal Chief People Officer
Sylvia MorinGlobal Chief Corporate Affairs Officer
Cathy NoonanGlobal Chief Synergies andProcurement Officer
Dave PerkinsGlobal Chief Strategy andCommercial Officer
W. Leo Kiely III
Sylvia Morin Dave Perkins
Kevin T. Boyce
Cathy Noonan
Peter Swinburn Frits van Paasschen
Timothy V. Wolf
Ralph Hargrow
Gregory L. Wade
Samuel D. Walker
Peter SwinburnPresident and Chief Executive Officer,Coors Brewers Limited
Frits van PaasschenPresident and Chief Executive Officer,Coors Brewing Company
Gregory L. WadeGlobal Chief Technical Officer
Samuel D. WalkerGlobal Chief Legal Officer/Corporate Secretary
Timothy V. WolfGlobal Chief Financial Officer

16 M O L S O N C O O R S B R E W I N G C O M P A N Y
Eric H. Molson ★
Chairman of the Board,Molson Coors Brewing Company
Peter H. Coors ■ ★
Vice Chairman of the Board,Molson Coors Brewing Company
W. Leo Kiely IIIChief Executive Officer,Molson Coors Brewing Company
Dr. Francesco Bellini ◆
Chairman and Chief Executive Officer,Neurochem Inc.
Rosalind G. BrewerPresident of the GlobalNonwovens Sector,Kimberly-ClarkCorporation
John E. Cleghorn ◆ ★
Chairman of the Board,SNC-Lavalin Group, Inc.
Charles M. Herington ◆
Senior Vice President,Avon Latin America
Eric H. Molson
Dr. Francesco Bellini
Charles M. Herington
Andrew T. Molson
Pamela H. Patsley
Peter H. Coors
Rosalind G. Brewer
Franklin W. Hobbs
David P. O’Brien
H. Sanford Riley
W. Leo Kiely III
John E. Cleghorn
Gary S. Matthews
Melissa Coors Osborn
Board of Directors
Franklin W. Hobbs ● ■
Former Chief Executive Officer,Houlihan Lokey Howard& Zukin and Partner,One Equity Partners
Gary S. Matthews ◆ ■
President and Chief Executive Officer,Sleep Innovations, Inc.
Andrew T. Molson ★
Vice-Chairman,Legal Affairs andCorporate SecretaryNATIONAL PublicRelations (Canada) Inc.
David P. O’Brien ● ■
Chairman of the Board,Royal Bank of Canadaand EnCana Corporation
Melissa Coors Osborn ★
Group Manager, StrategyCoors Brewing Company
Pamela H. Patsley ●
President,First Data International
H. Sanford Riley ◆
President and Chief Executive Officer,Richardson FinancialGroup
● Audit Committee◆ Compensation and Human Resources Committee■ Finance Committee★ Nominating Committee
UNITED STATES SECURITIES AND EXCHANGE COMMISSION
Washington, D.C. 20549
FORM 10-K (Mark One) ⌧ ANNUAL REPORT PURSUANT TO SECTION 13 OR 15(d) OF THE SECURITIES EXCHANGE
ACT OF 1934 For the Fiscal year ended December 25, 2005
OR TRANSITION REPORT PURSUANT TO SECTION 13 OR 15(d) OF THE SECURITIES
EXCHANGE ACT OF 1934 For the transition period from to .
Commission file number 1-14829
MOLSON COORS BREWING COMPANY (Exact name of registrant as specified in its charter)
DELAWARE 84-0178360 (State or other jurisdiction of incorporation or organization)
(I.R.S. Employer Identification No.)
1225 17th Street, Denver, Colorado 1555 Notre Dame Street East, Montréal, Québec, Canada
80202 H2L 2R5
(Address of principal executive offices) (Zip Code) 303-279-6565 (Colorado) 514-521-1786 (Québec)
(Registrant’s telephone number, including area code) Securities registered pursuant to Section 12(b) of the Act: Title of each class Name of each exchange on which registered Class A Common Stock (voting), $0.01 par value New York Stock Exchange
Toronto Stock Exchange Class B Common Stock (non-voting), $0.01 par value New York Stock Exchange
Toronto Stock Exchange Securities registered pursuant to Section 12(g) of the Act: Title of class None Indicate by check mark if the registrant is a well-known seasoned issuer, as defined in Rule 405 of the Securities Act. YES ⌧ NO Indicate by check mark if the registrant is not required to file reports pursuant to Section 13 or Section 15(d) of the Act. YES NO ⌧ Indicate by check mark whether the registrant (1) has filed all reports required to be filed by Section 13 or 15(d) of the Securities Exchange Act of 1934 during the preceding 12 months (or for such shorter period that the registrant was required to file such reports), and (2) has been subject to such filing requirements for the past 90 days. YES ⌧ NO Indicate by check mark if disclosure of delinquent filers pursuant to Item 405 of Regulation S-K is not contained herein, and will not be contained, to the best of registrant’s knowledge, in definitive proxy or information statements incorporated by reference in Part III of this Form 10-K or any amendment to this Form 10-K. YES ⌧ NO Indicate by check mark whether the registrant is a large accelerated filer ⌧, an accelerated filer , or a non-accelerated filer (check one). See definition of “accelerated filer and large accelerated filer” in Rule 12b-2 of the Exchange Act Indicate by check mark whether the registrant is a shell company (as defined in Rule 12b-2 of the Act). Yes ⌧ No The aggregate market value of the registrant’s publicly-traded stock held by non-affiliates of the registrant at the close of business on June 26, 2005, was $4,075,391,702 based upon the last sales price reported for such date on the New York Stock Exchange. For purposes of this disclosure, shares of common and exchangeable stock held by persons holding more than 5% of the outstanding shares of stock and shares owned by officers and directors of the registrant as of June 26, 2005 are excluded in that such persons may be deemed to be affiliates. This determination is not necessarily conclusive of affiliate status. The number of shares outstanding of each of the registrant’s classes of common stock, as of February 28, 2006: Class A Common Stock—1,364,867 shares Class B Common Stock—62,412,173 shares Exchangeable shares: As of February 28, 2006, the following number of exchangeable shares was outstanding for Molson Coors Canada, Inc.: Class A Exchangeable Shares—1,839,140 Class B Exchangeable Shares—20,051,909 In addition, the registrant has outstanding one share of special Class A voting stock, through which the holders of Class A Exchangeable shares and Class B exchangeable shares of Molson Coors Canada Inc. (a subsidiary of the registrant), respectively, may exercise their voting rights with respect to the registrant. The special Class A and Class B voting stock are entitled to one vote for each of the exchangeable shares, respectively, excluding shares held by the registrant or its subsidiaries, and generally vote together with the Class A common stock and Class B common stock, respectively, on all matters on which the Class A common stock and class B common stock are entitled to vote. The trustee holder of the special class A voting stock and the special Class B voting stock has the right to cast a number of votes equal to the number of then outstanding Class A exchangeable shares and Class B exchangeable shares, respectively. Documents Incorporated by Reference: Portions of the registrant’s definitive proxy statement for the registrant’s 2006 annual meeting of stockholders are incorporated by reference under Part III of this Annual Report on Form 10-K.
2
MOLSON COORS BREWING COMPANY AND SUBSIDIARIES INDEX
Page(s) PART I. 3 Item 1. Business............................................................................................................................................................ 3 Item 1A. Risk Factors...................................................................................................................................................... 13 Item 1B. Unresolved Staff Comments............................................................................................................................ 17 Item 2. Properties.......................................................................................................................................................... 17 Item 3. Legal Proceedings............................................................................................................................................ 18 Item 4. Submission of Matters to a Vote of Security Holders .................................................................................... 19 PART II. 19 Item 5. Market for the Registrant’s Common Equity and Issuer Purchases of Equity Securities.............................. 19 Item 6. Selected Financial Data ................................................................................................................................... 21 Item 7. Management’s Discussion and Analysis of Financial Condition and Results of Operations........................ 22 Item 7A. Quantitative and Qualitative Disclosures About Market Risk ....................................................................... 46 Item 8. Financial Statements and Supplementary Data............................................................................................... 49 Item 9. Changes in and Disagreements With Accountants on Accounting and Financial Disclosure....................... 108 Item 9A. Controls and Procedures .................................................................................................................................. 108 Item 9B. Other Information ............................................................................................................................................ 110 PART III. 110 Item 10. Directors and Executive Officers of the Registrant ........................................................................................ 110 Item 11. Executive Compensation ................................................................................................................................. 110 Item 12. Security Ownership of Certain Beneficial Owners and Management and Related Stockholder Matters ..... 110 Item 13. Certain Relationships and Related Transactions............................................................................................. 111 Item 14. Principal Accounting Fees and Services ......................................................................................................... 111 PART IV. 111 Item 15. Exhibits and Financial Statement Schedules................................................................................................... 111 Signatures............................................................................................................................................................................... 116
3
PART I ITEM 1. Business On February 9, 2005, Adolph Coors Company merged with Molson Inc. (the Merger). In connection with the Merger, Adolph Coors Company became the parent of the merged company and changed its name to Molson Coors Brewing Company. Unless otherwise noted in this report, any description of us includes Molson Coors Brewing Company (MCBC) (formerly Adolph Coors Company), principally a holding company, and its operating subsidiaries: Coors Brewing Company (CBC), operating in the United States (US); Coors Brewers Limited (CBL), operating in the United Kingdom (UK); Molson Inc. (Molson), operating in Canada; Cervejarias Kaiser S.A. (Kaiser), operated in Brazil and presented as a discontinued operation in this report; and our other corporate entities. Any reference to “Coors” means the Adolph Coors Company prior to the Merger. Any reference to Molson Inc. means Molson prior to the Merger. Any reference to “Molson Coors” means MCBC, after the Merger. Unless otherwise indicated, information in this report is presented in US Dollars (US $). (a) General Development of Business Molson was founded in 1786 and Coors was founded in 1873. Since each company was founded, they have been committed to producing the highest-quality beers. Our brands are designed to appeal to a wide range of consumer tastes, styles and price preferences. Until Coors’ acquisition of CBL in February 2002, and Molson Inc.’s acquisition of Kaiser in March 2002, we operated and sold our beverages predominately in North America and in a few international markets. As a result of the Merger, we became the fifth-largest brewer by volume in the world. The Merger The Merger was effected by the exchange of Coors stock for Molson stock in a transaction that was valued at approximately $3.6 billion. Coors is considered the acquirer for accounting purposes, although the transaction was viewed as a merger of equals by the two companies. The transaction is discussed in Note 2 to the accompanying Consolidated Financial Statements in Item 8 on page 76. Sale of Kaiser—Event Subsequent to Balance Sheet Date On January 13, 2006, we sold a 68% equity interest in Kaiser to FEMSA Cerveza S.A. de C.V. (FEMSA). Kaiser is the third largest brewer in Brazil. Kaiser’s key brands include Kaiser Pilsen®, and Bavaria®. We have retained a 15% ownership interest in the operations, which will be reflected as a cost method investment for accounting purposes. Our financial statements accompanying this report present Kaiser as a discontinued operation. Joint Ventures and Other Arrangements To focus on our core competencies in manufacturing, marketing and selling malt beverage products, we have entered into joint venture arrangements with third parties over the past decade to leverage their strengths in areas like can and bottle manufacturing, transportation, distribution, packaging, engineering, energy production and information technology. Additionally, before the Merger, Coors and Molson participated in joint ventures to market Coors products in Canada (Molson Coors Canada), and Molson Inc. products in the United States (Molson USA). (b) Financial Information About Segments Our reporting segments have been realigned as a result of the Merger. We have three operating segments: United States, Canada and Europe. Prior to being segregated and reported as a discontinued operation, and subsequent to the Merger in 2005, Brazil was a segment. A separate operating team manages each segment, and each segment consists of manufacturing, marketing and sale of beer and other beverage products. See Note 6 in Item 8, Financial Statements and Supplementary Data on page 84, for financial information relating to our segments and operations, including geographic information.
4
(c) Narrative Description of Business Some of the following statements may describe our expectations regarding future products and business plans, financial results, performance and events. Actual results may differ materially from any such forward-looking statements. Please see Cautionary Statement Pursuant to Safe Harbor Provisions of the Private Securities Litigation Reform Act of 1995 on page 14, for some of the factors that may negatively impact our performance. The following statements are made, expressly subject to those and other risk factors. Our Products Brands sold primarily in the United States include: Coors Light®, Coors®, Coors® Non-Alcoholic, Extra Gold®, Zima XXX®, Aspen Edge™, George Killian’s® Irish Red™ Lager, Keystone®, Keystone Light®, Keystone Ice®, and Blue Moon™ Belgian White Ale. We also sell the Molson family of brands in the United States. Brands sold primarily in Canada include Molson Canadian®, Coors Light, Molson Dry®, Molson Export®, Creemore Springs®, Rickard’s Red Ale®, Carling® and Pilsner®. We also brew or distribute under license the following brands: Amstel Light® under license from Amstel Brouwerij B.V., Heineken® and Murphy’s® under license from Heineken Brouwerijen B.V., Asahi® and Asahi Select® under license from Asahi Beer USA Inc., and Asahi Breweries, Ltd., Corona® under license from Cerveceria Modelo S.A. De C.V. and Canacermex, Inc., Miller Lite®, Miller Genuine Draft®, Milwaukee’s Best® and Milwaukee’s Best Dry® under license from Miller Brewing Company, and Foster’s® and Foster’s Special Bitter® under license from Carlton & United Beverages Limited. Brands sold primarily in the United Kingdom include: Carling®, Coors Fine Light Beer®, Worthington’s®, Caffrey’s®, Reef®, Screamers™ and Stones®. We also sell Grolsch® in the United Kingdom through a joint venture. We also sell factored brands in our UK segment. We sold approximately 56% of our 2005 reported volume in the United States segment, 18% in the Canada segment and 26% in the Europe segment. In 2005, our largest brands accounted for the following percentage of total consolidated volume: Coors Light accounted for approximately 39% of reported volume, Carling for approximately 17%, and Molson Canadian for approximately 4%. Our sales volume from continuing operations totaled 40.4 million barrels in 2005 and 32.7 million barrels in both 2004 and 2003. Brazil volume was 5.5 million barrels in 2005. The barrel sales figures for periods prior to our Merger on February 9, 2005, do not include barrel sales of our products sold in Canada or the United States through the Molson Coors Canada or Molson USA joint ventures. An additional 1.6 and 1.5 million barrels of beer were sold by Molson Coors Canada in 2004 and 2003, respectively. Our Molson USA venture sold 0.8 and 0.9 million barrels in 2004 and 2003, respectively. Our reported sales volumes also do not include the CBL factored brands business. No single customer accounted for more than 10% of our consolidated or segmented sales in 2005, 2004 or 2003.
United States Segment The United States (US) segment produces, markets, and sells the Coors portfolio of brands in the United States and its territories and includes the results of the Rocky Mountain Metal Corporation (RMMC) and Rocky Mountain Bottle Corporation (RMBC) joint ventures consolidated beginning in 2004 under FIN 46R. The US segment also includes a small amount of Coors brand volume that is sold outside of the United States and its territories, including primarily Mexico and the Caribbean, as well as sales of Molson products in the United States. Sales and Distribution In the United States, beer is generally distributed through a three-tier system consisting of manufacturers, distributors and retailers. A national network of over 500 independent distributors purchases our products and distributes them to retail accounts. We also own three distributorships which collectively handled less than 3% of our total US segments volume in 2005. In Puerto Rico, we market and sell Coors Light through an independent distributor. We have a team of employees managing the marketing and promotional efforts in this market, where Coors Light is the leading brand. We also sell our products in a number of other Caribbean markets. During the second quarter of 2004, Cerveceria Cuauhtemoc Moctezuma, S.A. de C.V., a subsidiary of FEMSA Cerveza, became the sole and exclusive importer, marketer, seller and distributor of Coors Light in Mexico.
5
Manufacturing, Production and Packaging in the United States Brewing Raw Materials We use the highest-quality water, barley and hops to brew our products. We have acquired water rights to provide for long-term strategic growth and to sustain brewing operations in case of a prolonged drought in Colorado. We buy barley under long-term contracts from a network of independent farmers located in five regions in the United States. Brewing and Packaging Facilities We have three domestic production facilities and one small brewery, which we plan to sell, located in Mexico. We own and operate the world’s largest single-site brewery located in Golden, Colorado. In addition, we have a packaging and brewing facility in Memphis, Tennessee, and a packaging facility located in the Shenandoah Valley in Virginia. We brew Coors Light, Coors, Extra Gold, Killian’s and the Keystone brands in Golden, and package in Golden approximately 66% of the beer brewed in Golden. The remainder is shipped in bulk from the Golden brewery to either our Memphis or Shenandoah facility for packaging. We are in the process of adding brewing capability to our Virginia facility which we expect to have operational by 2007 and are in the process of closing our Memphis facility which we expect to complete by the end of 2006. Packaging Materials Aluminum Cans Approximately 61% of our domestic products were packaged in aluminum cans in 2005. We purchased a substantial portion of those cans from RMMC, our joint venture with Ball Corporation (Ball). In addition to our supply agreement with RMMC, we also have commercial supply agreements with Ball and other third-party can manufacturers to purchase cans and ends in excess of what is supplied through RMMC. Glass Bottles We used glass bottles for approximately 28% of our products in 2005. RMBC, our joint venture with Owens-Brockway Glass Container, Inc. (Owens), produces glass bottles at our glass manufacturing facility. On July 29, 2003, we extended our joint venture with Owens for 12 years, as well as a supply agreement with Owens for the glass bottles we require in excess of joint venture production. Other Packaging Most of the remaining 11% of volume we sold in 2005 was packaged in quarter and half-barrel stainless steel kegs. We purchase most of our paperboard and label packaging from a subsidiary of Graphic Packaging Corporation (GPC), a related party. These products include paperboard, multi-can pack wrappers, bottle labels and other secondary packaging supplies. Seasonality of the Business Our US sales volumes are normally lowest in the first and fourth quarters and highest in the second and third quarters. Competitive Conditions Known Trends and Competitive Conditions Industry and competitive information in this section and elsewhere in this report was compiled from various industry sources, including beverage analyst reports (Beer Marketer’s Insights, Impact Databank and The Beer Institute). While management believes that these sources are reliable, we cannot guarantee the accuracy of these numbers and estimates. 2005 US Beer Industry Overview The beer industry in the United States is competitive and concentrated, with three major brewers controlling about 78% of the market. Growing or even maintaining market share has required increasing investments in marketing and sales. US beer industry shipments had an annual growth rate during the past 10 years of less than 1%. Pricing in the US beer industry became
6
increasingly competitive in 2005. While front line price increases were similar to recent history, discounting activity increased approximately 30% in 2005, compared to 2004. The beer market in Puerto Rico had extraordinary growth in the “70s and “80s. Since then, the market has experienced periodic growth and decline cycles. This market has traditionally been split among local brewers, US imports, and other imports. Coors Light is the market leader in Puerto Rico with approximately half the market. Our Competitive Position Our malt beverages compete with numerous above-premium, premium, low-calorie, low-carbohydrate, popular-priced, non-alcoholic and imported brands. These competing brands are produced by national, regional, local and international brewers. We compete most directly with Anheuser-Busch and SABMiller (SAB), the dominant beer companies in the United States. According to Beer Marketer’s Insights estimates, we are the nation’s third-largest brewer, selling approximately 11% of the total 2005 US brewing industry shipments (including exports and US shipments of imports). This compares to Anheuser-Busch’s 49% share and SAB’s 18% share. Our malt beverages also compete with other alcohol beverages, including wine and spirits, and thus our competitive position is affected by consumer preferences between and among these other categories.
Canada Segment Molson is Canada’s largest brewer by volume and North America’s oldest beer company. Molson brews, markets, sells and nationally distributes a wide variety of beer brands. Molson’s portfolio consists of strength or leadership in all major product and price segments. Molson’s strong market share and visability are consistent across retail and on-premise channels. Priority focus and investment is leveraged behind key owned brands (Coors Light, Molson Canadian, Molson Export and Rickard’s) and key strategic distribution partnerships (including Heineken, Corona and Miller). Before the Merger, the Canada segment consisted of Coors’ 50.1% interest in the Molson Coors Canada joint venture through which Coors Light was sold in Canada. The joint venture contracted with Molson for the brewing, distribution and sale of our products. Molson Coors Canada managed all marketing activities for our products in Canada. In connection with the Merger, Molson Coors Canada was dissolved into the Canadian business. Coors Light currently has a 10% market share, and is the largest-selling light beer and the second-best selling beer brand overall in Canada. Molson Canadian currently has a 9% market share and is the third-largest selling beer in Canada. Following the Merger, our Canada segment consists primarily of Molson’s beer business including the production and sale of the Molson brands, principally in Canada, our joint venture arrangements related to the distribution of beer in Ontario and the Western provinces, Brewers Retail, Inc. (BRI) (consolidated under FIN 46R), and Brewers Distribution Limited (BDL); and the Coors Light business in Canada. Sales and Distribution Canada In Canada, provincial governments have historically had a high degree of involvement in the regulation of the beer industry, particularly the regulation of the pricing, mark-up, container management, sale, distribution and advertising of beer. Distribution and retailing of products in Canada involves a wide range and varied degree of government control through provincial liquor boards. Ontario Consumers in Ontario can purchase beer only at retail outlets operated by BRI, at government-regulated retail outlets operated by the Liquor Control Board of Ontario, approved agents of the Liquor Control Board of Ontario or at any bar, restaurant or tavern licensed by the Liquor Control Board of Ontario to sell liquor for on premise consumption. All brewers pay a service fee, based on their sales volume, through BRI. Molson, together with certain other brewers, participates in the ownership of BRI in proportion to its provincial market share relative to other brewers. Ontario brewers may deliver directly to BRI’s outlets or may choose to use BRI’s distribution centers to access retail in Ontario, the Liquor Control Board of Ontario system and licensed establishments.
7
Québec In Québec, beer is distributed directly by each brewer or through independent agents. Molson is the agent for the licensed brands it distributes. The brewer or agent distributes the products to permit holders for retail sales for on-premise consumption. Québec retail sales for home consumption are made through grocery and convenience stores as well as government operated stores. British Columbia In British Columbia, the government’s Liquor Distribution Branch currently controls the regulatory elements of distribution of all alcohol products in the province. Brewers Distributors, Ltd. (BDL), which Molson co-owns with a competitor, manages the distribution of Molson’s products throughout British Columbia. Consumers can purchase beer at any Liquor Distribution Branch retail outlet, at any independently owned and licensed wine or beer retail store or at any licensed establishment for on-premise consumption. Liquor-primary licensed establishments for on-premise consumption may also be licensed for off-premise consumption. The British Columbia government announced in 2002 that the Liquor Distribution Branch would shift its role from managing distribution and retail operation to regulating these areas. A further announcement postponed this initiative indefinitely. Alberta In Alberta, the distribution of beer is managed by independent private warehousing and shipping companies or by a government sponsored system in the case of US sourced products. All sales of liquor in Alberta are made through retail outlets licensed by the Alberta Gaming and Liquor Commission or licensees, such as bars, hotels and restaurants. BDL manages the distribution of Molson’s products in Alberta. Other Provinces Molson’s products are distributed in the provinces of Manitoba and Saskatchewan through local liquor boards. Manitoba and Saskatchewan also have licensed private retailers. BDL manages the distribution of Molson’s products in Manitoba and Saskatchewan. In the Maritime Provinces (other than Newfoundland), local liquor boards distribute and retail Molson’s products. Yukon, Northwest Territories and Nunavat manage distribution and retail through government liquor commissioners. Manufacturing, Production and Packaging Brewing Raw Materials Molson’s goal is to procure quality materials and services at the lowest prices available. Molson works with the supplier community to select global suppliers for materials and services which best meet this goal. Molson also uses low risk hedging instruments to protect from pricing volatility in the commodities market. Molson single sources cans, glass bottles, crowns and labels. Availability of these products has not been an issue and Molson does not expect any difficulties in accessing any of these products. However, the risk of glass bottle supply disruptions has increased with the reduction of local supply alternatives due to the consolidation of the glass bottle industry in North America. Brewing and Packaging Facilities Molson has six breweries, strategically located throughout Canada, which brew, bottle, package, market and distribute all owned and licensed brands sold in and exported from Canada: St. John’s (Newfoundland), Montréal (Québec), Toronto (Ontario), Edmonton (Alberta), and Vancouver (British Columbia), and Creemore (Ontario). Molson plans to complete the construction of a Cdn $35 million brewery in Moncton, New Brunswick by January 2007. The new brewery will feature bottling and keg lines and have the flexibility for the future installation of a canning line. Brewing capacity will be more than 6 million 12-packs annually or 250,000 hectoliters.
8
Packaging Materials The distribution systems in each province generally provide the collection network for returnable bottles and cans. The standard container for beer brewed in Canada is the 341 ml returnable bottle, which represents approximately 69% of domestic sales in Canada, with cans accounting for 19% and draught for 12%. Seasonality of Business Total industry volume in Canada is sensitive to factors such as weather, changes in demographics and consumer preferences. Consumption of beer in Canada is also seasonal with approximately 40% of industry sales volume occurring during the four months from May through August. Competitive Conditions 2005 Canada Beer Industry Overview In the Canadian beer market, volumes have been gradually migrating from premium brands to super premium brands and value brands since 2001. After significant growth in 2004, the value segment in Canada began to stabilize in 2005. The national price gap between premium brands and value brands narrowed as value prices stabilized in all markets and increased in key markets. Brands in the premium segment held regular selling prices but used targeted feature price activity to generate growth. The Canadian brewing industry is a mature market. It is characterized by aggressive competition for volume and market share from regional brewers, microbrewers and certain foreign brewers, as well as Molson’s main domestic competitor. These competitive pressures require significant annual investment in marketing and selling activities. There are three major beer segments based on price: super premium, which includes imports and represents 16% of total sales of the industry and 13% of total sales of Molson; premium, which includes the majority of domestic brands and the light sub-segment and represents 60% of total sales of the industry and 65% of total sales of Molson; and the discount segment which represents 22% of total sales of the industry and 21% of total sales of Molson. During 2005, estimated industry sales volume in Canada, including sales of imported beers, increased by approximately 2%. Our Competitive Position The Canada brewing industry is comprised principally of two major brewers, Molson and Labatt, whose combined market share is approximately 83% of beer sold in Canada. The Ontario and Québec markets account for approximately 63% of the total beer market in Canada. The top ten brands in Canada account for approximately 56% of the packaged market in Canada in fiscal 2005.
Europe Segment The Europe segment consists of our production and sale of the CBL brands principally in the United Kingdom, our joint venture arrangement for the production and distribution of Grolsch in the United Kingdom and Republic of Ireland (consolidated under FIN 46R beginning in 2004), factored brand sales (beverage brands owned by other companies, but sold and delivered to retail by us), and our joint venture arrangement with Exel Logistics for the distribution of products throughout Great Britain (Tradeteam). Our Europe segment also includes a small volume of sales in Asia, Russia and other export markets. Sales and Distribution CBL has headquarters in Burton-on-Trent, England, and is the United Kingdom’s second-largest beer company with unit volume sales of approximately 10.3 million US barrels in 2005. CBL has an approximate 21% share of the UK beer market, Western Europe’s second-largest market. Sales are primarily in England and Wales, with the Carling brand (a mainstream lager) representing approximately 75% of CBL’s total beer volume.
9
United Kingdom Over the past three decades, volumes have shifted from the on-premise channel, where products are consumed in pubs and restaurants, to the off-premise channel, also referred to as the “take-home” market. Unlike the United States, where manufacturers are generally not permitted to distribute beer directly to retail, the large majority of our beer in the United Kingdom is sold directly to retailers. Distribution activities for CBL are conducted by Tradeteam, which operates a system of satellite warehouses and a transportation fleet. Tradeteam also manages the transportation of certain raw materials, such as malt, to the CBL breweries. Asia We continue to develop markets in Japan and China, which are managed by the Europe segment’s management team. The Japanese business is currently focused on the Zima and Coors brands.We also sell Coors Light and Coors in China. We have closed our operations in Taiwan. On-premise The on-premise channel accounted for approximately 63% of our UK sales volumes in 2005. The installation and maintenance of draught beer dispensing equipment in the on-premise channel is generally the responsibility of the brewer in the United Kingdom. CBL, therefore, owns equipment used to dispense beer from kegs to consumers. This includes beer lines, line cooling equipment, taps and countermounts. Similar to other UK brewers, CBL has traditionally used loans to secure supply relationships with customers in the on-premise market. Loans have been granted at below-market rates of interest, with the outlet purchasing beer at lower-than-average discount levels to compensate. We reclassify a portion of sales revenue as interest income to reflect the economic substance of these loans. Off-premise The off-premise channel accounted for approximately 37% of our UK sales volume in 2005. The off-premise market includes sales to supermarket chains, convenience stores, liquor store chains, distributors and wholesalers. Manufacturing, Production and Packaging Brewing Raw Materials We use the highest-quality water, barley and hops to brew our products. We assure the highest-quality water by obtaining our water from private water sources which are carefully chosen for their purity and which are regularly tasted and tested both analytically and microbiologically to ensure their ongoing purity and to confirm that all the requirements of the UK private water regulations are met. Public supplies are used as back-ups to the private supplies in some breweries and these are again tasted and tested regularly to ensure their ongoing purity. For agricultural crops such as barley and hops, we place forward contracts to ensure we have availability of the volume and varieties we require. Brewing and Packaging Facilities We operate three breweries in the United Kingdom. The Burton-on-Trent brewery, located in the Midlands, is the largest brewery in the United Kingdom. The other smaller breweries are located in Tadcaster and Alton. Packaging Materials Kegs We used kegs and casks for approximately 57% of our UK products in 2005, reflecting a high percentage of product sold on-premise.
10
Cans Approximately 34% of our UK products were packaged in cans in 2005. Virtually all of our cans were purchased through supply contracts with Ball. Other Packaging The remaining 9% of our UK products are packaged in glass bottles purchased through supply contracts with third-party suppliers. Seasonality of Business In the UK, the beer industry is subject to seasonal sales fluctuation primarily influenced by holiday periods, weather and by certain major televised sporting events. There is a peak during the summer and during the Christmas and New Year period. The Christmas/New Year holiday peak is most pronounced in the off-premise channel. Consequently, our largest quarters by volume are the third and fourth quarters, and the smallest are the first and second. Competitive Conditions 2005 UK Beer Industry Overview Beer consumption in the United Kingdom declined by an average of 0.9% per annum between 1980 and 2000. Over the last 5 years, volume has reached a plateau, providing some stability. The longer-term decline has been mainly attributable to the on-premise channel, where volumes are now approximately 44% lower than in 1980. Over the same period, off-premise volume has increased by approximately 210%. This trend is expected to continue and has been influenced by a number of factors, including changes in consumers’ lifestyles and an increasing price difference between beer prices in the on- and off-premise channels. Both trends continued in 2005 with off-premise market growth of 0.9% and a decline in the on-premise market of 3.8%. There has also been a steady trend away from ales and towards lager, driven predominantly by the leading lager brands. In 1980, lagers accounted for 31% of beer sales, and in 2005 lagers accounted for over 72%, up from 71% in 2004. While lager volume has been growing, ales, including stouts, have declined during this period, and this trend has accelerated in the last few years. The leading beer brands are generally growing at a faster rate than the market. The top 10 brands now represent approximately 65% of the total market, compared to only 34% in 1995. Our Competitive Position Our beers and flavored alcohol beverages compete not only with similar products from competitors, but also with other alcohol beverages, including wines and spirits. With the exception of stout, where we do not have our own brand, our brand portfolio gives us strong representation in all major beer categories. Our strength in the growing lager category with Carling, Grolsch and Coors Fine Light Beer positions us well to take advantage of the continuing trend toward lagers. Our principal competitors are Scottish & Newcastle UK Ltd., Inbev UK Ltd. and Carlsberg UK Ltd. We are Great Britain’s second-largest brewer, with a market share of approximately 21% (excluding factored brands sales), based on AC Nielsen information. This compares to Scottish & Newcastle UK Ltd.’s share of approximately 24%, Inbev UK Ltd.’s share of approximately 20% and Carlsberg UK Ltd.’s share of approximately 13%. Two of our three core brands—Carling, and Coors Fine Light Beer—increased their product category share in 2005. Global Intellectual Property We own trademarks on the majority of the brands we produce and have licenses for the remainder. We also hold several patents on innovative processes related to product formula, can making, can decorating and certain other technical operations. These patents have expiration dates through 2021. These expirations are not expected to have a significant impact on our business.
11
Inflation General inflation is not normally a factor in any of the segments in which we operate, although we periodically experience inflationary trends in specific areas, such as fuel costs, which were significantly higher in 2005 when compared to prior years. Regulation United States Our business in the United States and its territories is highly regulated by federal, state and local governments. These regulations govern many parts of our operations, including brewing, marketing and advertising, transportation, distributor relationships, sales and environmental issues. To operate our facilities, we must obtain and maintain numerous permits, licenses and approvals from various governmental agencies, including the US Treasury Department; Alcohol and Tobacco Tax and Trade Bureau; the US Department of Agriculture; the US Food and Drug Administration; state alcohol regulatory agencies as well as state and federal environmental agencies. Governmental entities also levy taxes and may require bonds to ensure compliance with applicable laws and regulations. US federal excise taxes on malt beverages are currently $18 per barrel. State excise taxes also are levied at rates that ranged in 2005 from a high of $33 per barrel in Hawaii to a low of $0.60 per barrel in Wyoming. Canada In Canada, provincial governments regulate the production, marketing, distribution, sale and pricing of beer and impose commodity taxes and license fees in relation to the production and sale of beer. In 2005, Canada excise taxes totaled $452 million or $61 per barrel sold. In addition, the federal government regulates the advertising, labeling, quality control, and international trade of beer, and also imposes commodity taxes, consumption taxes, excise taxes and in certain instances, custom duties on imported beer. Further, certain bilateral and multilateral treaties entered into by the federal government, provincial governments and certain foreign governments, especially with the government of the United States, affect the Canadian beer industry. While the beer industry in many countries, including the United States, is subject to government regulation, Canadian brewers have historically been subject to even greater regulation. Europe In the United Kingdom, regulations apply to many parts of our operations and products, including brewing, food safety, labeling and packaging, marketing and advertising, environmental, health and safety, employment, and data protection regulations. To operate our breweries and carry on business in the United Kingdom, we must obtain and maintain numerous permits and licenses from local Licensing Justices and governmental bodies, including HM Customs & Excise; the Office of Fair Trading; the Data Protection Commissioner and the Environment Agency. The UK government levies excise taxes on all alcohol beverages at varying rates depending on the type of product and its alcohol content by volume. In 2005, we incurred approximately $1.1 billion in excise taxes on gross revenues of approximately $2.6 billion, or approximately $102 per barrel. Environmental Matters United States We are one of a number of entities named by the Environmental Protection Agency (EPA) as a potentially responsible party (PRP) at the Lowry Superfund site. This landfill is owned by the City and County of Denver (Denver), and is managed by Waste Management of Colorado, Inc. (Waste Management). In 1990, we recorded a pretax charge of $30 million, a portion of which was put into a trust in 1993 as part of a settlement with Denver and Waste Management regarding the then outstanding litigation. Our settlement was based on an assumed remediation cost of $120 million (in 1992 adjusted dollars). The settlement requires us to pay a portion of future costs in excess of that amount. Considering uncertainties at the site, including what additional remedial actions may be required by the EPA, new technologies, and what costs are included in the determination of when the $120 million threshold is reached, the estimate of our liability may change as facts further develop. We cannot predict the amount or timing of any such change, but additional accruals could be required in the future.
12
We are aware of groundwater contamination at some of our properties in Colorado resulting from historical, ongoing or nearby activities. There may also be other contamination of which we are currently unaware. From time to time, we have been notified that we are or may be a PRP under the Comprehensive Environmental Response, Compensation and Liability Act or similar state laws for the cleanup of other sites where hazardous substances have allegedly been released into the environment. While we cannot predict our eventual aggregate cost for the environmental and related matters in which we may be or are currently involved, we believe that any payments, if required, for these matters would be made over a period of time in amounts that would not be material in any one year to our operating results, cash flows or our financial or competitive position. We believe adequate reserves have been provided for losses that are probable and estimable. See Note 19 to our consolidated financial statements in Item 8 on page 118. Canada Our Canadian brewing operations are subject to provincial environmental regulations and local permit requirements. Each of our Canadian breweries, other than the St. John’s brewery, either has water pre-treatment capabilities or are permitted to discharge into the public sewer system. We have comprehensive environmental programs in Canada including organization, monitoring and verification, regulatory compliance, reporting, education and training, and corrective action. MCBC remains responsible for sites relating to discontinued operations of Molson’s chemical specialties business sold in 1996, which require environmental remediation programs. These programs are either under way or are planned. Most of these sites relate to properties associated with previously owned business of chemicals and we have established provisions for the costs of these remediation programs. Some of them involve sites in the United States. Europe We are subject to the requirements of government and local environmental and occupational health and safety laws and regulations. Compliance with these laws and regulations did not materially affect our 2005 capital expenditures, earnings or competitive position, and we do not anticipate that they will do so in 2006. Employees and Employee Relations United States We have approximately 4,200 employees in our US segment. Memphis hourly employees, who constitute approximately 9% of our US work force, are represented by the Teamsters union; and a small number of other employees are represented by other unions. The Memphis union contract was renegotiated in 2005, which included provisions impacted by our plans to close the Memphis facility. We believe that relations with our US employees are good. Canada We have approximately 3,000 full-time employees in our Canada segment. Approximately 67% of this total workforce is represented by trade unions. Workplace change initiatives are continuing and as a result, joint union and management steering committees established in most breweries are focusing on customer service, quality, continuous improvement, employee training and a growing degree of employee involvement in all areas of brewery operations. We believe that relations with our Canada employees are good. Europe We have approximately 3,000 employees in our Europe segment. Approximately 29% of this total workforce is represented by trade unions, primarily at our Burton-on-Trent and Tadcaster breweries. Separate negotiated agreements are in place with the Transport and General Workers Union at the Tadcaster Brewery and the Burton-on-Trent Brewery. The agreements do not have expiration dates, and negotiations are conducted annually. We believe that relations with our Europe employees are good. (d) Financial Information about Foreign and Domestic Operations and Export Sales See Item 8, Financial Statements and Supplementary Data, for discussion of sales, operating income and identifiable assets attributable to our country of domicile, the United States, and all foreign countries.
13
(e) Available Information Our internet website is http://www.molsoncoors.com. Through a direct link to our reports at the SEC’s website at http://www.sec.gov, we make available, free of charge on our website, our annual reports on Form 10-K, quarterly reports on Form 10-Q, current reports on Form 8-K and amendments to those reports as soon as reasonably practicable after we electronically file or furnish such materials to the SEC. Cautionary Statement Pursuant to Safe Harbor Provisions of the Private Securities Litigation Reform Act of 1995 This document and the documents incorporated in this document by reference contain forward-looking statements that are subject to risks and uncertainties. All statements other than statements of historical fact contained in this document and the materials accompanying this document are forward-looking statements. Forward-looking statements are based on the beliefs of our management, as well as assumptions made by, and information currently available to, our management. Frequently, but not always, forward-looking statements are identified by the use of the future tense and by words such as “believes,” “expects,” “anticipates,” “intends,” “will,” “may,” “could,” “would,” “projects,” “continues,” “estimates,” or similar expressions. Forward-looking statements are not guarantees of future performance and actual results could differ materially from those indicated by forward-looking statements. Forward-looking statements involve known and unknown risks, uncertainties, and other factors that may cause our or our industry’s actual results, level of activity, performance or achievements to be materially different from any future results, levels of activity, performance or achievements expressed or implied by the forward-looking statements. The forward-looking statements contained or incorporated by reference in this document are forward-looking statements within the meaning of Section 27A of the Securities Act of 1933 and Section 21E of the Securities Exchange Act of 1934 (the Exchange Act) and are subject to the safe harbor created by the Private Securities Litigation Reform Act of 1995. These statements include declarations regarding our plans, intentions, beliefs or current expectations. Among the important factors that could cause actual results to differ materially from those indicated by forward-looking statements are the risks and uncertainties described under “Risk Factors” and elsewhere in this document and in our other filings with the SEC. Forward-looking statements are expressly qualified in their entirety by this cautionary statement. The forward-looking statements included in this document are made as of the date of this document and we do not undertake any obligation to update forward-looking statements to reflect new information, subsequent events or otherwise. ITEM 1A. Risk Factors The reader should carefully consider the following factors and the other information contained within this document. The most important factors that could influence the achievement of our goals, and cause actual results to differ materially from those expressed in the forward-looking statements, include, but are not limited to, the following: Risks specific to the Molson Merger We may not realize the cost savings and other benefits we currently anticipate due to challenges associated with integrating the operations, technologies, sales and other aspects of the businesses of Molson and Coors. Our success will depend in large part on management’s success in integrating the operations, technologies and personnel of Molson and Coors. If we fail to integrate the operations of Molson and Coors or otherwise fail to realize any of the anticipated benefits of the Merger transaction, including the estimated cost savings of approximately $175 million annually by the third year following the Merger, our results of operations could be impaired. In addition, the overall integration of the two companies may result in unanticipated operations problems, expenses and liabilities, and diversion of management’s attention. If Pentland and the Coors Trust do not agree on a matter submitted to stockholders, generally the matter will not be approved, even if beneficial to the Company or favored by other stockholders. Pentland and the Coors Trust, which together control more than two-thirds of the Company’s Class A Common and Exchangeable stock, have voting trust agreements through which they have combined their voting power over the shares of our Class A common stock and the Class A exchangeable shares that they own. However, in the event that these two stockholders do not agree to vote in favor of a matter submitted to a stockholder vote (other than the election of directors), the voting trustees will be required to vote all of the Class A common stock and Class A exchangeable shares deposited in the voting trusts against the matter. There is no other mechanism in the voting trust agreements to resolve a potential deadlock between these stockholders. Therefore, if either Pentland or the Coors
14
Trust is unwilling to vote in favor of a transaction that is subject to a stockholder vote, we may be unable to complete the transaction even if our board, management or other stockholders believe the transaction is beneficial for Molson Coors. Risks specific to our Discontinued Operations Indemnities provided to the purchaser of 68% of the Kaiser business in Brazil could result in future cash outflows and income statement charges. On January 13, 2006, we sold a 68% equity interest in Kaiser to FEMSA for $68 million cash, including the assumption by FEMSA of Kaiser-related debt and contingencies. The terms of the agreement require us to indemnify FEMSA for exposures related to certain tax, civil and labor contingencies. The ultimate resolution of these claims is not under our control, and we cannot predict the outcomes of administrative and judicial proceedings that will occur with regard to these claims. It is possible that we will have to make cash outlays to FEMSA with regard to these indemnities. While the fair values of these indemnity obligations will be recorded on our balance sheet in conjunction with the sale, we could incur future income statement charges as facts further develop resulting in changes to our fair value estimates. Risks specific to our Company Our success as an enterprise depends largely on the success of three primary products; the failure or weakening of one or more could materially adversely affect our financial results. Although we currently have 14 products in our US portfolio, Coors Light represented more than 72% of our US sales volume for 2005. Carling lager is the best-selling brand in the United Kingdom and represented approximately 75% of CBL sales volume in 2005. The combination of the Molson Canadian and Coors Light brands represented approximately 45% of our Canada segment’s sales volume for the year ended December 25, 2005. Consequently, any material shift in consumer preferences away from these brands would have a disproportionately large adverse impact on our business. We have indebtedness that is substantial in relation to our stockholders’ equity, which could hinder our ability to adjust to rapid changes in market conditions or to respond to competitive pressures. As of December 25, 2005, we had $850 million in debt primarily related to our acquisition of CBL, and $1.4 billion of debt primarily related to our Merger with Molson. As a result, we must use a substantial portion of our cash flow from operations to pay principal and interest on our debt. If our financial and operating performance is insufficient to generate sufficient cash flow for all of our activities, our operations could be adversely impacted. We rely on a small number of suppliers to obtain the packaging we need to operate our business, of which the loss or inability to obtain materials could negatively affect our ability to produce our products. For our US business, we purchase most of our paperboard and container supplies from a single supplier or a small number of suppliers. This packaging is unique and is not produced by any other supplier. Additionally, we are contractually obligated to purchase substantially all our can and bottle needs in the United States from our container joint ventures or from our partners in those ventures, Ball Corporation (RMMC) and Owens-Brockway Glass Container, Inc. (RMBC). Consolidation of the glass bottle industry in North America has reduced local supply alternatives and increased risks of glass bottle supply disruptions. CBL has only a single source for its can supply (Ball). The inability of any of these suppliers to meet our production requirements without sufficient time to develop an alternative source could have a material adverse effect on our business. Our primary production facilities in Europe and the United States are located at single sites, so we could be more vulnerable than our competitors to transportation disruptions, fuel increases and natural disasters. Our primary production facility in the United States is in Golden, Colorado and in Europe, our primary production facility is located in Burton-on-Trent, England. In both countries, our competitors have multiple geographically dispersed breweries and packaging facilities. As a result, we must ship our products greater distances than some of our competitors, making us more vulnerable to fluctuations in costs such as fuel, as well as the impact of any localized natural disasters should they occur. The termination of one or more manufacturer/distribution agreements could have a material adverse effect on our business. We manufacture and/or distribute products of other beverage companies, including those of one or more competitors, through various licensing, distribution or other arrangements in Canada and the United Kingdom. The loss of one or more of these arrangements could have a material adverse effect on the results of one or more reporting segments. Because we will continue to face intense global competition, operating results may be negatively impacted. The brewing industry is highly competitive and requires substantial human and capital resources. Competition in our various markets could cause us to reduce prices, increase capital and other expenditures or lose sales volume, any of which could have a material adverse effect on our business and financial results. In addition, in some of our markets, our primary competitors have substantially greater financial, marketing, production and distribution resources than Molson Coors has. In all of the markets
15
where Molson Coors operates, aggressive marketing strategies by our main competitors could adversely affect our financial results. Changes in tax, environmental or other regulations or failure to comply with existing licensing, trade and other regulations could have a material adverse effect on our financial condition. Our business is highly regulated by federal, state, provincial and local laws and regulations in various countries regarding such matters as licensing requirements, trade and pricing practices, labeling, advertising, promotion and marketing practices, relationships with distributors, environmental matters and other matters. Failure to comply with these laws and regulations could result in the loss, revocation or suspension of our licenses, permits or approvals. In addition, changes in tax, environmental or any other laws or regulations could have a material adverse effect on our business, financial condition and results of operations. We are subject to fluctuations in foreign exchange rates, most significantly the British pound and the Canadian dollar. We hold assets and incur liabilities, earn revenues and pay expenses in different currencies, most significantly sales of Coors Light in Canada, and sales of the Carling brand in the United Kingdom. Since our financial statements are presented in US dollars, we must translate our assets, liabilities, income and expenses into US dollars at current exchange rates. Increases and decreases in the value of the US dollar will affect, perhaps adversely, the value of these items in our financial statements, even if their local currency value has not changed. Our operations face significant commodity price change and foreign exchange rate exposure which could materially and adversely affect our operating results. We will use a large volume of agricultural and other raw materials to produce our products, including malt, hops, water and packaging materials. The supply and price of these raw materials can be affected by a number of factors beyond our control, including frosts, droughts and other weather conditions, economic factors affecting growth decisions, plant diseases, theft and market demand. To the extent any of the foregoing factors affect the prices of ingredients or packaging; our results of operations could be materially and adversely impacted. We have active hedging programs to address commodity price and foreign exchange rate changes. However, to the extent we fail to adequately manage the foregoing risks, including if our hedging arrangements do not effectively or completely hedge changes in foreign currency rates or commodity price risks, our results of operations may be adversely impacted. We could be adversely affected by overall declines in the beer market. Industry trends in many global markets indicate increases in consumer preference for wine and spirits, as well as for lower priced, value segment beer brands in some Canada markets, which could result in loss of volume or operating margins. Because of our reliance on a limited number of technical service suppliers, we could experience significant disruption to our business. We rely exclusively on one information technology services provider for our network, help desk, hardware, and software configuration for our US and UK businesses. Additionally, we rely on a single provider in Canada. If the service providers fail and we are unable to find a suitable replacement in a timely manner, we could be unable to properly administer our information technology systems. Due to a high concentration of unionized workers in the United Kingdom and Canada, we could be significantly affected by labor strikes, work stoppages or other employee-related issues. Approximately 29% of CBL’s total workforce and approximately 67% of Molson’s total workforce is represented by trade unions. Although we believe relations with our employees are good, more stringent labor laws in the United Kingdom expose us to a greater risk of loss should we experience labor disruptions in that market. Changes to the regulation of the distribution systems for our products could adversely impact our business. The US Supreme Court recently ruled that certain state regulations of interstate wine shipments are unlawful. As a result of this decision, states may alter the three-tier distribution system that has historically applied to the distribution of our products. Although it is too early to tell what, if any, changes states may make as a result of this decision, changes to the three-tier distribution system could have a materially adverse impact on our business. Further, in certain Canadian provinces, our products are distributed through joint venture arrangements that are mandated and regulated by provincial government regulators. If provincial regulation should change, effectively eliminating the distribution channels, the costs to adjust our distribution methods could have a material adverse impact on our business. Risks specific to the US Segment Litigation directed at the alcohol beverage industry may adversely affect our sales volumes, our business and our financial results. Molson Coors and many other brewers and distilled spirits manufacturers have been sued in several courts regarding advertising practices and underage consumption. The suits allege that each defendant intentionally marketed its products to “children and other underage consumers.” In essence, each suit seeks, on behalf of an undefined class of parents and
16
guardians, an injunction and unspecified money damages. We will vigorously defend these lawsuits and it is not possible at this time to estimate the possible loss or range of loss, if any, in these lawsuits. We are highly dependent on independent distributors in the United States to sell our products, with no assurance that these distributors will effectively sell our products. We sell all of our products in the United States to distributors for resale to retail outlets. Some of our distributors are at a competitive disadvantage because they are smaller than the largest distributors in their markets. Our distributors also sell products that compete with our products. These distributors may give our competitors’ products higher priority, thereby reducing sales of our products. In addition, the regulatory environment of many states makes it very difficult to change distributors. Consequently, if we are not allowed or are unable to replace unproductive or inefficient distributors, our business, financial position, and results of operation may be adversely affected. Risks specific to the Canada Segment We may be required to provide funding to or exercise control over the entity that owns the entertainment business and the Montréal Canadiens pursuant to the guarantees given to its lenders and the NHL. Pursuant to certain guarantees given to the lenders and the NHL in support of the entity that owns the majority of the entertainment business and the Montréal Canadiens professional hockey club (purchased from Molson in 2001), Molson shall provide funding to the entity to meet its obligations to the lenders and the entity’s operating expenses and Molson shall exercise control over the entity that owns the hockey club at predetermined conditions, subject to NHL approval, if the entity does not meet its obligations under various agreements. An adverse result in a lawsuit brought by Miller could have an adverse impact on our business. In December 2005, Miller Brewing Company sued the Company and several subsidiaries in a Wisconsin federal court. Miller seeks to invalidate a licensing agreement allowing Molson Canada the sole distribution of Miller products in Canada. Miller claims US and Canadian antitrust violations, and violations of the Agreement’s confidentiality provisions. Miller also claims that the Agreement’s purposes have been frustrated as a result of the Molson Coors merger. If Miller were to prevail in this action, it could have an adverse impact on our business. If we are unsuccessful in renegotiating licensing, distribution and related agreements, our business could suffer adverse effects. We manufacture and/or distribute products of other beverage companies in Canada, including those of one or more competitors, through various licensing, distribution or other arrangements. We are currently in negotiations with two of such companies to enter into new agreements. The loss of one or more of these arrangements could adversely impact our business. If regulatory authorities determine that industry understandings regarding the bottle standards are invalid, our business could be adversely impacted. The Canadian Competition Bureau is currently reviewing the validity of industry arrangements regarding industry bottle standards. If the Bureau were to determine that the agreement is anticompetitive, we may be required to use multiple bottle types which could significantly increase our production and other related costs. Risks specific to the Europe Segment Consolidation of pubs and growth in the size of pub chains in the United Kingdom could result in less ability to achieve pricing. The trend toward consolidation of pubs, away from independent pub and club operations, is continuing in the United Kingdom. These larger entities have stronger price negotiating power, which could impact CBL’s ability to obtain favorable pricing in the on-premise channel (due to spillover effect of reduced negotiating leverage) and could reduce our revenues and profit margins. In addition, these larger customers are beginning to purchase directly more of the products that, in the past, we have provided as part of our factored business. This consolidation could impact us adversely. We depend exclusively on one logistics provider in England, Wales and Scotland for distribution of our CBL products. We are involved in a joint venture with Exel Logistics called Tradeteam. Tradeteam handles all of the physical distribution for CBL in England, Wales and Scotland, except where a different distribution system is requested by a customer. If Tradeteam were unable to continue distribution of our product and we were unable to find a suitable replacement in a timely manner, we could experience significant disruptions in our business that could have an adverse impact on our operations. We are reliant on a single third party as a supplier for kegs in the United Kingdom. We do not own our kegs in the United Kingdom; rather we source our kegs from a logistics provider who is responsible for their ownership, upkeep, and to maintain an adequate stock. If this third party provider were to have a business failure, we may be required to purchase a stock of kegs, the estimated cost of which would be $61 million.
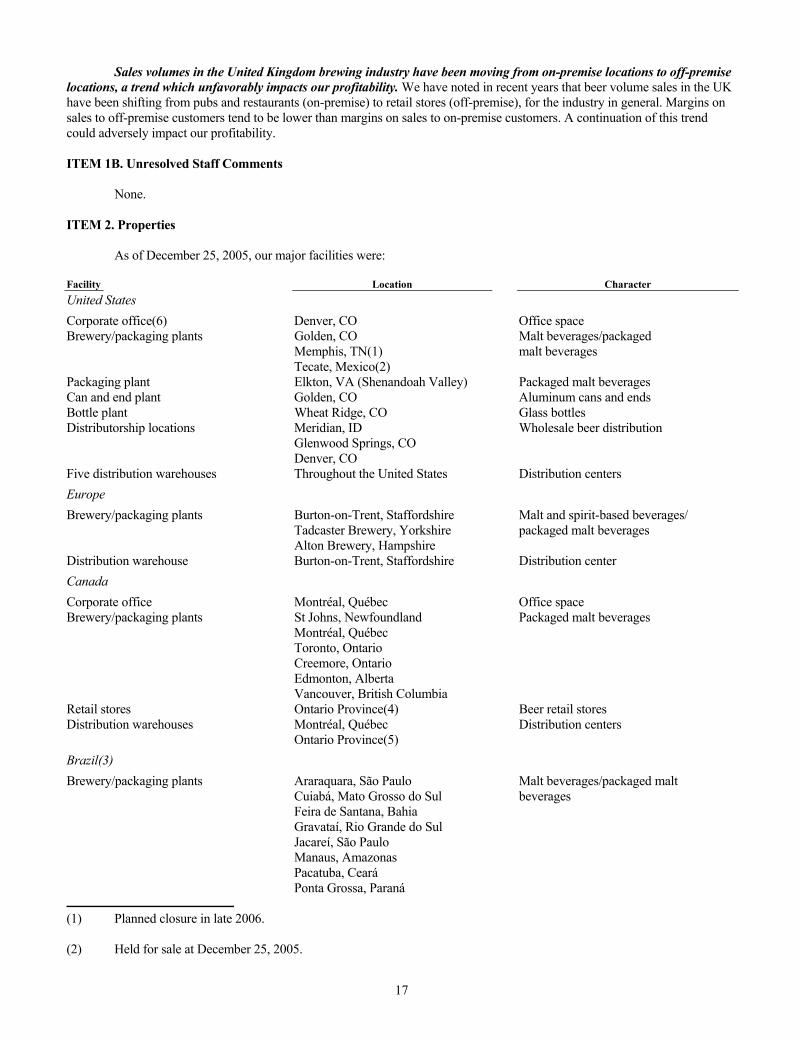
17
Sales volumes in the United Kingdom brewing industry have been moving from on-premise locations to off-premise locations, a trend which unfavorably impacts our profitability. We have noted in recent years that beer volume sales in the UK have been shifting from pubs and restaurants (on-premise) to retail stores (off-premise), for the industry in general. Margins on sales to off-premise customers tend to be lower than margins on sales to on-premise customers. A continuation of this trend could adversely impact our profitability. ITEM 1B. Unresolved Staff Comments None. ITEM 2. Properties As of December 25, 2005, our major facilities were: Facility Location Character United States Corporate office(6) Denver, CO Office space Brewery/packaging plants Golden, CO
Memphis, TN(1) Tecate, Mexico(2)
Malt beverages/packaged malt beverages
Packaging plant Elkton, VA (Shenandoah Valley) Packaged malt beverages Can and end plant Golden, CO Aluminum cans and ends Bottle plant Wheat Ridge, CO Glass bottles Distributorship locations Meridian, ID
Glenwood Springs, CO Denver, CO
Wholesale beer distribution
Five distribution warehouses Throughout the United States Distribution centers Europe Brewery/packaging plants Burton-on-Trent, Staffordshire
Tadcaster Brewery, Yorkshire Alton Brewery, Hampshire
Malt and spirit-based beverages/ packaged malt beverages
Distribution warehouse Burton-on-Trent, Staffordshire Distribution center Canada Corporate office Montréal, Québec Office space Brewery/packaging plants St Johns, Newfoundland
Montréal, Québec Toronto, Ontario Creemore, Ontario Edmonton, Alberta Vancouver, British Columbia
Packaged malt beverages
Retail stores Ontario Province(4) Beer retail stores Distribution warehouses Montréal, Québec
Ontario Province(5) Distribution centers
Brazil(3) Brewery/packaging plants Araraquara, São Paulo
Cuiabá, Mato Grosso do Sul Feira de Santana, Bahia Gravataí, Rio Grande do Sul Jacareí, São Paulo Manaus, Amazonas Pacatuba, Ceará Ponta Grossa, Paraná
Malt beverages/packaged malt beverages
(1) Planned closure in late 2006. (2) Held for sale at December 25, 2005.
18
(3) Majority interest sold in January 2006. (4) Approximately 400 stores owned or leased by our BRI joint venture in various locations in Ontario Province. (5) We have six warehouses owned or leased by our BRI joint venture and one warehouse we own in various locations in
Ontario Province. (6) Leased facility. We believe our facilities are well maintained and suitable for their respective operations. In 2005, our operating facilities were not constrained by capacity issues. Our satellite warehouses are owned and operated by third parties. Unless otherwise noted, all other locations are owned by the Company. ITEM 3. Legal Proceedings Beginning in May 2005, several purported class actions were filed in the United States and Canada, including Federal courts in Delaware and Colorado and provincial courts in Ontario and Québec, alleging, among other things, that the Company and its affiliated entities, including Molson Inc., and certain officers and directors misled stockholders by failing to disclose first quarter (January-March) 2005 US business trends prior to the Merger vote in January 2005. One of the lawsuits filed in Delaware federal court also alleges that the Company failed to comply with US GAAP. The Company will vigorously defend the lawsuits. The Company has been contacted by the Central Regional Office of the US Securities and Exchange Commission in Denver (the SEC) requesting the voluntary provision of documents and other information from the Company and Molson Inc. relating primarily to corporate and financial information and communications related to the Merger, the Company’s financial results for the first quarter of 2005 and other information. The SEC has advised the Company that this inquiry should not be construed as an indication by the SEC or its staff that any violations of law have occurred, nor should it be considered a reflection upon any person, entity, or security. The Company is cooperating with the inquiry. The Company has also been contacted by the New York Stock Exchange. The Exchange has requested information in connection with events leading up to the Company’s earnings announcement on April 28, 2005, which was the date we announced our first quarter 2005 losses attributed to lower sales and the Merger. The Exchange regularly conducts reviews of market activity surrounding corporate announcements or events and has indicated that no inference of impropriety should be drawn from its inquiry. The Company is cooperating with this inquiry. On July 20, 2005, the Ontario Securities Commission requested information related to the trading of MCBC stock prior to April 28, 2005, which was the date we announced our first quarter 2005 losses attributed to lower sales and the Merger. We are cooperating with the inquiry. The Audit Committee of the Company’s Board of Directors is investigating whether a complaint that it received in the third quarter of 2005 has any merit. The Committee has hired independent counsel to assist it in conducting the investigation. The complaint relates primarily to disclosure in connection with the Merger, exercises of stock options by Molson Inc. option holders before the record date for the special dividend paid to Molson Inc. shareholders before the Merger (which were disclosed in the Company’s Current Report on Form 8-K dated February 15, 2005), statements made concerning the special dividend to Molson Inc. shareholders, and sales of the Company’s common stock in connection with exercise of stock options by the Company’s chief executive officer and chief financial officer following the Merger, after the release of the year-end results for Coors and Molson Inc. and after the Company lifted the trading restrictions imposed before the Merger. The Board of Directors has full confidence in senior management, including the chief executive officer and chief financial officer. In December 2005, Miller Brewing Company sued the Company and several subsidiaries in a Wisconsin federal court. Miller seeks to invalidate a licensing agreement (the Agreement) allowing Molson Canada the sole distribution of Miller products in Canada. Miller also seeks damages for US and Canadian antitrust violations, and violations of the Agreement’s confidentiality provisions. Miller also claims that the Agreement’s purposes have been frustrated as a result of the Merger. The Company intends to vigorously defend this lawsuit, and has filed a claim against Miller and certain related entities in Ontario, Canada, seeking a declaration that the licensing agreement remains in full force and effect. Molson Coors and many other brewers and distilled spirits manufacturers have been sued in several courts regarding advertising practices and underage consumption. The suits have all been brought by the same law firm and allege that each defendant intentionally marketed its products to “children and other underage consumers.” In essence, each suit seeks, on behalf
19
of an undefined class of parents and guardians, an injunction and unspecified money damages. In each suit, the manufacturers have advanced motions for dismissal to the court. During the third quarter of 2005, one of the courts—the District Court for Jefferson County, Colorado—granted the manufacturers’ motion, dismissed all claims with prejudice, and granted attorneys’ fees to the defendants. In early 2006, two more courts (a federal court in Cleveland, Ohio, and a state court in Madison, Wisconsin) dismissed the suits. Plaintiffs have appealed two of three dismissals; the time to appeal the third has not arrived. We will vigorously defend these cases and it is not possible at this time to estimate the possible loss or range of loss, if any, in these lawsuits. CBL replaced a bonus plan in the United Kingdom with a different plan under which a bonus was not paid in 2003. A group of employees pursued a claim against CBL for this issue with an arbitration board. During the second quarter of 2005, the board ruled against CBL. CBL has appealed the arbitration award and is confident that it will be reversed. We have estimated the cost of the award, if affirmed, to be $1 million, and accrued that amount as of June 26, 2005. If the award were applied to other groups of employees, the potential loss could be higher. We are involved in other disputes and legal actions arising in the ordinary course of our business. While it is not feasible to predict or determine the outcome of these proceedings, in our opinion, based on a review with legal counsel, none of these disputes and legal actions is expected to have a material impact on our consolidated financial position, results of operations or cash flows. However, litigation is subject to inherent uncertainties, and an adverse result in these or other matters, including the above-described advertising practices case, may arise from time to time that may harm our business. ITEM 4. Submission of Matters to a Vote of Security Holders Not applicable.
PART II ITEM 5. Market for the Registrant’s Common Equity and Issuer Purchases of Equity Securities Prior to the Merger, our Class B non-voting common stock was traded on the New York Stock Exchange since March 11, 1999, under the symbol “RKY” since March 11, 1999 and prior to that was quoted on the NASDAQ National Market under the symbol “ACCOB.” As a result of the Merger, our Class B non-voting common stock is trading on the New York Stock Exchange and the Toronto Stock Exchange under the symbol “TAP.” In connection with the Merger and effective February 9, 2005, our common equity is significantly different. We now have Class A and Class B common stock trading on the New York Stock Exchange under the symbols “TAP A” and “TAP,” respectively, and on the Toronto Stock Exchange as “TAP.LV.A” and “TAP.NV,” respectively. In addition, our indirect subsidiary, Molson Coors Exchangeco, has Exchangeable Class A and Exchangeable Class B shares trading on the Toronto Stock Exchange under the symbols “TPX.LV.A” and “TPX.NV,” respectively. The exchangeable shares are a means to defer tax in Canada. The exchangeable shares can be exchanged for Molson Coors Class A or B common stock at any time and at the same exchange ratios described in the Merger documents, and will receive the same dividends. At the time of exchange, taxes are due. The exchangeable shares have voting rights through special voting shares held by a trustee and the holders thereof are able to elect members of the Board of Directors. See Note 2 on page 76 to the accompanying Consolidated Financial Statements for information on the exchange ratios used to effect the Merger. Refer to the definitive proxy statement, dated December 9, 2004, and supplemented on January 19, 2005, for complete descriptions of the Molson Coors capital stock. The Merger was effected by the issuance of Coors stock for Molson stock in a transaction that was valued at approximately $3.6 billion. Coors is considered the accounting acquirer, although the transaction is viewed as a merger of equals by the two companies. The transaction is discussed in Note 2 on page 76 to the accompanying Consolidated Financial Statements in Item 8. The approximate number of record security holders by class of stock at February 28, 2006, is as follows:
Title of class Number of record security holders Class A common stock, voting, $0.01 par value ............................... 30 Class B common stock, non-voting, $0.01 par value ........................ 3,050 Class A Exchangeable Shares ............................................................ 348 Class B Exchangeable Shares ............................................................ 3,492
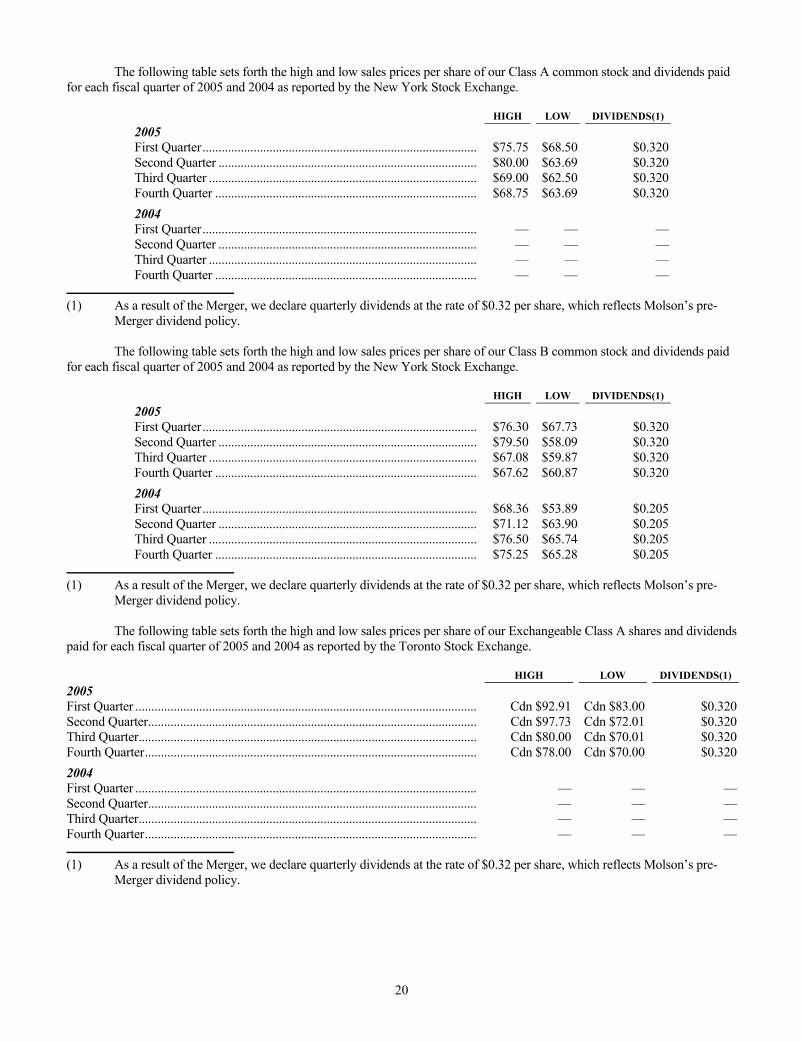
20
The following table sets forth the high and low sales prices per share of our Class A common stock and dividends paid for each fiscal quarter of 2005 and 2004 as reported by the New York Stock Exchange.
HIGH LOW DIVIDENDS(1) 2005 First Quarter...................................................................................... $75.75 $68.50 $0.320Second Quarter ................................................................................. $80.00 $63.69 $0.320Third Quarter .................................................................................... $69.00 $62.50 $0.320Fourth Quarter .................................................................................. $68.75 $63.69 $0.3202004 First Quarter...................................................................................... — — —Second Quarter ................................................................................. — — —Third Quarter .................................................................................... — — —Fourth Quarter .................................................................................. — — —
(1) As a result of the Merger, we declare quarterly dividends at the rate of $0.32 per share, which reflects Molson’s pre-
Merger dividend policy. The following table sets forth the high and low sales prices per share of our Class B common stock and dividends paid for each fiscal quarter of 2005 and 2004 as reported by the New York Stock Exchange.
HIGH LOW DIVIDENDS(1) 2005 First Quarter...................................................................................... $76.30 $67.73 $0.320Second Quarter ................................................................................. $79.50 $58.09 $0.320Third Quarter .................................................................................... $67.08 $59.87 $0.320Fourth Quarter .................................................................................. $67.62 $60.87 $0.3202004 First Quarter...................................................................................... $68.36 $53.89 $0.205Second Quarter ................................................................................. $71.12 $63.90 $0.205Third Quarter .................................................................................... $76.50 $65.74 $0.205Fourth Quarter .................................................................................. $75.25 $65.28 $0.205
(1) As a result of the Merger, we declare quarterly dividends at the rate of $0.32 per share, which reflects Molson’s pre-
Merger dividend policy. The following table sets forth the high and low sales prices per share of our Exchangeable Class A shares and dividends paid for each fiscal quarter of 2005 and 2004 as reported by the Toronto Stock Exchange. HIGH LOW DIVIDENDS(1) 2005 First Quarter ........................................................................................................... Cdn $92.91 Cdn $83.00 $0.320Second Quarter....................................................................................................... Cdn $97.73 Cdn $72.01 $0.320Third Quarter.......................................................................................................... Cdn $80.00 Cdn $70.01 $0.320Fourth Quarter........................................................................................................ Cdn $78.00 Cdn $70.00 $0.3202004 First Quarter ........................................................................................................... — — —Second Quarter....................................................................................................... — — —Third Quarter.......................................................................................................... — — —Fourth Quarter........................................................................................................ — — —
(1) As a result of the Merger, we declare quarterly dividends at the rate of $0.32 per share, which reflects Molson’s pre-
Merger dividend policy.
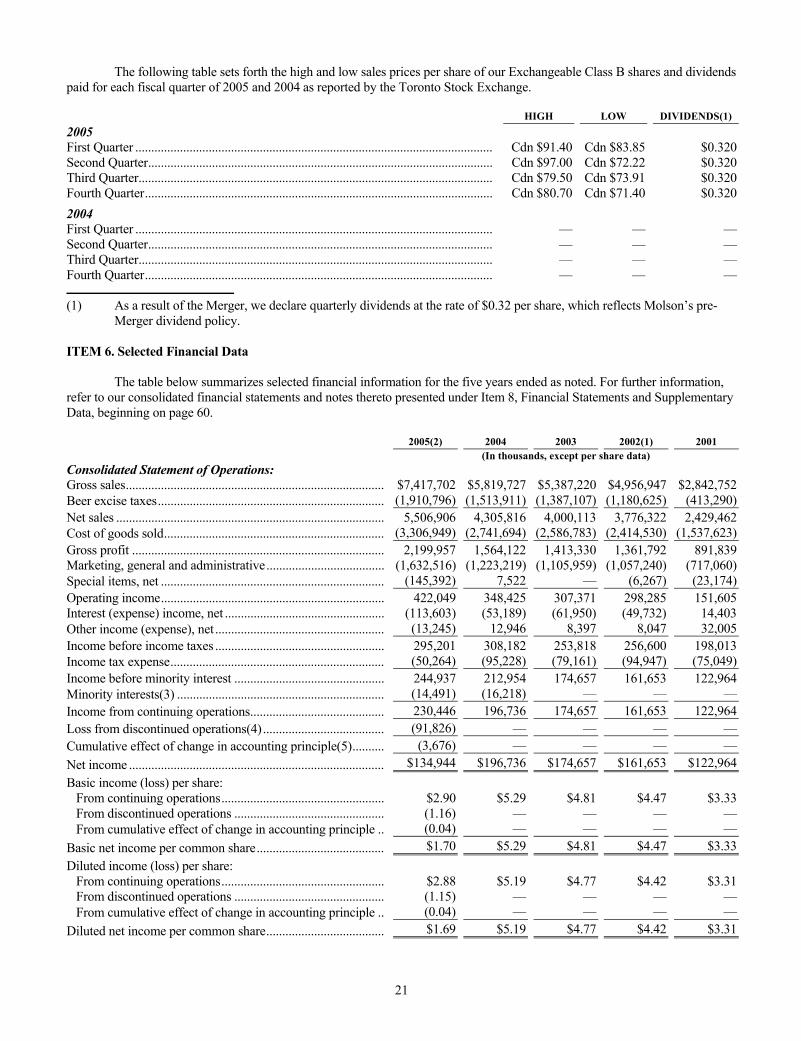
21
The following table sets forth the high and low sales prices per share of our Exchangeable Class B shares and dividends paid for each fiscal quarter of 2005 and 2004 as reported by the Toronto Stock Exchange. HIGH LOW DIVIDENDS(1) 2005 First Quarter ................................................................................................................ Cdn $91.40 Cdn $83.85 $0.320Second Quarter............................................................................................................ Cdn $97.00 Cdn $72.22 $0.320Third Quarter............................................................................................................... Cdn $79.50 Cdn $73.91 $0.320Fourth Quarter............................................................................................................. Cdn $80.70 Cdn $71.40 $0.3202004 First Quarter ................................................................................................................ — — —Second Quarter............................................................................................................ — — —Third Quarter............................................................................................................... — — —Fourth Quarter............................................................................................................. — — —
(1) As a result of the Merger, we declare quarterly dividends at the rate of $0.32 per share, which reflects Molson’s pre-
Merger dividend policy. ITEM 6. Selected Financial Data The table below summarizes selected financial information for the five years ended as noted. For further information, refer to our consolidated financial statements and notes thereto presented under Item 8, Financial Statements and Supplementary Data, beginning on page 60. 2005(2) 2004 2003 2002(1) 2001 (In thousands, except per share data) Consolidated Statement of Operations: Gross sales................................................................................. $7,417,702 $5,819,727 $5,387,220 $4,956,947 $2,842,752Beer excise taxes....................................................................... (1,910,796) (1,513,911) (1,387,107) (1,180,625) (413,290)Net sales .................................................................................... 5,506,906 4,305,816 4,000,113 3,776,322 2,429,462Cost of goods sold..................................................................... (3,306,949) (2,741,694) (2,586,783) (2,414,530) (1,537,623)Gross profit ............................................................................... 2,199,957 1,564,122 1,413,330 1,361,792 891,839Marketing, general and administrative..................................... (1,632,516) (1,223,219) (1,105,959) (1,057,240) (717,060)Special items, net ...................................................................... (145,392) 7,522 — (6,267) (23,174)Operating income...................................................................... 422,049 348,425 307,371 298,285 151,605Interest (expense) income, net .................................................. (113,603) (53,189) (61,950) (49,732) 14,403Other income (expense), net ..................................................... (13,245) 12,946 8,397 8,047 32,005Income before income taxes ..................................................... 295,201 308,182 253,818 256,600 198,013Income tax expense................................................................... (50,264) (95,228) (79,161) (94,947) (75,049)Income before minority interest ............................................... 244,937 212,954 174,657 161,653 122,964Minority interests(3) ................................................................. (14,491) (16,218) — — —Income from continuing operations.......................................... 230,446 196,736 174,657 161,653 122,964Loss from discontinued operations(4)...................................... (91,826) — — — —Cumulative effect of change in accounting principle(5).......... (3,676) — — — —Net income ................................................................................ $134,944 $196,736 $174,657 $161,653 $122,964Basic income (loss) per share:
From continuing operations................................................... $2.90 $5.29 $4.81 $4.47 $3.33From discontinued operations ............................................... (1.16) — — — —From cumulative effect of change in accounting principle .. (0.04) — — — —
Basic net income per common share........................................ $1.70 $5.29 $4.81 $4.47 $3.33Diluted income (loss) per share:
From continuing operations................................................... $2.88 $5.19 $4.77 $4.42 $3.31From discontinued operations ............................................... (1.15) — — — —From cumulative effect of change in accounting principle .. (0.04) — — — —
Diluted net income per common share..................................... $1.69 $5.19 $4.77 $4.42 $3.31
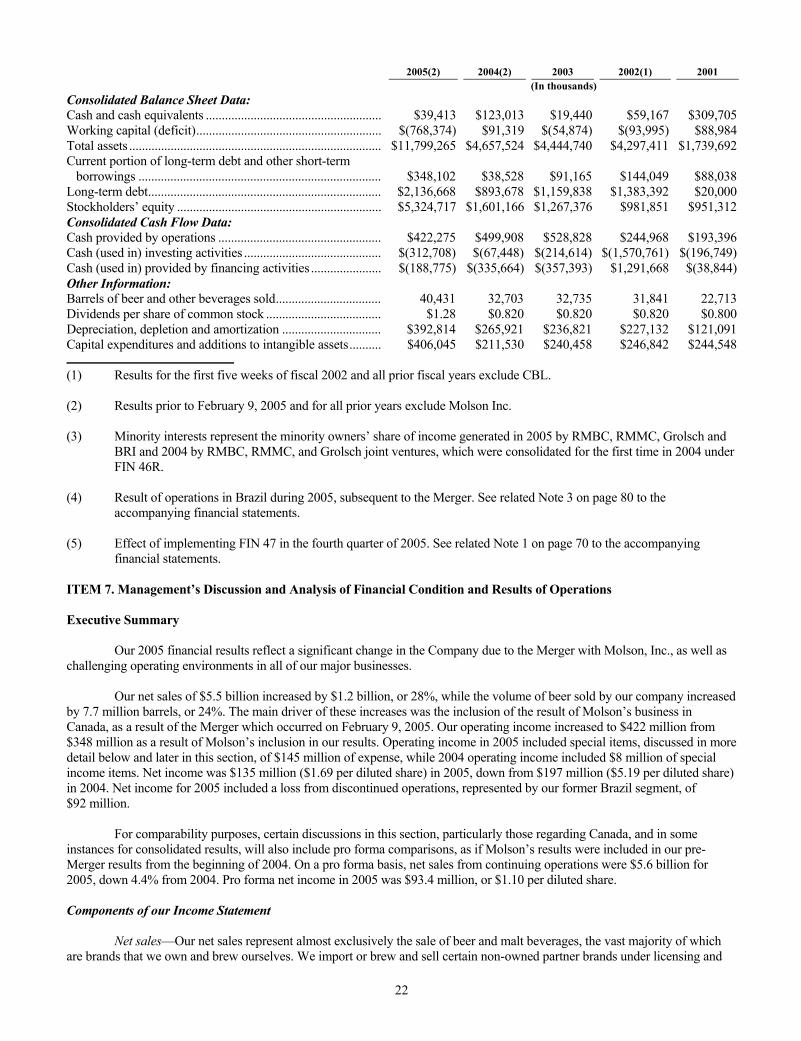
22
2005(2) 2004(2) 2003 2002(1) 2001 (In thousands) Consolidated Balance Sheet Data: Cash and cash equivalents ....................................................... $39,413 $123,013 $19,440 $59,167 $309,705Working capital (deficit).......................................................... $(768,374) $91,319 $(54,874) $(93,995) $88,984Total assets ............................................................................... $11,799,265 $4,657,524 $4,444,740 $4,297,411 $1,739,692Current portion of long-term debt and other short-term
borrowings ............................................................................ $348,102 $38,528 $91,165 $144,049 $88,038Long-term debt......................................................................... $2,136,668 $893,678 $1,159,838 $1,383,392 $20,000Stockholders’ equity ................................................................ $5,324,717 $1,601,166 $1,267,376 $981,851 $951,312Consolidated Cash Flow Data: Cash provided by operations ................................................... $422,275 $499,908 $528,828 $244,968 $193,396Cash (used in) investing activities ........................................... $(312,708) $(67,448) $(214,614) $(1,570,761) $(196,749)Cash (used in) provided by financing activities ...................... $(188,775) $(335,664) $(357,393) $1,291,668 $(38,844)Other Information: Barrels of beer and other beverages sold................................. 40,431 32,703 32,735 31,841 22,713Dividends per share of common stock .................................... $1.28 $0.820 $0.820 $0.820 $0.800Depreciation, depletion and amortization ............................... $392,814 $265,921 $236,821 $227,132 $121,091Capital expenditures and additions to intangible assets.......... $406,045 $211,530 $240,458 $246,842 $244,548
(1) Results for the first five weeks of fiscal 2002 and all prior fiscal years exclude CBL. (2) Results prior to February 9, 2005 and for all prior years exclude Molson Inc. (3) Minority interests represent the minority owners’ share of income generated in 2005 by RMBC, RMMC, Grolsch and
BRI and 2004 by RMBC, RMMC, and Grolsch joint ventures, which were consolidated for the first time in 2004 under FIN 46R.
(4) Result of operations in Brazil during 2005, subsequent to the Merger. See related Note 3 on page 80 to the
accompanying financial statements. (5) Effect of implementing FIN 47 in the fourth quarter of 2005. See related Note 1 on page 70 to the accompanying
financial statements. ITEM 7. Management’s Discussion and Analysis of Financial Condition and Results of Operations Executive Summary Our 2005 financial results reflect a significant change in the Company due to the Merger with Molson, Inc., as well as challenging operating environments in all of our major businesses. Our net sales of $5.5 billion increased by $1.2 billion, or 28%, while the volume of beer sold by our company increased by 7.7 million barrels, or 24%. The main driver of these increases was the inclusion of the result of Molson’s business in Canada, as a result of the Merger which occurred on February 9, 2005. Our operating income increased to $422 million from $348 million as a result of Molson’s inclusion in our results. Operating income in 2005 included special items, discussed in more detail below and later in this section, of $145 million of expense, while 2004 operating income included $8 million of special income items. Net income was $135 million ($1.69 per diluted share) in 2005, down from $197 million ($5.19 per diluted share) in 2004. Net income for 2005 included a loss from discontinued operations, represented by our former Brazil segment, of $92 million. For comparability purposes, certain discussions in this section, particularly those regarding Canada, and in some instances for consolidated results, will also include pro forma comparisons, as if Molson’s results were included in our pre-Merger results from the beginning of 2004. On a pro forma basis, net sales from continuing operations were $5.6 billion for 2005, down 4.4% from 2004. Pro forma net income in 2005 was $93.4 million, or $1.10 per diluted share. Components of our Income Statement Net sales—Our net sales represent almost exclusively the sale of beer and malt beverages, the vast majority of which are brands that we own and brew ourselves. We import or brew and sell certain non-owned partner brands under licensing and
23
related arrangements. We also sell certain “factored brands,” as a distributor, to customers in the United Kingdom (Europe segment). Cost of goods sold—Our cost of goods sold include costs we incur to make and ship beer. These costs include brewing materials, such as barley, in the United States and United Kingdom where we manufacture our own malt. In Canada, we purchase malt from third parties. Hops and various starches are other key brewing materials purchased by all of our segments. Packaging materials, including costs for glass bottles, aluminum cans, and cardboard and paperboard are also included in our cost of goods sold. Our cost of goods sold also include both direct and indirect labor, freight costs, utilities, maintenance costs, and other manufacturing overheads. Marketing, general and administrative—These costs include media advertising (television, radio, print), tactical advertising (signs, banners, point-of-sale materials) and promotion costs planned and executed on both local and national levels within our operating segments. Also included here are costs to run our sales organizations, including labor and other overheads. Lastly, this classification also includes general and administrative costs for functions such as finance, legal, human resources and information technology, which consist primarily of labor and outside services. Special Items—These are unique items which affect our income statement, which are discussed below. Other income (expense)—This classification includes primarily gains and losses associated with activities not directly related to brewing and selling beer. For instance, gains or losses on sales of non-operating assets, our share of income or loss associated with our ownership in the Montréal Canadiens hockey club, and certain foreign exchange gains and losses are classified here. Interest income (expense), net—Interest costs associated with borrowings to finance our operations are included in the corporate unallocated costs. Interest income in the Europe segment is associated with certain trade loans receivable from customers. Discussions of income statement line items such as minority interests, discontinued operations and cumulative effect of a change in accounting principle are discussed in detail elsewhere in MD&A and in the notes to the financial statements. Discontinued Operations The Company’s business in Brazil, which was acquired as part of the Merger, is now reported as discontinued operations due to the sale of a controlling interest in the business on January 13, 2006. During 2005, the Brazil business affected the Company’s financial results in the following ways, all of which are not expected to impact the Company’s results in reporting periods following the sale:
• The income statement impact included losses that totaled $91.8 million, or $1.15 per diluted share, in 2005. Since the Company’s effective tax rate did not benefit from these Brazil losses, these represent after-tax impacts on the Company’s financial results.
• As a result of the sale, the Company’s balance sheet will improve in two principal ways:
• The Company’s total debt position improves by approximately $128 million in 2006 versus 2005
following the Brazil sale with the inflow of $68 million of sale proceeds and the elimination of approximately $63 million of Brazil financial debt.
• Contingent liabilities of approximately $260 million, related primarily to tax claims, are removed from
the Company’s balance sheet. MCBC does have a level of continuing potential exposure to these contingent liabilities of Kaiser, as well as previously disclosed but less than probable un-accrued claims, due to certain indemnities provided to FEMSA pursuant to the sales and purchase agreement underlying the sale of our majority interest in Kaiser. Such indemnities are more fully described in Note 19 on page 118. While the Company believes that all significant contingencies have been disclosed as part of the sale process and adequately reserved for on the Kaiser financial statements, resolution of contingencies and claims above reserved or otherwise disclosed amounts could, under some circumstances, result in additional liabilities for Molson Coors because of transaction-related indemnity provisions.
The Brazil business reduced the Company’s free cash flow by $22 million during 2005 due primarily to operating losses and interest expense.
24
Special Items The Company reported special items totaling $145.4 million during 2005. These special charges were primarily related to accelerated initiatives to improve the Company’s future performance and were as follows: The US segment recorded special charges of $68.1 million during 2005, primarily related to closing the Memphis brewery, including accelerated asset depreciation and estimated costs associated with settling pension obligations for Memphis brewery workers. The Canada segment recorded special charges of $5.2 million during 2005, related primarily to restructuring of the sales and marketing organizations. The Europe segment recorded net special charges of $13.8 million during 2005, primarily attributable to restructuring expenses for cost-reduction initiatives, as well as costs related to the closure of the Company’s sales operation in Russia and Taiwan, netted against a net gain on disposals of assets during the year. We estimate annual savings from the Europe initiatives to approximate $20 million allocated 75% to selling, general and administrative and 25% to cost of goods sold beginning 2007. Special charges allocated to Corporate in 2005 were $58.3 million, substantially all of which ($55.9 million) were associated with severance and other costs related to change in control and other agreements with departing officers following the Merger. These costs are discussed in more detail in Note 8 to our consolidated financial statements included in Item 8 on page 93. Merger Synergies Update During 2005, the Company captured $59 million in Merger-related cost synergies, surpassing the Company’s 2005 goal of $50 million. The Company’s Merger-related synergies goals are an incremental $50 million in 2006 and total annual synergies of $175 million, which are expected by the third year following the completion of the Merger. As a result of work performed by our synergy and operating teams during the first year of the Merger, we now anticipate capturing $75 million in additional cost-reduction opportunities by the end of 2008, above and beyond the original $175 million year-three synergies target. Cumulative Effect of Change in Accounting Principle Molson Coors has adopted Financial Accounting Standards Board Interpretation No. 47, “Accounting for Conditional Asset Retirement Obligations, an interpretation of FASB Statement No. 143” (FIN 47) under which companies must recognize potential long-term liabilities related to the eventual retirement of assets. As a result of adopting FIN 47, the Company recorded a cumulative non-cash expense of $3.7 million, after tax, in the 2005 fourth quarter, reported as Cumulative Effect of Change in Accounting in the Company’s income statement. As reported in the Company’s 2005 fourth quarter and full year results, this expense represents accumulated remediation and restoration costs expected to be incurred up to 30 years in the future for anticipated asset retirements. Following this catch-up expense in the 2005 fourth quarter, the Company does not expect FIN 47-related expense to have a significant impact on its annual operating results.
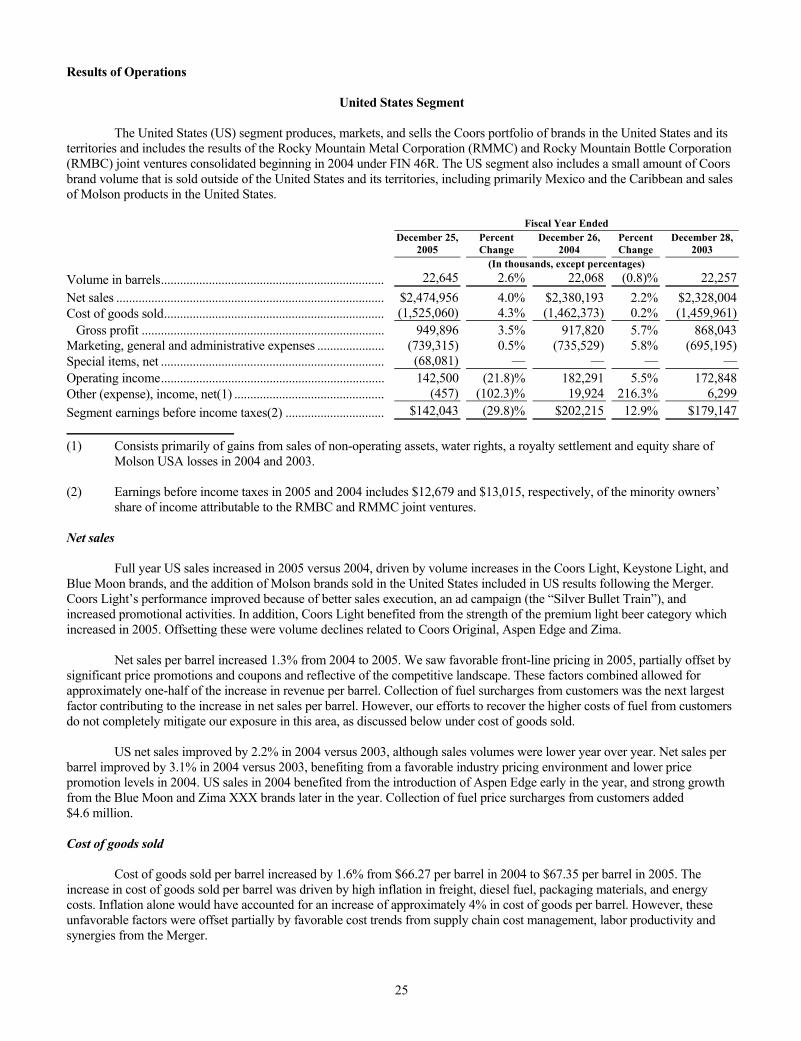
25
Results of Operations
United States Segment The United States (US) segment produces, markets, and sells the Coors portfolio of brands in the United States and its territories and includes the results of the Rocky Mountain Metal Corporation (RMMC) and Rocky Mountain Bottle Corporation (RMBC) joint ventures consolidated beginning in 2004 under FIN 46R. The US segment also includes a small amount of Coors brand volume that is sold outside of the United States and its territories, including primarily Mexico and the Caribbean and sales of Molson products in the United States. Fiscal Year Ended
December 25,
2005 Percent Change
December 26, 2004
PercentChange
December 28,2003
(In thousands, except percentages) Volume in barrels...................................................................... 22,645 2.6% 22,068 (0.8)% 22,257Net sales .................................................................................... $2,474,956 4.0% $2,380,193 2.2% $2,328,004Cost of goods sold..................................................................... (1,525,060) 4.3% (1,462,373) 0.2% (1,459,961)
Gross profit ............................................................................ 949,896 3.5% 917,820 5.7% 868,043Marketing, general and administrative expenses ..................... (739,315) 0.5% (735,529) 5.8% (695,195)Special items, net ...................................................................... (68,081) — — — —Operating income...................................................................... 142,500 (21.8)% 182,291 5.5% 172,848Other (expense), income, net(1) ............................................... (457) (102.3)% 19,924 216.3% 6,299Segment earnings before income taxes(2) ............................... $142,043 (29.8)% $202,215 12.9% $179,147
(1) Consists primarily of gains from sales of non-operating assets, water rights, a royalty settlement and equity share of
Molson USA losses in 2004 and 2003. (2) Earnings before income taxes in 2005 and 2004 includes $12,679 and $13,015, respectively, of the minority owners’
share of income attributable to the RMBC and RMMC joint ventures. Net sales Full year US sales increased in 2005 versus 2004, driven by volume increases in the Coors Light, Keystone Light, and Blue Moon brands, and the addition of Molson brands sold in the United States included in US results following the Merger. Coors Light’s performance improved because of better sales execution, an ad campaign (the “Silver Bullet Train”), and increased promotional activities. In addition, Coors Light benefited from the strength of the premium light beer category which increased in 2005. Offsetting these were volume declines related to Coors Original, Aspen Edge and Zima. Net sales per barrel increased 1.3% from 2004 to 2005. We saw favorable front-line pricing in 2005, partially offset by significant price promotions and coupons and reflective of the competitive landscape. These factors combined allowed for approximately one-half of the increase in revenue per barrel. Collection of fuel surcharges from customers was the next largest factor contributing to the increase in net sales per barrel. However, our efforts to recover the higher costs of fuel from customers do not completely mitigate our exposure in this area, as discussed below under cost of goods sold. US net sales improved by 2.2% in 2004 versus 2003, although sales volumes were lower year over year. Net sales per barrel improved by 3.1% in 2004 versus 2003, benefiting from a favorable industry pricing environment and lower price promotion levels in 2004. US sales in 2004 benefited from the introduction of Aspen Edge early in the year, and strong growth from the Blue Moon and Zima XXX brands later in the year. Collection of fuel price surcharges from customers added $4.6 million. Cost of goods sold Cost of goods sold per barrel increased by 1.6% from $66.27 per barrel in 2004 to $67.35 per barrel in 2005. The increase in cost of goods sold per barrel was driven by high inflation in freight, diesel fuel, packaging materials, and energy costs. Inflation alone would have accounted for an increase of approximately 4% in cost of goods per barrel. However, these unfavorable factors were offset partially by favorable cost trends from supply chain cost management, labor productivity and synergies from the Merger.

26
Cost of goods sold increased $2.4 million or 0.2% in 2004 versus 2003. On a per barrel basis, the increase was approximately 1.0%. The increase was the net effect of inflation (primarily higher fuel and packaging costs) ($15.1 million); as well as increased labor-related expenses ($12.1 million) and a mix shift to higher-cost brands and packages, such as Aspen Edge in 2004 ($10.9 million); offset by the cycling of extra expense related to our supply chain system implementation costs in 2003 ($6.5 million); and the implementation of FIN 46R which had the effect of reducing our cost of sales by re-allocating certain joint venture expenses in our income statement out of cost of sales ($13.0 million). Marketing, general and administrative expenses Marketing, general and administrative expenses increased by $3.8 million, or 0.5% in 2005 versus 2004. Increased spending on sales capabilities were offset by lower general and administrative overhead costs. Marketing, general and administrative expenses increased $43.0 million in 2004, compared to 2003, or 6.0%. This represents an additional $2.18 per barrel increase. The increase is due to higher investments in sales and marketing efforts ($29.6 million), in addition to modestly higher labor-related costs ($5.1 million). Special items Special items in the US segment in 2005 were associated primarily with the planned closure of the Memphis brewery, targeted for late 2006. We recorded $33.3 million in accelerated depreciation on brewery assets, reflecting their revised useful lives, $3.2 million in direct impairments of assets, $1.7 million for accruals of severance and associated benefits, and $25.0 million representing an estimate of costs to settle multi-employer pension plan obligations associated with Memphis workers. We recorded an additional $4.9 million of restructuring charges associated with brewery operations in Golden. Other income, net Other income was lower in 2005 versus 2004, primarily due to two large factors that occurred in 2004 but did not occur in 2005. First, we recorded $11.7 million of gains on the sale of certain owned, non-operating real estate, and second, we recorded royalties of $8.3 million from the receipt of cash in 2004 associated with a settlement from the purchaser of a coal mine previously owned by Coors. Other income increased in 2004 versus 2003 for primarily the same reasons listed in the previous paragraph.
Canada Segment Before the Merger, the Canada segment consisted of Coors Brewing Company’s 50.1% interest in the Coors Canada partnership through which the Coors Light business in Canada was conducted. Molson was the other owner of the partnership. The partnership contracted with Molson for the brewing, distribution and the sale of Coors Light in Canada. Coors Canada managed all marketing activities for our products in Canada. In connection with the Merger, Coors Canada and sale of Coors Light in Canada was dissolved into the Canada segment. Coors Light is currently Molson Canada’s largest selling beer, the largest-selling light beer and the second-best selling packaged beer brand overall in Canada. Following the Merger, our Canada segment consists primarily of Molson’s beer business including the production and sale of the Molson brands, principally in Canada, our joint venture arrangements related to the distribution of beer in Ontario and the Western provinces, Brewers Retail, Inc. (BRI) (consolidated under FIN 46R), and Brewers Distribution Limited (BDL).
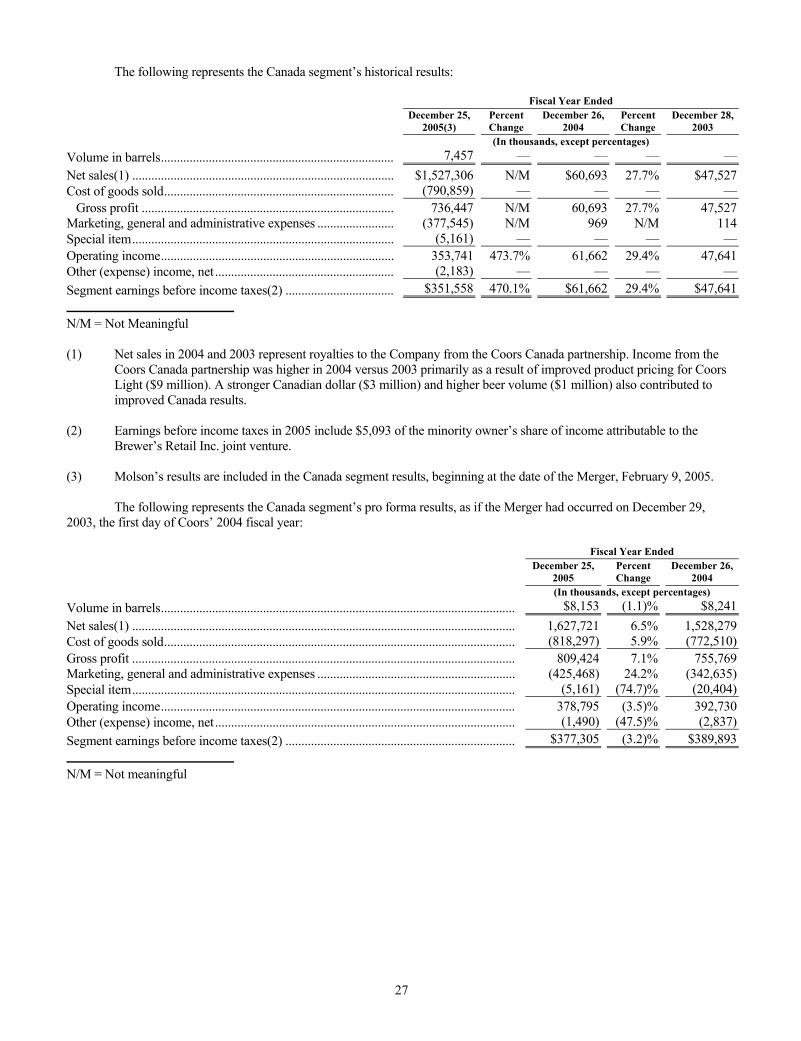
27
The following represents the Canada segment’s historical results: Fiscal Year Ended
December 25,
2005(3) Percent Change
December 26, 2004
PercentChange
December 28,2003
(In thousands, except percentages) Volume in barrels......................................................................... 7,457 — — — —Net sales(1) .................................................................................. $1,527,306 N/M $60,693 27.7% $47,527Cost of goods sold........................................................................ (790,859) — — — —
Gross profit ............................................................................... 736,447 N/M 60,693 27.7% 47,527Marketing, general and administrative expenses ........................ (377,545) N/M 969 N/M 114Special item.................................................................................. (5,161) — — — —Operating income......................................................................... 353,741 473.7% 61,662 29.4% 47,641Other (expense) income, net ........................................................ (2,183) — — — —Segment earnings before income taxes(2) .................................. $351,558 470.1% $61,662 29.4% $47,641
N/M = Not Meaningful (1) Net sales in 2004 and 2003 represent royalties to the Company from the Coors Canada partnership. Income from the
Coors Canada partnership was higher in 2004 versus 2003 primarily as a result of improved product pricing for Coors Light ($9 million). A stronger Canadian dollar ($3 million) and higher beer volume ($1 million) also contributed to improved Canada results.
(2) Earnings before income taxes in 2005 include $5,093 of the minority owner’s share of income attributable to the
Brewer’s Retail Inc. joint venture. (3) Molson’s results are included in the Canada segment results, beginning at the date of the Merger, February 9, 2005. The following represents the Canada segment’s pro forma results, as if the Merger had occurred on December 29, 2003, the first day of Coors’ 2004 fiscal year: Fiscal Year Ended
December 25,
2005 Percent Change
December 26,2004
(In thousands, except percentages) Volume in barrels............................................................................................................... $8,153 (1.1)% $8,241Net sales(1) ........................................................................................................................ 1,627,721 6.5% 1,528,279Cost of goods sold.............................................................................................................. (818,297) 5.9% (772,510)Gross profit ........................................................................................................................ 809,424 7.1% 755,769Marketing, general and administrative expenses .............................................................. (425,468) 24.2% (342,635)Special item........................................................................................................................ (5,161) (74.7)% (20,404)Operating income............................................................................................................... 378,795 (3.5)% 392,730Other (expense) income, net .............................................................................................. (1,490) (47.5)% (2,837)Segment earnings before income taxes(2) ........................................................................ $377,305 (3.2)% $389,893
N/M = Not meaningful
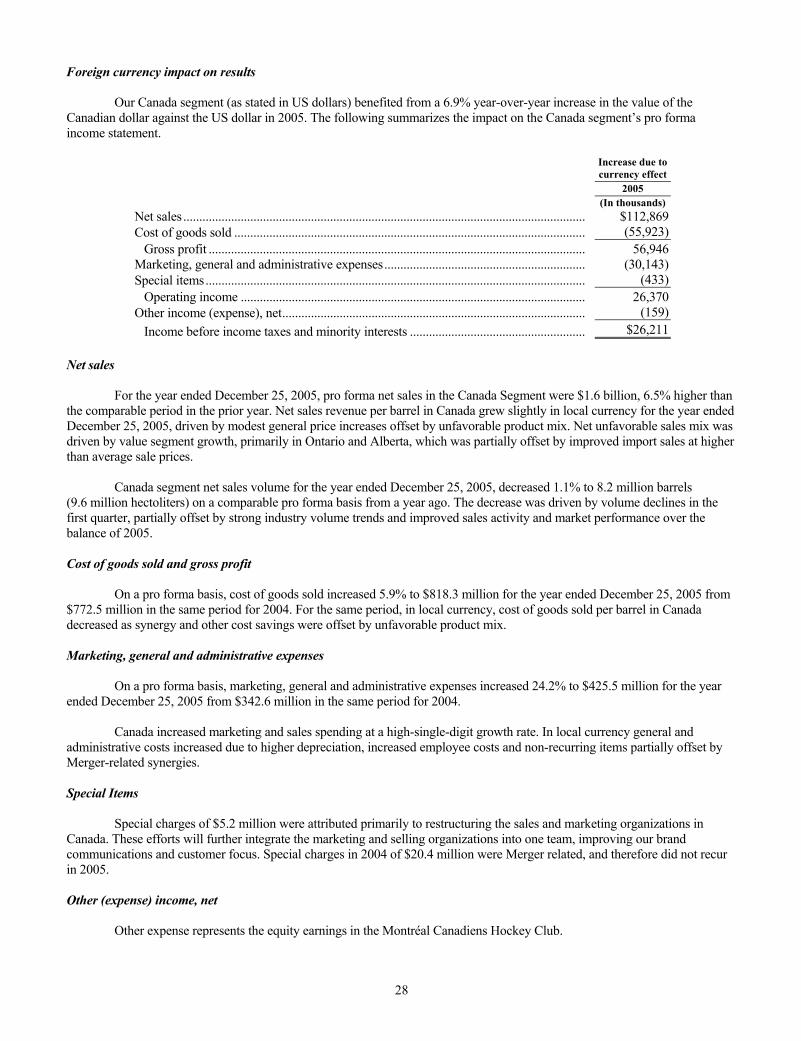
28
Foreign currency impact on results Our Canada segment (as stated in US dollars) benefited from a 6.9% year-over-year increase in the value of the Canadian dollar against the US dollar in 2005. The following summarizes the impact on the Canada segment’s pro forma income statement.
Increase due tocurrency effect
2005 (In thousands) Net sales.............................................................................................................................. $112,869Cost of goods sold .............................................................................................................. (55,923)
Gross profit ...................................................................................................................... 56,946Marketing, general and administrative expenses............................................................... (30,143)Special items....................................................................................................................... (433)
Operating income ............................................................................................................ 26,370Other income (expense), net............................................................................................... (159)
Income before income taxes and minority interests ....................................................... $26,211 Net sales For the year ended December 25, 2005, pro forma net sales in the Canada Segment were $1.6 billion, 6.5% higher than the comparable period in the prior year. Net sales revenue per barrel in Canada grew slightly in local currency for the year ended December 25, 2005, driven by modest general price increases offset by unfavorable product mix. Net unfavorable sales mix was driven by value segment growth, primarily in Ontario and Alberta, which was partially offset by improved import sales at higher than average sale prices. Canada segment net sales volume for the year ended December 25, 2005, decreased 1.1% to 8.2 million barrels (9.6 million hectoliters) on a comparable pro forma basis from a year ago. The decrease was driven by volume declines in the first quarter, partially offset by strong industry volume trends and improved sales activity and market performance over the balance of 2005. Cost of goods sold and gross profit On a pro forma basis, cost of goods sold increased 5.9% to $818.3 million for the year ended December 25, 2005 from $772.5 million in the same period for 2004. For the same period, in local currency, cost of goods sold per barrel in Canada decreased as synergy and other cost savings were offset by unfavorable product mix. Marketing, general and administrative expenses On a pro forma basis, marketing, general and administrative expenses increased 24.2% to $425.5 million for the year ended December 25, 2005 from $342.6 million in the same period for 2004. Canada increased marketing and sales spending at a high-single-digit growth rate. In local currency general and administrative costs increased due to higher depreciation, increased employee costs and non-recurring items partially offset by Merger-related synergies. Special Items Special charges of $5.2 million were attributed primarily to restructuring the sales and marketing organizations in Canada. These efforts will further integrate the marketing and selling organizations into one team, improving our brand communications and customer focus. Special charges in 2004 of $20.4 million were Merger related, and therefore did not recur in 2005. Other (expense) income, net Other expense represents the equity earnings in the Montréal Canadiens Hockey Club.
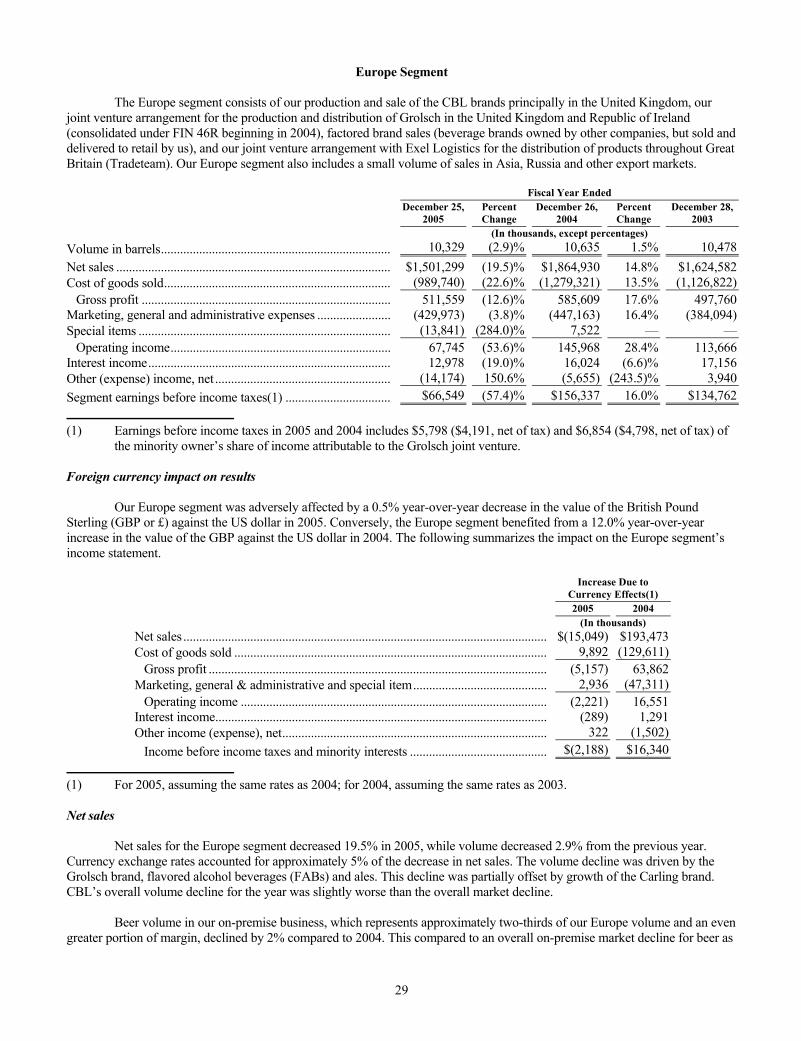
29
Europe Segment The Europe segment consists of our production and sale of the CBL brands principally in the United Kingdom, our joint venture arrangement for the production and distribution of Grolsch in the United Kingdom and Republic of Ireland (consolidated under FIN 46R beginning in 2004), factored brand sales (beverage brands owned by other companies, but sold and delivered to retail by us), and our joint venture arrangement with Exel Logistics for the distribution of products throughout Great Britain (Tradeteam). Our Europe segment also includes a small volume of sales in Asia, Russia and other export markets. Fiscal Year Ended
December 25,
2005 Percent Change
December 26, 2004
Percent Change
December 28,2003
(In thousands, except percentages) Volume in barrels........................................................................ 10,329 (2.9)% 10,635 1.5% 10,478Net sales ...................................................................................... $1,501,299 (19.5)% $1,864,930 14.8% $1,624,582Cost of goods sold....................................................................... (989,740) (22.6)% (1,279,321) 13.5% (1,126,822)
Gross profit .............................................................................. 511,559 (12.6)% 585,609 17.6% 497,760Marketing, general and administrative expenses ....................... (429,973) (3.8)% (447,163) 16.4% (384,094)Special items ............................................................................... (13,841) (284.0)% 7,522 — —
Operating income..................................................................... 67,745 (53.6)% 145,968 28.4% 113,666Interest income............................................................................ 12,978 (19.0)% 16,024 (6.6)% 17,156Other (expense) income, net ....................................................... (14,174) 150.6% (5,655) (243.5)% 3,940Segment earnings before income taxes(1) ................................. $66,549 (57.4)% $156,337 16.0% $134,762
(1) Earnings before income taxes in 2005 and 2004 includes $5,798 ($4,191, net of tax) and $6,854 ($4,798, net of tax) of
the minority owner’s share of income attributable to the Grolsch joint venture. Foreign currency impact on results Our Europe segment was adversely affected by a 0.5% year-over-year decrease in the value of the British Pound Sterling (GBP or £) against the US dollar in 2005. Conversely, the Europe segment benefited from a 12.0% year-over-year increase in the value of the GBP against the US dollar in 2004. The following summarizes the impact on the Europe segment’s income statement.
Increase Due to
Currency Effects(1) 2005 2004 (In thousands) Net sales.................................................................................................................. $(15,049) $193,473Cost of goods sold .................................................................................................. 9,892 (129,611)
Gross profit .......................................................................................................... (5,157) 63,862Marketing, general & administrative and special item.......................................... 2,936 (47,311)
Operating income ................................................................................................ (2,221) 16,551Interest income........................................................................................................ (289) 1,291Other income (expense), net................................................................................... 322 (1,502)
Income before income taxes and minority interests ........................................... $(2,188) $16,340
(1) For 2005, assuming the same rates as 2004; for 2004, assuming the same rates as 2003. Net sales Net sales for the Europe segment decreased 19.5% in 2005, while volume decreased 2.9% from the previous year. Currency exchange rates accounted for approximately 5% of the decrease in net sales. The volume decline was driven by the Grolsch brand, flavored alcohol beverages (FABs) and ales. This decline was partially offset by growth of the Carling brand. CBL’s overall volume decline for the year was slightly worse than the overall market decline. Beer volume in our on-premise business, which represents approximately two-thirds of our Europe volume and an even greater portion of margin, declined by 2% compared to 2004. This compared to an overall on-premise market decline for beer as
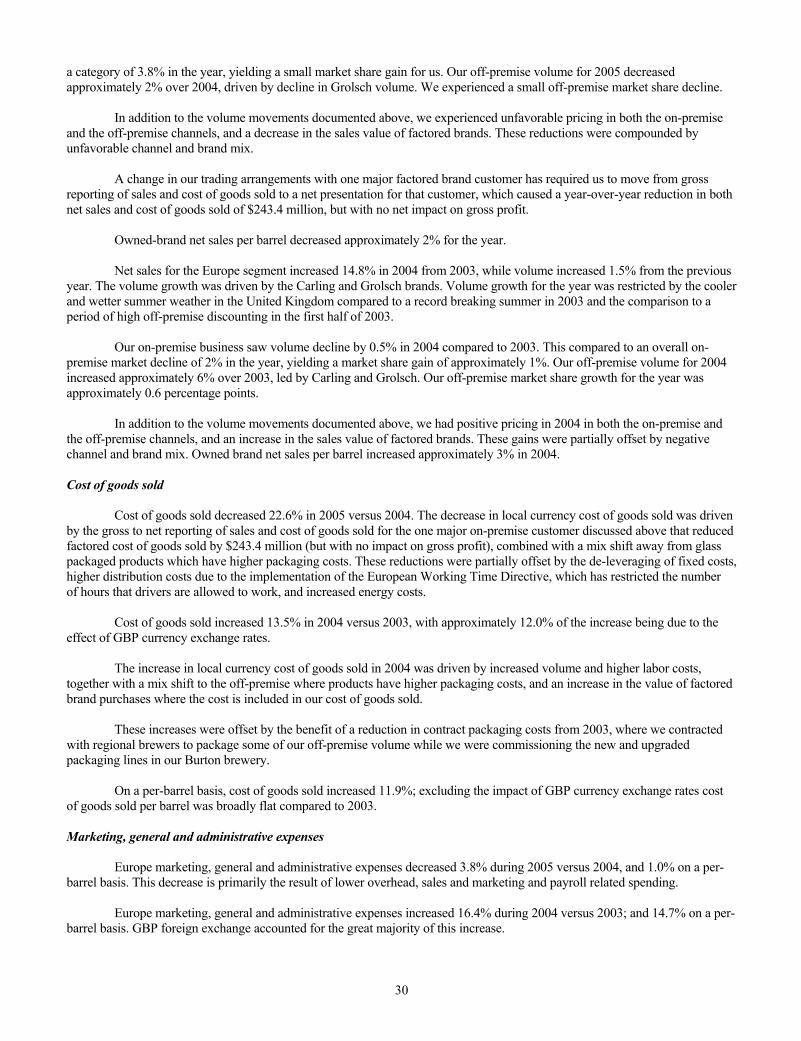
30
a category of 3.8% in the year, yielding a small market share gain for us. Our off-premise volume for 2005 decreased approximately 2% over 2004, driven by decline in Grolsch volume. We experienced a small off-premise market share decline. In addition to the volume movements documented above, we experienced unfavorable pricing in both the on-premise and the off-premise channels, and a decrease in the sales value of factored brands. These reductions were compounded by unfavorable channel and brand mix. A change in our trading arrangements with one major factored brand customer has required us to move from gross reporting of sales and cost of goods sold to a net presentation for that customer, which caused a year-over-year reduction in both net sales and cost of goods sold of $243.4 million, but with no net impact on gross profit. Owned-brand net sales per barrel decreased approximately 2% for the year. Net sales for the Europe segment increased 14.8% in 2004 from 2003, while volume increased 1.5% from the previous year. The volume growth was driven by the Carling and Grolsch brands. Volume growth for the year was restricted by the cooler and wetter summer weather in the United Kingdom compared to a record breaking summer in 2003 and the comparison to a period of high off-premise discounting in the first half of 2003. Our on-premise business saw volume decline by 0.5% in 2004 compared to 2003. This compared to an overall on-premise market decline of 2% in the year, yielding a market share gain of approximately 1%. Our off-premise volume for 2004 increased approximately 6% over 2003, led by Carling and Grolsch. Our off-premise market share growth for the year was approximately 0.6 percentage points. In addition to the volume movements documented above, we had positive pricing in 2004 in both the on-premise and the off-premise channels, and an increase in the sales value of factored brands. These gains were partially offset by negative channel and brand mix. Owned brand net sales per barrel increased approximately 3% in 2004. Cost of goods sold Cost of goods sold decreased 22.6% in 2005 versus 2004. The decrease in local currency cost of goods sold was driven by the gross to net reporting of sales and cost of goods sold for the one major on-premise customer discussed above that reduced factored cost of goods sold by $243.4 million (but with no impact on gross profit), combined with a mix shift away from glass packaged products which have higher packaging costs. These reductions were partially offset by the de-leveraging of fixed costs, higher distribution costs due to the implementation of the European Working Time Directive, which has restricted the number of hours that drivers are allowed to work, and increased energy costs. Cost of goods sold increased 13.5% in 2004 versus 2003, with approximately 12.0% of the increase being due to the effect of GBP currency exchange rates. The increase in local currency cost of goods sold in 2004 was driven by increased volume and higher labor costs, together with a mix shift to the off-premise where products have higher packaging costs, and an increase in the value of factored brand purchases where the cost is included in our cost of goods sold. These increases were offset by the benefit of a reduction in contract packaging costs from 2003, where we contracted with regional brewers to package some of our off-premise volume while we were commissioning the new and upgraded packaging lines in our Burton brewery. On a per-barrel basis, cost of goods sold increased 11.9%; excluding the impact of GBP currency exchange rates cost of goods sold per barrel was broadly flat compared to 2003. Marketing, general and administrative expenses Europe marketing, general and administrative expenses decreased 3.8% during 2005 versus 2004, and 1.0% on a per-barrel basis. This decrease is primarily the result of lower overhead, sales and marketing and payroll related spending. Europe marketing, general and administrative expenses increased 16.4% during 2004 versus 2003; and 14.7% on a per-barrel basis. GBP foreign exchange accounted for the great majority of this increase.
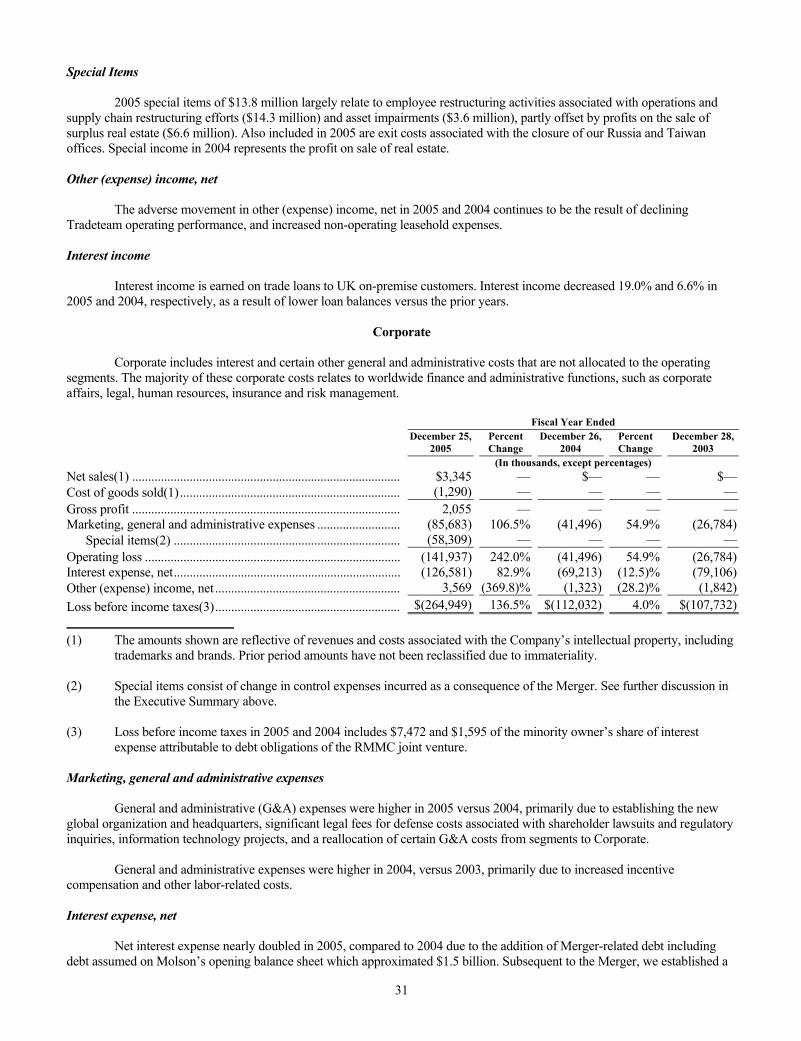
31
Special Items 2005 special items of $13.8 million largely relate to employee restructuring activities associated with operations and supply chain restructuring efforts ($14.3 million) and asset impairments ($3.6 million), partly offset by profits on the sale of surplus real estate ($6.6 million). Also included in 2005 are exit costs associated with the closure of our Russia and Taiwan offices. Special income in 2004 represents the profit on sale of real estate. Other (expense) income, net The adverse movement in other (expense) income, net in 2005 and 2004 continues to be the result of declining Tradeteam operating performance, and increased non-operating leasehold expenses. Interest income Interest income is earned on trade loans to UK on-premise customers. Interest income decreased 19.0% and 6.6% in 2005 and 2004, respectively, as a result of lower loan balances versus the prior years.
Corporate Corporate includes interest and certain other general and administrative costs that are not allocated to the operating segments. The majority of these corporate costs relates to worldwide finance and administrative functions, such as corporate affairs, legal, human resources, insurance and risk management. Fiscal Year Ended
December 25,
2005 Percent Change
December 26, 2004
Percent Change
December 28,2003
(In thousands, except percentages) Net sales(1) .................................................................................... $3,345 — $— — $—Cost of goods sold(1)..................................................................... (1,290) — — — —Gross profit .................................................................................... 2,055 — — — —Marketing, general and administrative expenses .......................... (85,683) 106.5% (41,496) 54.9% (26,784)
Special items(2) ....................................................................... (58,309) — — — —Operating loss ................................................................................ (141,937) 242.0% (41,496) 54.9% (26,784)Interest expense, net....................................................................... (126,581) 82.9% (69,213) (12.5)% (79,106)Other (expense) income, net .......................................................... 3,569 (369.8)% (1,323) (28.2)% (1,842)Loss before income taxes(3).......................................................... $(264,949) 136.5% $(112,032) 4.0% $(107,732)
(1) The amounts shown are reflective of revenues and costs associated with the Company’s intellectual property, including
trademarks and brands. Prior period amounts have not been reclassified due to immateriality. (2) Special items consist of change in control expenses incurred as a consequence of the Merger. See further discussion in
the Executive Summary above. (3) Loss before income taxes in 2005 and 2004 includes $7,472 and $1,595 of the minority owner’s share of interest
expense attributable to debt obligations of the RMMC joint venture. Marketing, general and administrative expenses General and administrative (G&A) expenses were higher in 2005 versus 2004, primarily due to establishing the new global organization and headquarters, significant legal fees for defense costs associated with shareholder lawsuits and regulatory inquiries, information technology projects, and a reallocation of certain G&A costs from segments to Corporate. General and administrative expenses were higher in 2004, versus 2003, primarily due to increased incentive compensation and other labor-related costs. Interest expense, net Net interest expense nearly doubled in 2005, compared to 2004 due to the addition of Merger-related debt including debt assumed on Molson’s opening balance sheet which approximated $1.5 billion. Subsequent to the Merger, we established a
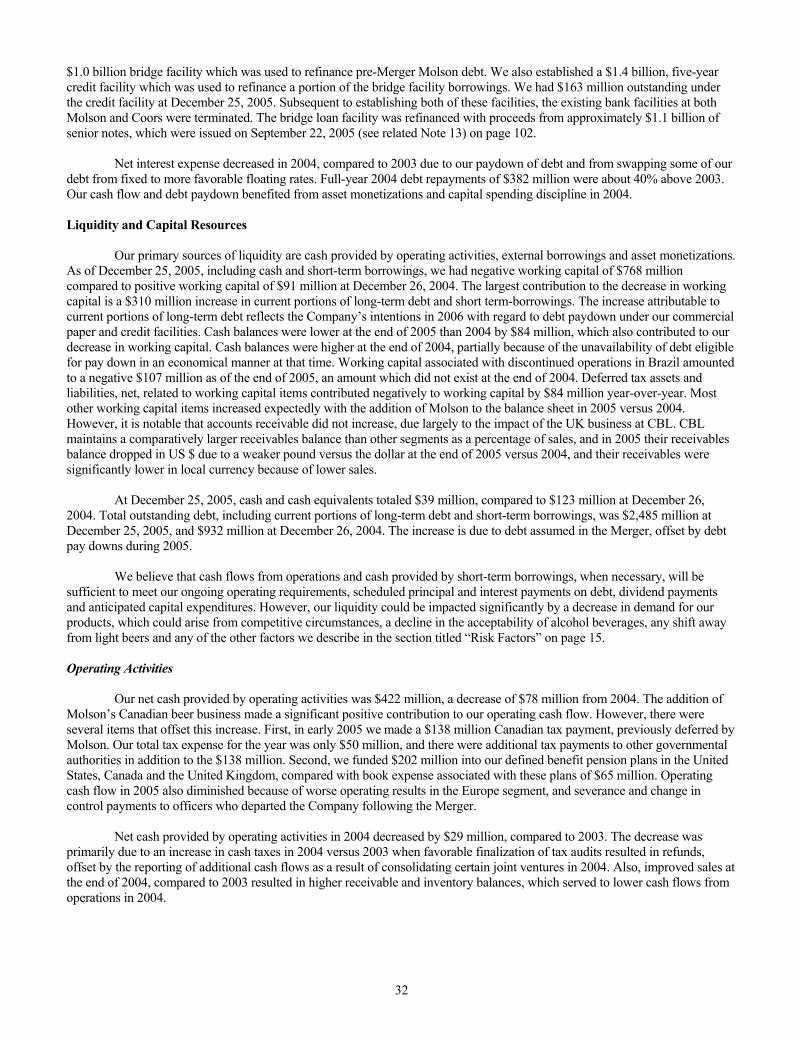
32
$1.0 billion bridge facility which was used to refinance pre-Merger Molson debt. We also established a $1.4 billion, five-year credit facility which was used to refinance a portion of the bridge facility borrowings. We had $163 million outstanding under the credit facility at December 25, 2005. Subsequent to establishing both of these facilities, the existing bank facilities at both Molson and Coors were terminated. The bridge loan facility was refinanced with proceeds from approximately $1.1 billion of senior notes, which were issued on September 22, 2005 (see related Note 13) on page 102. Net interest expense decreased in 2004, compared to 2003 due to our paydown of debt and from swapping some of our debt from fixed to more favorable floating rates. Full-year 2004 debt repayments of $382 million were about 40% above 2003. Our cash flow and debt paydown benefited from asset monetizations and capital spending discipline in 2004. Liquidity and Capital Resources Our primary sources of liquidity are cash provided by operating activities, external borrowings and asset monetizations. As of December 25, 2005, including cash and short-term borrowings, we had negative working capital of $768 million compared to positive working capital of $91 million at December 26, 2004. The largest contribution to the decrease in working capital is a $310 million increase in current portions of long-term debt and short term-borrowings. The increase attributable to current portions of long-term debt reflects the Company’s intentions in 2006 with regard to debt paydown under our commercial paper and credit facilities. Cash balances were lower at the end of 2005 than 2004 by $84 million, which also contributed to our decrease in working capital. Cash balances were higher at the end of 2004, partially because of the unavailability of debt eligible for pay down in an economical manner at that time. Working capital associated with discontinued operations in Brazil amounted to a negative $107 million as of the end of 2005, an amount which did not exist at the end of 2004. Deferred tax assets and liabilities, net, related to working capital items contributed negatively to working capital by $84 million year-over-year. Most other working capital items increased expectedly with the addition of Molson to the balance sheet in 2005 versus 2004. However, it is notable that accounts receivable did not increase, due largely to the impact of the UK business at CBL. CBL maintains a comparatively larger receivables balance than other segments as a percentage of sales, and in 2005 their receivables balance dropped in US $ due to a weaker pound versus the dollar at the end of 2005 versus 2004, and their receivables were significantly lower in local currency because of lower sales. At December 25, 2005, cash and cash equivalents totaled $39 million, compared to $123 million at December 26, 2004. Total outstanding debt, including current portions of long-term debt and short-term borrowings, was $2,485 million at December 25, 2005, and $932 million at December 26, 2004. The increase is due to debt assumed in the Merger, offset by debt pay downs during 2005. We believe that cash flows from operations and cash provided by short-term borrowings, when necessary, will be sufficient to meet our ongoing operating requirements, scheduled principal and interest payments on debt, dividend payments and anticipated capital expenditures. However, our liquidity could be impacted significantly by a decrease in demand for our products, which could arise from competitive circumstances, a decline in the acceptability of alcohol beverages, any shift away from light beers and any of the other factors we describe in the section titled “Risk Factors” on page 15. Operating Activities Our net cash provided by operating activities was $422 million, a decrease of $78 million from 2004. The addition of Molson’s Canadian beer business made a significant positive contribution to our operating cash flow. However, there were several items that offset this increase. First, in early 2005 we made a $138 million Canadian tax payment, previously deferred by Molson. Our total tax expense for the year was only $50 million, and there were additional tax payments to other governmental authorities in addition to the $138 million. Second, we funded $202 million into our defined benefit pension plans in the United States, Canada and the United Kingdom, compared with book expense associated with these plans of $65 million. Operating cash flow in 2005 also diminished because of worse operating results in the Europe segment, and severance and change in control payments to officers who departed the Company following the Merger. Net cash provided by operating activities in 2004 decreased by $29 million, compared to 2003. The decrease was primarily due to an increase in cash taxes in 2004 versus 2003 when favorable finalization of tax audits resulted in refunds, offset by the reporting of additional cash flows as a result of consolidating certain joint ventures in 2004. Also, improved sales at the end of 2004, compared to 2003 resulted in higher receivable and inventory balances, which served to lower cash flows from operations in 2004.
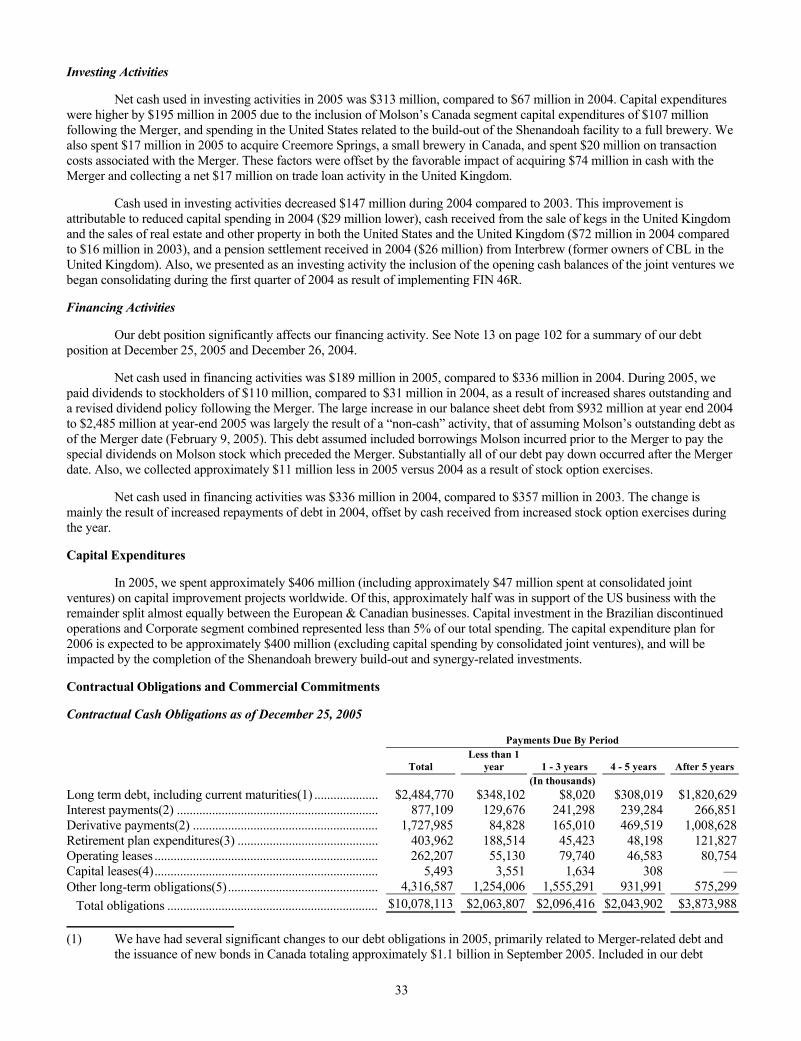
33
Investing Activities Net cash used in investing activities in 2005 was $313 million, compared to $67 million in 2004. Capital expenditures were higher by $195 million in 2005 due to the inclusion of Molson’s Canada segment capital expenditures of $107 million following the Merger, and spending in the United States related to the build-out of the Shenandoah facility to a full brewery. We also spent $17 million in 2005 to acquire Creemore Springs, a small brewery in Canada, and spent $20 million on transaction costs associated with the Merger. These factors were offset by the favorable impact of acquiring $74 million in cash with the Merger and collecting a net $17 million on trade loan activity in the United Kingdom. Cash used in investing activities decreased $147 million during 2004 compared to 2003. This improvement is attributable to reduced capital spending in 2004 ($29 million lower), cash received from the sale of kegs in the United Kingdom and the sales of real estate and other property in both the United States and the United Kingdom ($72 million in 2004 compared to $16 million in 2003), and a pension settlement received in 2004 ($26 million) from Interbrew (former owners of CBL in the United Kingdom). Also, we presented as an investing activity the inclusion of the opening cash balances of the joint ventures we began consolidating during the first quarter of 2004 as result of implementing FIN 46R. Financing Activities Our debt position significantly affects our financing activity. See Note 13 on page 102 for a summary of our debt position at December 25, 2005 and December 26, 2004. Net cash used in financing activities was $189 million in 2005, compared to $336 million in 2004. During 2005, we paid dividends to stockholders of $110 million, compared to $31 million in 2004, as a result of increased shares outstanding and a revised dividend policy following the Merger. The large increase in our balance sheet debt from $932 million at year end 2004 to $2,485 million at year-end 2005 was largely the result of a “non-cash” activity, that of assuming Molson’s outstanding debt as of the Merger date (February 9, 2005). This debt assumed included borrowings Molson incurred prior to the Merger to pay the special dividends on Molson stock which preceded the Merger. Substantially all of our debt pay down occurred after the Merger date. Also, we collected approximately $11 million less in 2005 versus 2004 as a result of stock option exercises. Net cash used in financing activities was $336 million in 2004, compared to $357 million in 2003. The change is mainly the result of increased repayments of debt in 2004, offset by cash received from increased stock option exercises during the year. Capital Expenditures In 2005, we spent approximately $406 million (including approximately $47 million spent at consolidated joint ventures) on capital improvement projects worldwide. Of this, approximately half was in support of the US business with the remainder split almost equally between the European & Canadian businesses. Capital investment in the Brazilian discontinued operations and Corporate segment combined represented less than 5% of our total spending. The capital expenditure plan for 2006 is expected to be approximately $400 million (excluding capital spending by consolidated joint ventures), and will be impacted by the completion of the Shenandoah brewery build-out and synergy-related investments. Contractual Obligations and Commercial Commitments Contractual Cash Obligations as of December 25, 2005 Payments Due By Period
Total Less than 1
year 1 - 3 years 4 - 5 years After 5 years (In thousands) Long term debt, including current maturities(1) .................... $2,484,770 $348,102 $8,020 $308,019 $1,820,629Interest payments(2) ............................................................... 877,109 129,676 241,298 239,284 266,851Derivative payments(2) .......................................................... 1,727,985 84,828 165,010 469,519 1,008,628Retirement plan expenditures(3) ............................................ 403,962 188,514 45,423 48,198 121,827Operating leases ...................................................................... 262,207 55,130 79,740 46,583 80,754Capital leases(4)...................................................................... 5,493 3,551 1,634 308 —Other long-term obligations(5)............................................... 4,316,587 1,254,006 1,555,291 931,991 575,299
Total obligations .................................................................. $10,078,113 $2,063,807 $2,096,416 $2,043,902 $3,873,988
(1) We have had several significant changes to our debt obligations in 2005, primarily related to Merger-related debt and
the issuance of new bonds in Canada totaling approximately $1.1 billion in September 2005. Included in our debt
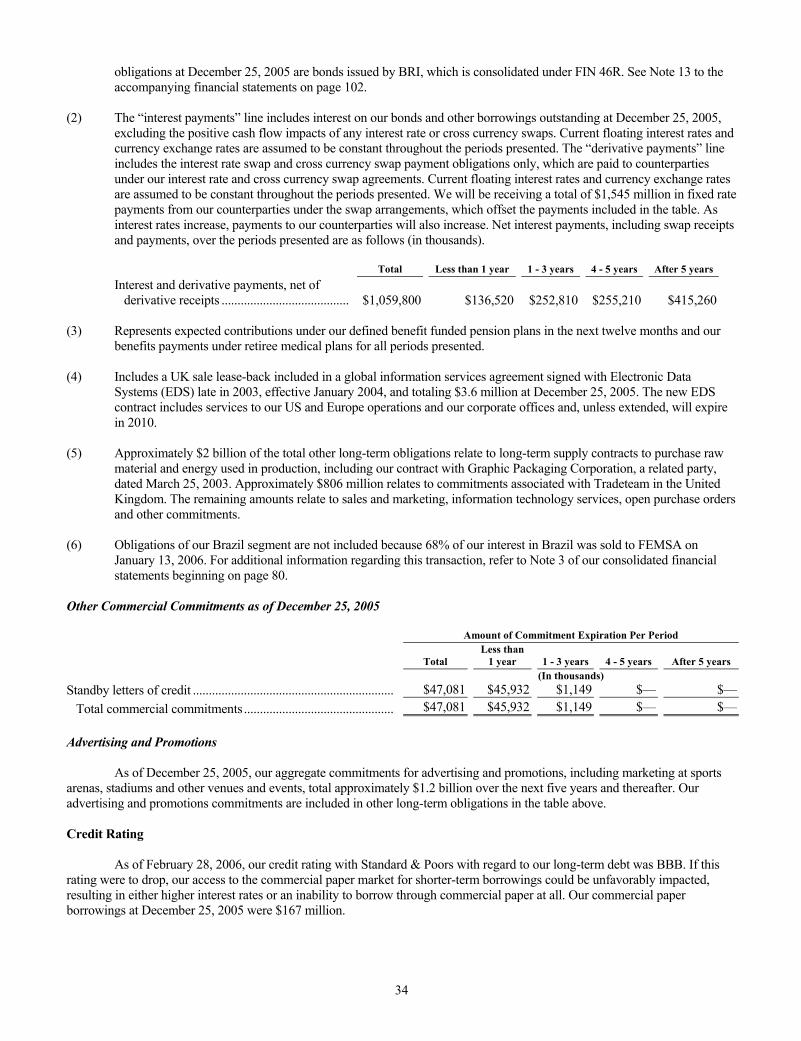
34
obligations at December 25, 2005 are bonds issued by BRI, which is consolidated under FIN 46R. See Note 13 to the accompanying financial statements on page 102.
(2) The “interest payments” line includes interest on our bonds and other borrowings outstanding at December 25, 2005,
excluding the positive cash flow impacts of any interest rate or cross currency swaps. Current floating interest rates and currency exchange rates are assumed to be constant throughout the periods presented. The “derivative payments” line includes the interest rate swap and cross currency swap payment obligations only, which are paid to counterparties under our interest rate and cross currency swap agreements. Current floating interest rates and currency exchange rates are assumed to be constant throughout the periods presented. We will be receiving a total of $1,545 million in fixed rate payments from our counterparties under the swap arrangements, which offset the payments included in the table. As interest rates increase, payments to our counterparties will also increase. Net interest payments, including swap receipts and payments, over the periods presented are as follows (in thousands).
Total Less than 1 year 1 - 3 years 4 - 5 years After 5 years Interest and derivative payments, net of
derivative receipts ........................................ $1,059,800 $136,520 $252,810 $255,210 $415,260 (3) Represents expected contributions under our defined benefit funded pension plans in the next twelve months and our
benefits payments under retiree medical plans for all periods presented. (4) Includes a UK sale lease-back included in a global information services agreement signed with Electronic Data
Systems (EDS) late in 2003, effective January 2004, and totaling $3.6 million at December 25, 2005. The new EDS contract includes services to our US and Europe operations and our corporate offices and, unless extended, will expire in 2010.
(5) Approximately $2 billion of the total other long-term obligations relate to long-term supply contracts to purchase raw
material and energy used in production, including our contract with Graphic Packaging Corporation, a related party, dated March 25, 2003. Approximately $806 million relates to commitments associated with Tradeteam in the United Kingdom. The remaining amounts relate to sales and marketing, information technology services, open purchase orders and other commitments.
(6) Obligations of our Brazil segment are not included because 68% of our interest in Brazil was sold to FEMSA on
January 13, 2006. For additional information regarding this transaction, refer to Note 3 of our consolidated financial statements beginning on page 80.
Other Commercial Commitments as of December 25, 2005 Amount of Commitment Expiration Per Period
Total Less than
1 year 1 - 3 years 4 - 5 years After 5 years (In thousands) Standby letters of credit ............................................................... $47,081 $45,932 $1,149 $— $—
Total commercial commitments............................................... $47,081 $45,932 $1,149 $— $— Advertising and Promotions As of December 25, 2005, our aggregate commitments for advertising and promotions, including marketing at sports arenas, stadiums and other venues and events, total approximately $1.2 billion over the next five years and thereafter. Our advertising and promotions commitments are included in other long-term obligations in the table above. Credit Rating As of February 28, 2006, our credit rating with Standard & Poors with regard to our long-term debt was BBB. If this rating were to drop, our access to the commercial paper market for shorter-term borrowings could be unfavorably impacted, resulting in either higher interest rates or an inability to borrow through commercial paper at all. Our commercial paper borrowings at December 25, 2005 were $167 million.
35
Pension Plans Our consolidated, unfunded pension position at the end of 2005 was approximately $800 million, an increase of $176 million from the end of 2004. The increase is the result of adding Canada’s unfunded position totaling $321 million after the Merger, netted against improvements in the US and UK unfunded pension positions. The primary cause of the improvements was the doubling of the actual UK returns on assets during 2005, compared to 2004, and additional pension contributions in the United States of $30 million in 2005, compared to 2004. Our accumulated benefit obligation increased by $1.6 billion in 2005, primarily due to the addition of the Canadian plans after the Merger. The prior service cost component of our US pension obligations declined by approximately $35 million in 2005 due to changes in our salaried employee benefit formula in July 2005. The benefit formula is now calculated based upon a salaried employee’s career average compensation, instead of the last five years’ average compensation. The UK obligations decreased due to a plan amendment in 2005, as well. The UK plan amendment served to reduce obligations in accordance with new benefit calculations approved by pension regulators during the year. The net consolidated result of movements in pension obligations and pension assets was a net increase in minimum pension obligations of $142 million at the end of 2005. It is our practice to fund pension plans to meet the minimum requirements set forth in applicable employee benefits laws. However, management may voluntarily increase funding levels to meet expense and asset return forecasts in any given year. Pension contributions on a consolidated basis were $202 million in 2005, reflecting statutory contribution levels in Canada and the United Kindgom, and $91 million of voluntary contributions in the United States. We anticipate making approximately $167 million of both statutory and voluntary contributions to our pension plans in 2006. Consolidated pension expense was $65 million in 2005, an increase of $21 million from 2004. Canada accounted for $18 million of the increase, and change in control increases due to departing Coors executives accounted for the remaining $3 million. Primarily due to lower discount rates at the end of 2005, compared to 2004, we anticipate pension expense on a consolidated basis for 2006 of approximately $45.7 million. Contingencies Brazil Guarantees On January 13, 2006, we sold a 68% equity interest in Kaiser to FEMSA for $68 million cash, plus the assumption by FEMSA of Kaiser-related debt and contingencies. Kaiser-related debt at year-end 2005 totaled approximately $60 million. Kaiser was our previously-reported Brazil operating segment. We retained a 15% interest in Kaiser and have one seat on its board. We determined that our Brazil segment represented a discontinued operation as of December 25, 2005. As a result, we have segregated the results of operations, financial position and cash flows for the Brazil segment in our financial statements to be reflected as discontinued operations. The terms of the agreement require us to indemnify FEMSA for certain exposures related to tax, civil and labor contingencies arising prior to FEMSA’s purchase of Kaiser. First, we provided a full indemnity for any losses Kaiser may incur with respect to tax claims associated with previously utilized purchased tax credits. Any potential liabilities associated with these exposures were not considered probable during 2005. The total amount of potential claims in this regard, plus estimated accumulated penalties and interest, is $205 million. Second, we provided an indemnity related to all other tax, civil and labor contingencies provided, however, that FEMSA assumed their full share of all contingent liabilities that had been recorded and disclosed by us. We may have to provide indemnity to FEMSA if those liabilities are resolved for amounts greater than those amounts recorded or disclosed by us. We will be able to offset any indemnity exposures in these circumstances with amounts that are resolved favorably to amounts previously recorded. We will record these guarantee liabilities on the balance sheet at fair value, and the creation of those liabilities will reduce the expected gain on the sale of 68% of the business to be reported in the first quarter of 2006. Guarantees under Arrangements with the Montréal Canadiens Molson Inc. sold the majority of its ownership in the Montréal Canadiens professional hockey club (the Club) to a purchaser in 2001. Molson maintains a 19.9% common ownership interest in the Club, as well as a preferred interest, redeemable in 2009. The shareholders of the Club (the purchaser and Molson) and the National Hockey League (NHL) are parties to a consent agreement, which requires the purchaser and Molson to abide by funding requirements included in the terms of the shareholders’ agreement and for Molson to provide a net working capital of $5 million and funding to enable the Club to meet its operating expenses. In addition, Molson has given certain guarantees to the NHL and the lenders of the purchaser of the Club and the Bell Centre (formerly the Molson Centre), such that in the event that the Club and the purchaser are not able to meet their obligations, or in the event of a default, we shall 1) provide adequate support to the purchaser through necessary cash payments so that the purchaser would have sufficient funds to meet its debt obligations, and 2) exercise control of the entity
36
which owns the Club and the entertainment business operated at the Bell Centre at predetermined conditions, subject to NHL approval. The obligations of the purchaser to such lenders were Cdn $92 million (approximately US $79 million) at December 25, 2005. As part of the sale transaction, Molson reaffirmed an existing guarantee of the purchaser’s payment obligations on a 99-year lease arrangement (which began in 1993) related to the land upon which the Bell Centre has been constructed. Annual lease payments in 2004 were Cdn $2.4 million (approximately US $2.1 million), and are adjusted annually to reflect prevailing interest rates and changes in the consumer price index. We have accrued the fair value of our guarantees under these arrangements as of December 25, 2005. Outlook for 2006 US Segment Coors Light is the key to success in the US business, and our primary sales and marketing programs revolve around this brand. In 2005, we focused on chain retail accounts, the Hispanic market, and the on-premise channel. Coors Light achieved a significant turn-around in 2005 by posting three consecutive growth quarters to finish 2005, following several quarters of declining sales to retail. Our plan in 2006 is to build on this momentum. The US business also will focus on capturing the identified cost savings from Merger synergies and other cost initiatives. Much of the cost improvement potential as a merged company centers on the US business, and it is important to achieve these cost savings as inflationary pressures continue to impact our cost of goods sold. We are planning to close the Memphis, Tennessee brewery in the fall of 2006. The Shenandoah, Virginia brewery is expected to be fully operational in 2007. We expect to continue to account for exit cost and other costs related to the Memphis brewery closure as special items in 2006, including accelerated depreciation, expected severance, and revisions of estimates for pension obligations. Canada Segment A main objective of 2005 was to stabilize year-over-year volume with renewed investment in mainstream brands. Share trends in the fourth quarter continued to show strong progress on Coors Light, and the Molson Canadian brand was flat in the quarter, the best result in more than two years. The value segment continued its growth trend to close out 2005; however, as we have begun to cycle the substantial ramp-up of value-brand activity in the prior year, the value segment is expected to continue to grow on a year-over-year basis in 2006 at a lower rate. Coors Light and Molson Canadian remain critical to our success. Our top-line programs are focused around these brands, while investing strategically across the entire portfolio. During 2006 we will remain focused on the objectives laid out at the beginning of the Merger, leveraging the five key priorities below and building on the strong progress to-date to drive a platform for growth. First, we will continue to drive accelerated growth for Coors Light with new marketing and sales programs. Coors Light commands approximately two-thirds of the light beer category in Canada and is now our largest brand in Canada, just ahead of Molson Canadian. This brand grew at a double-digit rate in 2005 and is our main growth engine in Canada. Second, we are making progress in stabilizing our overall volume and share trends for our other core mainstream brands, in particular Molson Canadian. Our strategies in this area began to show results by the 4th quarter of 2005 as our supported brands experienced volume and share growth. After increasing marketing investment behind the Molson Canadian brand substantially in 2005, we intend to maintain a competitive investment level for this critical brand going forward. Third, to drive volume growth, we are leveraging the strength of our world-class, partner-brand import portfolio, which includes Heineken, Corona and Miller Genuine Draft. These brands grew at significant rates in 2005 and will again benefit from new, innovative programming this year. Fourth, we have adjusted our value-segment strategies to regain lost volume and reduce the rate of trading down by consumers. We began to see positive results from these strategies in the second half of 2005, but we have more work to do. Stabilizing pricing will also be a key issue for Molson and the Industry in 2006. Fifth, we continue to focus on reducing costs to deliver the Canada-related Merger cost synergies. Through our initiatives, we will work to offset cost of goods inflation, specifically the costs of distribution, energy, and input materials, which
37
remain near historical high levels. Sales trade investment, in particular the Québec market, is a potential area of profit pressure if trade cost escalation continues to far exceed inflation. Meanwhile, we expect to limit general and administrative increases to less than inflationary levels. Europe Segment The competitive environment in the UK beer industry continues to be challenging, driving our focus is on two main strategies. First, we are implementing cost reduction initiatives, especially related to overhead and supply chain costs. While these cost improvements were implemented in the latter part of 2005 and were not enough to offset all of the margin loss that our Europe business sustained in the past year, we believe that these aggressive improvements will help this business return to a solid earnings growth trend. Second, we will continue to invest heavily behind our core lager brands—Carling, Grolsch and Coors Fine Light. The Carling brand has been consistently strong, growing market share every year for more than a decade and now represents three-fourths of our Europe volume. Because there is goodwill included in the carrying value of the Europe reporting unit, its fair value was compared to its carrying value in 2005 to determine if there was a risk of goodwill impairment. The goodwill associated with the Europe reporting unit originated in the 2002 purchase of the CBL business by Coors. A reduction in the fair value of the Europe reporting unit in the future could lead to a goodwill impairment. We noted a reduction in the value of the Europe reporting unit from 2003 to 2004, but not enough of a decrease to warrant a goodwill impairment. Future reductions in fair value could occur for a number of reasons, including cost increases due to inflation, a negative beer pricing environment, and declines in industry or company-specific beer volume sales. Corporate We expect general and administrative costs to be lower in 2006, because we experienced significant one time costs related to the formation of the new global organization and headquarters, and significant legal fees associated with regulatory and shareholder civil actions in 2005. Higher expected costs associated with incentive compensation, including costs for stock-based compensation, may offset these anticipated cost savings. Goodwill Because there is goodwill included in the carrying value of our three segments, its fair value was compared to its carrying value in 2005 to determine whether there was a risk of goodwill impairment. Most of the goodwill associated with the US and Canada segments originated in the Merger. Canada’s goodwill was determined through purchase accounting, requiring the purchase consideration to be allocated to Molson’s assets and liabilities based upon their fair values, with the residual to goodwill. A portion of the Merger goodwill was allocated to the US segment, based on the level of Merger synergy savings expected to accrue to the US segment over time. A reduction in the fair value of the US or Canada segment in the future could lead to a goodwill impairment. Reductions in fair value could occur for a number of reasons, including cost increases due to inflation, a negative beer pricing environment, declines in industry or company-specific beer volume sales, or the inability to achieve synergies from the Merger. The goodwill associated with the Europe segment originated in the 2002 purchase of the CBL business by Coors. A reduction in the fair value of the Europe segment in the future could lead to a goodwill impairment. We noted a reduction in the value of the Europe segment from 2003 to 2004, but not enough of a decrease to warrant a goodwill impairment. Future reductions in fair value could occur for a number of reasons, including cost increases due to inflation, a negative beer pricing environment, and declines in industry or company-specific beer volume sales. Interest We estimate that corporate interest expense in 2006 will be approximately $33-$34 million per quarter with the Brazil debt now removed from our balance sheet. Note that this excludes UK trade loan interest income.
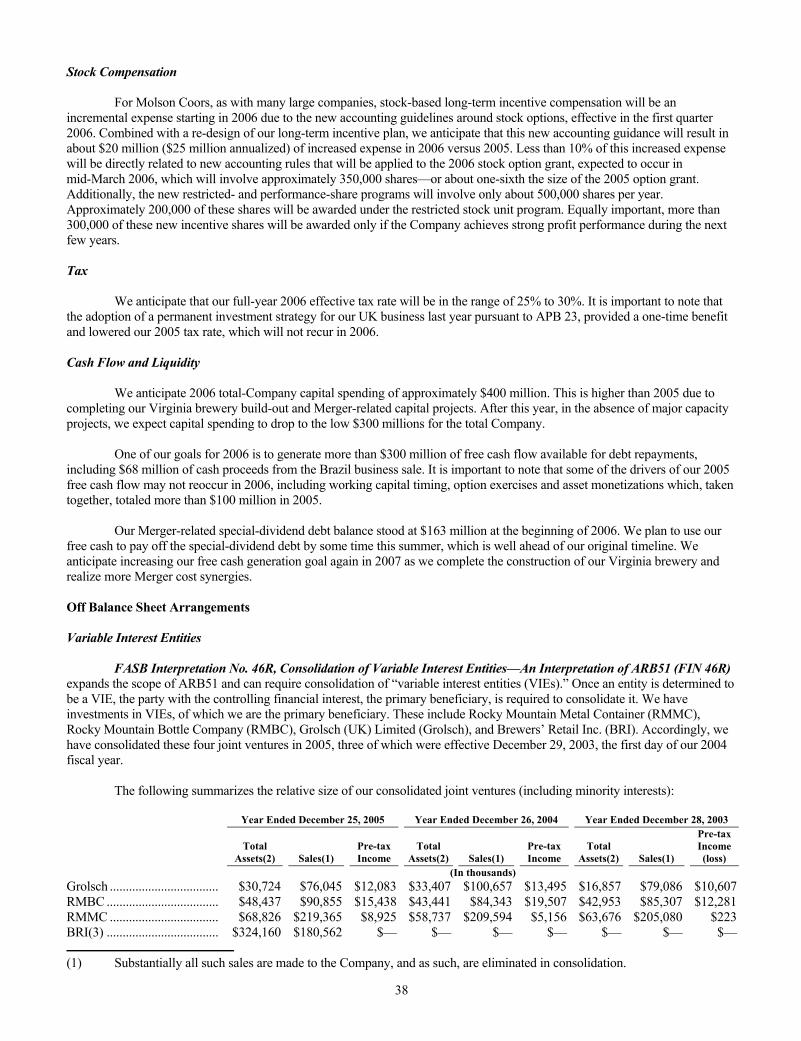
38
Stock Compensation For Molson Coors, as with many large companies, stock-based long-term incentive compensation will be an incremental expense starting in 2006 due to the new accounting guidelines around stock options, effective in the first quarter 2006. Combined with a re-design of our long-term incentive plan, we anticipate that this new accounting guidance will result in about $20 million ($25 million annualized) of increased expense in 2006 versus 2005. Less than 10% of this increased expense will be directly related to new accounting rules that will be applied to the 2006 stock option grant, expected to occur in mid-March 2006, which will involve approximately 350,000 shares—or about one-sixth the size of the 2005 option grant. Additionally, the new restricted- and performance-share programs will involve only about 500,000 shares per year. Approximately 200,000 of these shares will be awarded under the restricted stock unit program. Equally important, more than 300,000 of these new incentive shares will be awarded only if the Company achieves strong profit performance during the next few years. Tax We anticipate that our full-year 2006 effective tax rate will be in the range of 25% to 30%. It is important to note that the adoption of a permanent investment strategy for our UK business last year pursuant to APB 23, provided a one-time benefit and lowered our 2005 tax rate, which will not recur in 2006. Cash Flow and Liquidity We anticipate 2006 total-Company capital spending of approximately $400 million. This is higher than 2005 due to completing our Virginia brewery build-out and Merger-related capital projects. After this year, in the absence of major capacity projects, we expect capital spending to drop to the low $300 millions for the total Company. One of our goals for 2006 is to generate more than $300 million of free cash flow available for debt repayments, including $68 million of cash proceeds from the Brazil business sale. It is important to note that some of the drivers of our 2005 free cash flow may not reoccur in 2006, including working capital timing, option exercises and asset monetizations which, taken together, totaled more than $100 million in 2005. Our Merger-related special-dividend debt balance stood at $163 million at the beginning of 2006. We plan to use our free cash to pay off the special-dividend debt by some time this summer, which is well ahead of our original timeline. We anticipate increasing our free cash generation goal again in 2007 as we complete the construction of our Virginia brewery and realize more Merger cost synergies. Off Balance Sheet Arrangements Variable Interest Entities FASB Interpretation No. 46R, Consolidation of Variable Interest Entities—An Interpretation of ARB51 (FIN 46R) expands the scope of ARB51 and can require consolidation of “variable interest entities (VIEs).” Once an entity is determined to be a VIE, the party with the controlling financial interest, the primary beneficiary, is required to consolidate it. We have investments in VIEs, of which we are the primary beneficiary. These include Rocky Mountain Metal Container (RMMC), Rocky Mountain Bottle Company (RMBC), Grolsch (UK) Limited (Grolsch), and Brewers’ Retail Inc. (BRI). Accordingly, we have consolidated these four joint ventures in 2005, three of which were effective December 29, 2003, the first day of our 2004 fiscal year. The following summarizes the relative size of our consolidated joint ventures (including minority interests): Year Ended December 25, 2005 Year Ended December 26, 2004 Year Ended December 28, 2003
Total
Assets(2) Sales(1) Pre-taxIncome
Total Assets(2) Sales(1)
Pre-taxIncome
Total Assets(2) Sales(1)
Pre-taxIncome(loss)
(In thousands) Grolsch .................................. $30,724 $76,045 $12,083 $33,407 $100,657 $13,495 $16,857 $79,086 $10,607RMBC ................................... $48,437 $90,855 $15,438 $43,441 $84,343 $19,507 $42,953 $85,307 $12,281RMMC .................................. $68,826 $219,365 $8,925 $58,737 $209,594 $5,156 $63,676 $205,080 $223BRI(3) ................................... $324,160 $180,562 $— $— $— $— $— $— $—
(1) Substantially all such sales are made to the Company, and as such, are eliminated in consolidation.
39
(2) Excludes receivables from the Company. (3) BRI results from February 9, 2005, the date of the Merger. Revenues reflect service charge revenues earned by BRI
from the sale of products to the consumer; amount does not include beer sales of the Company, which are sold on a consignment basis. Total annual BRI beer sales handled by BRI approximate Cdn $2.6 billion, of which MCBC recognizes its share, or approximately 52%, as net sales in the statement of income.
Critical Accounting Policies and Estimates Management’s discussion and analysis of our financial condition and results of operations are based upon our consolidated financial statements, which have been prepared in accordance with accounting principles generally accepted in the United States, or US GAAP. We review our accounting policies on an on going basis. The preparation of our consolidated financial statements requires us to make estimates and judgments that affect the reported amounts of assets, liabilities, revenues and expenses, and related disclosures of contingent assets and liabilities. We base our estimates on historical experience and on various other assumptions we believe to be reasonable under the circumstances. By their nature, estimates are subject to uncertainty. Actual results may differ materially from these estimates under different assumptions or conditions. We have identified the accounting estimates below as critical to our financial condition and results of operations: Allowance for Doubtful Accounts In the US segment, our allowance for doubtful accounts and credit risk is insignificant. The majority of the US segment accounts receivable balance is generated from sales to independent distributors with whom we have a predetermined collection date arranged through electronic funds transfer. Also, in the US segment, we secure substantially all of our credit risk with purchase money security interests in inventory and proceeds, personal guarantees and other letters of credit. Because the majority of CBL sales are directly to retail customers and, because of the industry practice of making trade loans to customers, our ability to manage credit risk in this business is critical. We provide allowances for trade receivables and trade loans associated with the ability to collect outstanding receivables from our customers. Generally, provisions are recorded to cover the full exposure to a specific customer (total amount of all trade accounts and loans from a specific customer less the amount of security and insurance coverage) at the point the account is considered uncollectible. We record the provision as a bad debt in general and administrative expenses. Provisions are reversed upon recoverability of the account or relieved at the point an account is written off. Canada’s distribution channels are highly regulated by provincial regulation and experiences few collectibility problems. However, Canada does have direct sales to retail customers for which an allowance is recorded based upon aging analysis and historical experience. We are not able to predict changes in financial condition of our customers and, if circumstances related to our customers deteriorate, our estimates of the recoverability of our trade receivables could be adversely affected, and we may be required to record additional allowances. Pension and Postretirement Benefits We have defined benefit plans that cover the majority of our employees in the United States, Canada, and the United Kingdom. We also have postretirement welfare plans in the United States and Canada that provide medical benefits for retirees and eligible dependents and life insurance for certain retirees. The accounting for these plans is subject to the guidance provided in Statement of Financial Accounting Standards No. 87, “Employers’ Accounting for Pensions” (SFAS No. 87) and Statement of Financial Accounting Standards No. 106, “Employers’ Accounting for Postretirement Benefits Other than Pensions” (SFAS No. 106). Both of these statements require that management make certain assumptions relating to the long-term rate of return on plan assets, discount rates used to measure future obligations and expenses, salary increases, inflation, health care cost trend rates and other assumptions. We believe that the accounting estimates related to our pension and postretirement plans are critical accounting estimates because they are highly susceptible to change from period to period based on market conditions.
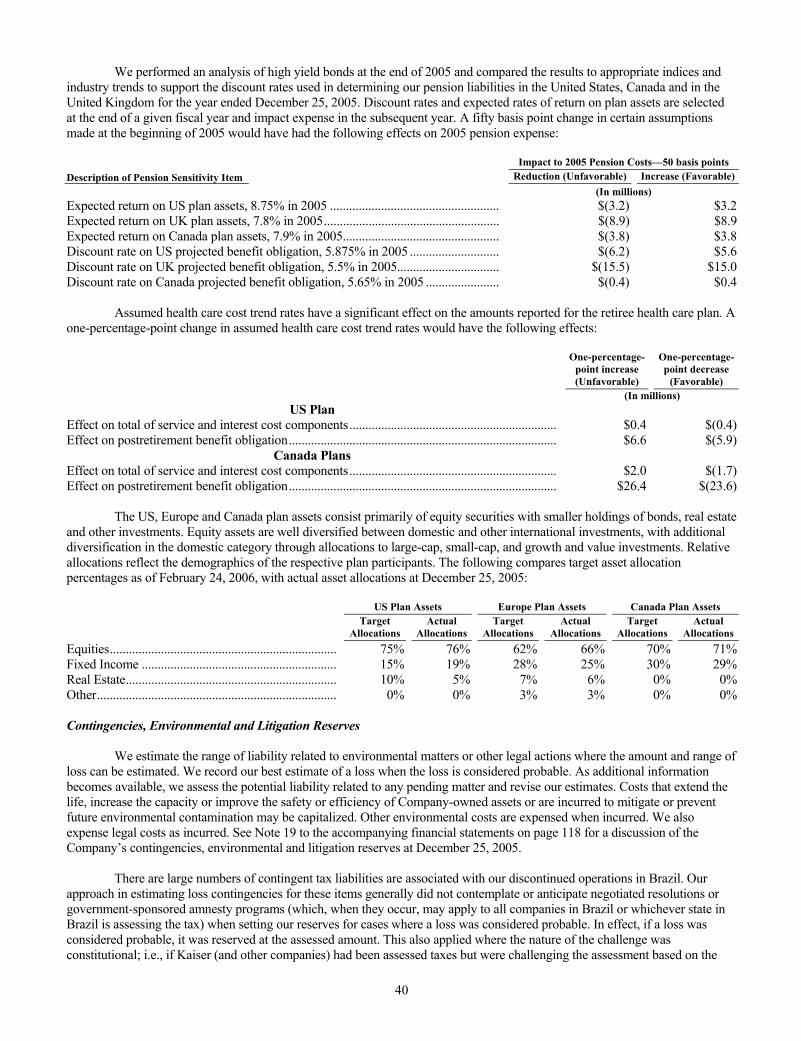
40
We performed an analysis of high yield bonds at the end of 2005 and compared the results to appropriate indices and industry trends to support the discount rates used in determining our pension liabilities in the United States, Canada and in the United Kingdom for the year ended December 25, 2005. Discount rates and expected rates of return on plan assets are selected at the end of a given fiscal year and impact expense in the subsequent year. A fifty basis point change in certain assumptions made at the beginning of 2005 would have had the following effects on 2005 pension expense: Impact to 2005 Pension Costs—50 basis points Description of Pension Sensitivity Item Reduction (Unfavorable) Increase (Favorable) (In millions) Expected return on US plan assets, 8.75% in 2005 ..................................................... $(3.2) $3.2Expected return on UK plan assets, 7.8% in 2005....................................................... $(8.9) $8.9Expected return on Canada plan assets, 7.9% in 2005................................................. $(3.8) $3.8Discount rate on US projected benefit obligation, 5.875% in 2005 ............................ $(6.2) $5.6Discount rate on UK projected benefit obligation, 5.5% in 2005................................ $(15.5) $15.0Discount rate on Canada projected benefit obligation, 5.65% in 2005 ....................... $(0.4) $0.4 Assumed health care cost trend rates have a significant effect on the amounts reported for the retiree health care plan. A one-percentage-point change in assumed health care cost trend rates would have the following effects:
One-percentage- point increase (Unfavorable)
One-percentage-point decrease
(Favorable) (In millions)
US Plan Effect on total of service and interest cost components................................................................. $0.4 $(0.4)Effect on postretirement benefit obligation.................................................................................... $6.6 $(5.9)
Canada Plans Effect on total of service and interest cost components................................................................. $2.0 $(1.7)Effect on postretirement benefit obligation.................................................................................... $26.4 $(23.6) The US, Europe and Canada plan assets consist primarily of equity securities with smaller holdings of bonds, real estate and other investments. Equity assets are well diversified between domestic and other international investments, with additional diversification in the domestic category through allocations to large-cap, small-cap, and growth and value investments. Relative allocations reflect the demographics of the respective plan participants. The following compares target asset allocation percentages as of February 24, 2006, with actual asset allocations at December 25, 2005: US Plan Assets Europe Plan Assets Canada Plan Assets
Target
Allocations Actual
Allocations Target
Allocations Actual
Allocations Target
Allocations Actual
Allocations Equities....................................................................... 75% 76% 62% 66% 70% 71%Fixed Income ............................................................. 15% 19% 28% 25% 30% 29%Real Estate.................................................................. 10% 5% 7% 6% 0% 0%Other........................................................................... 0% 0% 3% 3% 0% 0% Contingencies, Environmental and Litigation Reserves We estimate the range of liability related to environmental matters or other legal actions where the amount and range of loss can be estimated. We record our best estimate of a loss when the loss is considered probable. As additional information becomes available, we assess the potential liability related to any pending matter and revise our estimates. Costs that extend the life, increase the capacity or improve the safety or efficiency of Company-owned assets or are incurred to mitigate or prevent future environmental contamination may be capitalized. Other environmental costs are expensed when incurred. We also expense legal costs as incurred. See Note 19 to the accompanying financial statements on page 118 for a discussion of the Company’s contingencies, environmental and litigation reserves at December 25, 2005. There are large numbers of contingent tax liabilities are associated with our discontinued operations in Brazil. Our approach in estimating loss contingencies for these items generally did not contemplate or anticipate negotiated resolutions or government-sponsored amnesty programs (which, when they occur, may apply to all companies in Brazil or whichever state in Brazil is assessing the tax) when setting our reserves for cases where a loss was considered probable. In effect, if a loss was considered probable, it was reserved at the assessed amount. This also applied where the nature of the challenge was constitutional; i.e., if Kaiser (and other companies) had been assessed taxes but were challenging the assessment based on the
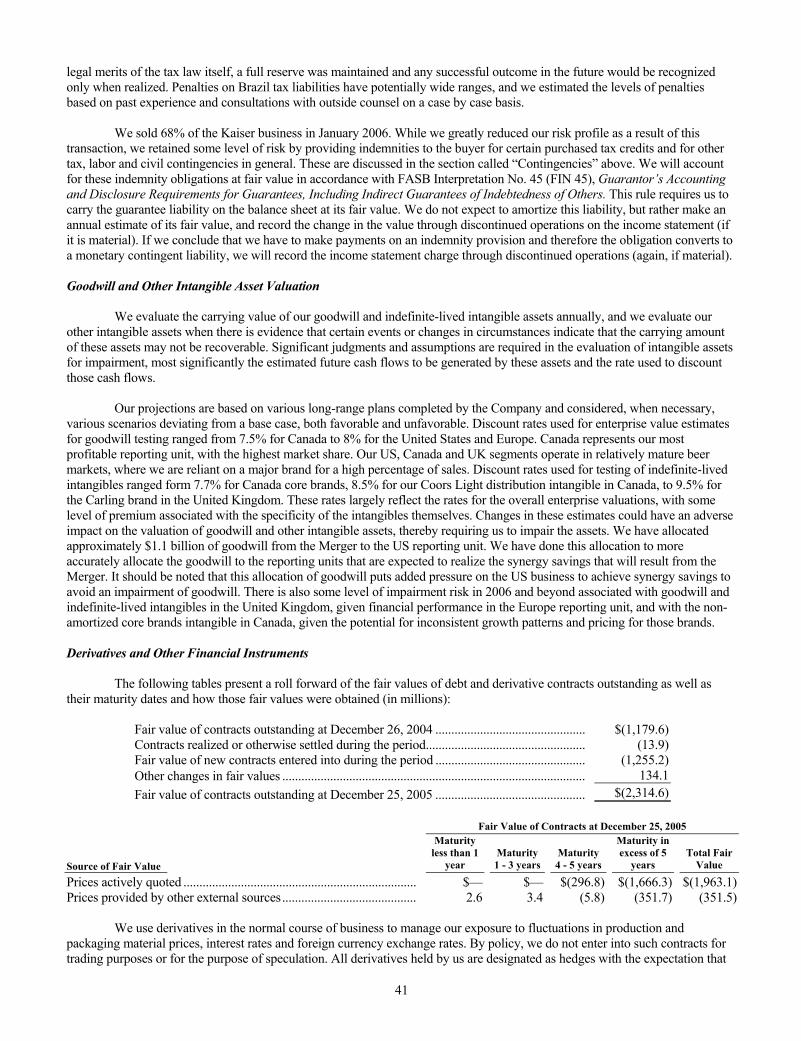
41
legal merits of the tax law itself, a full reserve was maintained and any successful outcome in the future would be recognized only when realized. Penalties on Brazil tax liabilities have potentially wide ranges, and we estimated the levels of penalties based on past experience and consultations with outside counsel on a case by case basis. We sold 68% of the Kaiser business in January 2006. While we greatly reduced our risk profile as a result of this transaction, we retained some level of risk by providing indemnities to the buyer for certain purchased tax credits and for other tax, labor and civil contingencies in general. These are discussed in the section called “Contingencies” above. We will account for these indemnity obligations at fair value in accordance with FASB Interpretation No. 45 (FIN 45), Guarantor’s Accounting and Disclosure Requirements for Guarantees, Including Indirect Guarantees of Indebtedness of Others. This rule requires us to carry the guarantee liability on the balance sheet at its fair value. We do not expect to amortize this liability, but rather make an annual estimate of its fair value, and record the change in the value through discontinued operations on the income statement (if it is material). If we conclude that we have to make payments on an indemnity provision and therefore the obligation converts to a monetary contingent liability, we will record the income statement charge through discontinued operations (again, if material). Goodwill and Other Intangible Asset Valuation We evaluate the carrying value of our goodwill and indefinite-lived intangible assets annually, and we evaluate our other intangible assets when there is evidence that certain events or changes in circumstances indicate that the carrying amount of these assets may not be recoverable. Significant judgments and assumptions are required in the evaluation of intangible assets for impairment, most significantly the estimated future cash flows to be generated by these assets and the rate used to discount those cash flows. Our projections are based on various long-range plans completed by the Company and considered, when necessary, various scenarios deviating from a base case, both favorable and unfavorable. Discount rates used for enterprise value estimates for goodwill testing ranged from 7.5% for Canada to 8% for the United States and Europe. Canada represents our most profitable reporting unit, with the highest market share. Our US, Canada and UK segments operate in relatively mature beer markets, where we are reliant on a major brand for a high percentage of sales. Discount rates used for testing of indefinite-lived intangibles ranged form 7.7% for Canada core brands, 8.5% for our Coors Light distribution intangible in Canada, to 9.5% for the Carling brand in the United Kingdom. These rates largely reflect the rates for the overall enterprise valuations, with some level of premium associated with the specificity of the intangibles themselves. Changes in these estimates could have an adverse impact on the valuation of goodwill and other intangible assets, thereby requiring us to impair the assets. We have allocated approximately $1.1 billion of goodwill from the Merger to the US reporting unit. We have done this allocation to more accurately allocate the goodwill to the reporting units that are expected to realize the synergy savings that will result from the Merger. It should be noted that this allocation of goodwill puts added pressure on the US business to achieve synergy savings to avoid an impairment of goodwill. There is also some level of impairment risk in 2006 and beyond associated with goodwill and indefinite-lived intangibles in the United Kingdom, given financial performance in the Europe reporting unit, and with the non-amortized core brands intangible in Canada, given the potential for inconsistent growth patterns and pricing for those brands. Derivatives and Other Financial Instruments The following tables present a roll forward of the fair values of debt and derivative contracts outstanding as well as their maturity dates and how those fair values were obtained (in millions):
Fair value of contracts outstanding at December 26, 2004 ............................................... $(1,179.6)Contracts realized or otherwise settled during the period.................................................. (13.9)Fair value of new contracts entered into during the period ............................................... (1,255.2)Other changes in fair values ............................................................................................... 134.1Fair value of contracts outstanding at December 25, 2005 ............................................... $(2,314.6)
Fair Value of Contracts at December 25, 2005
Source of Fair Value
Maturity less than 1
year Maturity1 - 3 years
Maturity 4 - 5 years
Maturity inexcess of 5
years Total Fair
Value
Prices actively quoted ......................................................................... $— $— $(296.8) $(1,666.3) $(1,963.1)Prices provided by other external sources.......................................... 2.6 3.4 (5.8) (351.7) (351.5) We use derivatives in the normal course of business to manage our exposure to fluctuations in production and packaging material prices, interest rates and foreign currency exchange rates. By policy, we do not enter into such contracts for trading purposes or for the purpose of speculation. All derivatives held by us are designated as hedges with the expectation that
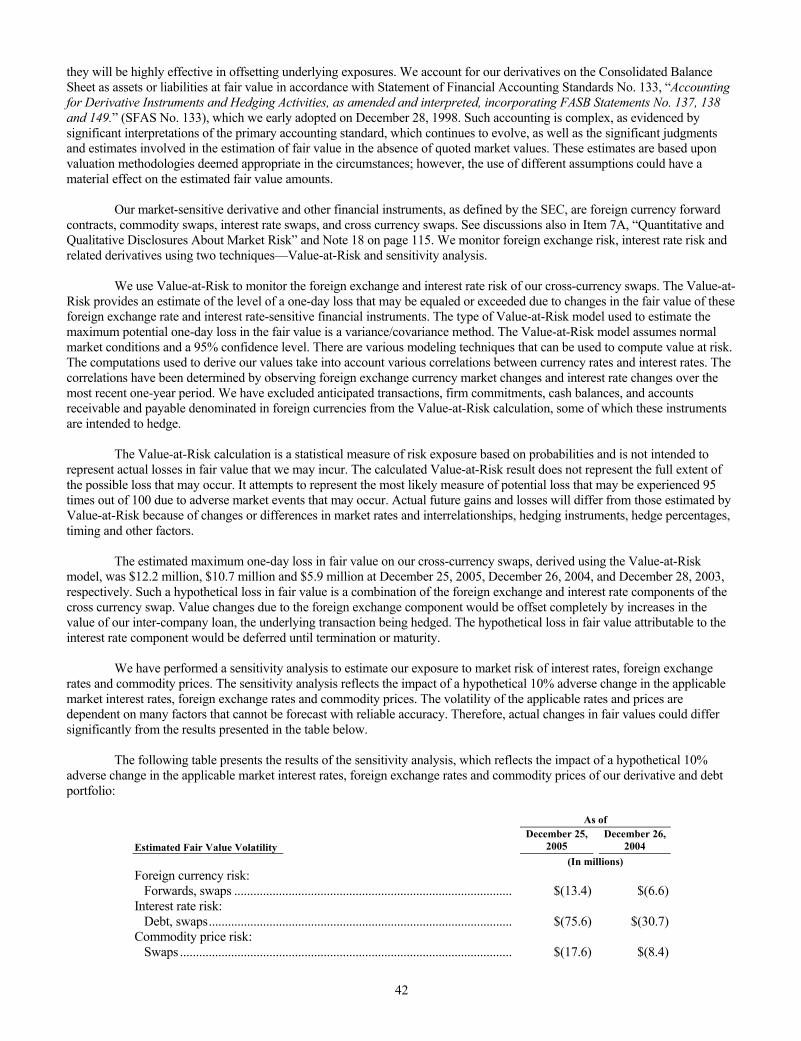
42
they will be highly effective in offsetting underlying exposures. We account for our derivatives on the Consolidated Balance Sheet as assets or liabilities at fair value in accordance with Statement of Financial Accounting Standards No. 133, “Accounting for Derivative Instruments and Hedging Activities, as amended and interpreted, incorporating FASB Statements No. 137, 138 and 149.” (SFAS No. 133), which we early adopted on December 28, 1998. Such accounting is complex, as evidenced by significant interpretations of the primary accounting standard, which continues to evolve, as well as the significant judgments and estimates involved in the estimation of fair value in the absence of quoted market values. These estimates are based upon valuation methodologies deemed appropriate in the circumstances; however, the use of different assumptions could have a material effect on the estimated fair value amounts. Our market-sensitive derivative and other financial instruments, as defined by the SEC, are foreign currency forward contracts, commodity swaps, interest rate swaps, and cross currency swaps. See discussions also in Item 7A, “Quantitative and Qualitative Disclosures About Market Risk” and Note 18 on page 115. We monitor foreign exchange risk, interest rate risk and related derivatives using two techniques—Value-at-Risk and sensitivity analysis. We use Value-at-Risk to monitor the foreign exchange and interest rate risk of our cross-currency swaps. The Value-at-Risk provides an estimate of the level of a one-day loss that may be equaled or exceeded due to changes in the fair value of these foreign exchange rate and interest rate-sensitive financial instruments. The type of Value-at-Risk model used to estimate the maximum potential one-day loss in the fair value is a variance/covariance method. The Value-at-Risk model assumes normal market conditions and a 95% confidence level. There are various modeling techniques that can be used to compute value at risk. The computations used to derive our values take into account various correlations between currency rates and interest rates. The correlations have been determined by observing foreign exchange currency market changes and interest rate changes over the most recent one-year period. We have excluded anticipated transactions, firm commitments, cash balances, and accounts receivable and payable denominated in foreign currencies from the Value-at-Risk calculation, some of which these instruments are intended to hedge. The Value-at-Risk calculation is a statistical measure of risk exposure based on probabilities and is not intended to represent actual losses in fair value that we may incur. The calculated Value-at-Risk result does not represent the full extent of the possible loss that may occur. It attempts to represent the most likely measure of potential loss that may be experienced 95 times out of 100 due to adverse market events that may occur. Actual future gains and losses will differ from those estimated by Value-at-Risk because of changes or differences in market rates and interrelationships, hedging instruments, hedge percentages, timing and other factors. The estimated maximum one-day loss in fair value on our cross-currency swaps, derived using the Value-at-Risk model, was $12.2 million, $10.7 million and $5.9 million at December 25, 2005, December 26, 2004, and December 28, 2003, respectively. Such a hypothetical loss in fair value is a combination of the foreign exchange and interest rate components of the cross currency swap. Value changes due to the foreign exchange component would be offset completely by increases in the value of our inter-company loan, the underlying transaction being hedged. The hypothetical loss in fair value attributable to the interest rate component would be deferred until termination or maturity. We have performed a sensitivity analysis to estimate our exposure to market risk of interest rates, foreign exchange rates and commodity prices. The sensitivity analysis reflects the impact of a hypothetical 10% adverse change in the applicable market interest rates, foreign exchange rates and commodity prices. The volatility of the applicable rates and prices are dependent on many factors that cannot be forecast with reliable accuracy. Therefore, actual changes in fair values could differ significantly from the results presented in the table below. The following table presents the results of the sensitivity analysis, which reflects the impact of a hypothetical 10% adverse change in the applicable market interest rates, foreign exchange rates and commodity prices of our derivative and debt portfolio:
As of
Estimated Fair Value Volatility December 25,
2005 December 26,
2004 (In millions) Foreign currency risk:
Forwards, swaps ....................................................................................... $(13.4) $(6.6)Interest rate risk:
Debt, swaps............................................................................................... $(75.6) $(30.7)Commodity price risk:
Swaps ........................................................................................................ $(17.6) $(8.4)
43
Income Tax Assumptions We account for income taxes in accordance with Statement of Financial Accounting Standards No. 109, “Accounting for Income Taxes” (SFAS No. 109) Judgment is required in determining our worldwide provision for income taxes. In the ordinary course of our global business, there are many transactions for which the ultimate tax outcome is uncertain. Additionally, our income tax provision is based on calculations and assumptions that are subject to examination by many different tax authorities. We adjust our income tax provision in the period it is probable that actual results will differ from our estimates. Tax law and rate changes are reflected in the income tax provision in the period in which such changes are enacted. We have historically provided US deferred income taxes on the undistributed earnings of certain of our foreign subsidiaries. During 2005, we assessed our corporate financing position with respect to all our foreign subsidiaries. As a result, we have elected to treat our portion of all foreign subsidiary earnings through December 25, 2005 as permanently reinvested. Under the accounting guidance of APB 23 and SFAS 109, we recorded a tax provision benefit in the third quarter of 2005 totaling $44 million, representing the reversal of a previously established deferred tax liability in our UK subsidiary. As of December 25, 2005, approximately $255 million of retained earnings attributable to international companies was considered to be permanently re-invested. The Company’s intention is to reinvest the earnings permanently or to repatriate the earnings when it is tax effective to do so. It is not practicable to determine the amount of incremental taxes that might arise were these earnings to be remitted. However, the Company believes that US foreign tax credits would largely eliminate any US taxes and offset any foreign withholding taxes due on remittance. On October 22, 2004, the American Jobs Creation Act of 2004 (the “Jobs Act”) provided a deduction for income from qualified domestic production activities, which will be phased in from 2005 through 2010. In return, the Act also provides for a two-year phase-out of the existing extra-territorial income exclusion (ETI) for foreign sales that was viewed to be inconsistent with international trade protocols by the European Union. The net effect of the phase-out of the ETI and the phase-in of this new deduction did not materially impact the Company’s effective tax rate in 2005. In addition to the deduction for income from qualified domestic production activities, the Jobs Act also creates a temporary incentive for US corporations to repatriate accumulated income earned abroad by providing an 85 percent dividends received deduction for certain dividends from controlled foreign corporations. The deduction is subject to a number of limitations, which resulted in the Company not recognizing a benefit from this provision of the Jobs Act. The FASB is currently considering changes to accounting for uncertain tax positions. Because the nature and extent of the changes are not fully known we are not able to predict the impact on our tax contingency reserve, if any. We record a valuation allowance to reduce our deferred tax assets to the amount that is more likely than not to be realized. While we consider future taxable income and ongoing prudent and feasible tax planning strategies in assessing the need for the valuation allowance, in the event we were to determine that we would be able to realize our deferred tax assets in the future in excess of its net recorded amount, an adjustment to the deferred tax asset would increase income in the period a determination was made. Likewise, should we determine that we would not be able to realize all or part of our net deferred tax asset in the future, an adjustment to the deferred tax asset would be charged to income in the period such determination was made. Reductions to the valuation allowance related to the Merger with Molson or the acquisitions of CBL that relate to deferred taxes arising from those events would reduce goodwill, unless the reduction was caused by a change in law, in which case the adjustment would impact earnings. During 2002, in connection with the purchase of CBL, we recorded a deferred tax liability on the books of CBL and a corresponding deferred tax asset on the books of the acquiring Company for the difference between the purchase price and historical basis of the CBL assets. Concurrently, we recorded a $40.0 million valuation allowance to reduce our deferred tax asset to the amount that is more likely than not to be realized. In 2005 the Company re-evaluated the purchase accounting and determined that recording this deferred tax asset was not appropriate as it did not represent either a tax carry-forward or a difference in the book and tax bases of the net assets at the time the purchase accounting adjustments were recorded. The impact of the misstatement on the Company’s balance sheet was an overstatement of the long-term deferred tax asset account of $157 million, with a corresponding understatement of goodwill of $147 million at December 26, 2004. The impact of this misstatement was not material to the consolidated balance sheets for December 26, 2004. This error resulted in immaterial misstatements in the Company’s reported income tax provision for the year ended December 26, 2004. See Item 9A on page 136.
44
Consolidations under FIN 46R RMMC and RMBC are dedicated predominantly to our packaging and distribution activities and were formed with companies which have core competencies in the aluminum and glass container businesses. The CBL joint venture with Grolsch was formed to provide a long-term relationship with that brand’s owner in a key segment of the UK beer market. In 2003, our share of the pre-tax joint venture profits for each of these investments was offset against cost of goods sold in our Consolidated Statements of Income. In 2004, as a result of implementing FIN 46R, these entities have been consolidated into our Consolidated Financial Statements as we have determined they are variable interest entities and that we are the primary beneficiary. We also consolidate the financial position and results of Brewers Retail, Inc. (BRI), which is 52% owned by Molson, and provides all distribution and retail sales of beer in the province of Ontario in Canada. We have examined another potential business relationship during 2004 when implementing FIN 46R. This is the relationship we have with Trigen, the supplier of virtually all our energy needs at our Golden facility. Trigen purchased our power plant facilities in 1995 and signed a contract to provide our energy needs in Golden. We do not own any portion of the Trigen entity, but upon review of the supply contract, we believe that the relationship could be viewed as a variable interest, as defined by FIN 46R. However, despite exhaustive efforts to obtain financial information necessary to proceed with the analysis, we have been unable to obtain the information from Trigen, which cites privacy and competitive issues with releasing this financial information. We purchase approximately $34.0 million of energy each year from Trigen. We have determined that any risk of a material loss is remote and that our total maximum loss cannot be reasonably estimated. We do not have another readily available option to obtain the steam energy required to run our plant. We could incur operational losses should we be unable to purchase steam from Trigen, and we are unable to estimate any such losses. In addition, we have a non-cancelable obligation to pay Trigen fixed costs through the remainder of the contract. The costs are adjusted annually for inflation and were approximately $17.5 million in 2005. We currently purchase some of our electricity requirements from another supplier at rates that do not significantly differ from the rates we pay Trigen. Our risk of loss relating to the difference in price from having to buy electricity from another third party rather than from Trigen is not significant. In the event that Trigen failed to perform its contractual obligations, MCBC has the right to step in and operate the power plant facilities. This circumstance would involve MCBC repurchasing the power plant assets, a cost that could be borne with MCBC’s current capital resources. Adoption of New Accounting Pronouncement FASB Interpretation No. 47 “Accounting for Conditional Asset Retirement Obligations, an interpretation of FASB Statement No. 143” In March 2005, the FASB issued FASB Interpretation No. 47—”Accounting for Conditional Asset Retirement Obligations, an interpretation of FASB Statement No. 143,” (“FIN 47”) which clarifies the term “conditional asset retirement obligation” as used in SFAS No. 143, “Accounting for Asset Retirement Obligations.” (“SFAS No. 143”) Specifically, FIN 47 provides that an asset retirement obligation is conditional when either the timing and (or) method of settling the obligation is conditioned on a future event. Accordingly, an entity is required to recognize a liability for the fair value of a conditional asset retirement obligation if the fair market value of the liability can be reasonably estimated. Uncertainty about the timing and (or) method of settlement of a conditional asset retirement obligation should be factored into the measurement of the liability when sufficient information exists. We adopted FIN 47 on December 25, 2005, which resulted in an increase to properties of $0.5 million, goodwill of $2.2 million and liabilities of $9.6 million related to asset retirement obligations. For asset retirement obligations related to the properties acquired in the acquisition of Molson Inc. as of February 9, 2005, such obligations increased the goodwill amounts recognized upon the acquisition by $2.2 million as such properties were recorded at the appraised fair market value at the acquisition date. These asset retirement obligations relate primarily to clean-up, removal, or replacement activities and related costs for asbestos, coolants, waste water, oils and other contaminants contained within our manufacturing properties. The adoption of FIN 47 was reflected in our financial statements as the cumulative effect of the change in accounting principle with the catch-up adjustment of $3.7 million, net of tax benefit of $2.2 million, in the 2005 income statement. This adjustment represents a depreciation charge and an accretion of liability from the time the obligation originated, which is either from the time of the acquisition or the construction of related long-lived assets, through December 25, 2005. Inherent in the fair value calculation of asset retirement obligations are numerous assumptions and judgments including the ultimate settlement amounts, inflation factors, credit adjusted discount rates, timing of settlement, and changes in the legal, regulatory, environmental and political environments. To the extent future revisions to these assumptions impact the fair value of
45
the existing asset retirement obligation liability, a corresponding adjustment will be made to the asset balance. If the obligation is settled for other than the carrying amount of the liability, we will recognize a gain or loss upon the settlement. The net value of the asset retirement obligation liabilities calculated on a pro-forma basis as if the standard had been retrospectively applied to all periods presented are as follows:
December 25, 2005 December 26, 2004 December 28, 2003 $9,628,580 $5,926,852 $5,487,826
New Accounting Pronouncements SFAS 123R, “Share-Based Payment” Statement of Financial Accounting Standard No. 123R (SFAS No. 123R) was issued in December 2004 and will be effective for us in the first quarter of 2006. SFAS No. 123R requires all share-based payments to employees, including grants of employee stock options, to be recognized as compensation in the financial statements based on their fair values. Currently, under an exemption written into the guidance for qualifying stock option grants with no intrinsic value on the date of grant, we present pro forma share-based compensation expense for our stock option program in the notes to our financial statements. We have elected to use the modified-prospective transition method of implementing SFAS 123R. Under the modified prospective method, awards that are granted, modified, or settled after adoption of SFAS 123R are prospectively measured and accounted for in accordance with SFAS 123R. Unvested equity-classified awards that were granted prior to the adoption of SFAS 123R should continue to be accounted for in accordance with SFAS 123, except that amounts must be recognized in the income statement. In March 2005, the SEC issued Staff Accounting Bulletin 107 (SAB 107) to assist preparers by simplifying some of the implementation challenges of SFAS 123R. In particular, SAB 107 provides supplemental implementation guidance on SFAS 123R, including guidance on valuation methods, classification of compensation expense, inventory capitalization of share-based compensation cost, income tax effects, disclosures in Management’s Discussion and Analysis and several other issues. We will apply the principles of SAB 107 in conjunction with our adoption of SFAS 123R. We have elected to use the Black-Scholes option pricing model to value stock options granted in 2006 and will amortize the expense on a straight-line basis over the vesting period. We expect to use lattice modeling to determine our expected term assumption. Other equity instruments issued as compensation will be valued based upon the market price of our stock on the date of grant and will be amortized on a straight-line basis over their earnings periods. The pro forma disclosures in Note 1 to the Consolidated Financial Statements included in Item 8 on page 70 illustrate the approximate impact of applying SFAS 123R to the historical periods presented. However, the 2005 historical period presented includes the effects of the accelerated vesting of all outstanding, but unvested stock options on the date of our Merger ($18 million) and the accelerated vesting of all outstanding, but unvested stock options with exercise prices above $70 approved by our Board of Directors in December 2005 ($29 million). The Board action in December, while serving to reduce future stock option amortization expense as a result of adoption of SFAS 123R, will be partially offset by new issuances of equity instruments to employees in 2006. We are finalizing our first quarter 2006 option expense calculations and do not yet know the impact to our income statement. SFAS No. 151 “Inventory Costs” SFAS No. 151 is an amendment to ARB No. 43, Chapter 4 that will be effective for us in fiscal 2006. The standard clarifies the accounting for abnormal amounts of idle facility expense, freight, handling costs, and spoilage to require that those costs be expensed currently, as opposed to being included in overhead costs. We do not anticipate that the adoption will have a significant impact on our financial statements. SFAS No. 154 “Accounting Changes and Corrections” SFAS No. 154 replaces APB Opinion No. 20 and FAS No. 3 and will be effective for us in fiscal 2006. The standard introduces a new requirement to retrospectively apply accounting principle changes to prior years’ comparative financial statements as if the Company had always applied the newly adopted accounting principle. Changes in depreciation, amortization and depletion methods previously considered a change in accounting principle are now considered a change in estimate under SFAS No. 154, requiring prospective adoption.
46
SFAS No. 155, “Accounting for Certain Hybrid Financial Instruments” SFAS No. 155 was issued in February 2006 and will be effective for us in the first quarter of our 2007 fiscal year. Among other things, SFAS No. 155 simplifies the accounting for certain hybrid financial instruments by permitting fair value accounting for any hybrid financial instrument that contains an embedded derivative that otherwise would require bifurcation. We are still reviewing the impact that SFAS No. 155 will have on our financial statements. FASB Staff Position (“FSP”) No. FIN 45-3 “Application of FASB Interpretation No. 45 to Minimum Revenue Guarantees Granted to a Business or its Owners” FSP No. FIN 45-3 is an amendment to FIN 45 requiring the recognition and disclosure of the fair value of an obligation undertaken for minimum revenue guarantees granted to a business or its owners that the revenue of the business for a specified period of time will be at least a specified minimum amount. The FSP is effective for new minimum revenue guarantees issued or modified on or after the beginning of the first quarter 2006. We do not anticipate that the adoption will have a significant impact on our financial statements. Related Party Transactions Transactions with Management and Others We employ members of the Coors and Molson families, which collectively owned 81% of the voting A share, common and exchangeable stock of the Company after the Merger and throughout 2005. Hiring and placement decisions are made based upon merit, and compensation packages offered are commensurate with policies in place for all employees of the Company. Certain Business Relationships We purchase a large portion of our paperboard packaging requirements from Graphic Packaging Corporation (GPC), a related party. As of December 25, 2005, various Coors family trusts collectively owned approximately 40% of our Class A voting common stock, approximately 13% of our Class B common stock, and approximately 30% of GPC’s common stock. Our payments under the GPC packaging agreement in 2005, 2004 and 2003 totaled $75.3 million, $104.5 million and $106.4 million, respectively. Related accounts payable balances included in Affiliates Accounts Payable on the Consolidated Balance Sheets were $2.8 million and $3.4 million at December 25, 2005, and December 26, 2004, respectively. ITEM 7A. Quantitative and Qualitative Disclosures About Market Risk In the normal course of business, we are exposed to fluctuations in interest rates, foreign currencies and the prices of production and packaging materials. We have established policies and procedures to govern the strategic management of these exposures through a variety of financial instruments. By policy, we do not enter into any contracts for the purpose of trading or speculation. Our objective in managing our exposure to fluctuations in interest rates, foreign currency exchange rates and production and packaging materials prices is to decrease the volatility of our earnings and cash flows affected by potential changes in underlying rates and prices. To achieve this objective, we enter into foreign currency forward contracts, commodity swaps, interest rate swaps and cross currency swaps, the values of which change in the opposite direction of the anticipated cash flows. We do not hedge the value of net investments in foreign-currency-denominated operations or translated earnings of foreign subsidiaries. Our primary foreign currency exposures are Canadian dollar (Cdn $), British pound sterling (GBP or £) and Japanese yen (Yen). Derivatives are either exchange-traded instruments, or over-the-counter agreements entered into with highly rated financial institutions. No losses on over-the-counter agreements due to counterparty credit issues are anticipated. All over-the-counter agreements are entered into with counterparties rated no lower than A (S&P) or A2 (Moody’s). In some instances our counterparties and we have reciprocal collateralization agreements regarding fair value positions in excess of certain thresholds. These agreements call for the posting of collateral in the form of cash, treasury securities or letters of credit if a fair value loss position to our counterparties or us exceeds a certain amount. At December 25, 2005, no collateral was posted by our counterparties or us.
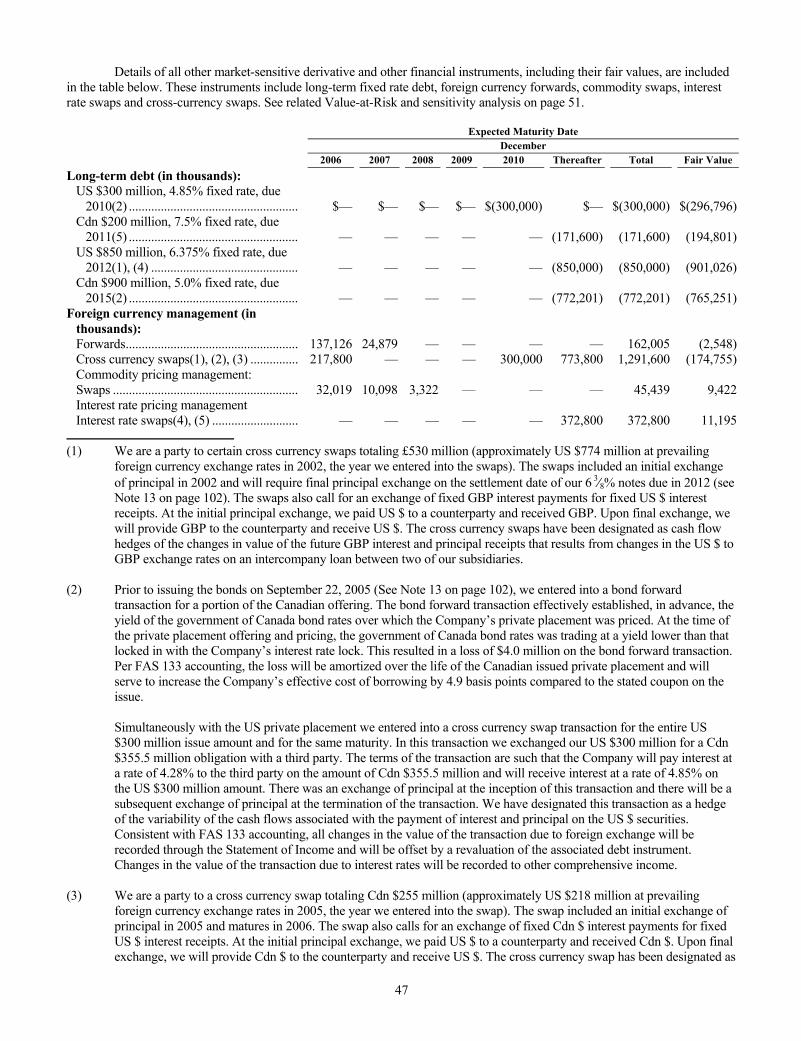
47
Details of all other market-sensitive derivative and other financial instruments, including their fair values, are included in the table below. These instruments include long-term fixed rate debt, foreign currency forwards, commodity swaps, interest rate swaps and cross-currency swaps. See related Value-at-Risk and sensitivity analysis on page 51. Expected Maturity Date December 2006 2007 2008 2009 2010 Thereafter Total Fair Value Long-term debt (in thousands):
US $300 million, 4.85% fixed rate, due 2010(2) ..................................................... $— $— $— $— $(300,000) $— $(300,000) $(296,796)
Cdn $200 million, 7.5% fixed rate, due 2011(5) ..................................................... — — — — — (171,600) (171,600) (194,801)
US $850 million, 6.375% fixed rate, due 2012(1), (4) .............................................. — — — — — (850,000) (850,000) (901,026)
Cdn $900 million, 5.0% fixed rate, due 2015(2) ..................................................... — — — — — (772,201) (772,201) (765,251)
Foreign currency management (in thousands): Forwards...................................................... 137,126 24,879 — — — — 162,005 (2,548)Cross currency swaps(1), (2), (3) ............... 217,800 — — — 300,000 773,800 1,291,600 (174,755)Commodity pricing management: Swaps .......................................................... 32,019 10,098 3,322 — — — 45,439 9,422Interest rate pricing management Interest rate swaps(4), (5) ........................... — — — — — 372,800 372,800 11,195
(1) We are a party to certain cross currency swaps totaling £530 million (approximately US $774 million at prevailing
foreign currency exchange rates in 2002, the year we entered into the swaps). The swaps included an initial exchange of principal in 2002 and will require final principal exchange on the settlement date of our 6 3⁄8% notes due in 2012 (see Note 13 on page 102). The swaps also call for an exchange of fixed GBP interest payments for fixed US $ interest receipts. At the initial principal exchange, we paid US $ to a counterparty and received GBP. Upon final exchange, we will provide GBP to the counterparty and receive US $. The cross currency swaps have been designated as cash flow hedges of the changes in value of the future GBP interest and principal receipts that results from changes in the US $ to GBP exchange rates on an intercompany loan between two of our subsidiaries.
(2) Prior to issuing the bonds on September 22, 2005 (See Note 13 on page 102), we entered into a bond forward
transaction for a portion of the Canadian offering. The bond forward transaction effectively established, in advance, the yield of the government of Canada bond rates over which the Company’s private placement was priced. At the time of the private placement offering and pricing, the government of Canada bond rates was trading at a yield lower than that locked in with the Company’s interest rate lock. This resulted in a loss of $4.0 million on the bond forward transaction. Per FAS 133 accounting, the loss will be amortized over the life of the Canadian issued private placement and will serve to increase the Company’s effective cost of borrowing by 4.9 basis points compared to the stated coupon on the issue.
Simultaneously with the US private placement we entered into a cross currency swap transaction for the entire US $300 million issue amount and for the same maturity. In this transaction we exchanged our US $300 million for a Cdn $355.5 million obligation with a third party. The terms of the transaction are such that the Company will pay interest at a rate of 4.28% to the third party on the amount of Cdn $355.5 million and will receive interest at a rate of 4.85% on the US $300 million amount. There was an exchange of principal at the inception of this transaction and there will be a subsequent exchange of principal at the termination of the transaction. We have designated this transaction as a hedge of the variability of the cash flows associated with the payment of interest and principal on the US $ securities. Consistent with FAS 133 accounting, all changes in the value of the transaction due to foreign exchange will be recorded through the Statement of Income and will be offset by a revaluation of the associated debt instrument. Changes in the value of the transaction due to interest rates will be recorded to other comprehensive income.
(3) We are a party to a cross currency swap totaling Cdn $255 million (approximately US $218 million at prevailing
foreign currency exchange rates in 2005, the year we entered into the swap). The swap included an initial exchange of principal in 2005 and matures in 2006. The swap also calls for an exchange of fixed Cdn $ interest payments for fixed US $ interest receipts. At the initial principal exchange, we paid US $ to a counterparty and received Cdn $. Upon final exchange, we will provide Cdn $ to the counterparty and receive US $. The cross currency swap has been designated as
48
a cash flow hedge of the changes in value of the future Cdn $ interest and principal receipts that results from changes in the US $ to Cdn $ exchange rates on an intercompany loan between two of our subsidiaries. See accounting method discussion in Note 18 on page 115 to the accompanying financial statements.
(4) We are a party to interest rate swap agreements related to our 6 3⁄8% fixed rate debt. The interest rate swaps convert
$201.2 million notional amount from fixed rates to floating rates and mature in 2012. We will receive fixed US $ interest payments semi-annually at a rate of 6 3⁄8% per annum and pay a rate to our counterparty based on a credit spread plus the three-month LIBOR rate, thereby exchanging a fixed interest obligation for a floating rate obligation. There was no exchange of principal at the inception of the swaps. We designated the interest rate swaps as fair value hedges of the changes in the fair value of $201.2 million fixed-rate debt attributable to changes in the LIBOR swap rates. See accounting method discussion in Note 18 on page 115 to the accompanying financial statements.
(5) The BRI joint venture is a party to interest rate swaps, converting Cdn $200 million notional amount from fixed rates to
floating rates and mature in 2011. There was no exchange of principal at the inception of the swaps. These interest rate swaps do not qualify for hedge accounting treatment. See accounting method discussion in Note 18 on page 115 to the accompanying financial statements.
49
ITEM 8. Financial Statements and Supplementary Data Index to Financial Statements Page(s)Consolidated Financial Statements:
Management’s Report to Stockholders ................................................................................................................................ 50 Report of Independent Registered Public Accounting Firm................................................................................................ 50 Consolidated Statements of Income and Comprehensive Income for each of the three years in the period ended
December 25, 2005............................................................................................................................................................ 53 Consolidated Balance Sheets at December 25, 2005, and December 26, 2004.................................................................. 54 Consolidated Statements of Cash Flows for each of the three years in the period ended December 25, 2005.................. 56 Consolidated Statements of Stockholders’ Equity for each of the three years in the period ended December 25,
2005.................................................................................................................................................................................... 58 Notes to Consolidated Financial Statements........................................................................................................................ 59
50
MANAGEMENT’S REPORT TO STOCKHOLDERS The preparation, integrity and objectivity of the financial statements and all other financial information included in this annual report are the responsibility of the management of Molson Coors Brewing Company. The financial statements have been prepared in accordance with generally accepted accounting principles, applying estimates based on management’s best judgment where necessary. Management believes that all material uncertainties have been appropriately accounted for and disclosed. The established system of accounting procedures and related internal controls provide reasonable assurance that the assets are safeguarded against loss and that the policies and procedures are implemented by qualified personnel. PricewaterhouseCoopers LLP, the Company’s independent registered public accounting firm, provides an objective, independent audit of the consolidated financial statements and internal control over financial reporting. Their accompanying report is based upon an examination conducted in accordance with standards of the Public Company Accounting Oversight Board (United States), including tests of accounting procedures, records and internal controls. The Board of Directors, operating through its Audit Committee composed of independent, outside directors, monitors the Company’s accounting control systems and reviews the results of the Company’s auditing activities. The Audit Committee meets at least quarterly, either separately or jointly, with representatives of management, PricewaterhouseCoopers LLP, and internal auditors. To ensure complete independence, PricewaterhouseCoopers LLP and the Company’s internal auditors have full and free access to the Audit Committee and may meet with or without the presence of management. W. LEO KIELY, III Global Chief Executive Officer Molson Coors Brewing Company
TIMOTHY V. WOLF Vice President and Global Chief Financial Officer, Molson Coors Brewing Company
Report of Independent Registered Public Accounting Firm
To the Board of Directors and Shareholders
of Molson Coors Brewing Company: We have completed integrated audits of Molson Coors Brewing Company’s 2005 and 2004 consolidated financial statements and of its internal control over financial reporting as of December 25, 2005, and an audit of its 2003 consolidated financial statements in accordance with the standards of the Public Company Accounting Oversight Board (United States). Our opinions, based on our audits, are presented below. Consolidated financial statements and financial statement schedule In our opinion, the consolidated financial statements listed in the accompanying index present fairly, in all material respects, the financial position of Molson Coors Brewing Company and its subsidiaries (the “Company”) at December 25, 2005 and December 26, 2004, and the results of their operations and their cash flows for each of the three years in the period ended December 25, 2005 in conformity with accounting principles generally accepted in the United States of America. In addition, in our opinion, the financial statement schedule listed in the index under Item 15(a)(2) presents fairly, in all material respects, the information set forth therein when read in conjunction with the related consolidated financial statements. These financial statements and financial statement schedule are the responsibility of the Company’s management. Our responsibility is to express an opinion on these financial statements and financial statement schedule based on our audits. We conducted our audits of these statements in accordance with the standards of the Public Company Accounting Oversight Board (United States). Those standards require that we plan and perform the audit to obtain reasonable assurance about whether the financial statements are free of material misstatement. An audit of financial statements includes examining, on a test basis, evidence supporting the amounts and disclosures in the financial statements, assessing the accounting principles used and significant estimates made by management, and evaluating the overall financial statement presentation. We believe that our audits provide a reasonable basis for our opinion. As discussed in the notes to the consolidated financial statements, effective December 25, 2005, the Company adopted the provisions of Financial Accounting Standard Board Interpretation No. 47 “Accounting for Conditional Asset Retirement Obligations, an interpretation of FASB Statement No. 143.”
51
Internal control over financial reporting Also, we have audited management’s assessment, included in Management’s Report on Internal Control over Financial Reporting appearing under Item 9A, that the Company did not maintain effective internal control over financial reporting as of December 25, 2005 because the Company did not maintain effective controls over the completeness and accuracy of the income tax provision and related balance sheet accounts, based on criteria established in Internal Control—Integrated Framework issued by the Committee of Sponsoring Organizations of the Treadway Commission (COSO). The Company’s management is responsible for maintaining effective internal control over financial reporting and for its assessment of the effectiveness of internal control over financial reporting. Our responsibility is to express opinions on management’s assessment and on the effectiveness of the Company’s internal control over financial reporting based on our audit. We conducted our audit of internal control over financial reporting in accordance with the standards of the Public Company Accounting Oversight Board (United States). Those standards require that we plan and perform the audit to obtain reasonable assurance about whether effective internal control over financial reporting was maintained in all material respects. An audit of internal control over financial reporting includes obtaining an understanding of internal control over financial reporting, evaluating management’s assessment, testing and evaluating the design and operating effectiveness of internal control, and performing such other procedures as we consider necessary in the circumstances. We believe that our audit provides a reasonable basis for our opinions. A company’s internal control over financial reporting is a process designed to provide reasonable assurance regarding the reliability of financial reporting and the preparation of financial statements for external purposes in accordance with generally accepted accounting principles. A company’s internal control over financial reporting includes those policies and procedures that (i) pertain to the maintenance of records that, in reasonable detail, accurately and fairly reflect the transactions and dispositions of the assets of the company; (ii) provide reasonable assurance that transactions are recorded as necessary to permit preparation of financial statements in accordance with generally accepted accounting principles, and that receipts and expenditures of the company are being made only in accordance with authorizations of management and directors of the company; and (iii) provide reasonable assurance regarding prevention or timely detection of unauthorized acquisition, use, or disposition of the company’s assets that could have a material effect on the financial statements. Because of its inherent limitations, internal control over financial reporting may not prevent or detect misstatements. Also, projections of any evaluation of effectiveness to future periods are subject to the risk that controls may become inadequate because of changes in conditions, or that the degree of compliance with the policies or procedures may deteriorate. A material weakness is a control deficiency, or combination of control deficiencies, that results in more than a remote likelihood that a material misstatement of the annual or interim financial statements will not be prevented or detected. The following material weakness has been identified and included in management’s assessment. As of December 25, 2005, the Company did not maintain effective controls over the completeness and accuracy of the income tax provision and related balance sheet accounts. Specifically, the Company’s controls over the processes and procedures related to the determination and review of the quarterly and annual tax provisions were not adequate to ensure that the income tax provision was prepared in accordance with generally accepted accounting principles. This control deficiency resulted in the restatement of the first quarter of 2005 as well as audit adjustments to the annual 2005 consolidated financial statements. Additionally, this control deficiency could result in a misstatement of the income tax provision and related balance sheet accounts that would result in a material misstatement to the annual or interim consolidated financial statements that would not be prevented or detected. Accordingly, the Company determined that this control deficiency constitutes a material weakness. This material weakness was considered in determining the nature, timing, and extent of audit tests applied in our audit of the 2005 consolidated financial statements, and our opinion regarding the effectiveness of the Company’s internal control over financial reporting does not affect our opinion on those consolidated financial statements. As described in Management’s Report on Internal Control over Financial Reporting, management has excluded its Molson Canada and Kaiser Brazil business units from its assessment of internal control over financial reporting as of December 25, 2005 because these business units were acquired by the Company in a purchase business combination during 2005. We have also excluded the Molson Canada and Kaiser Brazil business units from our audit of internal control over financial reporting. Molson Canada is a wholly-owned subsidiary whose total assets and total revenues represent 50% and 28%, respectively, of the related consolidated financial statement amounts as of and for the year ended December 25, 2005. The Kaiser Brazil business unit is presented as a discontinued operation in the accompanying financial statements due to the sale of the business unit in January 2006 and whose total assets represent five percent of the consolidated financial statement amount as of December 25, 2005.

52
In our opinion, management’s assessment that Molson Coors Brewing Company did not maintain effective internal control over financial reporting as of December 25, 2005, is fairly stated, in all material respects, based on criteria established in Internal Control—Integrated Framework issued by the COSO. Also, in our opinion, because of the effect of the material weakness described above on the achievement of the objectives of the control criteria, Molson Coors Brewing Company has not maintained effective internal control over financial reporting as of December 25, 2005, based on criteria established in Internal Control—Integrated Framework issued by the COSO. PricewaterhouseCoopers LLP Denver, Colorado March 10, 2006

53
MOLSON COORS BREWING COMPANY AND SUBSIDIARIES CONSOLIDATED STATEMENTS OF INCOME
AND COMPREHENSIVE INCOME (IN THOUSANDS, EXCEPT SHARE DATA)
For the Years Ended
December 25,
2005 December 26,
2004 December 28,
2003 Sales ................................................................................................................................. $7,417,702 $5,819,727 $5,387,220Excise taxes...................................................................................................................... (1,910,796) (1,513,911) (1,387,107)Net sales ........................................................................................................................... 5,506,906 4,305,816 4,000,113Cost of goods sold............................................................................................................ (3,306,949) (2,741,694) (2,586,783)Gross profit ...................................................................................................................... 2,199,957 1,564,122 1,413,330Other operating expenses:
Marketing, general and administrative......................................................................... (1,632,516) (1,223,219) (1,105,959)Special items, net (Note 8)............................................................................................ (145,392) 7,522 —
Total other operating expenses .................................................................................. (1,777,908) (1,215,697) (1,105,959)Operating income............................................................................................................. 422,049 348,425 307,371Other (expense) income:
Interest income.............................................................................................................. 17,503 19,252 19,245Interest expense............................................................................................................. (131,106) (72,441) (81,195)Other (expense) income, net (Note 5) .......................................................................... (13,245) 12,946 8,397
Total other expense.................................................................................................... (126,848) (40,243) (53,553)Income from continuing operations before income taxes and minority interests .......... 295,201 308,182 253,818Income tax expense.......................................................................................................... (50,264) (95,228) (79,161)Minority interests ............................................................................................................. (14,491) (16,218) —Income from continuing operations................................................................................. 230,446 196,736 174,657Loss from discontinued operations, net of tax (Note 3).................................................. (91,826) — —Income before cumulative effect of change in accounting principle (Note 1) ............... 138,620 196,736 174,657Cumulative effect of change in accounting principle, net of tax .................................... (3,676) — —Net income ....................................................................................................................... $134,944 $196,736 $174,657Other comprehensive income, net of tax:
Foreign currency translation adjustments..................................................................... 122,971 123,011 147,803Unrealized (loss) gain on derivative instruments......................................................... (19,276) (217) 282Minimum pension liability adjustment......................................................................... (6,203) (24,048) (15,031)Reclassification adjustments......................................................................................... (8,404) (4,686) 4,235
Comprehensive income ................................................................................................... $224,032 $290,796 $311,946Basic income (loss) per share:
From continuing operations.......................................................................................... 2.90 5.29 4.81From discontinued operations ...................................................................................... (1.16) — —Cumulative effect of change in accounting principle .................................................. (0.04) — —
Basic net income per share .............................................................................................. $1.70 $5.29 $4.81Diluted income (loss) per share:
From continuing operations.......................................................................................... 2.88 5.19 4.77From discontinued operations ...................................................................................... (1.15) — —Cumulative effect of change in accounting principle .................................................. (0.04) — —
Diluted net income per share ........................................................................................... $1.69 $5.19 $4.77
Weighted average shares—basic..................................................................................... 79,403 37,159 36,338
Weighted average shares—diluted.................................................................................. 80,036 37,909 36,596
See notes to consolidated financial statements.
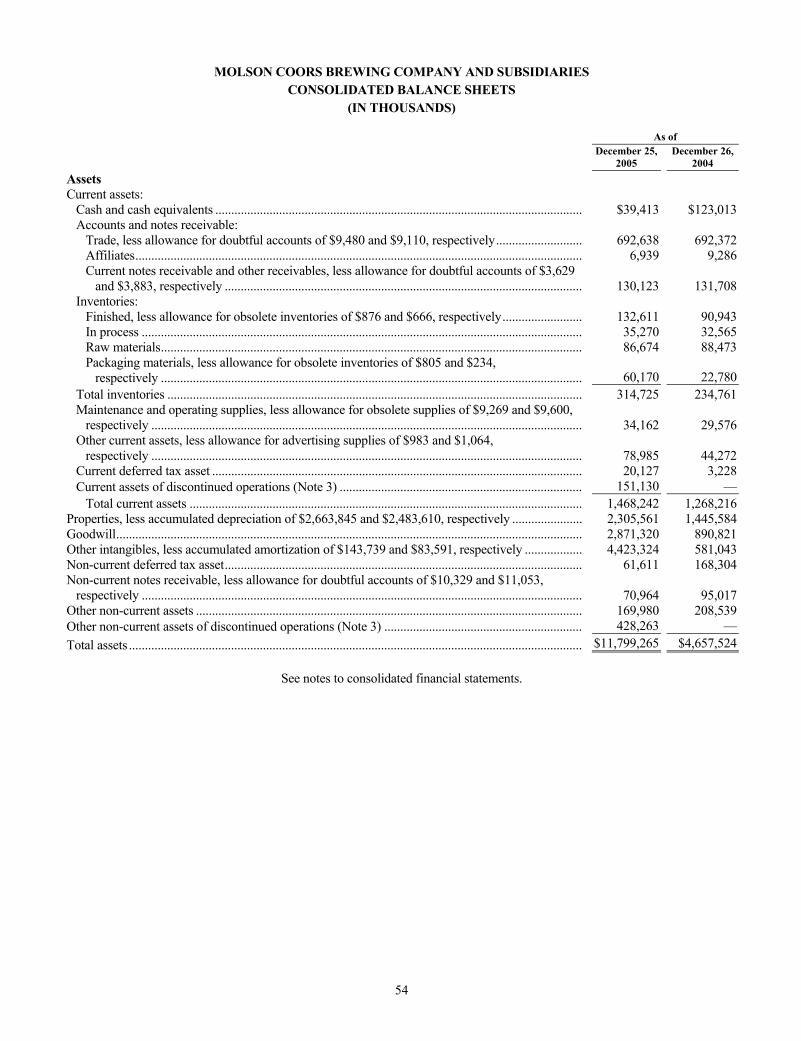
54
MOLSON COORS BREWING COMPANY AND SUBSIDIARIES CONSOLIDATED BALANCE SHEETS
(IN THOUSANDS) As of
December 25,
2005 December 26,
2004 Assets Current assets:
Cash and cash equivalents ................................................................................................................... $39,413 $123,013Accounts and notes receivable:
Trade, less allowance for doubtful accounts of $9,480 and $9,110, respectively........................... 692,638 692,372Affiliates............................................................................................................................................ 6,939 9,286Current notes receivable and other receivables, less allowance for doubtful accounts of $3,629
and $3,883, respectively ................................................................................................................ 130,123 131,708Inventories:
Finished, less allowance for obsolete inventories of $876 and $666, respectively......................... 132,611 90,943In process .......................................................................................................................................... 35,270 32,565Raw materials.................................................................................................................................... 86,674 88,473Packaging materials, less allowance for obsolete inventories of $805 and $234,
respectively .................................................................................................................................... 60,170 22,780Total inventories .................................................................................................................................. 314,725 234,761Maintenance and operating supplies, less allowance for obsolete supplies of $9,269 and $9,600,
respectively ....................................................................................................................................... 34,162 29,576Other current assets, less allowance for advertising supplies of $983 and $1,064,
respectively ....................................................................................................................................... 78,985 44,272Current deferred tax asset .................................................................................................................... 20,127 3,228Current assets of discontinued operations (Note 3) ............................................................................ 151,130 —
Total current assets ........................................................................................................................... 1,468,242 1,268,216Properties, less accumulated depreciation of $2,663,845 and $2,483,610, respectively ...................... 2,305,561 1,445,584Goodwill.................................................................................................................................................. 2,871,320 890,821Other intangibles, less accumulated amortization of $143,739 and $83,591, respectively .................. 4,423,324 581,043Non-current deferred tax asset................................................................................................................ 61,611 168,304Non-current notes receivable, less allowance for doubtful accounts of $10,329 and $11,053,
respectively .......................................................................................................................................... 70,964 95,017Other non-current assets ......................................................................................................................... 169,980 208,539Other non-current assets of discontinued operations (Note 3) .............................................................. 428,263 —Total assets .............................................................................................................................................. $11,799,265 $4,657,524
See notes to consolidated financial statements.
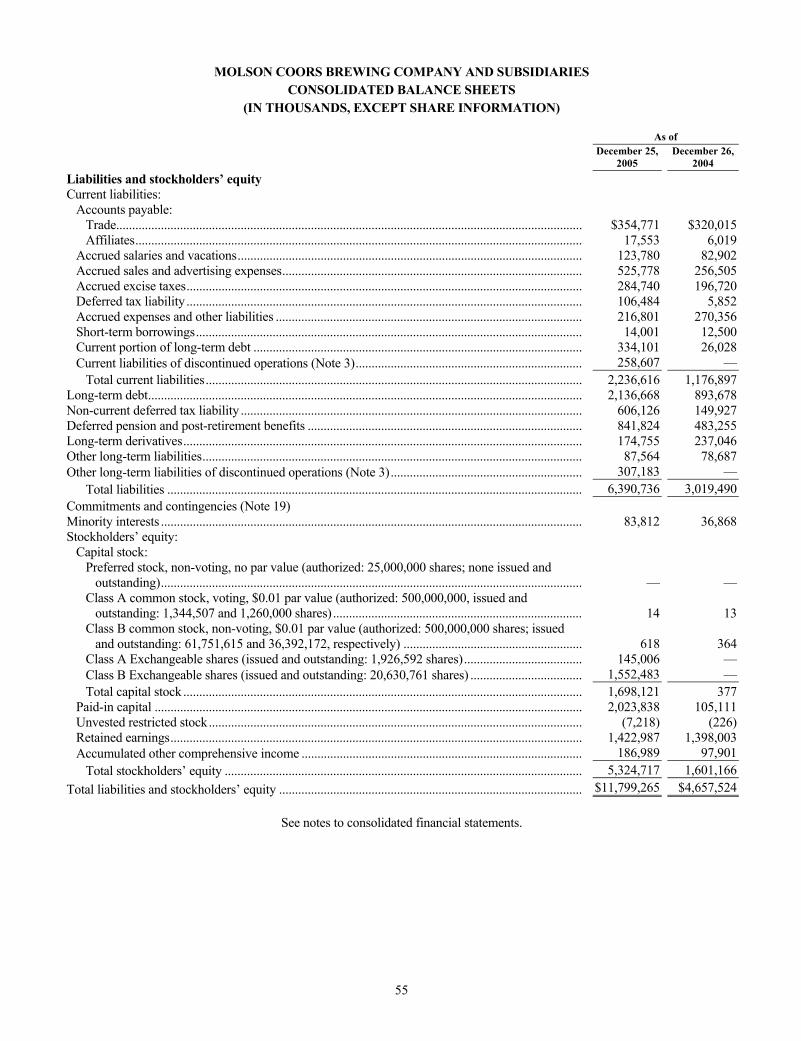
55
MOLSON COORS BREWING COMPANY AND SUBSIDIARIES CONSOLIDATED BALANCE SHEETS
(IN THOUSANDS, EXCEPT SHARE INFORMATION) As of
December 25,
2005 December 26,
2004 Liabilities and stockholders’ equity Current liabilities:
Accounts payable: Trade.................................................................................................................................................. $354,771 $320,015Affiliates............................................................................................................................................ 17,553 6,019
Accrued salaries and vacations............................................................................................................ 123,780 82,902Accrued sales and advertising expenses.............................................................................................. 525,778 256,505Accrued excise taxes............................................................................................................................ 284,740 196,720Deferred tax liability ............................................................................................................................ 106,484 5,852Accrued expenses and other liabilities ................................................................................................ 216,801 270,356Short-term borrowings......................................................................................................................... 14,001 12,500Current portion of long-term debt ....................................................................................................... 334,101 26,028Current liabilities of discontinued operations (Note 3)....................................................................... 258,607 —
Total current liabilities...................................................................................................................... 2,236,616 1,176,897Long-term debt........................................................................................................................................ 2,136,668 893,678Non-current deferred tax liability ........................................................................................................... 606,126 149,927Deferred pension and post-retirement benefits ...................................................................................... 841,824 483,255Long-term derivatives............................................................................................................................. 174,755 237,046Other long-term liabilities....................................................................................................................... 87,564 78,687Other long-term liabilities of discontinued operations (Note 3)............................................................ 307,183 —
Total liabilities .................................................................................................................................. 6,390,736 3,019,490Commitments and contingencies (Note 19) Minority interests .................................................................................................................................... 83,812 36,868Stockholders’ equity:
Capital stock: Preferred stock, non-voting, no par value (authorized: 25,000,000 shares; none issued and
outstanding).................................................................................................................................... — —Class A common stock, voting, $0.01 par value (authorized: 500,000,000, issued and
outstanding: 1,344,507 and 1,260,000 shares).............................................................................. 14 13Class B common stock, non-voting, $0.01 par value (authorized: 500,000,000 shares; issued
and outstanding: 61,751,615 and 36,392,172, respectively) ........................................................ 618 364Class A Exchangeable shares (issued and outstanding: 1,926,592 shares)..................................... 145,006 —Class B Exchangeable shares (issued and outstanding: 20,630,761 shares) ................................... 1,552,483 —Total capital stock ............................................................................................................................. 1,698,121 377
Paid-in capital ...................................................................................................................................... 2,023,838 105,111Unvested restricted stock..................................................................................................................... (7,218) (226)Retained earnings................................................................................................................................. 1,422,987 1,398,003Accumulated other comprehensive income ........................................................................................ 186,989 97,901
Total stockholders’ equity ................................................................................................................ 5,324,717 1,601,166Total liabilities and stockholders’ equity ............................................................................................... $11,799,265 $4,657,524
See notes to consolidated financial statements.
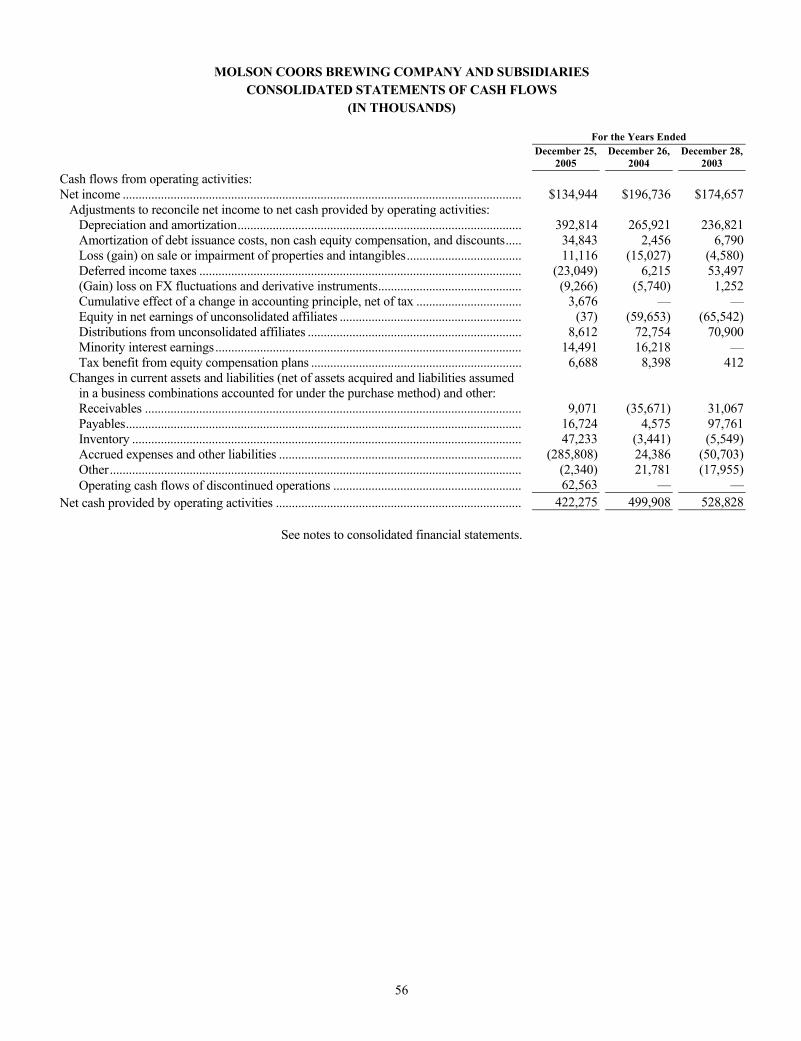
56
MOLSON COORS BREWING COMPANY AND SUBSIDIARIES CONSOLIDATED STATEMENTS OF CASH FLOWS
(IN THOUSANDS)
For the Years Ended
December 25,
2005 December 26,
2004 December 28,
2003 Cash flows from operating activities: Net income ............................................................................................................................. $134,944 $196,736 $174,657
Adjustments to reconcile net income to net cash provided by operating activities: Depreciation and amortization......................................................................................... 392,814 265,921 236,821Amortization of debt issuance costs, non cash equity compensation, and discounts..... 34,843 2,456 6,790Loss (gain) on sale or impairment of properties and intangibles.................................... 11,116 (15,027) (4,580)Deferred income taxes ..................................................................................................... (23,049) 6,215 53,497(Gain) loss on FX fluctuations and derivative instruments............................................. (9,266) (5,740) 1,252Cumulative effect of a change in accounting principle, net of tax ................................. 3,676 — —Equity in net earnings of unconsolidated affiliates ......................................................... (37) (59,653) (65,542)Distributions from unconsolidated affiliates ................................................................... 8,612 72,754 70,900Minority interest earnings................................................................................................ 14,491 16,218 —Tax benefit from equity compensation plans .................................................................. 6,688 8,398 412
Changes in current assets and liabilities (net of assets acquired and liabilities assumed in a business combinations accounted for under the purchase method) and other: Receivables ...................................................................................................................... 9,071 (35,671) 31,067Payables............................................................................................................................ 16,724 4,575 97,761Inventory .......................................................................................................................... 47,233 (3,441) (5,549)Accrued expenses and other liabilities ............................................................................ (285,808) 24,386 (50,703)Other................................................................................................................................. (2,340) 21,781 (17,955)Operating cash flows of discontinued operations ........................................................... 62,563 — —
Net cash provided by operating activities ............................................................................. 422,275 499,908 528,828
See notes to consolidated financial statements.
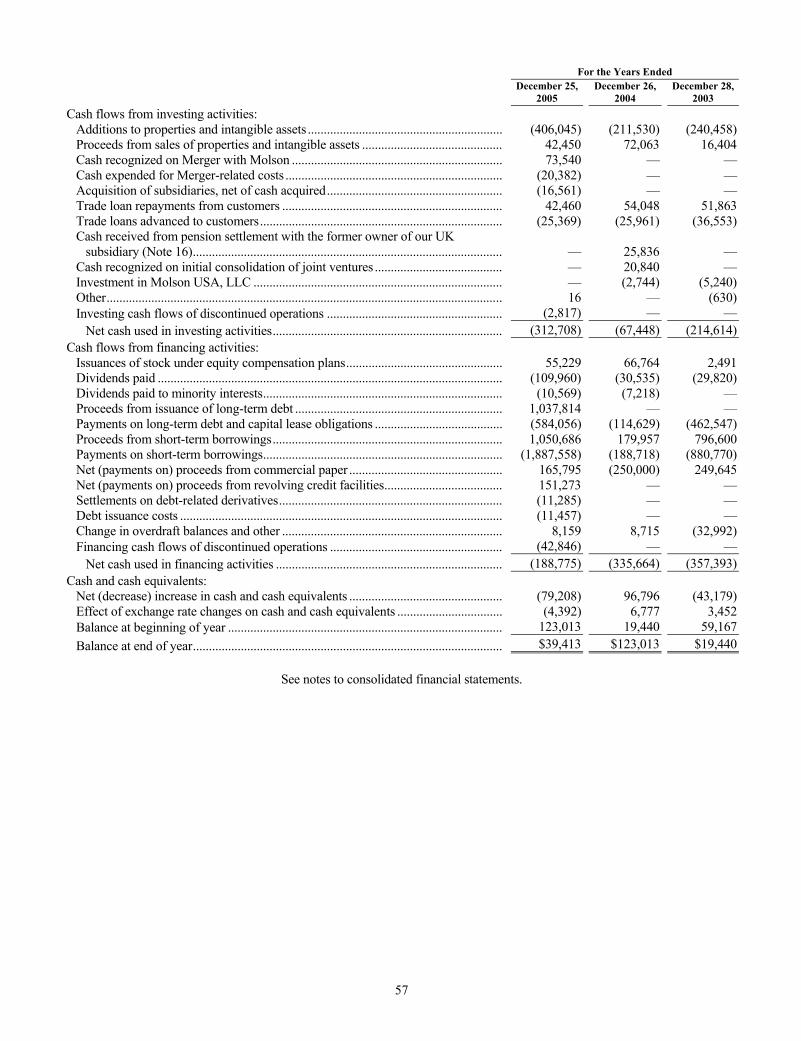
57
For the Years Ended
December 25,
2005 December 26,
2004 December 28,
2003 Cash flows from investing activities:
Additions to properties and intangible assets ............................................................. (406,045) (211,530) (240,458)Proceeds from sales of properties and intangible assets ............................................ 42,450 72,063 16,404Cash recognized on Merger with Molson .................................................................. 73,540 — —Cash expended for Merger-related costs .................................................................... (20,382) — —Acquisition of subsidiaries, net of cash acquired....................................................... (16,561) — —Trade loan repayments from customers ..................................................................... 42,460 54,048 51,863Trade loans advanced to customers............................................................................ (25,369) (25,961) (36,553)Cash received from pension settlement with the former owner of our UK
subsidiary (Note 16)................................................................................................. — 25,836 —Cash recognized on initial consolidation of joint ventures ........................................ — 20,840 —Investment in Molson USA, LLC .............................................................................. — (2,744) (5,240)Other............................................................................................................................ 16 — (630)Investing cash flows of discontinued operations ....................................................... (2,817) — —
Net cash used in investing activities........................................................................ (312,708) (67,448) (214,614)Cash flows from financing activities:
Issuances of stock under equity compensation plans................................................. 55,229 66,764 2,491Dividends paid ............................................................................................................ (109,960) (30,535) (29,820)Dividends paid to minority interests........................................................................... (10,569) (7,218) —Proceeds from issuance of long-term debt ................................................................. 1,037,814 — —Payments on long-term debt and capital lease obligations ........................................ (584,056) (114,629) (462,547)Proceeds from short-term borrowings........................................................................ 1,050,686 179,957 796,600Payments on short-term borrowings........................................................................... (1,887,558) (188,718) (880,770)Net (payments on) proceeds from commercial paper ................................................ 165,795 (250,000) 249,645Net (payments on) proceeds from revolving credit facilities..................................... 151,273 — —Settlements on debt-related derivatives...................................................................... (11,285) — —Debt issuance costs ..................................................................................................... (11,457) — —Change in overdraft balances and other ..................................................................... 8,159 8,715 (32,992)Financing cash flows of discontinued operations ...................................................... (42,846) — —
Net cash used in financing activities ....................................................................... (188,775) (335,664) (357,393)Cash and cash equivalents:
Net (decrease) increase in cash and cash equivalents ................................................ (79,208) 96,796 (43,179)Effect of exchange rate changes on cash and cash equivalents ................................. (4,392) 6,777 3,452Balance at beginning of year ...................................................................................... 123,013 19,440 59,167Balance at end of year................................................................................................. $39,413 $123,013 $19,440
See notes to consolidated financial statements.
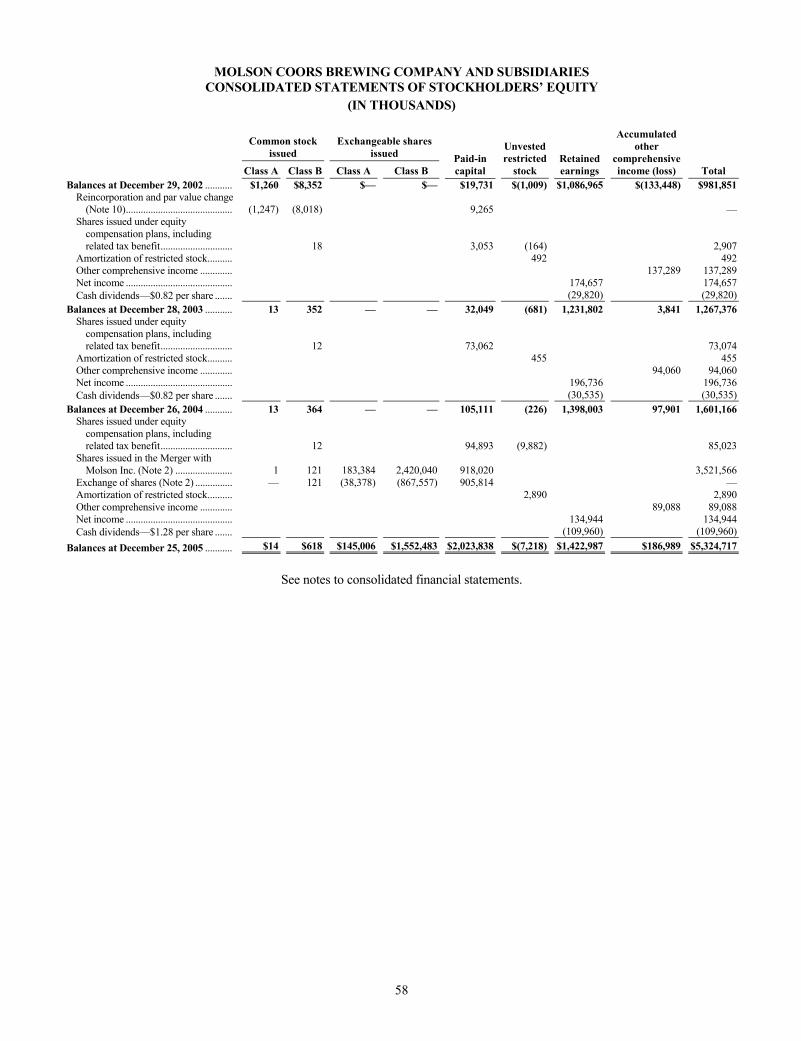
58
MOLSON COORS BREWING COMPANY AND SUBSIDIARIES CONSOLIDATED STATEMENTS OF STOCKHOLDERS’ EQUITY
(IN THOUSANDS)
Common stock issued
Exchangeable shares issued
Class A Class B Class A Class B Paid-in capital
Unvestedrestricted
stock Retained earnings
Accumulatedother
comprehensiveincome (loss) Total
Balances at December 29, 2002 ........... $1,260 $8,352 $— $— $19,731 $(1,009) $1,086,965 $(133,448) $981,851Reincorporation and par value change
(Note 10)........................................... (1,247) (8,018) 9,265 —Shares issued under equity
compensation plans, including related tax benefit............................. 18 3,053 (164) 2,907
Amortization of restricted stock.......... 492 492Other comprehensive income ............. 137,289 137,289Net income ........................................... 174,657 174,657Cash dividends—$0.82 per share ....... (29,820) (29,820)
Balances at December 28, 2003 ........... 13 352 — — 32,049 (681) 1,231,802 3,841 1,267,376Shares issued under equity
compensation plans, including related tax benefit............................. 12 73,062 73,074
Amortization of restricted stock.......... 455 455Other comprehensive income ............. 94,060 94,060Net income ........................................... 196,736 196,736Cash dividends—$0.82 per share ....... (30,535) (30,535)
Balances at December 26, 2004 ........... 13 364 — — 105,111 (226) 1,398,003 97,901 1,601,166Shares issued under equity
compensation plans, including related tax benefit............................. 12 94,893 (9,882) 85,023
Shares issued in the Merger with Molson Inc. (Note 2) ....................... 1 121 183,384 2,420,040 918,020 3,521,566
Exchange of shares (Note 2) ............... — 121 (38,378) (867,557) 905,814 —Amortization of restricted stock.......... 2,890 2,890Other comprehensive income ............. 89,088 89,088Net income ........................................... 134,944 134,944Cash dividends—$1.28 per share ....... (109,960) (109,960)
Balances at December 25, 2005 ........... $14 $618 $145,006 $1,552,483 $2,023,838 $(7,218) $1,422,987 $186,989 $5,324,717
See notes to consolidated financial statements.
59
MOLSON COORS BREWING COMPANY AND SUBSIDIARIES NOTES TO CONSOLIDATED FINANCIAL STATEMENTS
1. Basis of Presentation and Summary of Significant Accounting Policies On February 9, 2005, Adolph Coors Company merged with Molson Inc. (the Merger). In connection with the Merger, Adolph Coors Company became the parent of the merged Company and changed its name to Molson Coors Brewing Company. Unless otherwise noted in this report, any description of us includes Molson Coors Brewing Company (MCBC or the “Company”), principally a holding company, and its operating subsidiaries: Coors Brewing Company (CBC), operating in the United States (US); Coors Brewers Limited (CBL), operating in the United Kingdom (UK); Molson Inc. (Molson), operating in Canada; Cervejarias Kaiser Brasil S.A. (Kaiser), presented as a discontinued operation; and our other corporate entities. Any reference to “Coors” means the Adolph Coors Company prior to the Merger. Any reference to Molson Inc. means Molson prior to the Merger. Any reference to “Molson Coors” means MCBC after the Merger. Unless otherwise indicated, information in this report is presented in US dollars (US $). Our Fiscal Year Our fiscal year is a 52- or 53-week period ending on the last Sunday in December. Fiscal years ended December 25, 2005, December 26, 2004, and December 28, 2003, were all 52-week periods. Principles of Consolidation Our consolidated financial statements include our accounts and our majority-owned and controlled domestic and foreign subsidiaries, as well as entities consolidated under FIN 46R. All significant intercompany accounts and transactions have been eliminated. Reporting Periods Presented The accompanying consolidated financial statements do not include the results of Molson and Kaiser prior to the Merger on February 9, 2005. Further, the results of Kaiser and our joint venture, Brewers Retail Inc. (BRI), consolidated under FIN 46R, are reported one month in arrears since the date of the Merger for this and future reporting periods, which means for the year ended December 25, 2005, Kaiser’s and BRI’s results include the results for the months of February through November 2005. Use of Estimates Our consolidated financial statements are prepared in accordance with accounting principles generally accepted in the United States (US GAAP). These accounting principles require us to make certain estimates, judgments and assumptions. We believe that the estimates, judgments and assumptions are reasonable, based on information available at the time they are made. To the extent there are material differences between these estimates and actual results, our consolidated financial statements may be affected. Reclassifications Certain reclassifications have been made to the 2004 and 2003 financial statements to conform to the 2005 presentation. Revenue Recognition Depending upon the method of distribution, revenue is recognized when the significant risks and rewards of ownership are transferred to the customer or distributor, which is either at the time of shipment to distributors or upon delivery of product to retail customers. In the United States, customers are principally independent distributors or wholesalers. Revenue is recognized when product is shipped and the risk of loss transfers to the distributors or wholesalers. In Canada, revenue is recognized when the significant risks and rewards of ownership are transferred to the customer or distributor, which is either at the time of shipment to distributors or upon delivery of product to retail customers.
60
Revenue is recognized in the Europe segment when product is received by our customers, who are principally independent retailers in the United Kingdom. In the United Kingdom, excise taxes are included in the purchase price we pay the vendor on beverages for the factored brands business purchased from third parties for resale and are included in our cost of goods sold when ultimately sold. In all segments, the cost of various programs, such as price promotions, rebates and coupon programs are treated as a reduction of sales. Sales of products are for cash or otherwise agreed upon credit terms. Revenue is stated net of incentives, discounts and returns. Revenue is recognized when the significant risks and rewards of ownership are transferred to the customer or distributor, which is either at the time of shipment to distributors or upon delivery of product to retail customers. Outside of unusual circumstances, if product is returned, it is generally for failure to meet our quality standards, not caused by customer actions. Products that do not meet our high quality standards are returned and destroyed. We do not have standard terms that permit return of product. We estimate the costs for product returns and record those costs in cost of goods sold in the consolidated income statements each period. We reduce revenue at the value of the original sales price in the period that the product is returned. Cost of Goods Sold Our cost of goods sold includes beer raw materials, packaging materials (including promotional packaging), manufacturing costs, plant administrative support and overheads, and freight and warehouse costs (including distribution network costs). Distribution network costs include inbound and outbound freight charges, purchasing and receiving costs, inspection costs, warehousing, and internal transfer costs. Equity Method Accounting We generally apply the equity method of accounting to 20% to 50% owned investments where we exercise significant influence, except for certain joint ventures that must be consolidated as variable interest entities under FIN 46R. These investments primarily involve equity ownership in transportation services in Europe; and an investment in the Montréal Canadiens in Canada. There are no related parties that own interests in our equity method investments as of December 25, 2005. Marketing, General and Administrative Expenses Our marketing, general and administrative expenses consist predominately of advertising, sales staff costs, and non-manufacturing administrative and overhead costs. The creative portion of our advertising activities is expensed as incurred. Production costs are generally expensed when the advertising is first run. Cooperative advertising expenses are included in marketing, general and administrative costs. Advertising expense was $729.1 million, $627.4 million, and $588.2 million for years 2005, 2004, and 2003, respectively. Prepaid advertising costs of $23.3 million ($16.7 million in current and $6.6 million in long-term) and $27.9 million ($17.7 million in current and $10.2 million in long-term) were included in other current and other non-current assets in the Consolidated Balance Sheets at December 25, 2005, and December 26, 2004, respectively. Trade Loans CBL extends loans to retail outlets that sell our brands. Some of these loans provide for no interest to be payable, and others provide for payment of a below market interest rate. In return, the retail outlets receive smaller discounts on beer and other beverage products purchased from us, with the net result being CBL attaining a market return on the outstanding loan balance. Trade loan receivables are classified as either other receivables or non-current notes receivable in our Consolidated Balance Sheets. At December 25, 2005, and December 26, 2004, total loans outstanding, net of allowances, were $95.9 million and $128.6 million, respectively. We reclassify a portion of beer revenue into interest income to reflect a market rate of interest on these loans. In 2005 and 2004 and 2003 this amount was $13.1 million and $16.0 million and $17.2 million, respectively. We have included this interest income in the Europe segment since it is related solely to the Europe business.
61
Allowance for Doubtful Accounts In the US segment, our allowance for doubtful accounts and credit risk is insignificant as the majority of the US segment accounts receivable balance is generated from sales to independent distributors with whom collection occurs through electronic funds transfer. Also, in the United States, we secure substantially all of our product sale credit risk with purchase money security interests in inventory and proceeds, personal guarantees and other letters of credit. Because the majority of CBL sales are directly to retail customers and, because of the industry practice of making trade loans to customers, our ability to manage credit risk in this business is critical. At CBL, we provide allowances for trade receivables and trade loans associated with the ability to collect outstanding receivables from our customers. Generally, provisions are recorded to cover the full exposure to a specific customer at the point the account is considered uncollectible. Accounts are typically deemed uncollectible based on the sales channel, either ninety days or one hundred eighty days. At this time, we record the provision as a bad debt in marketing, general and administrative expenses. Provisions are reversed upon recoverability of the account or relieved at the point an account is written off. Canada’s distribution channels are highly regulated by provincial regulation and experiences few collectibility problems. However, Canada does have direct sales to retail customers for which an allowance is recorded based upon aging analysis and historical experience. We are not able to predict changes in financial condition of our customers and, if circumstances related to our customers deteriorate, our estimates of the recoverability of our trade receivables and trade loans could be materially affected. Inventories Inventories are stated at the lower of cost or market. Cost is determined by the last-in, first-out (LIFO) method for substantially all inventories in the United States and on the first-in, first-out (FIFO) method in the United Kingdom and Canada. Current cost in the United States, determined on the FIFO method, exceeded LIFO cost by $44.1 million and $40.1 million at December 25, 2005, and December 26, 2004, respectively. We regularly assess the shelf-life of our inventories and reserve for those inventories when it becomes apparent the product will not be sold within our freshness specifications. Fair Value of Financial Instruments The carrying amounts of our cash and cash equivalents, accounts receivable, accounts payable and accrued liabilities, approximate fair value as recorded due to the short-term maturity of these instruments. The fair value of long-term obligations for derivatives was estimated by discounting the future cash flows using market interest rates and does not differ significantly from the amounts reflected in the consolidated financial statements. Assuming current market rates for similar instruments, the fair value of long-term debt exceeds the carrying value by approximately $53.6 million at December 25, 2005. Foreign Currency Translation Assets and liabilities recorded in foreign currencies that are the functional currencies for the respective operations are translated at the prevailing exchange rate at the balance sheet date. Revenue and expenses are translated at the average exchange rates during the period. Translation adjustments resulting from this process are reported as a separate component of other comprehensive income. Stock-Based Compensation The company accounts for employee stock options in accordance with FAS 123, “Accounting for Stock-Based Compensation.” Under FAS 123, the company elects to recognize no compensation expense related to employee stock options, since options are always granted with an exercise price equal to the market price of the company’s stock on the day of grant. See Note 14 for information regarding the company’s stock option plans, options outstanding, and options exercisable.
62
The following table illustrates the effect on net income and earnings per share if we had applied the fair value provisions of Statement of Financial Accounting Standards No. 123, “Accounting for Stock-based Compensation” (SFAS No. 123) to stock-based compensation using the Black-Scholes valuation model: Fiscal Year Ended
December 25,
2005 December 26,
2004 December 28,
2003 (In thousands, except per share data) Net income, as reported ................................................................................................ $134,944 $196,736 $174,657Total stock-based compensation expense, net of related tax benefits, included in the
determination of net income, as reported .................................................................. 14,978 5,573 338Total stock-based compensation expense determined under fair value based
methods for all awards, net of related tax effects...................................................... (65,327) (21,799) (21,116)Pro forma net income.................................................................................................... $84,595 $180,510 $153,879Net income per share:
Basic—as reported..................................................................................................... $1.70 $5.29 $4.81Basic—pro forma....................................................................................................... $1.07 $4.86 $4.23Diluted—as reported.................................................................................................. $1.69 $5.19 $4.77Diluted—pro forma.................................................................................................... $1.06 $4.76 $4.20
As a result of shifts in exercise patterns, we adjusted the expected term for stock options issued in 2004 to 7.0 years for options granted to Section 16b officers and to 3.5 years for other option grantees, from 5.4 years for all option holders in 2003 and 2002. We amortize pro forma expense on a straight-line basis over the option-vesting period of three years. See Note 14 for the other assumptions used in estimating the pro forma expenses. Factored Brands In the United Kingdom, in addition to supplying our own brands, we sell other beverage companies’ products to our on-premise customers to provide them with a full range of products for their retail outlets. These factored brand sales are included in our financial results, but the related volume is not included in our reported sales volumes. We refer to this as the “factored brand business.” In the factored brand business, CBL normally purchases factored brand inventory, filing orders from customers for such brands, and invoicing customers for the product and related costs of delivery. In accordance with EITF 99-19, “Reporting Revenue Gross as a Principal Versus Net as an Agent,” sales under the factored brand are generally reported on a gross income basis. However, CBL’s relationship with a large on-premise customer changed in 2005, resulting in net reporting of sales and cost of sales as an agent for that customer in our consolidated income statement on a prospective basis from the date of change in our contract terms. The change in accounting recognition from gross to net reporting reflects a change in the substance of CBL’s status as transaction agent whereby there has been a transfer of credit risk from CBL to the owner and supplier of the factored brands effective in 2005. Statement of Cash Flows Data Cash equivalents represent highly liquid investments with original maturities of 90 days or less. The fair value of these investments approximates their carrying value. The following presents our supplemental cash flow information: For the fiscal years ended December 25, 2005 December 26, 2004 December 28, 2003 (In millions) Cash paid for interest ............................................................................ $70.7 $57.7 $78.5Cash paid for income taxes................................................................... $170.7 $51.9 $30.7Receipt of note upon sale of property................................................... $— $46.8 $—Sale lease-back of computer equipment............................................... $— $8.9 $—Issuance of restricted stock, net of forfeitures...................................... $9.9 $— $0.1Tax benefit from exercise of stock options .......................................... $6.7 $8.4 $0.4
63
Adoption of New Accounting Pronouncement FASB Interpretation No. 47 “Accounting for Conditional Asset Retirement Obligations, an interpretation of FASB Statement No. 143” In March 2005, the FASB issued FASB Interpretation No. 47—”Accounting for Conditional Asset Retirement Obligations, an interpretation of FASB Statement No. 143,” (“FIN 47”) which clarifies the term “conditional asset retirement obligation” as used in SFAS No. 143, “Accounting for Asset Retirement Obligations.” (“SFAS No. 143”) Specifically, FIN 47 provides that an asset retirement obligation is conditional when either the timing and (or) method of settling the obligation is conditioned on a future event. Accordingly, an entity is required to recognize a liability for the fair value of a conditional asset retirement obligation if the fair market value of the liability can be reasonably estimated. Uncertainty about the timing and (or) method of settlement of a conditional asset retirement obligation should be factored into the measurement of the liability when sufficient information exists. We adopted FIN 47 on December 25, 2005, which resulted in an increase to properties of $0.5 million, goodwill of $2.2 million and liabilities of $9.6 million related to asset retirement obligations. For asset retirement obligations related to the properties acquired in the acquisition of Molson Inc. as of February 9, 2005, such obligations increased the goodwill amounts recognized upon the acquisition by $2.2 million as such properties were recorded at the appraised fair market value at the acquisition date. These asset retirement obligations relate primarily to clean-up, removal, or replacement activities and related costs for asbestos, coolants, waste water, oils and other contaminants contained within our manufacturing properties. The adoption of FIN 47 was reflected in our financial statements as the cumulative effect of the change in accounting principle with the catch-up adjustment of $3.7 million, net of tax benefit of $2.2 million, in the 2005 statement of income. This adjustment represents a depreciation charge and an accretion of liability from the time the obligation originated, which is either from the time of the acquisition or the construction of related long-lived assets, through December 25, 2005. Inherent in the fair value calculation of asset retirement obligations are numerous assumptions and judgments including the ultimate settlement amounts, inflation factors, credit adjusted discount rates, timing of settlement, and changes in the legal, regulatory, environmental and political environments. To the extent future revisions to these assumptions impact the fair value of the existing asset retirement obligation liability, a corresponding adjustment will be made to the asset balance. If the obligation is settled for other than the carrying amount of the liability, we will recognize a gain or loss upon the settlement. The net value of the asset retirement obligation liabilities calculated on a pro-forma basis as if the standard had been retrospectively applied to all periods presented are as follows:
December 25, 2005 December 26, 2004 December 28, 2003 $9,628,580 $5,926,852 $5,487,826
New Accounting Pronouncements SFAS 123R, “Share-Based Payment” Statement of Financial Accounting Standard No. 123R (SFAS No. 123R) was issued in December 2004 and will be effective for us in the first quarter of 2006. SFAS No. 123R requires all share-based payments to employees, including grants of employee stock options, to be recognized as compensation in the financial statements based on their fair values. Currently, under an exemption written into the guidance for qualifying stock option grants with no intrinsic value on the date of grant, we present pro forma share-based compensation expense for our stock option program in the notes to our financial statements. We have elected to use the modified-prospective transition method of implementing SFAS 123R. Under the modified prospective method, awards that are granted, modified, or settled after adoption of SFAS 123R are prospectively measured and accounted for in accordance with SFAS 123R. Unvested equity-classified awards that were granted prior to the adoption of SFAS 123R should continue to be accounted for in accordance with SFAS 123, except that the pro forma fair value amounts must be recognized in the income statement. In March 2005, the SEC issued Staff Accounting Bulletin 107 (SAB 107) to assist preparers by simplifying some of the implementation challenges of SFAS 123R. In particular, SAB 107 provides supplemental implementation guidance on SFAS 123R, including guidance on valuation methods, classification of compensation expense, inventory capitalization of share-based compensation cost, income tax effects, disclosures in Management’s Discussion and Analysis and several other issues. We will apply the principles of SAB 107 in conjunction with our adoption of SFAS 123R.
64
We have elected to use the Black-Scholes option pricing model to value stock options granted in 2006 and will amortize the expense on a straight-line basis over the vesting period. We expect to use lattice modeling to determine our expected term assumption. Other equity instruments issued as compensation will be valued based upon the market price of our stock on the date of grant and will be amortized on a straight-line basis over their earnings periods. The pro forma disclosures included earlier under “Stock Based Compensation” approximate what would have been the impact of applying SFAS 123R to the historical periods presented. However, the 2005 historical period presented includes the effects of the accelerated vesting of all outstanding, but unvested stock options on the date of our Merger ($18 million) and the accelerated vesting of all outstanding, but unvested stock options with exercise prices above $70 approved by our Board of Directors in December 2005 ($29 million). The Board action in December, while serving to reduce future stock option amortization expense as a result of adoption of SFAS 123R, will be offset by new issuances of equity instruments to employees in 2006. We are finalizing our first quarter 2006 option expense calculations and do not yet know the impact to our income statement. SFAS No. 151 “Inventory Costs” SFAS No. 151 is an amendment to ARB No. 43, Chapter 4 that will be effective for us in fiscal 2006. The standard clarifies the accounting for abnormal amounts of idle facility expense, freight, handling costs, and spoilage to require that those costs be expensed currently, as opposed to being included in overhead costs. We do not anticipate that the adoption will have a significant impact on our financial statements. SFAS No. 154 “Accounting Changes and Corrections” SFAS No. 154 replaces APB Opinion No. 20 and FAS No. 3 and will be effective for us in fiscal 2006. The standard introduces a new requirement to retrospectively apply accounting principle changes to prior years’ comparative financial statements as if the Company had always applied the newly adopted accounting principle. Changes in depreciation, amortization and depletion previously considered a change in accounting principle are now considered a change in estimate under SFAS No. 154, requiring prospective adoption. SFAS No. 155 “Accounting for Certain Hybrid Financial Instruments” SFAS No. 155 was issued in February 2006 and will be effective for us in the first quarter of our 2007 fiscal year. Among other things, SFAS No. 155 simplifies the accounting for certain hybrid financial instruments by permitting fair value accounting for any hybrid financial instrument that contains an embedded derivative that otherwise would require bifurcation. We are still reviewing the impact that SFAS No. 155 will have on our financial statements. FASB Staff Position (“FSP”) No. FIN 45-3 “Application of FASB Interpretation No. 45 to Minimum Revenue Guarantees Granted to a Business or its Owners” FSP No. FIN 45-3 is an amendment to FIN 45 requiring the recognition and disclosure of the fair value of an obligation undertaken for a minimum revenue guarantees granted to a business or its owners that the revenue of the business for a specified period of time will be at least a specified minimum amount. The FSP is effective for new minimum revenue guarantees issued or modified on or after the beginning of the first quarter 2006. 2. Mergers and Acquisitions Merger Transaction The Merger was approved at a special meeting of the shareholders of Molson Inc. on January 28, 2005, and a separate meeting of Molson Inc. option holders on January 27, 2005, and amendments to the Company’s certificate of incorporation and a proposal to approve the issuance of shares of Class A common stock, Class B common stock, special Class A voting stock and special Class B voting stock (and any shares convertible into or exchangeable for shares of that stock) were approved by the Coors stockholders on February 1, 2005. The Merger was effected through an exchange of stock, in which Molson Inc. shareholders received stock in MCBC according to an exchange ratio, depending upon the type of stock held. Also, Molson Inc. shareholders were permitted to receive a combination of common stock of MCBC and exchangeable shares in a subsidiary of MCBC, Molson Coors Canada, Inc. Canadian resident holders who received exchangeable shares in the Merger defer paying income taxes on the transaction until such time as they exchange the shares for common stock or otherwise dispose of them.
65
In the Merger, Molson Inc. shareholders received the following: Molson Class A Shareholders. A holder of Molson Class A non-voting shares who was a Canadian resident for Canadian income tax purposes was permitted to elect to receive for each of those shares:
• 0.360 of a Class B exchangeable share of Molson Coors Canada (and ancillary rights),
• through a series of exchanges, 0.360 of a share of Class B common stock of MCBC, or
• a combination of Class B exchangeable shares (and ancillary rights) and, through a series of exchanges, shares of Class B common stock.
Molson Class B Shareholders. A holder of Molson Class B common shares who was a Canadian resident for Canadian income tax purposes was permitted to elect to receive for each of those shares:
• 0.126 of a Class A exchangeable share and 0.234 of a Class B exchangeable share of Molson Coors Canada (and ancillary rights),
• through a series of exchanges, an aggregate of 0.360 of a share of MCBC common stock, comprised of 0.126 of a
share of Class A common stock and 0.234 of a share of Class B common stock, or
• a combination of exchangeable shares (and ancillary rights) and, through a series of exchanges, shares of MCBC common stock.
Molson Stock Option Holders A holder of Molson Inc. stock options was permitted to exchange each such Molson Inc. option for 0.360 of a MCBC option to purchase Class B common stock. Approximately 1.3 million options were issued by MCBC in the Merger. Molson Class A non-voting and Class B common shareholders, excluding Pentland Securities (a company controlled by Eric Molson, a related party), also received a special dividend (the “Special Dividend”) of Cdn $5.44 per share, or a total of approximately Cdn $652 million (US $523 million) paid by Molson in connection with the Merger to Molson Inc. shareholders of record at the close of business on February 8, 2005. Included in the number of outstanding shares of Molson Inc.’s common stock were approximately 1.4 million shares issued upon the exercise of options to purchase Molson Class A common stock by Molson Inc.’s directors and senior management between January 28, 2005, and February 8, 2005. This resulted in an increase in the Special Dividend of Cdn $12 million (US $10 million) and an increase in Molson Inc.’s outstanding Class A common stock. As discussed below, the Special Dividend was financed through additional debt. At its January 28, 2005, meeting, in light of the amount of work involved in completing the Merger transaction, the Board of Directors of Molson Inc. authorized additional payments of: Cdn $50,000 (US $39,800) to each of the then outside directors of Molson Inc.; an additional Cdn $50,000 (US $39,800) to the chairs of the Independent Committee and Human Resources Committee; and Cdn $845,000 (US $672,630) in aggregate additional payments to executive officers and certain other employees of Molson Inc. All Merger-related expenses incurred by Molson Inc. prior to the Merger were expensed as incurred. Reasons for the Merger The Merger placed our combined Company as the world’s fifth largest brewer, by volume, with combined annual volume of approximately 40 million barrels. The combined Company offers a diverse offering of owned and licensed brands in key markets throughout the world. Management has identified synergies that the combined Company believes it can achieve in stages over the next three years, including the closing of the Memphis plant discussed in Note 8, in addition to administrative, strategic sourcing and other cost reductions. However, there can be no assurances that we will achieve all synergies. Pro Forma Results As discussed in Note 1, the results of Molson Canada have been included in the consolidated financial statements since February 9, 2005.
66
The following unaudited, pro forma information shows the results of our operations for the fiscal year ended December 25, 2005 as if the Merger had occurred at the beginning of the fiscal year. The pro forma results include special charges of $169.3 million, consisting of post-Merger charges and Merger-related charges incurred by Molson prior to February 9, 2005. Pro forma results for 2004 include special charges of $12.9 million, including Merger-related Corporate expenses.
Year ended December 25, 2005 December 26, 2004 (In millions, except per share amounts) Net sales..................................................................................... $5,613.1 $5,869.9Income from continuing operations before income taxes and
cumulative effect of change in accounting principle ............. $290.3 $575.6Net income................................................................................. $93.4 $193.5Net income per common share:
Basic........................................................................................ $1.11 $2.31Diluted..................................................................................... $1.10 $2.25
Allocation of Purchase Price The Merger’s equity consideration was valued at $3.6 billion, including the exchange of 46.7 million equivalent shares of stock at a market price of $75.25 per share, the exchange of stock options valued at $4.0 million, and Merger-related costs incurred by Coors, of which $16 million was incurred prior to the Merger. Coors was considered the accounting acquirer in the Merger, requiring the purchase consideration to be allocated to Molson’s and Kaiser’s assets and liabilities based upon their fair values, with the residual to goodwill. The allocation of the purchase price was substantially complete as of December 25, 2005. The following table summarizes the preliminary fair values of the assets acquired and liabilities assumed at the Merger date.
As of February 9, 2005 (In millions) Current assets..................................................................................................... $486.7Property, plant and equipment .......................................................................... 1,011.6Other assets ........................................................................................................ 489.6Intangible assets................................................................................................. 3,734.9Goodwill ............................................................................................................ 1,837.6
Total assets acquired....................................................................................... 7,560.4Current liabilities ............................................................................................... (688.3)Non-current liabilities and minority interests ................................................... (3,315.6)
Total liabilities assumed ................................................................................. (4,003.9)Net assets acquired ...................................................................................... $3,556.5

67
We have allocated preliminary purchase price to goodwill and intangibles as follows. Overall enterprise values and values of individual intangible assets were determined primarily through the use of discounted cash flow techniques.
As of February 9, 2005
Amount Estimated Useful
Lives in Years (In millions) Intangible Assets—Finite Lived Canada Segment
Distribution Agreements................................................................................ $270.7 4 to 11 Brands ............................................................................................................ 144.5 12
Total Canada Segment................................................................................ 415.2 Brazil Segment
Distribution Network ..................................................................................... 8.3 15 Brands ............................................................................................................ 23.5 12 to 36
Total Brazil Segment .................................................................................. 31.8 Total Intangible Assets—Finite Lived.......................................................... 447.0 Intangible Assets—Indefinite Lived Canada Segment
Distribution Network ..................................................................................... 811.5 Brands ............................................................................................................ 2,476.4
Total Intangible Assets—Indefinite Lived ................................................... 3,287.9 Total Intangible Assets ................................................................................... $3,734.9 Goodwill
Canada Segment............................................................................................. $625.2 Brazil Segment............................................................................................... 95.4 US Segment.................................................................................................... 1,117.0
Total Goodwill................................................................................................. $1,837.6 Synergies deriving from the Merger are expected to benefit both the Canada and US segments. However, goodwill has been allocated to the US segment based upon projections that a large portion of synergy cost savings will benefit that segment. Fair value estimates of the US segment done both with and without total synergies expected to benefit the US segment indicate a difference in that fair value of $1.1 billion. Management believes that this amount provides a reasonable basis for allocation of goodwill to the US segment. Merger-related Debt Subsequent to the Merger, we established a $1.0 billion bridge facility which was used to refinance pre-Merger Molson debt, including debt used to finance the Special Dividend and to refinance some of Molson’s other pre-Merger debt. We also established a $1.4 billion, five-year credit facility which was used to refinance a portion of the bridge facility borrowings. We had $163 million outstanding under the credit facility at December 25, 2005. Subsequent to establishing both of these facilities, the existing bank facilities at both Molson and Coors were terminated. The bridge loan facility was refinanced with proceeds from approximately $1.1 billion of senior notes, which were issued on September 22, 2005 (see related Note 13). Merger-related Other Molson sold the majority of its ownership in the Montréal Canadiens professional hockey club (the Club) to a purchaser in 2001. Molson maintained a 19.9% common ownership interest in the Club, as well as a preferred interest, redeemable in 2009. The preferred equity interest has a stated value of Cdn $86.5 million. (approximately US $74.2 million) and is redeemable in 2009. We have determined that, while the Club is a variable interest entity as defined by FIN 46R, we are not the primary beneficiary of the entity. As a result, we account for our interest in the Club using the equity method. The shareholders of the Club (the purchaser and Molson) and the National Hockey League (NHL) are parties to a consent agreement, which requires the purchaser and MCBC to abide by funding requirements included in the terms of the shareholders’ agreement. In addition, MCBC is party to certain guarantees to the lenders of the purchaser of the Canadiens and the Bell Centre (formerly the Molson Centre), such that in the event that the Club and the purchaser are not able to meet their obligations, or in the event of a default, we shall 1) provide adequate support to the purchaser through necessary cash payments so that the purchaser would have sufficient funds to meet its debt obligations, and 2) exercise control of the entity which owns
68
the Club and the entertainment business operated at the Bell Centre at predetermined conditions, subject to NHL approval. The obligations of the purchaser to such lenders were Cdn $92 million (approximately US $79 million) at December 25, 2005. As part of the sale transaction, Molson reaffirmed an existing guarantee of the purchaser’s payment obligations on a 99-year lease arrangement (which began in 1993) related to the land upon which the Bell Centre has been constructed. Annual lease payments in 2004 were Cdn $2.4 million (approximately $1.2 million), and are adjusted annually to reflect prevailing interest rates and changes in the consumer price index. The lessee is an entity owned by the purchaser of the Canadiens. We have made estimates of the fair values of the common and preferred equity investments in the Montréal Canadiens, as well as of the guarantee to lenders noted above and a guarantee of payments due under the land lease, which are accrued as of December 25, 2005. We have assigned values to intangible assets that are imbedded in our investment in the Montréal Canadiens, which is recorded in Other non-current assets. We recorded amortization in 2005 of $0.6 million associated with the estimated finite-lived intangibles. This amortization cost is classified as a component of our equity in income or loss in the Canadiens. 3. Discontinued Operations On January 13, 2006, we sold a 68% equity interest in our Brazilian unit, Cervejarias Kaiser (“Kaiser”), to FEMSA Cerveza S.A. de C.V. (“FEMSA”) for $68 million cash, including the assumption by FEMSA of Kaiser-related debt and contingencies. Kaiser represented our previously-reported Brazil operating segment that we acquired on February 9, 2005 as part of the Merger. We retained a 15% interest in Kaiser and have one seat out of seven on its board. Heineken NV remains a 17 percent equity partner in the Kaiser business. We undertook the sale of Kaiser to allow us to focus on our United States, Canada and UK markets, and to continue to deliver the cost synergies and other benefits related to the Merger. Prior to the acquisition of 68% of Kaiser, FEMSA was, and remains, the largest distributor of Kaiser products in Brazil. The terms of the agreement require us to indemnify FEMSA for exposures related to certain tax, civil and labor contingencies arising prior to FEMSA’s purchase of Kaiser. First, we provided a full indemnity for any losses Kaiser may incur with respect to tax claims associated with previously utilized purchased tax credits. Any potential liabilities associated with these exposures were not considered probable during 2005. The total base amount of potential claims in this regard, plus estimated accumulated penalties and interest, is $205 million. Second, we provided indemnity related to all other tax, civil and labor contingencies. In this regard, however, FEMSA assumed their full share of all contingent liabilities that had been recorded and disclosed by us. However, we may have to provide indemnity to FEMSA if those liabilities settle at amounts greater than those amounts recorded or disclosed by us. We will be able to offset any indemnity exposures in these circumstances with amounts that settle favorably to amounts previously recorded. We will record these guarantee liabilities on the balance sheet at fair value, and the creation of those liabilities will reduce the expected gain on the sale of 68% of the business to be reported in the first quarter of 2006. We hold a put option to sell to FEMSA our remaining 15% interest in Kaiser for the greater of $15 million or fair market value for the next three years and at fair market value after three years. The value of the put option will increase the gain on the sale expected to be reported in the first quarter of 2006. FEMSA holds a call option to purchase from us our remaining 15% interest at fair market value beginning in January 2013. Kaiser had $244.7 million of net sales and $100.5 million of pre-tax losses during 2005. The pre-tax losses included $46.7 million of special charges associated with contingent tax liabilities. The pre-tax loss also includes $7.3 million of interest expense, associated with Brazil bank debt, that would have been recorded in the Corporate segment had Brazil remained an operating segment. As our Brazil segment represented a discontinued operation as of December 25, 2005, we have segregated the results of operations, financial position, and cash flows for the Brazil segment in our financial statements to be reflected as discontinued operations. 4. Variable Interest Entities FASB Interpretation No. 46R, Consolidation of Variable Interest Entities—An Interpretation of ARB51 (FIN 46R) expands the scope of ARB51 and can require consolidation of “variable interest entities (VIEs).” Once an entity is determined to be a VIE, the party with the controlling financial interest, the primary beneficiary, is required to consolidate it. We have investments in VIEs, of which we are the primary beneficiary. These include Rocky Mountain Metal Container (RMMC), Rocky Mountain Bottle Company (RMBC), Grolsch (UK) Limited (Grolsch) and Brewers’ Retail Inc. (BRI). Accordingly, we have consolidated these four joint ventures, three of which were effective December 29, 2003, the first day of our 2004 fiscal year. Our partners’ share of the operating results of the ventures is eliminated in the minority interests line of the accompanying
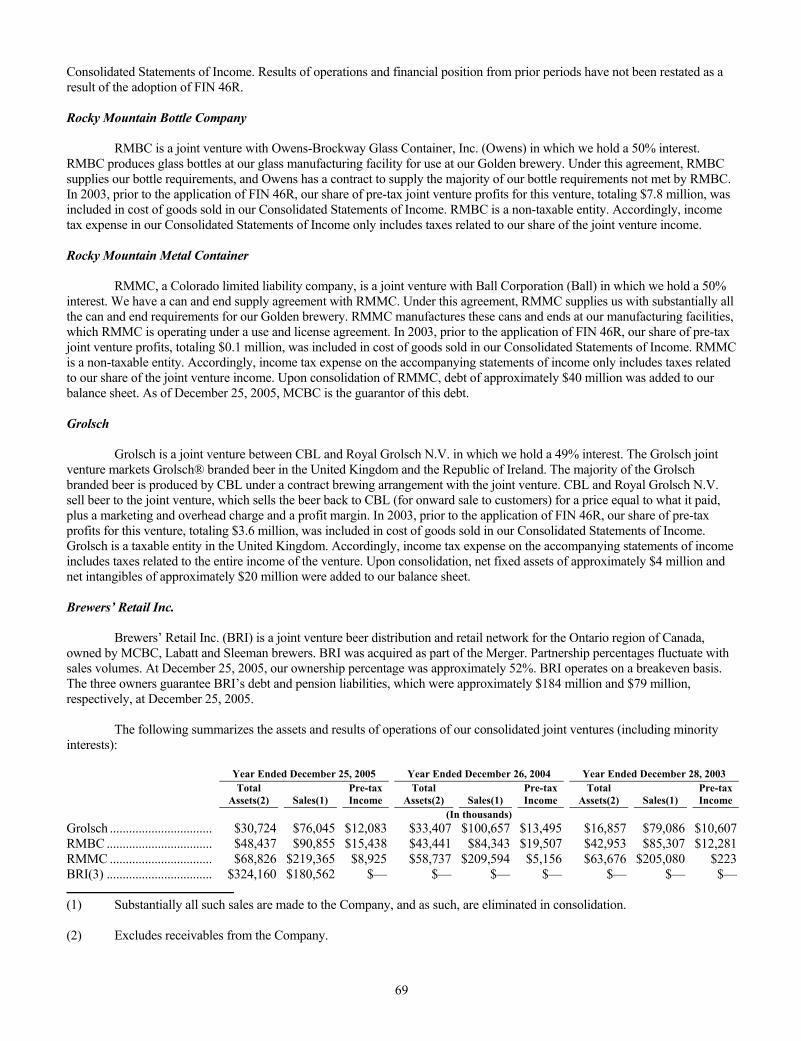
69
Consolidated Statements of Income. Results of operations and financial position from prior periods have not been restated as a result of the adoption of FIN 46R. Rocky Mountain Bottle Company RMBC is a joint venture with Owens-Brockway Glass Container, Inc. (Owens) in which we hold a 50% interest. RMBC produces glass bottles at our glass manufacturing facility for use at our Golden brewery. Under this agreement, RMBC supplies our bottle requirements, and Owens has a contract to supply the majority of our bottle requirements not met by RMBC. In 2003, prior to the application of FIN 46R, our share of pre-tax joint venture profits for this venture, totaling $7.8 million, was included in cost of goods sold in our Consolidated Statements of Income. RMBC is a non-taxable entity. Accordingly, income tax expense in our Consolidated Statements of Income only includes taxes related to our share of the joint venture income. Rocky Mountain Metal Container RMMC, a Colorado limited liability company, is a joint venture with Ball Corporation (Ball) in which we hold a 50% interest. We have a can and end supply agreement with RMMC. Under this agreement, RMMC supplies us with substantially all the can and end requirements for our Golden brewery. RMMC manufactures these cans and ends at our manufacturing facilities, which RMMC is operating under a use and license agreement. In 2003, prior to the application of FIN 46R, our share of pre-tax joint venture profits, totaling $0.1 million, was included in cost of goods sold in our Consolidated Statements of Income. RMMC is a non-taxable entity. Accordingly, income tax expense on the accompanying statements of income only includes taxes related to our share of the joint venture income. Upon consolidation of RMMC, debt of approximately $40 million was added to our balance sheet. As of December 25, 2005, MCBC is the guarantor of this debt. Grolsch Grolsch is a joint venture between CBL and Royal Grolsch N.V. in which we hold a 49% interest. The Grolsch joint venture markets Grolsch® branded beer in the United Kingdom and the Republic of Ireland. The majority of the Grolsch branded beer is produced by CBL under a contract brewing arrangement with the joint venture. CBL and Royal Grolsch N.V. sell beer to the joint venture, which sells the beer back to CBL (for onward sale to customers) for a price equal to what it paid, plus a marketing and overhead charge and a profit margin. In 2003, prior to the application of FIN 46R, our share of pre-tax profits for this venture, totaling $3.6 million, was included in cost of goods sold in our Consolidated Statements of Income. Grolsch is a taxable entity in the United Kingdom. Accordingly, income tax expense on the accompanying statements of income includes taxes related to the entire income of the venture. Upon consolidation, net fixed assets of approximately $4 million and net intangibles of approximately $20 million were added to our balance sheet. Brewers’ Retail Inc. Brewers’ Retail Inc. (BRI) is a joint venture beer distribution and retail network for the Ontario region of Canada, owned by MCBC, Labatt and Sleeman brewers. BRI was acquired as part of the Merger. Partnership percentages fluctuate with sales volumes. At December 25, 2005, our ownership percentage was approximately 52%. BRI operates on a breakeven basis. The three owners guarantee BRI’s debt and pension liabilities, which were approximately $184 million and $79 million, respectively, at December 25, 2005. The following summarizes the assets and results of operations of our consolidated joint ventures (including minority interests): Year Ended December 25, 2005 Year Ended December 26, 2004 Year Ended December 28, 2003
Total
Assets(2) Sales(1) Pre-taxIncome
Total Assets(2) Sales(1)
Pre-taxIncome
Total Assets(2) Sales(1)
Pre-taxIncome
(In thousands) Grolsch ................................ $30,724 $76,045 $12,083 $33,407 $100,657 $13,495 $16,857 $79,086 $10,607RMBC ................................. $48,437 $90,855 $15,438 $43,441 $84,343 $19,507 $42,953 $85,307 $12,281RMMC ................................ $68,826 $219,365 $8,925 $58,737 $209,594 $5,156 $63,676 $205,080 $223BRI(3) ................................. $324,160 $180,562 $— $— $— $— $— $— $—
(1) Substantially all such sales are made to the Company, and as such, are eliminated in consolidation. (2) Excludes receivables from the Company.
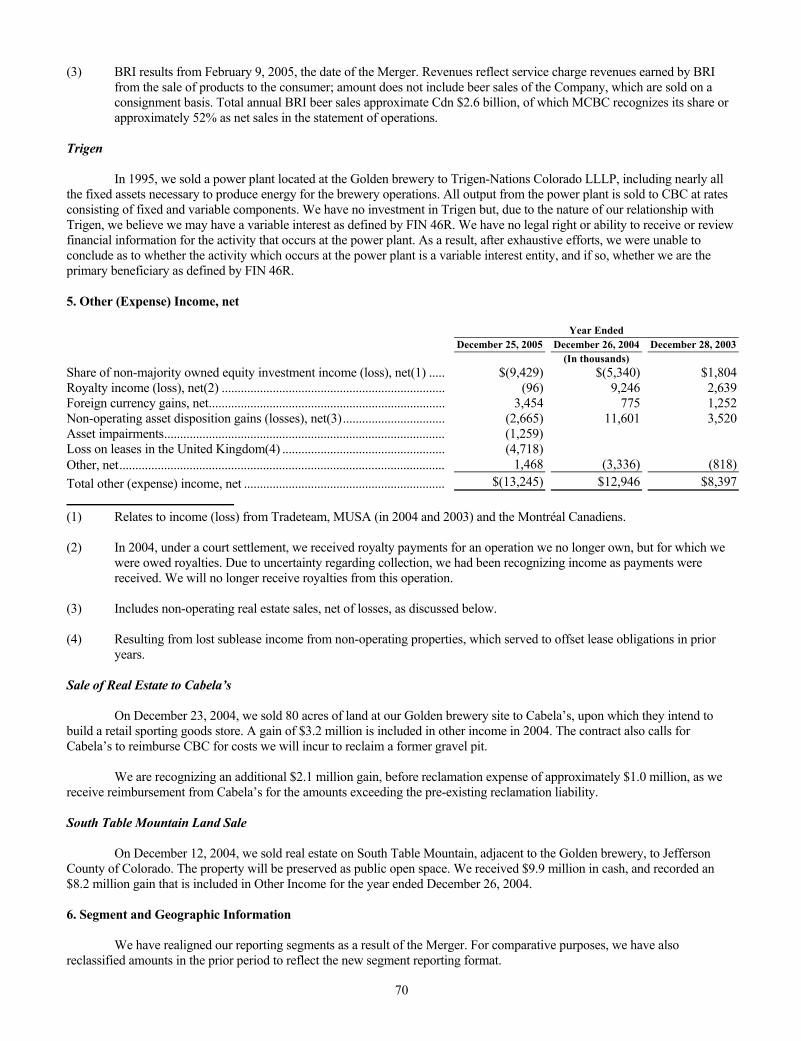
70
(3) BRI results from February 9, 2005, the date of the Merger. Revenues reflect service charge revenues earned by BRI from the sale of products to the consumer; amount does not include beer sales of the Company, which are sold on a consignment basis. Total annual BRI beer sales approximate Cdn $2.6 billion, of which MCBC recognizes its share or approximately 52% as net sales in the statement of operations.
Trigen In 1995, we sold a power plant located at the Golden brewery to Trigen-Nations Colorado LLLP, including nearly all the fixed assets necessary to produce energy for the brewery operations. All output from the power plant is sold to CBC at rates consisting of fixed and variable components. We have no investment in Trigen but, due to the nature of our relationship with Trigen, we believe we may have a variable interest as defined by FIN 46R. We have no legal right or ability to receive or review financial information for the activity that occurs at the power plant. As a result, after exhaustive efforts, we were unable to conclude as to whether the activity which occurs at the power plant is a variable interest entity, and if so, whether we are the primary beneficiary as defined by FIN 46R. 5. Other (Expense) Income, net Year Ended December 25, 2005 December 26, 2004 December 28, 2003 (In thousands) Share of non-majority owned equity investment income (loss), net(1) ..... $(9,429) $(5,340) $1,804Royalty income (loss), net(2) ...................................................................... (96) 9,246 2,639Foreign currency gains, net.......................................................................... 3,454 775 1,252Non-operating asset disposition gains (losses), net(3)................................ (2,665) 11,601 3,520Asset impairments........................................................................................ (1,259) Loss on leases in the United Kingdom(4) ................................................... (4,718) Other, net...................................................................................................... 1,468 (3,336) (818)Total other (expense) income, net ............................................................... $(13,245) $12,946 $8,397
(1) Relates to income (loss) from Tradeteam, MUSA (in 2004 and 2003) and the Montréal Canadiens. (2) In 2004, under a court settlement, we received royalty payments for an operation we no longer own, but for which we
were owed royalties. Due to uncertainty regarding collection, we had been recognizing income as payments were received. We will no longer receive royalties from this operation.
(3) Includes non-operating real estate sales, net of losses, as discussed below. (4) Resulting from lost sublease income from non-operating properties, which served to offset lease obligations in prior
years. Sale of Real Estate to Cabela’s On December 23, 2004, we sold 80 acres of land at our Golden brewery site to Cabela’s, upon which they intend to build a retail sporting goods store. A gain of $3.2 million is included in other income in 2004. The contract also calls for Cabela’s to reimburse CBC for costs we will incur to reclaim a former gravel pit. We are recognizing an additional $2.1 million gain, before reclamation expense of approximately $1.0 million, as we receive reimbursement from Cabela’s for the amounts exceeding the pre-existing reclamation liability. South Table Mountain Land Sale On December 12, 2004, we sold real estate on South Table Mountain, adjacent to the Golden brewery, to Jefferson County of Colorado. The property will be preserved as public open space. We received $9.9 million in cash, and recorded an $8.2 million gain that is included in Other Income for the year ended December 26, 2004. 6. Segment and Geographic Information We have realigned our reporting segments as a result of the Merger. For comparative purposes, we have also reclassified amounts in the prior period to reflect the new segment reporting format.
71
United States (US) The US segment consists of the production, marketing, and sales of the Coors and Molson portfolios of brands in the United States and its territories, Mexico and in the Caribbean. This segment also includes the results of the Rocky Mountain Metal Container (RMMC) and Rocky Mountain Bottle Company (RMBC) joint ventures consolidated under FIN 46R. Europe The Europe segment consists of our production and sale of the CBL brands, principally in the United Kingdom, with sales in Asia and other export markets, our joint venture arrangement relating to the production and distribution of Grolsch in the United Kingdom and Republic of Ireland (consolidated under FIN 46R), and our joint venture arrangement for the physical distribution of products throughout Great Britain (Tradeteam). Canada The Canada segment consists of our production and sale of the Molson and Coors Light brands, principally in Canada; our joint venture arrangement related to the distribution and retail sale of beer in Ontario, Brewers Retail, Inc. (BRI) (consolidated under FIN 46R); and our joint venture arrangement related to the distribution of beer in the western provinces, Brewers Distribution Limited (BDL). The Canada segment also includes our equity interest in the Montréal Canadiens Hockey Club. We also distribute, market and sell Corona Extra® in Ontario, Québec, and the Atlantic provinces under agreement with Cerveceria Modelo S.A. de C.V. We have an agreement with Heineken N.V. (Netherlands) which grants us the right to import, market and sell Heineken products throughout Canada and with Miller to brew, market and sell several Miller brands, and distribute and sell imported Miller brands. The Canada segment also has an agreement with Carlton and United Breweries Limited, a subsidiary of Foster’s Brewing Group Limited, to brew Foster’s Lager® in Canada for sale in Canada and the United States. Lastly, Molson Canada has the right to contract produce Asahi® for the United States market. Corporate Corporate includes interest and certain other general and administrative costs that are not allocated to any of the operating segments. The majority of these corporate costs relates to worldwide administrative functions, such as corporate affairs, legal, human resources, accounting, treasury, insurance and risk management. Corporate also includes certain royalty income and intangible administrative costs that are absorbed by Corporate. Discontinued Operations Our Brazil segment, which was comprised of Kaiser, was sold subsequent to December 25, 2005, and has been reflected as a discontinued operation herein. No single customer accounted for more than 10% of our sales. Inter-segment sales revenues are insignificant and eliminated in consolidation.
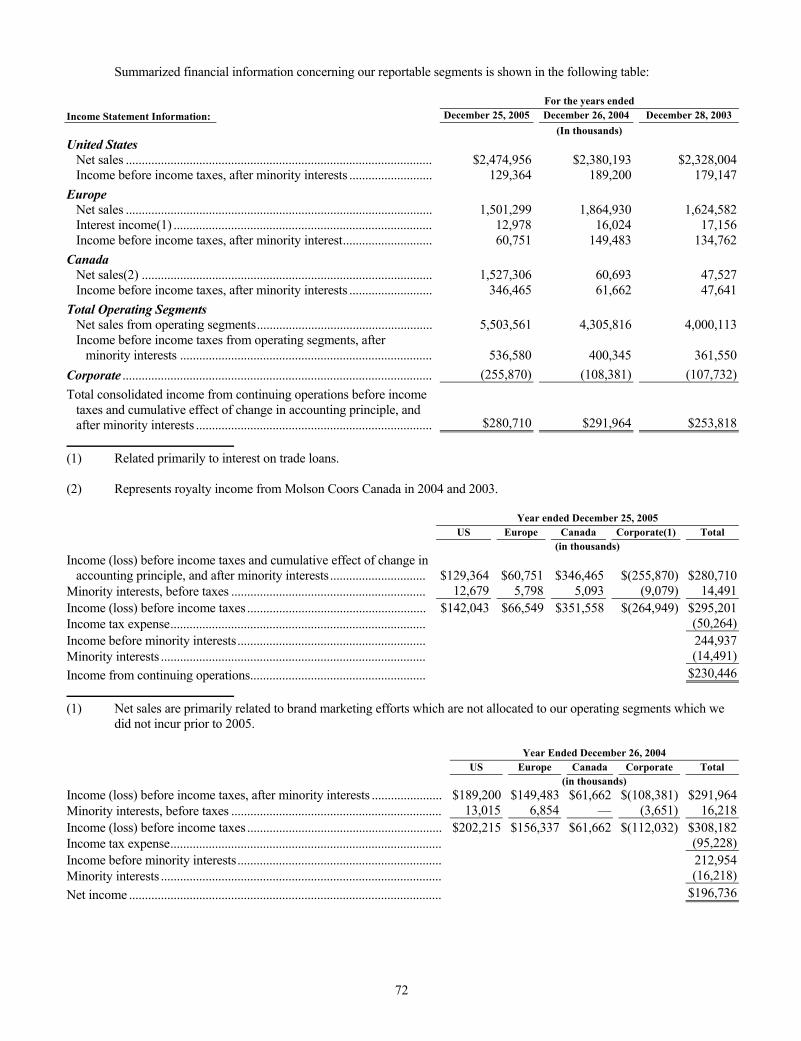
72
Summarized financial information concerning our reportable segments is shown in the following table: For the years ended Income Statement Information: December 25, 2005 December 26, 2004 December 28, 2003 (In thousands) United States
Net sales ................................................................................................ $2,474,956 $2,380,193 $2,328,004Income before income taxes, after minority interests .......................... 129,364 189,200 179,147
Europe Net sales ................................................................................................ 1,501,299 1,864,930 1,624,582Interest income(1) ................................................................................. 12,978 16,024 17,156Income before income taxes, after minority interest............................ 60,751 149,483 134,762
Canada Net sales(2) ........................................................................................... 1,527,306 60,693 47,527Income before income taxes, after minority interests .......................... 346,465 61,662 47,641
Total Operating Segments Net sales from operating segments....................................................... 5,503,561 4,305,816 4,000,113Income before income taxes from operating segments, after
minority interests ............................................................................... 536,580 400,345 361,550Corporate ................................................................................................. (255,870) (108,381) (107,732)Total consolidated income from continuing operations before income
taxes and cumulative effect of change in accounting principle, and after minority interests .......................................................................... $280,710 $291,964 $253,818
(1) Related primarily to interest on trade loans. (2) Represents royalty income from Molson Coors Canada in 2004 and 2003. Year ended December 25, 2005 US Europe Canada Corporate(1) Total (in thousands) Income (loss) before income taxes and cumulative effect of change in
accounting principle, and after minority interests.............................. $129,364 $60,751 $346,465 $(255,870) $280,710Minority interests, before taxes ............................................................. 12,679 5,798 5,093 (9,079) 14,491Income (loss) before income taxes ........................................................ $142,043 $66,549 $351,558 $(264,949) $295,201Income tax expense................................................................................ (50,264)Income before minority interests........................................................... 244,937Minority interests ................................................................................... (14,491)Income from continuing operations....................................................... $230,446
(1) Net sales are primarily related to brand marketing efforts which are not allocated to our operating segments which we
did not incur prior to 2005. Year Ended December 26, 2004 US Europe Canada Corporate Total (in thousands) Income (loss) before income taxes, after minority interests ...................... $189,200 $149,483 $61,662 $(108,381) $291,964Minority interests, before taxes .................................................................. 13,015 6,854 — (3,651) 16,218Income (loss) before income taxes ............................................................. $202,215 $156,337 $61,662 $(112,032) $308,182Income tax expense..................................................................................... (95,228)Income before minority interests................................................................ 212,954Minority interests ........................................................................................ (16,218)Net income .................................................................................................. $196,736
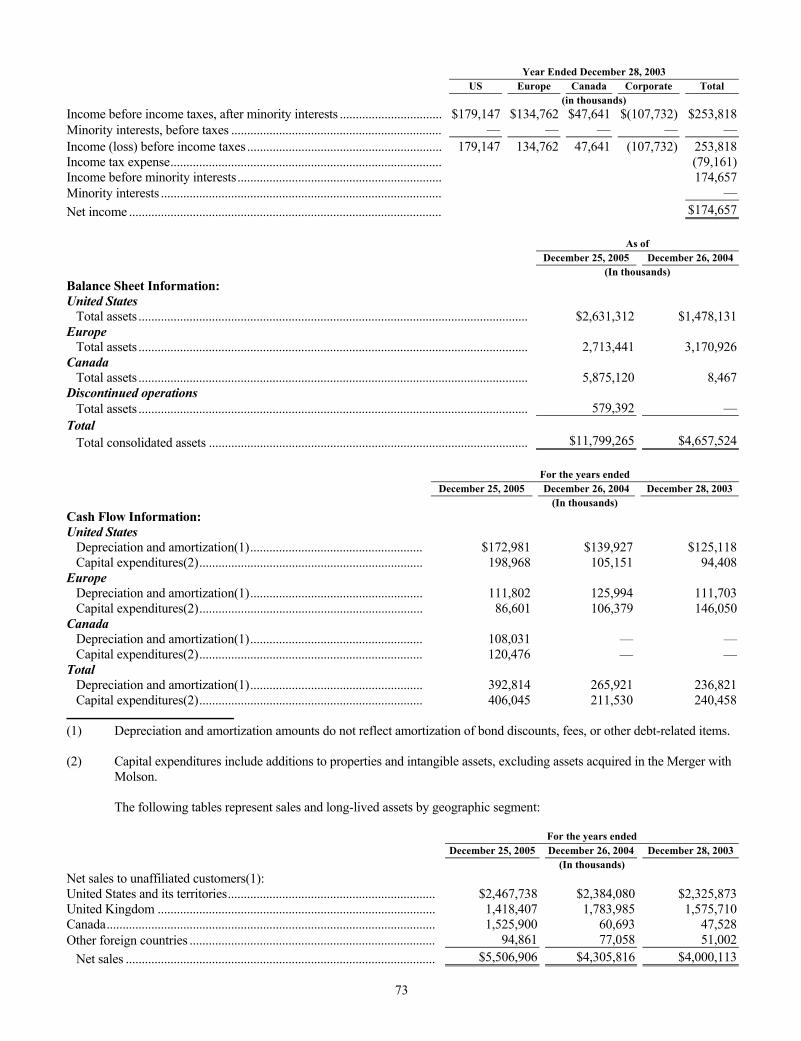
73
Year Ended December 28, 2003 US Europe Canada Corporate Total (in thousands) Income before income taxes, after minority interests ................................ $179,147 $134,762 $47,641 $(107,732) $253,818Minority interests, before taxes .................................................................. — — — — —Income (loss) before income taxes ............................................................. 179,147 134,762 47,641 (107,732) 253,818Income tax expense..................................................................................... (79,161)Income before minority interests................................................................ 174,657Minority interests ........................................................................................ —Net income .................................................................................................. $174,657 As of December 25, 2005 December 26, 2004 (In thousands) Balance Sheet Information: United States
Total assets .......................................................................................................................... $2,631,312 $1,478,131Europe
Total assets .......................................................................................................................... 2,713,441 3,170,926Canada
Total assets .......................................................................................................................... 5,875,120 8,467Discontinued operations
Total assets .......................................................................................................................... 579,392 —Total
Total consolidated assets .................................................................................................... $11,799,265 $4,657,524 For the years ended December 25, 2005 December 26, 2004 December 28, 2003 (In thousands) Cash Flow Information: United States
Depreciation and amortization(1)...................................................... $172,981 $139,927 $125,118Capital expenditures(2)...................................................................... 198,968 105,151 94,408
Europe Depreciation and amortization(1)...................................................... 111,802 125,994 111,703Capital expenditures(2)...................................................................... 86,601 106,379 146,050
Canada Depreciation and amortization(1)...................................................... 108,031 — —Capital expenditures(2)...................................................................... 120,476 — —
Total Depreciation and amortization(1)...................................................... 392,814 265,921 236,821Capital expenditures(2)...................................................................... 406,045 211,530 240,458
(1) Depreciation and amortization amounts do not reflect amortization of bond discounts, fees, or other debt-related items. (2) Capital expenditures include additions to properties and intangible assets, excluding assets acquired in the Merger with
Molson. The following tables represent sales and long-lived assets by geographic segment: For the years ended December 25, 2005 December 26, 2004 December 28, 2003 (In thousands) Net sales to unaffiliated customers(1): United States and its territories................................................................. $2,467,738 $2,384,080 $2,325,873United Kingdom ....................................................................................... 1,418,407 1,783,985 1,575,710Canada....................................................................................................... 1,525,900 60,693 47,528Other foreign countries ............................................................................. 94,861 77,058 51,002
Net sales ................................................................................................. $5,506,906 $4,305,816 $4,000,113
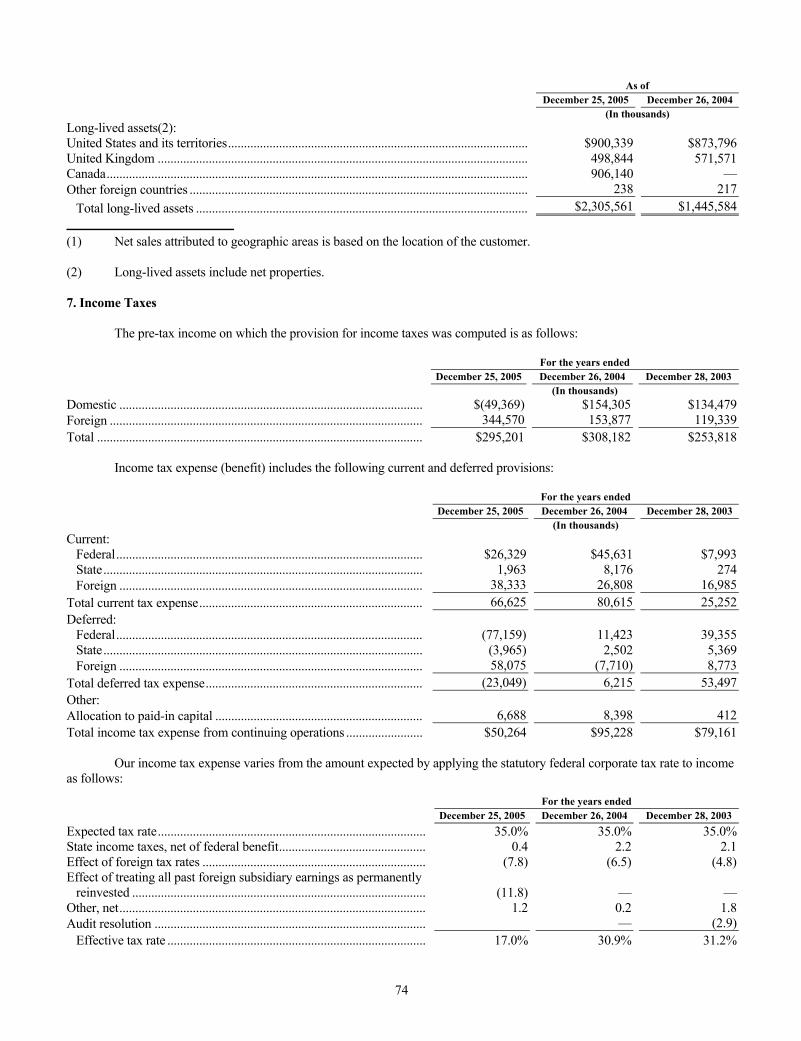
74
As of December 25, 2005 December 26, 2004
(In thousands) Long-lived assets(2): United States and its territories.............................................................................................. $900,339 $873,796United Kingdom .................................................................................................................... 498,844 571,571Canada.................................................................................................................................... 906,140 —Other foreign countries .......................................................................................................... 238 217
Total long-lived assets ........................................................................................................ $2,305,561 $1,445,584
(1) Net sales attributed to geographic areas is based on the location of the customer. (2) Long-lived assets include net properties. 7. Income Taxes The pre-tax income on which the provision for income taxes was computed is as follows: For the years ended December 25, 2005 December 26, 2004 December 28, 2003 (In thousands) Domestic ............................................................................................... $(49,369) $154,305 $134,479Foreign .................................................................................................. 344,570 153,877 119,339Total ...................................................................................................... $295,201 $308,182 $253,818 Income tax expense (benefit) includes the following current and deferred provisions: For the years ended December 25, 2005 December 26, 2004 December 28, 2003 (In thousands) Current:
Federal................................................................................................ $26,329 $45,631 $7,993State.................................................................................................... 1,963 8,176 274Foreign ............................................................................................... 38,333 26,808 16,985
Total current tax expense...................................................................... 66,625 80,615 25,252Deferred:
Federal................................................................................................ (77,159) 11,423 39,355State.................................................................................................... (3,965) 2,502 5,369Foreign ............................................................................................... 58,075 (7,710) 8,773
Total deferred tax expense.................................................................... (23,049) 6,215 53,497Other: Allocation to paid-in capital ................................................................. 6,688 8,398 412Total income tax expense from continuing operations ........................ $50,264 $95,228 $79,161 Our income tax expense varies from the amount expected by applying the statutory federal corporate tax rate to income as follows:
For the years ended December 25, 2005 December 26, 2004 December 28, 2003 Expected tax rate.................................................................................... 35.0% 35.0% 35.0%State income taxes, net of federal benefit.............................................. 0.4 2.2 2.1Effect of foreign tax rates ...................................................................... (7.8) (6.5) (4.8)Effect of treating all past foreign subsidiary earnings as permanently
reinvested ............................................................................................ (11.8) — —Other, net................................................................................................ 1.2 0.2 1.8Audit resolution ..................................................................................... — (2.9)
Effective tax rate ................................................................................. 17.0% 30.9% 31.2%
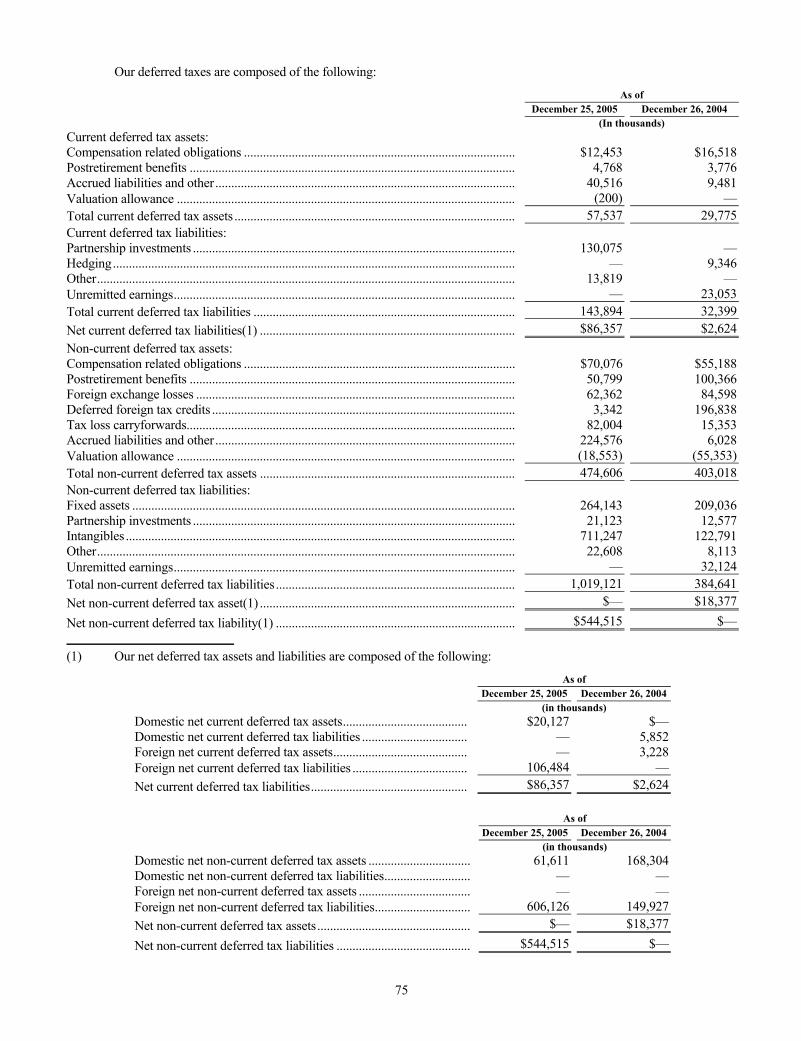
75
Our deferred taxes are composed of the following:
As of December 25, 2005 December 26, 2004 (In thousands) Current deferred tax assets: Compensation related obligations ..................................................................................... $12,453 $16,518Postretirement benefits ...................................................................................................... 4,768 3,776Accrued liabilities and other.............................................................................................. 40,516 9,481Valuation allowance .......................................................................................................... (200) —Total current deferred tax assets ........................................................................................ 57,537 29,775Current deferred tax liabilities: Partnership investments ..................................................................................................... 130,075 —Hedging.............................................................................................................................. — 9,346Other................................................................................................................................... 13,819 —Unremitted earnings........................................................................................................... — 23,053Total current deferred tax liabilities .................................................................................. 143,894 32,399Net current deferred tax liabilities(1) ................................................................................ $86,357 $2,624Non-current deferred tax assets: Compensation related obligations ..................................................................................... $70,076 $55,188Postretirement benefits ...................................................................................................... 50,799 100,366Foreign exchange losses .................................................................................................... 62,362 84,598Deferred foreign tax credits ............................................................................................... 3,342 196,838Tax loss carryforwards....................................................................................................... 82,004 15,353Accrued liabilities and other.............................................................................................. 224,576 6,028Valuation allowance .......................................................................................................... (18,553) (55,353)Total non-current deferred tax assets ................................................................................ 474,606 403,018Non-current deferred tax liabilities: Fixed assets ........................................................................................................................ 264,143 209,036Partnership investments ..................................................................................................... 21,123 12,577Intangibles .......................................................................................................................... 711,247 122,791Other................................................................................................................................... 22,608 8,113Unremitted earnings........................................................................................................... — 32,124Total non-current deferred tax liabilities........................................................................... 1,019,121 384,641Net non-current deferred tax asset(1) ................................................................................ $— $18,377
Net non-current deferred tax liability(1) ........................................................................... $544,515 $—
(1) Our net deferred tax assets and liabilities are composed of the following:
As of December 25, 2005 December 26, 2004 (in thousands) Domestic net current deferred tax assets....................................... $20,127 $—Domestic net current deferred tax liabilities ................................. — 5,852Foreign net current deferred tax assets.......................................... — 3,228Foreign net current deferred tax liabilities .................................... 106,484 —Net current deferred tax liabilities................................................. $86,357 $2,624
As of December 25, 2005 December 26, 2004 (in thousands) Domestic net non-current deferred tax assets ................................ 61,611 168,304Domestic net non-current deferred tax liabilities........................... — —Foreign net non-current deferred tax assets ................................... — —Foreign net non-current deferred tax liabilities.............................. 606,126 149,927Net non-current deferred tax assets................................................ $— $18,377
Net non-current deferred tax liabilities .......................................... $544,515 $—
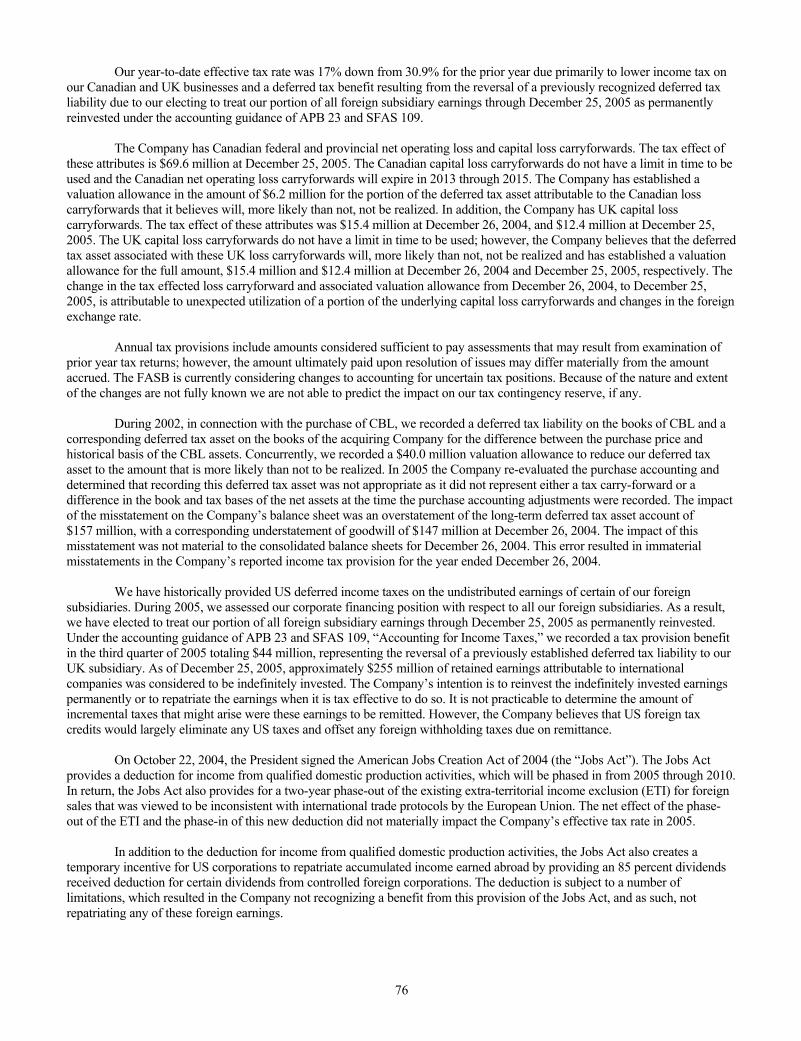
76
Our year-to-date effective tax rate was 17% down from 30.9% for the prior year due primarily to lower income tax on our Canadian and UK businesses and a deferred tax benefit resulting from the reversal of a previously recognized deferred tax liability due to our electing to treat our portion of all foreign subsidiary earnings through December 25, 2005 as permanently reinvested under the accounting guidance of APB 23 and SFAS 109. The Company has Canadian federal and provincial net operating loss and capital loss carryforwards. The tax effect of these attributes is $69.6 million at December 25, 2005. The Canadian capital loss carryforwards do not have a limit in time to be used and the Canadian net operating loss carryforwards will expire in 2013 through 2015. The Company has established a valuation allowance in the amount of $6.2 million for the portion of the deferred tax asset attributable to the Canadian loss carryforwards that it believes will, more likely than not, not be realized. In addition, the Company has UK capital loss carryforwards. The tax effect of these attributes was $15.4 million at December 26, 2004, and $12.4 million at December 25, 2005. The UK capital loss carryforwards do not have a limit in time to be used; however, the Company believes that the deferred tax asset associated with these UK loss carryforwards will, more likely than not, not be realized and has established a valuation allowance for the full amount, $15.4 million and $12.4 million at December 26, 2004 and December 25, 2005, respectively. The change in the tax effected loss carryforward and associated valuation allowance from December 26, 2004, to December 25, 2005, is attributable to unexpected utilization of a portion of the underlying capital loss carryforwards and changes in the foreign exchange rate. Annual tax provisions include amounts considered sufficient to pay assessments that may result from examination of prior year tax returns; however, the amount ultimately paid upon resolution of issues may differ materially from the amount accrued. The FASB is currently considering changes to accounting for uncertain tax positions. Because of the nature and extent of the changes are not fully known we are not able to predict the impact on our tax contingency reserve, if any. During 2002, in connection with the purchase of CBL, we recorded a deferred tax liability on the books of CBL and a corresponding deferred tax asset on the books of the acquiring Company for the difference between the purchase price and historical basis of the CBL assets. Concurrently, we recorded a $40.0 million valuation allowance to reduce our deferred tax asset to the amount that is more likely than not to be realized. In 2005 the Company re-evaluated the purchase accounting and determined that recording this deferred tax asset was not appropriate as it did not represent either a tax carry-forward or a difference in the book and tax bases of the net assets at the time the purchase accounting adjustments were recorded. The impact of the misstatement on the Company’s balance sheet was an overstatement of the long-term deferred tax asset account of $157 million, with a corresponding understatement of goodwill of $147 million at December 26, 2004. The impact of this misstatement was not material to the consolidated balance sheets for December 26, 2004. This error resulted in immaterial misstatements in the Company’s reported income tax provision for the year ended December 26, 2004. We have historically provided US deferred income taxes on the undistributed earnings of certain of our foreign subsidiaries. During 2005, we assessed our corporate financing position with respect to all our foreign subsidiaries. As a result, we have elected to treat our portion of all foreign subsidiary earnings through December 25, 2005 as permanently reinvested. Under the accounting guidance of APB 23 and SFAS 109, “Accounting for Income Taxes,” we recorded a tax provision benefit in the third quarter of 2005 totaling $44 million, representing the reversal of a previously established deferred tax liability to our UK subsidiary. As of December 25, 2005, approximately $255 million of retained earnings attributable to international companies was considered to be indefinitely invested. The Company’s intention is to reinvest the indefinitely invested earnings permanently or to repatriate the earnings when it is tax effective to do so. It is not practicable to determine the amount of incremental taxes that might arise were these earnings to be remitted. However, the Company believes that US foreign tax credits would largely eliminate any US taxes and offset any foreign withholding taxes due on remittance. On October 22, 2004, the President signed the American Jobs Creation Act of 2004 (the “Jobs Act”). The Jobs Act provides a deduction for income from qualified domestic production activities, which will be phased in from 2005 through 2010. In return, the Jobs Act also provides for a two-year phase-out of the existing extra-territorial income exclusion (ETI) for foreign sales that was viewed to be inconsistent with international trade protocols by the European Union. The net effect of the phase-out of the ETI and the phase-in of this new deduction did not materially impact the Company’s effective tax rate in 2005. In addition to the deduction for income from qualified domestic production activities, the Jobs Act also creates a temporary incentive for US corporations to repatriate accumulated income earned abroad by providing an 85 percent dividends received deduction for certain dividends from controlled foreign corporations. The deduction is subject to a number of limitations, which resulted in the Company not recognizing a benefit from this provision of the Jobs Act, and as such, not repatriating any of these foreign earnings.
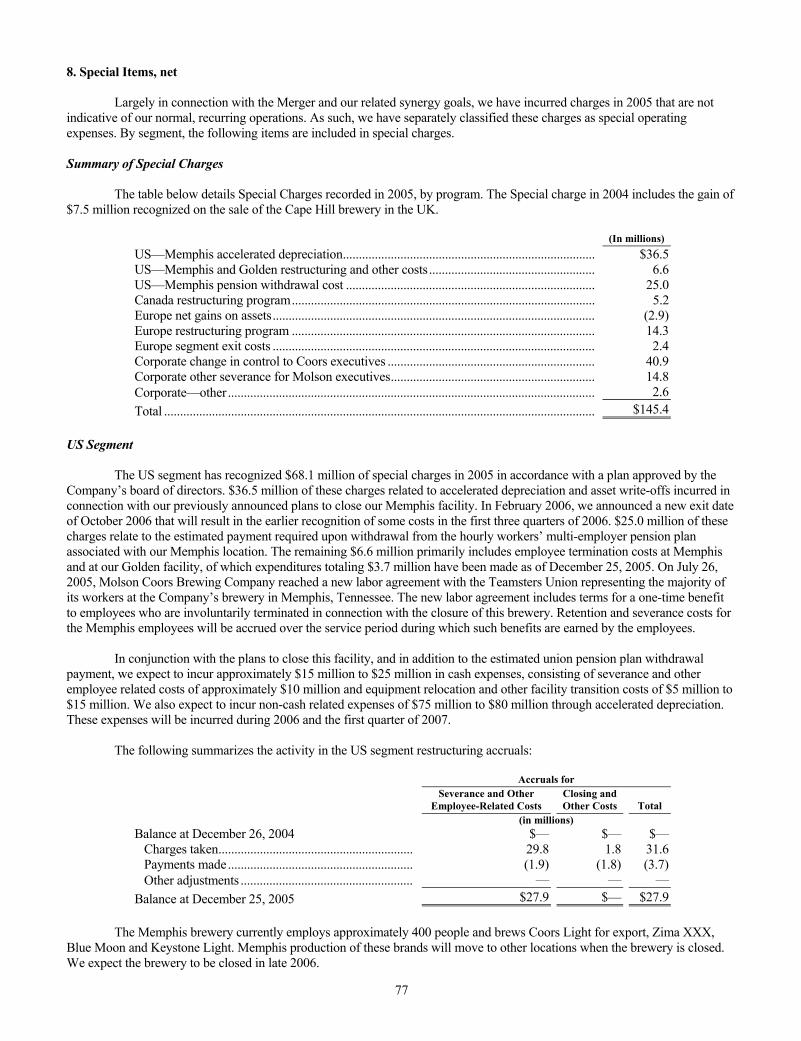
77
8. Special Items, net Largely in connection with the Merger and our related synergy goals, we have incurred charges in 2005 that are not indicative of our normal, recurring operations. As such, we have separately classified these charges as special operating expenses. By segment, the following items are included in special charges. Summary of Special Charges The table below details Special Charges recorded in 2005, by program. The Special charge in 2004 includes the gain of $7.5 million recognized on the sale of the Cape Hill brewery in the UK.
(In millions) US—Memphis accelerated depreciation............................................................................... $36.5US—Memphis and Golden restructuring and other costs.................................................... 6.6US—Memphis pension withdrawal cost .............................................................................. 25.0Canada restructuring program............................................................................................... 5.2Europe net gains on assets..................................................................................................... (2.9)Europe restructuring program ............................................................................................... 14.3Europe segment exit costs ..................................................................................................... 2.4Corporate change in control to Coors executives ................................................................. 40.9Corporate other severance for Molson executives................................................................ 14.8Corporate—other................................................................................................................... 2.6Total ....................................................................................................................................... $145.4
US Segment The US segment has recognized $68.1 million of special charges in 2005 in accordance with a plan approved by the Company’s board of directors. $36.5 million of these charges related to accelerated depreciation and asset write-offs incurred in connection with our previously announced plans to close our Memphis facility. In February 2006, we announced a new exit date of October 2006 that will result in the earlier recognition of some costs in the first three quarters of 2006. $25.0 million of these charges relate to the estimated payment required upon withdrawal from the hourly workers’ multi-employer pension plan associated with our Memphis location. The remaining $6.6 million primarily includes employee termination costs at Memphis and at our Golden facility, of which expenditures totaling $3.7 million have been made as of December 25, 2005. On July 26, 2005, Molson Coors Brewing Company reached a new labor agreement with the Teamsters Union representing the majority of its workers at the Company’s brewery in Memphis, Tennessee. The new labor agreement includes terms for a one-time benefit to employees who are involuntarily terminated in connection with the closure of this brewery. Retention and severance costs for the Memphis employees will be accrued over the service period during which such benefits are earned by the employees. In conjunction with the plans to close this facility, and in addition to the estimated union pension plan withdrawal payment, we expect to incur approximately $15 million to $25 million in cash expenses, consisting of severance and other employee related costs of approximately $10 million and equipment relocation and other facility transition costs of $5 million to $15 million. We also expect to incur non-cash related expenses of $75 million to $80 million through accelerated depreciation. These expenses will be incurred during 2006 and the first quarter of 2007. The following summarizes the activity in the US segment restructuring accruals:
Accruals for
Severance and Other
Employee-Related Costs Closing and Other Costs Total
(in millions) Balance at December 26, 2004 $— $— $—
Charges taken............................................................. 29.8 1.8 31.6Payments made.......................................................... (1.9) (1.8) (3.7)Other adjustments ...................................................... — — —
Balance at December 25, 2005 $27.9 $— $27.9 The Memphis brewery currently employs approximately 400 people and brews Coors Light for export, Zima XXX, Blue Moon and Keystone Light. Memphis production of these brands will move to other locations when the brewery is closed. We expect the brewery to be closed in late 2006.
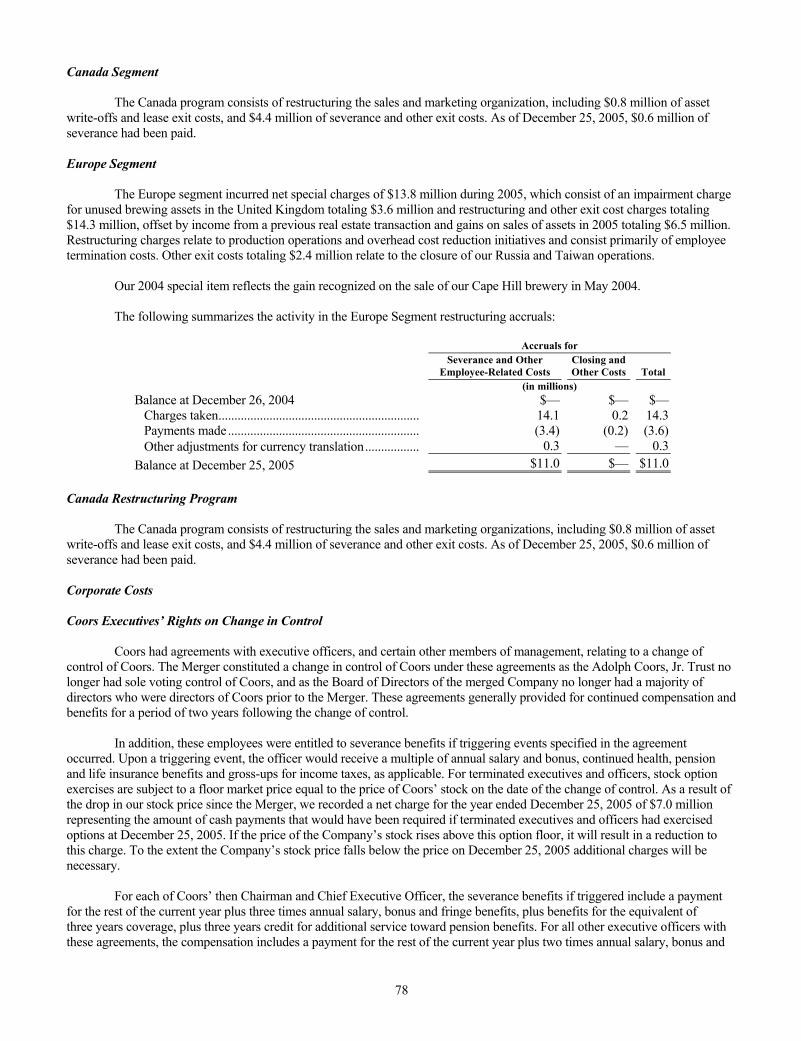
78
Canada Segment The Canada program consists of restructuring the sales and marketing organization, including $0.8 million of asset write-offs and lease exit costs, and $4.4 million of severance and other exit costs. As of December 25, 2005, $0.6 million of severance had been paid. Europe Segment The Europe segment incurred net special charges of $13.8 million during 2005, which consist of an impairment charge for unused brewing assets in the United Kingdom totaling $3.6 million and restructuring and other exit cost charges totaling $14.3 million, offset by income from a previous real estate transaction and gains on sales of assets in 2005 totaling $6.5 million. Restructuring charges relate to production operations and overhead cost reduction initiatives and consist primarily of employee termination costs. Other exit costs totaling $2.4 million relate to the closure of our Russia and Taiwan operations. Our 2004 special item reflects the gain recognized on the sale of our Cape Hill brewery in May 2004. The following summarizes the activity in the Europe Segment restructuring accruals:
Accruals for
Severance and Other
Employee-Related Costs Closing and Other Costs Total
(in millions) Balance at December 26, 2004 $— $— $—
Charges taken............................................................... 14.1 0.2 14.3Payments made............................................................ (3.4) (0.2) (3.6)Other adjustments for currency translation................. 0.3 — 0.3
Balance at December 25, 2005 $11.0 $— $11.0 Canada Restructuring Program The Canada program consists of restructuring the sales and marketing organizations, including $0.8 million of asset write-offs and lease exit costs, and $4.4 million of severance and other exit costs. As of December 25, 2005, $0.6 million of severance had been paid. Corporate Costs Coors Executives’ Rights on Change in Control Coors had agreements with executive officers, and certain other members of management, relating to a change of control of Coors. The Merger constituted a change in control of Coors under these agreements as the Adolph Coors, Jr. Trust no longer had sole voting control of Coors, and as the Board of Directors of the merged Company no longer had a majority of directors who were directors of Coors prior to the Merger. These agreements generally provided for continued compensation and benefits for a period of two years following the change of control. In addition, these employees were entitled to severance benefits if triggering events specified in the agreement occurred. Upon a triggering event, the officer would receive a multiple of annual salary and bonus, continued health, pension and life insurance benefits and gross-ups for income taxes, as applicable. For terminated executives and officers, stock option exercises are subject to a floor market price equal to the price of Coors’ stock on the date of the change of control. As a result of the drop in our stock price since the Merger, we recorded a net charge for the year ended December 25, 2005 of $7.0 million representing the amount of cash payments that would have been required if terminated executives and officers had exercised options at December 25, 2005. If the price of the Company’s stock rises above this option floor, it will result in a reduction to this charge. To the extent the Company’s stock price falls below the price on December 25, 2005 additional charges will be necessary. For each of Coors’ then Chairman and Chief Executive Officer, the severance benefits if triggered include a payment for the rest of the current year plus three times annual salary, bonus and fringe benefits, plus benefits for the equivalent of three years coverage, plus three years credit for additional service toward pension benefits. For all other executive officers with these agreements, the compensation includes a payment for the rest of the current year plus two times annual salary, bonus and
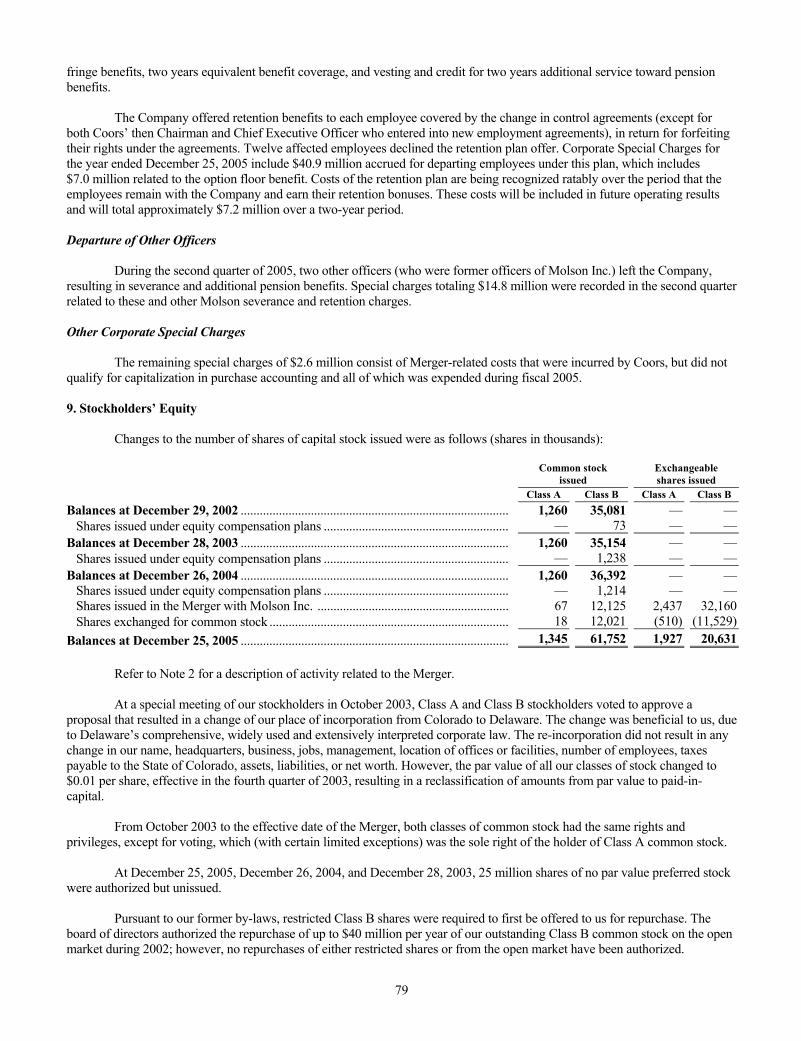
79
fringe benefits, two years equivalent benefit coverage, and vesting and credit for two years additional service toward pension benefits. The Company offered retention benefits to each employee covered by the change in control agreements (except for both Coors’ then Chairman and Chief Executive Officer who entered into new employment agreements), in return for forfeiting their rights under the agreements. Twelve affected employees declined the retention plan offer. Corporate Special Charges for the year ended December 25, 2005 include $40.9 million accrued for departing employees under this plan, which includes $7.0 million related to the option floor benefit. Costs of the retention plan are being recognized ratably over the period that the employees remain with the Company and earn their retention bonuses. These costs will be included in future operating results and will total approximately $7.2 million over a two-year period. Departure of Other Officers During the second quarter of 2005, two other officers (who were former officers of Molson Inc.) left the Company, resulting in severance and additional pension benefits. Special charges totaling $14.8 million were recorded in the second quarter related to these and other Molson severance and retention charges. Other Corporate Special Charges The remaining special charges of $2.6 million consist of Merger-related costs that were incurred by Coors, but did not qualify for capitalization in purchase accounting and all of which was expended during fiscal 2005. 9. Stockholders’ Equity Changes to the number of shares of capital stock issued were as follows (shares in thousands):
Common stock
issued Exchangeable shares issued
Class A Class B Class A Class B Balances at December 29, 2002 .................................................................................... 1,260 35,081 — —
Shares issued under equity compensation plans .......................................................... — 73 — —Balances at December 28, 2003 .................................................................................... 1,260 35,154 — —
Shares issued under equity compensation plans .......................................................... — 1,238 — —Balances at December 26, 2004 .................................................................................... 1,260 36,392 — —
Shares issued under equity compensation plans .......................................................... — 1,214 — —Shares issued in the Merger with Molson Inc. ............................................................ 67 12,125 2,437 32,160Shares exchanged for common stock ........................................................................... 18 12,021 (510) (11,529)
Balances at December 25, 2005 .................................................................................... 1,345 61,752 1,927 20,631 Refer to Note 2 for a description of activity related to the Merger. At a special meeting of our stockholders in October 2003, Class A and Class B stockholders voted to approve a proposal that resulted in a change of our place of incorporation from Colorado to Delaware. The change was beneficial to us, due to Delaware’s comprehensive, widely used and extensively interpreted corporate law. The re-incorporation did not result in any change in our name, headquarters, business, jobs, management, location of offices or facilities, number of employees, taxes payable to the State of Colorado, assets, liabilities, or net worth. However, the par value of all our classes of stock changed to $0.01 per share, effective in the fourth quarter of 2003, resulting in a reclassification of amounts from par value to paid-in-capital. From October 2003 to the effective date of the Merger, both classes of common stock had the same rights and privileges, except for voting, which (with certain limited exceptions) was the sole right of the holder of Class A common stock. At December 25, 2005, December 26, 2004, and December 28, 2003, 25 million shares of no par value preferred stock were authorized but unissued. Pursuant to our former by-laws, restricted Class B shares were required to first be offered to us for repurchase. The board of directors authorized the repurchase of up to $40 million per year of our outstanding Class B common stock on the open market during 2002; however, no repurchases of either restricted shares or from the open market have been authorized.
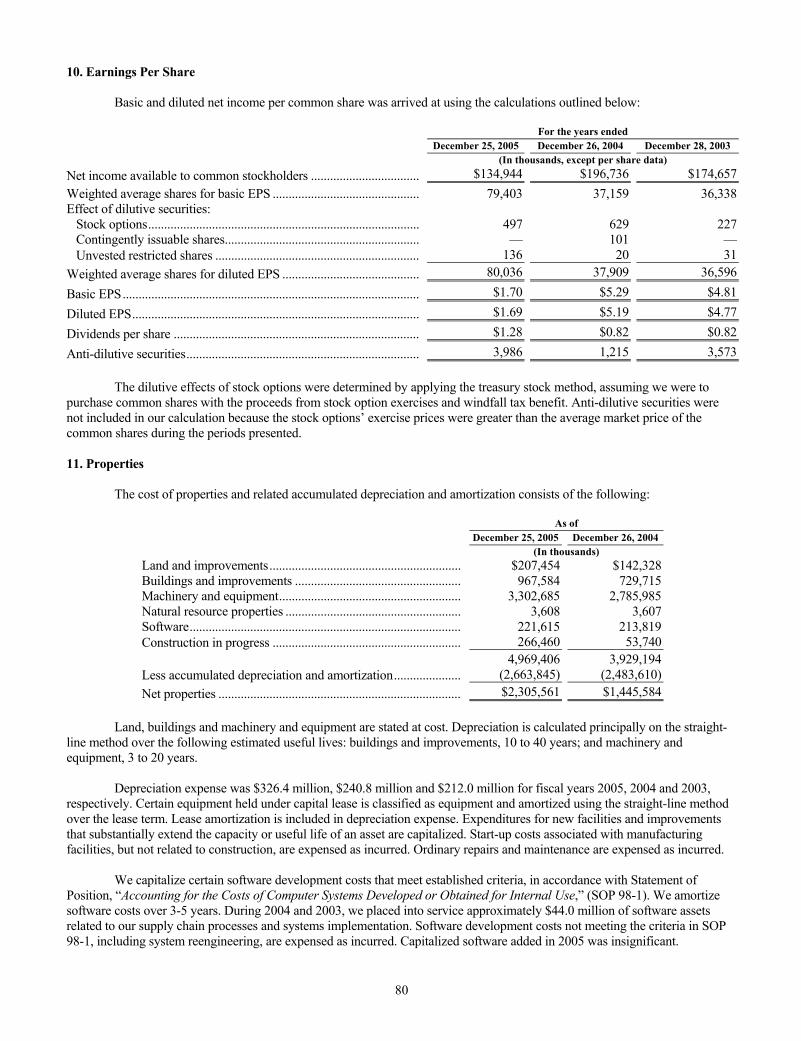
80
10. Earnings Per Share Basic and diluted net income per common share was arrived at using the calculations outlined below: For the years ended December 25, 2005 December 26, 2004 December 28, 2003 (In thousands, except per share data) Net income available to common stockholders .................................. $134,944 $196,736 $174,657Weighted average shares for basic EPS .............................................. 79,403 37,159 36,338Effect of dilutive securities:
Stock options..................................................................................... 497 629 227Contingently issuable shares............................................................. — 101 —Unvested restricted shares ................................................................ 136 20 31
Weighted average shares for diluted EPS ........................................... 80,036 37,909 36,596
Basic EPS............................................................................................. $1.70 $5.29 $4.81
Diluted EPS.......................................................................................... $1.69 $5.19 $4.77
Dividends per share ............................................................................. $1.28 $0.82 $0.82
Anti-dilutive securities......................................................................... 3,986 1,215 3,573 The dilutive effects of stock options were determined by applying the treasury stock method, assuming we were to purchase common shares with the proceeds from stock option exercises and windfall tax benefit. Anti-dilutive securities were not included in our calculation because the stock options’ exercise prices were greater than the average market price of the common shares during the periods presented. 11. Properties The cost of properties and related accumulated depreciation and amortization consists of the following:
As of December 25, 2005 December 26, 2004 (In thousands) Land and improvements............................................................ $207,454 $142,328Buildings and improvements .................................................... 967,584 729,715Machinery and equipment......................................................... 3,302,685 2,785,985Natural resource properties ....................................................... 3,608 3,607Software..................................................................................... 221,615 213,819Construction in progress ........................................................... 266,460 53,740 4,969,406 3,929,194Less accumulated depreciation and amortization..................... (2,663,845) (2,483,610)Net properties ............................................................................ $2,305,561 $1,445,584
Land, buildings and machinery and equipment are stated at cost. Depreciation is calculated principally on the straight-line method over the following estimated useful lives: buildings and improvements, 10 to 40 years; and machinery and equipment, 3 to 20 years. Depreciation expense was $326.4 million, $240.8 million and $212.0 million for fiscal years 2005, 2004 and 2003, respectively. Certain equipment held under capital lease is classified as equipment and amortized using the straight-line method over the lease term. Lease amortization is included in depreciation expense. Expenditures for new facilities and improvements that substantially extend the capacity or useful life of an asset are capitalized. Start-up costs associated with manufacturing facilities, but not related to construction, are expensed as incurred. Ordinary repairs and maintenance are expensed as incurred. We capitalize certain software development costs that meet established criteria, in accordance with Statement of Position, “Accounting for the Costs of Computer Systems Developed or Obtained for Internal Use,” (SOP 98-1). We amortize software costs over 3-5 years. During 2004 and 2003, we placed into service approximately $44.0 million of software assets related to our supply chain processes and systems implementation. Software development costs not meeting the criteria in SOP 98-1, including system reengineering, are expensed as incurred. Capitalized software added in 2005 was insignificant.
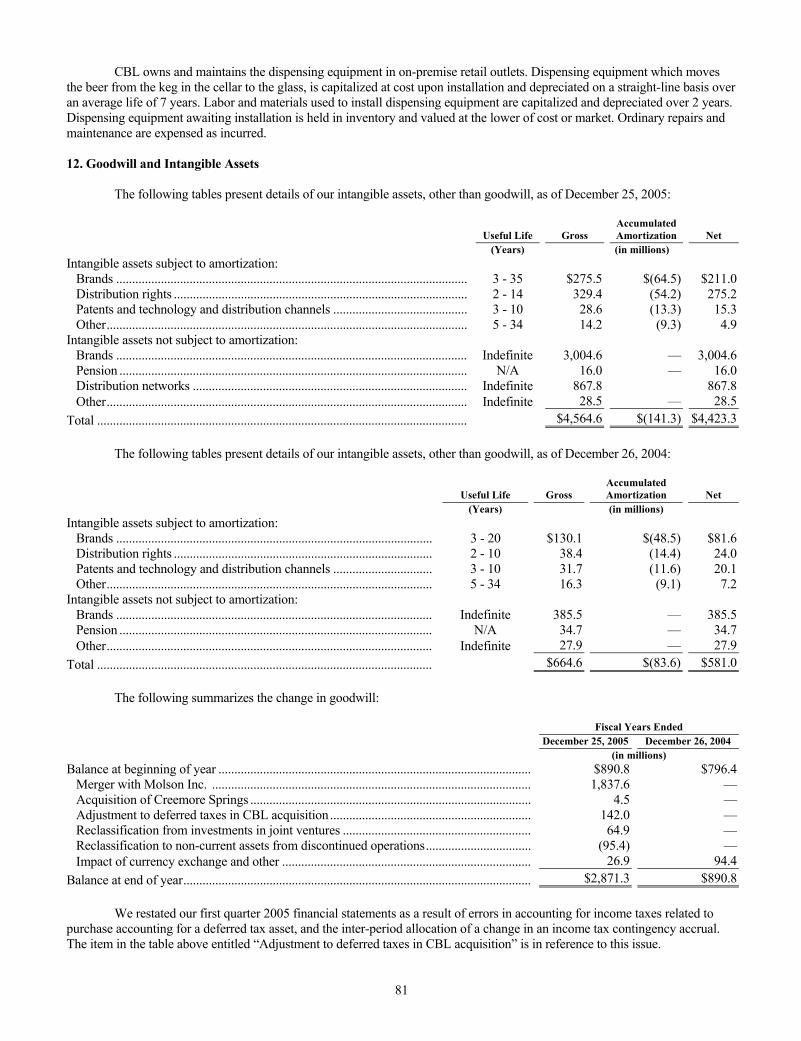
81
CBL owns and maintains the dispensing equipment in on-premise retail outlets. Dispensing equipment which moves the beer from the keg in the cellar to the glass, is capitalized at cost upon installation and depreciated on a straight-line basis over an average life of 7 years. Labor and materials used to install dispensing equipment are capitalized and depreciated over 2 years. Dispensing equipment awaiting installation is held in inventory and valued at the lower of cost or market. Ordinary repairs and maintenance are expensed as incurred. 12. Goodwill and Intangible Assets The following tables present details of our intangible assets, other than goodwill, as of December 25, 2005:
Useful Life Gross AccumulatedAmortization Net
(Years) (in millions) Intangible assets subject to amortization:
Brands .............................................................................................................. 3 - 35 $275.5 $(64.5) $211.0Distribution rights ............................................................................................ 2 - 14 329.4 (54.2) 275.2Patents and technology and distribution channels .......................................... 3 - 10 28.6 (13.3) 15.3Other................................................................................................................. 5 - 34 14.2 (9.3) 4.9
Intangible assets not subject to amortization: Brands .............................................................................................................. Indefinite 3,004.6 — 3,004.6Pension ............................................................................................................. N/A 16.0 — 16.0Distribution networks ...................................................................................... Indefinite 867.8 867.8Other................................................................................................................. Indefinite 28.5 — 28.5
Total .................................................................................................................... $4,564.6 $(141.3) $4,423.3 The following tables present details of our intangible assets, other than goodwill, as of December 26, 2004:
Useful Life Gross Accumulated Amortization Net
(Years) (in millions) Intangible assets subject to amortization:
Brands ................................................................................................... 3 - 20 $130.1 $(48.5) $81.6Distribution rights ................................................................................. 2 - 10 38.4 (14.4) 24.0Patents and technology and distribution channels ............................... 3 - 10 31.7 (11.6) 20.1Other...................................................................................................... 5 - 34 16.3 (9.1) 7.2
Intangible assets not subject to amortization: Brands ................................................................................................... Indefinite 385.5 — 385.5Pension .................................................................................................. N/A 34.7 — 34.7Other...................................................................................................... Indefinite 27.9 — 27.9
Total ......................................................................................................... $664.6 $(83.6) $581.0 The following summarizes the change in goodwill: Fiscal Years Ended December 25, 2005 December 26, 2004 (in millions) Balance at beginning of year .................................................................................................. $890.8 $796.4
Merger with Molson Inc. .................................................................................................... 1,837.6 —Acquisition of Creemore Springs ........................................................................................ 4.5 —Adjustment to deferred taxes in CBL acquisition ............................................................... 142.0 —Reclassification from investments in joint ventures ........................................................... 64.9 —Reclassification to non-current assets from discontinued operations................................. (95.4) —Impact of currency exchange and other .............................................................................. 26.9 94.4
Balance at end of year............................................................................................................. $2,871.3 $890.8 We restated our first quarter 2005 financial statements as a result of errors in accounting for income taxes related to purchase accounting for a deferred tax asset, and the inter-period allocation of a change in an income tax contingency accrual. The item in the table above entitled “Adjustment to deferred taxes in CBL acquisition” is in reference to this issue.

82
During the second quarter of 2005, we acquired Creemore Springs Brewery, Ltd. for cash of $16.6 million. The purchase included a small brewing facility in Canada and the Creemore Springs brand, which is included in our Canada segment brand portfolio. The acquisition resulted in the addition of $12.8 million of brand intangible assets and $4.5 million of goodwill. Prior to the Merger, we classified $64.9 million of goodwill associated with our investment in the Molson USA joint venture, previously accounted for under the equity method, in investments in joint ventures on the balance sheet. Molson USA became a wholly-owned subsidiary at the time of the Merger and the amount was reclassified to goodwill associated with the US segment. As of December 25, 2005, our Kaiser business in Brazil was classified as a discontinued operation. As a result, we reclassified goodwill associated with Kaiser, originally recognized through the Merger with Molson Inc., to non-current assets from discontinued operations. Based on foreign exchange rates as of December 25, 2005, the estimated future amortization expense of intangible assets is as follows:
Fiscal Year Amount (In millions) 2006............................................................................................................................ $71.42007............................................................................................................................ $71.42008............................................................................................................................ $71.42009............................................................................................................................ $65.32010............................................................................................................................ $50.0
Amortization expense of intangible assets was $66.4 million, $25.1 million and $22.2 million for the years ended December 25, 2005, December 26, 2004 and December 28, 2003 respectively. As of December 25, 2005, goodwill was allocated between our reportable segments as follows. We do not have reporting units below the segment level:
Segment Amount (In millions) United States.......................................................................................................................... $1,347.6Europe.................................................................................................................................... 791.1Canada ................................................................................................................................... 732.6Total ....................................................................................................................................... $2,871.3
As discussed in Note 2, we allocated $1.8 billion to goodwill as a result of the Merger. See Note 2 for the detailed listing of values assigned to intangibles and goodwill resulting from the Merger. Goodwill created by the Merger amounting to $1.1 billion has been allocated to the US segment based upon projections that a large portion of synergy cost savings will benefit that business unit. In addition, $140.9 million of goodwill associated with the 2002 acquisition of CBL has been allocated to the US segment, also based on expected synergy savings at the time of the acquisition.
SFAS 142 stipulates that we are required to perform goodwill and other intangible asset impairment tests on at least an annual basis and more frequently in certain circumstances. We completed the required impairment testing of goodwill and other intangible assets under SFAS 142 during the third quarter of 2005 and determined that no goodwill or other intangible asset was impaired.
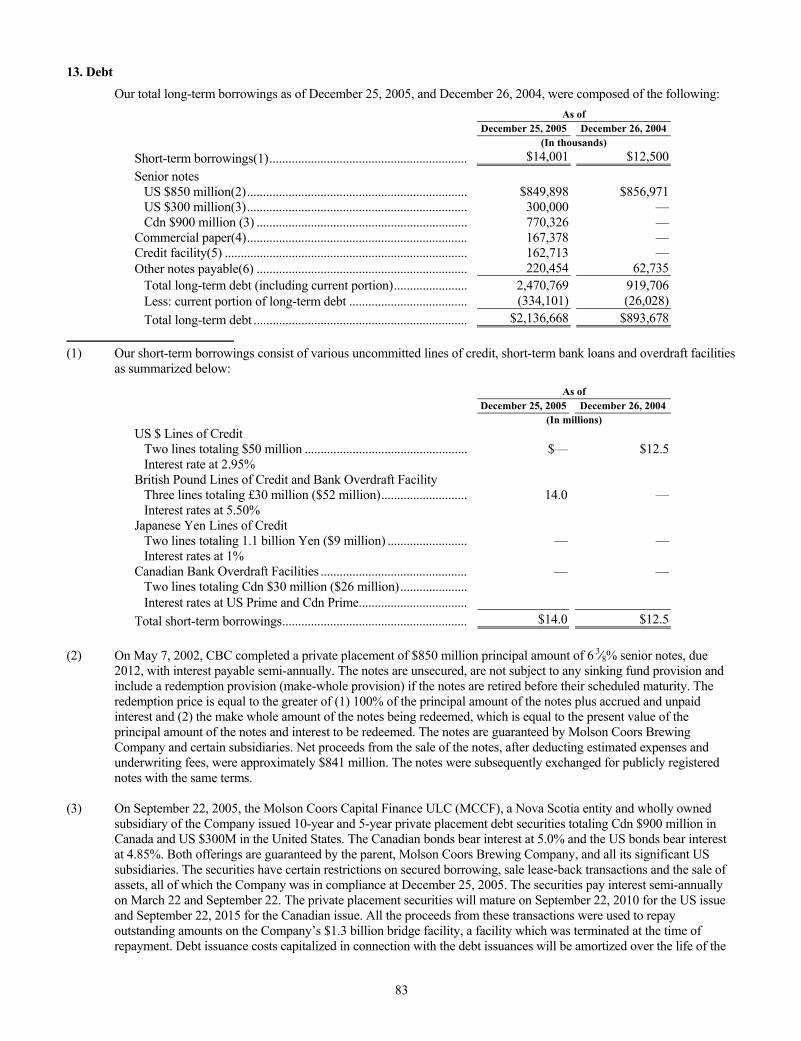
83
13. Debt
Our total long-term borrowings as of December 25, 2005, and December 26, 2004, were composed of the following: As of December 25, 2005 December 26, 2004 (In thousands) Short-term borrowings(1).............................................................. $14,001 $12,500Senior notes
US $850 million(2)..................................................................... $849,898 $856,971US $300 million(3)..................................................................... 300,000 —Cdn $900 million (3) .................................................................. 770,326 —
Commercial paper(4)..................................................................... 167,378 —Credit facility(5) ............................................................................ 162,713 —Other notes payable(6) .................................................................. 220,454 62,735
Total long-term debt (including current portion)....................... 2,470,769 919,706Less: current portion of long-term debt ..................................... (334,101) (26,028)Total long-term debt ................................................................... $2,136,668 $893,678
(1) Our short-term borrowings consist of various uncommitted lines of credit, short-term bank loans and overdraft facilities
as summarized below:
As of December 25, 2005 December 26, 2004 (In millions) US $ Lines of Credit
Two lines totaling $50 million ................................................... $— $12.5Interest rate at 2.95%
British Pound Lines of Credit and Bank Overdraft Facility Three lines totaling £30 million ($52 million)........................... 14.0 —Interest rates at 5.50%
Japanese Yen Lines of Credit Two lines totaling 1.1 billion Yen ($9 million) ......................... — —Interest rates at 1%
Canadian Bank Overdraft Facilities .............................................. — —Two lines totaling Cdn $30 million ($26 million)..................... Interest rates at US Prime and Cdn Prime..................................
Total short-term borrowings.......................................................... $14.0 $12.5 (2) On May 7, 2002, CBC completed a private placement of $850 million principal amount of 6 3⁄8% senior notes, due
2012, with interest payable semi-annually. The notes are unsecured, are not subject to any sinking fund provision and include a redemption provision (make-whole provision) if the notes are retired before their scheduled maturity. The redemption price is equal to the greater of (1) 100% of the principal amount of the notes plus accrued and unpaid interest and (2) the make whole amount of the notes being redeemed, which is equal to the present value of the principal amount of the notes and interest to be redeemed. The notes are guaranteed by Molson Coors Brewing Company and certain subsidiaries. Net proceeds from the sale of the notes, after deducting estimated expenses and underwriting fees, were approximately $841 million. The notes were subsequently exchanged for publicly registered notes with the same terms.
(3) On September 22, 2005, the Molson Coors Capital Finance ULC (MCCF), a Nova Scotia entity and wholly owned
subsidiary of the Company issued 10-year and 5-year private placement debt securities totaling Cdn $900 million in Canada and US $300M in the United States. The Canadian bonds bear interest at 5.0% and the US bonds bear interest at 4.85%. Both offerings are guaranteed by the parent, Molson Coors Brewing Company, and all its significant US subsidiaries. The securities have certain restrictions on secured borrowing, sale lease-back transactions and the sale of assets, all of which the Company was in compliance at December 25, 2005. The securities pay interest semi-annually on March 22 and September 22. The private placement securities will mature on September 22, 2010 for the US issue and September 22, 2015 for the Canadian issue. All the proceeds from these transactions were used to repay outstanding amounts on the Company’s $1.3 billion bridge facility, a facility which was terminated at the time of repayment. Debt issuance costs capitalized in connection with the debt issuances will be amortized over the life of the
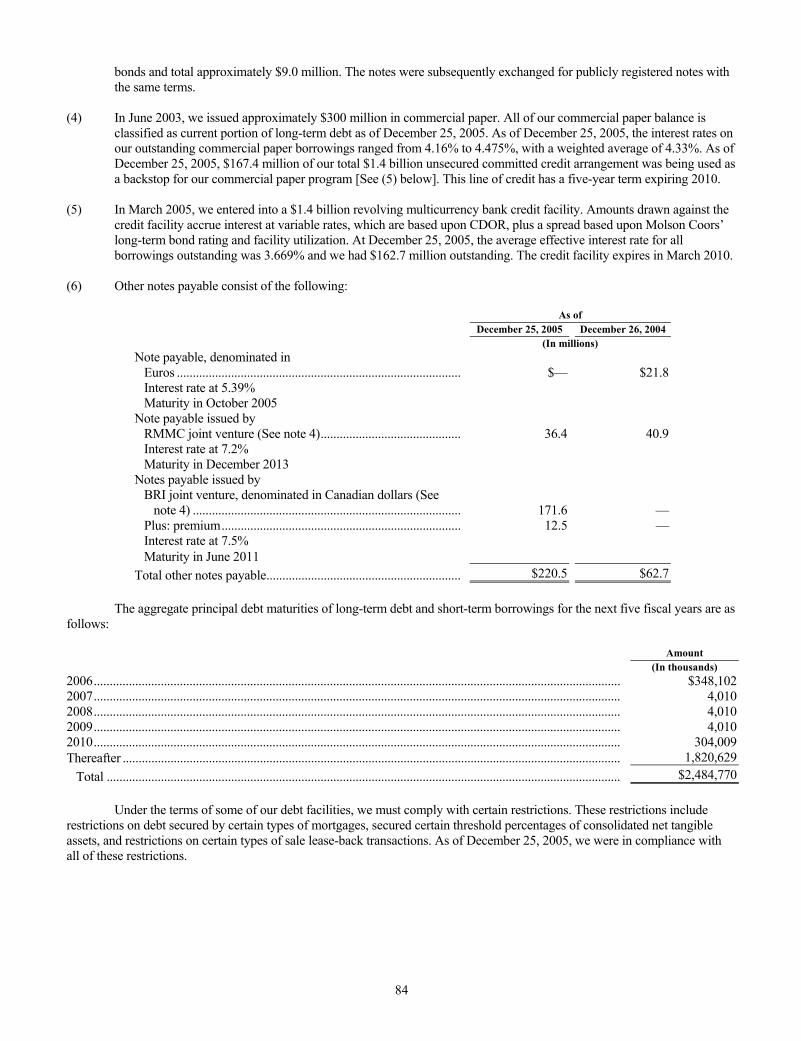
84
bonds and total approximately $9.0 million. The notes were subsequently exchanged for publicly registered notes with the same terms.
(4) In June 2003, we issued approximately $300 million in commercial paper. All of our commercial paper balance is
classified as current portion of long-term debt as of December 25, 2005. As of December 25, 2005, the interest rates on our outstanding commercial paper borrowings ranged from 4.16% to 4.475%, with a weighted average of 4.33%. As of December 25, 2005, $167.4 million of our total $1.4 billion unsecured committed credit arrangement was being used as a backstop for our commercial paper program [See (5) below]. This line of credit has a five-year term expiring 2010.
(5) In March 2005, we entered into a $1.4 billion revolving multicurrency bank credit facility. Amounts drawn against the
credit facility accrue interest at variable rates, which are based upon CDOR, plus a spread based upon Molson Coors’ long-term bond rating and facility utilization. At December 25, 2005, the average effective interest rate for all borrowings outstanding was 3.669% and we had $162.7 million outstanding. The credit facility expires in March 2010.
(6) Other notes payable consist of the following:
As of December 25, 2005 December 26, 2004 (In millions) Note payable, denominated in
Euros ......................................................................................... $— $21.8Interest rate at 5.39% Maturity in October 2005
Note payable issued by RMMC joint venture (See note 4)............................................ 36.4 40.9Interest rate at 7.2% Maturity in December 2013
Notes payable issued by BRI joint venture, denominated in Canadian dollars (See
note 4) .................................................................................... 171.6 —Plus: premium........................................................................... 12.5 —Interest rate at 7.5% Maturity in June 2011
Total other notes payable............................................................. $220.5 $62.7 The aggregate principal debt maturities of long-term debt and short-term borrowings for the next five fiscal years are as follows: Amount (In thousands) 2006..................................................................................................................................................................... $348,1022007..................................................................................................................................................................... 4,0102008..................................................................................................................................................................... 4,0102009..................................................................................................................................................................... 4,0102010..................................................................................................................................................................... 304,009Thereafter ............................................................................................................................................................ 1,820,629
Total ................................................................................................................................................................. $2,484,770 Under the terms of some of our debt facilities, we must comply with certain restrictions. These restrictions include restrictions on debt secured by certain types of mortgages, secured certain threshold percentages of consolidated net tangible assets, and restrictions on certain types of sale lease-back transactions. As of December 25, 2005, we were in compliance with all of these restrictions.
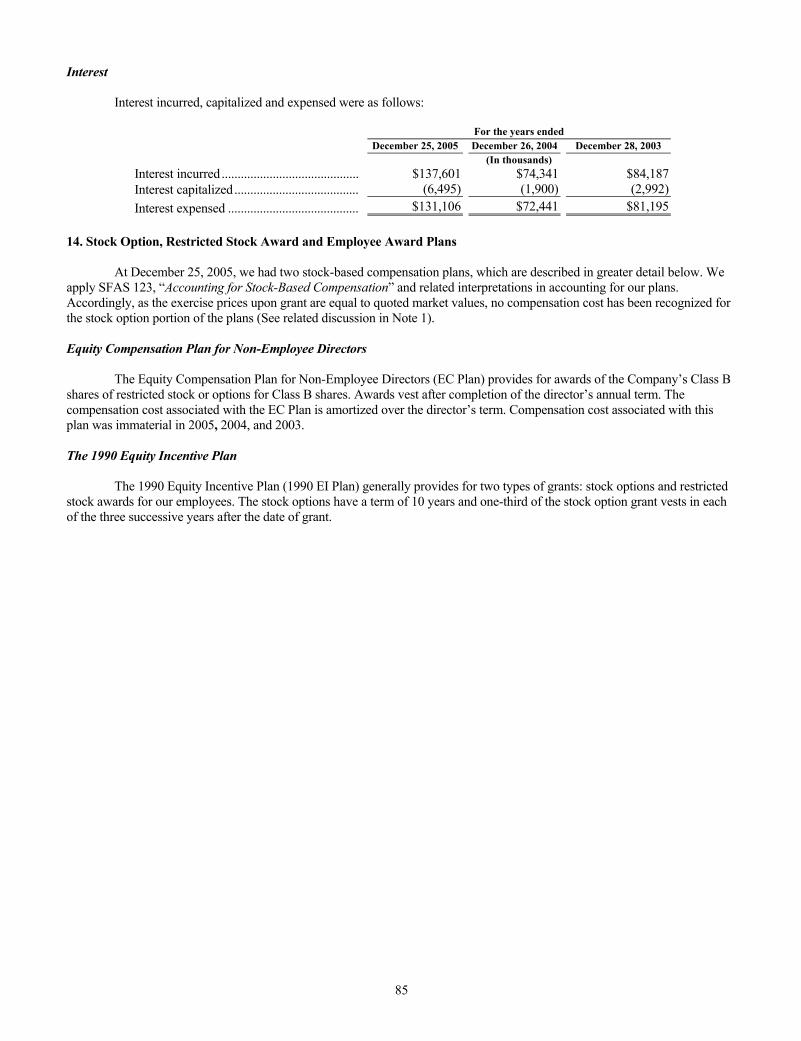
85
Interest Interest incurred, capitalized and expensed were as follows:
For the years ended December 25, 2005 December 26, 2004 December 28, 2003 (In thousands) Interest incurred........................................... $137,601 $74,341 $84,187Interest capitalized....................................... (6,495) (1,900) (2,992)Interest expensed ......................................... $131,106 $72,441 $81,195
14. Stock Option, Restricted Stock Award and Employee Award Plans At December 25, 2005, we had two stock-based compensation plans, which are described in greater detail below. We apply SFAS 123, “Accounting for Stock-Based Compensation” and related interpretations in accounting for our plans. Accordingly, as the exercise prices upon grant are equal to quoted market values, no compensation cost has been recognized for the stock option portion of the plans (See related discussion in Note 1). Equity Compensation Plan for Non-Employee Directors The Equity Compensation Plan for Non-Employee Directors (EC Plan) provides for awards of the Company’s Class B shares of restricted stock or options for Class B shares. Awards vest after completion of the director’s annual term. The compensation cost associated with the EC Plan is amortized over the director’s term. Compensation cost associated with this plan was immaterial in 2005, 2004, and 2003. The 1990 Equity Incentive Plan The 1990 Equity Incentive Plan (1990 EI Plan) generally provides for two types of grants: stock options and restricted stock awards for our employees. The stock options have a term of 10 years and one-third of the stock option grant vests in each of the three successive years after the date of grant.
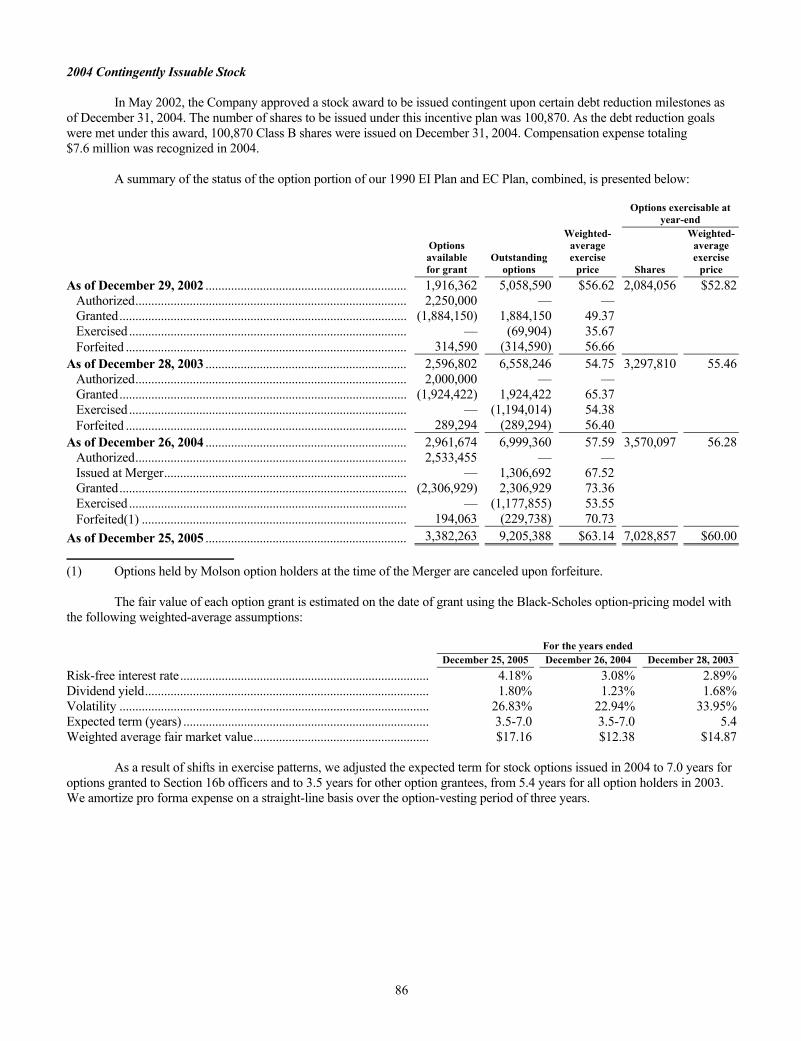
86
2004 Contingently Issuable Stock In May 2002, the Company approved a stock award to be issued contingent upon certain debt reduction milestones as of December 31, 2004. The number of shares to be issued under this incentive plan was 100,870. As the debt reduction goals were met under this award, 100,870 Class B shares were issued on December 31, 2004. Compensation expense totaling $7.6 million was recognized in 2004. A summary of the status of the option portion of our 1990 EI Plan and EC Plan, combined, is presented below:
Options exercisable at
year-end
Options available for grant
Outstandingoptions
Weighted- average exercise
price Shares
Weighted-average exercise
price As of December 29, 2002 ............................................................... 1,916,362 5,058,590 $56.62 2,084,056 $52.82
Authorized..................................................................................... 2,250,000 — — Granted.......................................................................................... (1,884,150) 1,884,150 49.37 Exercised....................................................................................... — (69,904) 35.67 Forfeited ........................................................................................ 314,590 (314,590) 56.66
As of December 28, 2003 ............................................................... 2,596,802 6,558,246 54.75 3,297,810 55.46Authorized..................................................................................... 2,000,000 — — Granted.......................................................................................... (1,924,422) 1,924,422 65.37 Exercised....................................................................................... — (1,194,014) 54.38 Forfeited ........................................................................................ 289,294 (289,294) 56.40
As of December 26, 2004 ............................................................... 2,961,674 6,999,360 57.59 3,570,097 56.28Authorized..................................................................................... 2,533,455 — — Issued at Merger............................................................................ — 1,306,692 67.52 Granted.......................................................................................... (2,306,929) 2,306,929 73.36 Exercised....................................................................................... — (1,177,855) 53.55 Forfeited(1) ................................................................................... 194,063 (229,738) 70.73
As of December 25, 2005 ............................................................... 3,382,263 9,205,388 $63.14 7,028,857 $60.00
(1) Options held by Molson option holders at the time of the Merger are canceled upon forfeiture. The fair value of each option grant is estimated on the date of grant using the Black-Scholes option-pricing model with the following weighted-average assumptions: For the years ended December 25, 2005 December 26, 2004 December 28, 2003 Risk-free interest rate.............................................................................. 4.18% 3.08% 2.89%Dividend yield......................................................................................... 1.80% 1.23% 1.68%Volatility ................................................................................................. 26.83% 22.94% 33.95%Expected term (years) ............................................................................. 3.5-7.0 3.5-7.0 5.4Weighted average fair market value....................................................... $17.16 $12.38 $14.87 As a result of shifts in exercise patterns, we adjusted the expected term for stock options issued in 2004 to 7.0 years for options granted to Section 16b officers and to 3.5 years for other option grantees, from 5.4 years for all option holders in 2003. We amortize pro forma expense on a straight-line basis over the option-vesting period of three years.
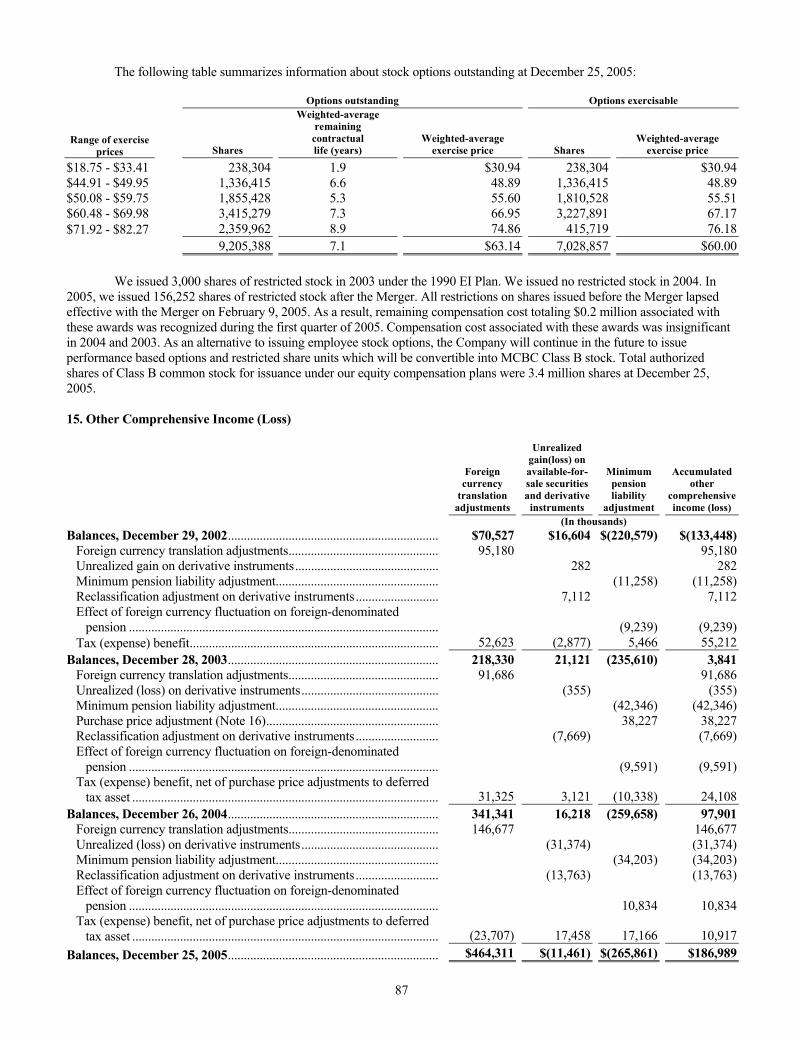
87
The following table summarizes information about stock options outstanding at December 25, 2005: Options outstanding Options exercisable
Range of exercise prices Shares
Weighted-average remaining
contractual life (years)
Weighted-average exercise price Shares
Weighted-average exercise price
$18.75 - $33.41 238,304 1.9 $30.94 238,304 $30.94$44.91 - $49.95 1,336,415 6.6 48.89 1,336,415 48.89$50.08 - $59.75 1,855,428 5.3 55.60 1,810,528 55.51$60.48 - $69.98 3,415,279 7.3 66.95 3,227,891 67.17$71.92 - $82.27 2,359,962 8.9 74.86 415,719 76.18 9,205,388 7.1 $63.14 7,028,857 $60.00 We issued 3,000 shares of restricted stock in 2003 under the 1990 EI Plan. We issued no restricted stock in 2004. In 2005, we issued 156,252 shares of restricted stock after the Merger. All restrictions on shares issued before the Merger lapsed effective with the Merger on February 9, 2005. As a result, remaining compensation cost totaling $0.2 million associated with these awards was recognized during the first quarter of 2005. Compensation cost associated with these awards was insignificant in 2004 and 2003. As an alternative to issuing employee stock options, the Company will continue in the future to issue performance based options and restricted share units which will be convertible into MCBC Class B stock. Total authorized shares of Class B common stock for issuance under our equity compensation plans were 3.4 million shares at December 25, 2005. 15. Other Comprehensive Income (Loss)
Foreign currency
translation adjustments
Unrealized gain(loss) on available-for- sale securities and derivative
instruments
Minimum pension liability
adjustment
Accumulatedother
comprehensiveincome (loss)
(In thousands) Balances, December 29, 2002.................................................................. $70,527 $16,604 $(220,579) $(133,448)
Foreign currency translation adjustments............................................... 95,180 95,180Unrealized gain on derivative instruments............................................. 282 282Minimum pension liability adjustment................................................... (11,258) (11,258)Reclassification adjustment on derivative instruments.......................... 7,112 7,112Effect of foreign currency fluctuation on foreign-denominated
pension ................................................................................................. (9,239) (9,239)Tax (expense) benefit.............................................................................. 52,623 (2,877) 5,466 55,212
Balances, December 28, 2003.................................................................. 218,330 21,121 (235,610) 3,841Foreign currency translation adjustments............................................... 91,686 91,686Unrealized (loss) on derivative instruments........................................... (355) (355)Minimum pension liability adjustment................................................... (42,346) (42,346)Purchase price adjustment (Note 16)...................................................... 38,227 38,227Reclassification adjustment on derivative instruments.......................... (7,669) (7,669)Effect of foreign currency fluctuation on foreign-denominated
pension ................................................................................................. (9,591) (9,591)Tax (expense) benefit, net of purchase price adjustments to deferred
tax asset ................................................................................................ 31,325 3,121 (10,338) 24,108Balances, December 26, 2004.................................................................. 341,341 16,218 (259,658) 97,901
Foreign currency translation adjustments............................................... 146,677 146,677Unrealized (loss) on derivative instruments........................................... (31,374) (31,374)Minimum pension liability adjustment................................................... (34,203) (34,203)Reclassification adjustment on derivative instruments.......................... (13,763) (13,763)Effect of foreign currency fluctuation on foreign-denominated
pension ................................................................................................. 10,834 10,834Tax (expense) benefit, net of purchase price adjustments to deferred
tax asset ................................................................................................ (23,707) 17,458 17,166 10,917Balances, December 25, 2005.................................................................. $464,311 $(11,461) $(265,861) $186,989
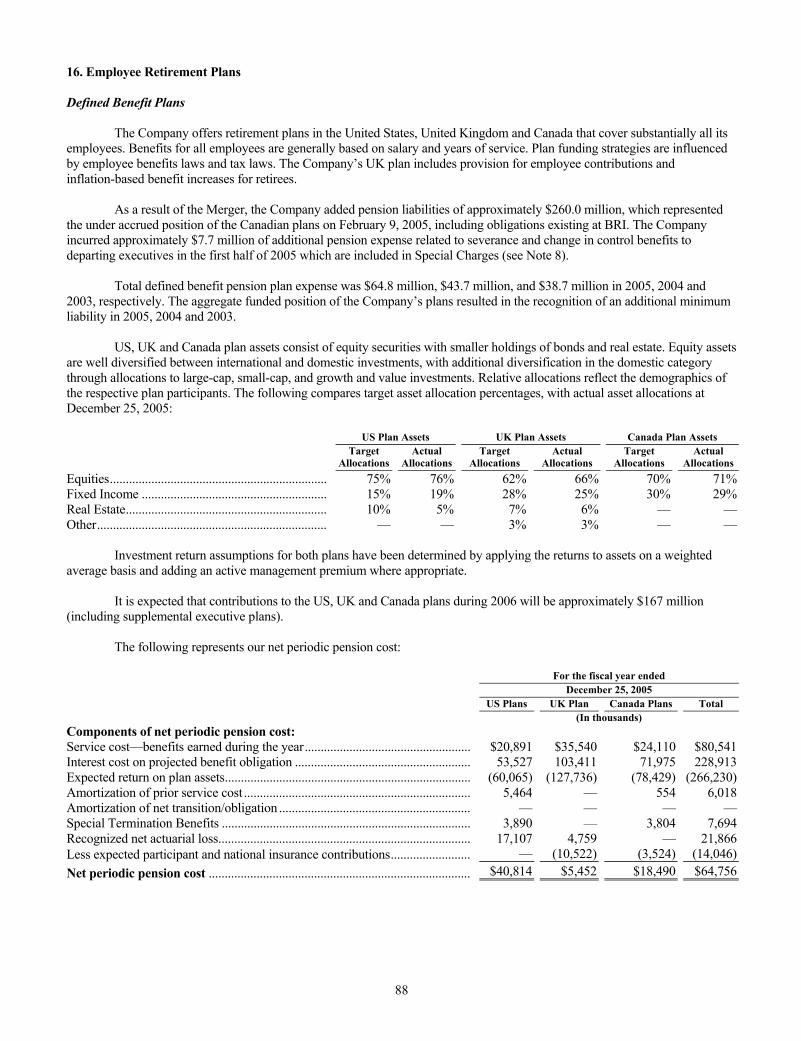
88
16. Employee Retirement Plans Defined Benefit Plans The Company offers retirement plans in the United States, United Kingdom and Canada that cover substantially all its employees. Benefits for all employees are generally based on salary and years of service. Plan funding strategies are influenced by employee benefits laws and tax laws. The Company’s UK plan includes provision for employee contributions and inflation-based benefit increases for retirees. As a result of the Merger, the Company added pension liabilities of approximately $260.0 million, which represented the under accrued position of the Canadian plans on February 9, 2005, including obligations existing at BRI. The Company incurred approximately $7.7 million of additional pension expense related to severance and change in control benefits to departing executives in the first half of 2005 which are included in Special Charges (see Note 8). Total defined benefit pension plan expense was $64.8 million, $43.7 million, and $38.7 million in 2005, 2004 and 2003, respectively. The aggregate funded position of the Company’s plans resulted in the recognition of an additional minimum liability in 2005, 2004 and 2003. US, UK and Canada plan assets consist of equity securities with smaller holdings of bonds and real estate. Equity assets are well diversified between international and domestic investments, with additional diversification in the domestic category through allocations to large-cap, small-cap, and growth and value investments. Relative allocations reflect the demographics of the respective plan participants. The following compares target asset allocation percentages, with actual asset allocations at December 25, 2005: US Plan Assets UK Plan Assets Canada Plan Assets
Target
Allocations Actual
Allocations Target
Allocations Actual
Allocations Target
Allocations Actual
Allocations Equities.................................................................... 75% 76% 62% 66% 70% 71%Fixed Income .......................................................... 15% 19% 28% 25% 30% 29%Real Estate............................................................... 10% 5% 7% 6% — —Other........................................................................ — — 3% 3% — — Investment return assumptions for both plans have been determined by applying the returns to assets on a weighted average basis and adding an active management premium where appropriate. It is expected that contributions to the US, UK and Canada plans during 2006 will be approximately $167 million (including supplemental executive plans). The following represents our net periodic pension cost: For the fiscal year ended December 25, 2005 US Plans UK Plan Canada Plans Total (In thousands) Components of net periodic pension cost: Service cost—benefits earned during the year.................................................... $20,891 $35,540 $24,110 $80,541Interest cost on projected benefit obligation ....................................................... 53,527 103,411 71,975 228,913Expected return on plan assets............................................................................. (60,065) (127,736) (78,429) (266,230)Amortization of prior service cost ....................................................................... 5,464 — 554 6,018Amortization of net transition/obligation ............................................................ — — — —Special Termination Benefits .............................................................................. 3,890 — 3,804 7,694Recognized net actuarial loss............................................................................... 17,107 4,759 — 21,866Less expected participant and national insurance contributions......................... — (10,522) (3,524) (14,046)Net periodic pension cost .................................................................................. $40,814 $5,452 $18,490 $64,756
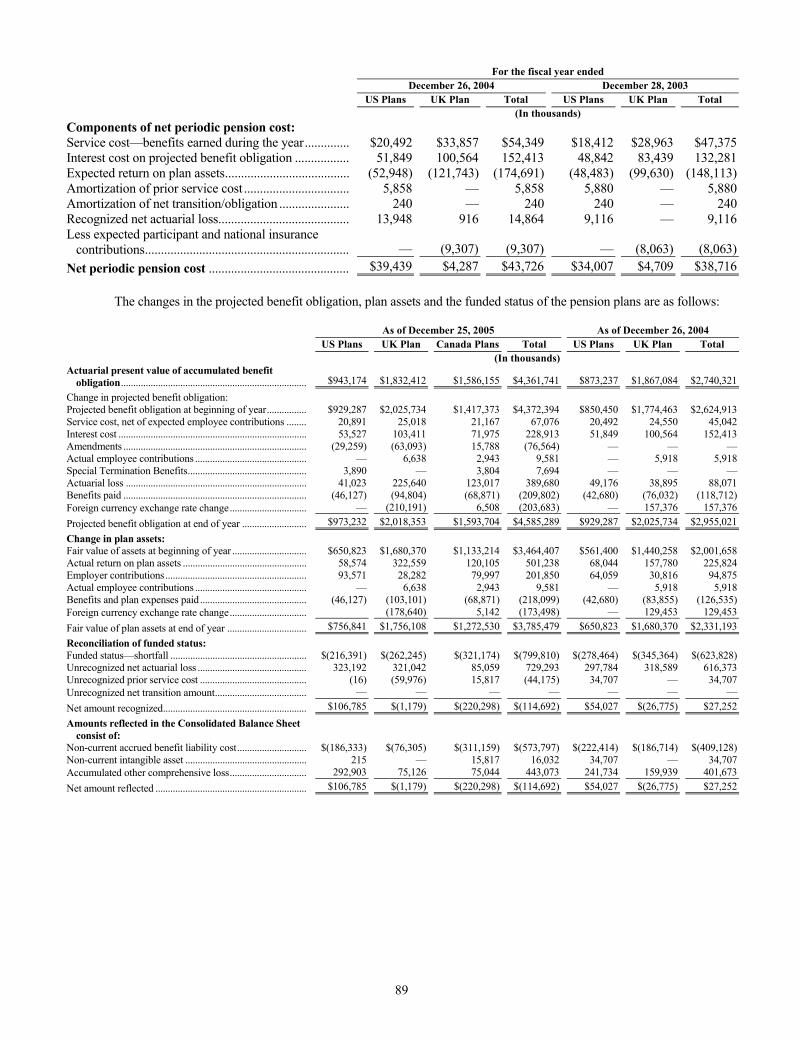
89
For the fiscal year ended December 26, 2004 December 28, 2003 US Plans UK Plan Total US Plans UK Plan Total (In thousands) Components of net periodic pension cost: Service cost—benefits earned during the year.............. $20,492 $33,857 $54,349 $18,412 $28,963 $47,375Interest cost on projected benefit obligation ................. 51,849 100,564 152,413 48,842 83,439 132,281Expected return on plan assets....................................... (52,948) (121,743) (174,691) (48,483) (99,630) (148,113)Amortization of prior service cost ................................. 5,858 — 5,858 5,880 — 5,880Amortization of net transition/obligation ...................... 240 — 240 240 — 240Recognized net actuarial loss......................................... 13,948 916 14,864 9,116 — 9,116Less expected participant and national insurance
contributions................................................................ — (9,307) (9,307) — (8,063) (8,063)Net periodic pension cost ............................................ $39,439 $4,287 $43,726 $34,007 $4,709 $38,716 The changes in the projected benefit obligation, plan assets and the funded status of the pension plans are as follows: As of December 25, 2005 As of December 26, 2004 US Plans UK Plan Canada Plans Total US Plans UK Plan Total (In thousands) Actuarial present value of accumulated benefit
obligation........................................................................... $943,174 $1,832,412 $1,586,155 $4,361,741 $873,237 $1,867,084 $2,740,321Change in projected benefit obligation: Projected benefit obligation at beginning of year................ $929,287 $2,025,734 $1,417,373 $4,372,394 $850,450 $1,774,463 $2,624,913Service cost, net of expected employee contributions ........ 20,891 25,018 21,167 67,076 20,492 24,550 45,042Interest cost ............................................................................ 53,527 103,411 71,975 228,913 51,849 100,564 152,413Amendments .......................................................................... (29,259) (63,093) 15,788 (76,564) — — —Actual employee contributions ............................................. — 6,638 2,943 9,581 — 5,918 5,918Special Termination Benefits................................................ 3,890 — 3,804 7,694 — — —Actuarial loss ......................................................................... 41,023 225,640 123,017 389,680 49,176 38,895 88,071Benefits paid .......................................................................... (46,127) (94,804) (68,871) (209,802) (42,680) (76,032) (118,712)Foreign currency exchange rate change............................... — (210,191) 6,508 (203,683) — 157,376 157,376Projected benefit obligation at end of year .......................... $973,232 $2,018,353 $1,593,704 $4,585,289 $929,287 $2,025,734 $2,955,021Change in plan assets: Fair value of assets at beginning of year .............................. $650,823 $1,680,370 $1,133,214 $3,464,407 $561,400 $1,440,258 $2,001,658Actual return on plan assets .................................................. 58,574 322,559 120,105 501,238 68,044 157,780 225,824Employer contributions......................................................... 93,571 28,282 79,997 201,850 64,059 30,816 94,875Actual employee contributions ............................................. — 6,638 2,943 9,581 — 5,918 5,918Benefits and plan expenses paid........................................... (46,127) (103,101) (68,871) (218,099) (42,680) (83,855) (126,535)Foreign currency exchange rate change............................... (178,640) 5,142 (173,498) — 129,453 129,453Fair value of plan assets at end of year ................................ $756,841 $1,756,108 $1,272,530 $3,785,479 $650,823 $1,680,370 $2,331,193Reconciliation of funded status: Funded status—shortfall ....................................................... $(216,391) $(262,245) $(321,174) $(799,810) $(278,464) $(345,364) $(623,828)Unrecognized net actuarial loss ............................................ 323,192 321,042 85,059 729,293 297,784 318,589 616,373Unrecognized prior service cost ........................................... (16) (59,976) 15,817 (44,175) 34,707 — 34,707Unrecognized net transition amount..................................... — — — — — — —Net amount recognized.......................................................... $106,785 $(1,179) $(220,298) $(114,692) $54,027 $(26,775) $27,252Amounts reflected in the Consolidated Balance Sheet
consist of: Non-current accrued benefit liability cost............................ $(186,333) $(76,305) $(311,159) $(573,797) $(222,414) $(186,714) $(409,128)Non-current intangible asset ................................................. 215 — 15,817 16,032 34,707 — 34,707Accumulated other comprehensive loss............................... 292,903 75,126 75,044 443,073 241,734 159,939 401,673Net amount reflected ............................................................. $106,785 $(1,179) $(220,298) $(114,692) $54,027 $(26,775) $27,252
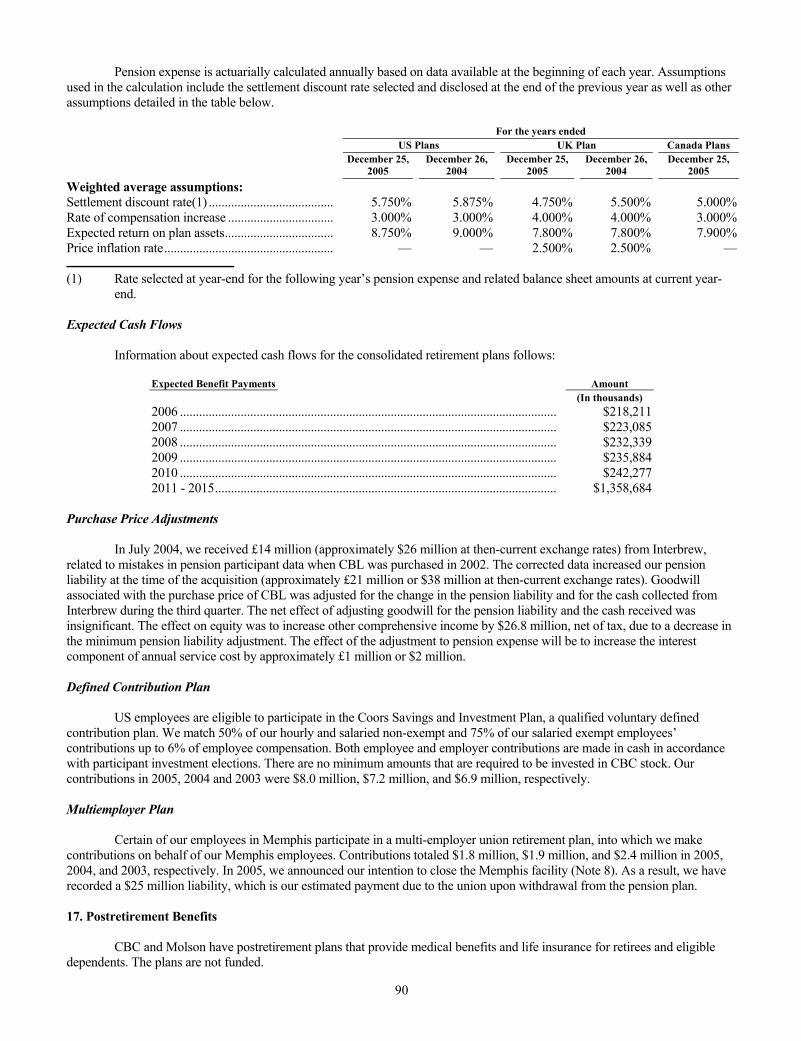
90
Pension expense is actuarially calculated annually based on data available at the beginning of each year. Assumptions used in the calculation include the settlement discount rate selected and disclosed at the end of the previous year as well as other assumptions detailed in the table below. For the years ended US Plans UK Plan Canada Plans
December 25,
2005 December 26,
2004 December 25,
2005 December 26,
2004 December 25,
2005 Weighted average assumptions: Settlement discount rate(1) ....................................... 5.750% 5.875% 4.750% 5.500% 5.000%Rate of compensation increase ................................. 3.000% 3.000% 4.000% 4.000% 3.000%Expected return on plan assets.................................. 8.750% 9.000% 7.800% 7.800% 7.900%Price inflation rate..................................................... — — 2.500% 2.500% —
(1) Rate selected at year-end for the following year’s pension expense and related balance sheet amounts at current year-
end. Expected Cash Flows Information about expected cash flows for the consolidated retirement plans follows:
Expected Benefit Payments Amount (In thousands) 2006 ...................................................................................................................... $218,2112007 ...................................................................................................................... $223,0852008 ...................................................................................................................... $232,3392009 ...................................................................................................................... $235,8842010 ...................................................................................................................... $242,2772011 - 2015........................................................................................................... $1,358,684
Purchase Price Adjustments In July 2004, we received £14 million (approximately $26 million at then-current exchange rates) from Interbrew, related to mistakes in pension participant data when CBL was purchased in 2002. The corrected data increased our pension liability at the time of the acquisition (approximately £21 million or $38 million at then-current exchange rates). Goodwill associated with the purchase price of CBL was adjusted for the change in the pension liability and for the cash collected from Interbrew during the third quarter. The net effect of adjusting goodwill for the pension liability and the cash received was insignificant. The effect on equity was to increase other comprehensive income by $26.8 million, net of tax, due to a decrease in the minimum pension liability adjustment. The effect of the adjustment to pension expense will be to increase the interest component of annual service cost by approximately £1 million or $2 million. Defined Contribution Plan US employees are eligible to participate in the Coors Savings and Investment Plan, a qualified voluntary defined contribution plan. We match 50% of our hourly and salaried non-exempt and 75% of our salaried exempt employees’ contributions up to 6% of employee compensation. Both employee and employer contributions are made in cash in accordance with participant investment elections. There are no minimum amounts that are required to be invested in CBC stock. Our contributions in 2005, 2004 and 2003 were $8.0 million, $7.2 million, and $6.9 million, respectively. Multiemployer Plan Certain of our employees in Memphis participate in a multi-employer union retirement plan, into which we make contributions on behalf of our Memphis employees. Contributions totaled $1.8 million, $1.9 million, and $2.4 million in 2005, 2004, and 2003, respectively. In 2005, we announced our intention to close the Memphis facility (Note 8). As a result, we have recorded a $25 million liability, which is our estimated payment due to the union upon withdrawal from the pension plan. 17. Postretirement Benefits CBC and Molson have postretirement plans that provide medical benefits and life insurance for retirees and eligible dependents. The plans are not funded.
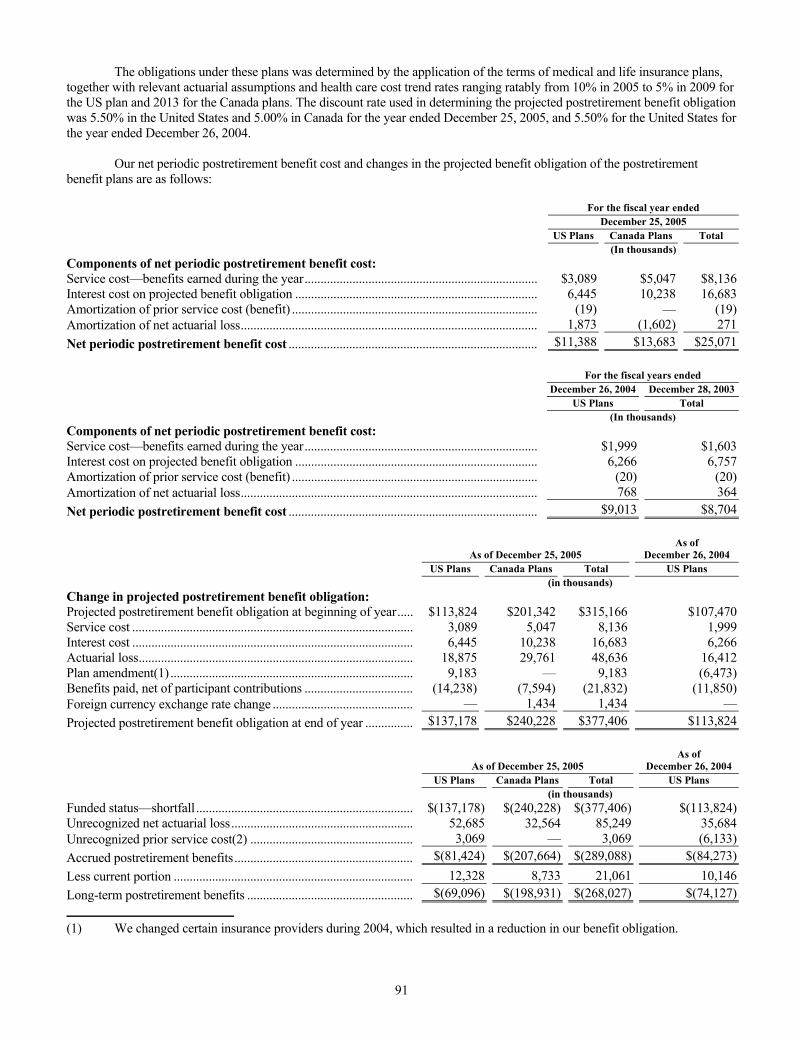
91
The obligations under these plans was determined by the application of the terms of medical and life insurance plans, together with relevant actuarial assumptions and health care cost trend rates ranging ratably from 10% in 2005 to 5% in 2009 for the US plan and 2013 for the Canada plans. The discount rate used in determining the projected postretirement benefit obligation was 5.50% in the United States and 5.00% in Canada for the year ended December 25, 2005, and 5.50% for the United States for the year ended December 26, 2004. Our net periodic postretirement benefit cost and changes in the projected benefit obligation of the postretirement benefit plans are as follows: For the fiscal year ended December 25, 2005 US Plans Canada Plans Total (In thousands) Components of net periodic postretirement benefit cost: Service cost—benefits earned during the year......................................................................... $3,089 $5,047 $8,136Interest cost on projected benefit obligation ............................................................................ 6,445 10,238 16,683Amortization of prior service cost (benefit) ............................................................................. (19) — (19)Amortization of net actuarial loss............................................................................................. 1,873 (1,602) 271Net periodic postretirement benefit cost .............................................................................. $11,388 $13,683 $25,071 For the fiscal years ended December 26, 2004 December 28, 2003 US Plans Total (In thousands) Components of net periodic postretirement benefit cost: Service cost—benefits earned during the year......................................................................... $1,999 $1,603Interest cost on projected benefit obligation ............................................................................ 6,266 6,757Amortization of prior service cost (benefit) ............................................................................. (20) (20)Amortization of net actuarial loss............................................................................................. 768 364Net periodic postretirement benefit cost .............................................................................. $9,013 $8,704
As of December 25, 2005 As of
December 26, 2004 US Plans Canada Plans Total US Plans (in thousands) Change in projected postretirement benefit obligation: Projected postretirement benefit obligation at beginning of year..... $113,824 $201,342 $315,166 $107,470Service cost ........................................................................................ 3,089 5,047 8,136 1,999Interest cost ........................................................................................ 6,445 10,238 16,683 6,266Actuarial loss...................................................................................... 18,875 29,761 48,636 16,412Plan amendment(1) ............................................................................ 9,183 — 9,183 (6,473)Benefits paid, net of participant contributions .................................. (14,238) (7,594) (21,832) (11,850)Foreign currency exchange rate change ............................................ — 1,434 1,434 —Projected postretirement benefit obligation at end of year ............... $137,178 $240,228 $377,406 $113,824
As of December 25, 2005 As of
December 26, 2004 US Plans Canada Plans Total US Plans (in thousands) Funded status—shortfall.................................................................... $(137,178) $(240,228) $(377,406) $(113,824)Unrecognized net actuarial loss......................................................... 52,685 32,564 85,249 35,684Unrecognized prior service cost(2) ................................................... 3,069 — 3,069 (6,133)Accrued postretirement benefits........................................................ $(81,424) $(207,664) $(289,088) $(84,273)Less current portion ........................................................................... 12,328 8,733 21,061 10,146Long-term postretirement benefits .................................................... $(69,096) $(198,931) $(268,027) $(74,127)
(1) We changed certain insurance providers during 2004, which resulted in a reduction in our benefit obligation.
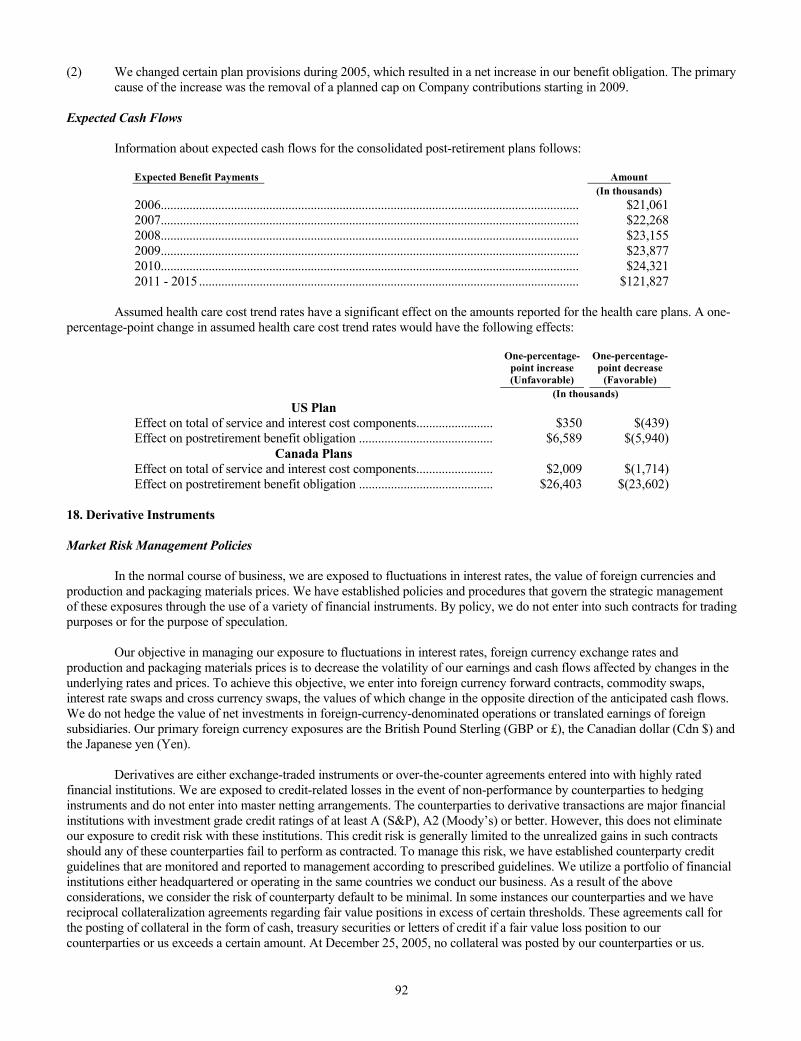
92
(2) We changed certain plan provisions during 2005, which resulted in a net increase in our benefit obligation. The primary cause of the increase was the removal of a planned cap on Company contributions starting in 2009.
Expected Cash Flows Information about expected cash flows for the consolidated post-retirement plans follows:
Expected Benefit Payments Amount (In thousands) 2006................................................................................................................................... $21,0612007................................................................................................................................... $22,2682008................................................................................................................................... $23,1552009................................................................................................................................... $23,8772010................................................................................................................................... $24,3212011 - 2015 ....................................................................................................................... $121,827
Assumed health care cost trend rates have a significant effect on the amounts reported for the health care plans. A one-percentage-point change in assumed health care cost trend rates would have the following effects:
One-percentage- point increase (Unfavorable)
One-percentage-point decrease
(Favorable) (In thousands)
US Plan Effect on total of service and interest cost components........................ $350 $(439)Effect on postretirement benefit obligation .......................................... $6,589 $(5,940)
Canada Plans Effect on total of service and interest cost components........................ $2,009 $(1,714)Effect on postretirement benefit obligation .......................................... $26,403 $(23,602)
18. Derivative Instruments Market Risk Management Policies In the normal course of business, we are exposed to fluctuations in interest rates, the value of foreign currencies and production and packaging materials prices. We have established policies and procedures that govern the strategic management of these exposures through the use of a variety of financial instruments. By policy, we do not enter into such contracts for trading purposes or for the purpose of speculation. Our objective in managing our exposure to fluctuations in interest rates, foreign currency exchange rates and production and packaging materials prices is to decrease the volatility of our earnings and cash flows affected by changes in the underlying rates and prices. To achieve this objective, we enter into foreign currency forward contracts, commodity swaps, interest rate swaps and cross currency swaps, the values of which change in the opposite direction of the anticipated cash flows. We do not hedge the value of net investments in foreign-currency-denominated operations or translated earnings of foreign subsidiaries. Our primary foreign currency exposures are the British Pound Sterling (GBP or £), the Canadian dollar (Cdn $) and the Japanese yen (Yen). Derivatives are either exchange-traded instruments or over-the-counter agreements entered into with highly rated financial institutions. We are exposed to credit-related losses in the event of non-performance by counterparties to hedging instruments and do not enter into master netting arrangements. The counterparties to derivative transactions are major financial institutions with investment grade credit ratings of at least A (S&P), A2 (Moody’s) or better. However, this does not eliminate our exposure to credit risk with these institutions. This credit risk is generally limited to the unrealized gains in such contracts should any of these counterparties fail to perform as contracted. To manage this risk, we have established counterparty credit guidelines that are monitored and reported to management according to prescribed guidelines. We utilize a portfolio of financial institutions either headquartered or operating in the same countries we conduct our business. As a result of the above considerations, we consider the risk of counterparty default to be minimal. In some instances our counterparties and we have reciprocal collateralization agreements regarding fair value positions in excess of certain thresholds. These agreements call for the posting of collateral in the form of cash, treasury securities or letters of credit if a fair value loss position to our counterparties or us exceeds a certain amount. At December 25, 2005, no collateral was posted by our counterparties or us.
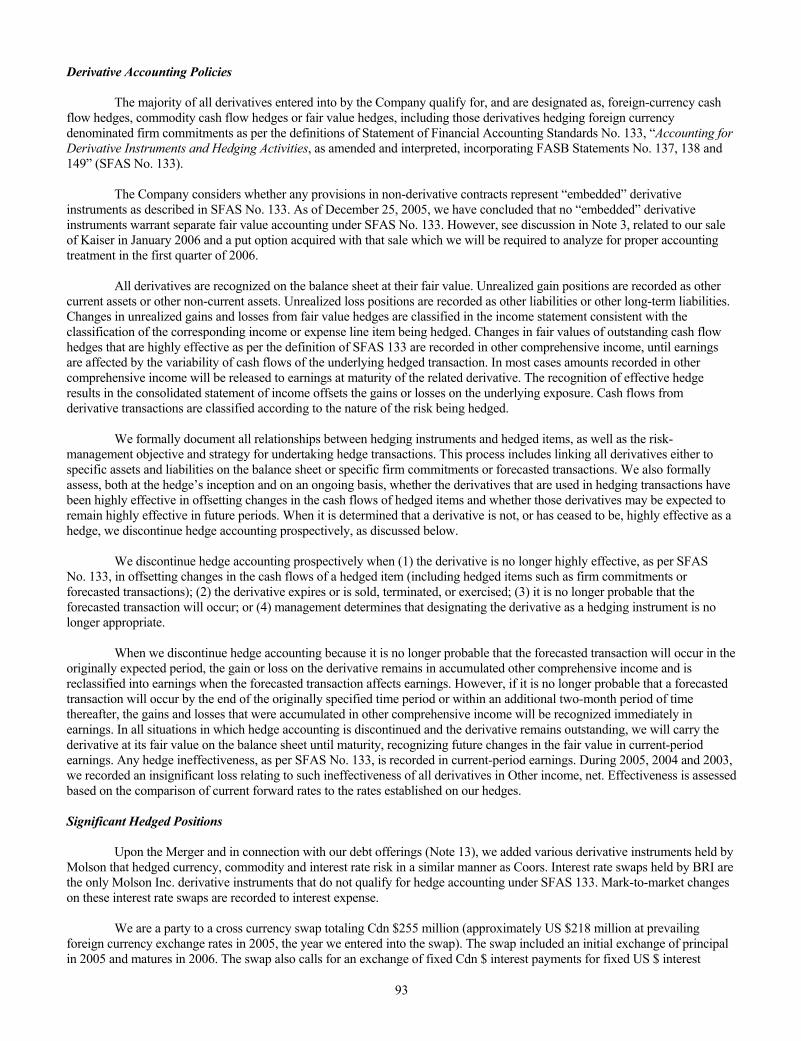
93
Derivative Accounting Policies The majority of all derivatives entered into by the Company qualify for, and are designated as, foreign-currency cash flow hedges, commodity cash flow hedges or fair value hedges, including those derivatives hedging foreign currency denominated firm commitments as per the definitions of Statement of Financial Accounting Standards No. 133, “Accounting for Derivative Instruments and Hedging Activities, as amended and interpreted, incorporating FASB Statements No. 137, 138 and 149” (SFAS No. 133). The Company considers whether any provisions in non-derivative contracts represent “embedded” derivative instruments as described in SFAS No. 133. As of December 25, 2005, we have concluded that no “embedded” derivative instruments warrant separate fair value accounting under SFAS No. 133. However, see discussion in Note 3, related to our sale of Kaiser in January 2006 and a put option acquired with that sale which we will be required to analyze for proper accounting treatment in the first quarter of 2006. All derivatives are recognized on the balance sheet at their fair value. Unrealized gain positions are recorded as other current assets or other non-current assets. Unrealized loss positions are recorded as other liabilities or other long-term liabilities. Changes in unrealized gains and losses from fair value hedges are classified in the income statement consistent with the classification of the corresponding income or expense line item being hedged. Changes in fair values of outstanding cash flow hedges that are highly effective as per the definition of SFAS 133 are recorded in other comprehensive income, until earnings are affected by the variability of cash flows of the underlying hedged transaction. In most cases amounts recorded in other comprehensive income will be released to earnings at maturity of the related derivative. The recognition of effective hedge results in the consolidated statement of income offsets the gains or losses on the underlying exposure. Cash flows from derivative transactions are classified according to the nature of the risk being hedged. We formally document all relationships between hedging instruments and hedged items, as well as the risk-management objective and strategy for undertaking hedge transactions. This process includes linking all derivatives either to specific assets and liabilities on the balance sheet or specific firm commitments or forecasted transactions. We also formally assess, both at the hedge’s inception and on an ongoing basis, whether the derivatives that are used in hedging transactions have been highly effective in offsetting changes in the cash flows of hedged items and whether those derivatives may be expected to remain highly effective in future periods. When it is determined that a derivative is not, or has ceased to be, highly effective as a hedge, we discontinue hedge accounting prospectively, as discussed below. We discontinue hedge accounting prospectively when (1) the derivative is no longer highly effective, as per SFAS No. 133, in offsetting changes in the cash flows of a hedged item (including hedged items such as firm commitments or forecasted transactions); (2) the derivative expires or is sold, terminated, or exercised; (3) it is no longer probable that the forecasted transaction will occur; or (4) management determines that designating the derivative as a hedging instrument is no longer appropriate. When we discontinue hedge accounting because it is no longer probable that the forecasted transaction will occur in the originally expected period, the gain or loss on the derivative remains in accumulated other comprehensive income and is reclassified into earnings when the forecasted transaction affects earnings. However, if it is no longer probable that a forecasted transaction will occur by the end of the originally specified time period or within an additional two-month period of time thereafter, the gains and losses that were accumulated in other comprehensive income will be recognized immediately in earnings. In all situations in which hedge accounting is discontinued and the derivative remains outstanding, we will carry the derivative at its fair value on the balance sheet until maturity, recognizing future changes in the fair value in current-period earnings. Any hedge ineffectiveness, as per SFAS No. 133, is recorded in current-period earnings. During 2005, 2004 and 2003, we recorded an insignificant loss relating to such ineffectiveness of all derivatives in Other income, net. Effectiveness is assessed based on the comparison of current forward rates to the rates established on our hedges. Significant Hedged Positions Upon the Merger and in connection with our debt offerings (Note 13), we added various derivative instruments held by Molson that hedged currency, commodity and interest rate risk in a similar manner as Coors. Interest rate swaps held by BRI are the only Molson Inc. derivative instruments that do not qualify for hedge accounting under SFAS 133. Mark-to-market changes on these interest rate swaps are recorded to interest expense. We are a party to a cross currency swap totaling Cdn $255 million (approximately US $218 million at prevailing foreign currency exchange rates in 2005, the year we entered into the swap). The swap included an initial exchange of principal in 2005 and matures in 2006. The swap also calls for an exchange of fixed Cdn $ interest payments for fixed US $ interest
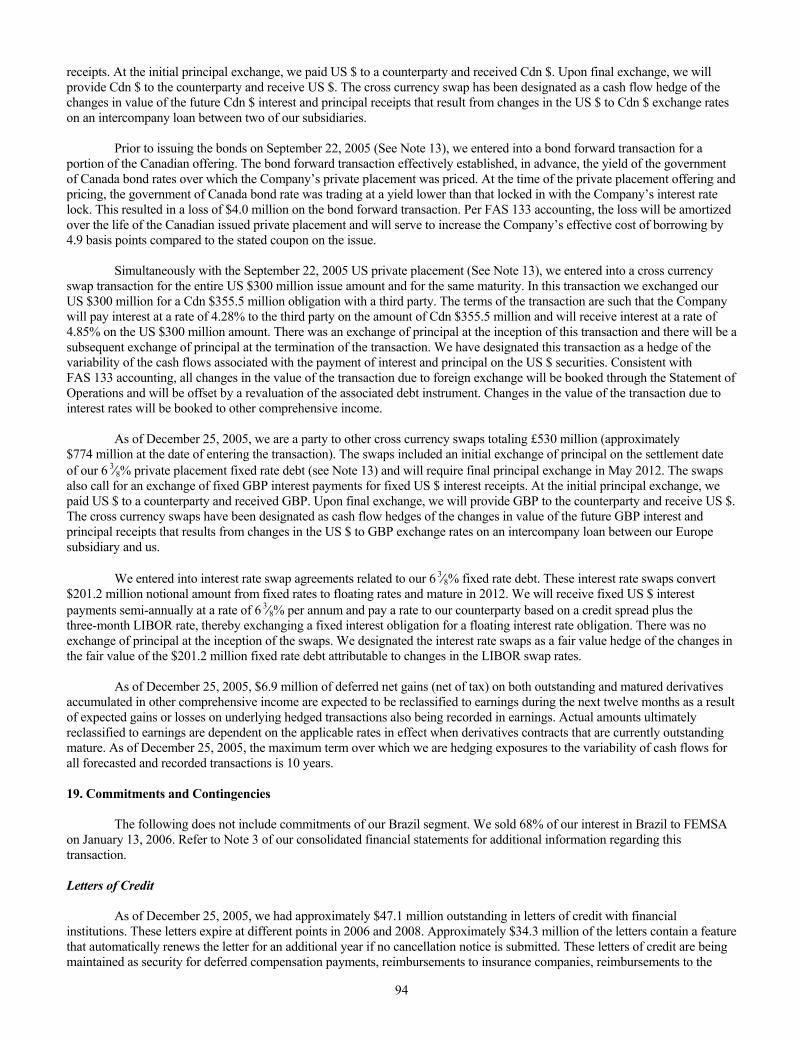
94
receipts. At the initial principal exchange, we paid US $ to a counterparty and received Cdn $. Upon final exchange, we will provide Cdn $ to the counterparty and receive US $. The cross currency swap has been designated as a cash flow hedge of the changes in value of the future Cdn $ interest and principal receipts that result from changes in the US $ to Cdn $ exchange rates on an intercompany loan between two of our subsidiaries. Prior to issuing the bonds on September 22, 2005 (See Note 13), we entered into a bond forward transaction for a portion of the Canadian offering. The bond forward transaction effectively established, in advance, the yield of the government of Canada bond rates over which the Company’s private placement was priced. At the time of the private placement offering and pricing, the government of Canada bond rate was trading at a yield lower than that locked in with the Company’s interest rate lock. This resulted in a loss of $4.0 million on the bond forward transaction. Per FAS 133 accounting, the loss will be amortized over the life of the Canadian issued private placement and will serve to increase the Company’s effective cost of borrowing by 4.9 basis points compared to the stated coupon on the issue. Simultaneously with the September 22, 2005 US private placement (See Note 13), we entered into a cross currency swap transaction for the entire US $300 million issue amount and for the same maturity. In this transaction we exchanged our US $300 million for a Cdn $355.5 million obligation with a third party. The terms of the transaction are such that the Company will pay interest at a rate of 4.28% to the third party on the amount of Cdn $355.5 million and will receive interest at a rate of 4.85% on the US $300 million amount. There was an exchange of principal at the inception of this transaction and there will be a subsequent exchange of principal at the termination of the transaction. We have designated this transaction as a hedge of the variability of the cash flows associated with the payment of interest and principal on the US $ securities. Consistent with FAS 133 accounting, all changes in the value of the transaction due to foreign exchange will be booked through the Statement of Operations and will be offset by a revaluation of the associated debt instrument. Changes in the value of the transaction due to interest rates will be booked to other comprehensive income. As of December 25, 2005, we are a party to other cross currency swaps totaling £530 million (approximately $774 million at the date of entering the transaction). The swaps included an initial exchange of principal on the settlement date of our 6 3⁄8% private placement fixed rate debt (see Note 13) and will require final principal exchange in May 2012. The swaps also call for an exchange of fixed GBP interest payments for fixed US $ interest receipts. At the initial principal exchange, we paid US $ to a counterparty and received GBP. Upon final exchange, we will provide GBP to the counterparty and receive US $. The cross currency swaps have been designated as cash flow hedges of the changes in value of the future GBP interest and principal receipts that results from changes in the US $ to GBP exchange rates on an intercompany loan between our Europe subsidiary and us. We entered into interest rate swap agreements related to our 6 3⁄8% fixed rate debt. These interest rate swaps convert $201.2 million notional amount from fixed rates to floating rates and mature in 2012. We will receive fixed US $ interest payments semi-annually at a rate of 6 3⁄8% per annum and pay a rate to our counterparty based on a credit spread plus the three-month LIBOR rate, thereby exchanging a fixed interest obligation for a floating interest rate obligation. There was no exchange of principal at the inception of the swaps. We designated the interest rate swaps as a fair value hedge of the changes in the fair value of the $201.2 million fixed rate debt attributable to changes in the LIBOR swap rates. As of December 25, 2005, $6.9 million of deferred net gains (net of tax) on both outstanding and matured derivatives accumulated in other comprehensive income are expected to be reclassified to earnings during the next twelve months as a result of expected gains or losses on underlying hedged transactions also being recorded in earnings. Actual amounts ultimately reclassified to earnings are dependent on the applicable rates in effect when derivatives contracts that are currently outstanding mature. As of December 25, 2005, the maximum term over which we are hedging exposures to the variability of cash flows for all forecasted and recorded transactions is 10 years. 19. Commitments and Contingencies The following does not include commitments of our Brazil segment. We sold 68% of our interest in Brazil to FEMSA on January 13, 2006. Refer to Note 3 of our consolidated financial statements for additional information regarding this transaction. Letters of Credit As of December 25, 2005, we had approximately $47.1 million outstanding in letters of credit with financial institutions. These letters expire at different points in 2006 and 2008. Approximately $34.3 million of the letters contain a feature that automatically renews the letter for an additional year if no cancellation notice is submitted. These letters of credit are being maintained as security for deferred compensation payments, reimbursements to insurance companies, reimbursements to the
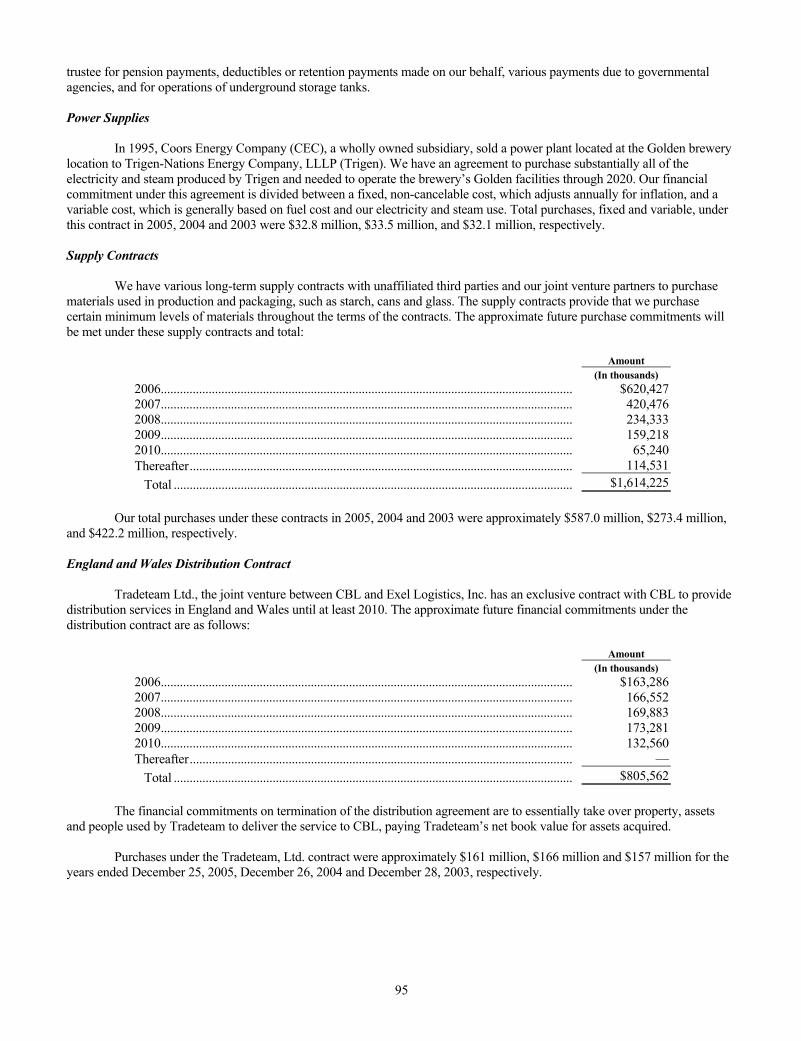
95
trustee for pension payments, deductibles or retention payments made on our behalf, various payments due to governmental agencies, and for operations of underground storage tanks. Power Supplies In 1995, Coors Energy Company (CEC), a wholly owned subsidiary, sold a power plant located at the Golden brewery location to Trigen-Nations Energy Company, LLLP (Trigen). We have an agreement to purchase substantially all of the electricity and steam produced by Trigen and needed to operate the brewery’s Golden facilities through 2020. Our financial commitment under this agreement is divided between a fixed, non-cancelable cost, which adjusts annually for inflation, and a variable cost, which is generally based on fuel cost and our electricity and steam use. Total purchases, fixed and variable, under this contract in 2005, 2004 and 2003 were $32.8 million, $33.5 million, and $32.1 million, respectively. Supply Contracts We have various long-term supply contracts with unaffiliated third parties and our joint venture partners to purchase materials used in production and packaging, such as starch, cans and glass. The supply contracts provide that we purchase certain minimum levels of materials throughout the terms of the contracts. The approximate future purchase commitments will be met under these supply contracts and total:
Amount (In thousands) 2006................................................................................................................................. $620,4272007................................................................................................................................. 420,4762008................................................................................................................................. 234,3332009................................................................................................................................. 159,2182010................................................................................................................................. 65,240Thereafter........................................................................................................................ 114,531
Total ............................................................................................................................. $1,614,225 Our total purchases under these contracts in 2005, 2004 and 2003 were approximately $587.0 million, $273.4 million, and $422.2 million, respectively. England and Wales Distribution Contract Tradeteam Ltd., the joint venture between CBL and Exel Logistics, Inc. has an exclusive contract with CBL to provide distribution services in England and Wales until at least 2010. The approximate future financial commitments under the distribution contract are as follows:
Amount (In thousands) 2006................................................................................................................................. $163,2862007................................................................................................................................. 166,5522008................................................................................................................................. 169,8832009................................................................................................................................. 173,2812010................................................................................................................................. 132,560Thereafter........................................................................................................................ —
Total ............................................................................................................................. $805,562 The financial commitments on termination of the distribution agreement are to essentially take over property, assets and people used by Tradeteam to deliver the service to CBL, paying Tradeteam’s net book value for assets acquired. Purchases under the Tradeteam, Ltd. contract were approximately $161 million, $166 million and $157 million for the years ended December 25, 2005, December 26, 2004 and December 28, 2003, respectively.
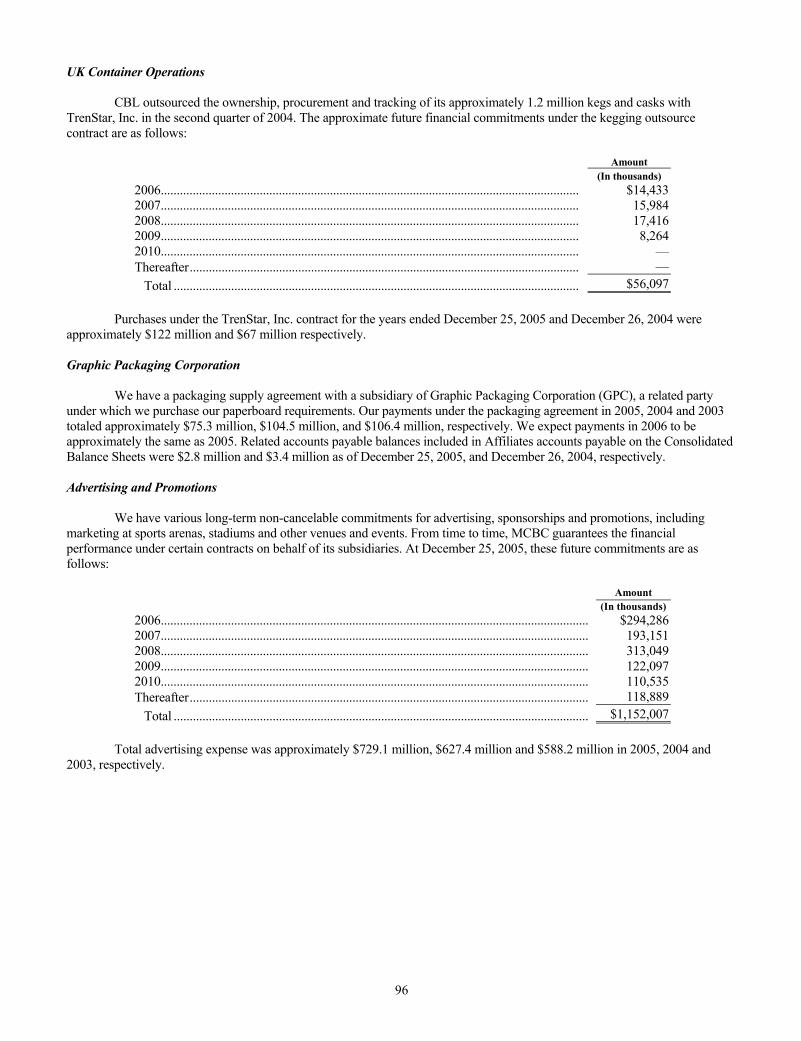
96
UK Container Operations CBL outsourced the ownership, procurement and tracking of its approximately 1.2 million kegs and casks with TrenStar, Inc. in the second quarter of 2004. The approximate future financial commitments under the kegging outsource contract are as follows:
Amount (In thousands) 2006................................................................................................................................... $14,4332007................................................................................................................................... 15,9842008................................................................................................................................... 17,4162009................................................................................................................................... 8,2642010................................................................................................................................... —Thereafter.......................................................................................................................... —
Total ............................................................................................................................... $56,097 Purchases under the TrenStar, Inc. contract for the years ended December 25, 2005 and December 26, 2004 were approximately $122 million and $67 million respectively. Graphic Packaging Corporation We have a packaging supply agreement with a subsidiary of Graphic Packaging Corporation (GPC), a related party under which we purchase our paperboard requirements. Our payments under the packaging agreement in 2005, 2004 and 2003 totaled approximately $75.3 million, $104.5 million, and $106.4 million, respectively. We expect payments in 2006 to be approximately the same as 2005. Related accounts payable balances included in Affiliates accounts payable on the Consolidated Balance Sheets were $2.8 million and $3.4 million as of December 25, 2005, and December 26, 2004, respectively. Advertising and Promotions We have various long-term non-cancelable commitments for advertising, sponsorships and promotions, including marketing at sports arenas, stadiums and other venues and events. From time to time, MCBC guarantees the financial performance under certain contracts on behalf of its subsidiaries. At December 25, 2005, these future commitments are as follows:
Amount (In thousands) 2006...................................................................................................................................... $294,2862007...................................................................................................................................... 193,1512008...................................................................................................................................... 313,0492009...................................................................................................................................... 122,0972010...................................................................................................................................... 110,535Thereafter............................................................................................................................. 118,889
Total .................................................................................................................................. $1,152,007 Total advertising expense was approximately $729.1 million, $627.4 million and $588.2 million in 2005, 2004 and 2003, respectively.
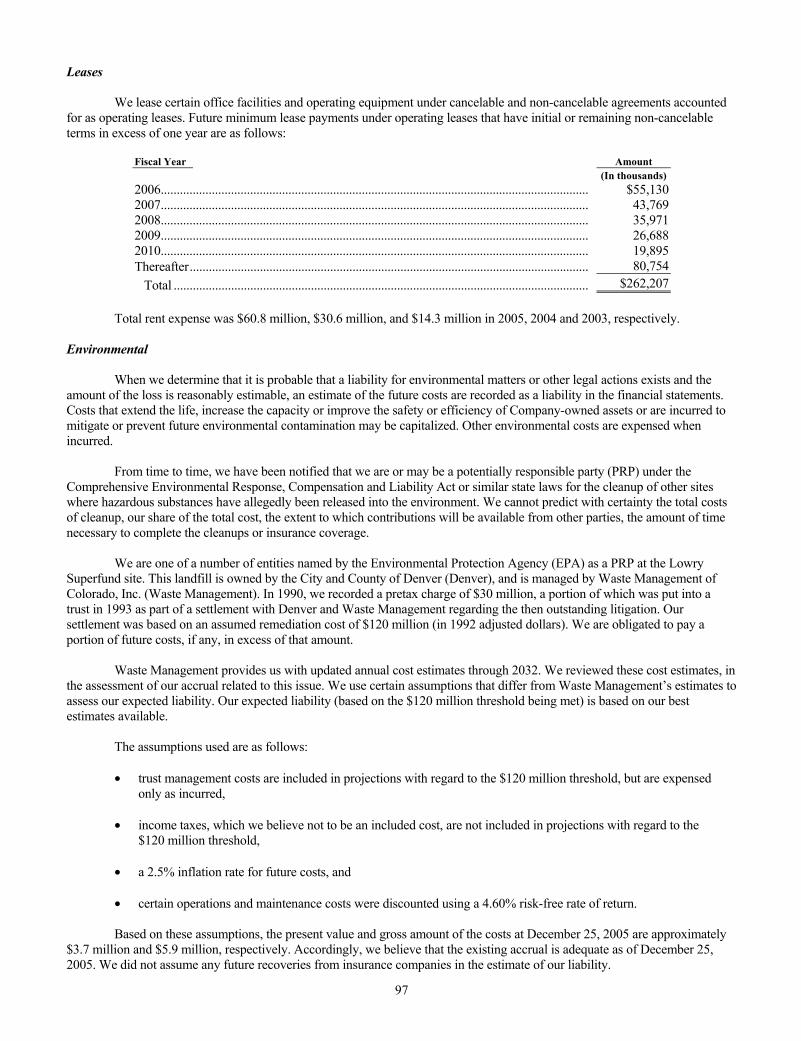
97
Leases We lease certain office facilities and operating equipment under cancelable and non-cancelable agreements accounted for as operating leases. Future minimum lease payments under operating leases that have initial or remaining non-cancelable terms in excess of one year are as follows:
Fiscal Year Amount (In thousands) 2006...................................................................................................................................... $55,1302007...................................................................................................................................... 43,7692008...................................................................................................................................... 35,9712009...................................................................................................................................... 26,6882010...................................................................................................................................... 19,895Thereafter............................................................................................................................. 80,754
Total .................................................................................................................................. $262,207 Total rent expense was $60.8 million, $30.6 million, and $14.3 million in 2005, 2004 and 2003, respectively. Environmental When we determine that it is probable that a liability for environmental matters or other legal actions exists and the amount of the loss is reasonably estimable, an estimate of the future costs are recorded as a liability in the financial statements. Costs that extend the life, increase the capacity or improve the safety or efficiency of Company-owned assets or are incurred to mitigate or prevent future environmental contamination may be capitalized. Other environmental costs are expensed when incurred. From time to time, we have been notified that we are or may be a potentially responsible party (PRP) under the Comprehensive Environmental Response, Compensation and Liability Act or similar state laws for the cleanup of other sites where hazardous substances have allegedly been released into the environment. We cannot predict with certainty the total costs of cleanup, our share of the total cost, the extent to which contributions will be available from other parties, the amount of time necessary to complete the cleanups or insurance coverage. We are one of a number of entities named by the Environmental Protection Agency (EPA) as a PRP at the Lowry Superfund site. This landfill is owned by the City and County of Denver (Denver), and is managed by Waste Management of Colorado, Inc. (Waste Management). In 1990, we recorded a pretax charge of $30 million, a portion of which was put into a trust in 1993 as part of a settlement with Denver and Waste Management regarding the then outstanding litigation. Our settlement was based on an assumed remediation cost of $120 million (in 1992 adjusted dollars). We are obligated to pay a portion of future costs, if any, in excess of that amount. Waste Management provides us with updated annual cost estimates through 2032. We reviewed these cost estimates, in the assessment of our accrual related to this issue. We use certain assumptions that differ from Waste Management’s estimates to assess our expected liability. Our expected liability (based on the $120 million threshold being met) is based on our best estimates available. The assumptions used are as follows:
• trust management costs are included in projections with regard to the $120 million threshold, but are expensed only as incurred,
• income taxes, which we believe not to be an included cost, are not included in projections with regard to the
$120 million threshold,
• a 2.5% inflation rate for future costs, and
• certain operations and maintenance costs were discounted using a 4.60% risk-free rate of return. Based on these assumptions, the present value and gross amount of the costs at December 25, 2005 are approximately $3.7 million and $5.9 million, respectively. Accordingly, we believe that the existing accrual is adequate as of December 25, 2005. We did not assume any future recoveries from insurance companies in the estimate of our liability.
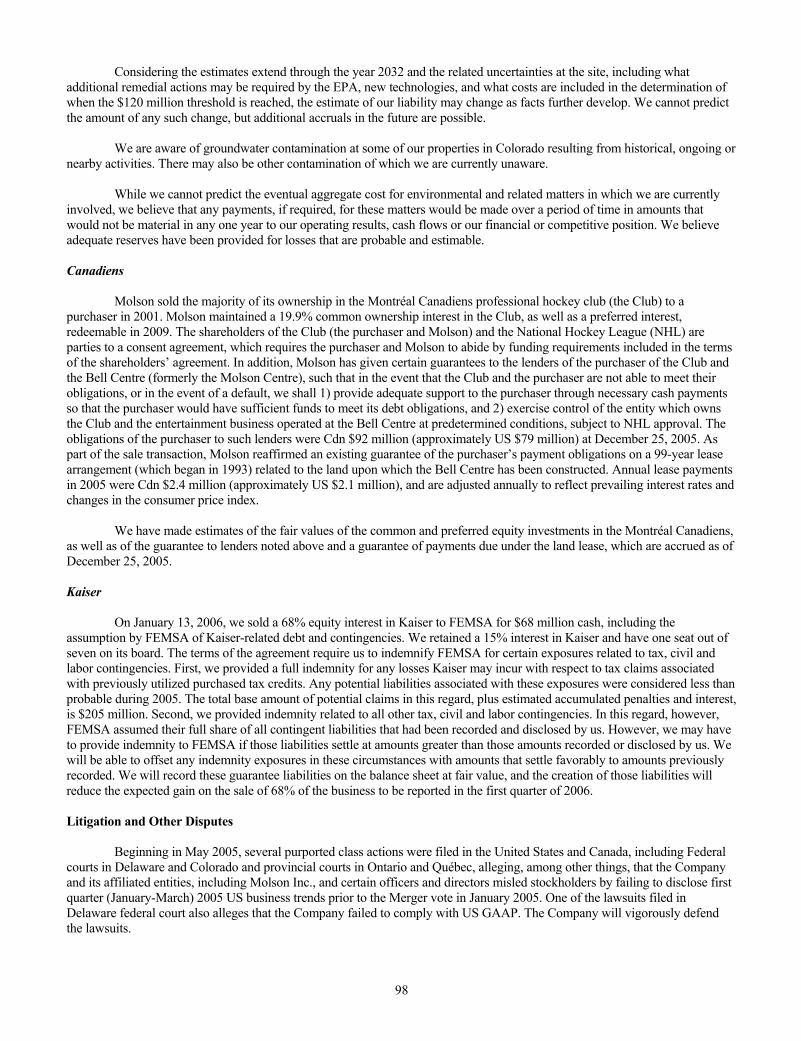
98
Considering the estimates extend through the year 2032 and the related uncertainties at the site, including what additional remedial actions may be required by the EPA, new technologies, and what costs are included in the determination of when the $120 million threshold is reached, the estimate of our liability may change as facts further develop. We cannot predict the amount of any such change, but additional accruals in the future are possible. We are aware of groundwater contamination at some of our properties in Colorado resulting from historical, ongoing or nearby activities. There may also be other contamination of which we are currently unaware. While we cannot predict the eventual aggregate cost for environmental and related matters in which we are currently involved, we believe that any payments, if required, for these matters would be made over a period of time in amounts that would not be material in any one year to our operating results, cash flows or our financial or competitive position. We believe adequate reserves have been provided for losses that are probable and estimable. Canadiens Molson sold the majority of its ownership in the Montréal Canadiens professional hockey club (the Club) to a purchaser in 2001. Molson maintained a 19.9% common ownership interest in the Club, as well as a preferred interest, redeemable in 2009. The shareholders of the Club (the purchaser and Molson) and the National Hockey League (NHL) are parties to a consent agreement, which requires the purchaser and Molson to abide by funding requirements included in the terms of the shareholders’ agreement. In addition, Molson has given certain guarantees to the lenders of the purchaser of the Club and the Bell Centre (formerly the Molson Centre), such that in the event that the Club and the purchaser are not able to meet their obligations, or in the event of a default, we shall 1) provide adequate support to the purchaser through necessary cash payments so that the purchaser would have sufficient funds to meet its debt obligations, and 2) exercise control of the entity which owns the Club and the entertainment business operated at the Bell Centre at predetermined conditions, subject to NHL approval. The obligations of the purchaser to such lenders were Cdn $92 million (approximately US $79 million) at December 25, 2005. As part of the sale transaction, Molson reaffirmed an existing guarantee of the purchaser’s payment obligations on a 99-year lease arrangement (which began in 1993) related to the land upon which the Bell Centre has been constructed. Annual lease payments in 2005 were Cdn $2.4 million (approximately US $2.1 million), and are adjusted annually to reflect prevailing interest rates and changes in the consumer price index. We have made estimates of the fair values of the common and preferred equity investments in the Montréal Canadiens, as well as of the guarantee to lenders noted above and a guarantee of payments due under the land lease, which are accrued as of December 25, 2005. Kaiser On January 13, 2006, we sold a 68% equity interest in Kaiser to FEMSA for $68 million cash, including the assumption by FEMSA of Kaiser-related debt and contingencies. We retained a 15% interest in Kaiser and have one seat out of seven on its board. The terms of the agreement require us to indemnify FEMSA for certain exposures related to tax, civil and labor contingencies. First, we provided a full indemnity for any losses Kaiser may incur with respect to tax claims associated with previously utilized purchased tax credits. Any potential liabilities associated with these exposures were considered less than probable during 2005. The total base amount of potential claims in this regard, plus estimated accumulated penalties and interest, is $205 million. Second, we provided indemnity related to all other tax, civil and labor contingencies. In this regard, however, FEMSA assumed their full share of all contingent liabilities that had been recorded and disclosed by us. However, we may have to provide indemnity to FEMSA if those liabilities settle at amounts greater than those amounts recorded or disclosed by us. We will be able to offset any indemnity exposures in these circumstances with amounts that settle favorably to amounts previously recorded. We will record these guarantee liabilities on the balance sheet at fair value, and the creation of those liabilities will reduce the expected gain on the sale of 68% of the business to be reported in the first quarter of 2006. Litigation and Other Disputes Beginning in May 2005, several purported class actions were filed in the United States and Canada, including Federal courts in Delaware and Colorado and provincial courts in Ontario and Québec, alleging, among other things, that the Company and its affiliated entities, including Molson Inc., and certain officers and directors misled stockholders by failing to disclose first quarter (January-March) 2005 US business trends prior to the Merger vote in January 2005. One of the lawsuits filed in Delaware federal court also alleges that the Company failed to comply with US GAAP. The Company will vigorously defend the lawsuits.
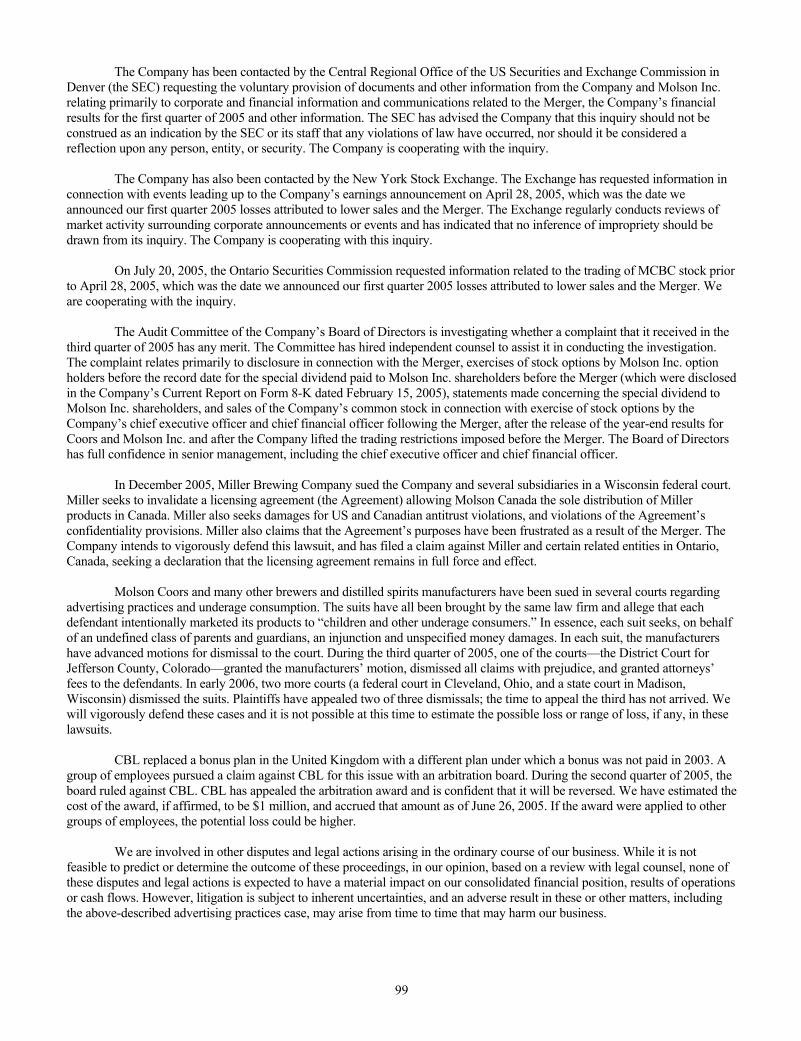
99
The Company has been contacted by the Central Regional Office of the US Securities and Exchange Commission in Denver (the SEC) requesting the voluntary provision of documents and other information from the Company and Molson Inc. relating primarily to corporate and financial information and communications related to the Merger, the Company’s financial results for the first quarter of 2005 and other information. The SEC has advised the Company that this inquiry should not be construed as an indication by the SEC or its staff that any violations of law have occurred, nor should it be considered a reflection upon any person, entity, or security. The Company is cooperating with the inquiry. The Company has also been contacted by the New York Stock Exchange. The Exchange has requested information in connection with events leading up to the Company’s earnings announcement on April 28, 2005, which was the date we announced our first quarter 2005 losses attributed to lower sales and the Merger. The Exchange regularly conducts reviews of market activity surrounding corporate announcements or events and has indicated that no inference of impropriety should be drawn from its inquiry. The Company is cooperating with this inquiry. On July 20, 2005, the Ontario Securities Commission requested information related to the trading of MCBC stock prior to April 28, 2005, which was the date we announced our first quarter 2005 losses attributed to lower sales and the Merger. We are cooperating with the inquiry. The Audit Committee of the Company’s Board of Directors is investigating whether a complaint that it received in the third quarter of 2005 has any merit. The Committee has hired independent counsel to assist it in conducting the investigation. The complaint relates primarily to disclosure in connection with the Merger, exercises of stock options by Molson Inc. option holders before the record date for the special dividend paid to Molson Inc. shareholders before the Merger (which were disclosed in the Company’s Current Report on Form 8-K dated February 15, 2005), statements made concerning the special dividend to Molson Inc. shareholders, and sales of the Company’s common stock in connection with exercise of stock options by the Company’s chief executive officer and chief financial officer following the Merger, after the release of the year-end results for Coors and Molson Inc. and after the Company lifted the trading restrictions imposed before the Merger. The Board of Directors has full confidence in senior management, including the chief executive officer and chief financial officer. In December 2005, Miller Brewing Company sued the Company and several subsidiaries in a Wisconsin federal court. Miller seeks to invalidate a licensing agreement (the Agreement) allowing Molson Canada the sole distribution of Miller products in Canada. Miller also seeks damages for US and Canadian antitrust violations, and violations of the Agreement’s confidentiality provisions. Miller also claims that the Agreement’s purposes have been frustrated as a result of the Merger. The Company intends to vigorously defend this lawsuit, and has filed a claim against Miller and certain related entities in Ontario, Canada, seeking a declaration that the licensing agreement remains in full force and effect. Molson Coors and many other brewers and distilled spirits manufacturers have been sued in several courts regarding advertising practices and underage consumption. The suits have all been brought by the same law firm and allege that each defendant intentionally marketed its products to “children and other underage consumers.” In essence, each suit seeks, on behalf of an undefined class of parents and guardians, an injunction and unspecified money damages. In each suit, the manufacturers have advanced motions for dismissal to the court. During the third quarter of 2005, one of the courts—the District Court for Jefferson County, Colorado—granted the manufacturers’ motion, dismissed all claims with prejudice, and granted attorneys’ fees to the defendants. In early 2006, two more courts (a federal court in Cleveland, Ohio, and a state court in Madison, Wisconsin) dismissed the suits. Plaintiffs have appealed two of three dismissals; the time to appeal the third has not arrived. We will vigorously defend these cases and it is not possible at this time to estimate the possible loss or range of loss, if any, in these lawsuits. CBL replaced a bonus plan in the United Kingdom with a different plan under which a bonus was not paid in 2003. A group of employees pursued a claim against CBL for this issue with an arbitration board. During the second quarter of 2005, the board ruled against CBL. CBL has appealed the arbitration award and is confident that it will be reversed. We have estimated the cost of the award, if affirmed, to be $1 million, and accrued that amount as of June 26, 2005. If the award were applied to other groups of employees, the potential loss could be higher. We are involved in other disputes and legal actions arising in the ordinary course of our business. While it is not feasible to predict or determine the outcome of these proceedings, in our opinion, based on a review with legal counsel, none of these disputes and legal actions is expected to have a material impact on our consolidated financial position, results of operations or cash flows. However, litigation is subject to inherent uncertainties, and an adverse result in these or other matters, including the above-described advertising practices case, may arise from time to time that may harm our business.
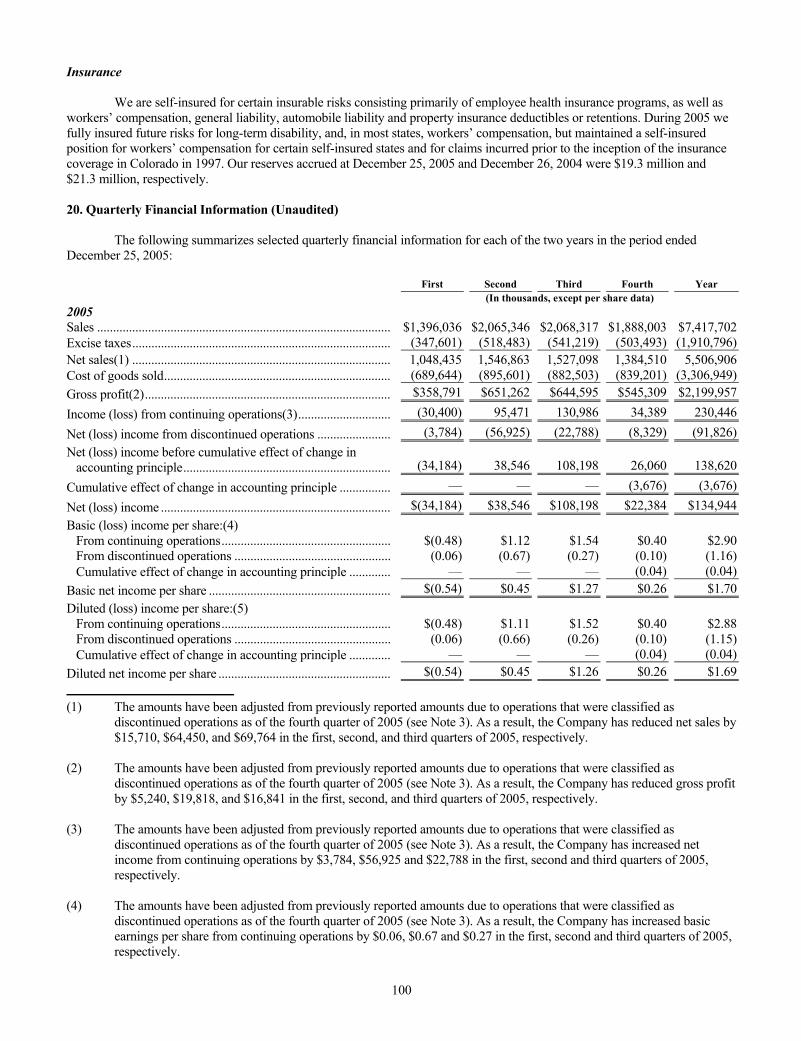
100
Insurance We are self-insured for certain insurable risks consisting primarily of employee health insurance programs, as well as workers’ compensation, general liability, automobile liability and property insurance deductibles or retentions. During 2005 we fully insured future risks for long-term disability, and, in most states, workers’ compensation, but maintained a self-insured position for workers’ compensation for certain self-insured states and for claims incurred prior to the inception of the insurance coverage in Colorado in 1997. Our reserves accrued at December 25, 2005 and December 26, 2004 were $19.3 million and $21.3 million, respectively. 20. Quarterly Financial Information (Unaudited) The following summarizes selected quarterly financial information for each of the two years in the period ended December 25, 2005: First Second Third Fourth Year (In thousands, except per share data) 2005 Sales ............................................................................................ $1,396,036 $2,065,346 $2,068,317 $1,888,003 $7,417,702Excise taxes................................................................................. (347,601) (518,483) (541,219) (503,493) (1,910,796)Net sales(1) ................................................................................. 1,048,435 1,546,863 1,527,098 1,384,510 5,506,906Cost of goods sold....................................................................... (689,644) (895,601) (882,503) (839,201) (3,306,949)Gross profit(2)............................................................................. $358,791 $651,262 $644,595 $545,309 $2,199,957
Income (loss) from continuing operations(3)............................. (30,400) 95,471 130,986 34,389 230,446
Net (loss) income from discontinued operations ....................... (3,784) (56,925) (22,788) (8,329) (91,826)Net (loss) income before cumulative effect of change in
accounting principle................................................................. (34,184) 38,546 108,198 26,060 138,620
Cumulative effect of change in accounting principle ................ — — — (3,676) (3,676)
Net (loss) income ........................................................................ $(34,184) $38,546 $108,198 $22,384 $134,944Basic (loss) income per share:(4)
From continuing operations..................................................... $(0.48) $1.12 $1.54 $0.40 $2.90From discontinued operations ................................................. (0.06) (0.67) (0.27) (0.10) (1.16)Cumulative effect of change in accounting principle ............. — — — (0.04) (0.04)
Basic net income per share ......................................................... $(0.54) $0.45 $1.27 $0.26 $1.70Diluted (loss) income per share:(5)
From continuing operations..................................................... $(0.48) $1.11 $1.52 $0.40 $2.88From discontinued operations ................................................. (0.06) (0.66) (0.26) (0.10) (1.15)Cumulative effect of change in accounting principle ............. — — — (0.04) (0.04)
Diluted net income per share ...................................................... $(0.54) $0.45 $1.26 $0.26 $1.69
(1) The amounts have been adjusted from previously reported amounts due to operations that were classified as
discontinued operations as of the fourth quarter of 2005 (see Note 3). As a result, the Company has reduced net sales by $15,710, $64,450, and $69,764 in the first, second, and third quarters of 2005, respectively.
(2) The amounts have been adjusted from previously reported amounts due to operations that were classified as
discontinued operations as of the fourth quarter of 2005 (see Note 3). As a result, the Company has reduced gross profit by $5,240, $19,818, and $16,841 in the first, second, and third quarters of 2005, respectively.
(3) The amounts have been adjusted from previously reported amounts due to operations that were classified as
discontinued operations as of the fourth quarter of 2005 (see Note 3). As a result, the Company has increased net income from continuing operations by $3,784, $56,925 and $22,788 in the first, second and third quarters of 2005, respectively.
(4) The amounts have been adjusted from previously reported amounts due to operations that were classified as
discontinued operations as of the fourth quarter of 2005 (see Note 3). As a result, the Company has increased basic earnings per share from continuing operations by $0.06, $0.67 and $0.27 in the first, second and third quarters of 2005, respectively.
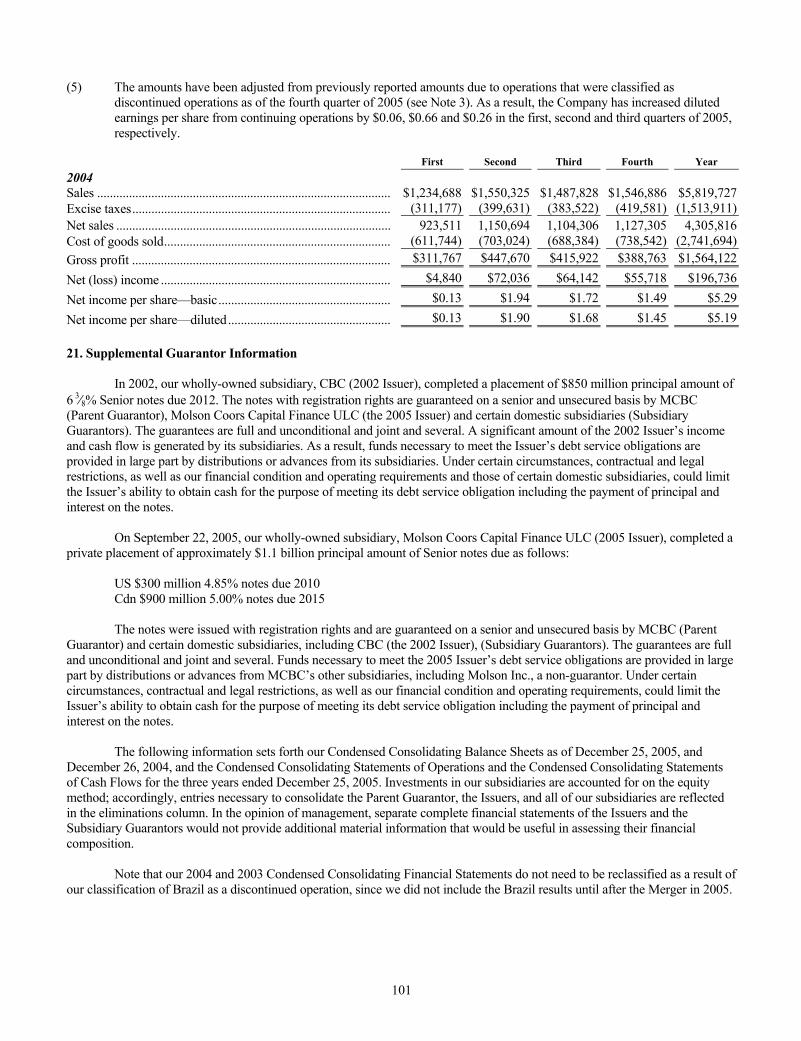
101
(5) The amounts have been adjusted from previously reported amounts due to operations that were classified as
discontinued operations as of the fourth quarter of 2005 (see Note 3). As a result, the Company has increased diluted earnings per share from continuing operations by $0.06, $0.66 and $0.26 in the first, second and third quarters of 2005, respectively.
First Second Third Fourth Year 2004 Sales ............................................................................................ $1,234,688 $1,550,325 $1,487,828 $1,546,886 $5,819,727Excise taxes................................................................................. (311,177) (399,631) (383,522) (419,581) (1,513,911)Net sales ...................................................................................... 923,511 1,150,694 1,104,306 1,127,305 4,305,816Cost of goods sold....................................................................... (611,744) (703,024) (688,384) (738,542) (2,741,694)Gross profit ................................................................................. $311,767 $447,670 $415,922 $388,763 $1,564,122
Net (loss) income ........................................................................ $4,840 $72,036 $64,142 $55,718 $196,736
Net income per share—basic...................................................... $0.13 $1.94 $1.72 $1.49 $5.29
Net income per share—diluted................................................... $0.13 $1.90 $1.68 $1.45 $5.19 21. Supplemental Guarantor Information In 2002, our wholly-owned subsidiary, CBC (2002 Issuer), completed a placement of $850 million principal amount of 6 3⁄8% Senior notes due 2012. The notes with registration rights are guaranteed on a senior and unsecured basis by MCBC (Parent Guarantor), Molson Coors Capital Finance ULC (the 2005 Issuer) and certain domestic subsidiaries (Subsidiary Guarantors). The guarantees are full and unconditional and joint and several. A significant amount of the 2002 Issuer’s income and cash flow is generated by its subsidiaries. As a result, funds necessary to meet the Issuer’s debt service obligations are provided in large part by distributions or advances from its subsidiaries. Under certain circumstances, contractual and legal restrictions, as well as our financial condition and operating requirements and those of certain domestic subsidiaries, could limit the Issuer’s ability to obtain cash for the purpose of meeting its debt service obligation including the payment of principal and interest on the notes. On September 22, 2005, our wholly-owned subsidiary, Molson Coors Capital Finance ULC (2005 Issuer), completed a private placement of approximately $1.1 billion principal amount of Senior notes due as follows: US $300 million 4.85% notes due 2010 Cdn $900 million 5.00% notes due 2015 The notes were issued with registration rights and are guaranteed on a senior and unsecured basis by MCBC (Parent Guarantor) and certain domestic subsidiaries, including CBC (the 2002 Issuer), (Subsidiary Guarantors). The guarantees are full and unconditional and joint and several. Funds necessary to meet the 2005 Issuer’s debt service obligations are provided in large part by distributions or advances from MCBC’s other subsidiaries, including Molson Inc., a non-guarantor. Under certain circumstances, contractual and legal restrictions, as well as our financial condition and operating requirements, could limit the Issuer’s ability to obtain cash for the purpose of meeting its debt service obligation including the payment of principal and interest on the notes. The following information sets forth our Condensed Consolidating Balance Sheets as of December 25, 2005, and December 26, 2004, and the Condensed Consolidating Statements of Operations and the Condensed Consolidating Statements of Cash Flows for the three years ended December 25, 2005. Investments in our subsidiaries are accounted for on the equity method; accordingly, entries necessary to consolidate the Parent Guarantor, the Issuers, and all of our subsidiaries are reflected in the eliminations column. In the opinion of management, separate complete financial statements of the Issuers and the Subsidiary Guarantors would not provide additional material information that would be useful in assessing their financial composition. Note that our 2004 and 2003 Condensed Consolidating Financial Statements do not need to be reclassified as a result of our classification of Brazil as a discontinued operation, since we did not include the Brazil results until after the Merger in 2005.
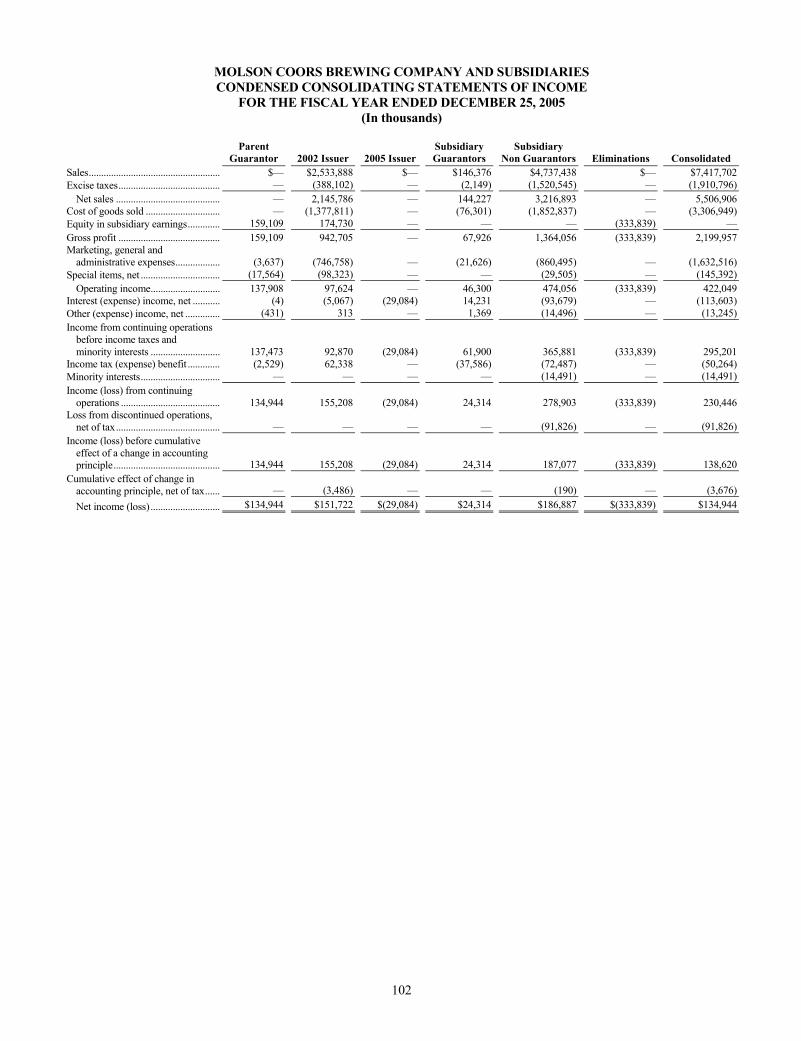
102
MOLSON COORS BREWING COMPANY AND SUBSIDIARIES CONDENSED CONSOLIDATING STATEMENTS OF INCOME
FOR THE FISCAL YEAR ENDED DECEMBER 25, 2005 (In thousands)
Parent
Guarantor 2002 Issuer 2005 Issuer Subsidiary Guarantors
Subsidiary Non Guarantors Eliminations Consolidated
Sales..................................................... $— $2,533,888 $— $146,376 $4,737,438 $— $7,417,702Excise taxes......................................... — (388,102) — (2,149) (1,520,545) — (1,910,796)
Net sales .......................................... — 2,145,786 — 144,227 3,216,893 — 5,506,906Cost of goods sold .............................. — (1,377,811) — (76,301) (1,852,837) — (3,306,949)Equity in subsidiary earnings............. 159,109 174,730 — — — (333,839) —Gross profit ......................................... 159,109 942,705 — 67,926 1,364,056 (333,839) 2,199,957Marketing, general and
administrative expenses.................. (3,637) (746,758) — (21,626) (860,495) — (1,632,516)Special items, net ................................ (17,564) (98,323) — — (29,505) — (145,392)
Operating income............................ 137,908 97,624 — 46,300 474,056 (333,839) 422,049Interest (expense) income, net ........... (4) (5,067) (29,084) 14,231 (93,679) — (113,603)Other (expense) income, net .............. (431) 313 — 1,369 (14,496) — (13,245)Income from continuing operations
before income taxes and minority interests ............................ 137,473 92,870 (29,084) 61,900 365,881 (333,839) 295,201
Income tax (expense) benefit ............. (2,529) 62,338 — (37,586) (72,487) — (50,264)Minority interests................................ — — — — (14,491) — (14,491)Income (loss) from continuing
operations ........................................ 134,944 155,208 (29,084) 24,314 278,903 (333,839) 230,446Loss from discontinued operations,
net of tax.......................................... — — — — (91,826) — (91,826)Income (loss) before cumulative
effect of a change in accounting principle........................................... 134,944 155,208 (29,084) 24,314 187,077 (333,839) 138,620
Cumulative effect of change in accounting principle, net of tax...... — (3,486) — — (190) — (3,676)Net income (loss)............................ $134,944 $151,722 $(29,084) $24,314 $186,887 $(333,839) $134,944
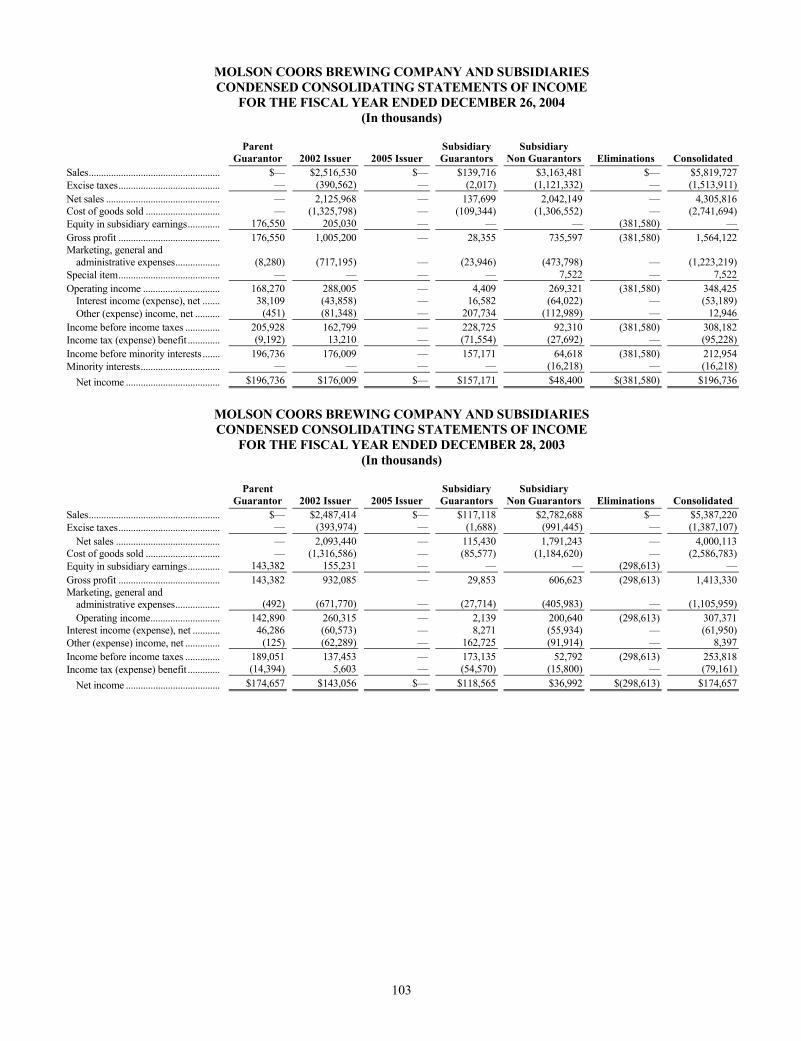
103
MOLSON COORS BREWING COMPANY AND SUBSIDIARIES CONDENSED CONSOLIDATING STATEMENTS OF INCOME
FOR THE FISCAL YEAR ENDED DECEMBER 26, 2004 (In thousands)
Parent
Guarantor 2002 Issuer 2005 Issuer SubsidiaryGuarantors
Subsidiary Non Guarantors Eliminations Consolidated
Sales..................................................... $— $2,516,530 $— $139,716 $3,163,481 $— $5,819,727Excise taxes......................................... — (390,562) — (2,017) (1,121,332) — (1,513,911)Net sales .............................................. — 2,125,968 — 137,699 2,042,149 — 4,305,816Cost of goods sold .............................. — (1,325,798) — (109,344) (1,306,552) — (2,741,694)Equity in subsidiary earnings............. 176,550 205,030 — — — (381,580) —Gross profit ......................................... 176,550 1,005,200 — 28,355 735,597 (381,580) 1,564,122Marketing, general and
administrative expenses.................. (8,280) (717,195) — (23,946) (473,798) — (1,223,219)Special item......................................... — — — — 7,522 — 7,522Operating income ............................... 168,270 288,005 — 4,409 269,321 (381,580) 348,425
Interest income (expense), net ....... 38,109 (43,858) — 16,582 (64,022) — (53,189)Other (expense) income, net .......... (451) (81,348) — 207,734 (112,989) — 12,946
Income before income taxes .............. 205,928 162,799 — 228,725 92,310 (381,580) 308,182Income tax (expense) benefit ............. (9,192) 13,210 — (71,554) (27,692) — (95,228)Income before minority interests ....... 196,736 176,009 — 157,171 64,618 (381,580) 212,954Minority interests................................ — — — — (16,218) — (16,218)
Net income ...................................... $196,736 $176,009 $— $157,171 $48,400 $(381,580) $196,736
MOLSON COORS BREWING COMPANY AND SUBSIDIARIES CONDENSED CONSOLIDATING STATEMENTS OF INCOME
FOR THE FISCAL YEAR ENDED DECEMBER 28, 2003 (In thousands)
Parent
Guarantor 2002 Issuer 2005 Issuer SubsidiaryGuarantors
Subsidiary Non Guarantors Eliminations Consolidated
Sales..................................................... $— $2,487,414 $— $117,118 $2,782,688 $— $5,387,220Excise taxes......................................... — (393,974) — (1,688) (991,445) — (1,387,107)
Net sales .......................................... — 2,093,440 — 115,430 1,791,243 — 4,000,113Cost of goods sold .............................. — (1,316,586) — (85,577) (1,184,620) — (2,586,783)Equity in subsidiary earnings............. 143,382 155,231 — — — (298,613) —Gross profit ......................................... 143,382 932,085 — 29,853 606,623 (298,613) 1,413,330Marketing, general and
administrative expenses.................. (492) (671,770) — (27,714) (405,983) — (1,105,959)Operating income............................ 142,890 260,315 — 2,139 200,640 (298,613) 307,371
Interest income (expense), net ........... 46,286 (60,573) — 8,271 (55,934) — (61,950)Other (expense) income, net .............. (125) (62,289) — 162,725 (91,914) — 8,397Income before income taxes .............. 189,051 137,453 — 173,135 52,792 (298,613) 253,818Income tax (expense) benefit ............. (14,394) 5,603 — (54,570) (15,800) — (79,161)
Net income ...................................... $174,657 $143,056 $— $118,565 $36,992 $(298,613) $174,657
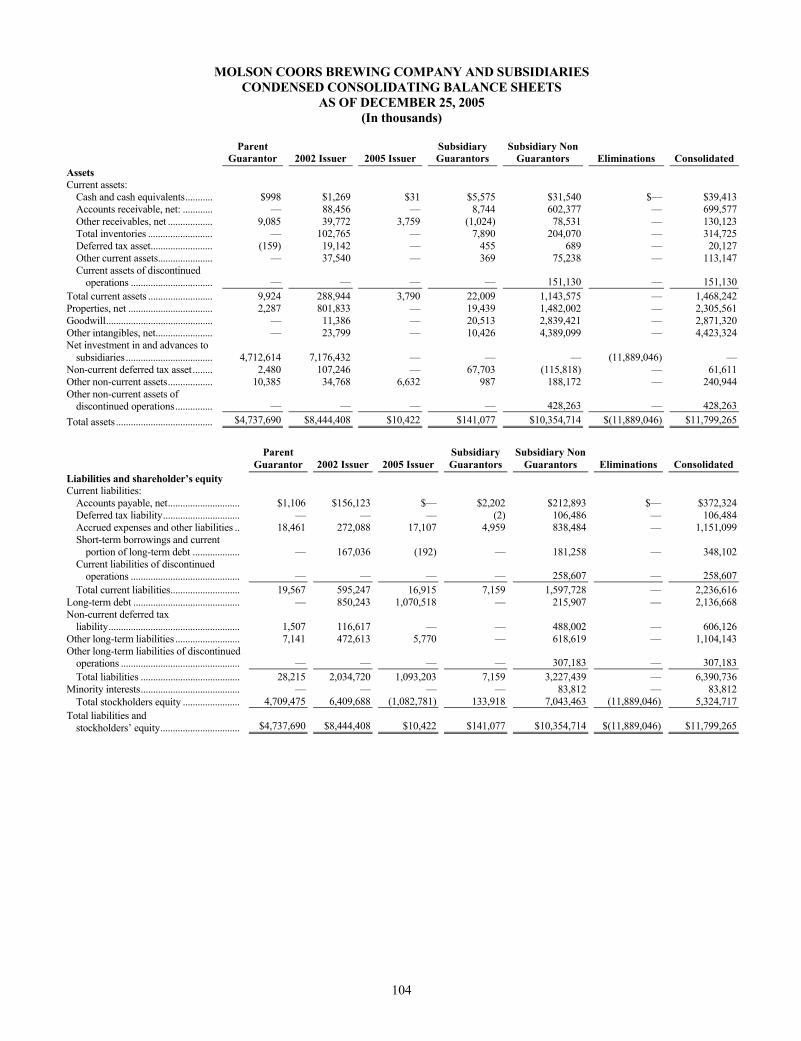
104
MOLSON COORS BREWING COMPANY AND SUBSIDIARIES CONDENSED CONSOLIDATING BALANCE SHEETS
AS OF DECEMBER 25, 2005 (In thousands)
Parent
Guarantor 2002 Issuer 2005 Issuer Subsidiary Guarantors
Subsidiary Non Guarantors Eliminations Consolidated
Assets Current assets:
Cash and cash equivalents........... $998 $1,269 $31 $5,575 $31,540 $— $39,413Accounts receivable, net: ............ — 88,456 — 8,744 602,377 — 699,577Other receivables, net .................. 9,085 39,772 3,759 (1,024) 78,531 — 130,123Total inventories .......................... — 102,765 — 7,890 204,070 — 314,725Deferred tax asset......................... (159) 19,142 — 455 689 — 20,127Other current assets...................... — 37,540 — 369 75,238 — 113,147Current assets of discontinued
operations ................................. — — — — 151,130 — 151,130Total current assets .......................... 9,924 288,944 3,790 22,009 1,143,575 — 1,468,242Properties, net .................................. 2,287 801,833 — 19,439 1,482,002 — 2,305,561Goodwill........................................... — 11,386 — 20,513 2,839,421 — 2,871,320Other intangibles, net....................... — 23,799 — 10,426 4,389,099 — 4,423,324Net investment in and advances to
subsidiaries................................... 4,712,614 7,176,432 — — — (11,889,046) —Non-current deferred tax asset........ 2,480 107,246 — 67,703 (115,818) — 61,611Other non-current assets.................. 10,385 34,768 6,632 987 188,172 — 240,944Other non-current assets of
discontinued operations............... — — — — 428,263 — 428,263Total assets....................................... $4,737,690 $8,444,408 $10,422 $141,077 $10,354,714 $(11,889,046) $11,799,265
Parent
Guarantor 2002 Issuer 2005 Issuer SubsidiaryGuarantors
Subsidiary Non Guarantors Eliminations Consolidated
Liabilities and shareholder’s equity Current liabilities:
Accounts payable, net............................. $1,106 $156,123 $— $2,202 $212,893 $— $372,324Deferred tax liability............................... — — — (2) 106,486 — 106,484Accrued expenses and other liabilities .. 18,461 272,088 17,107 4,959 838,484 — 1,151,099Short-term borrowings and current
portion of long-term debt ................... — 167,036 (192) — 181,258 — 348,102Current liabilities of discontinued
operations ............................................ — — — — 258,607 — 258,607Total current liabilities............................ 19,567 595,247 16,915 7,159 1,597,728 — 2,236,616
Long-term debt ........................................... — 850,243 1,070,518 — 215,907 — 2,136,668Non-current deferred tax
liability..................................................... 1,507 116,617 — — 488,002 — 606,126Other long-term liabilities .......................... 7,141 472,613 5,770 — 618,619 — 1,104,143Other long-term liabilities of discontinued
operations ................................................ — — — — 307,183 — 307,183Total liabilities ........................................ 28,215 2,034,720 1,093,203 7,159 3,227,439 — 6,390,736
Minority interests........................................ — — — — 83,812 — 83,812Total stockholders equity ....................... 4,709,475 6,409,688 (1,082,781) 133,918 7,043,463 (11,889,046) 5,324,717
Total liabilities and stockholders’ equity................................ $4,737,690 $8,444,408 $10,422 $141,077 $10,354,714 $(11,889,046) $11,799,265
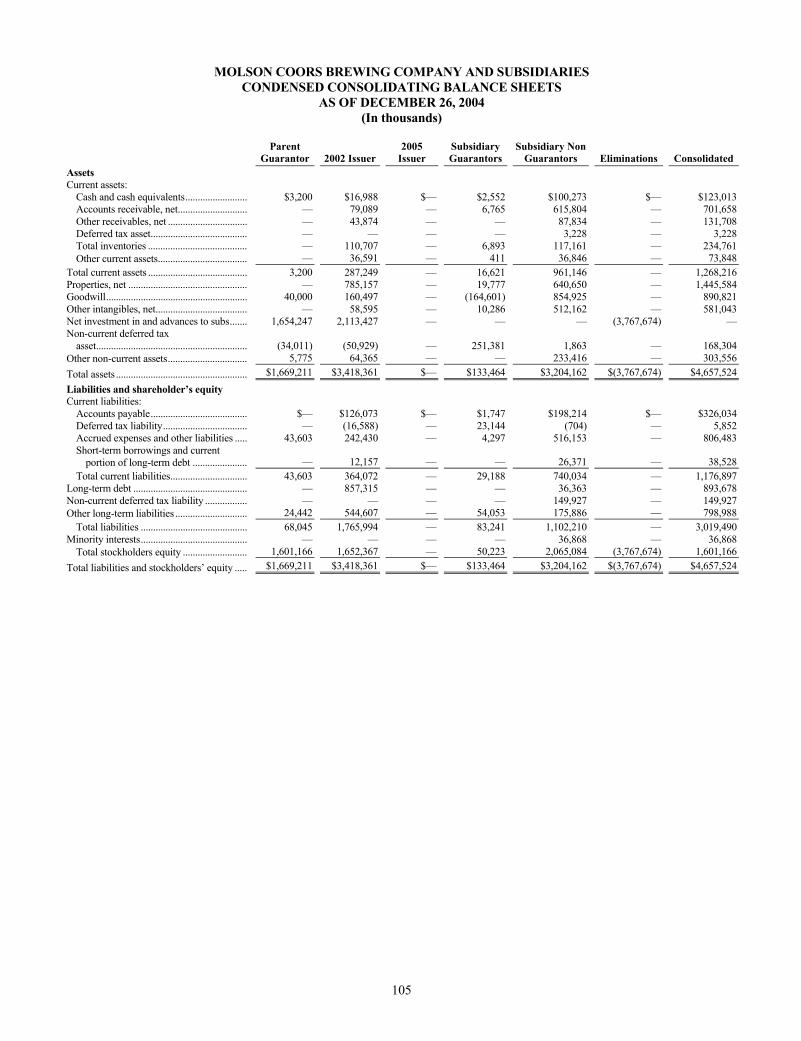
105
MOLSON COORS BREWING COMPANY AND SUBSIDIARIES CONDENSED CONSOLIDATING BALANCE SHEETS
AS OF DECEMBER 26, 2004 (In thousands)
Parent
Guarantor 2002 Issuer 2005
Issuer SubsidiaryGuarantors
Subsidiary Non Guarantors Eliminations Consolidated
Assets Current assets:
Cash and cash equivalents......................... $3,200 $16,988 $— $2,552 $100,273 $— $123,013Accounts receivable, net............................ — 79,089 — 6,765 615,804 — 701,658Other receivables, net ................................ — 43,874 — — 87,834 — 131,708Deferred tax asset....................................... — — — — 3,228 — 3,228Total inventories ........................................ — 110,707 — 6,893 117,161 — 234,761Other current assets.................................... — 36,591 — 411 36,846 — 73,848
Total current assets ........................................ 3,200 287,249 — 16,621 961,146 — 1,268,216Properties, net ................................................ — 785,157 — 19,777 640,650 — 1,445,584Goodwill......................................................... 40,000 160,497 — (164,601) 854,925 — 890,821Other intangibles, net..................................... — 58,595 — 10,286 512,162 — 581,043Net investment in and advances to subs....... 1,654,247 2,113,427 — — — (3,767,674) —Non-current deferred tax
asset............................................................. (34,011) (50,929) — 251,381 1,863 — 168,304Other non-current assets................................ 5,775 64,365 — — 233,416 — 303,556Total assets..................................................... $1,669,211 $3,418,361 $— $133,464 $3,204,162 $(3,767,674) $4,657,524Liabilities and shareholder’s equity Current liabilities:
Accounts payable....................................... $— $126,073 $— $1,747 $198,214 $— $326,034Deferred tax liability.................................. — (16,588) — 23,144 (704) — 5,852Accrued expenses and other liabilities ..... 43,603 242,430 — 4,297 516,153 — 806,483Short-term borrowings and current
portion of long-term debt ...................... — 12,157 — — 26,371 — 38,528Total current liabilities............................... 43,603 364,072 — 29,188 740,034 — 1,176,897
Long-term debt .............................................. — 857,315 — — 36,363 — 893,678Non-current deferred tax liability ................. — — — — 149,927 — 149,927Other long-term liabilities ............................. 24,442 544,607 — 54,053 175,886 — 798,988
Total liabilities ........................................... 68,045 1,765,994 — 83,241 1,102,210 — 3,019,490Minority interests........................................... — — — — 36,868 — 36,868
Total stockholders equity .......................... 1,601,166 1,652,367 — 50,223 2,065,084 (3,767,674) 1,601,166Total liabilities and stockholders’ equity ..... $1,669,211 $3,418,361 $— $133,464 $3,204,162 $(3,767,674) $4,657,524
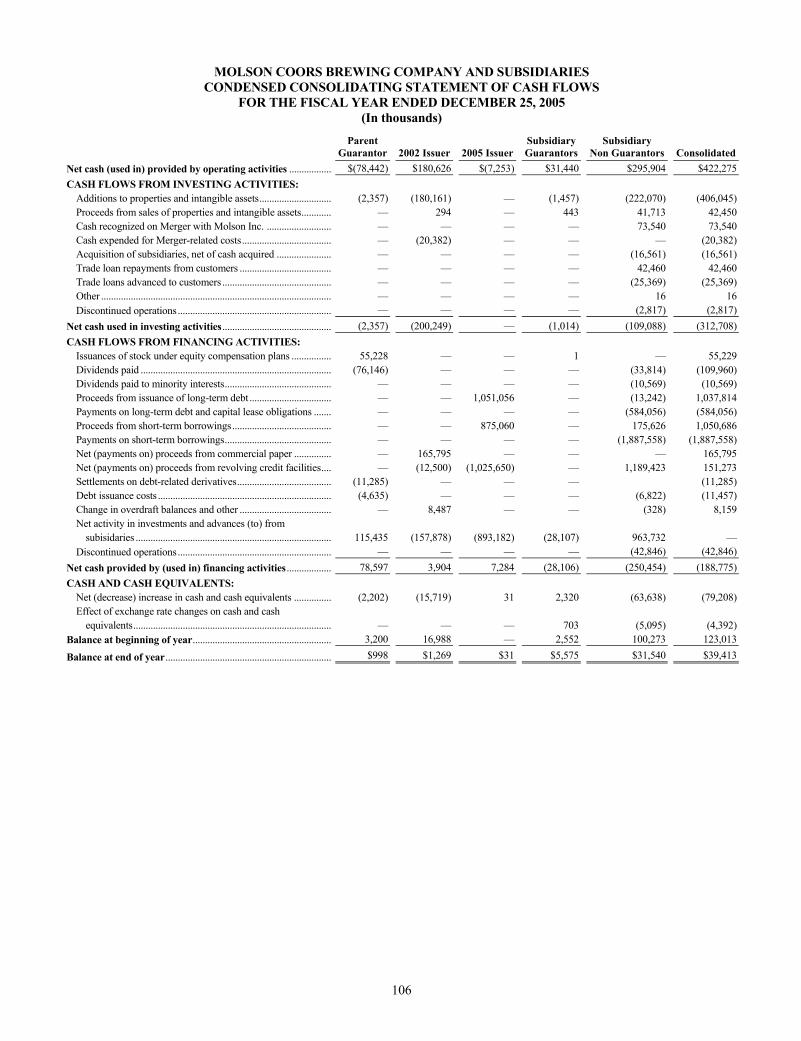
106
MOLSON COORS BREWING COMPANY AND SUBSIDIARIES CONDENSED CONSOLIDATING STATEMENT OF CASH FLOWS
FOR THE FISCAL YEAR ENDED DECEMBER 25, 2005 (In thousands)
Parent
Guarantor 2002 Issuer 2005 Issuer Subsidiary Guarantors
Subsidiary Non Guarantors Consolidated
Net cash (used in) provided by operating activities .................. $(78,442) $180,626 $(7,253) $31,440 $295,904 $422,275CASH FLOWS FROM INVESTING ACTIVITIES:
Additions to properties and intangible assets.............................. (2,357) (180,161) — (1,457) (222,070) (406,045)Proceeds from sales of properties and intangible assets............. — 294 — 443 41,713 42,450Cash recognized on Merger with Molson Inc. ........................... — — — — 73,540 73,540Cash expended for Merger-related costs..................................... — (20,382) — — — (20,382)Acquisition of subsidiaries, net of cash acquired ....................... — — — — (16,561) (16,561)Trade loan repayments from customers ...................................... — — — — 42,460 42,460Trade loans advanced to customers ............................................. — — — — (25,369) (25,369)Other .............................................................................................. — — — — 16 16Discontinued operations............................................................... — — — — (2,817) (2,817)
Net cash used in investing activities............................................. (2,357) (200,249) — (1,014) (109,088) (312,708)CASH FLOWS FROM FINANCING ACTIVITIES:
Issuances of stock under equity compensation plans ................. 55,228 — — 1 — 55,229Dividends paid .............................................................................. (76,146) — — — (33,814) (109,960)Dividends paid to minority interests............................................ — — — — (10,569) (10,569)Proceeds from issuance of long-term debt .................................. — — 1,051,056 — (13,242) 1,037,814Payments on long-term debt and capital lease obligations ........ — — — — (584,056) (584,056)Proceeds from short-term borrowings......................................... — — 875,060 — 175,626 1,050,686Payments on short-term borrowings............................................ — — — — (1,887,558) (1,887,558)Net (payments on) proceeds from commercial paper ................ — 165,795 — — — 165,795Net (payments on) proceeds from revolving credit facilities..... — (12,500) (1,025,650) — 1,189,423 151,273Settlements on debt-related derivatives....................................... (11,285) — — — (11,285)Debt issuance costs ....................................................................... (4,635) — — — (6,822) (11,457)Change in overdraft balances and other ...................................... — 8,487 — — (328) 8,159Net activity in investments and advances (to) from
subisidaries ................................................................................ 115,435 (157,878) (893,182) (28,107) 963,732 —Discontinued operations............................................................... — — — — (42,846) (42,846)
Net cash provided by (used in) financing activities................... 78,597 3,904 7,284 (28,106) (250,454) (188,775)CASH AND CASH EQUIVALENTS:
Net (decrease) increase in cash and cash equivalents ................ (2,202) (15,719) 31 2,320 (63,638) (79,208)Effect of exchange rate changes on cash and cash
equivalents................................................................................. — — — 703 (5,095) (4,392)Balance at beginning of year......................................................... 3,200 16,988 — 2,552 100,273 123,013
Balance at end of year.................................................................... $998 $1,269 $31 $5,575 $31,540 $39,413
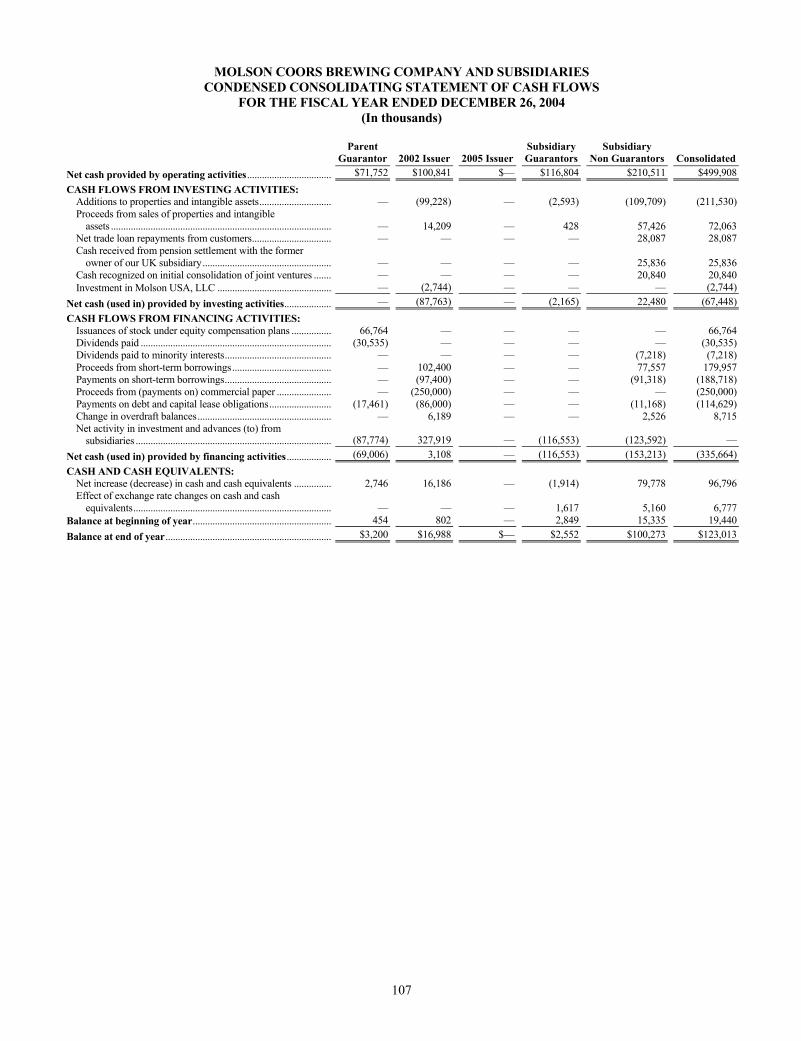
107
MOLSON COORS BREWING COMPANY AND SUBSIDIARIES CONDENSED CONSOLIDATING STATEMENT OF CASH FLOWS
FOR THE FISCAL YEAR ENDED DECEMBER 26, 2004 (In thousands)
Parent
Guarantor 2002 Issuer 2005 Issuer Subsidiary Guarantors
Subsidiary Non Guarantors Consolidated
Net cash provided by operating activities................................... $71,752 $100,841 $— $116,804 $210,511 $499,908CASH FLOWS FROM INVESTING ACTIVITIES:
Additions to properties and intangible assets.............................. — (99,228) — (2,593) (109,709) (211,530)Proceeds from sales of properties and intangible
assets .......................................................................................... — 14,209 — 428 57,426 72,063Net trade loan repayments from customers................................. — — — — 28,087 28,087Cash received from pension settlement with the former
owner of our UK subsidiary..................................................... — — — — 25,836 25,836Cash recognized on initial consolidation of joint ventures ........ — — — — 20,840 20,840Investment in Molson USA, LLC ............................................... — (2,744) — — — (2,744)
Net cash (used in) provided by investing activities.................... — (87,763) — (2,165) 22,480 (67,448)CASH FLOWS FROM FINANCING ACTIVITIES:
Issuances of stock under equity compensation plans ................. 66,764 — — — — 66,764Dividends paid .............................................................................. (30,535) — — — — (30,535)Dividends paid to minority interests............................................ — — — — (7,218) (7,218)Proceeds from short-term borrowings......................................... — 102,400 — — 77,557 179,957Payments on short-term borrowings............................................ — (97,400) — — (91,318) (188,718)Proceeds from (payments on) commercial paper ....................... — (250,000) — — — (250,000)Payments on debt and capital lease obligations.......................... (17,461) (86,000) — — (11,168) (114,629)Change in overdraft balances....................................................... — 6,189 — — 2,526 8,715Net activity in investment and advances (to) from
subsidiaries ................................................................................ (87,774) 327,919 — (116,553) (123,592) —Net cash (used in) provided by financing activities................... (69,006) 3,108 — (116,553) (153,213) (335,664)CASH AND CASH EQUIVALENTS:
Net increase (decrease) in cash and cash equivalents ................ 2,746 16,186 — (1,914) 79,778 96,796Effect of exchange rate changes on cash and cash
equivalents................................................................................. — — — 1,617 5,160 6,777Balance at beginning of year......................................................... 454 802 — 2,849 15,335 19,440Balance at end of year.................................................................... $3,200 $16,988 $— $2,552 $100,273 $123,013
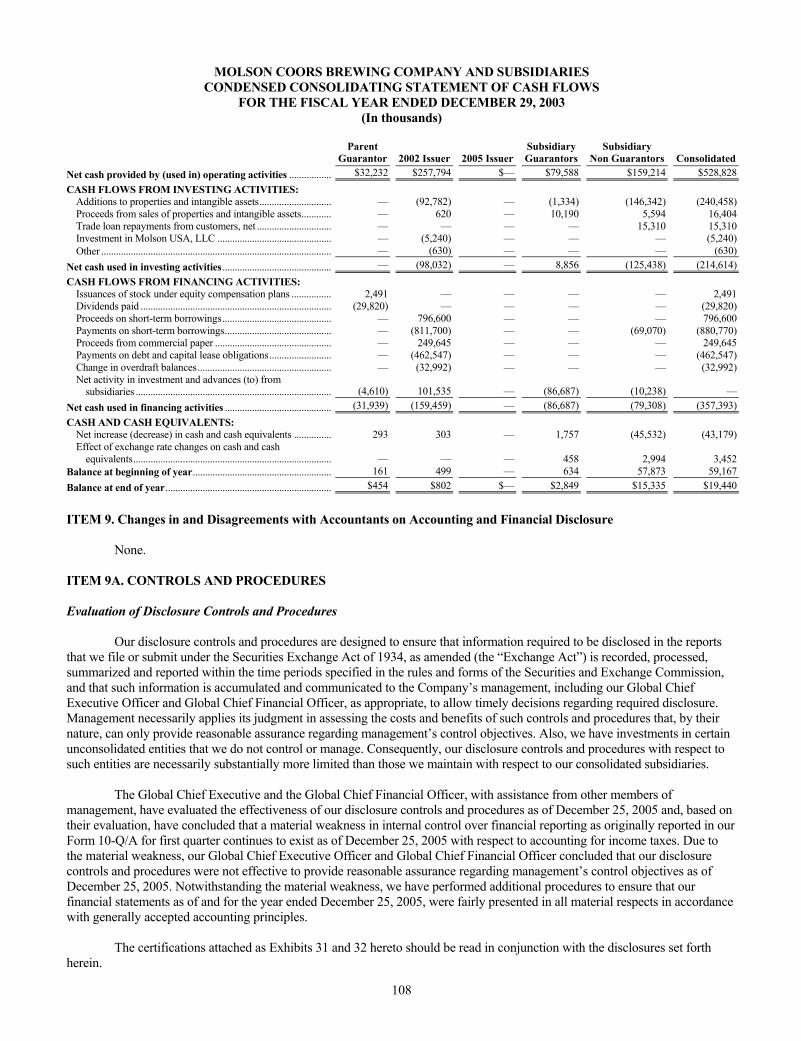
108
MOLSON COORS BREWING COMPANY AND SUBSIDIARIES CONDENSED CONSOLIDATING STATEMENT OF CASH FLOWS
FOR THE FISCAL YEAR ENDED DECEMBER 29, 2003 (In thousands)
Parent
Guarantor 2002 Issuer 2005 Issuer Subsidiary Guarantors
Subsidiary Non Guarantors Consolidated
Net cash provided by (used in) operating activities .................. $32,232 $257,794 $— $79,588 $159,214 $528,828CASH FLOWS FROM INVESTING ACTIVITIES:
Additions to properties and intangible assets.............................. — (92,782) — (1,334) (146,342) (240,458)Proceeds from sales of properties and intangible assets............. — 620 — 10,190 5,594 16,404Trade loan repayments from customers, net ............................... — — — — 15,310 15,310Investment in Molson USA, LLC ............................................... — (5,240) — — — (5,240)Other .............................................................................................. — (630) — — — (630)
Net cash used in investing activities............................................. — (98,032) — 8,856 (125,438) (214,614)CASH FLOWS FROM FINANCING ACTIVITIES:
Issuances of stock under equity compensation plans ................. 2,491 — — — — 2,491Dividends paid .............................................................................. (29,820) — — — — (29,820)Proceeds on short-term borrowings............................................. — 796,600 — — — 796,600Payments on short-term borrowings............................................ — (811,700) — — (69,070) (880,770)Proceeds from commercial paper ................................................ — 249,645 — — — 249,645Payments on debt and capital lease obligations.......................... — (462,547) — — — (462,547)Change in overdraft balances....................................................... — (32,992) — — — (32,992)Net activity in investment and advances (to) from
subsidiaries ................................................................................ (4,610) 101,535 — (86,687) (10,238) —Net cash used in financing activities ............................................ (31,939) (159,459) — (86,687) (79,308) (357,393)CASH AND CASH EQUIVALENTS:
Net increase (decrease) in cash and cash equivalents ................ 293 303 — 1,757 (45,532) (43,179)Effect of exchange rate changes on cash and cash
equivalents................................................................................. — — — 458 2,994 3,452Balance at beginning of year......................................................... 161 499 — 634 57,873 59,167Balance at end of year.................................................................... $454 $802 $— $2,849 $15,335 $19,440
ITEM 9. Changes in and Disagreements with Accountants on Accounting and Financial Disclosure None. ITEM 9A. CONTROLS AND PROCEDURES Evaluation of Disclosure Controls and Procedures Our disclosure controls and procedures are designed to ensure that information required to be disclosed in the reports that we file or submit under the Securities Exchange Act of 1934, as amended (the “Exchange Act”) is recorded, processed, summarized and reported within the time periods specified in the rules and forms of the Securities and Exchange Commission, and that such information is accumulated and communicated to the Company’s management, including our Global Chief Executive Officer and Global Chief Financial Officer, as appropriate, to allow timely decisions regarding required disclosure. Management necessarily applies its judgment in assessing the costs and benefits of such controls and procedures that, by their nature, can only provide reasonable assurance regarding management’s control objectives. Also, we have investments in certain unconsolidated entities that we do not control or manage. Consequently, our disclosure controls and procedures with respect to such entities are necessarily substantially more limited than those we maintain with respect to our consolidated subsidiaries. The Global Chief Executive and the Global Chief Financial Officer, with assistance from other members of management, have evaluated the effectiveness of our disclosure controls and procedures as of December 25, 2005 and, based on their evaluation, have concluded that a material weakness in internal control over financial reporting as originally reported in our Form 10-Q/A for first quarter continues to exist as of December 25, 2005 with respect to accounting for income taxes. Due to the material weakness, our Global Chief Executive Officer and Global Chief Financial Officer concluded that our disclosure controls and procedures were not effective to provide reasonable assurance regarding management’s control objectives as of December 25, 2005. Notwithstanding the material weakness, we have performed additional procedures to ensure that our financial statements as of and for the year ended December 25, 2005, were fairly presented in all material respects in accordance with generally accepted accounting principles. The certifications attached as Exhibits 31 and 32 hereto should be read in conjunction with the disclosures set forth herein.
109
Management’s Report on Internal Control over Financial Reporting Our management is responsible for establishing and maintaining adequate internal control over financial reporting as such term is defined in the Exchange Act Rule 13a—15(f). The Company’s internal control over financial reporting is a process designed to provide reasonable assurance regarding the reliability of financial reporting and the preparation of financial statements for external purposes in accordance with generally accepted accounting principles. The Global Chief Executive and the Global Chief Financial Officer, with assistance from other members of management, assessed the effectiveness of internal control over financial reporting as of December 25, 2005 based on the criteria established in Internal Control—Integrated Framework issued by the Committee of Sponsoring Organizations of the Treadway Commission. Based on its evaluation, management has concluded that a material weakness in internal control over financial reporting as originally reported in our Form 10-Q/A for the first quarter of 2005 continued to exist as of December 25, 2005 with respect to accounting for income taxes and therefore internal control over financial reporting was not effective as of December 25, 2005. A material weakness is a control deficiency, or combination of control deficiencies, that results in more than a remote likelihood that a material misstatement of the annual or interim financial statements will not be prevented or detected. As of December 25, 2005, the Company did not maintain effective controls over the completeness and accuracy of the income tax provision and related balance sheet accounts. Specifically, our controls over the processes and procedures related to the determination and review of the quarterly and annual tax provisions were not adequate to ensure that the income tax provision was prepared in accordance with generally accepted accounting principles. This control deficiency resulted in the restatement of the first quarter of 2005 as well as adjustments to the annual 2005 consolidated financial statements. Additionally, this control deficiency could result in a misstatement of the income tax provision and related balance sheet accounts that would result in a material misstatement to the annual or interim consolidated financial statements that would not be prevented or detected. Accordingly, management determined that this control deficiency constitutes a material weakness. Because the Molson Canada and Kaiser Brazil companies were merged into the Company in 2005 they were not required to be included in management’s assessment of internal controls over financial reporting for the year ended and, therefore, management excluded them from its assessment. Molson Canada is a wholly-owned subsidiary whose total assets and total revenues represent 50% and 28%, respectively, of the related consolidated financial statement amounts as of and for the year ended December 25, 2005. The Kaiser Brazil business unit is presented as a discontinued operation in the accompanying financial statements due to the sale of the business unit in January 2006 and whose total assets represent five percent of the consolidated financial statement amount as of December 25, 2005. The Company’s independent registered public accounting firm has audited and issued their report on management’s assessment of the effectiveness of internal control over financial reporting as of December 25, 2005 which appears herein. Remediation of Material Weakness in Internal Control over Financial Reporting As previously reported in our first quarter 2005 Quarterly Report on Form 10-Q/A, we had identified the above material weakness in internal control over financial reporting, which continues to exist as of December 25, 2005. Throughout 2005, we have been working to implement the following steps to remediate this material weakness:
• We have hired additional experienced tax staff including a new vice president of tax and two additional senior level tax managers;
• We have implemented additional procedures to ensure adequate levels of review in this area; and
• Although not complete as of December 25, 2005 we will be implementing new software that will automate and
improve controls in this activity. In addition to completing the implementation of new software that will automate and improve transparency and controls with respect to the preparation of the tax provision (our third remediation initiative noted above), we intend to continue to evaluate the need to implement additional internal controls as necessary and appropriate with respect to accounting for income taxes.
110
Changes in Internal Control over Financial Reporting There were no changes in internal control over financial reporting during the quarter ended December 25, 2005 that have materially affected, or are reasonably likely to materially affect the Company’s internal control over financial reporting. ITEM 9B. Other Information None.
PART III ITEM 10. Directors and Executive Officers of the Registrant Incorporated by reference to the Company’s definitive proxy statement. ITEM 11. Executive Compensation Incorporated by reference to the Company’s definitive proxy statement. ITEM 12. Security Ownership of Certain Beneficial Owners and Management and Related Stockholder Matters Information related to Security Ownership of Certain Beneficial Owners and Management is incorporated by reference to the Company’s definitive proxy statement. Equity Compensation Plan Information The following table summarizes information about the 1990 Adolph Coors Equity Incentive Plan (the “EI Plan”) and the Equity Compensation Plan for Non-Employee Directors as of December 25, 2005. All outstanding awards shown in the table below relate to our Class B common stock.
Plan Category
A Number of securities to be
issued upon exercise of outstanding options, warrants
and rights
B Weighted-average exercise
price of outstanding options, warrants and rights
C Number of securities remaining
available for future issuance under equity compensation plans (excluding securities
reflected in column A)
Equity compensation plans approved by security holders ........................................ 9,205,388(1)(2) $63.14(1)(2) 3,382,263(1)(2)
Equity compensation plans not approved by security holders ................................... None None None
(1) We may issue securities under our equity compensation plan in forms other than options, warrants or rights. Under the
EI Plan, we may issue Restricted Stock Awards, as that term is defined in the EI Plan. (2) In connection with the Merger, we exchanged approximately 1.3 million Molson stock options for Molson Coors stock
options under our EI Plan. In order to accommodate the exchange, the Compensation Committee of the Coors Board of Directors approved 5.0 million shares for exchange under the EI Plan in 2005.
As of December 25, 2005, there were 138,252 restricted stock units (RSUs) outstanding. These include shares with respect to which restrictions on ownership (i.e., vesting periods) lapsed as of the Merger on February 9, 2005, as well as RSUs issued subsequent to the Merger. RSUs are currently granted to executives. These restricted shares, along with common stock convertible equivalent units, accrue dividends which will be convertible into MCBC Class B stock at the end of three years and may be offered to a broader mix of employees beginning in 2006. These instruments are meant to reward exceptional performance and encourage retention. The number granted, if any, will be granted based upon performance. All unvested securities issued under the EI Plan and the Equity Compensation Plan for Non-Employee Directors vested immediately upon the Merger. For 2006, the Company has determined to maintain an emphasis on the performance-based annual incentive compensation program and to maintain the prior years’ practice of using stock options and RSUs to provide long-term
111
incentives. Performance shares, which will be convertible into MCBC Class B stock, will be issued under a new equity incentive plan and will be awarded, based upon achievement of Company performance measures to be approved by the Board. The Concept behind the performance shares is similar to the 2004 debt reduction plan for our executives, but will be offered to a broader group of employees. The performance period will be at least two years, but no more than five years to achieve established goals. If goals are not achieved, the shares will not be issued. ITEM 13. Certain Relationships and Related Transactions Incorporated by reference to the Company’s definitive proxy statement. ITEM 14. Principal Accountant Fees and Services Incorporated by reference to the Company’s definitive proxy statement.
PART IV ITEM 15. Exhibits and Financial Statement Schedules (a) Financial Statements, Financial Statement Schedules and Exhibits The following are filed as a part of this Report on Form 10-K
(1) Management’s Report to Stockholders
Report of Independent Registered Public Accounting Firm
Consolidated Statements of Income and Comprehensive Income for each of the three years in the period ended December 25, 2005
Consolidated Balance Sheets at December 25, 2005 and December 26, 2004
Consolidated Statements of Cash Flows for each of the three years in the period ended December 25, 2005
Consolidated Statements of Stockholders’ Equity for each of the three years in the period ended December 25, 2005
Notes to Consolidated Financial Statements
(2) Schedule II—Valuation and Qualifying Accounts for each of the three years in the period ended
December 25, 2005
(3) Exhibit list Exhibit Number
Document Description
2.1 Share Purchase Agreement between Coors Worldwide, Inc. and Adolph Coors Company and Interbrew, S.A., Interbrew UK Holdings Limited, Brandbrew S.A., and Golden Acquisition Limited dated December 24, 2001 and amended February 1, 2002 (incorporated by reference to Exhibit 2.1 to Form 8-K/A filed April 18, 2002).
2.2 Agreement and Plan of Merger dated August 14, 2003 by and between Adolph Coors Company, a Colorado corporation, and Adolph Coors Company, a Delaware corporation (incorporated by reference to Exhibit 2.1 to Form 8-K filed October 6, 2003).
2.3 Combination Agreement, dated as of July 21, 2004, by an among Adolph Coors Company, Coors Canada Inc. and Molson Inc., together with the exhibits U.C. thereto incorporated by reference to Exhibit 2.1 of our Current Report on Form 8-K filed August 4, 2004 as amended by Amendment No. 1 thereto (incorporated by reference to B-II of the Joint Proxy Statement/Management Information Circular on Schedule 14A, filed with the SEC on December 10, 2004) and by Amendment No. 2 thereto (incorporated by reference to Exhibit 2.1 to our Current Report on Form 8-K filed with the SEC on January 14, 2005).
112
Exhibit Number
Document Description
2.4 Plan of Arrangement Including Appendices (incorporated by reference to Annex D of the Joint Proxy Statement/Management Information Circular on Schedule 14A, filed with the SEC on December 10, 2004).
3.1 Restated Certificate of Incorporation of Molson Coors Brewing Company (incorporated by reference to Annex G of the Joint Proxy Statement/Management Information Circular on Schedule 14A, filed on December 9, 2004).
3.2 Amended and Restated Bylaws of Molson Coors Brewing Company (incorporated by reference to Annex H of the Joint Proxy Statement/Management Information Circular on Schedule 14A, filed on December 9, 2004).
4.1 Indenture, dated as of May 7, 2002, by and among the Issuer, the Guarantors and Deutsche Bank Trust Company Americas, as trustee (incorporated by reference to Exhibit 4.1 to the quarterly report on Form 10-Q for the quarter ended March 31, 2002).
4.2 First Supplemental Indenture, dated as of May 7, 2002 by and among the issuer, the Guarantors and Deutsche Bank Trust Company Americas, as trustee (incorporated by reference to Exhibit 4.2 to the quarterly report on Form 10-Q for the quarter ended March 31, 2002).
4.3 Credit Agreement dated as of February 1, 2002 among Adolph Coors Company, CBC, Golden Acquisition Limited, the lenders party thereto, Deutsche Bank Alex. Brown Inc., as Syndication Agent, JPMorgan Chase Bank, as Administrative Agent, and J.P. Morgan Europe Limited, as London Agent (incorporated by reference to Exhibit 10.15 to Form 10-K for the fiscal year ended December 30, 2001).
4.4 Bridge Credit Agreement dated as of February 1, 2002 among Adolph Coors Company, CBC, the lenders party thereto, Morgan Stanley Senior Funding, Inc., as Syndication Agent, JPMorgan Chase Bank, as Administrative Agent, and J.P. Morgan Europe Limited, as London Agent (incorporated by reference to Exhibit 10.16 to Form 10-K for the fiscal year ended December 30, 2001).
4.5 Amendment No. 4 to the Credit Agreement, dated as of November 24, 2004, among Adolph Coors Company, Coors Brewing Company, Golden Acquisition Limited, the lenders party thereto, Deutsche Bank Securities Inc., as Syndication Agent, J.P. Morgan Europe Limited, as London Agent, and JPMorgan Chase Bank, as administrative agent (incorporated by reference to Exhibit 99.1 to Form 8-K, filed February 15, 2005).
4.6 Registration Rights Agreement, dated as of February 9, 2005, among Adolph Coors Company, Pentland Securities (1981) Inc., 4280661 Canada Inc., Nooya Investments Ltd., Lincolnshire Holdings Limited, 4198832 Canada Inc., BAX Investments Limited, 6339522 Canada Inc., Barleycorn Investments Ltd., DJS Holdings Ltd., 6339549 Canada Inc., Hoopoe Holdings Ltd., 6339603 Canada Inc., and The Adolph Coors, Jr. Trust dated September 12, 1969 (incorporated by reference to Exhibit 99.2 to Form 8-K, filed February 15, 2005).
4.7 Molson Inc. 1988 Canadian Stock Option Plan, as revised (incorporated by reference to Exhibit 4.3 to Form S-8, filed February 8, 2005).
4.8 Molson Coors Brewing Company Incentive Compensation Plan (incorporated by reference to Exhibit 4.3 to Form S-8, filed April 18, 2005).
4.9 Indenture dated as of September 22, 2005, among Molson Coors Capital Finance ULC, Molson Coors Brewing Company, Coors Brewing Company, Coors Distributing Company, Coors International Market Development, L.L.L.P., Coors Worldwide, Inc., Coors Global Properties, Inc., Coors Intercontinental, Inc., and Coors Brewing Company International, Inc. and TD Banknorth, National Association and the Canada Trust Company as co-trustees (incorporated by reference to Exhibit 4.1 to Form S-4, filed October 19, 2005).
4.10 First Supplemental Indenture dated as of September 22, 2005, among Molson Coors Capital Finance ULC, Molson Coors Brewing Company, Coors Brewing Company, Coors Distributing Company, Coors International Market Development, L.L.L.P., Coors Worldwide, Inc., Coors Global Properties, Inc., Coors Intercontinental, Inc., and Coors Brewing Company International, Inc. and TD Banknorth, National Association as trustee (incorporated by reference to Exhibit 4.2 to Form S-4, filed October 19, 2005).
4.11 Second Supplemental Indenture dated as of September 22, 2005, among Molson Coors Capital Finance ULC, Molson Coors Brewing Company, Coors Brewing Company, Coors Distributing Company, Coors International Market Development, L.L.L.P., Coors Worldwide, Inc., Coors Global Properties, Inc., Coors Intercontinental, Inc., and Coors Brewing Company International, Inc. and The Canada Trust Company as trustee (incorporated by reference to Exhibit 4.3 to Form S-4, on October 19, 2005).
4.12 US $300,000,000 in aggregate principal amount of 4.85% Notes due 2010 (incorporated by reference to Exhibit 4.4 to Form S-4, filed October 19, 2005).
113
Exhibit Number
Document Description
4.13 Cdn $900,000,000 in aggregate principal amount of 5.00% Notes due 2015 (incorporated by reference to Exhibit 4.5 to Form 10-Q, filed November 4, 2005).
4.14 Registration Rights Agreement dated as of September 22, 2005, among Molson Coors Capital Finance ULC, Molson Coors Brewing Company, Coors Brewing Company, Coors Distributing Company, Coors International Market Development, L.L.L.P., Coors Worldwide, Inc., Coors Global Properties, Inc., Coors Intercontinental, Inc., and Coors Brewing Company International, Inc. and J.P. Morgan Securities Inc. and Morgan Stanley & Co. Incorporated as representatives of the several initial purchasers named in the related Purchase Agreement (incorporated by reference to Exhibit 4.5 to Form S-4, filed October 19, 2005).
4.15 Exchange Offer Agreement dated as of September 22, 2005, among Molson Coors Capital Finance ULC, Molson Coors Brewing Company, Coors Brewing Company, Coors Distributing Company, Coors International Market Development, L.L.L.P., Coors Worldwide, Inc., Coors Global Properties, Inc., Coors Intercontinental, Inc., and Coors Brewing Company International, Inc. and BMO Nesbitt Burns Inc., TD Securities Inc., J.P. Morgan Securities Inc., Morgan Stanley & Co. Incorporated, Deutsche Bank Securities Inc., Deutsche Bank Securities Limited, J.P. Morgan Securities Canada Inc., and Morgan Stanley Canada Limited, as the initial purchasers named in the related Canadian Purchase Agreement (incorporated by reference to Exhibit 4.7 to Form 10-Q, filed November 4, 2005).
10.1* Adolph Coors Company 1990 Equity Incentive Plan effective August 14, 2003, As Corrected and Conformed June 30, 2004 (incorporated by reference to Exhibit 10.1 to Form 10-Q, filed August 5, 2004).
10.2 Form of CBC Distributorship Agreement (incorporated by reference to Exhibit 10.20 to Form 10-K for the fiscal year ended December 29, 1996).
10.3* Adolph Coors Company Equity Compensation Plan for Non-Employee Directors, Amended and Restated effective November 13, 2003, As Corrected and Conformed June 30, 2004 (incorporated by reference to Exhibit 10.3 to Form 10-Q, filed with the SEC on August 5, 2004).
10.4 Distribution Agreement, dated as of October 5, 1992, between the Company and ACX Technologies, Inc. (incorporated herein by reference to the Distribution Agreement included as Exhibits 2, 19.1 and 19.1A to the Registration Statement on Form 10 filed by ACX Technologies, Inc. (file No. 0-20704) with the SEC on October 6, 1992, as amended).
10.5* Adolph Coors Company Stock Unit Plan (incorporated by reference to Exhibit 10.16 to Form 10-K for the fiscal year ended December 28, 1997) and 1999 Amendment (incorporated by reference to Exhibit 10.16 to Form 10-K for the fiscal year ended December 27, 1998).
10.8 Adolph Coors Company Water Augmentation Plan (incorporated by reference to Exhibit 10.12 to Form 10-K for the fiscal year ended December 31, 1989).
10.9* Amended form of change-in-control agreements for Chairman and for Chief Executive Officer (incorporated by reference to Exhibit 10.10 to Form 10-K for the fiscal year ended December 29, 2002).
10.10* Amended form of change-in-control agreements for other officers (incorporated by reference to Exhibit 10.11 to Form 10-K for the fiscal year ended December 29, 2002).
10.11 Supply agreement between CBC and Ball Metal Beverage Container Corp. dated November 12, 2001 (incorporated by reference to Exhibit 10.12 to Form 10-K for the fiscal year ended December 30, 2001).
10.12 Supply Agreement between Rocky Mountain Metal Container, LLC and CBC dated November 12, 2001 (incorporated by reference to Exhibit 10.13 to Form 8-K/A filed April 18, 2002).
10.13 Agreed and restated Global Master Services Agreement between CBC and EDS Information Services, LLC effective January 1, 2004 (filed pursuant to confidential treatment request) (incorporated by reference to Exhibit 10.13 to Form 10-K filed on March 12, 2004).
10.16* Adolph Coors Company Deferred Compensation Plan, As Amended and Restated effective January 1, 2002, As Corrected and Conformed June 30, 2004 (incorporated by reference to Exhibit 10.16 to Form 10-Q, filed with the SEC on August 5, 2004).
10.17 Purchase and sale agreement by and between Graphic Packaging Corporation and Coors Brewing Company (incorporated by reference to Exhibit 99.1 to the Form 8-K dated March 25, 2003, filed by Graphic Packaging International Corporation).
10.18 Supply agreement between CBC and Owens-Brockway, Inc. dated July 29, 2003, effective August 1, 2003 (incorporated by reference to Exhibit 10.20 to Form 10-Q for the quarter ended September 29, 2003).
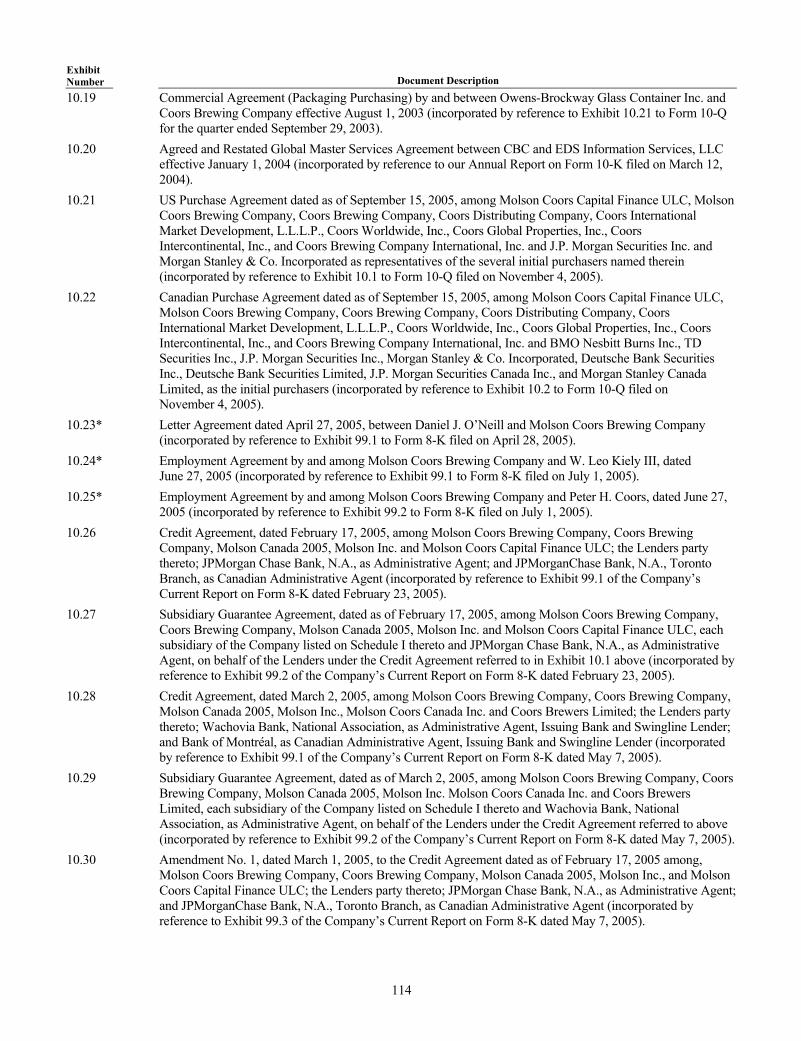
114
Exhibit Number
Document Description
10.19 Commercial Agreement (Packaging Purchasing) by and between Owens-Brockway Glass Container Inc. and Coors Brewing Company effective August 1, 2003 (incorporated by reference to Exhibit 10.21 to Form 10-Q for the quarter ended September 29, 2003).
10.20 Agreed and Restated Global Master Services Agreement between CBC and EDS Information Services, LLC effective January 1, 2004 (incorporated by reference to our Annual Report on Form 10-K filed on March 12, 2004).
10.21 US Purchase Agreement dated as of September 15, 2005, among Molson Coors Capital Finance ULC, Molson Coors Brewing Company, Coors Brewing Company, Coors Distributing Company, Coors International Market Development, L.L.L.P., Coors Worldwide, Inc., Coors Global Properties, Inc., Coors Intercontinental, Inc., and Coors Brewing Company International, Inc. and J.P. Morgan Securities Inc. and Morgan Stanley & Co. Incorporated as representatives of the several initial purchasers named therein (incorporated by reference to Exhibit 10.1 to Form 10-Q filed on November 4, 2005).
10.22 Canadian Purchase Agreement dated as of September 15, 2005, among Molson Coors Capital Finance ULC, Molson Coors Brewing Company, Coors Brewing Company, Coors Distributing Company, Coors International Market Development, L.L.L.P., Coors Worldwide, Inc., Coors Global Properties, Inc., Coors Intercontinental, Inc., and Coors Brewing Company International, Inc. and BMO Nesbitt Burns Inc., TD Securities Inc., J.P. Morgan Securities Inc., Morgan Stanley & Co. Incorporated, Deutsche Bank Securities Inc., Deutsche Bank Securities Limited, J.P. Morgan Securities Canada Inc., and Morgan Stanley Canada Limited, as the initial purchasers (incorporated by reference to Exhibit 10.2 to Form 10-Q filed on November 4, 2005).
10.23* Letter Agreement dated April 27, 2005, between Daniel J. O’Neill and Molson Coors Brewing Company (incorporated by reference to Exhibit 99.1 to Form 8-K filed on April 28, 2005).
10.24* Employment Agreement by and among Molson Coors Brewing Company and W. Leo Kiely III, dated June 27, 2005 (incorporated by reference to Exhibit 99.1 to Form 8-K filed on July 1, 2005).
10.25* Employment Agreement by and among Molson Coors Brewing Company and Peter H. Coors, dated June 27, 2005 (incorporated by reference to Exhibit 99.2 to Form 8-K filed on July 1, 2005).
10.26 Credit Agreement, dated February 17, 2005, among Molson Coors Brewing Company, Coors Brewing Company, Molson Canada 2005, Molson Inc. and Molson Coors Capital Finance ULC; the Lenders party thereto; JPMorgan Chase Bank, N.A., as Administrative Agent; and JPMorganChase Bank, N.A., Toronto Branch, as Canadian Administrative Agent (incorporated by reference to Exhibit 99.1 of the Company’s Current Report on Form 8-K dated February 23, 2005).
10.27 Subsidiary Guarantee Agreement, dated as of February 17, 2005, among Molson Coors Brewing Company, Coors Brewing Company, Molson Canada 2005, Molson Inc. and Molson Coors Capital Finance ULC, each subsidiary of the Company listed on Schedule I thereto and JPMorgan Chase Bank, N.A., as Administrative Agent, on behalf of the Lenders under the Credit Agreement referred to in Exhibit 10.1 above (incorporated by reference to Exhibit 99.2 of the Company’s Current Report on Form 8-K dated February 23, 2005).
10.28 Credit Agreement, dated March 2, 2005, among Molson Coors Brewing Company, Coors Brewing Company, Molson Canada 2005, Molson Inc., Molson Coors Canada Inc. and Coors Brewers Limited; the Lenders party thereto; Wachovia Bank, National Association, as Administrative Agent, Issuing Bank and Swingline Lender; and Bank of Montréal, as Canadian Administrative Agent, Issuing Bank and Swingline Lender (incorporated by reference to Exhibit 99.1 of the Company’s Current Report on Form 8-K dated May 7, 2005).
10.29 Subsidiary Guarantee Agreement, dated as of March 2, 2005, among Molson Coors Brewing Company, Coors Brewing Company, Molson Canada 2005, Molson Inc. Molson Coors Canada Inc. and Coors Brewers Limited, each subsidiary of the Company listed on Schedule I thereto and Wachovia Bank, National Association, as Administrative Agent, on behalf of the Lenders under the Credit Agreement referred to above (incorporated by reference to Exhibit 99.2 of the Company’s Current Report on Form 8-K dated May 7, 2005).
10.30 Amendment No. 1, dated March 1, 2005, to the Credit Agreement dated as of February 17, 2005 among, Molson Coors Brewing Company, Coors Brewing Company, Molson Canada 2005, Molson Inc., and Molson Coors Capital Finance ULC; the Lenders party thereto; JPMorgan Chase Bank, N.A., as Administrative Agent; and JPMorganChase Bank, N.A., Toronto Branch, as Canadian Administrative Agent (incorporated by reference to Exhibit 99.3 of the Company’s Current Report on Form 8-K dated May 7, 2005).
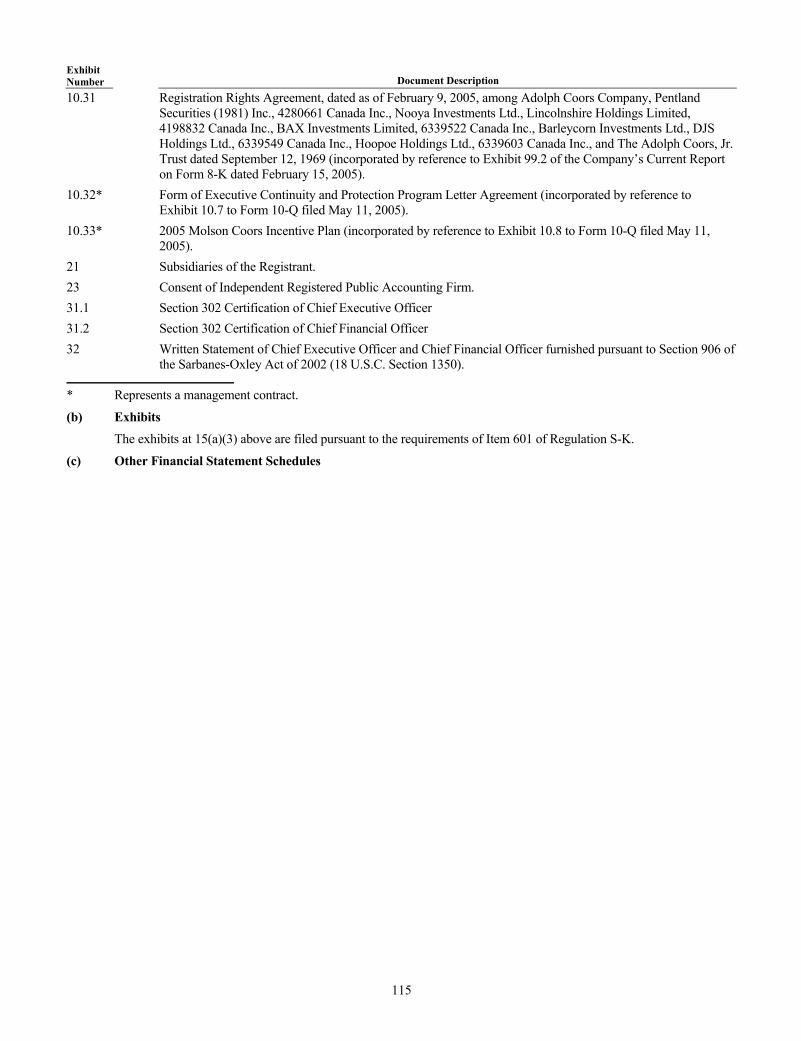
115
Exhibit Number
Document Description
10.31 Registration Rights Agreement, dated as of February 9, 2005, among Adolph Coors Company, Pentland Securities (1981) Inc., 4280661 Canada Inc., Nooya Investments Ltd., Lincolnshire Holdings Limited, 4198832 Canada Inc., BAX Investments Limited, 6339522 Canada Inc., Barleycorn Investments Ltd., DJS Holdings Ltd., 6339549 Canada Inc., Hoopoe Holdings Ltd., 6339603 Canada Inc., and The Adolph Coors, Jr. Trust dated September 12, 1969 (incorporated by reference to Exhibit 99.2 of the Company’s Current Report on Form 8-K dated February 15, 2005).
10.32* Form of Executive Continuity and Protection Program Letter Agreement (incorporated by reference to Exhibit 10.7 to Form 10-Q filed May 11, 2005).
10.33* 2005 Molson Coors Incentive Plan (incorporated by reference to Exhibit 10.8 to Form 10-Q filed May 11, 2005).
21 Subsidiaries of the Registrant. 23 Consent of Independent Registered Public Accounting Firm. 31.1 Section 302 Certification of Chief Executive Officer 31.2 Section 302 Certification of Chief Financial Officer 32 Written Statement of Chief Executive Officer and Chief Financial Officer furnished pursuant to Section 906 of
the Sarbanes-Oxley Act of 2002 (18 U.S.C. Section 1350).
* Represents a management contract.
(b) Exhibits The exhibits at 15(a)(3) above are filed pursuant to the requirements of Item 601 of Regulation S-K.
(c) Other Financial Statement Schedules
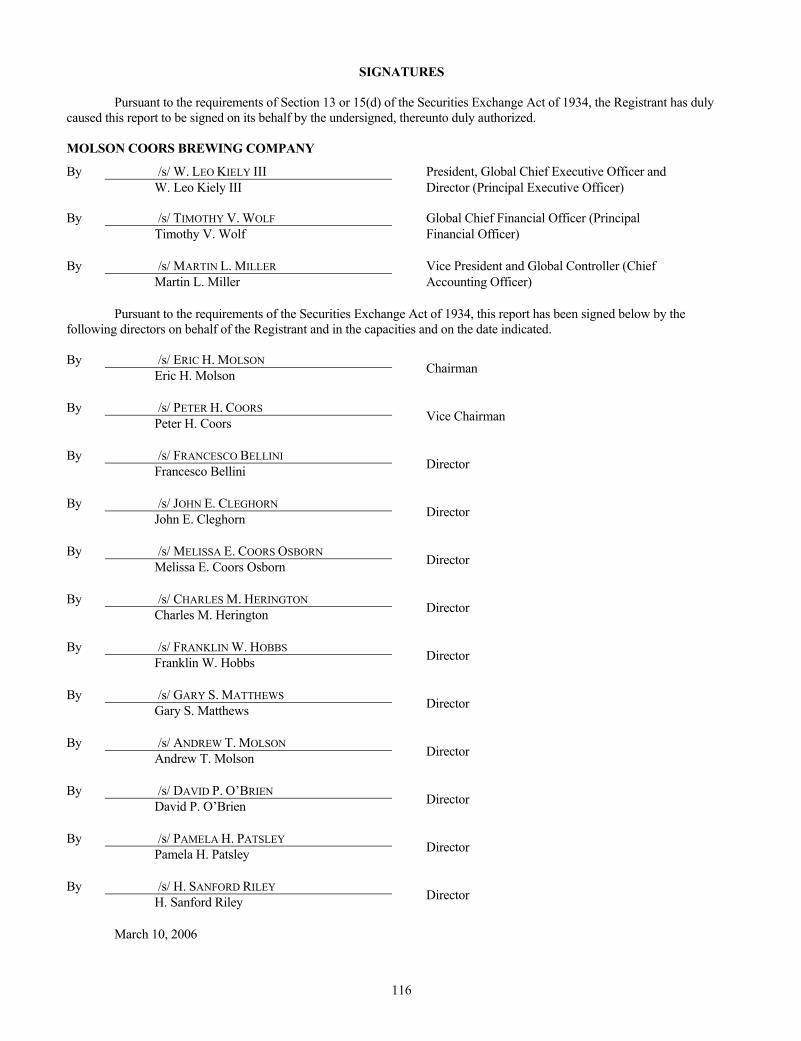
116
SIGNATURES Pursuant to the requirements of Section 13 or 15(d) of the Securities Exchange Act of 1934, the Registrant has duly caused this report to be signed on its behalf by the undersigned, thereunto duly authorized. MOLSON COORS BREWING COMPANY
By /s/ W. LEO KIELY III President, Global Chief Executive Officer and W. Leo Kiely III Director (Principal Executive Officer) By /s/ TIMOTHY V. WOLF Global Chief Financial Officer (Principal Timothy V. Wolf Financial Officer) By /s/ MARTIN L. MILLER Vice President and Global Controller (Chief Martin L. Miller Accounting Officer) Pursuant to the requirements of the Securities Exchange Act of 1934, this report has been signed below by the following directors on behalf of the Registrant and in the capacities and on the date indicated. By /s/ ERIC H. MOLSON Eric H. Molson Chairman
By /s/ PETER H. COORS Peter H. Coors Vice Chairman
By /s/ FRANCESCO BELLINI Francesco Bellini Director
By /s/ JOHN E. CLEGHORN John E. Cleghorn Director
By /s/ MELISSA E. COORS OSBORN Melissa E. Coors Osborn Director
By /s/ CHARLES M. HERINGTON Charles M. Herington Director
By /s/ FRANKLIN W. HOBBS Franklin W. Hobbs Director
By /s/ GARY S. MATTHEWS Gary S. Matthews Director
By /s/ ANDREW T. MOLSON Andrew T. Molson Director
By /s/ DAVID P. O’BRIEN David P. O’Brien Director
By /s/ PAMELA H. PATSLEY Pamela H. Patsley Director
By /s/ H. SANFORD RILEY H. Sanford Riley Director
March 10, 2006

117
SCHEDULE II
VALUATION AND QUALIFYING ACCOUNTS MOLSON COORS BREWING COMPANY AND SUBSIDIARIES
(In thousands)
Balance at beginning
of year
Acquiredwith
Molson
Additions charged to costs and
expenses(2) Deductions(1)
Foreign exchange
impact Balance at end of year
Allowance for doubtful accounts—trade accounts receivable
Year ended: December 25, 2005................................................ $9,110 $1,736 $1,534 $(2,150) $(750) $9,480December 26, 2004................................................ 12,413 — 2,158 (7,458) 1,997 9,110December 28, 2003................................................ 14,334 — 836 (3,973) 1,216 12,413Allowance for doubtful accounts—current
trade loans Year ended: December 25, 2005................................................ $3,883 $— $1,024 $(887) $(391) $3,629December 26, 2004................................................ 4,641 — 385 (1,468) 325 3,883December 28, 2003................................................ 6,582 — (37) (2,389) 485 4,641Allowance for doubtful accounts—long term
trade loans Year ended: December 25, 2005................................................ $11,053 $— $2,916 $(2,523) $(1,117) $10,329December 26, 2004................................................ 12,548 — 1,097 (3,539) 947 11,053December 28, 2003................................................ 17,794 — (100) (6,456) 1,310 12,548Allowance for obsolete inventories and
supplies Year ended: December 25, 2005................................................ $11,564 $69 $16,655 $(15,718) $(637) $11,933December 26, 2004................................................ 15,911 — 28,117 (33,073) 609 11,564December 28, 2003................................................ 15,024 — 16,512 (16,451) 826 15,911
(1) Write-offs of uncollectible accounts, claims or obsolete inventories and supplies. (2) Negative adjustments reflect recoveries.
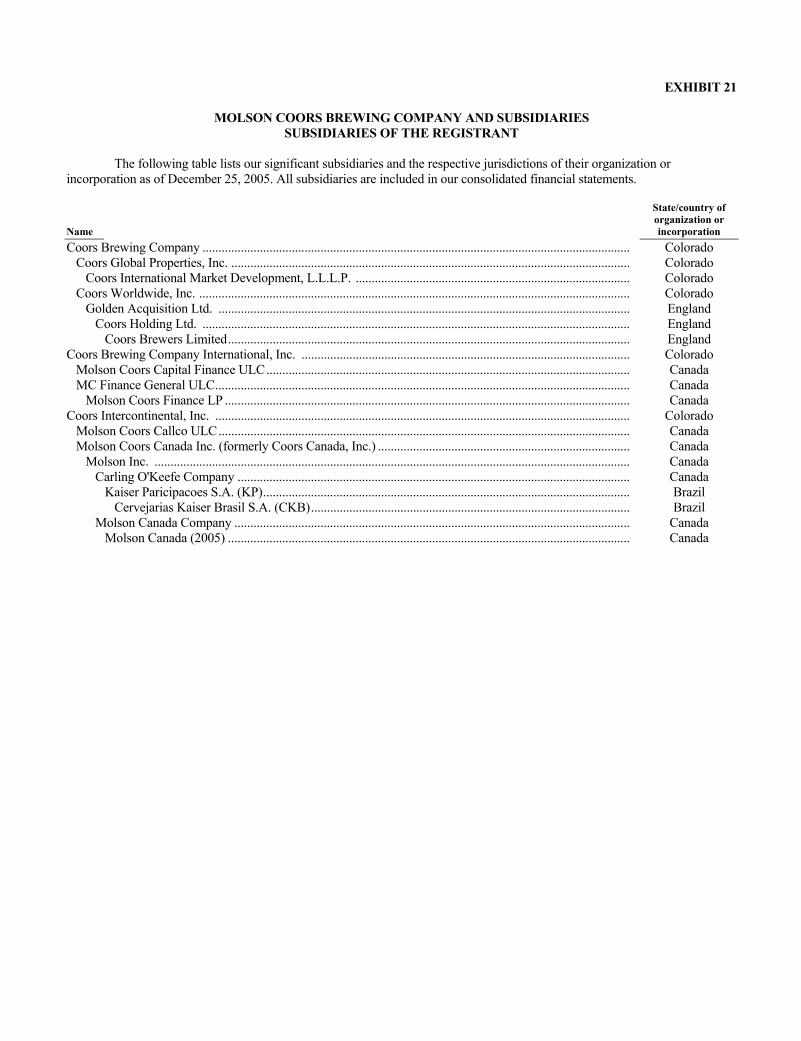
EXHIBIT 21
MOLSON COORS BREWING COMPANY AND SUBSIDIARIES
SUBSIDIARIES OF THE REGISTRANT The following table lists our significant subsidiaries and the respective jurisdictions of their organization or incorporation as of December 25, 2005. All subsidiaries are included in our consolidated financial statements.
Name
State/country of organization or incorporation
Coors Brewing Company ...................................................................................................................................... Colorado Coors Global Properties, Inc. ............................................................................................................................. Colorado
Coors International Market Development, L.L.L.P. ...................................................................................... Colorado Coors Worldwide, Inc. ....................................................................................................................................... Colorado
Golden Acquisition Ltd. ................................................................................................................................. England Coors Holding Ltd. ...................................................................................................................................... England
Coors Brewers Limited.............................................................................................................................. England Coors Brewing Company International, Inc. ....................................................................................................... Colorado
Molson Coors Capital Finance ULC.................................................................................................................. Canada MC Finance General ULC.................................................................................................................................. Canada
Molson Coors Finance LP ............................................................................................................................... Canada Coors Intercontinental, Inc. .................................................................................................................................. Colorado
Molson Coors Callco ULC................................................................................................................................. Canada Molson Coors Canada Inc. (formerly Coors Canada, Inc.) ............................................................................... Canada
Molson Inc. ..................................................................................................................................................... Canada Carling O'Keefe Company ........................................................................................................................... Canada
Kaiser Paricipacoes S.A. (KP)................................................................................................................... Brazil Cervejarias Kaiser Brasil S.A. (CKB).................................................................................................... Brazil
Molson Canada Company ............................................................................................................................ Canada Molson Canada (2005) .............................................................................................................................. Canada
EXHIBIT 23
CONSENT OF INDEPENDENT REGISTERED PUBLIC ACCOUNTING FIRM
We hereby consent to the incorporation by reference in the Registration Statements on Form S-8 (Nos. 33-35035, 33-40730, 33-59979, 333-45869, 333-103573, 333-59516, 333-38378 and 333-122628) and Form S-3 (333-120776) of Molson Coors Brewing Company of our report dated March 10, 2006, relating to the consolidated financial statements, financial statement schedule, management's assessment of internal control over financial reporting and the effectiveness of internal control over financial reporting, which appear in this Annual Report on Form 10-K. PricewaterhouseCoopers LLP Denver, Colorado March 10, 2006
EXHIBIT 31.1
SECTION 302 CERTIFICATION OF CHIEF EXECUTIVE OFFICER
I, W. Leo Kiely III, certify that: 1. I have reviewed this annual report on Form 10-K of Molson Coors Brewing Company; 2. Based on my knowledge, this report does not contain any untrue statement of a material fact or omit to state a material
fact necessary to make the statements made, in light of the circumstances under which such statements were made, not misleading with respect to the period covered by this report;
3. Based on my knowledge, the financial statements, and other financial information included in this report, fairly present
in all material respects the financial condition, results of operations and cash flows of the registrant as of, and for, the periods presented in this report;
4. The registrant's other certifying officer and I are responsible for establishing and maintaining disclosure controls and
procedures (as defined in Exchange Act Rules 13a-15(e) and 15d-15(e)) and internal control over financial reporting (as defined in Exchange Act Rules 13a-15(f) and 15d-15(f)) for the registrant and have:
a) Designed such disclosure controls and procedures, or caused such disclosure controls and procedures to be
designed under our supervision, to ensure that material information relating to the registrant, including its consolidated subsidiaries, is made known to us by others within those entities, particularly during the period in which this report is being prepared;
b) Designed such internal control over financial reporting, or caused such internal control over financial
reporting to be designed under our supervision, to provide reasonable assurance regarding the reliability of financial reporting and the preparation of financial statements for external purposes in accordance with generally accepted accounting principles;
c) Evaluated the effectiveness of the registrant's disclosure controls and procedures and presented in this report
our conclusions about the effectiveness of the disclosure controls and procedures, as of the end of the period covered by this report based on such evaluation; and
d) Disclosed in this report any change in the registrant's internal control over financial reporting that occurred
during the registrant's fourth fiscal quarter that has materially affected, or is reasonably likely to materially affect, the registrant's internal control over financial reporting; and
5. The registrant's other certifying officer and I have disclosed, based on our most recent evaluation of internal control
over financial reporting, to the registrant's auditors and the audit committee of the registrant's board of directors: a) All significant deficiencies and material weaknesses in the design or operation of internal control over
financial reporting which are reasonably likely to adversely affect the registrant's ability to record, process, summarize and report financial information; and
b) Any fraud, whether or not material, that involves management or other employees who have a significant role
in the registrant's internal control over financial reporting. March 10, 2006 /s/ W. LEO KIELY III
W. Leo Kiely III President, Global Chief Executive Officer and Director (Principal Executive Officer)
EXHIBIT 31.2
SECTION 302 CERTIFICATION OF CHIEF FINANCIAL OFFICER
I, Timothy V. Wolf, certify that: 1. I have reviewed this annual report on Form 10-K of Molson Coors Brewing Company; 2. Based on my knowledge, this report does not contain any untrue statement of a material fact or omit to state a material
fact necessary to make the statements made, in light of the circumstances under which such statements were made, not misleading with respect to the period covered by this report;
3. Based on my knowledge, the financial statements, and other financial information included in this report, fairly present
in all material respects the financial condition, results of operations and cash flows of the registrant as of, and for, the periods presented in this report;
4. The registrant's other certifying officer and I are responsible for establishing and maintaining disclosure controls and
procedures (as defined in Exchange Act Rules 13a-15(e) and 15d-15(e)) and internal control over financial reporting (as defined in Exchange Act Rules 13a-15(f) and 15d-15(f)) for the registrant and have:
a) Designed such disclosure controls and procedures, or caused such disclosure controls and procedures to be
designed under our supervision, to ensure that material information relating to the registrant, including its consolidated subsidiaries, is made known to us by others within those entities, particularly during the period in which this report is being prepared;
b) Designed such internal control over financial reporting, or caused such internal control over financial
reporting to be designed under our supervision, to provide reasonable assurance regarding the reliability of financial reporting and the preparation of financial statements for external purposes in accordance with generally accepted accounting principles;
c) Evaluated the effectiveness of the registrant's disclosure controls and procedures and presented in this report
our conclusions about the effectiveness of the disclosure controls and procedures, as of the end of the period covered by this report based on such evaluation; and
d) Disclosed in this report any change in the registrant's internal control over financial reporting that occurred
during the registrant's fourth fiscal quarter that has materially affected, or is reasonably likely to materially affect, the registrant's internal control over financial reporting; and
5. The registrant's other certifying officer and I have disclosed, based on our most recent evaluation of internal control
over financial reporting, to the registrant's auditors and the audit committee of the registrant's board of directors:
a) All significant deficiencies and material weaknesses in the design or operation of internal control over financial reporting which are reasonably likely to adversely affect the registrant's ability to record, process, summarize and report financial information; and
b) Any fraud, whether or not material, that involves management or other employees who have a significant role
in the registrant's internal control over financial reporting. March 10, 2006 /s/ TIMOTHY V. WOLF
Timothy V. Wolf Global Chief Financial Officer (Principal Financial Officer
EXHIBIT 32
WRITTEN STATEMENT OF CHIEF EXECUTIVE OFFICER
AND CHIEF FINANCIAL OFFICER FURNISHED PURSUANT TO SECTION 906
OF THE SARBANES-OXLEY ACT OF 2002 (18 U.S.C. SECTION 1350) AND FOR THE PURPOSE OF COMPLYING WITH RULE 13a-14(b)
OF THE SECURITIES EXCHANGE ACT OF 1934. The undersigned, the Chief Executive Officer and the Chief Financial Officer of Molson Coors Brewing Company (the "Company") respectively, each hereby certifies that to his knowledge on the date hereof:
a) the Annual Report on Form 10-K of the Company for the year ended December 25, 2005 filed on the date hereof with the Securities and Exchange Commission (the "Report") fully complies with the requirements of Section 13(a) or 15(d) of the Securities Exchange Act of 1934; and
b) information contained in the Report fairly presents, in all material respects, the financial condition and results
of operations of the Company.
/s/ W. LEO KIELY III W. Leo Kiely III President, Global Chief Executive Officer and Director (Principal Executive Officer) March 10, 2006
/s/ TIMOTHY V. WOLF Timothy V. Wolf Global Chief Financial Officer (Principal Financial Officer) March 10, 2006
A signed original of this written statement required by Section 906, or other document authenticating, acknowledging, or otherwise adopting the signature that appears in typed form within the electronic version of this written statement required by Section 906, has been provided to the Company and will be retained by the Company and furnished to the Securities and Exchange Commission or its staff upon request.
Investor Information
Shareholder RelationsQuestions about stock ownership and dividends should bedirected to Shareholder Relations, (303) 277-7759. Shareholdersmay obtain a copy of the Company’s 2005 Annual Report orForm 10-K filed with the Securities and Exchange Commissionby visiting our website, www.molsoncoors.com; by writing to theConsumer Information Center, Mail No. NH475, Molson CoorsBrewing Company, P.O. Box 4030, Golden, Colorado 80401; orby calling Coors Brewing Company at 800 642-6116, or MolsonCanada at 800 MOLSON 1 (800 665-7661).
Investor RelationsSecurities analysts, investment professionals and shareholderswith business-related inquiries regarding Molson Coors BrewingCompany should contact Dave Dunnewald or Kevin Caulfield inInvestor Relations, (303) 279-6565.
Customer/News Media RelationsCustomers are invited to contact our Consumer Information Center,by calling the Coors Brewing Company (CBC) at 800 642-6116,or Molson Canada at 800 MOLSON 1 (800 665-7661).
The news media should direct questions to CorporateCommunications, (514) 590-6341 FAX, (514) 590-6332
Transfer AgentsFor TAP.A and TAP.B stockComputershare Trust Company, N.A., Shareholder Services,P.O. Box 43078, Providence, Rhode Island 02940-3078, tel.(781) 575-3400 or access the website, www.computershare.com.
For TPX.NV and TPX.LVA sharesCIBC Mellon Trust Company, 2001 University Street, Suite 1600,Montreal Quebec H3A 2A6 or P.O. Box 700, Station B, Montreal,Quebec H3B 2K3, (514) 285-3600, or access the website atwww.cibcmellon.com, or email at [email protected].
Stock InformationMolson Coors Brewing CompanyClass B common stock non-voting – NYSE: TAP; TSX: TAP.NVClass A common stock voting – NYSE: TAP.A; TSX: TAP.LVA
Molson Coors Canada, Inc.Class B exchangeable shares – TSX: TPX.NVClass A exchangeable shares – TSX: TPX.LVA
Dividends on the common stock have historically been paid inthe months of March, June, September and December to stock-holders of record on the last business day of the preceding month.The company intends to pay an equivalent dividend to holders of exchangeable shares in Canadian dollars.
The Company’s current dividend rate is US $0.32 per common share and the Canadian dollar equivalent for theexchangeable shares.
Equal Opportunity at Molson Coors BrewingMolson Coors Brewing Company employs over 10,200 peopleworldwide, which includes approximately 3,000 in Canada,3,000 in the United Kingdom, and 4,200 in the United States,maintaining a long-standing commitment to equal opportunity in the areas of employment, promotion and purchasing.
The Company has a policy, which prohibits discrimination on the basis of race, color, national origin, sexual orientation,religion, disability, veteran status, gender or age.
CertificationsA CEO certification regarding the company’s compliance with thecorporate governance listing standards of the New York StockExchange, has been submitted to the Exchange as required by itslisting rules. In addition, the CEO and CFO certifications regardingthe quality of the company’s public disclosure, as required bySection 302 of the Sarbanes-Oxley Act of 2002, have beenincluded as exhibits to the Company’s Form 10-K for the yearended December 25, 2005 as filed with the SEC.
Des
ign:
Coa
tes
and
Coa
tes.
Writ
ing:
Dov
etai
l Com
mun
icat
ions
. Pr
intin
g: G
raph
ic P
ress
,Inc
.

Molson Coors Brewing Company
Denver Montreal1225 17th Street 1555 Notre-Dame Street East Denver, CO 80202 Montreal, Quebec H2L 2R5 303-277-3500 514-521-1786
www.molsoncoors.com