Molson Coors Brewing Company 2016 NY Investor/Analyst Meeting
97
JUNE 8, 2016 MOLSON COORS BREWING COMPANY ANNUAL NEW YORK INVESTOR/ANALYST MEETING
-
Upload
molsoncoorsir -
Category
Investor Relations
-
view
11.754 -
download
3
Transcript of Molson Coors Brewing Company 2016 NY Investor/Analyst Meeting
J U N E 8 , 2 0 1 6
M O L S O N C O O R S B R E W I N G C O M PA N Y
A N N U A L N E W Y O R K I N V E S T O R / A N A LY S T M E E T I N G
M A R K H U N T E R
P R E S I D E N T & C E OM O L S O N C O O R S B R E W I N G C O M PA N Y
3
F O RWA R D L O O K I N G S TAT E M E N T
This presentation includes estimates or projections that constitute “forward-looking statements” within the meaning of the U.S. federal securities laws. Generally, the words “believe,” "expect,” "intend,” "anticipate,” “project,” “will,” and similar expressions identify forward-looking statements, which generally are not historic in nature. Although the Company believes that the assumptions upon which its forward-looking statements are based are reasonable, it can give no assurance that these assumptions will prove to be correct. Important factors that could cause actual results to differ materially from the Company’s historical experience, and present projections and expectations are disclosed in the Company’s filings with the Securities and Exchange Commission (“SEC”), including in "Risk Factors" in our Annual Report on Form 10-K for the year-ended December 31, 2015. These factors include, among others, our ability to successfully close, finance and integrate the acquisition; our ability to achieve expected tax benefits, accretion and cost synergies; our ability to obtain necessary regulatory approvals for the acquisition; impact of increased competition resulting from further consolidation of brewers, competitive pricing and productpressures; health of the beer industry and our brands in our markets; economic conditions in our markets; additional impairment charges; our ability to maintain manufacturer/distribution agreements; changes in our supply chain system; availability or increase in the cost of packaging materials; success of our joint ventures; risks relating to operations in developing and emerging markets; changes in legal and regulatory requirements, including the regulation of distribution systems; fluctuations in foreign currency exchange rates; increase in the cost of commodities used in the business; the impact of climate change and the availability and quality of water; loss or closure of a major brewery or other key facility; our ability to implement our strategic initiatives, including executing and realizing cost savings; our ability to successfully integrate newlyacquired businesses; pension plan costs; failure to comply with debt covenants or deterioration in our credit rating; our ability to maintain good labor relations; our ability to maintain brand image, reputation and product quality; lack of full-control over the operations of MillerCoors and other risks discussed in our filings with the SEC, including our Annual Report on Form 10-K for the year-ended December 31, 2015. All forward-looking statements in this presentation are expressly qualified by such cautionary statements and by reference to the underlying assumptions. You should not place undue reliance on forward-looking statements, which speak only as of the date they are made. We do not undertake to update forward-looking statements, whether as a result of new information, future events or otherwise.
4
TO D AY ’ S A G E N D A
MARK HUNTER, CEO, MOLSON COORS• Introductions, corporate overview, strategic focus and growth opportunities
BUSINESS UNIT PRESENTATIONS• Gavin Hattersley, CEO, MillerCoors
• Stewart Glendinning, CEO, Molson Coors Canada
• Simon Cox, CEO, Molson Coors Europe
• Kandy Anand, CEO, Molson Coors International
MAURICIO RESTREPO, CFO, MOLSON COORS • Strategies to grow profit, cash, total shareholder return
CLOSING REMARKSQ&A WITH FULL LEADERSHIP TEAMRECEPTION
5
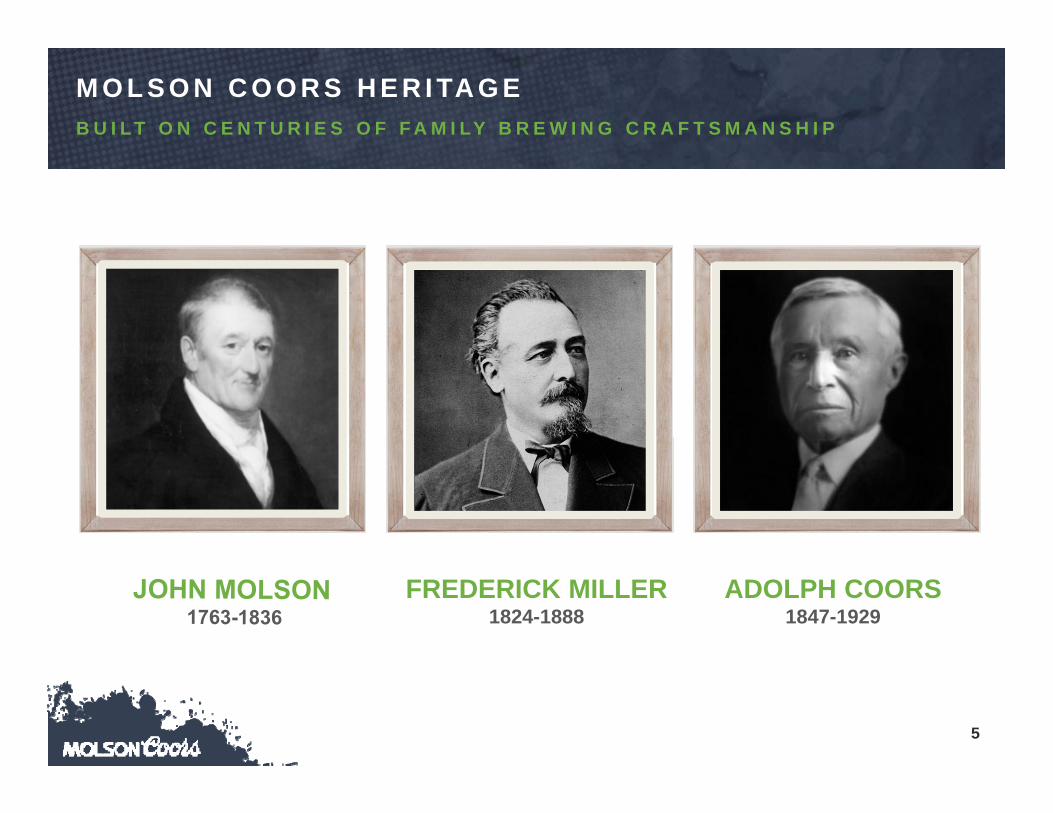
M O L S O N C O O R S H E R I TA G EB U I L T O N C E N T U R I E S O F F A M I LY B R E W I N G C R A F T S M A N S H I P
ADOLPH COORS 1847-1929
FREDERICK MILLER 1824-1888
6
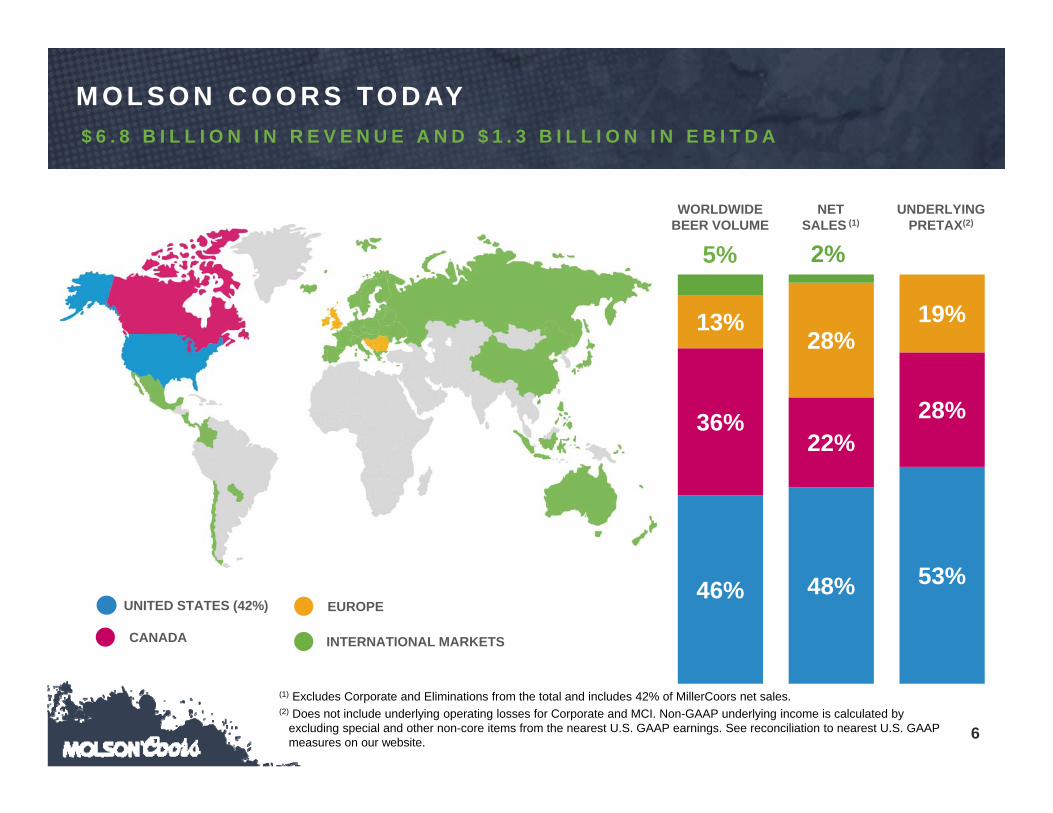
M O L S O N C O O R S TO D AY$ 6 . 8 B I L L I O N I N R E V E N U E A N D $ 1 . 3 B I L L I O N I N E B I T D A
(1) Excludes Corporate and Eliminations from the total and includes 42% of MillerCoors net sales.(2) Does not include underlying operating losses for Corporate and MCI. Non-GAAP underlying income is calculated by
excluding special and other non-core items from the nearest U.S. GAAP earnings. See reconciliation to nearest U.S. GAAP measures on our website.
EUROPE
CANADA
UNITED STATES (42%)
INTERNATIONAL MARKETS
46% 48% 53%
36%22%
28%
13%28%
19%
2%
WORLDWIDEBEER VOLUME
NETSALES (1)
UNDERLYINGPRETAX(2)
5%
7
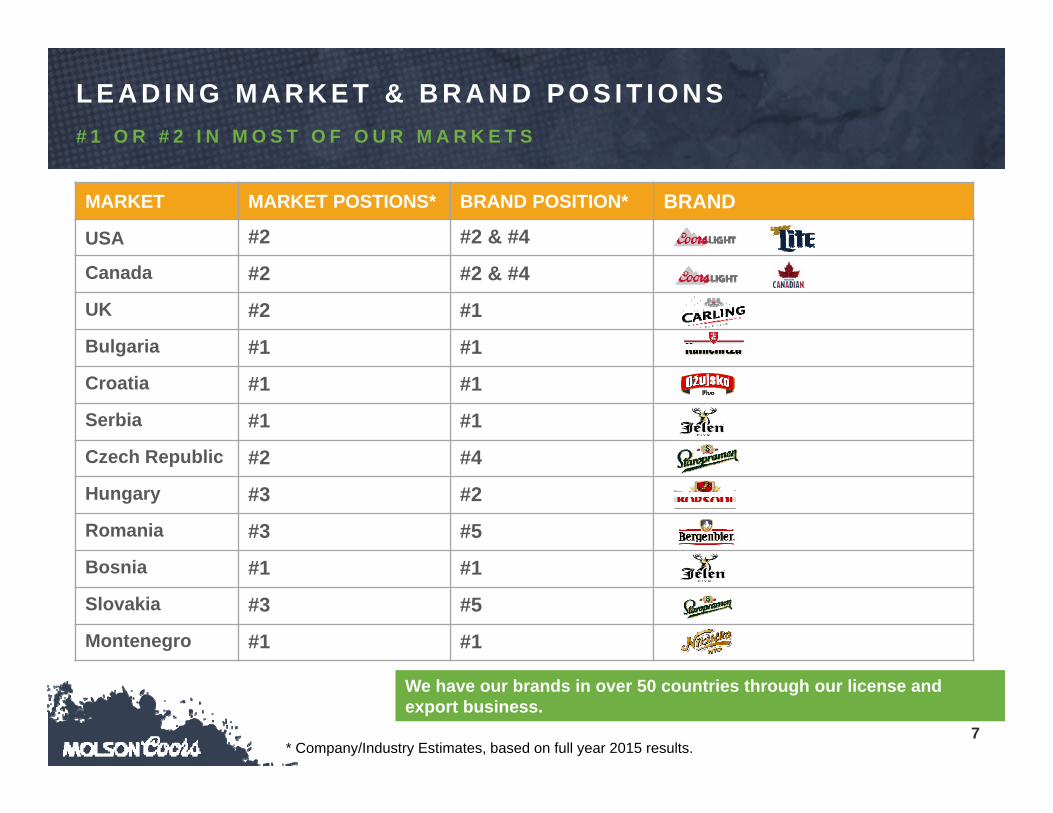
L E A D I N G M A R K E T & B R A N D P O S I T I O N S# 1 O R # 2 I N M O S T O F O U R M A R K E T S
We have our brands in over 50 countries through our license and export business.
* Company/Industry Estimates, based on full year 2015 results.
MARKET MARKET POSTIONS* BRAND POSITION* BRAND
USA #2 #2 & #4
Canada #2 #2 & #4
UK #2 #1
Bulgaria #1 #1
Croatia #1 #1
Serbia #1 #1
Czech Republic #2 #4
Hungary #3 #2
Romania #3 #5
Bosnia #1 #1
Slovakia #3 #5
Montenegro #1 #1
8
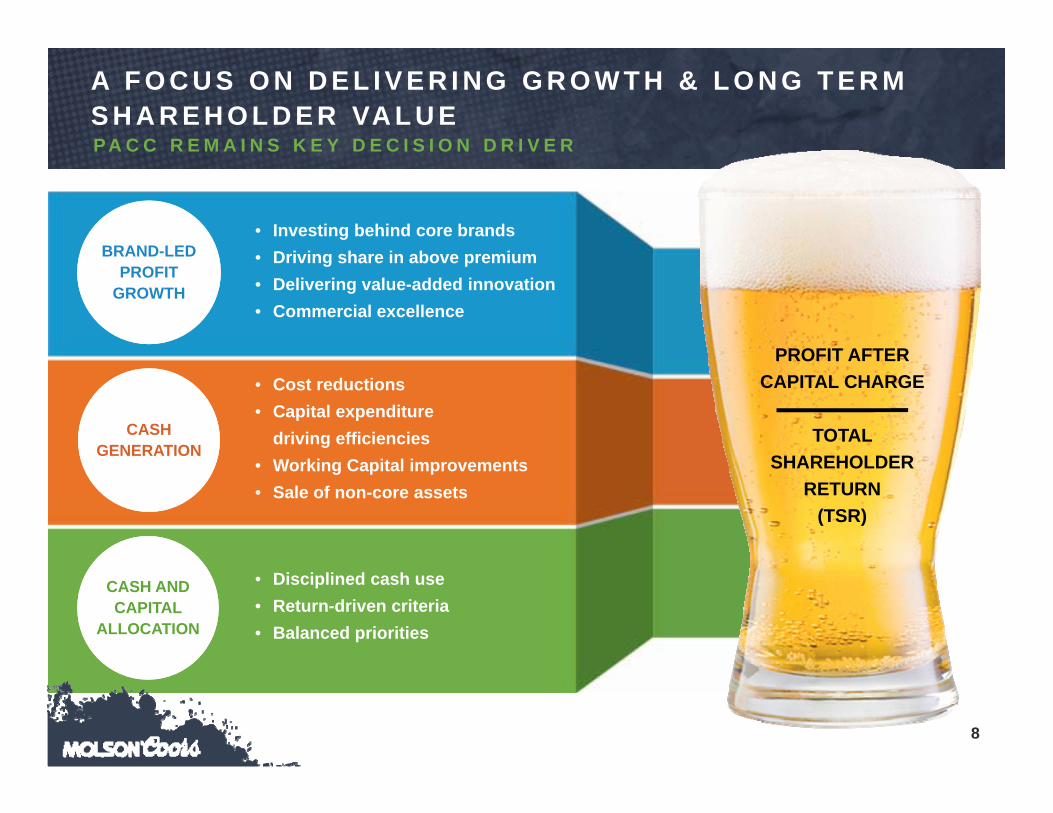
A F O C U S O N D E L I V E R I N G G R O W T H & L O N G T E R M S H A R E H O L D E R VA L U E
• Investing behind core brands• Driving share in above premium• Delivering value-added innovation• Commercial excellence
• Cost reductions• Capital expenditure
driving efficiencies• Working Capital improvements• Sale of non-core assets
• Disciplined cash use• Return-driven criteria• Balanced priorities
PROFIT AFTERCAPITAL CHARGE
TOTAL SHAREHOLDER
RETURN(TSR)
BRAND-LED PROFIT
GROWTH
CASH AND CAPITAL
ALLOCATION
CASHGENERATION
P A C C R E M A I N S K E Y D E C I S I O N D R I V E R
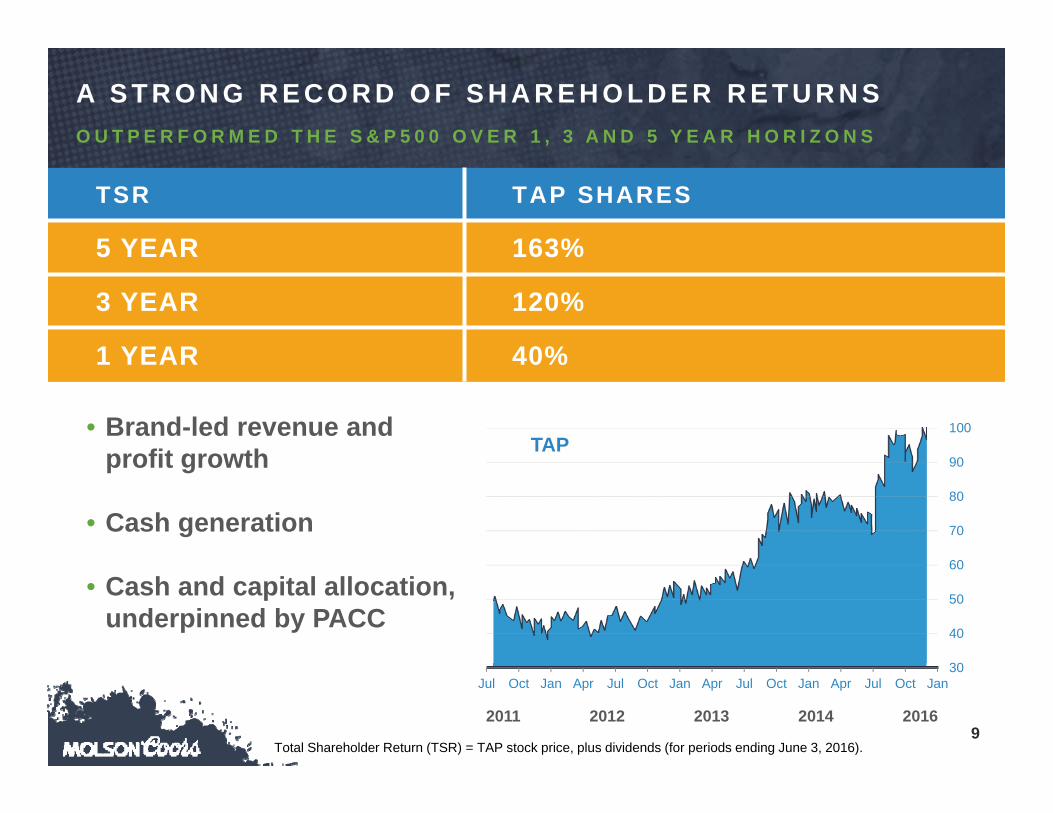
9
30
40
50
60
70
80
90
100
Jul Oct Jan Apr Jul Oct Jan Apr Jul Oct Jan Apr Jul Oct Jan
• Brand-led revenue and profit growth
• Cash generation
• Cash and capital allocation, underpinned by PACC
TSR TAP SHARES
5 YEAR 163%
3 YEAR 120%
1 YEAR 40%
TAP
2011 2012 2013 2014 2016
A S T R O N G R E C O R D O F S H A R E H O L D E R R E T U R N SO U T P E R F O R M E D T H E S & P 5 0 0 O V E R 1 , 3 A N D 5 Y E A R H O R I Z O N S
Total Shareholder Return (TSR) = TAP stock price, plus dividends (for periods ending June 3, 2016).
10
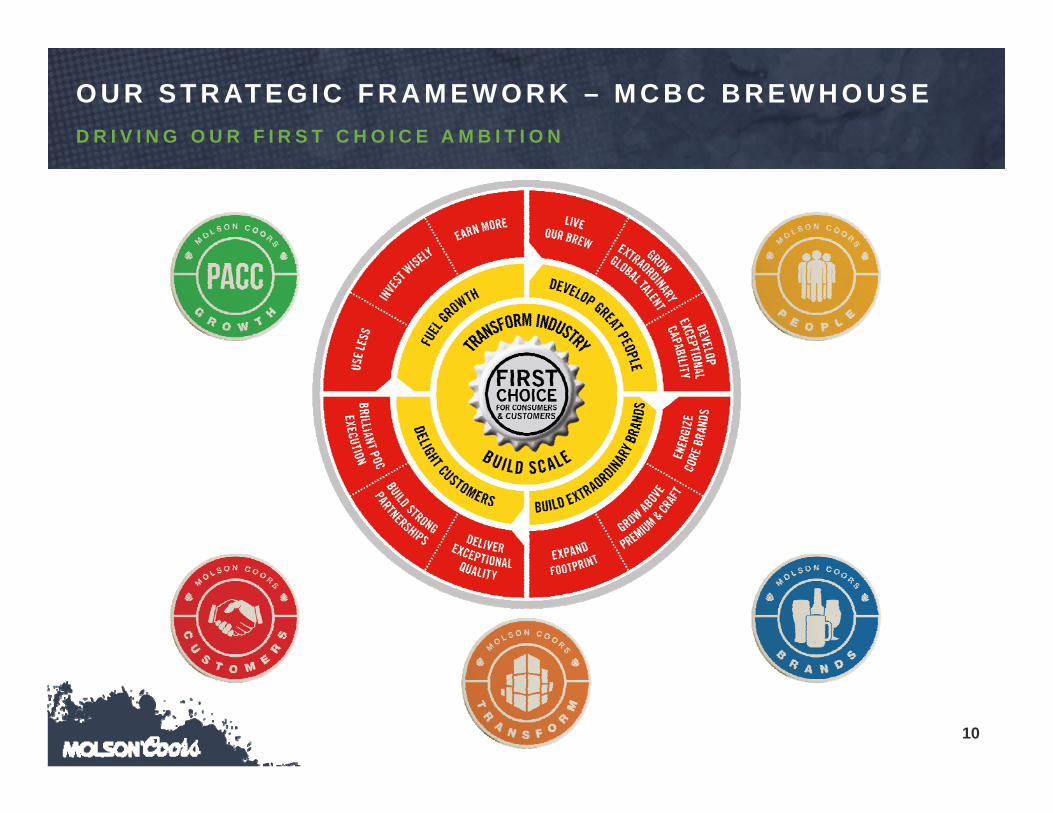
O U R S T R AT E G I C F R A M E W O R K – M C B C B R E W H O U S ED R I V I N G O U R F I R S T C H O I C E A M B I T I O N
11
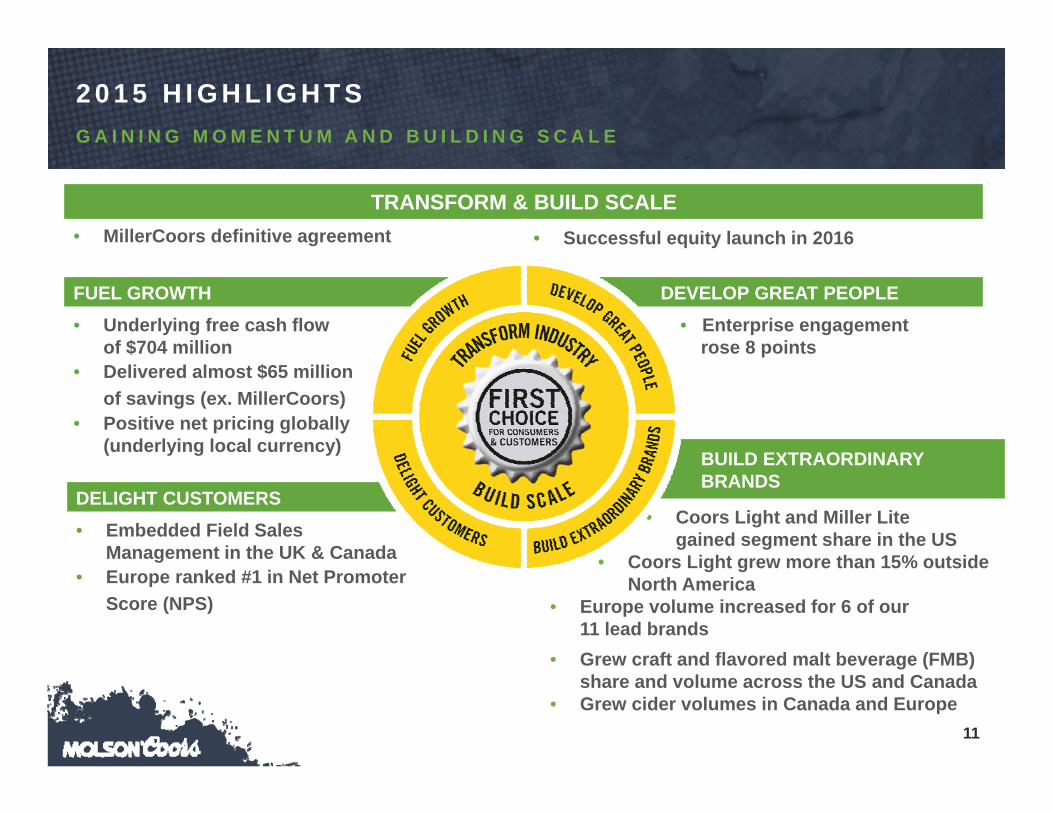
BUILD EXTRAORDINARY BRANDS
• Coors Light and Miller Litegained segment share in the US
• Coors Light grew more than 15% outside North America
• Europe volume increased for 6 of our 11 lead brands
• Grew craft and flavored malt beverage (FMB) share and volume across the US and Canada
• Grew cider volumes in Canada and Europe
2 0 1 5 H I G H L I G H T SG A I N I N G M O M E N T U M A N D B U I L D I N G S C A L E
TRANSFORM & BUILD SCALE• MillerCoors definitive agreement • Successful equity launch in 2016
FUEL GROWTH • Underlying free cash flow
of $704 million• Delivered almost $65 million
of savings (ex. MillerCoors)• Positive net pricing globally
(underlying local currency)
DELIGHT CUSTOMERS• Embedded Field Sales
Management in the UK & Canada• Europe ranked #1 in Net Promoter
Score (NPS)
DEVELOP GREAT PEOPLE• Enterprise engagement
rose 8 points
12
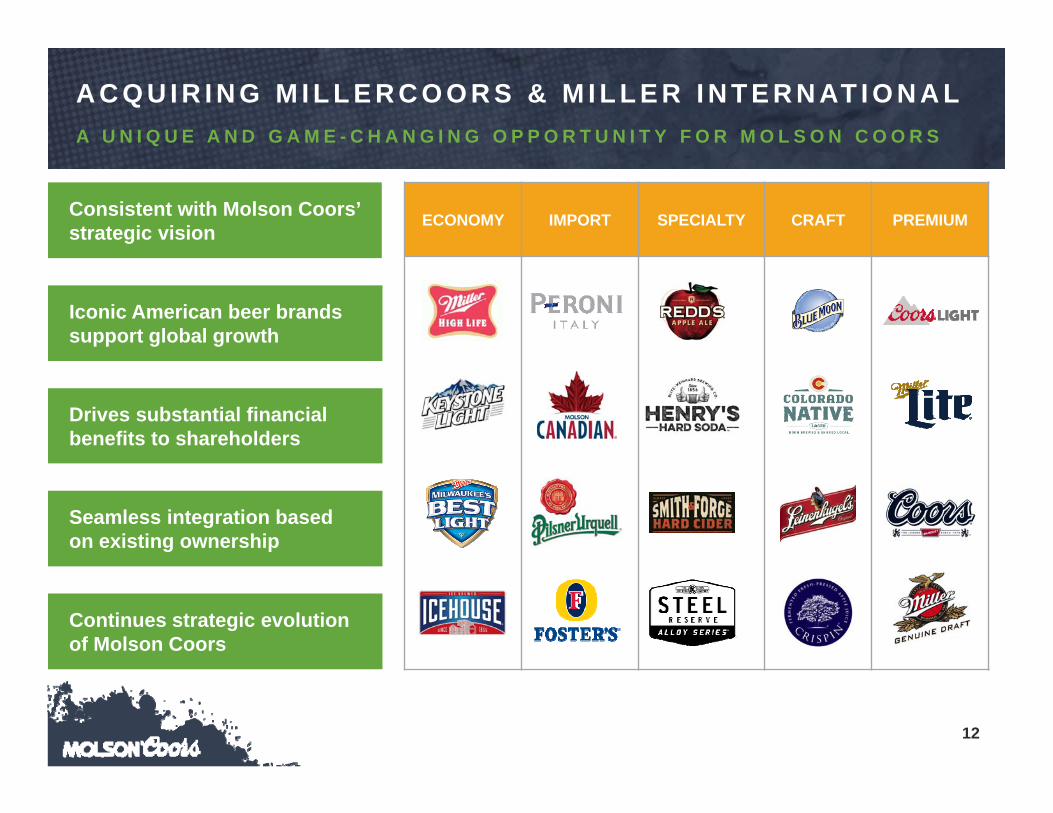
ECONOMY IMPORT SPECIALTY CRAFT PREMIUM
A C Q U I R I N G M I L L E R C O O R S & M I L L E R I N T E R N AT I O N A LA U N I Q U E A N D G A M E - C H A N G I N G O P P O R T U N I T Y F O R M O L S O N C O O R S
Consistent with Molson Coors’ strategic vision
Seamless integration based on existing ownership
Iconic American beer brands support global growth
Drives substantial financial benefits to shareholders
Continues strategic evolution of Molson Coors
13
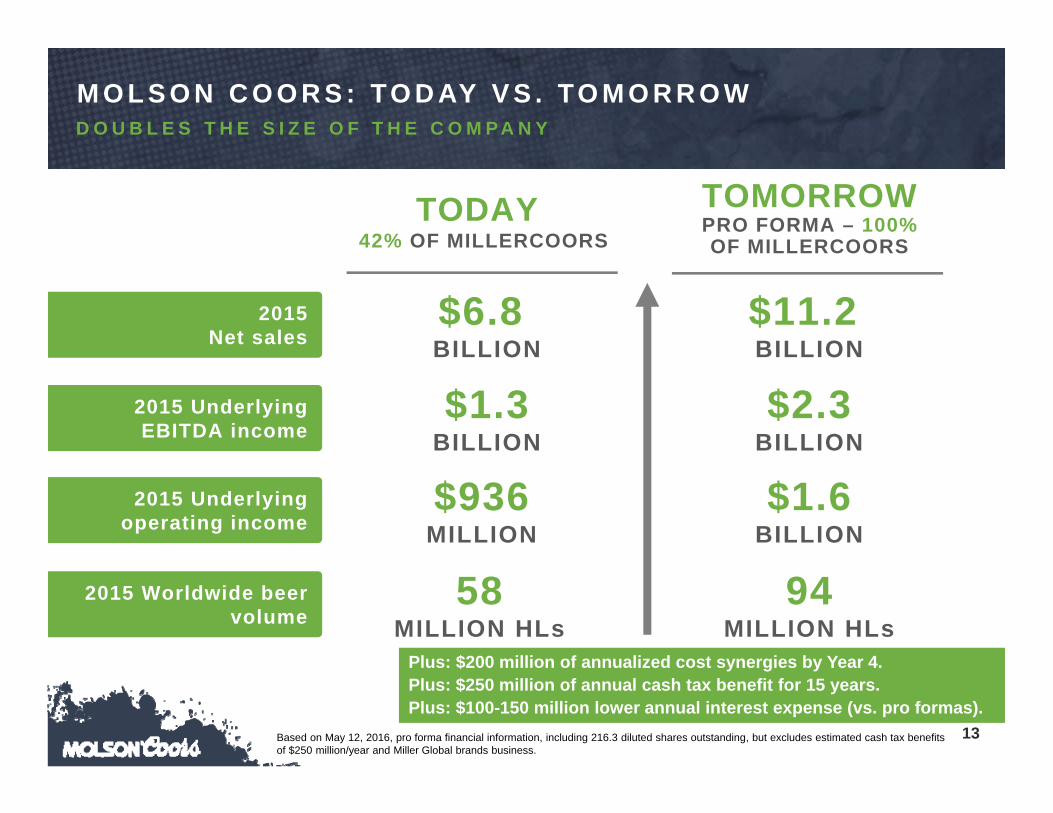
M O L S O N C O O R S : TO D AY V S . TO M O R R O WD O U B L E S T H E S I Z E O F T H E C O M P A N Y
Plus: $200 million of annualized cost synergies by Year 4.Plus: $250 million of annual cash tax benefit for 15 years.Plus: $100-150 million lower annual interest expense (vs. pro formas).
TODAY42% OF MILLERCOORS
TOMORROWPRO FORMA – 100%OF MILLERCOORS
2015 Net sales
2015 Underlying EBITDA income
$6.8 BILLION
$1.3BILLION
$11.2 BILLION
$2.3BILLION
2015 Underlying operating income
2015 Worldwide beer volume
$936MILLION
$1.6BILLION
58MILLION HLs
94MILLION HLs
Based on May 12, 2016, pro forma financial information, including 216.3 diluted shares outstanding, but excludes estimated cash tax benefits of $250 million/year and Miller Global brands business.
14
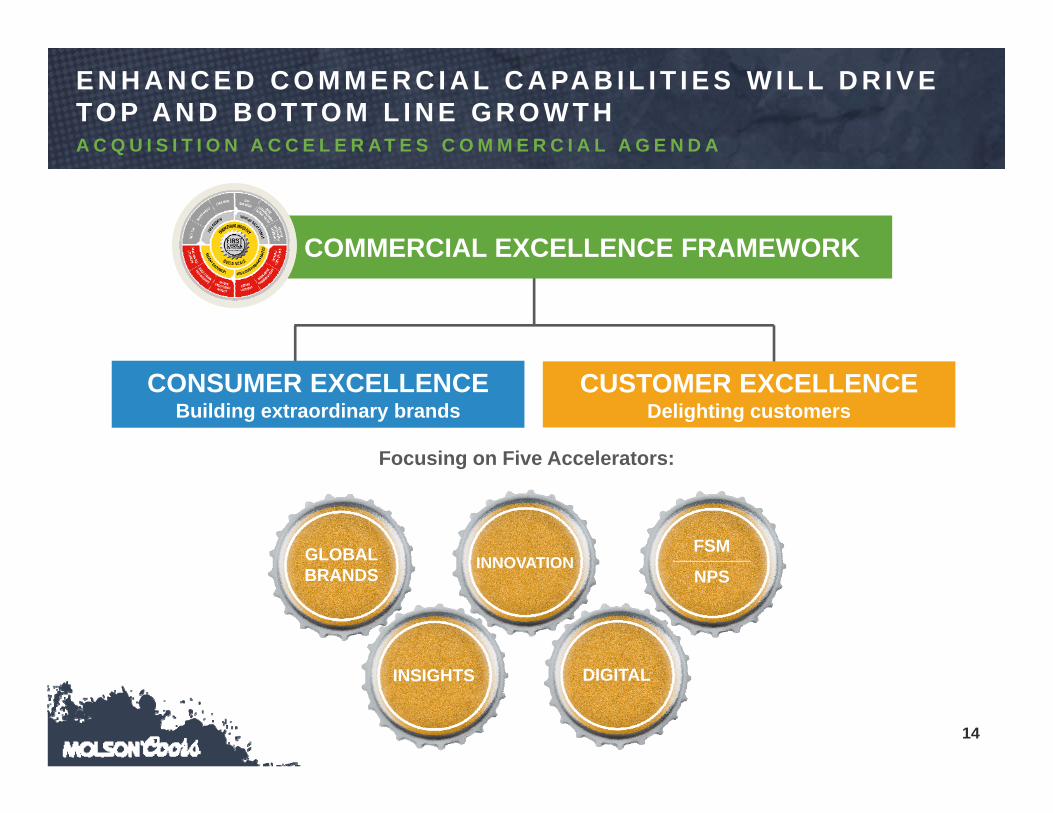
E N H A N C E D C O M M E R C I A L C A PA B I L I T I E S W I L L D R I V E TO P A N D B O T TO M L I N E G R O W T H
DIGITAL
CUSTOMER
RELATIONSHIPS CUSTOMER
RELATIONSHIPS
Focusing on Five Accelerators:
INSIGHTS
CONSUMER EXCELLENCEBuilding extraordinary brands
CUSTOMER EXCELLENCEDelighting customers
COMMERCIAL EXCELLENCE FRAMEWORK
GLOBALBRANDS
INSIGHTS
INNOVATION
DIGITAL
FSM________NPS
A C Q U I S I T I O N A C C E L E R A T E S C O M M E R C I A L A G E N D A
15
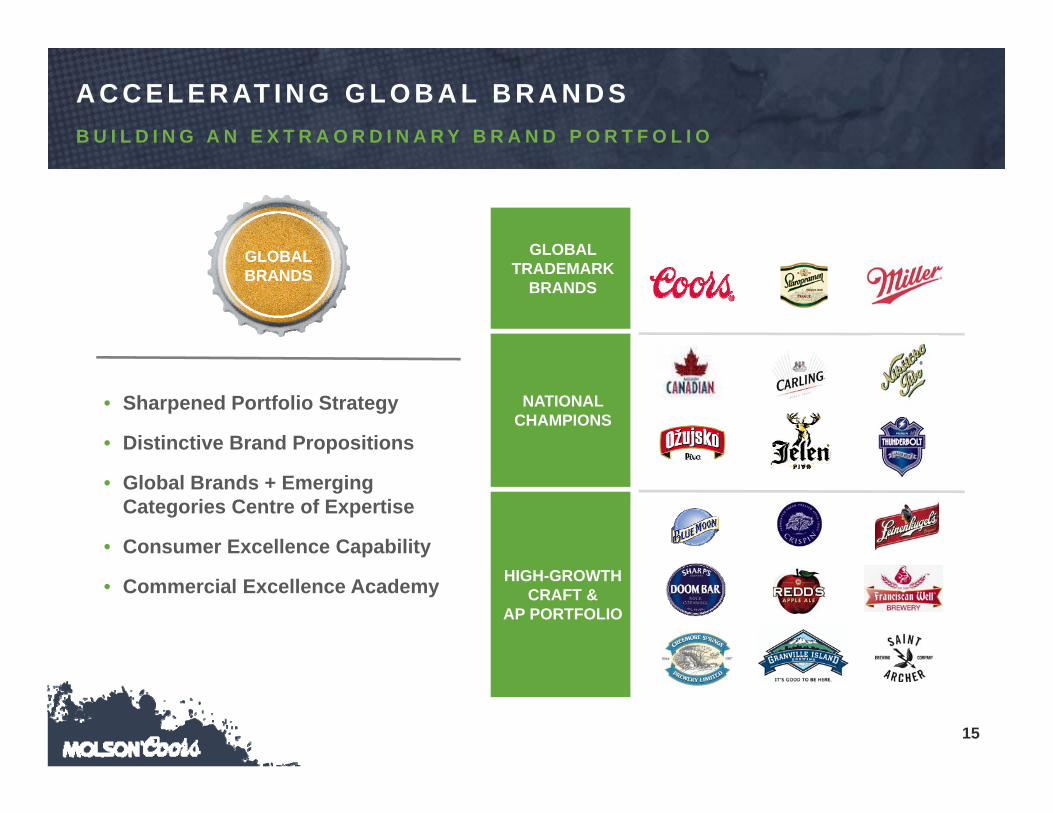
A C C E L E R AT I N G G L O B A L B R A N D SB U I L D I N G A N E X T R A O R D I N A R Y B R A N D P O R T F O L I O
• Sharpened Portfolio Strategy
• Distinctive Brand Propositions
• Global Brands + Emerging Categories Centre of Expertise
• Consumer Excellence Capability
• Commercial Excellence Academy
GLOBAL TRADEMARK
BRANDS
GLOBALBRANDS
NATIONAL CHAMPIONS
HIGH-GROWTH CRAFT &
AP PORTFOLIO
16
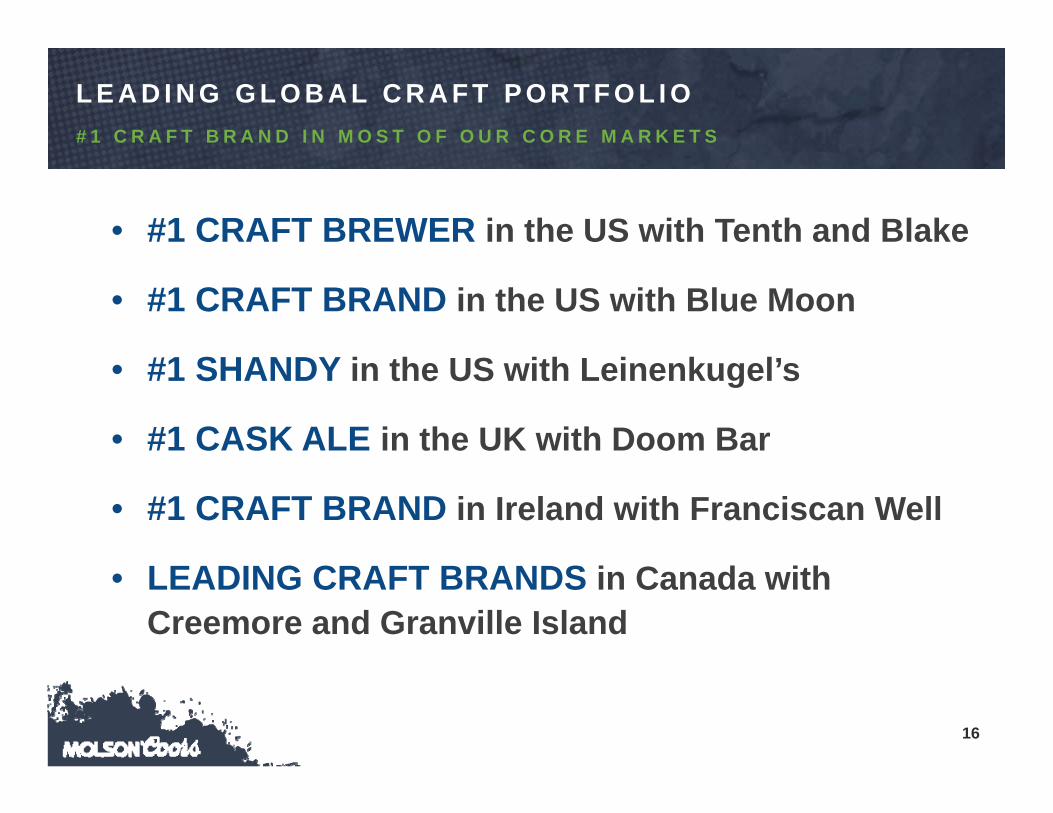
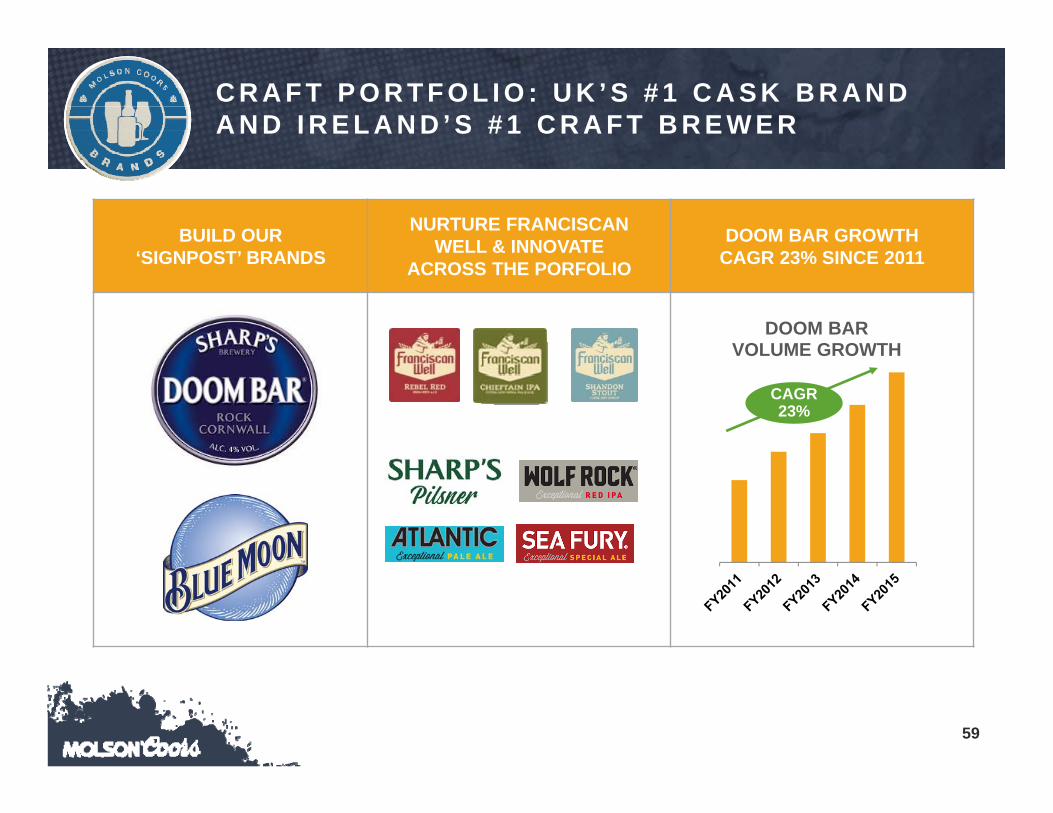
# 1 C R A F T B R A N D I N M O S T O F O U R C O R E M A R K E T S
• #1 CRAFT BREWER in the US with Tenth and Blake
• #1 CRAFT BRAND in the US with Blue Moon
• #1 SHANDY in the US with Leinenkugel’s
• #1 CASK ALE in the UK with Doom Bar
• #1 CRAFT BRAND in Ireland with Franciscan Well
• LEADING CRAFT BRANDS in Canada with Creemore and Granville Island
L E A D I N G G L O B A L C R A F T P O R T F O L I O
17
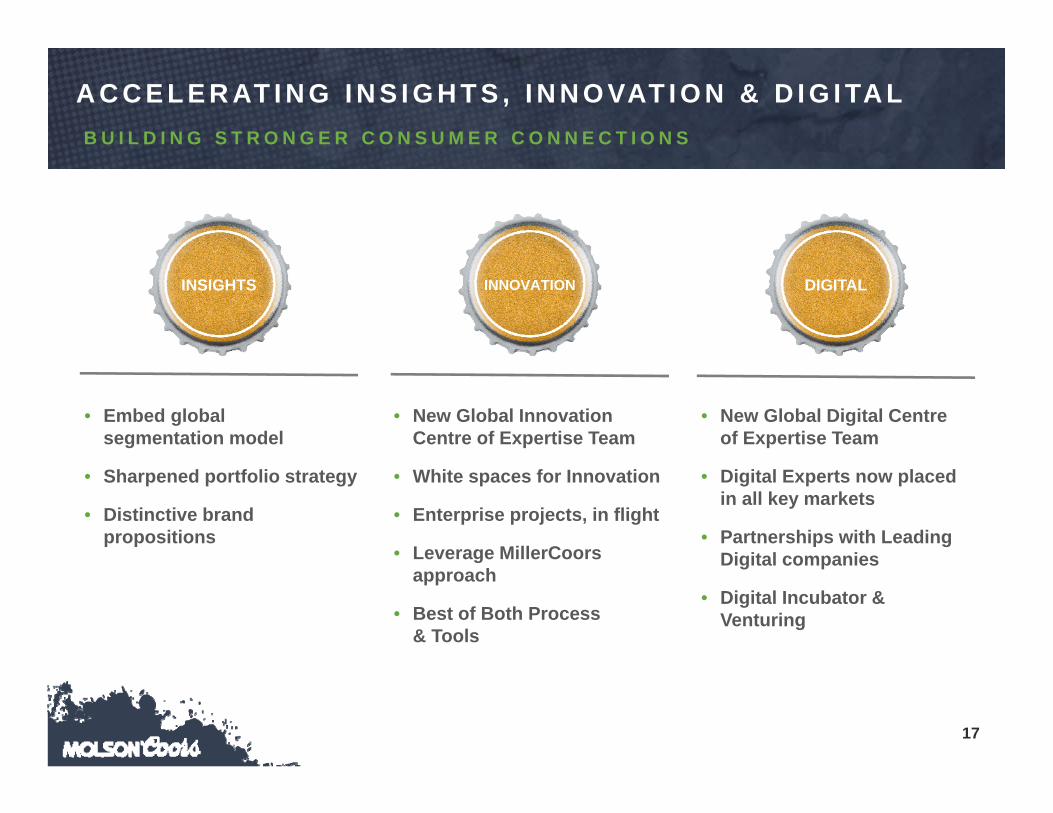
A C C E L E R AT I N G I N S I G H T S , I N N O VAT I O N & D I G I TA L
• Embed global segmentation model
• Sharpened portfolio strategy
• Distinctive brand propositions
INSIGHTS
• New Global Digital Centre of Expertise Team
• Digital Experts now placed in all key markets
• Partnerships with Leading Digital companies
• Digital Incubator & Venturing
DIGITAL
• New Global Innovation Centre of Expertise Team
• White spaces for Innovation
• Enterprise projects, in flight
• Leverage MillerCoors approach
• Best of Both Process & Tools
INNOVATION
B U I L D I N G S T R O N G E R C O N S U M E R C O N N E C T I O N S
18
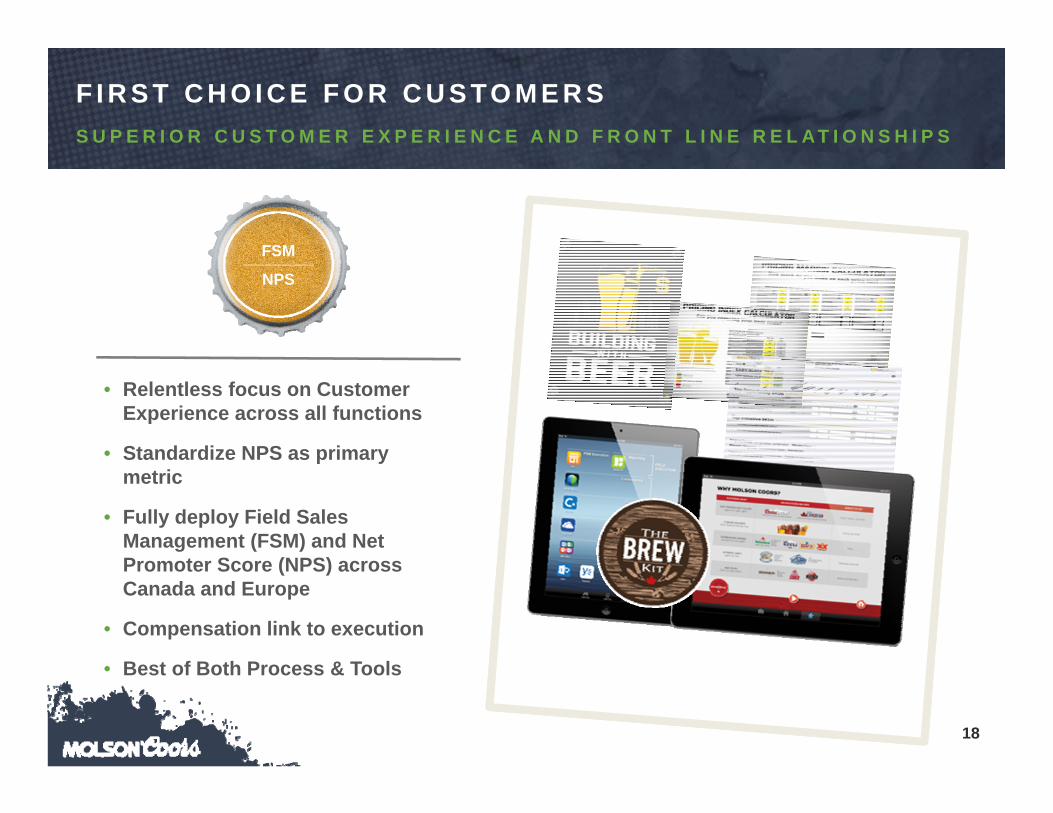
F I R S T C H O I C E F O R C U S TO M E R SS U P E R I O R C U S T O M E R E X P E R I E N C E A N D F R O N T L I N E R E L A T I O N S H I P S
• Relentless focus on Customer Experience across all functions
• Standardize NPS as primary metric
• Fully deploy Field Sales Management (FSM) and Net Promoter Score (NPS) across Canada and Europe
• Compensation link to execution
• Best of Both Process & Tools
FSM________NPS
19
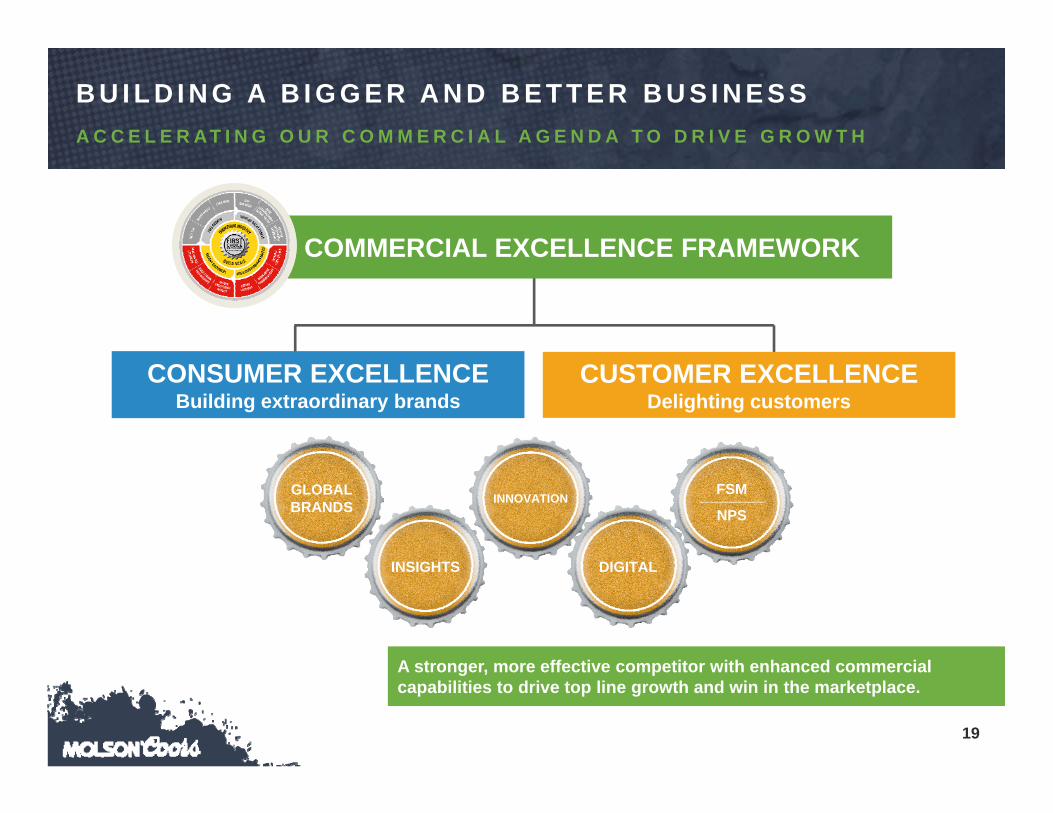
B U I L D I N G A B I G G E R A N D B E T T E R B U S I N E S S
DIGITAL
CUSTOMER
RELATIONSHIPS CUSTOMER
RELATIONSHIPS
INSIGHTS
CONSUMER EXCELLENCEBuilding extraordinary brands
CUSTOMER EXCELLENCEDelighting customers
COMMERCIAL EXCELLENCE FRAMEWORK
GLOBALBRANDS
INSIGHTS
INNOVATION
DIGITAL
FSM________NPS
A C C E L E R A T I N G O U R C O M M E R C I A L A G E N D A T O D R I V E G R O W T H
A stronger, more effective competitor with enhanced commercial capabilities to drive top line growth and win in the marketplace.
J U N E 8 , 2 0 1 6
20
G AV I N H AT T E R S L E Y
C E O , M I L L E R C O O R S
21
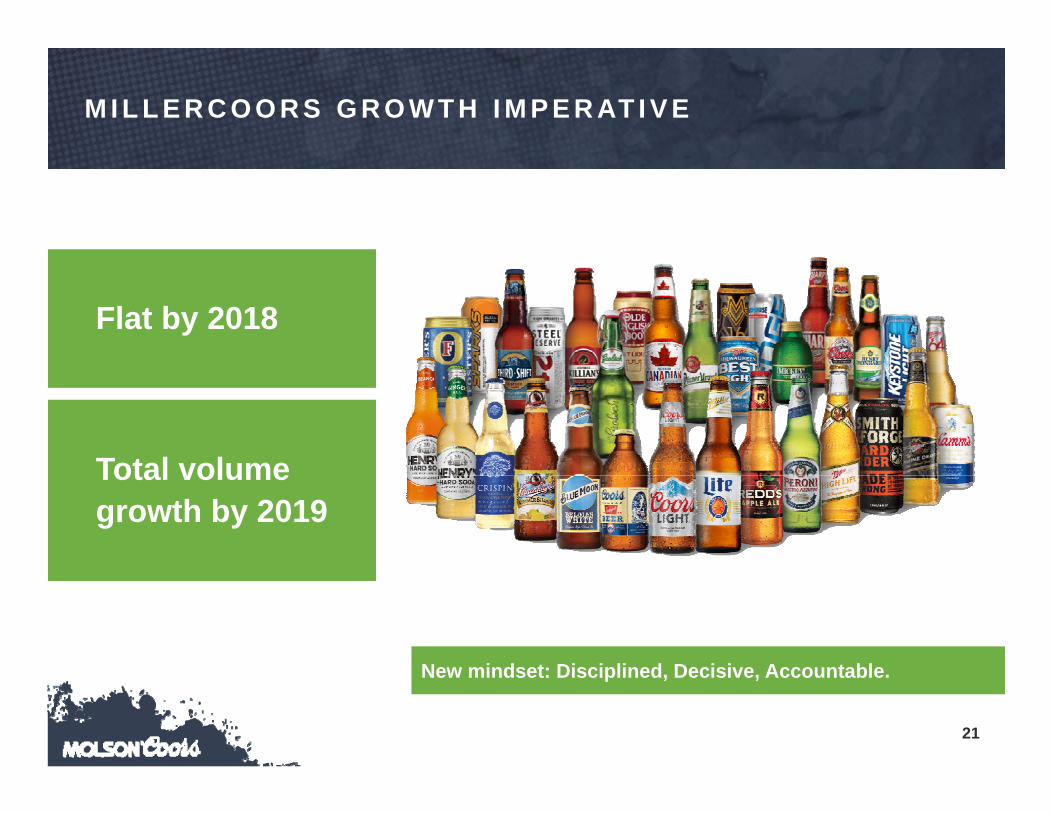
New mindset: Disciplined, Decisive, Accountable.
M I L L E R C O O R S G R O W T H I M P E R AT I V E
Flat by 2018
Total volume growth by 2019

22
Right Beer, Right Price.
C O N S U M E R E X C E L L E N C E –A C C E L E R AT E P O R T F O L I O T R A N S F O R M AT I O N
• Grow Above Premium
• Take share in American Light Lagers
• Mitigate decline in Economy
2008 2015Above
Premium
PremiumLight
Premium Regular
Economy
6.5
55.9
5.8
31.8
10.4
56.7
4.4
28.5
Percent of Total STR Volume
23
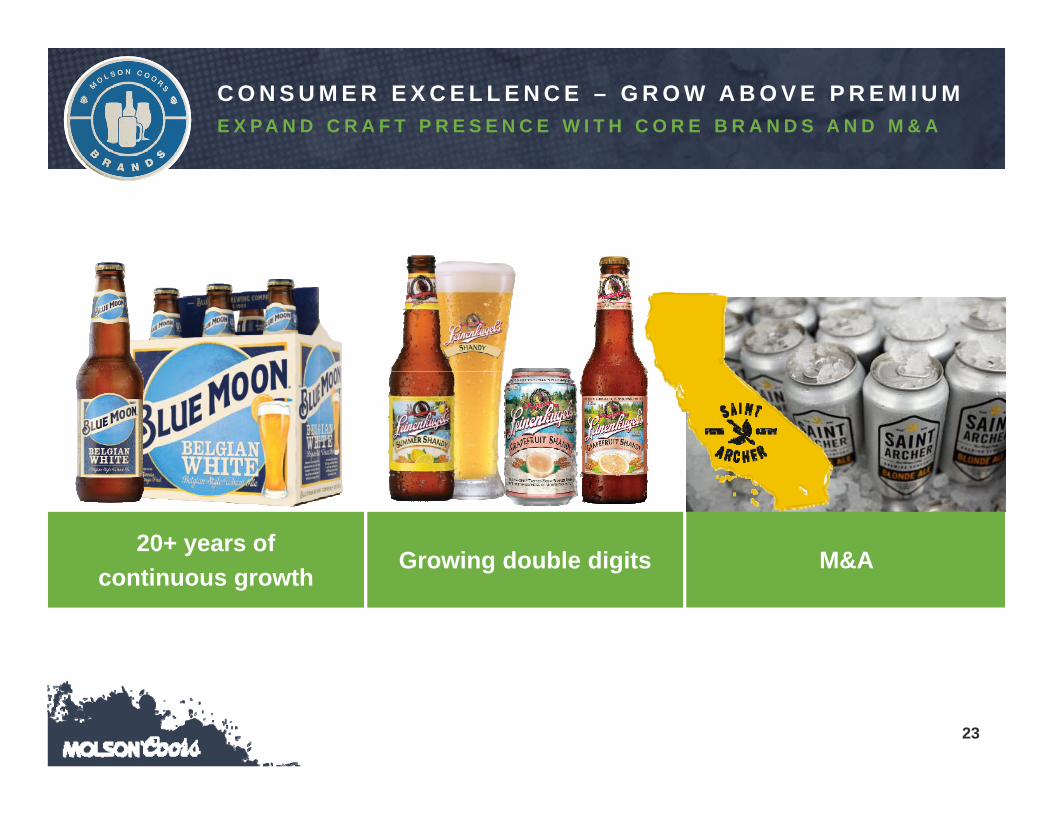
20+ years of continuous growth
Growing double digits M&A
C O N S U M E R E X C E L L E N C E – G R O W A B O V E P R E M I U ME X P A N D C R A F T P R E S E N C E W I T H C O R E B R A N D S A N D M & A
24
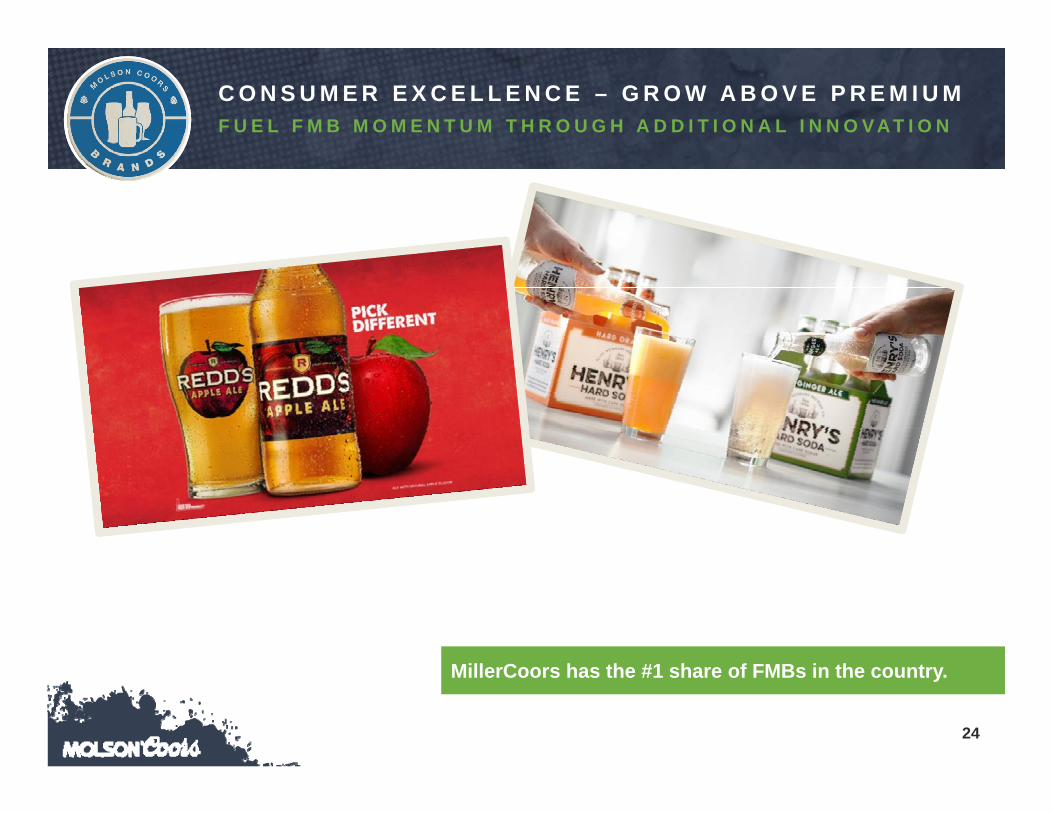
C O N S U M E R E X C E L L E N C E – G R O W A B O V E P R E M I U MF U E L F M B M O M E N T U M T H R O U G H A D D I T I O N A L I N N O V A T I O N
MillerCoors has the #1 share of FMBs in the country.
25
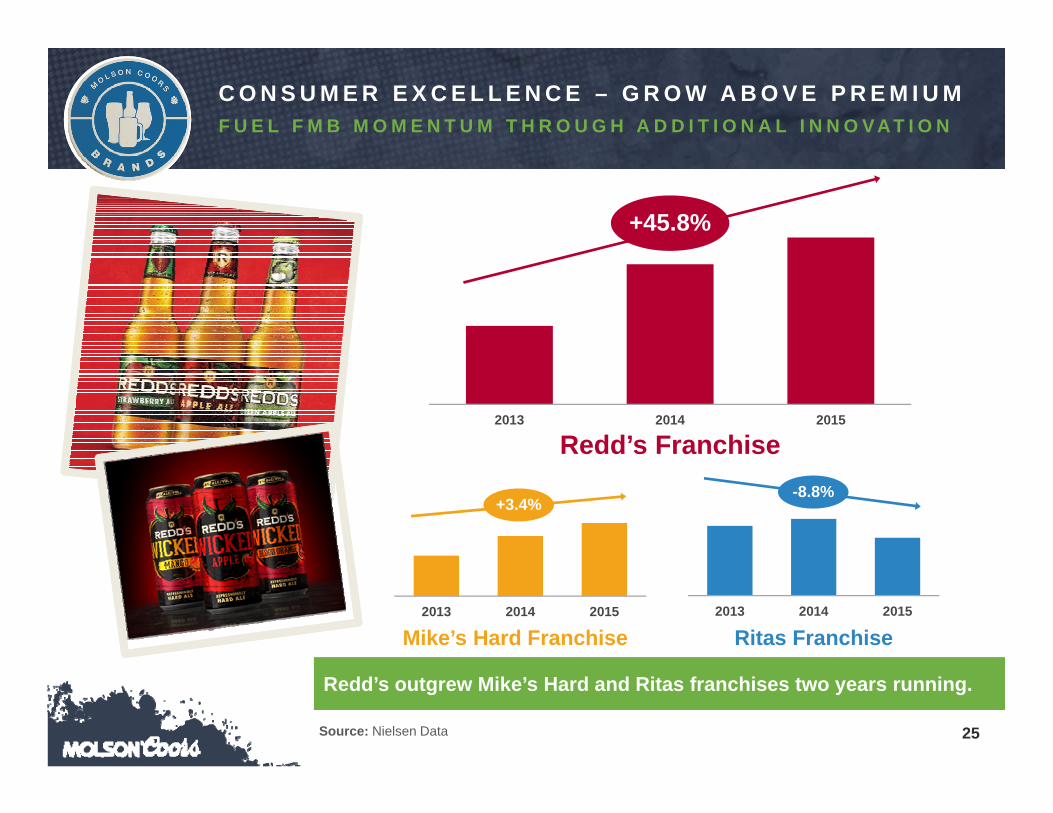
C O N S U M E R E X C E L L E N C E – G R O W A B O V E P R E M I U MF U E L F M B M O M E N T U M T H R O U G H A D D I T I O N A L I N N O V A T I O N
Source: Nielsen Data
Redd’s outgrew Mike’s Hard and Ritas franchises two years running.
2013 2014 2015
Redd’s Franchise
+45.8%
Mike’s Hard Franchise2013 2014 2015
+3.4%
Ritas Franchise2013 2014 2015
-8.8%
26
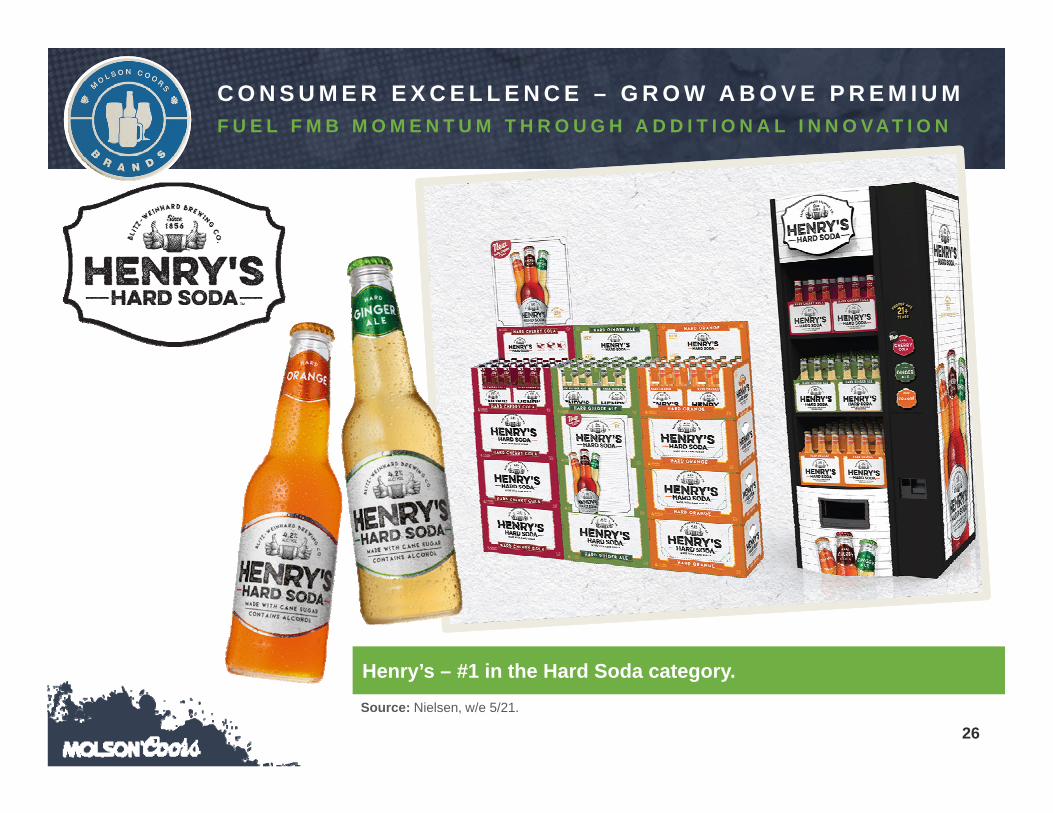
C O N S U M E R E X C E L L E N C E – G R O W A B O V E P R E M I U MF U E L F M B M O M E N T U M T H R O U G H A D D I T I O N A L I N N O V A T I O N
Source: Nielsen, w/e 5/21.
Henry’s – #1 in the Hard Soda category.

• Roll Henry’s “TBD”
28
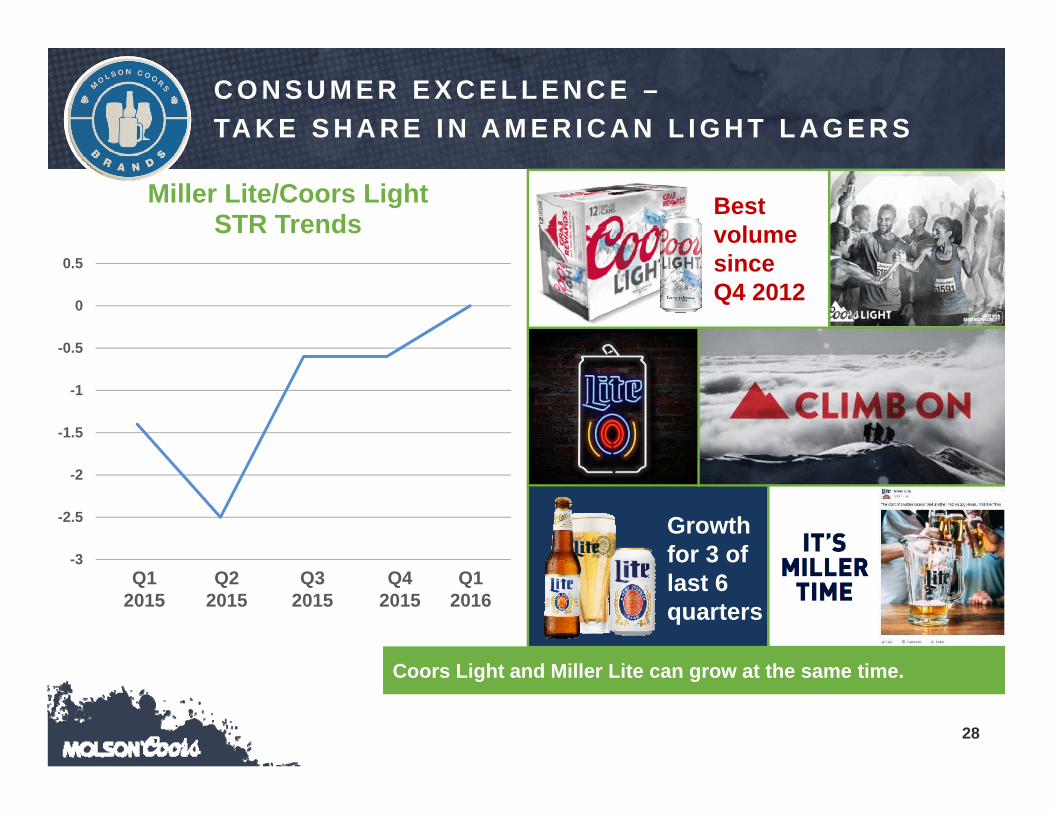
C O N S U M E R E X C E L L E N C E –TA K E S H A R E I N A M E R I C A N L I G H T L A G E R S
-3
-2.5
-2
-1.5
-1
-0.5
0
0.5
Miller Lite/Coors Light STR Trends
Q2 2015
Q3 2015
Q4 2015
Q1 2016
Q1 2015
Best volume since Q4 2012
Growth for 3 of last 6 quarters
Coors Light and Miller Lite can grow at the same time.
29
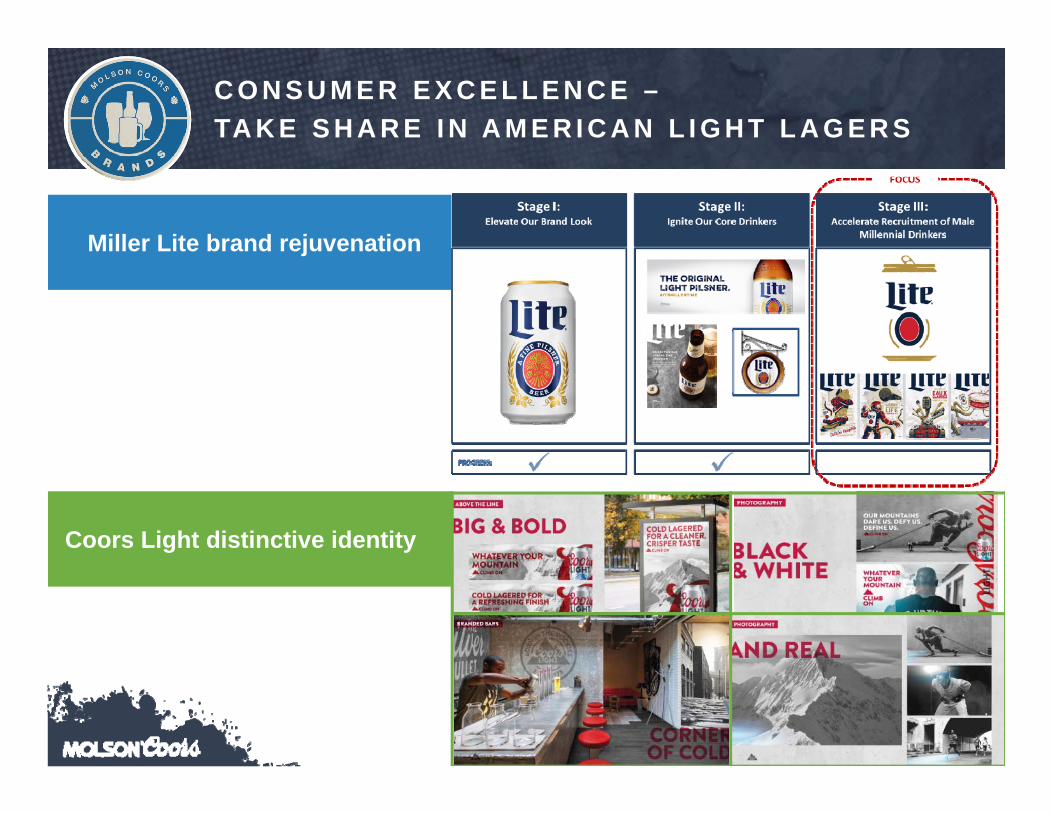
C O N S U M E R E X C E L L E N C E –TA K E S H A R E I N A M E R I C A N L I G H T L A G E R S
Coors Light distinctive identity
Miller Lite brand rejuvenation


31
C O N S U M E R E X C E L L E N C E – E C O N O M YS T A B I L I Z E L O S S E S B Y F I N D I N G N E W W AY S T O D E L I V E R V A L U E
• Build preference with loyal economy consumers and others
• Find new ways to deliver value –liquid & equity
• Right packs, right place MHL positioning is connecting with millennials – penetration up 30+% and improved trends.
32
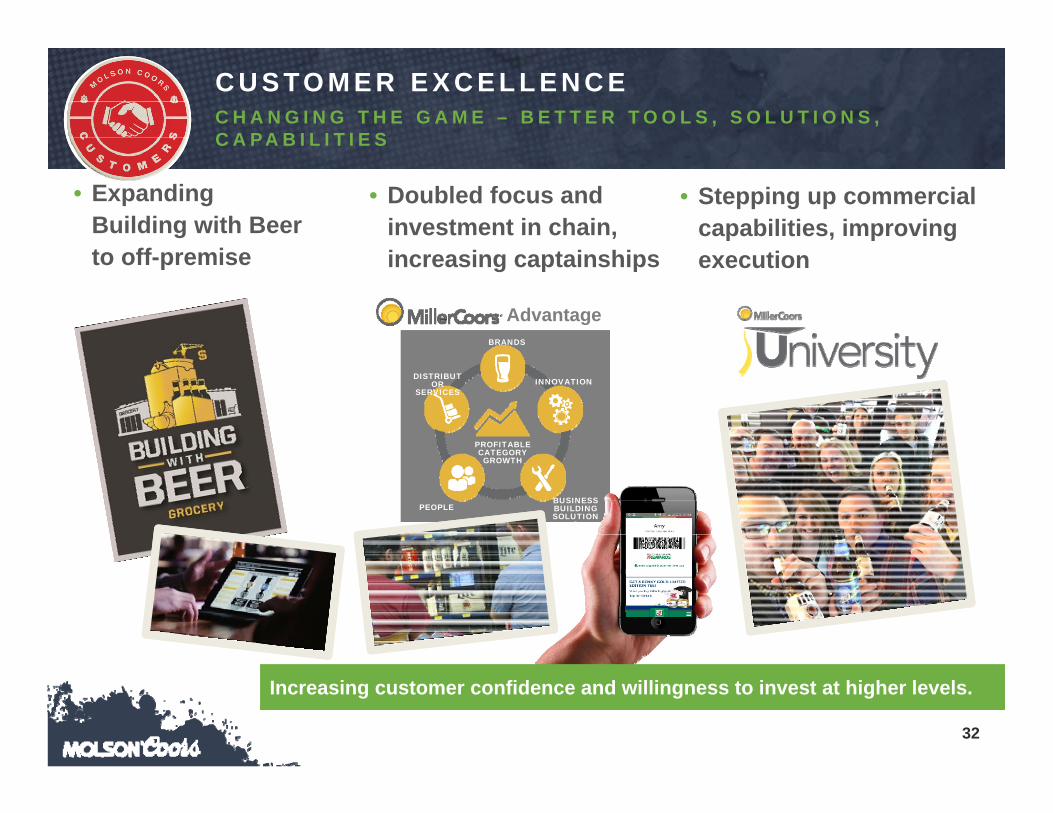
• Doubled focus and investment in chain, increasing captainships
C U S TO M E R E X C E L L E N C EC H A N G I N G T H E G A M E – B E T T E R T O O L S , S O L U T I O N S , C A P A B I L I T I E S
• Expanding Building with Beer to off-premise
• Stepping up commercial capabilities, improving execution
PEOPLEBUSINESS BUILDINGSOLUTION
S
DISTRIBUTOR
SERVICESINNOVATION
PROFITABLECATEGORY GROWTH
BRANDS
Advantage
Increasing customer confidence and willingness to invest at higher levels.
33
-3.5
-3
-2.5
-2
-1.5
-1
Q1 2015
Q2 2015
Q3 2015
Q4 2015
Q1 2016
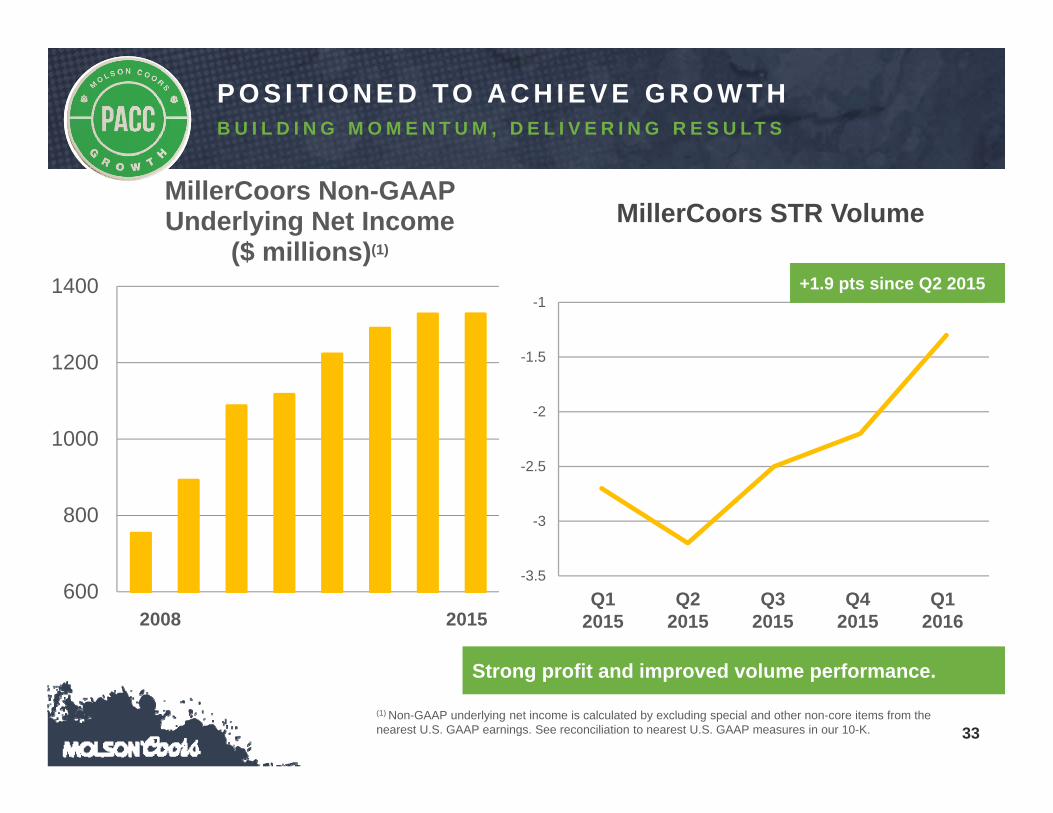
+1.9 pts since Q2 2015
600
800
1000
1200
1400
MillerCoors Non-GAAP Underlying Net Income
($ millions)(1)
2008 2015
MillerCoors STR Volume
P O S I T I O N E D TO A C H I E V E G R O W T HB U I L D I N G M O M E N T U M , D E L I V E R I N G R E S U L T S
Strong profit and improved volume performance.
(1) Non-GAAP underlying net income is calculated by excluding special and other non-core items from the nearest U.S. GAAP earnings. See reconciliation to nearest U.S. GAAP measures in our 10-K.

J U N E 8 , 2 0 1 6
S T E WA R T G L E N D I N N I N G
C E O , M O L S O N C O O R S C A N A D A
35
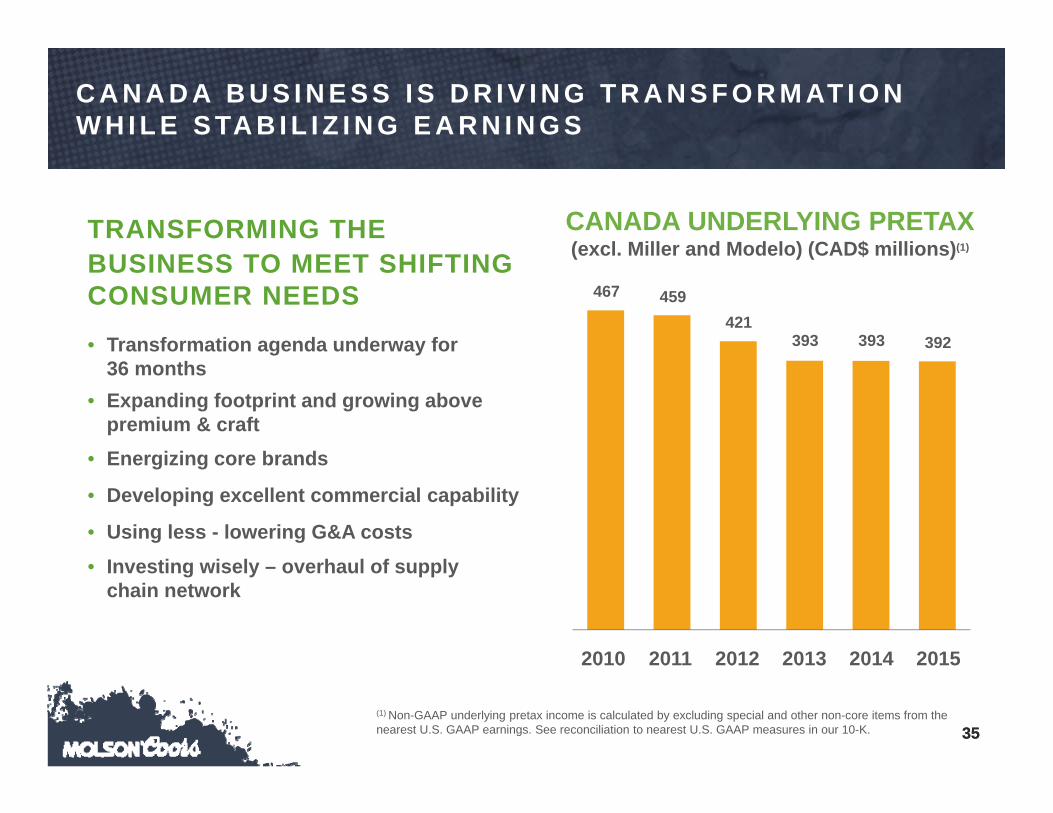
C A N A D A B U S I N E S S I S D R I V I N G T R A N S F O R M AT I O N W H I L E S TA B I L I Z I N G E A R N I N G S
• Transformation agenda underway for 36 months
• Expanding footprint and growing above premium & craft
• Energizing core brands
• Developing excellent commercial capability
• Using less - lowering G&A costs• Investing wisely – overhaul of supply
chain network
TRANSFORMING THE BUSINESS TO MEET SHIFTING CONSUMER NEEDS 467 459
421 393 393 392
2011 20122010 2013 2014 2015
CANADA UNDERLYING PRETAX(excl. Miller and Modelo) (CAD$ millions)(1)
35(1) Non-GAAP underlying pretax income is calculated by excluding special and other non-core items from the nearest U.S. GAAP earnings. See reconciliation to nearest U.S. GAAP measures in our 10-K.
36
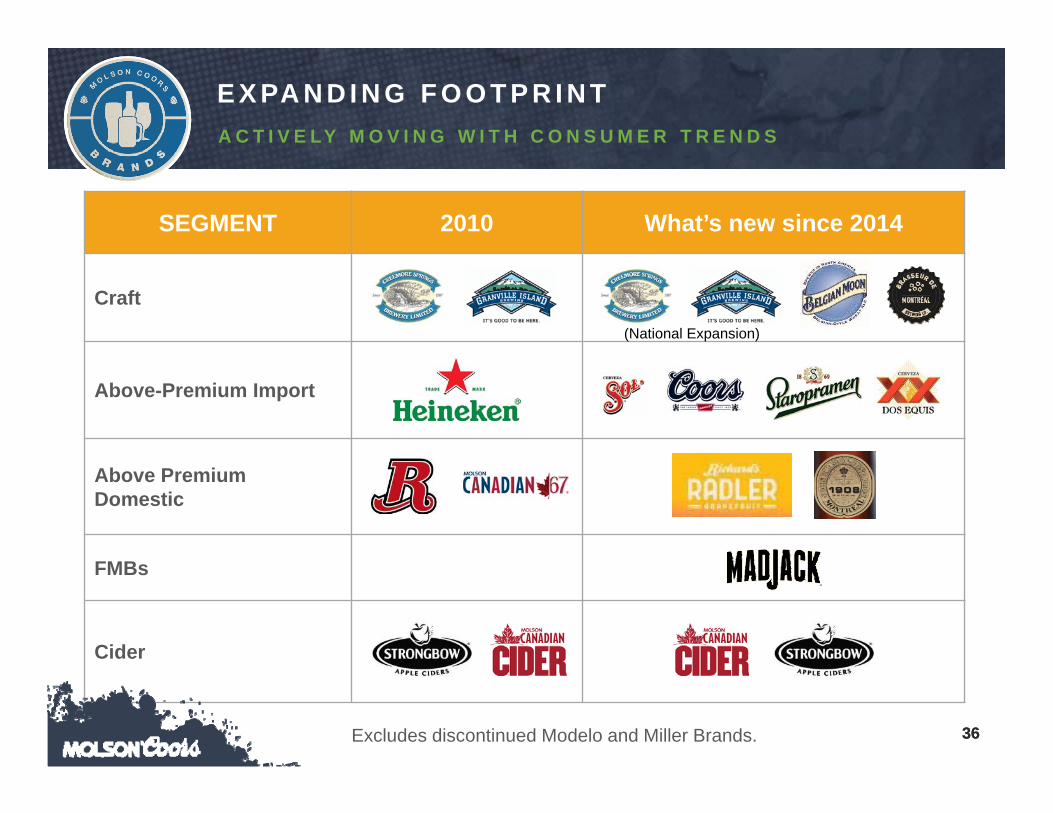
SEGMENT 2010 What’s new since 2014
Craft
Above-Premium Import
Above Premium Domestic
FMBs
Cider
36
E X PA N D I N G F O O T P R I N TA C T I V E LY M O V I N G W I T H C O N S U M E R T R E N D S
(National Expansion)
Excludes discontinued Modelo and Miller Brands.
37
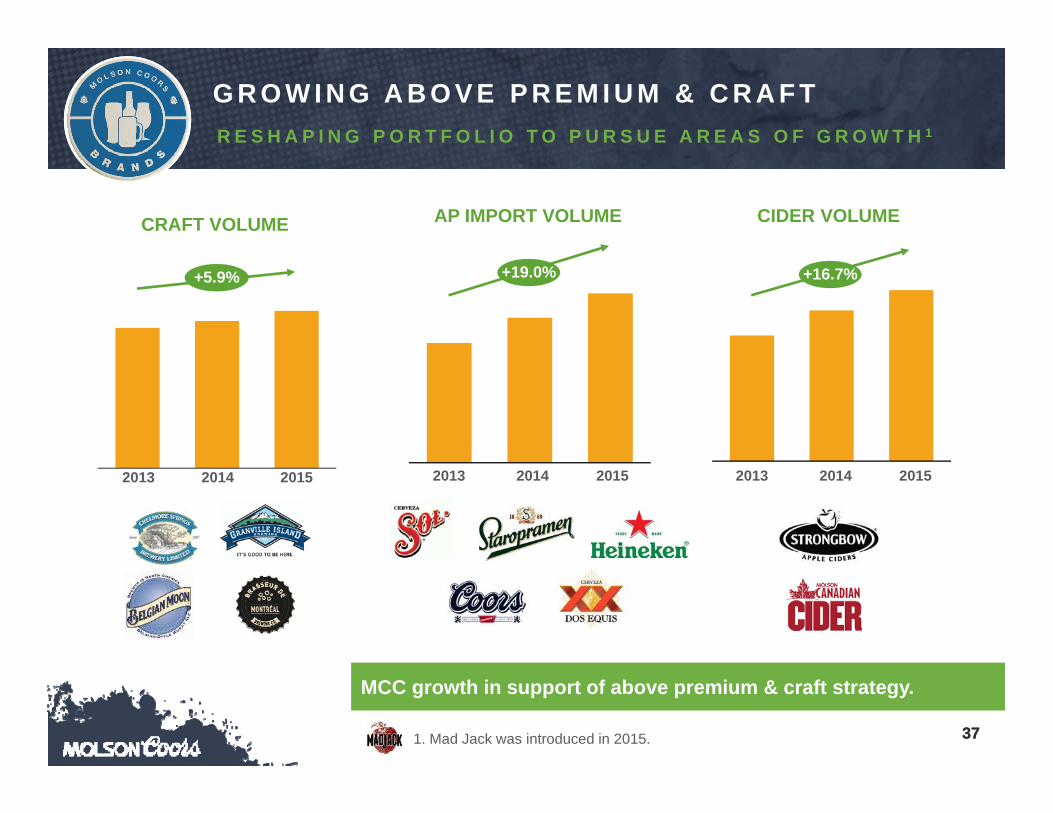
AP IMPORT VOLUME CIDER VOLUME
2014 20152013
CRAFT VOLUME
20142013 2015
37
G R O W I N G A B O V E P R E M I U M & C R A F TR E S H A P I N G P O R T F O L I O T O P U R S U E A R E A S O F G R O W T H 1
MCC growth in support of above premium & craft strategy.
20142013 2015
1. Mad Jack was introduced in 2015.
+5.9% +19.0% +16.7%

3838
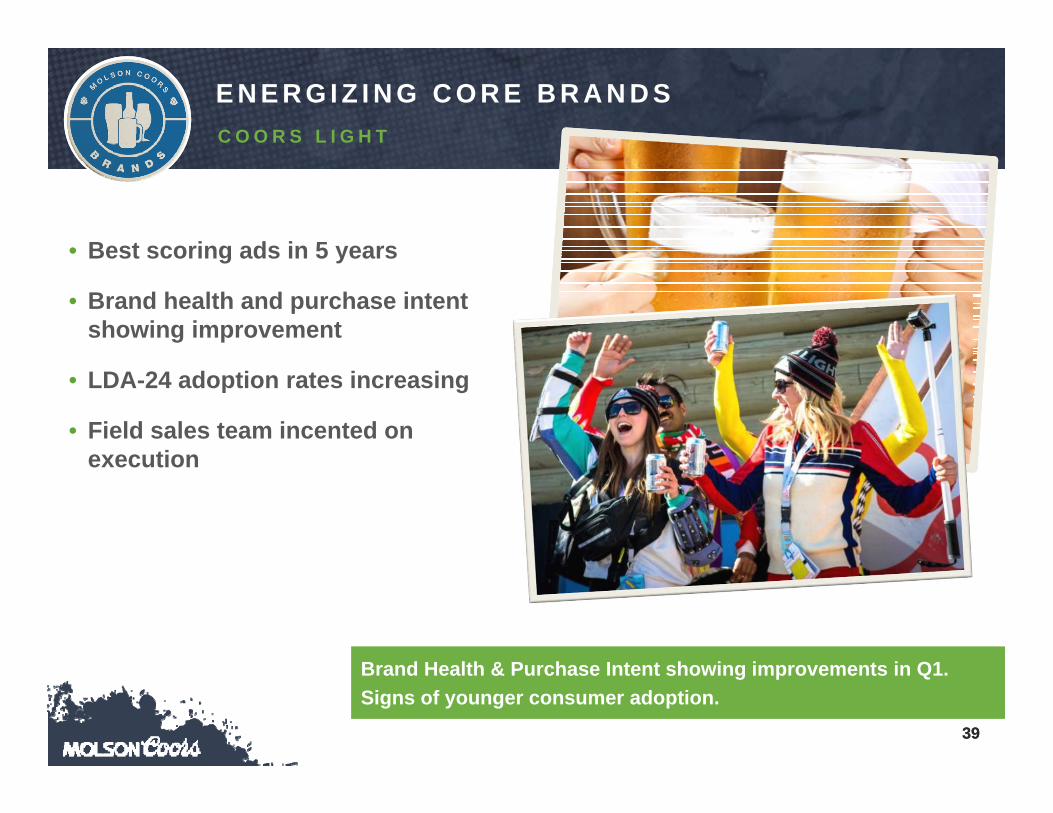
E N E R G I Z I N G C O R E B R A N D SC O O R S L I G H T
• Strengthening Communications
• Improving Quality & Taste Perceptions
• Recruiting Next Generation (LDA-24)
• Points of Connection Pressure
DIFFERENCE MAKERS DRIVING IMPROVED PURCHASE INTENT
Leading Premium Category across the majority of metrics.
39
Brand Health & Purchase Intent showing improvements in Q1. Signs of younger consumer adoption.
• Best scoring ads in 5 years
• Brand health and purchase intent showing improvement
• LDA-24 adoption rates increasing
• Field sales team incented on execution
39
E N E R G I Z I N G C O R E B R A N D SC O O R S L I G H T
4040
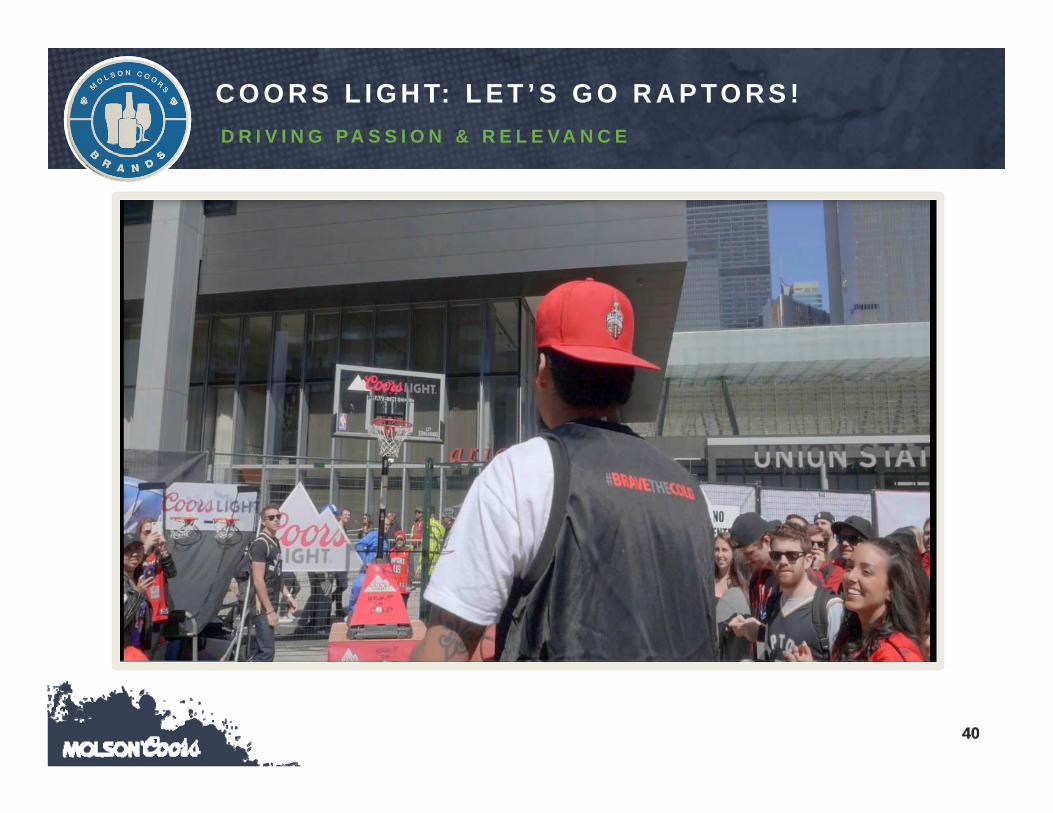
C O O R S L I G H T: L E T ’ S G O R A P TO R S !D R I V I N G P A S S I O N & R E L E V A N C E

42
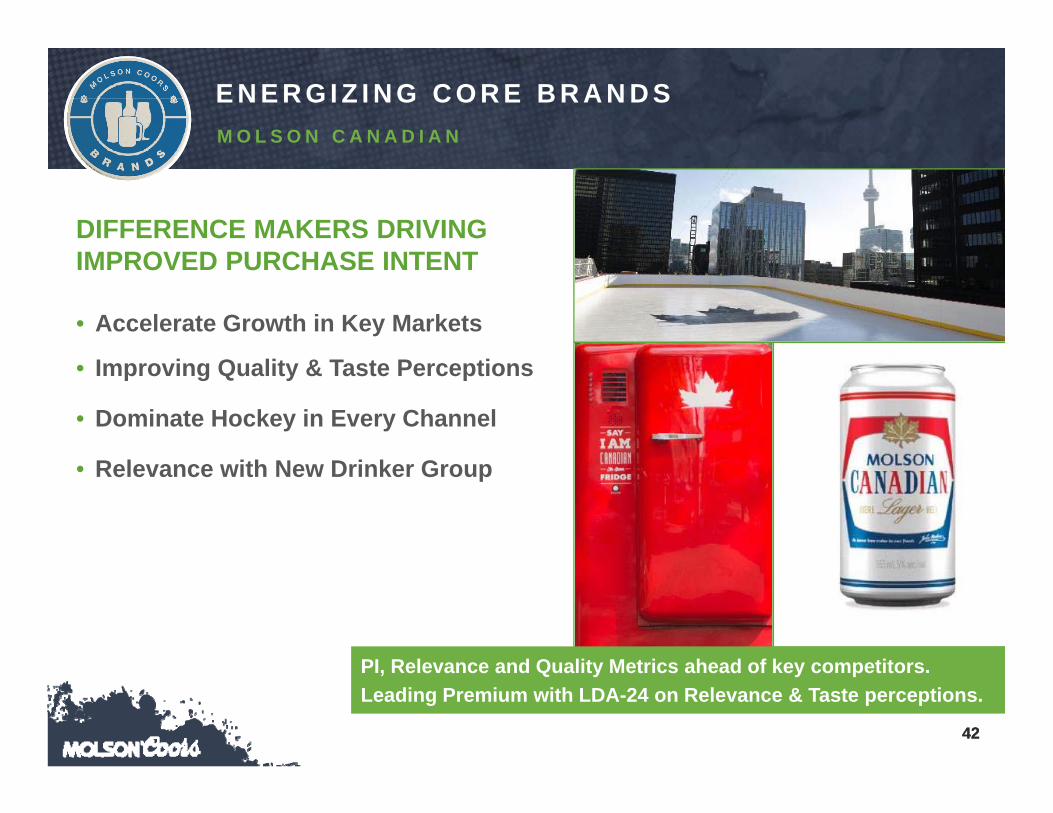
E N E R G I Z I N G C O R E B R A N D SM O L S O N C A N A D I A N
• Accelerate Growth in Key Markets
• Improving Quality & Taste Perceptions
• Dominate Hockey in Every Channel
• Relevance with New Drinker Group
DIFFERENCE MAKERS DRIVING IMPROVED PURCHASE INTENT
PI, Relevance and Quality Metrics ahead of key competitors.Leading Premium with LDA-24 on Relevance & Taste perceptions.
42

4343
C A N A D I A N : A N Y T H I N G F O R H O C K E YA C H I E V E D A L M O S T 2 0 0 M I L L I O N E A R N E D I M P R E S S I O N S

45
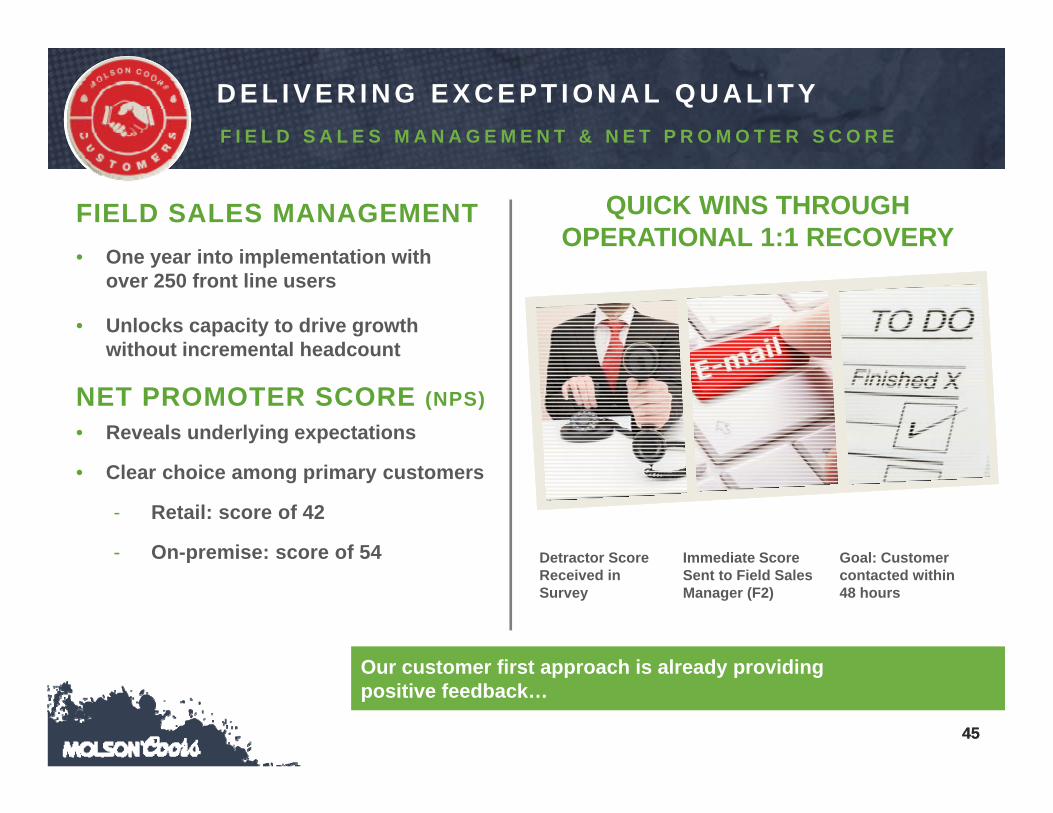
Our customer first approach is already providing positive feedback…
Detractor Score Received in Survey
Immediate Score Sent to Field Sales Manager (F2)
Goal: Customer contacted within 48 hours
QUICK WINS THROUGH OPERATIONAL 1:1 RECOVERY
45
D E L I V E R I N G E X C E P T I O N A L Q U A L I T YF I E L D S A L E S M A N A G E M E N T & N E T P R O M O T E R S C O R E
• One year into implementation with over 250 front line users
• Unlocks capacity to drive growth without incremental headcount
FIELD SALES MANAGEMENT
NET PROMOTER SCORE (NPS)• Reveals underlying expectations
• Clear choice among primary customers
- Retail: score of 42
- On-premise: score of 54
4646
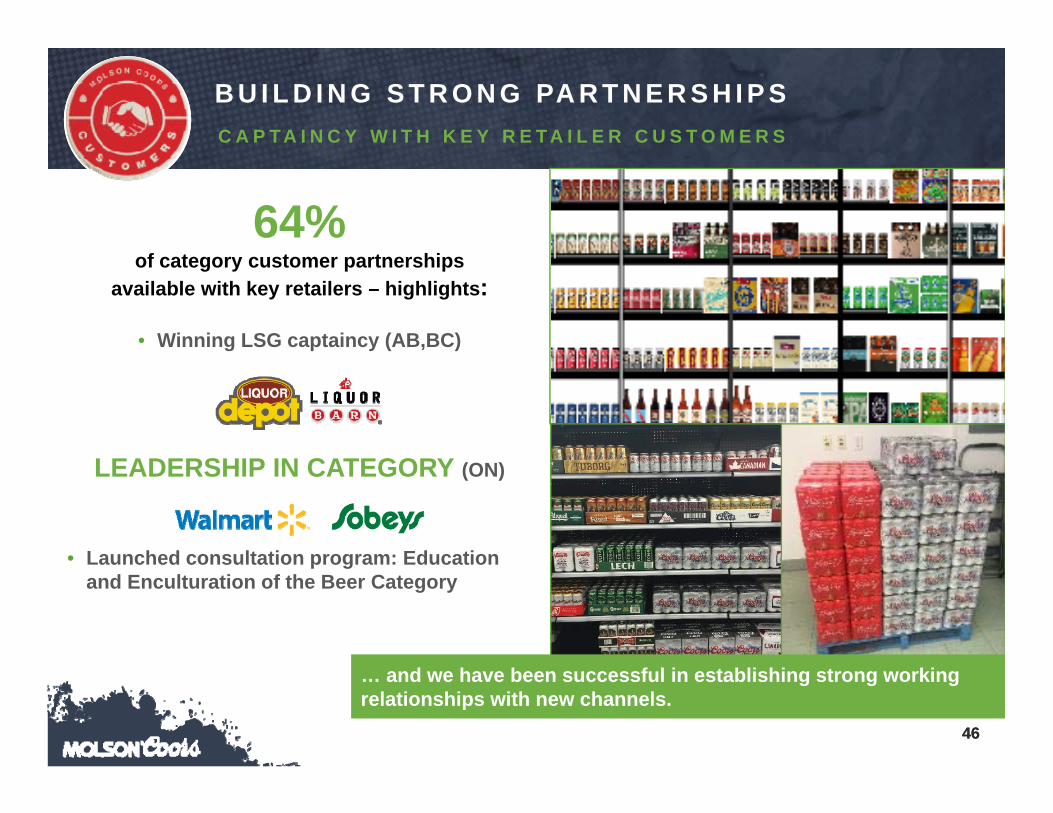
… and we have been successful in establishing strong working relationships with new channels.
B U I L D I N G S T R O N G PA R T N E R S H I P SC A P T A I N C Y W I T H K E Y R E T A I L E R C U S T O M E R S
• Winning LSG captaincy (AB,BC)
LEADERSHIP IN CATEGORY (ON)
• Launched consultation program: Education and Enculturation of the Beer Category
64% of category customer partnerships
available with key retailers – highlights:
47
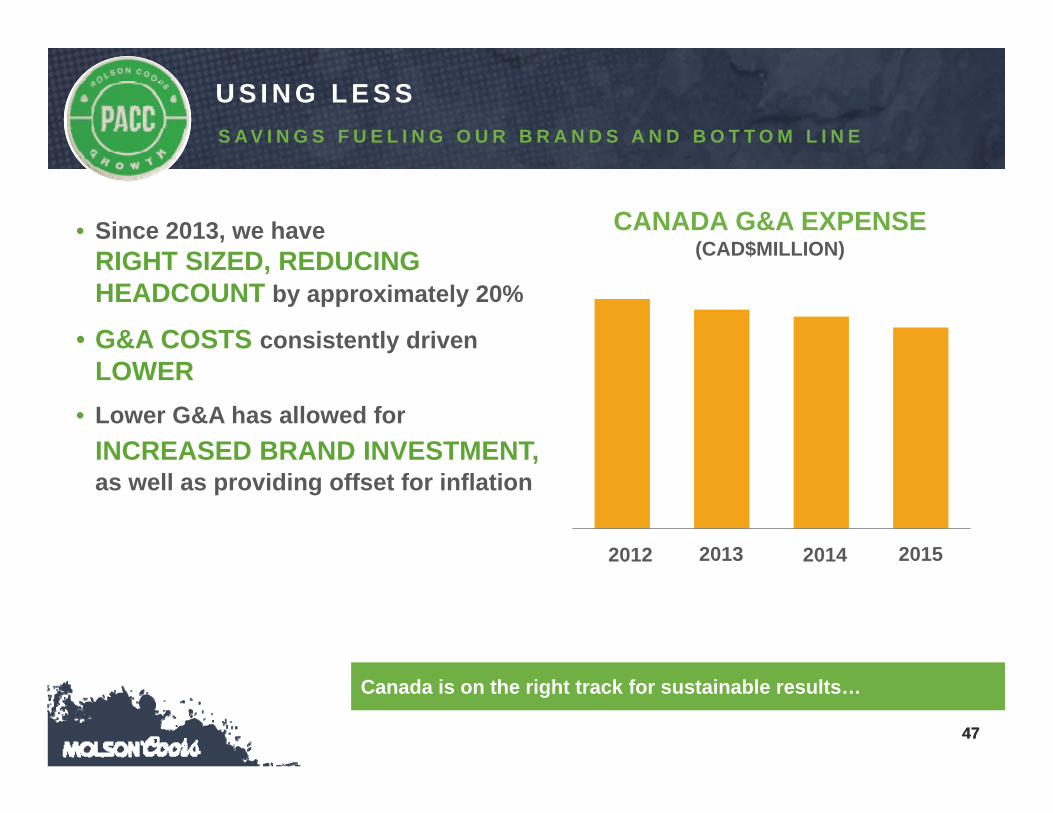
Canada is on the right track for sustainable results…
47
U S I N G L E S SS A V I N G S F U E L I N G O U R B R A N D S A N D B O T T O M L I N E
• Since 2013, we have RIGHT SIZED, REDUCING HEADCOUNT by approximately 20%
• G&A COSTS consistently driven LOWER
• Lower G&A has allowed for INCREASED BRAND INVESTMENT,as well as providing offset for inflation
2012 2013 2014 2015
CANADA G&A EXPENSE(CAD$MILLION)
48
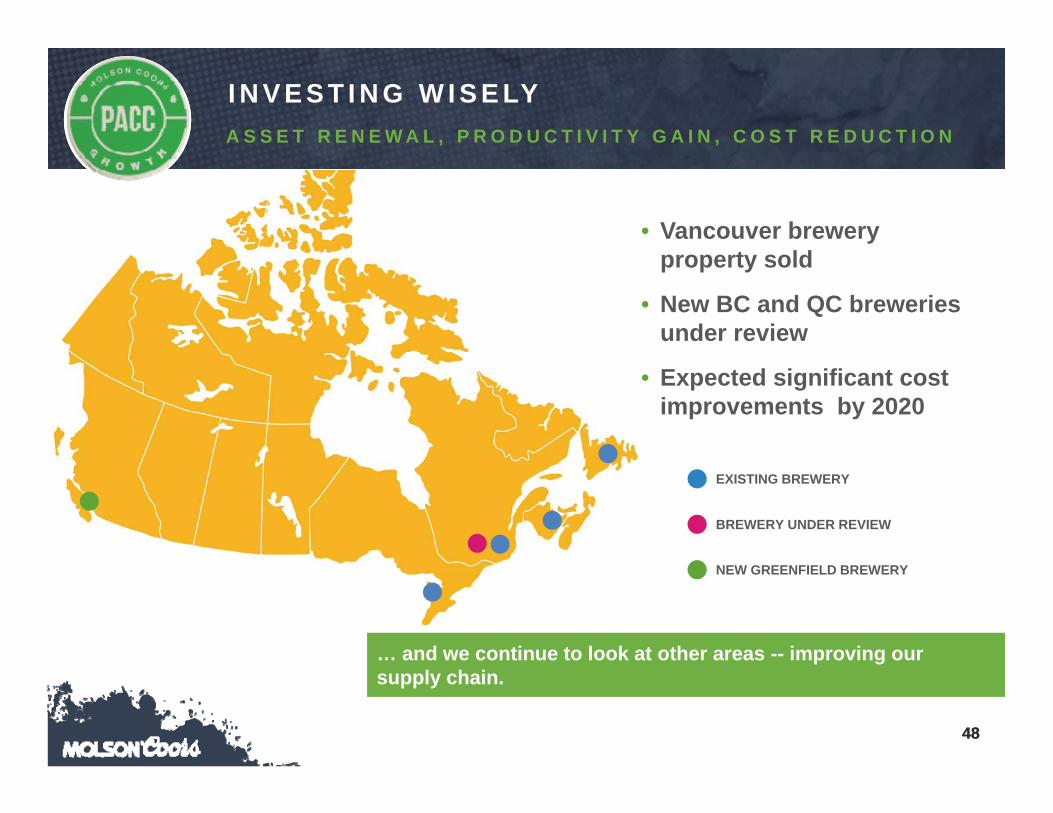
… and we continue to look at other areas -- improving our supply chain.
• Vancouver brewery property sold
• New BC and QC breweries under review
• Expected significant cost improvements by 2020
48
I N V E S T I N G W I S E LYA S S E T R E N E W A L , P R O D U C T I V I T Y G A I N , C O S T R E D U C T I O N
EXISTING BREWERY
BREWERY UNDER REVIEW
NEW GREENFIELD BREWERY

49
S U M M A RY
• Right steps to set up the business for long-term success and growth
• Considerable progress made in a short time
• Keenly focused on improving core brand performance
• Miller acquisition will improve portfolio breadth and unlock savings
49
J U N E 8 , 2 0 1 6
S I M O N C O X
C E O , M O L S O N C O O R S E U R O P E
51
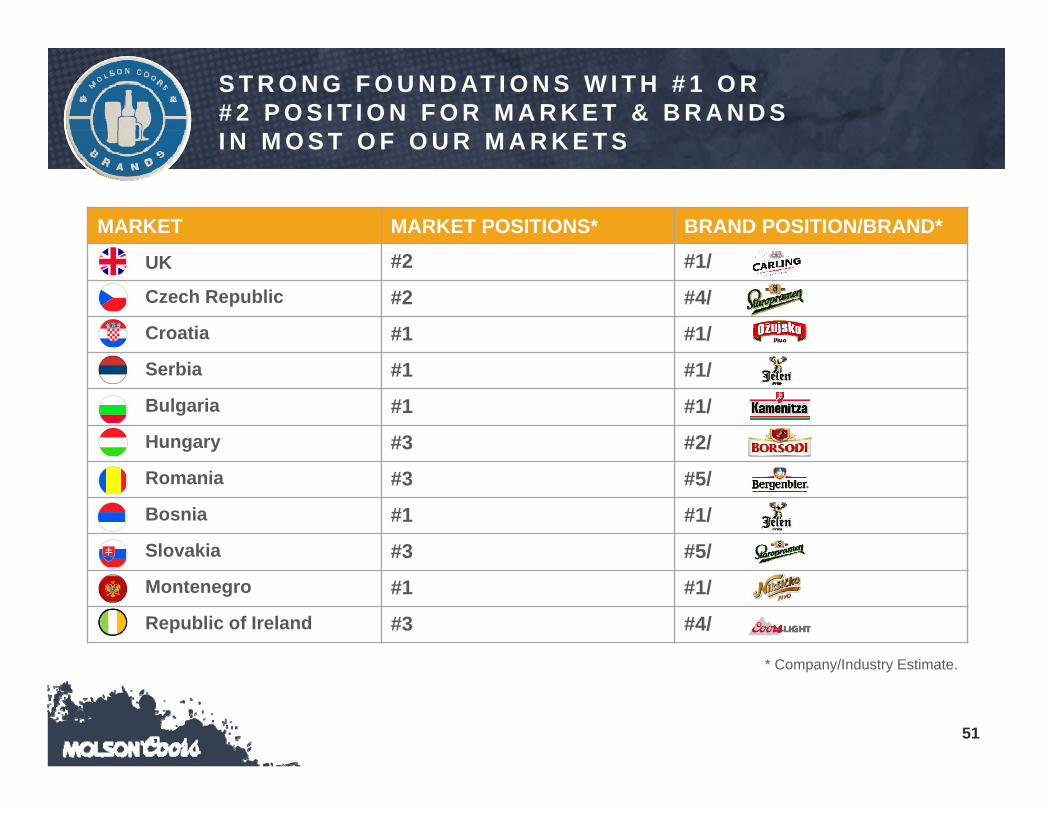
MARKET MARKET POSITIONS* BRAND POSITION/BRAND*
UK #2 #1/
Czech Republic #2 #4/
Croatia #1 #1/
Serbia #1 #1/
Bulgaria #1 #1/
Hungary #3 #2/
Romania #3 #5/
Bosnia #1 #1/
Slovakia #3 #5/
Montenegro #1 #1/
Republic of Ireland #3 #4/
* Company/Industry Estimate.
S T R O N G F O U N D AT I O N S W I T H # 1 O R # 2 P O S I T I O N F O R M A R K E T & B R A N D S I N M O S T O F O U R M A R K E T S
52
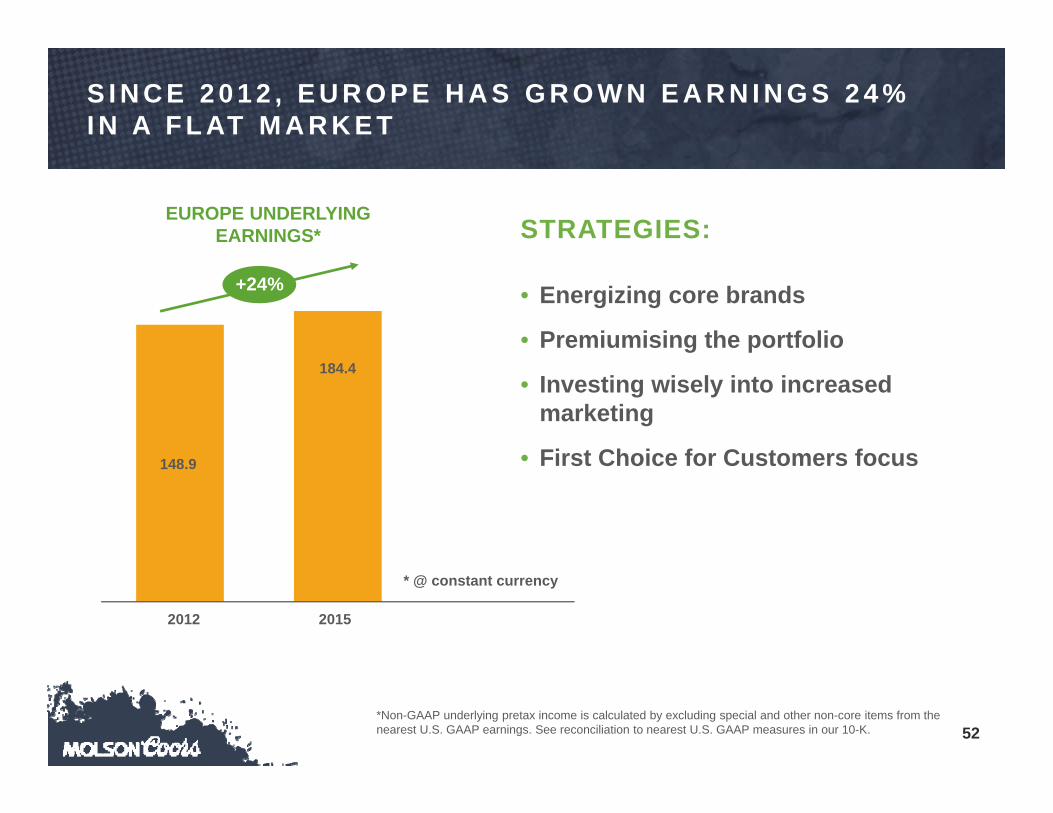
S I N C E 2 0 1 2 , E U R O P E H A S G R O W N E A R N I N G S 2 4 % I N A F L AT M A R K E T
* @ constant currency
20152012
+24%
148.9
184.4
EUROPE UNDERLYING EARNINGS*
• Energizing core brands
• Premiumising the portfolio
• Investing wisely into increased marketing
• First Choice for Customers focus
STRATEGIES:
*Non-GAAP underlying pretax income is calculated by excluding special and other non-core items from the nearest U.S. GAAP earnings. See reconciliation to nearest U.S. GAAP measures in our 10-K.
53
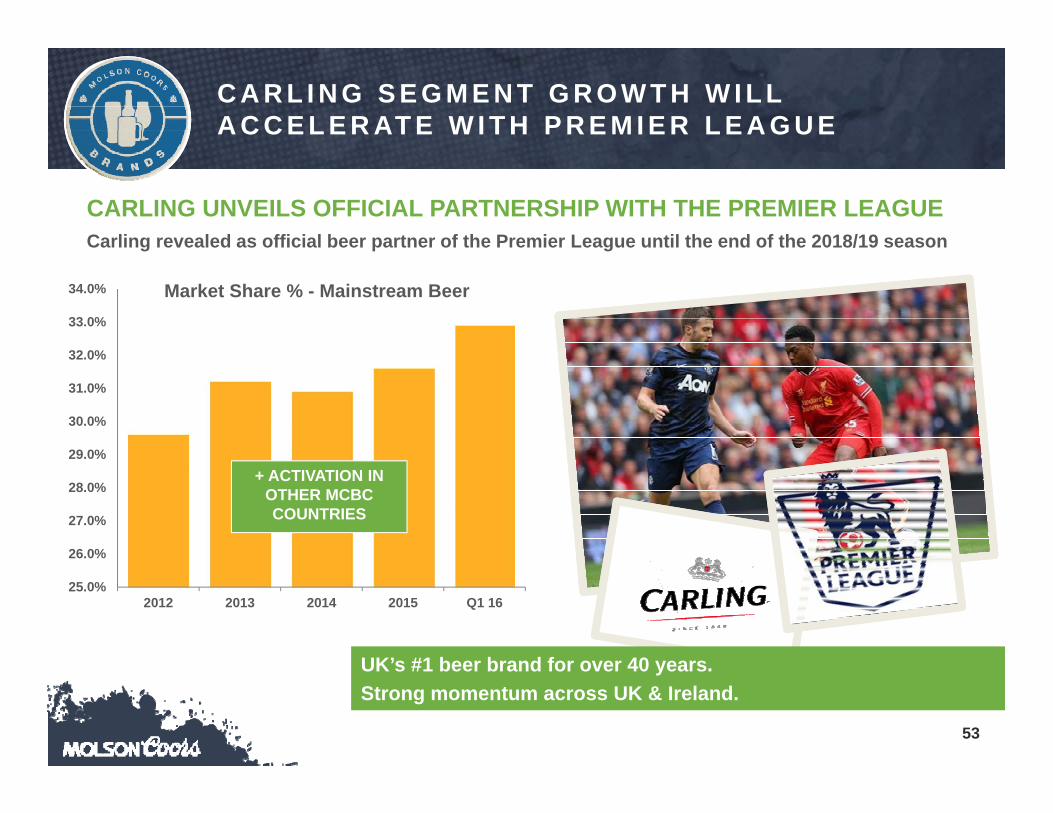
CARLING UNVEILS OFFICIAL PARTNERSHIP WITH THE PREMIER LEAGUE Carling revealed as official beer partner of the Premier League until the end of the 2018/19 season
C A R L I N G S E G M E N T G R O W T H W I L L A C C E L E R AT E W I T H P R E M I E R L E A G U E
UK’s #1 beer brand for over 40 years.Strong momentum across UK & Ireland.
25.0%
26.0%
27.0%
28.0%
29.0%
30.0%
31.0%
32.0%
33.0%
34.0%
2012 2013 2014 2015 Q1 16
Market Share % - Mainstream Beer
+ ACTIVATION IN OTHER MCBC COUNTRIES
54
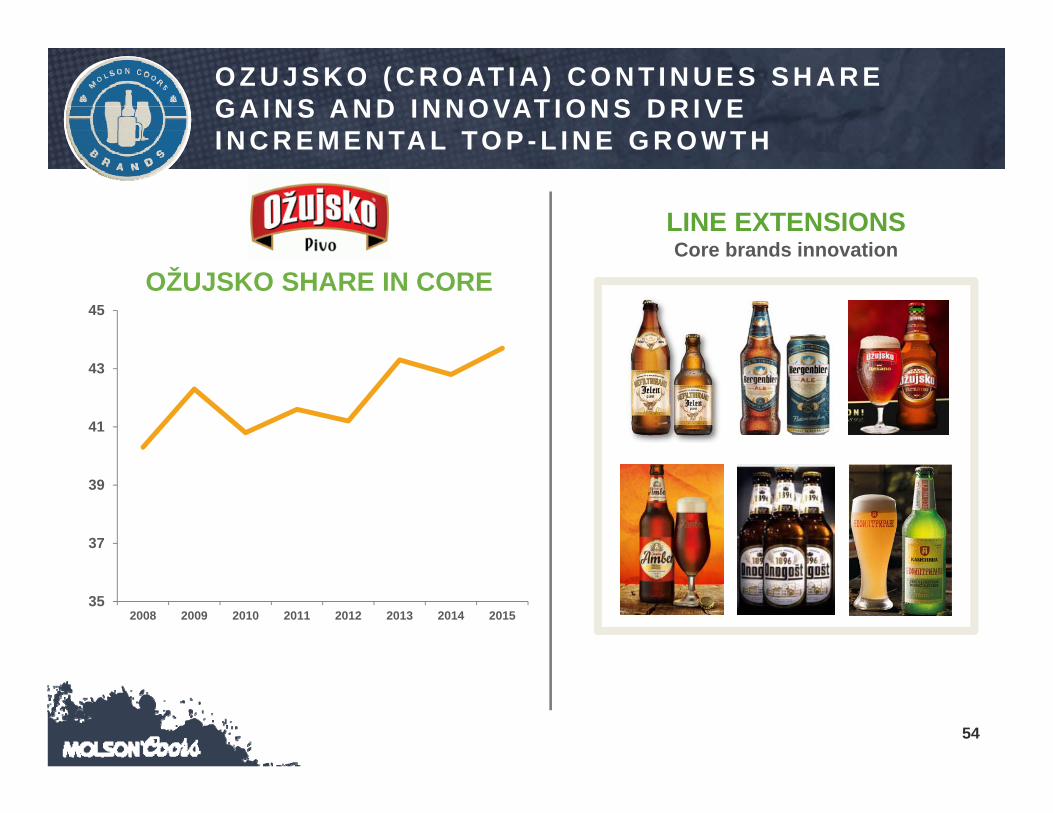
O Z U J S K O ( C R O AT I A ) C O N T I N U E S S H A R E G A I N S A N D I N N O VAT I O N S D R I V E I N C R E M E N TA L TO P - L I N E G R O W T H
35
37
39
41
43
45
2008 2009 2010 2011 2012 2013 2014 2015
LINE EXTENSIONSCore brands innovation
OŽUJSKO SHARE IN CORE
55
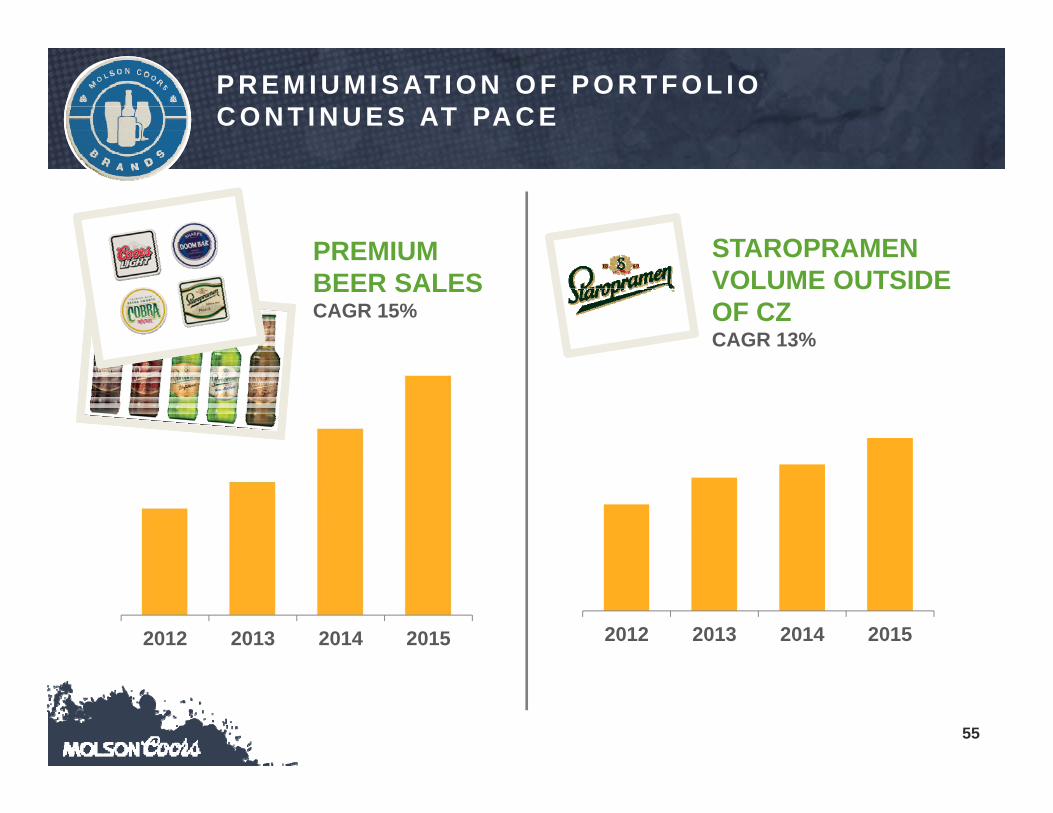
P R E M I U M I S AT I O N O F P O R T F O L I O C O N T I N U E S AT PA C E
PREMIUM BEER SALES CAGR 15%
2012 2013 2014 2015 2012 2013 2014 2015
STAROPRAMEN VOLUME OUTSIDE OF CZ CAGR 13%


57
C R E AT I V E S TA R O P R A M E N A N D P R AV H A B R A N D I N G

59
BUILD OUR ‘SIGNPOST’ BRANDS
NURTURE FRANCISCAN WELL & INNOVATE
ACROSS THE PORFOLIO
DOOM BAR GROWTH CAGR 23% SINCE 2011
DOOM BAR VOLUME GROWTH
C R A F T P O R T F O L I O : U K ’ S # 1 C A S K B R A N D A N D I R E L A N D ’ S # 1 C R A F T B R E W E R
CAGR23%
60
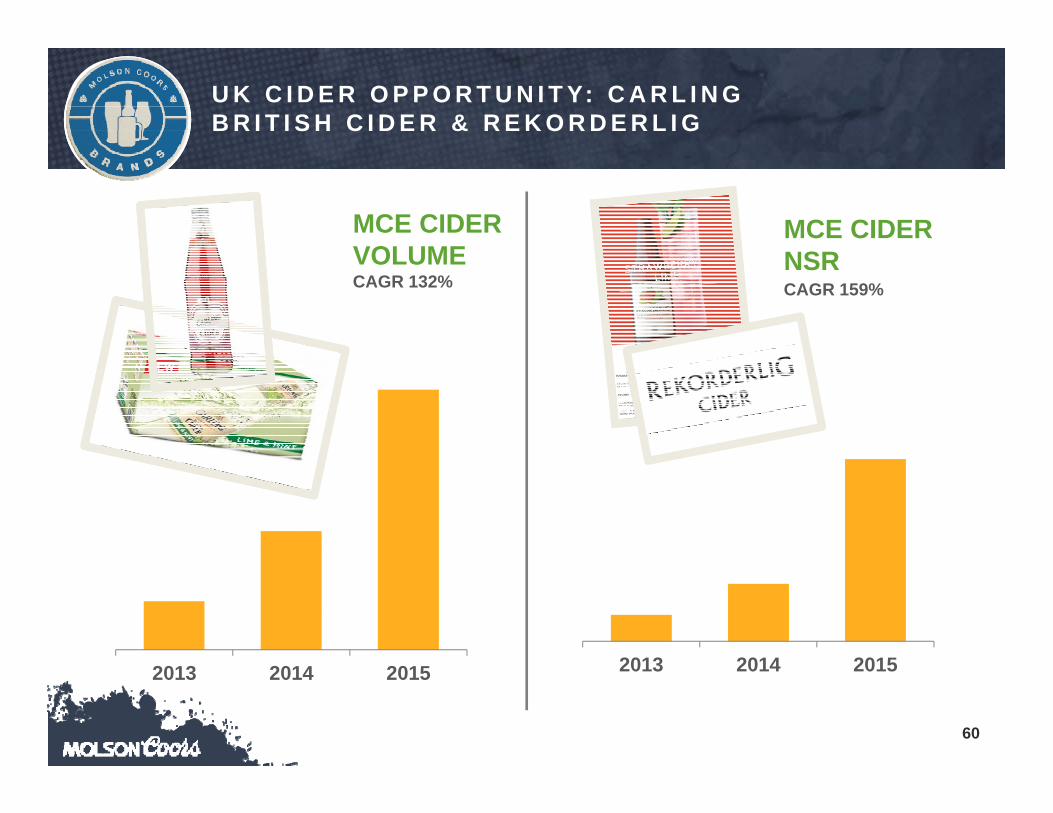
U K C I D E R O P P O R T U N I T Y: C A R L I N G B R I T I S H C I D E R & R E K O R D E R L I G
MCE CIDER VOLUMECAGR 132%
2013 2014 2015 2013 2014 2015
MCE CIDER NSRCAGR 159%

61
D I G I TA L A G E N D A A N D S O C I A L M E D I A D R I V E C O N S U M E R E N G A G E M E N T
62
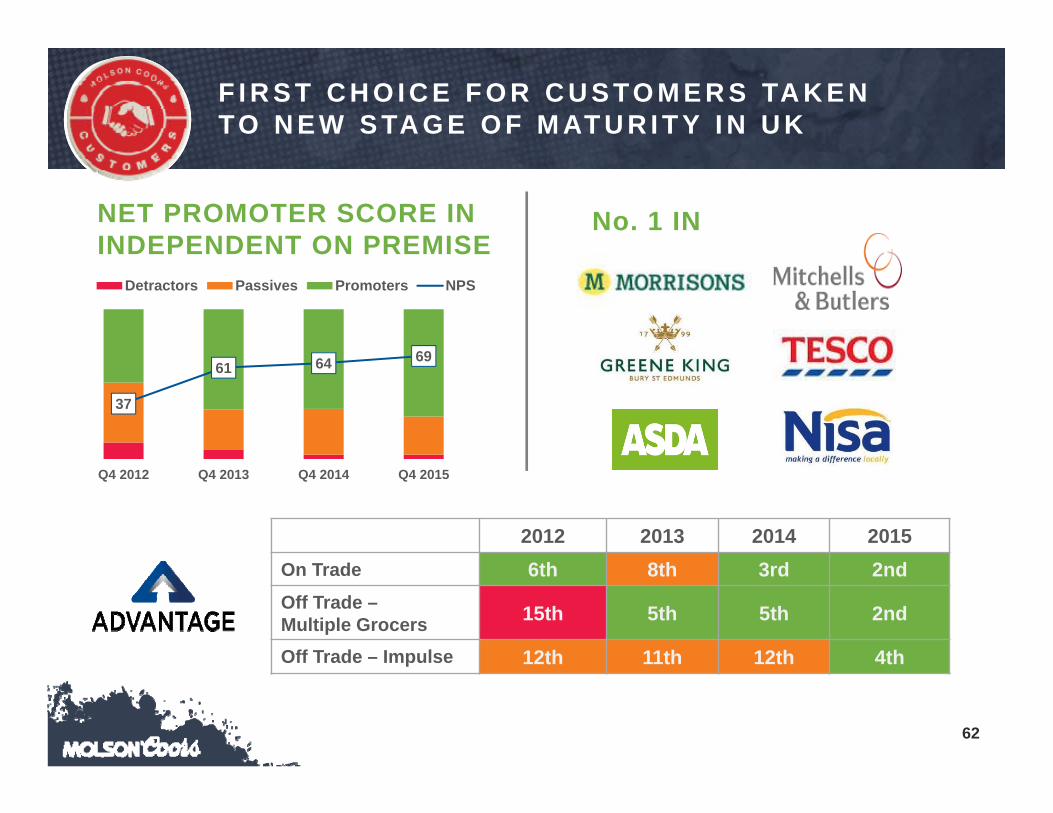
37
61 64 69
0
20
40
60
80
100
0%
20%
40%
60%
80%
100%
Q4 2012 Q4 2013 Q4 2014 Q4 2015
Detractors Passives Promoters NPS
F I R S T C H O I C E F O R C U S TO M E R S TA K E N TO N E W S TA G E O F M AT U R I T Y I N U K
NET PROMOTER SCORE IN INDEPENDENT ON PREMISE
No. 1 IN
2012 2013 2014 2015On Trade 6th 8th 3rd 2ndOff Trade –Multiple Grocers 15th 5th 5th 2nd
Off Trade – Impulse 12th 11th 12th 4th
63
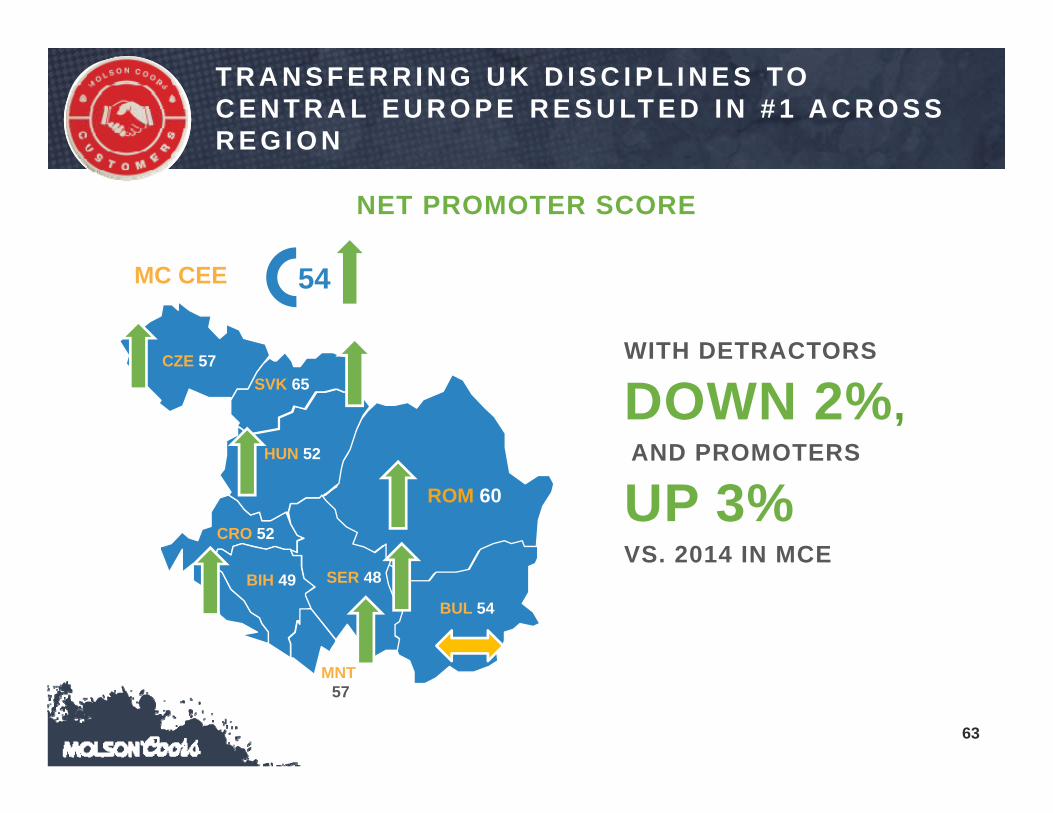
CRO 52
BUL 54
MNT 57
BIH 49
HUN 52
SER 48
CZE 57SVK 65
54MC CEE
ROM 60
NET PROMOTER SCORE
T R A N S F E R R I N G U K D I S C I P L I N E S TO C E N T R A L E U R O P E R E S U LT E D I N # 1 A C R O S S R E G I O N
WITH DETRACTORS
DOWN 2%,AND PROMOTERS
UP 3% VS. 2014 IN MCE
64
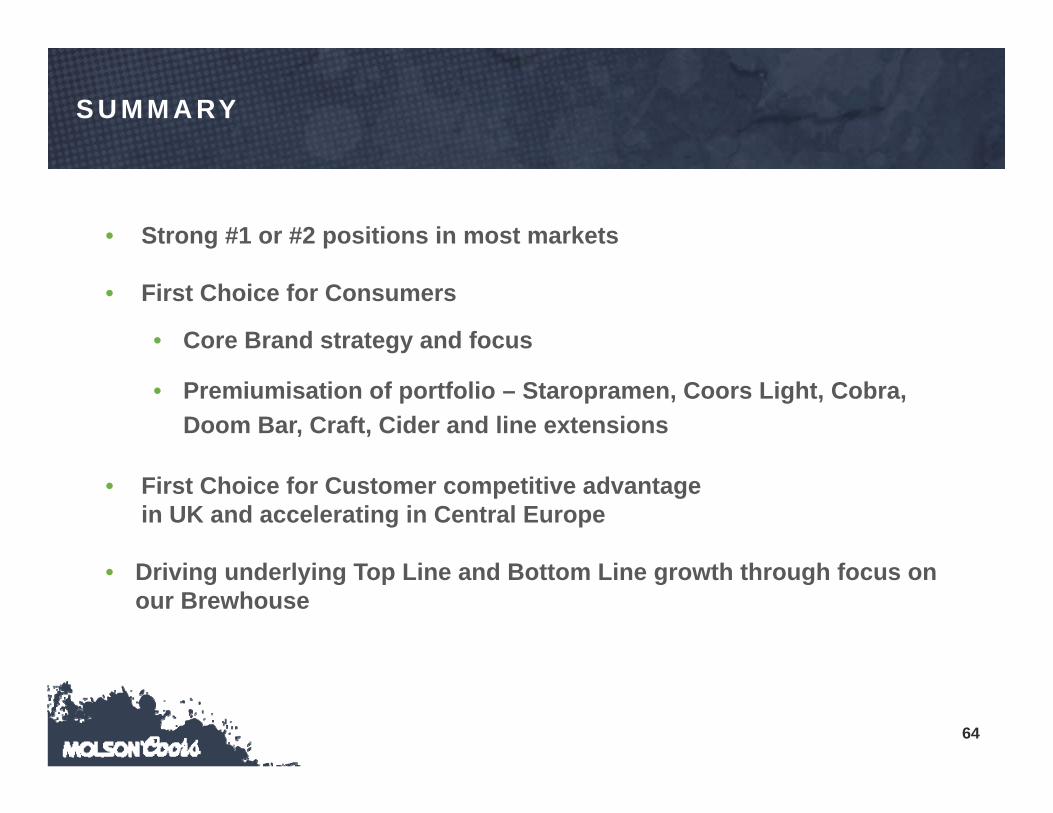
• Strong #1 or #2 positions in most markets
• First Choice for Consumers
• Core Brand strategy and focus
• Premiumisation of portfolio – Staropramen, Coors Light, Cobra, Doom Bar, Craft, Cider and line extensions
• First Choice for Customer competitive advantage in UK and accelerating in Central Europe
• Driving underlying Top Line and Bottom Line growth through focus on our Brewhouse
S U M M A RY
J U N E 8 , 2 0 1 6
K A N D Y A N A N D
C E O , M O L S O N C O O R S I N T E R N AT I O N A L
66
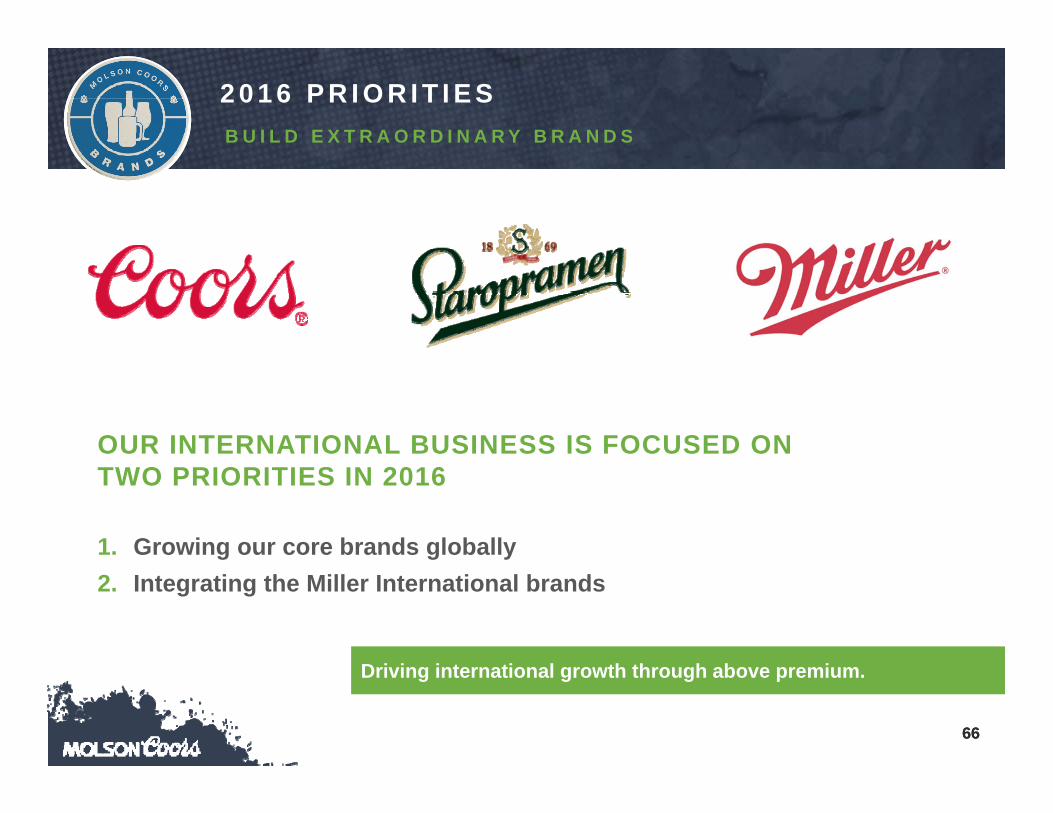
2 0 1 6 P R I O R I T I E SB U I L D E X T R A O R D I N A R Y B R A N D S
Driving international growth through above premium.
1. Growing our core brands globally2. Integrating the Miller International brands
OUR INTERNATIONAL BUSINESS IS FOCUSED ON TWO PRIORITIES IN 2016
66

67
-$35
-$30
-$25
-$20
-$15
-$10
-$5
$0
2011 2012 2013 2014 2015
MCI UNDERLYING PRETAX INCOME ($MILLIONS)(1)
2015 pretax impacted by China restructure and FX
S T R O N G T R A C K R E C O R D O F P R E TA X I M P R O V E M E N T
F U E L G R O W T H
On track to reach 2016 profitability, net of FX and Bihar prohibition.
67(1) Non-GAAP underlying pretax income is calculated by excluding special and other non-core items from the nearest U.S. GAAP earnings. See reconciliation to nearest U.S. GAAP measures in our 10-K.
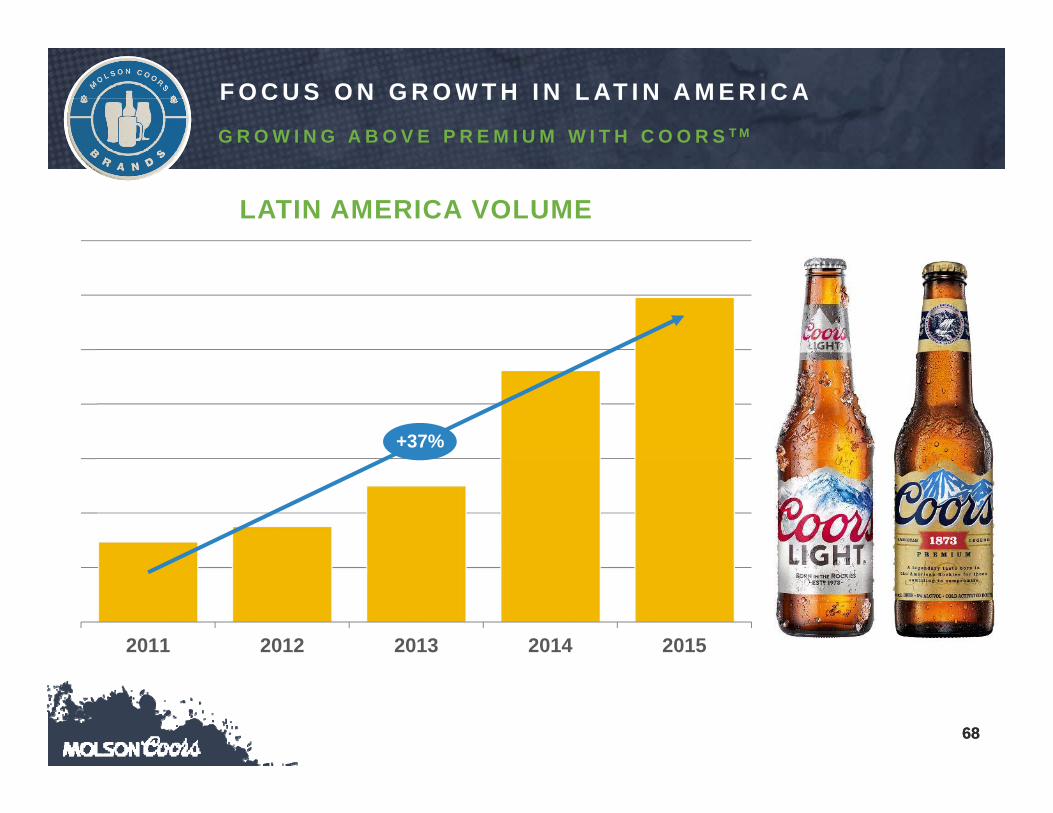
68
2011 2012 2013 2014 2015
LATIN AMERICA VOLUME
F O C U S O N G R O W T H I N L AT I N A M E R I C A
G R O W I N G A B O V E P R E M I U M W I T H C O O R S T M
68
+37%
69
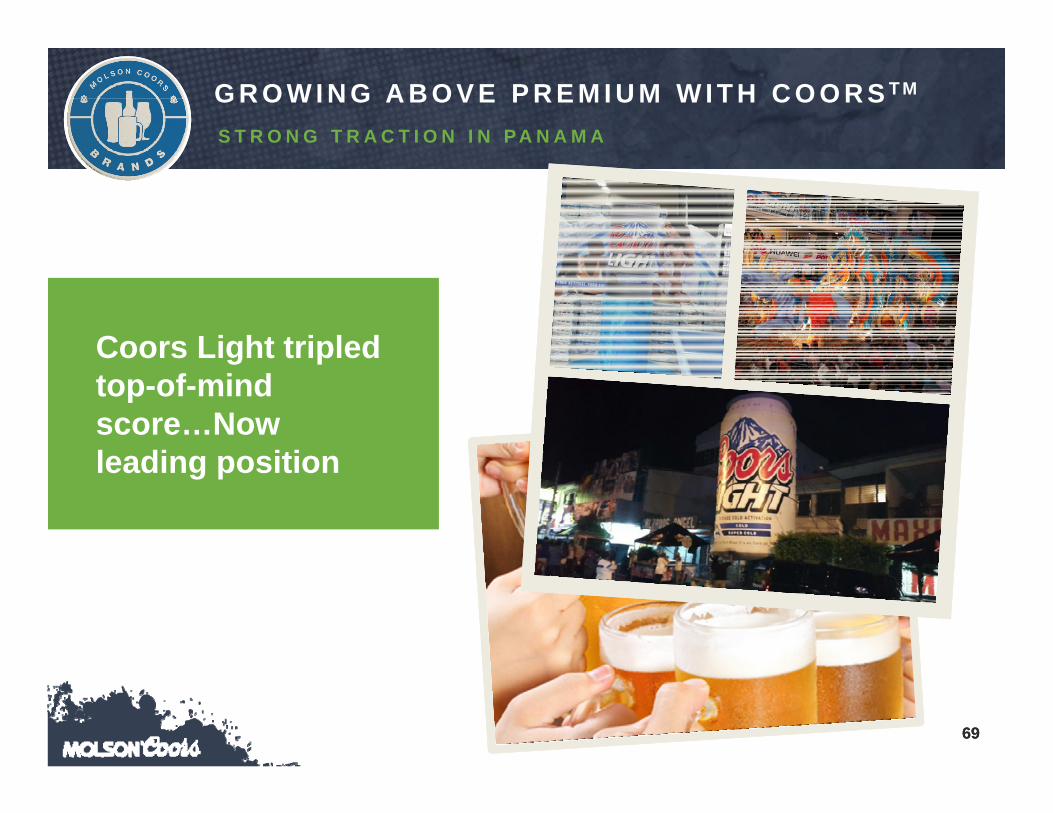
G R O W I N G A B O V E P R E M I U M W I T H C O O R S T M
S T R O N G T R A C T I O N I N P A N A M A
Coors Light tripled top-of-mind score…Now leading position
69
70
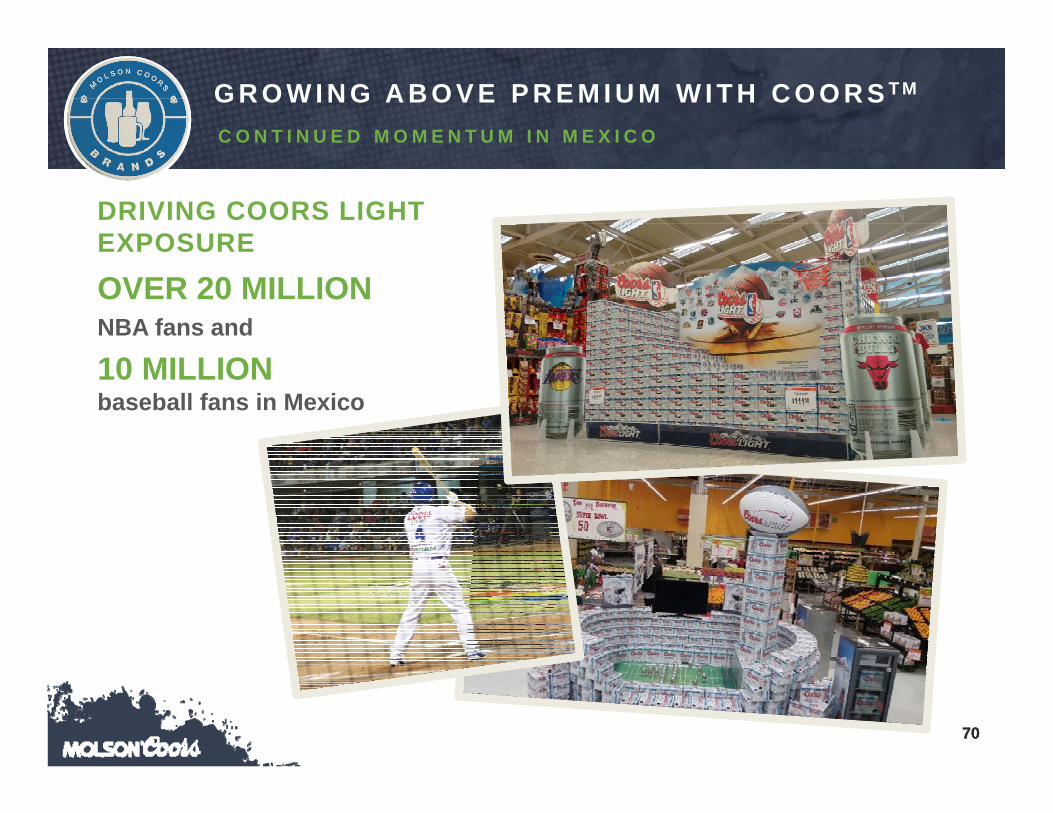
G R O W I N G A B O V E P R E M I U M W I T H C O O R S T M
C O N T I N U E D M O M E N T U M I N M E X I C O
OVER 20 MILLION NBA fans and
10 MILLION baseball fans in Mexico
DRIVING COORS LIGHT EXPOSURE
70

71
G R O W I N G A B O V E P R E M I U M W I T H C O O R SS U C C E S S F U L C O L O M B I A L A U N C H
COORS LIGHT DISTRIBUTION INCREASED TO 16,000 OUTLETS
71

72

73
D R I V I N G S TA R O P R A M E N G R O W T HN E W V I S U A L B R A N D I D E N T I T Y
Driving digital via YouTube in Russia/Ukraine – 4 million views.
73
Staropramen Ukraine Market ShareRecord high market share
74
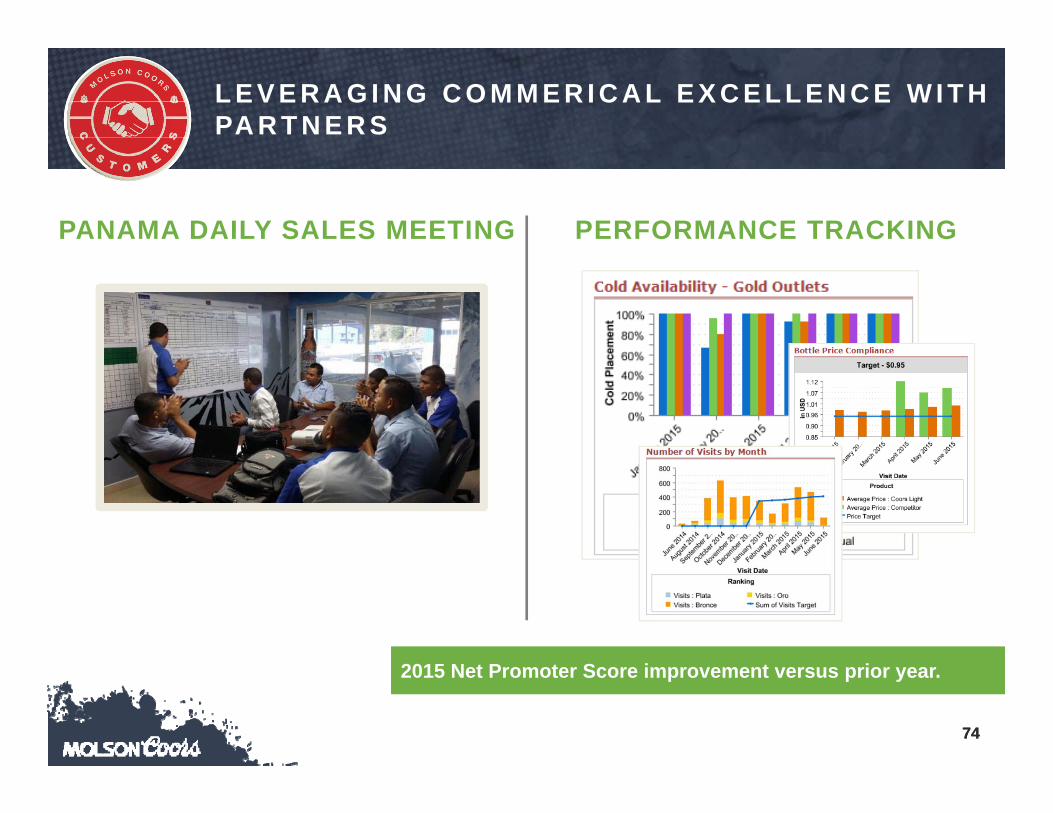
L E V E R A G I N G C O M M E R I C A L E X C E L L E N C E W I T H PA R T N E R S
PANAMA DAILY SALES MEETING PERFORMANCE TRACKING
74
2015 Net Promoter Score improvement versus prior year.
75
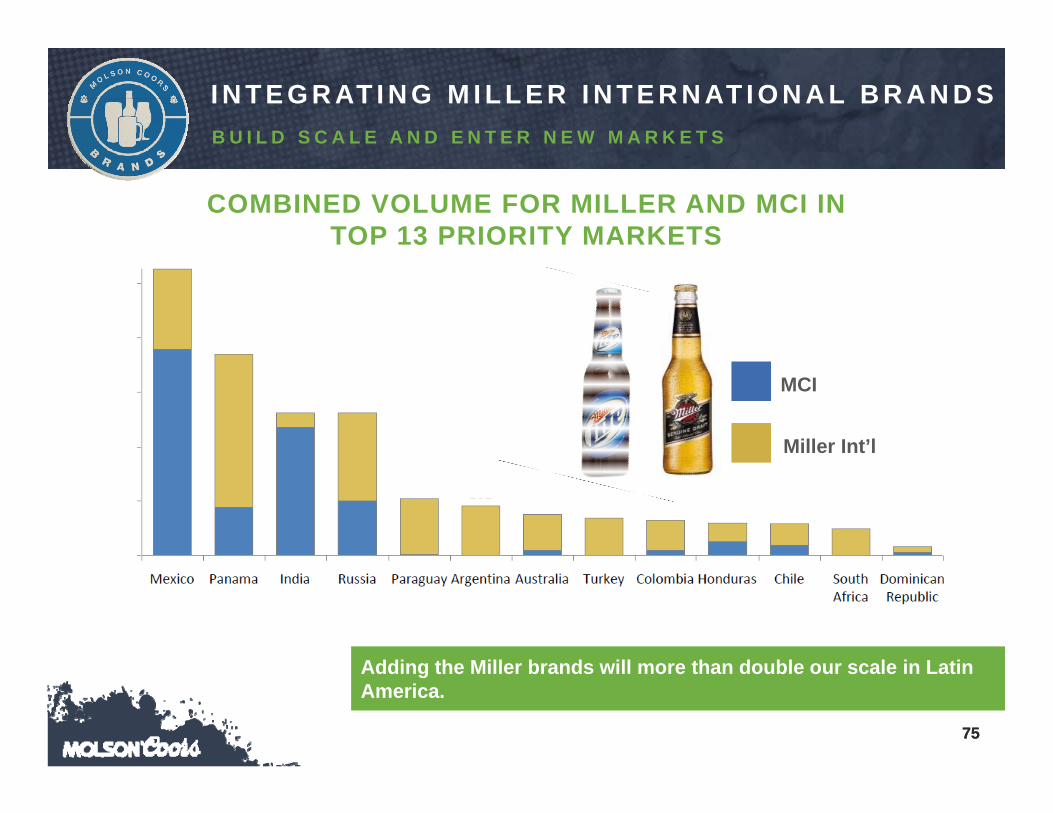
I N T E G R AT I N G M I L L E R I N T E R N AT I O N A L B R A N D S B U I L D S C A L E A N D E N T E R N E W M A R K E T S
COMBINED VOLUME FOR MILLER AND MCI IN TOP 13 PRIORITY MARKETS
Adding the Miller brands will more than double our scale in Latin America.
75
MCI
Miller Int’l
76
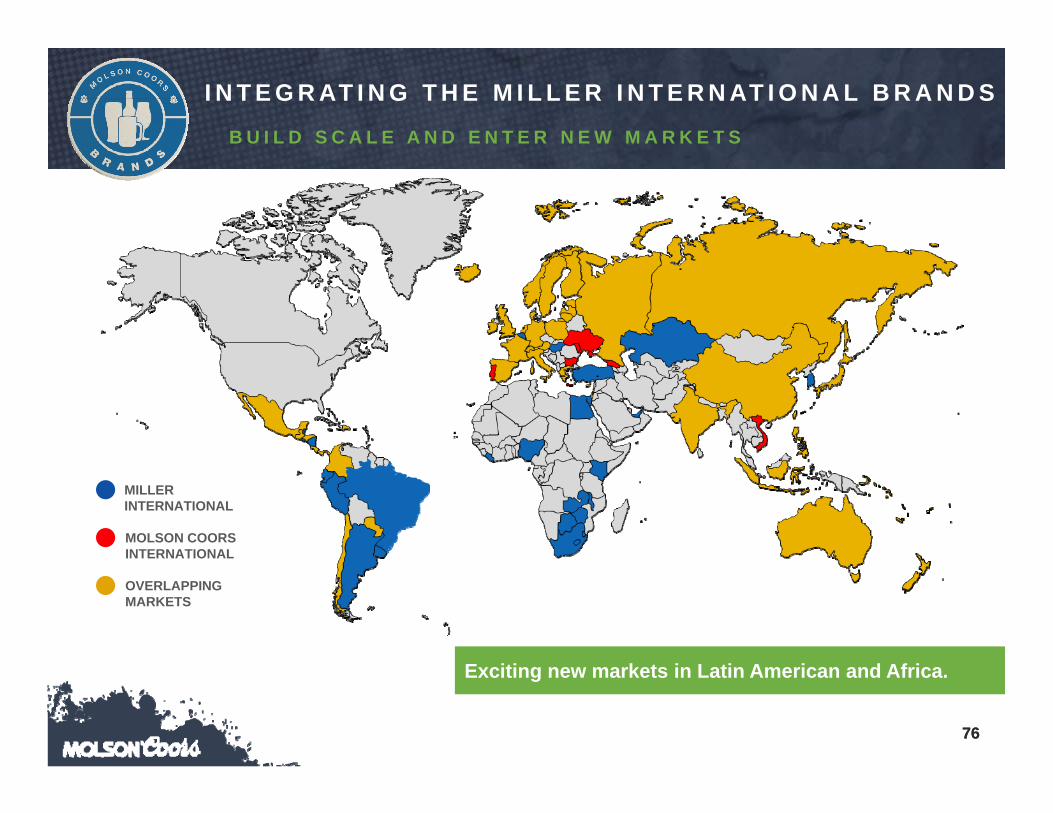
I N T E G R AT I N G T H E M I L L E R I N T E R N AT I O N A L B R A N D S
B U I L D S C A L E A N D E N T E R N E W M A R K E T S
Exciting new markets in Latin American and Africa.
76
OVERLAPPING MARKETS
MOLSON COORSINTERNATIONAL
MILLER INTERNATIONAL

77
BUILD EXTRAORDINARY BRANDS
• Invest behind Coors Light in Latin America
• Drive Staropramen growth in Europe
• Integrate Miller International brands
DELIGHT CUSTOMERS AND PARTNERS• Continue to develop partner FSM capability
• Improve engagement scores
• Focus on quality and service delivery
MCI will contribute positively to top and bottom line growth.
D R I V E F I R S T C H O I C E A N D P R O F I TA B I L I T YS T R O N G F O C U S O N B R A N D S A N D C U S T O M E R S
77
J U N E 8 , 2 0 1 6
M A U R I C I O R E S T R E P O
G L O B A L C F O , M O L S O N C O O R S B R E W I N G C O M PA N Y
79
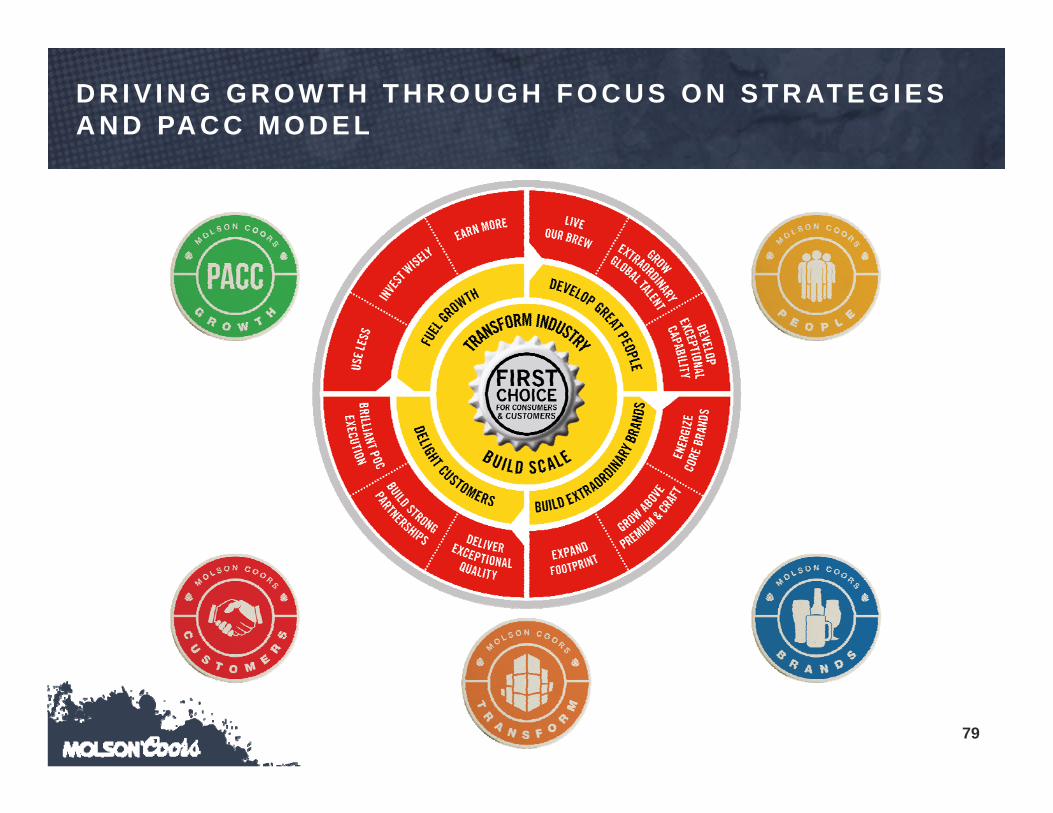
D R I V I N G G R O W T H T H R O U G H F O C U S O N S T R AT E G I E S A N D PA C C M O D E L
80
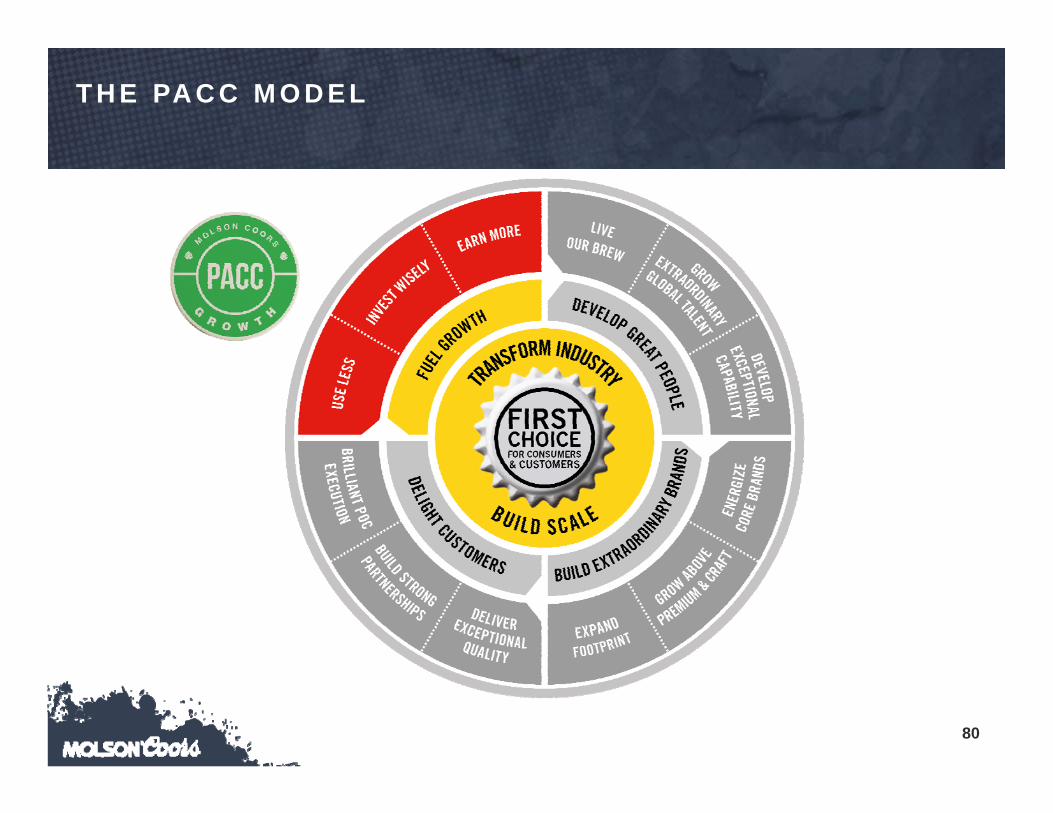
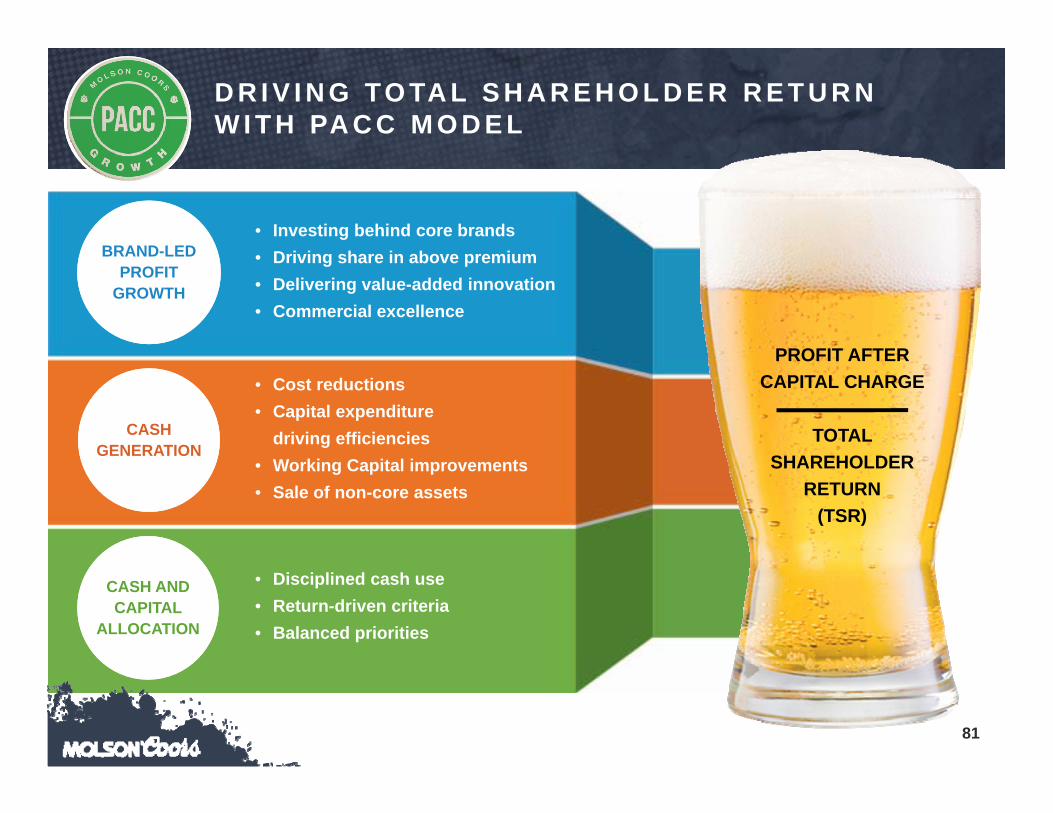
T H E PA C C M O D E L
81
• Investing behind core brands• Driving share in above premium• Delivering value-added innovation• Commercial excellence
• Cost reductions• Capital expenditure
driving efficiencies• Working Capital improvements• Sale of non-core assets
• Disciplined cash use• Return-driven criteria• Balanced priorities
PROFIT AFTERCAPITAL CHARGE
TOTAL SHAREHOLDER
RETURN(TSR)
BRAND-LED PROFIT
GROWTH
CASH AND CAPITAL
ALLOCATION
CASHGENERATION
D R I V I N G TO TA L S H A R E H O L D E R R E T U R N W I T H PA C C M O D E L
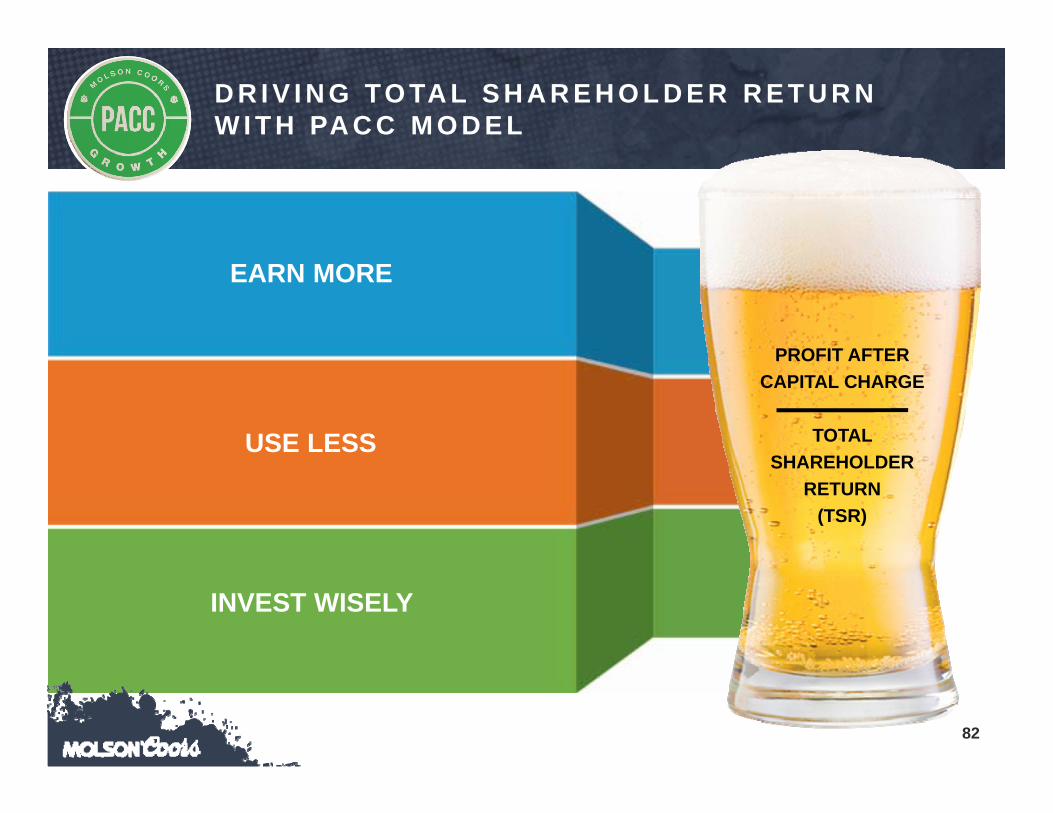
82
EARN MORE
INVEST WISELY
USE LESS
D R I V I N G TO TA L S H A R E H O L D E R R E T U R N W I T H PA C C M O D E L
PROFIT AFTERCAPITAL CHARGE
TOTAL SHAREHOLDER
RETURN(TSR)
83
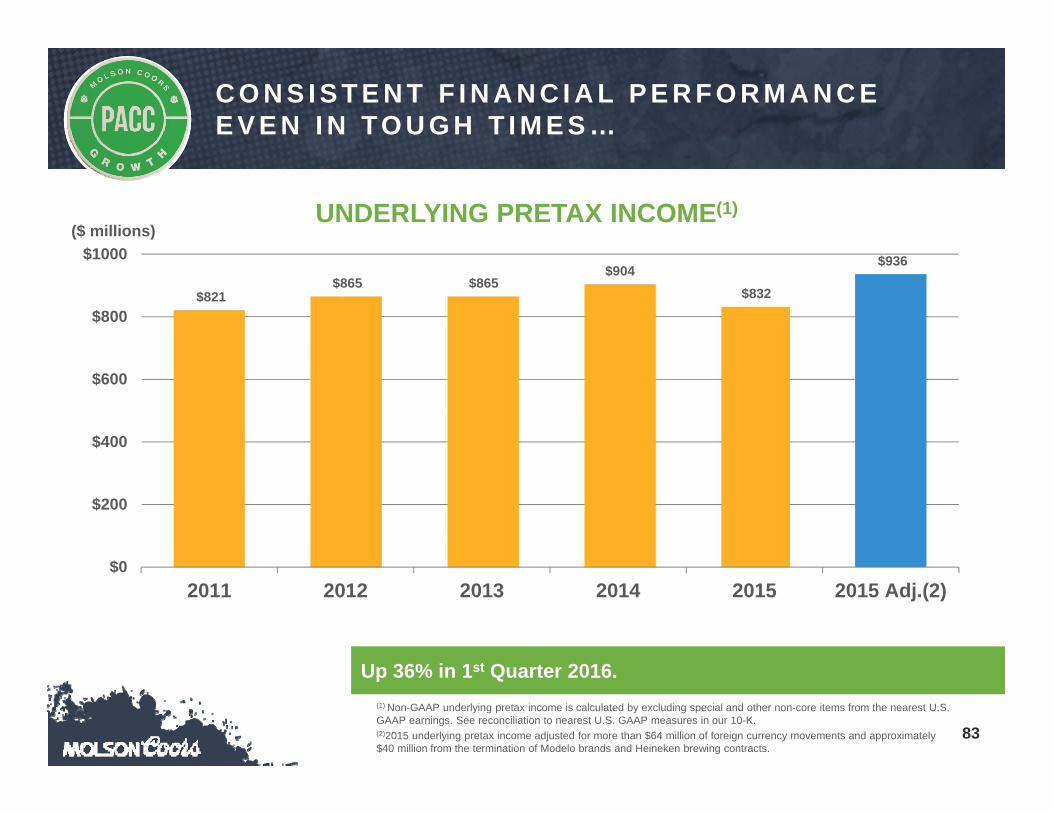
Up 36% in 1st Quarter 2016.(1) Non-GAAP underlying pretax income is calculated by excluding special and other non-core items from the nearest U.S. GAAP earnings. See reconciliation to nearest U.S. GAAP measures in our 10-K.(2)2015 underlying pretax income adjusted for more than $64 million of foreign currency movements and approximately $40 million from the termination of Modelo brands and Heineken brewing contracts.
$821 $865 $865
$904 $832
$936
$0
$200
$400
$600
$800
$1000
2011 2012 2013 2014 2015 2015 Adj.(2)
($ millions)
C O N S I S T E N T F I N A N C I A L P E R F O R M A N C E E V E N I N TO U G H T I M E S …
UNDERLYING PRETAX INCOME(1)
84
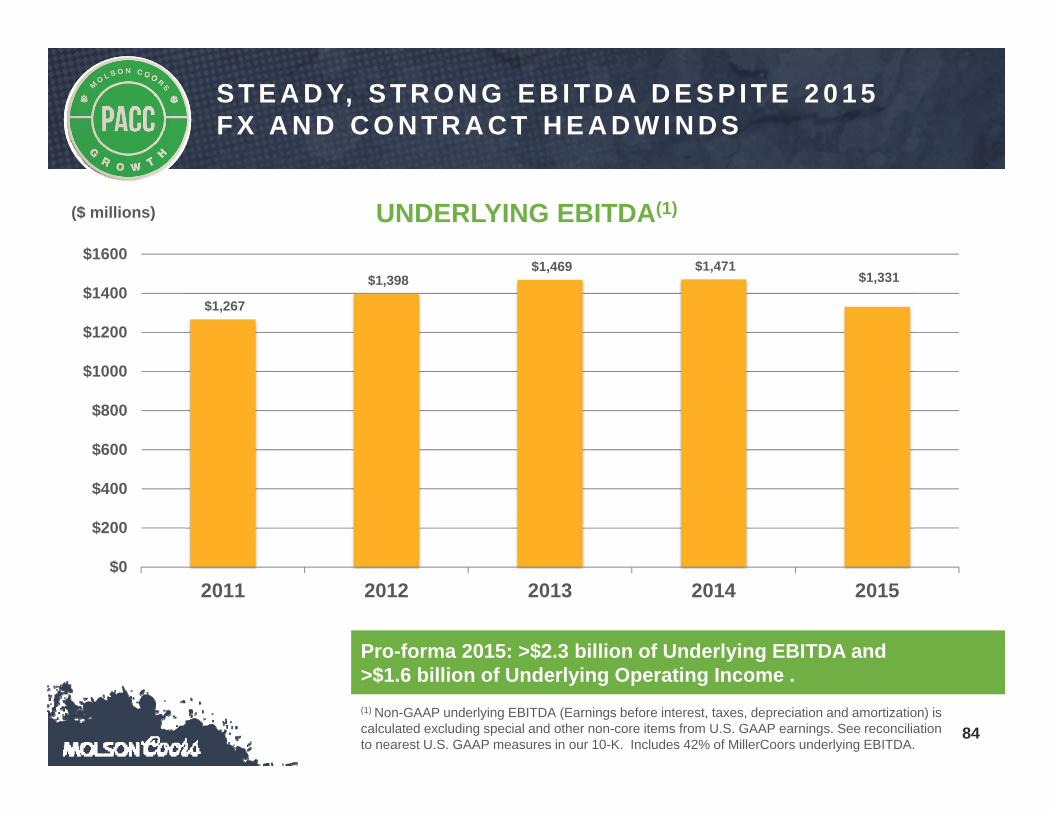
Pro-forma 2015: >$2.3 billion of Underlying EBITDA and >$1.6 billion of Underlying Operating Income .(1) Non-GAAP underlying EBITDA (Earnings before interest, taxes, depreciation and amortization) is calculated excluding special and other non-core items from U.S. GAAP earnings. See reconciliation to nearest U.S. GAAP measures in our 10-K. Includes 42% of MillerCoors underlying EBITDA.
$1,267
$1,398 $1,469 $1,471
$1,331
$0
$200
$400
$600
$800
$1000
$1200
$1400
$1600
2011 2012 2013 2014 2015
S T E A D Y, S T R O N G E B I T D A D E S P I T E 2 0 1 5 F X A N D C O N T R A C T H E A D W I N D S
UNDERLYING EBITDA(1)($ millions)

85
Over $1.4 billion of cumulative annualized cost savings delivered.(1) Includes 42% of MillerCoors cost savings.
$81 $185
$331 $442
$657
$851
$958 $1,078
$1,195
$1,333 $1,434
$0
$200
$400
$600
$800
$1000
$1200
$1400
2005 2006 2007 2008 2009 2010 2011 2012 2013 2014 2015
($ millions)
C O S T R E D U C T I O N S H E L P TO D R I V E TO P L I N E A N D B O T TO M L I N E
CUMULATIVE ANNUALIZED COST SAVINGS(1)
86
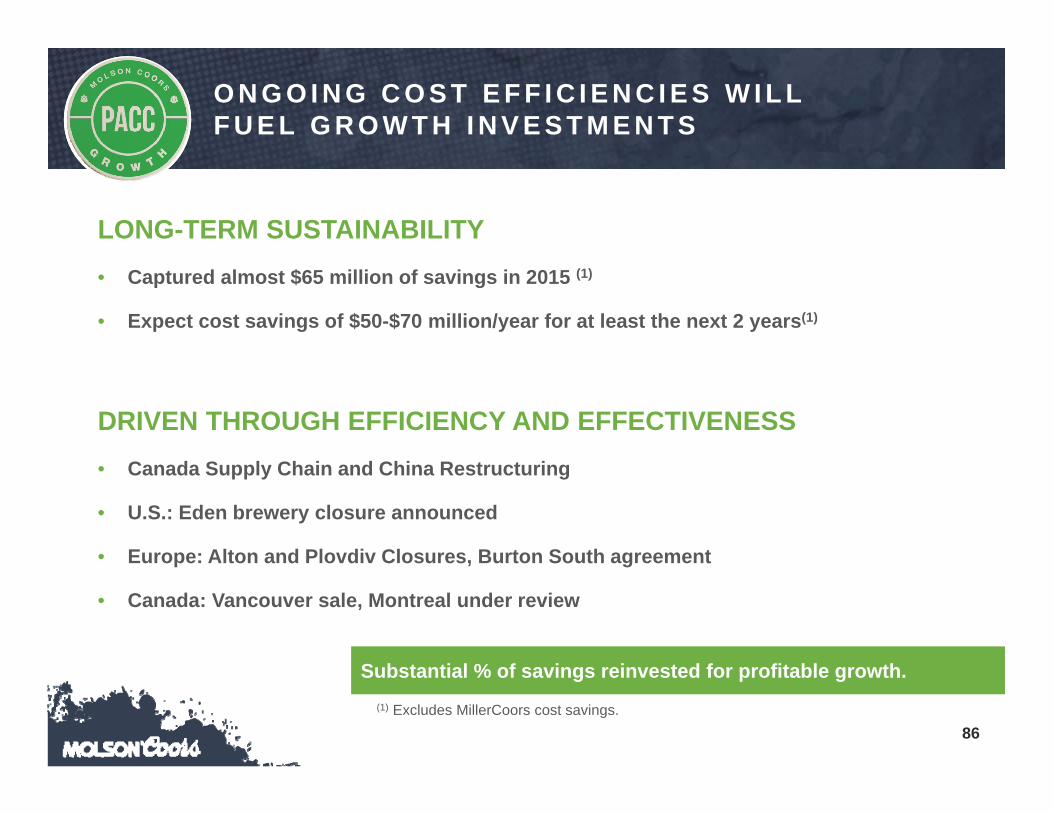
Substantial % of savings reinvested for profitable growth.
LONG-TERM SUSTAINABILITY• Captured almost $65 million of savings in 2015 (1)
• Expect cost savings of $50-$70 million/year for at least the next 2 years(1)
DRIVEN THROUGH EFFICIENCY AND EFFECTIVENESS• Canada Supply Chain and China Restructuring
• U.S.: Eden brewery closure announced
• Europe: Alton and Plovdiv Closures, Burton South agreement
• Canada: Vancouver sale, Montreal under review
(1) Excludes MillerCoors cost savings.
O N G O I N G C O S T E F F I C I E N C I E S W I L L F U E L G R O W T H I N V E S T M E N T S
87
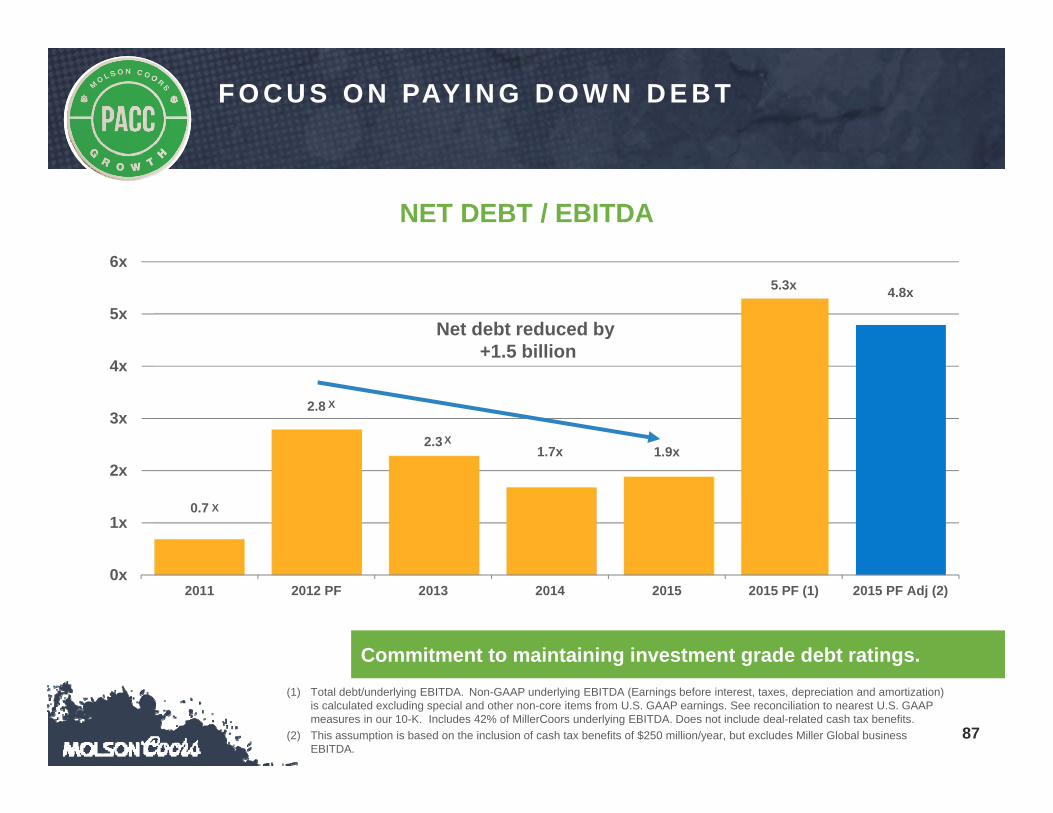
Commitment to maintaining investment grade debt ratings.(1) Total debt/underlying EBITDA. Non-GAAP underlying EBITDA (Earnings before interest, taxes, depreciation and amortization)
is calculated excluding special and other non-core items from U.S. GAAP earnings. See reconciliation to nearest U.S. GAAP measures in our 10-K. Includes 42% of MillerCoors underlying EBITDA. Does not include deal-related cash tax benefits.
(2) This assumption is based on the inclusion of cash tax benefits of $250 million/year, but excludes Miller Global business EBITDA.
F O C U S O N PAY I N G D O W N D E B T
0.7
2.8
2.31.7x 1.9x
5.3x 4.8x
0x
1x
2x
3x
4x
5x
6x
2011 2012 PF 2013 2014 2015 2015 PF (1) 2015 PF Adj (2)
NET DEBT / EBITDA
Net debt reduced by +1.5 billion
X
X
X
88
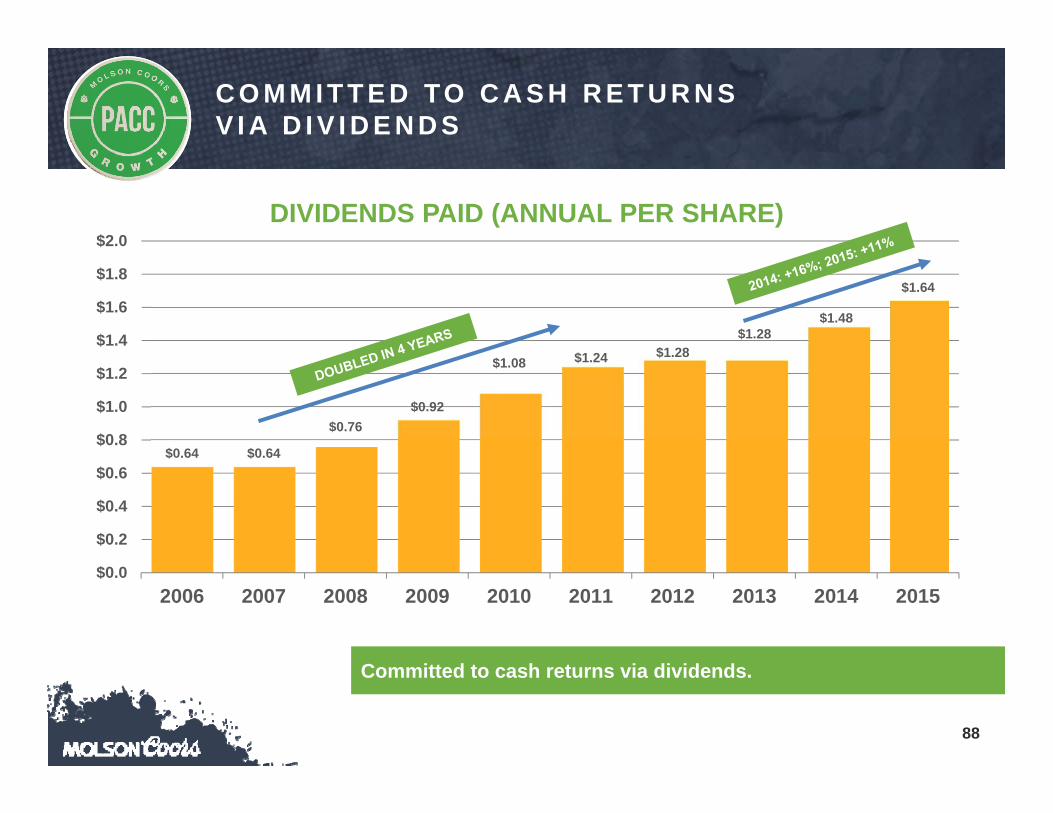
Committed to cash returns via dividends.
$0.64 $0.64
$0.76$0.92
$1.08 $1.24 $1.28$1.28
$1.48
$1.64
$0.0
$0.2
$0.4
$0.6
$0.8
$1.0
$1.2
$1.4
$1.6
$1.8
$2.0
2006 2007 2008 2009 2010 2011 2012 2013 2014 2015
C O M M I T T E D TO C A S H R E T U R N S V I A D I V I D E N D S
DIVIDENDS PAID (ANNUAL PER SHARE)
89
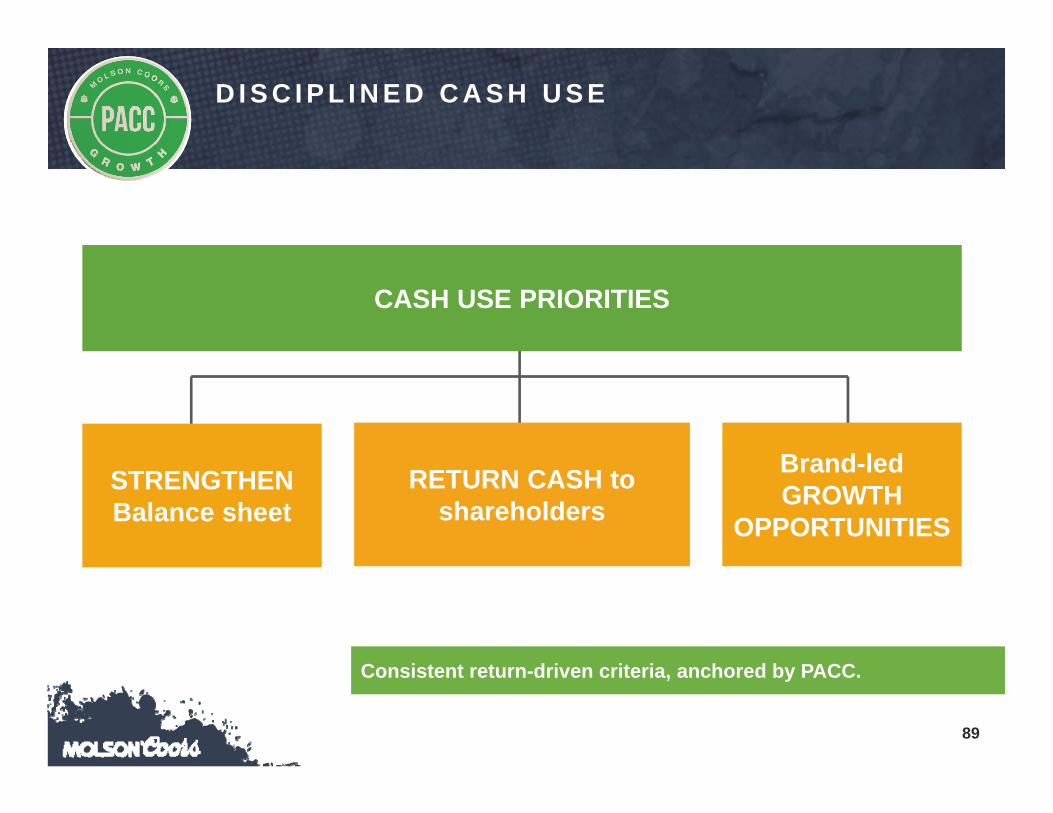
Consistent return-driven criteria, anchored by PACC.
D I S C I P L I N E D C A S H U S E
STRENGTHENBalance sheet
RETURN CASH to shareholders
CASH USE PRIORITIES
Brand-ledGROWTH
OPPORTUNITIES
90
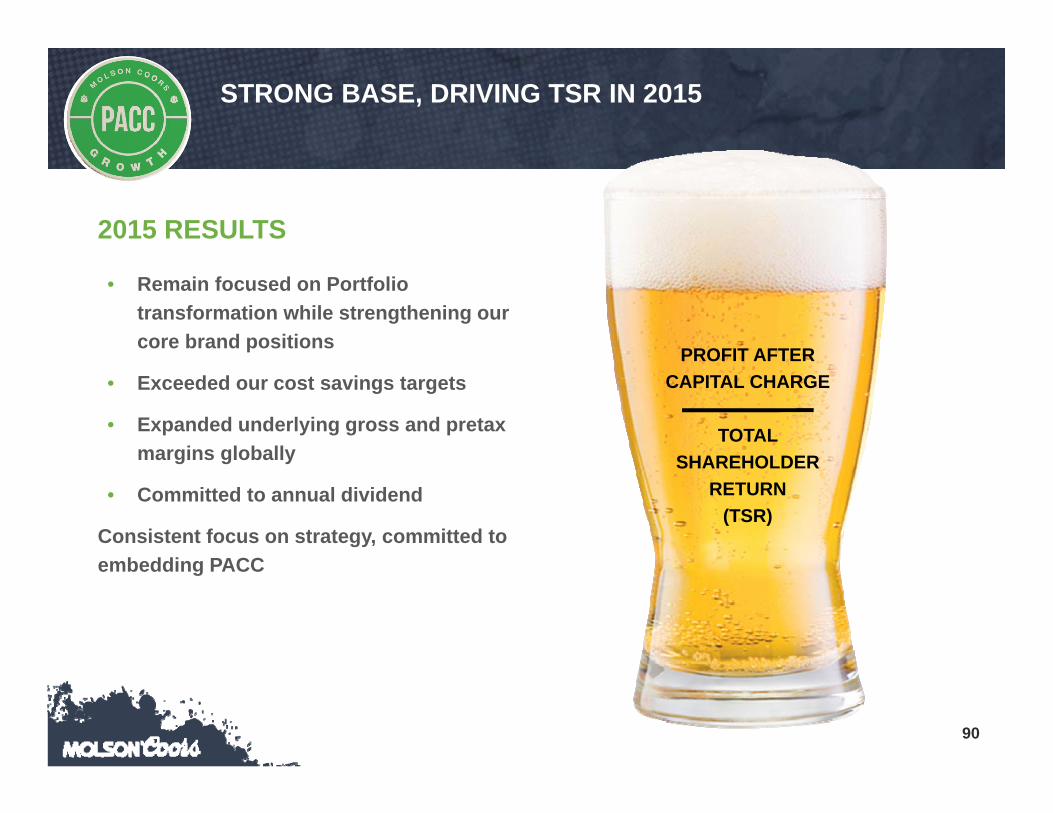
STRONG BASE, DRIVING TSR IN 2015
2015 RESULTS
• Remain focused on Portfolio transformation while strengthening our core brand positions
• Exceeded our cost savings targets
• Expanded underlying gross and pretax margins globally
• Committed to annual dividend
Consistent focus on strategy, committed to embedding PACC
PROFIT AFTERCAPITAL CHARGE
TOTAL SHAREHOLDER
RETURN(TSR)
91
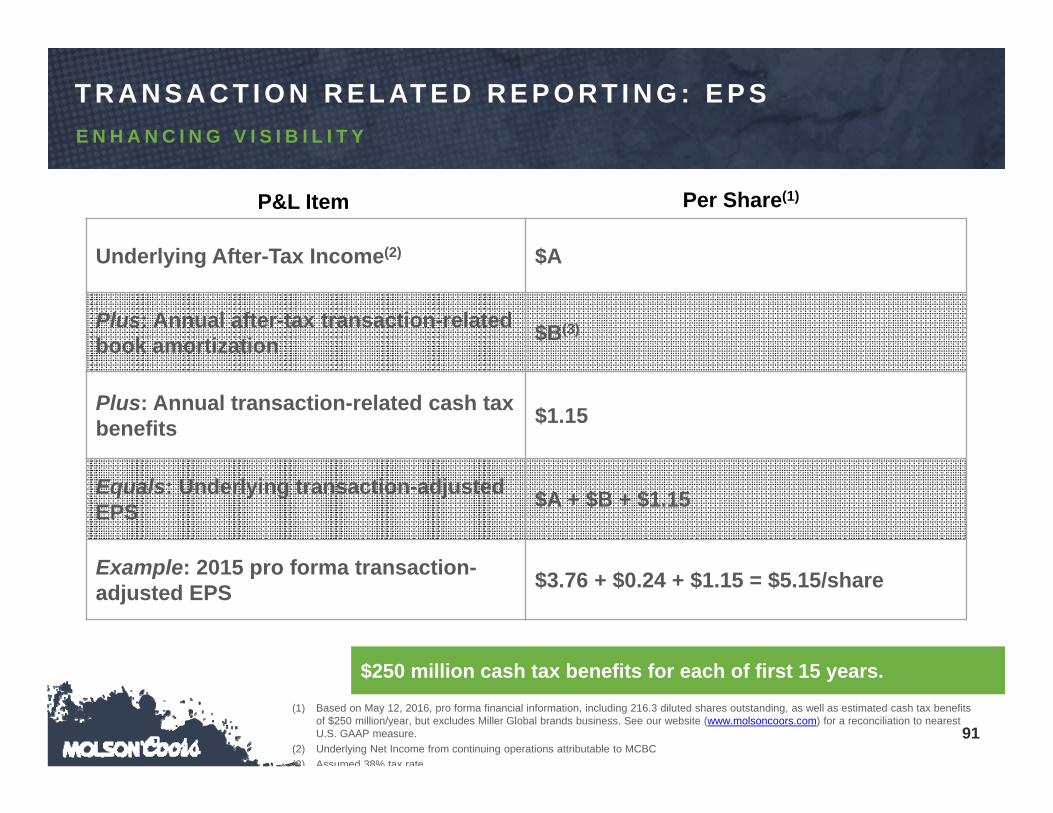
$250 million cash tax benefits for each of first 15 years.
E N H A N C I N G V I S I B I L I T Y
T R A N S A C T I O N R E L AT E D R E P O R T I N G : E P S
Underlying After-Tax Income(2) $A
Plus: Annual after-tax transaction-related book amortization $B(3)
Plus: Annual transaction-related cash tax benefits $1.15
Equals: Underlying transaction-adjusted EPS $A + $B + $1.15
Example: 2015 pro forma transaction-adjusted EPS $3.76 + $0.24 + $1.15 = $5.15/share
P&L Item Per Share(1)
(1) Based on May 12, 2016, pro forma financial information, including 216.3 diluted shares outstanding, as well as estimated cash tax benefits of $250 million/year, but excludes Miller Global brands business. See our website (www.molsoncoors.com) for a reconciliation to nearest U.S. GAAP measure.
(2) Underlying Net Income from continuing operations attributable to MCBC(3) Assumed 38% tax rate
92
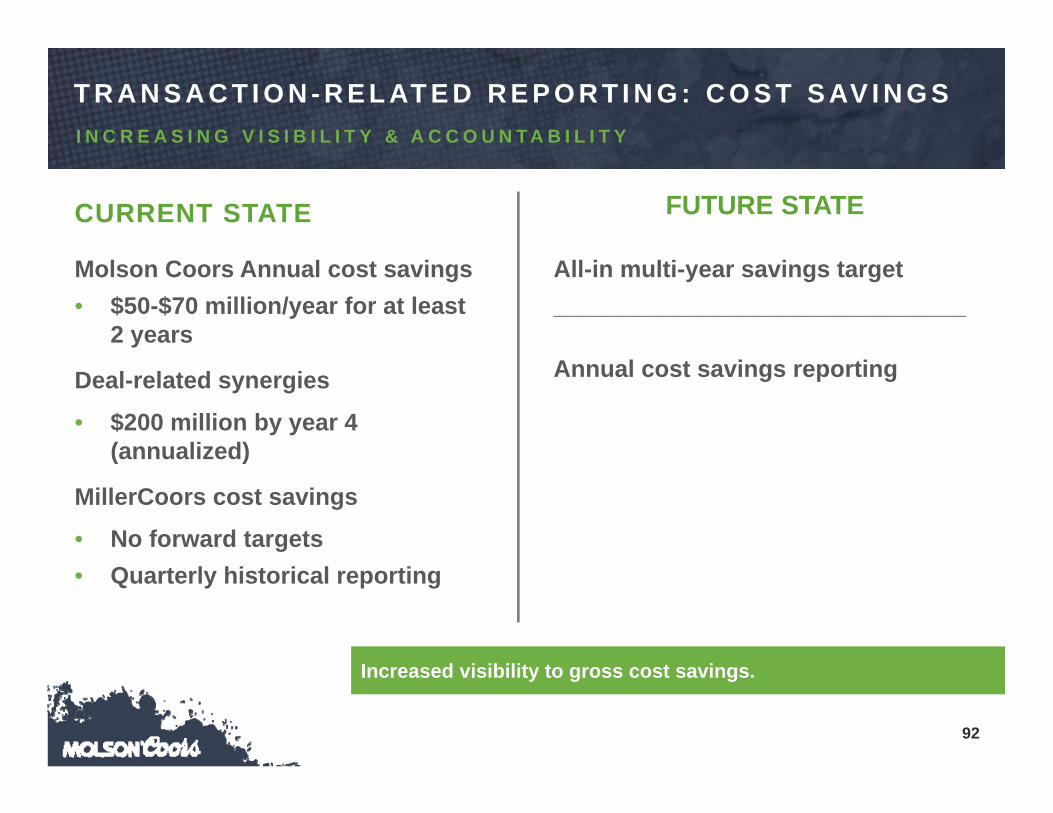
Increased visibility to gross cost savings.
FUTURE STATECURRENT STATE
Molson Coors Annual cost savings • $50-$70 million/year for at least
2 years
Deal-related synergies
• $200 million by year 4 (annualized)
MillerCoors cost savings
• No forward targets• Quarterly historical reporting
All-in multi-year savings target_______________________________
Annual cost savings reporting
I N C R E A S I N G V I S I B I L I T Y & A C C O U N T A B I L I T Y
T R A N S A C T I O N - R E L AT E D R E P O R T I N G : C O S T S AV I N G S

93
D R I V I N G TO TA L S H A R E H O L D E R R E T U R N W I T H PA C C M O D E L
EARN MORE
INVEST WISELY
USE LESS
PROFIT AFTERCAPITAL CHARGE
TOTAL SHAREHOLDER
RETURN(TSR)

M A R K H U N T E R
P R E S I D E N T & C E OM O L S O N C O O R S B R E W I N G C O M PA N Y
95
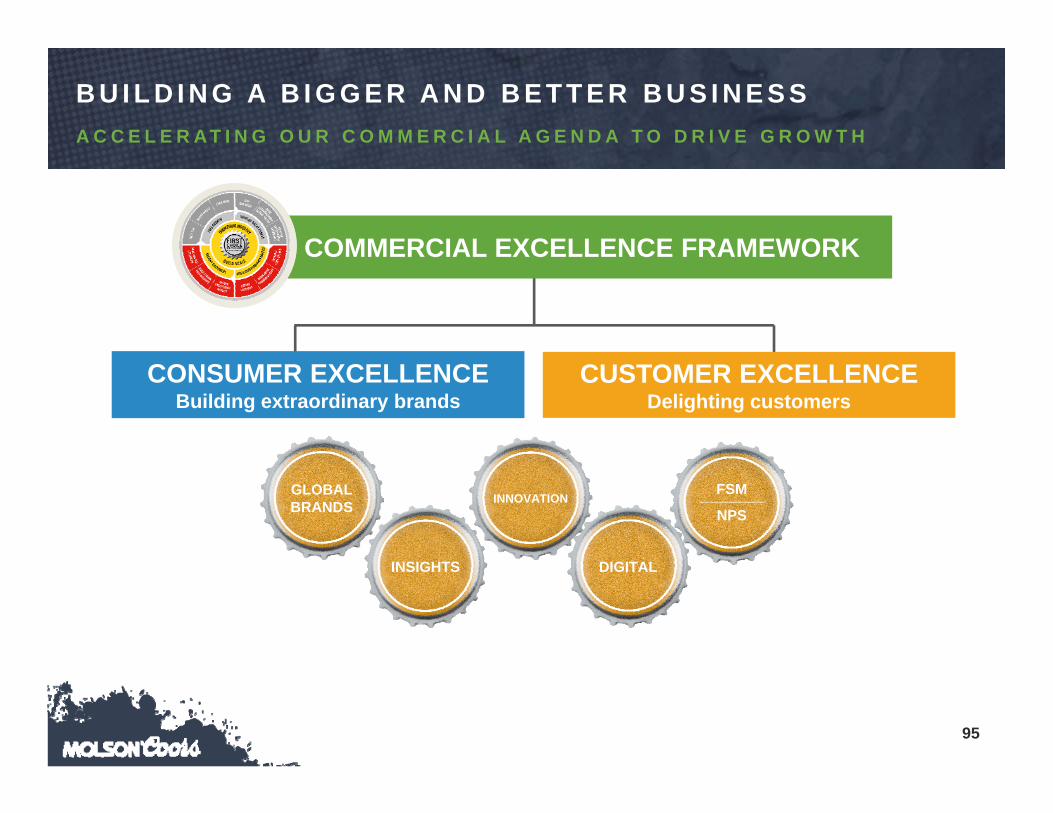
B U I L D I N G A B I G G E R A N D B E T T E R B U S I N E S S
DIGITAL
CUSTOMER
RELATIONSHIPS CUSTOMER
RELATIONSHIPS
INSIGHTS
CONSUMER EXCELLENCEBuilding extraordinary brands
CUSTOMER EXCELLENCEDelighting customers
COMMERCIAL EXCELLENCE FRAMEWORK
GLOBALBRANDS
INSIGHTS
INNOVATION
DIGITAL
FSM________NPS
A C C E L E R A T I N G O U R C O M M E R C I A L A G E N D A T O D R I V E G R O W T H

96
O U R S T R AT E G I C F R A M E W O R K – B U I L D I N G A B I G G E R , B E T T E R B U S I N E S S

J U N E 8 , 2 0 1 6
M O L S O N C O O R S B R E W I N G C O M PA N Y
A N N U A L N E W Y O R K I N V E S T O R / A N A LY S T M E E T I N G