MOLSON COORS BREWING COMPANY 2015 NEW...
81
MOLSON COORS BREWING COMPANY 2015 NEW YORK INVESTOR/ANALYST MEETING JUNE 17, 2015 1
Transcript of MOLSON COORS BREWING COMPANY 2015 NEW...

M O L S O N C O O R S B R E W I N G C O M PA N Y 2 0 1 5 N E W Y O R K I N V E S T O R / A N A LY S T M E E T I N G
J U N E 1 7 , 2 0 1 5
1
2
MARK HUNTER, PRESIDENT & CEO MOLSON COORS BREWING COMPANY
MARK HUNTER, PRESIDENT & CEO MOLSON COORS BREWING COMPANY
This presentation includes estimates or projections that constitute “forward-looking statements” withinthe meaning of the U.S. federal securities laws. Generally, the words “believe,” "expect,” "intend,”"anticipate,” “project,” “will,” and similar expressions identify forward-looking statements, which generallyare not historic in nature. Although the Company believes that the assumptions upon which its forward lookingstatements are based are reasonable, it can give no assurance that these assumptions will prove to be correct. Important factors that could cause actual results to differ materially from the Company’shistorical experience, and present projections and expectations are disclosed in the Company’s filingswith the Securities and Exchange Commission (“SEC”). These factors include, among others, impact ofincreased competition resulting from further consolidation of brewers, competitive pricing and productpressures; health of the beer industry and our brands in our markets; economic conditions in our markets; additional impairment charges; our ability to maintain manufacturer/distribution agreements; changes in our supply chain system; availability or increase in the cost of packaging materials; success of our joint ventures; risks relating to operations in developing and emerging markets; changes in legal and regulatory requirements, including the regulation of distribution systems; fluctuations in foreign currency exchange rates; increase in the cost of commodities used in the business; the impact of climate change and the availability and quality of water; loss or closure of a major brewery or other key facility; our ability to implement our strategic initiatives, including executing and realizing cost savings; our ability to successfully integrate newly acquired businesses; pension plan costs; failure to comply with debt covenants or deterioration in our credit rating; our ability to maintain good labor relations; our ability to maintain brand image, reputation and product quality; lack of full-control over the operations of MillerCoors; and other risks discussed in our filings with the SEC, including our Annual Report on Form 10-K for the year-ended December 31, 2014, which is available from the SEC. All forward looking statements in this press release are expressly qualified by such cautionary statements and by reference to the underlying assumptions. You should not place undue reliance on forward-looking statements, which speak only as of the date they are made. We do not undertake to update forward looking statements, whether as a result of new information, future events or otherwise.
3
FORWARD LOOKING STATEMENTFORWARD LOOKING STATEMENT
Mark Hunter, CEO, Molson Coors• Introductions, strategic overview and growth opportunities
Gavin Hattersley, CFO, Molson Coors • Strategies to grow profit, cash, total shareholder return
Closing Remarks
Q&A with Full Leadership Team• Mark Hunter, CEO, Molson Coors• Gavin Hattersley, CFO, Molson Coors • Tom Long, CEO, MillerCoors• Simon Cox, CEO, Molson Coors Europe• Stewart Glendinning, CEO, Molson Coors Canada• Kandy Anand, CEO, Molson Coors International
Reception
4
TODAY’S AGENDATODAY’S AGENDA
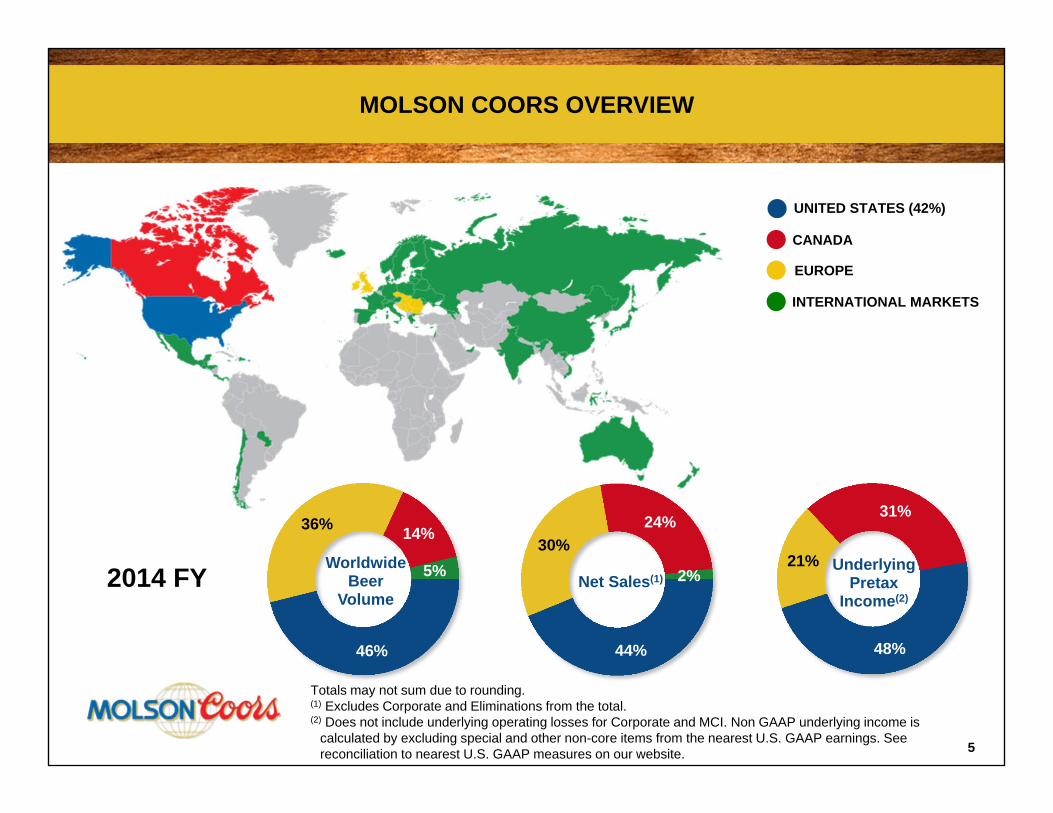
Totals may not sum due to rounding.(1) Excludes Corporate and Eliminations from the total.(2) Does not include underlying operating losses for Corporate and MCI. Non GAAP underlying income is
calculated by excluding special and other non-core items from the nearest U.S. GAAP earnings. See reconciliation to nearest U.S. GAAP measures on our website. 5
MOLSON COORS OVERVIEWMOLSON COORS OVERVIEW
46%
36% 14%
5%Worldwide Beer
Volume
44%
30%24%
2%Net Sales(1)
48%
21%
31%
Underlying Pretax
Income(2)
INTERNATIONAL MARKETS
EUROPE
CANADA
UNITED STATES (42%)
2014 FY

6
#1 OR #2 MARKET & BRAND POSITIONS IN MOST OF OUR MARKETS#1 OR #2 MARKET & BRAND POSITIONS IN MOST OF OUR MARKETS
Market Market Position* Brand Position* Brand
USA #2 #2 & #4 Coors Light, Miller LiteCanada #2 #2 & #3 Coors Light, Molson CanadianUK #2 #1 CarlingBulgaria #1 #1 KamenitzaCroatia #1 #1 OzujskoSerbia #1 #1 JelenCzech Republic #2 #4 StaropramenHungary #3 #2 BorsodiRomania #3 #5 BergenbierBosnia #1 #1 JelenSlovakia #3 #5 StaropramenMontenegro #1 #1 Niksicko
* Company/Industry Estimates
7
PROVEN STRENGTH IN BUILDING ICONIC BRANDS, ENGAGED CONSUMERS AND STRONG CUSTOMER PARTNERSHIPS
PROVEN STRENGTH IN BUILDING ICONIC BRANDS, ENGAGED CONSUMERS AND STRONG CUSTOMER PARTNERSHIPS
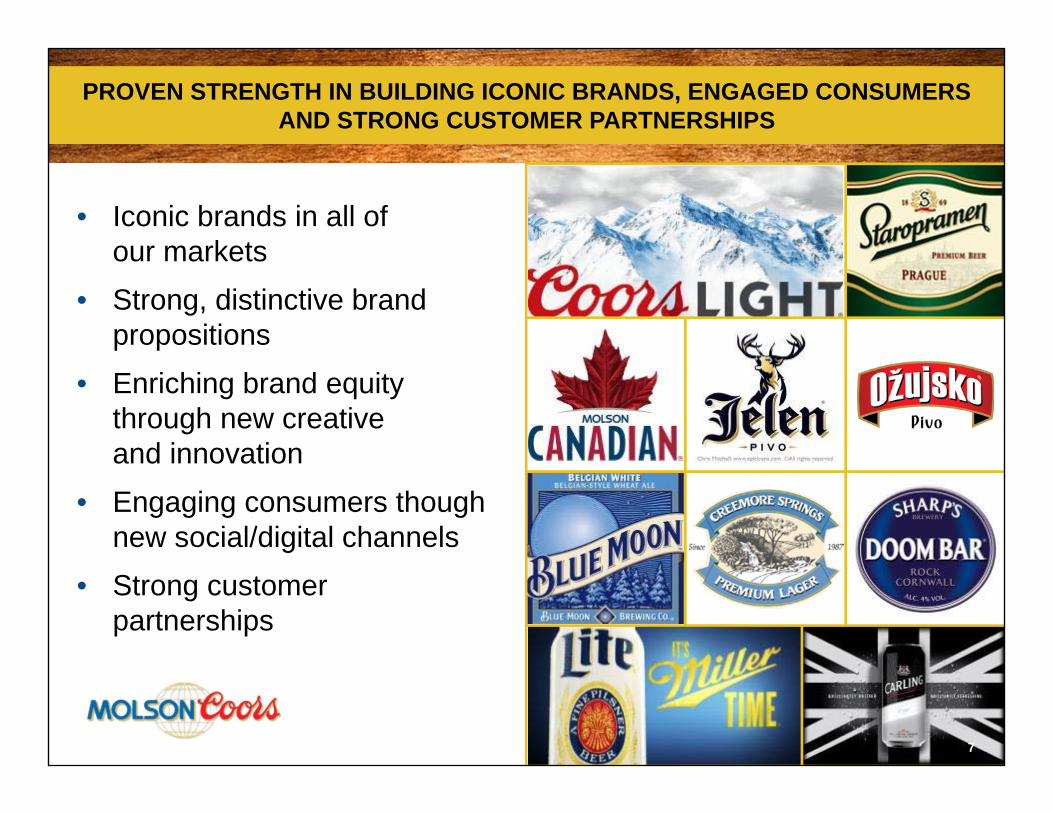
• Iconic brands in all of our markets
• Strong, distinctive brand propositions
• Enriching brand equity through new creative and innovation
• Engaging consumers though new social/digital channels
• Strong customer partnerships
8
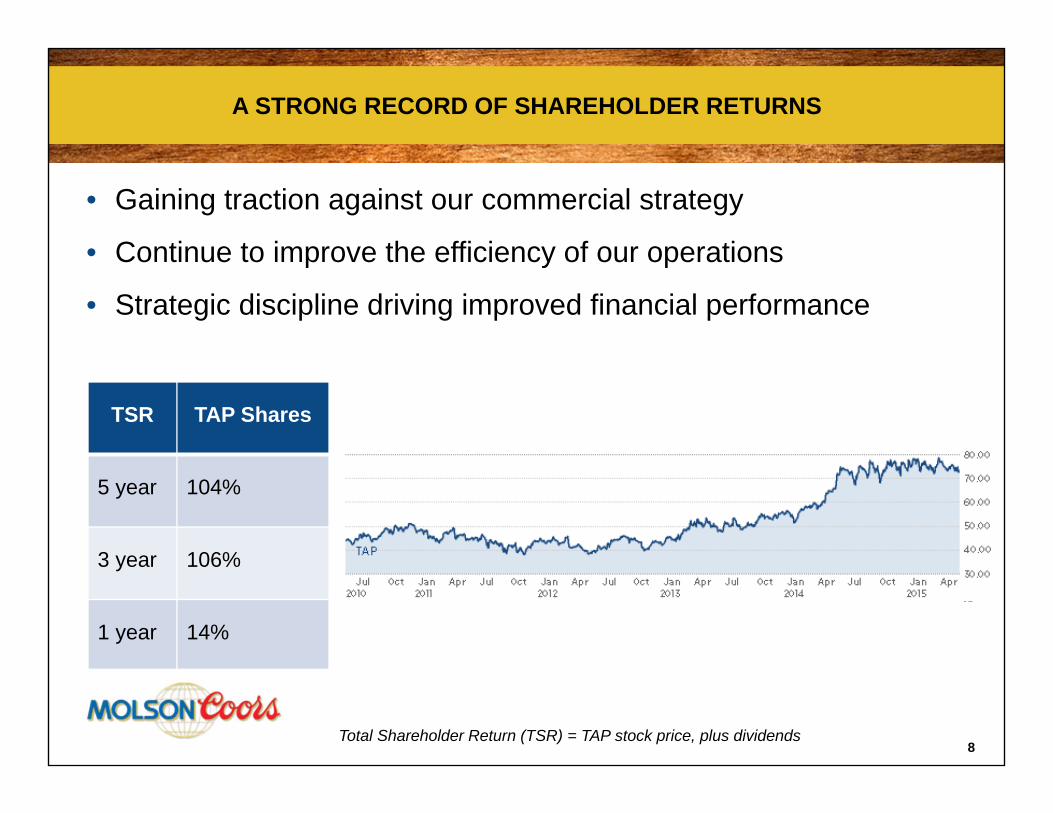
A STRONG RECORD OF SHAREHOLDER RETURNSA STRONG RECORD OF SHAREHOLDER RETURNS
TSR TAP Shares
5 year 104%
3 year 106%
1 year 14%
• Gaining traction against our commercial strategy
• Continue to improve the efficiency of our operations
• Strategic discipline driving improved financial performance
Total Shareholder Return (TSR) = TAP stock price, plus dividends
9
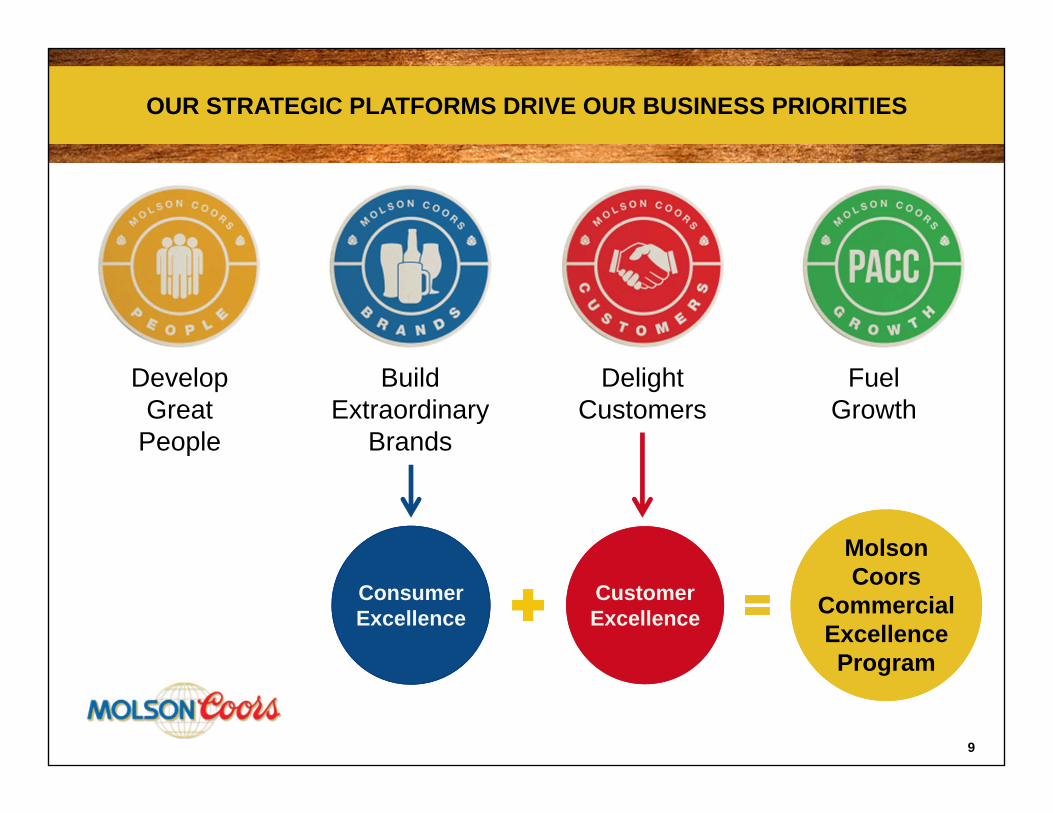
OUR STRATEGIC PLATFORMS DRIVE OUR BUSINESS PRIORITIESOUR STRATEGIC PLATFORMS DRIVE OUR BUSINESS PRIORITIES
Delight Customers
Fuel Growth
Build Extraordinary
Brands
Develop Great
People
Consumer Excellence
Customer Excellence
Molson Coors
Commercial Excellence Program
10
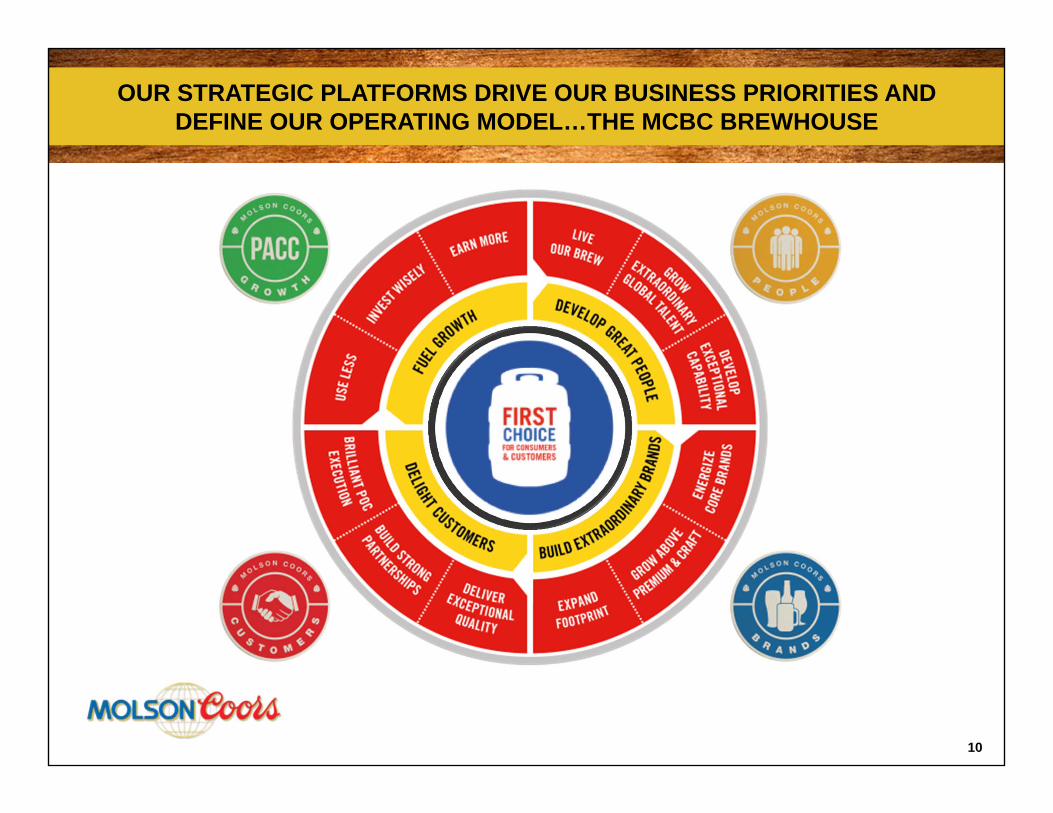
OUR STRATEGIC PLATFORMS DRIVE OUR BUSINESS PRIORITIES AND DEFINE OUR OPERATING MODEL…THE MCBC BREWHOUSE
OUR STRATEGIC PLATFORMS DRIVE OUR BUSINESS PRIORITIES AND DEFINE OUR OPERATING MODEL…THE MCBC BREWHOUSE
11
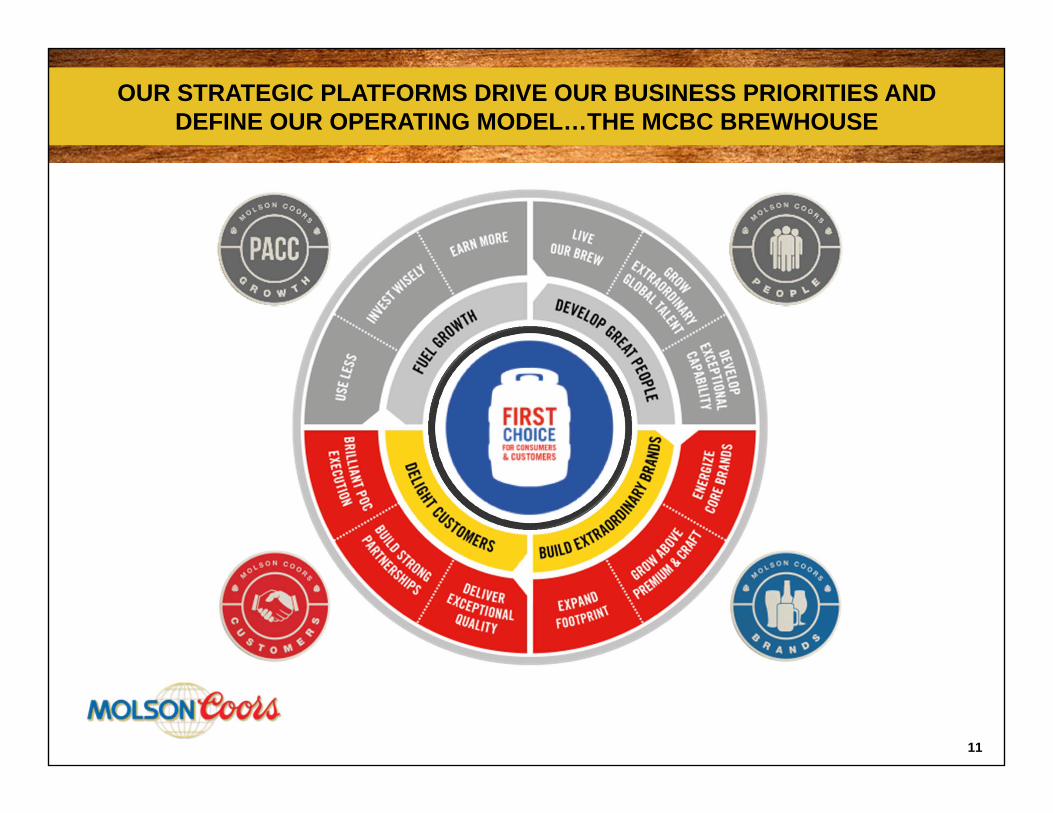
OUR STRATEGIC PLATFORMS DRIVE OUR BUSINESS PRIORITIES AND DEFINE OUR OPERATING MODEL…THE MCBC BREWHOUSE
OUR STRATEGIC PLATFORMS DRIVE OUR BUSINESS PRIORITIES AND DEFINE OUR OPERATING MODEL…THE MCBC BREWHOUSE
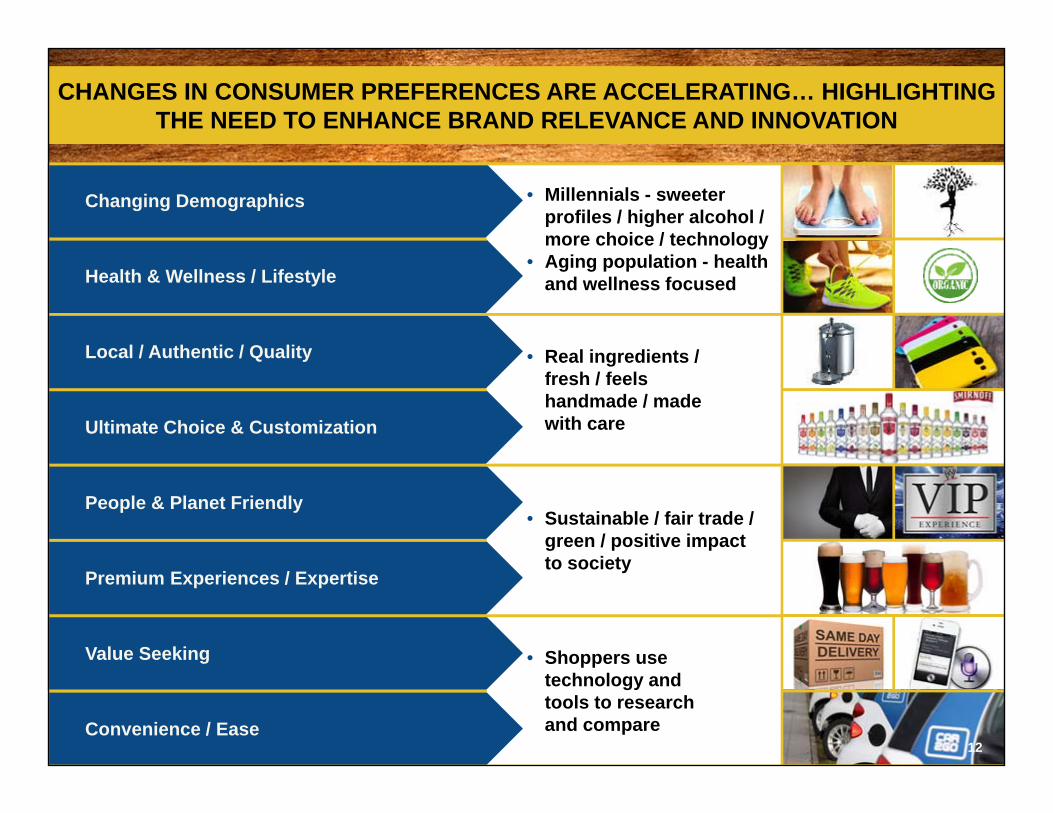
• Millennials - sweeter profiles / higher alcohol / more choice / technology
• Aging population - health and wellness focused
CHANGES IN CONSUMER PREFERENCES ARE ACCELERATING… HIGHLIGHTING THE NEED TO ENHANCE BRAND RELEVANCE AND INNOVATION
CHANGES IN CONSUMER PREFERENCES ARE ACCELERATING… HIGHLIGHTING THE NEED TO ENHANCE BRAND RELEVANCE AND INNOVATION
Changing Demographics
Health & Wellness / Lifestyle
Local / Authentic / Quality
Ultimate Choice & Customization
People & Planet Friendly
Premium Experiences / Expertise
Value Seeking
Convenience / Ease
• Real ingredients / fresh / feels handmade / made with care
• Sustainable / fair trade / green / positive impact to society
• Shoppers use technology and tools to research and compare
12
13
BUILDING EXTRAORDINARY BRANDSENERGIZING OUR CORE BRANDS
BUILDING EXTRAORDINARY BRANDSENERGIZING OUR CORE BRANDS

14
MAINSTREAM PREMIUM SEGMENT AND OUR CORE BRANDS REMAIN THE ECONOMIC ENGINE
MAINSTREAM PREMIUM SEGMENT AND OUR CORE BRANDS REMAIN THE ECONOMIC ENGINE
• Nearly half of all beer volumes in the US and Canada – and more than 60% in Europe– are premium or premium light beers.
• US premium light category alone is more than 3 times larger than craft category.
• The #1, #2 and #4 beer brands in America are premium lights. And Coors Light and Miller Lite drive over 50% of our US volume.
• Top four brands in Canada are premium or premium light. Coors Light is #2 and Molson Canadian is #3. These two brands make up approximately 50% of our overall Canada volume.
• The #1 brand in the UK is ours – Carling.
We are building our distinctiveness, relevance and share of segment
15
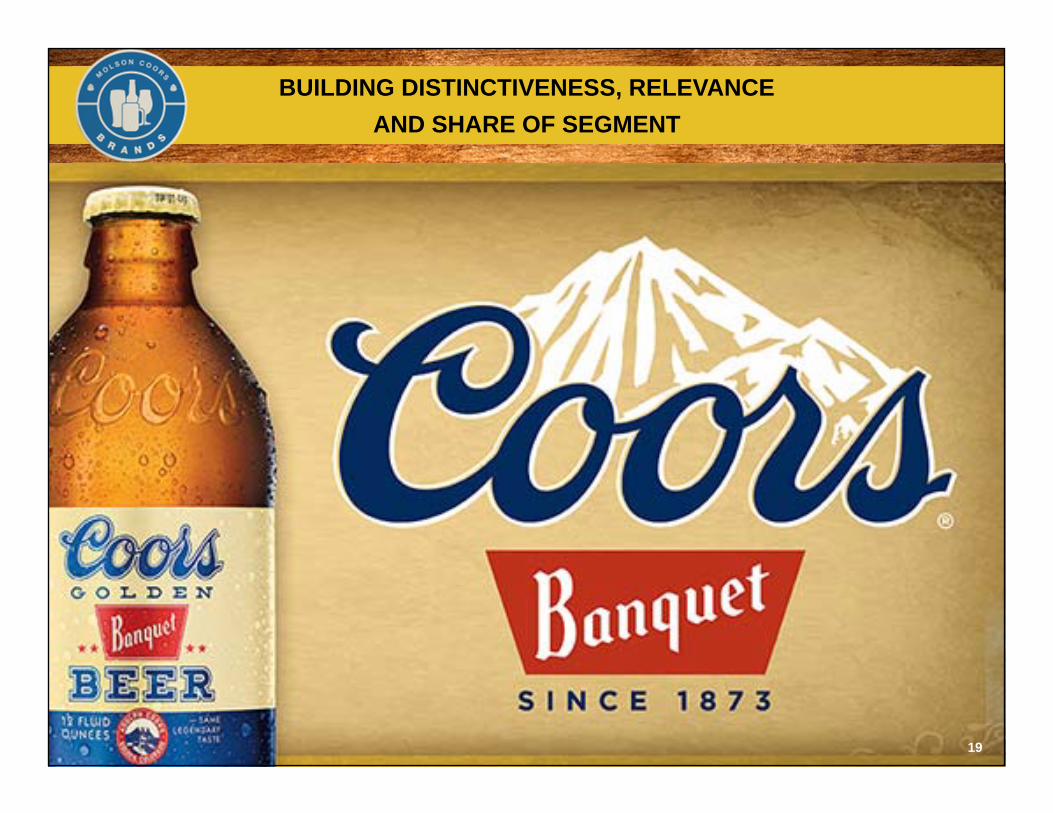
BUILDING DISTINCTIVENESS, RELEVANCE AND SHARE OF SEGMENT
BUILDING DISTINCTIVENESS, RELEVANCE AND SHARE OF SEGMENT
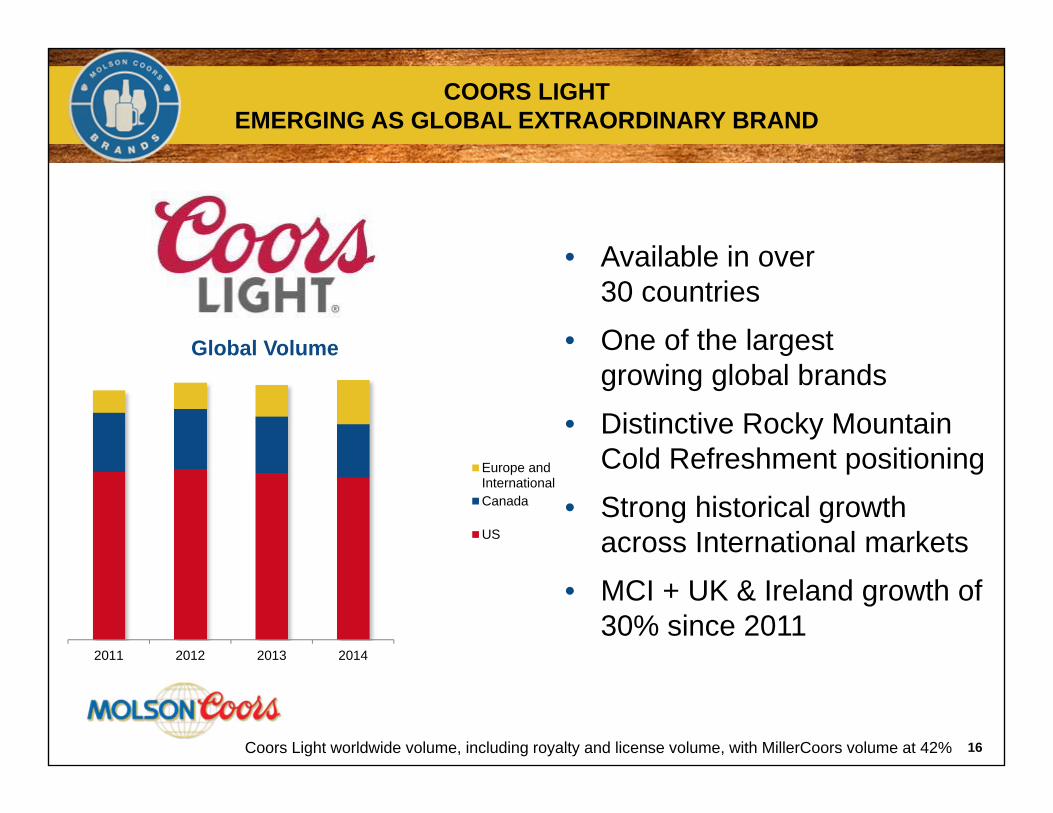
• Available in over 30 countries
• One of the largestgrowing global brands
• Distinctive Rocky Mountain Cold Refreshment positioning
• Strong historical growth across International markets
• MCI + UK & Ireland growth of 30% since 2011
COORS LIGHTEMERGING AS GLOBAL EXTRAORDINARY BRAND
COORS LIGHTEMERGING AS GLOBAL EXTRAORDINARY BRAND
2011 2012 2013 2014
Europe andInternationalCanada
US
Global Volume
Coors Light worldwide volume, including royalty and license volume, with MillerCoors volume at 42% 16
17
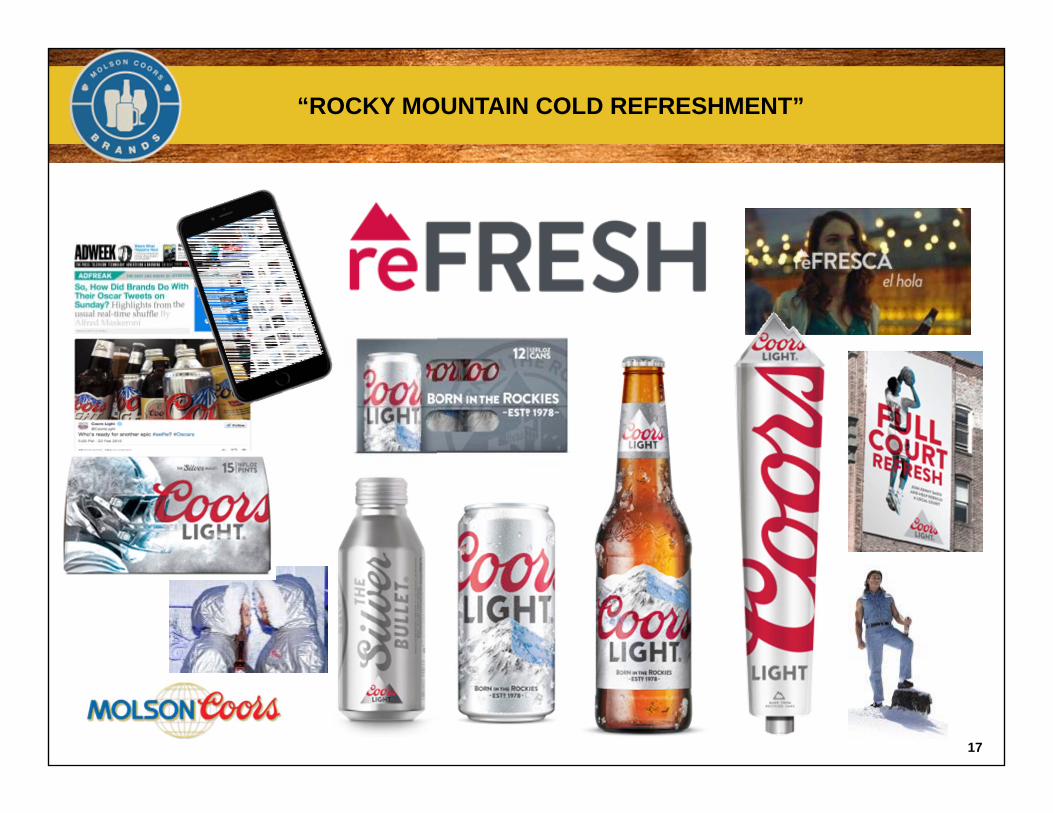
“ROCKY MOUNTAIN COLD REFRESHMENT”“ROCKY MOUNTAIN COLD REFRESHMENT”

18
• COMMERCIAL #1
19
BUILDING DISTINCTIVENESS, RELEVANCE AND SHARE OF SEGMENT
BUILDING DISTINCTIVENESS, RELEVANCE AND SHARE OF SEGMENT
20
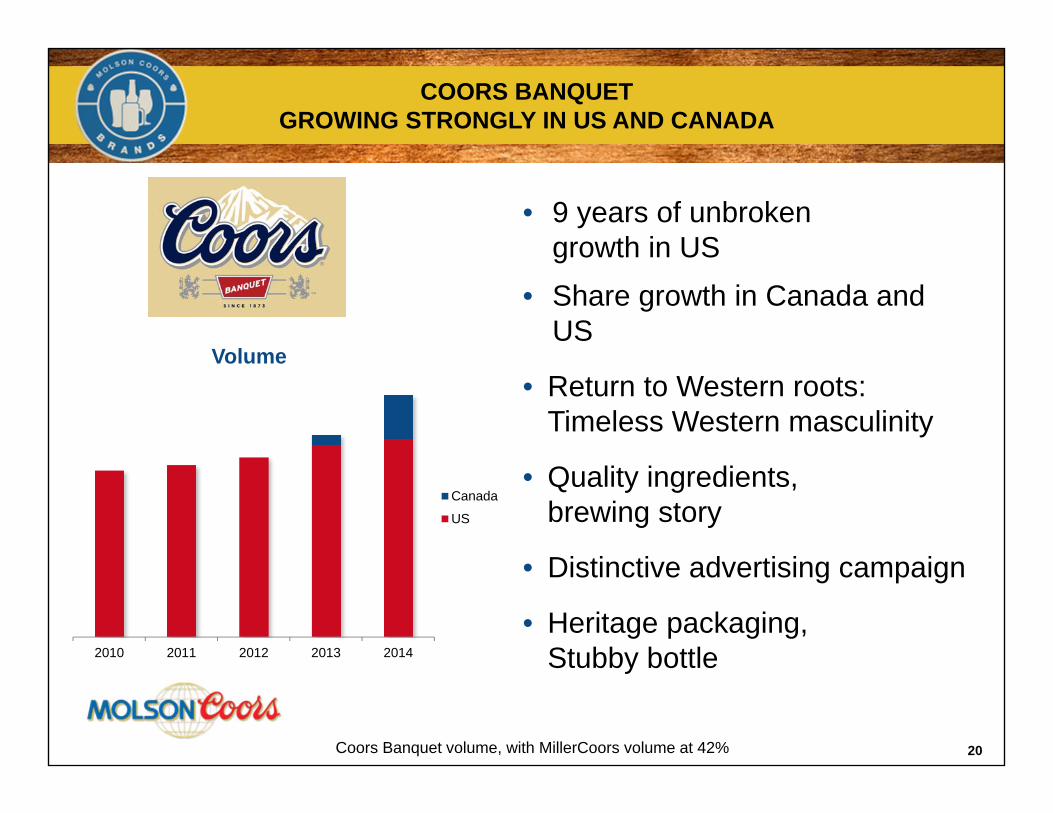
COORS BANQUETGROWING STRONGLY IN US AND CANADA
COORS BANQUETGROWING STRONGLY IN US AND CANADA
• 9 years of unbroken growth in US
• Share growth in Canada and US
• Return to Western roots: Timeless Western masculinity
• Quality ingredients, brewing story
• Distinctive advertising campaign
• Heritage packaging, Stubby bottle2010 2011 2012 2013 2014
Canada
US
Volume
Coors Banquet volume, with MillerCoors volume at 42%
21
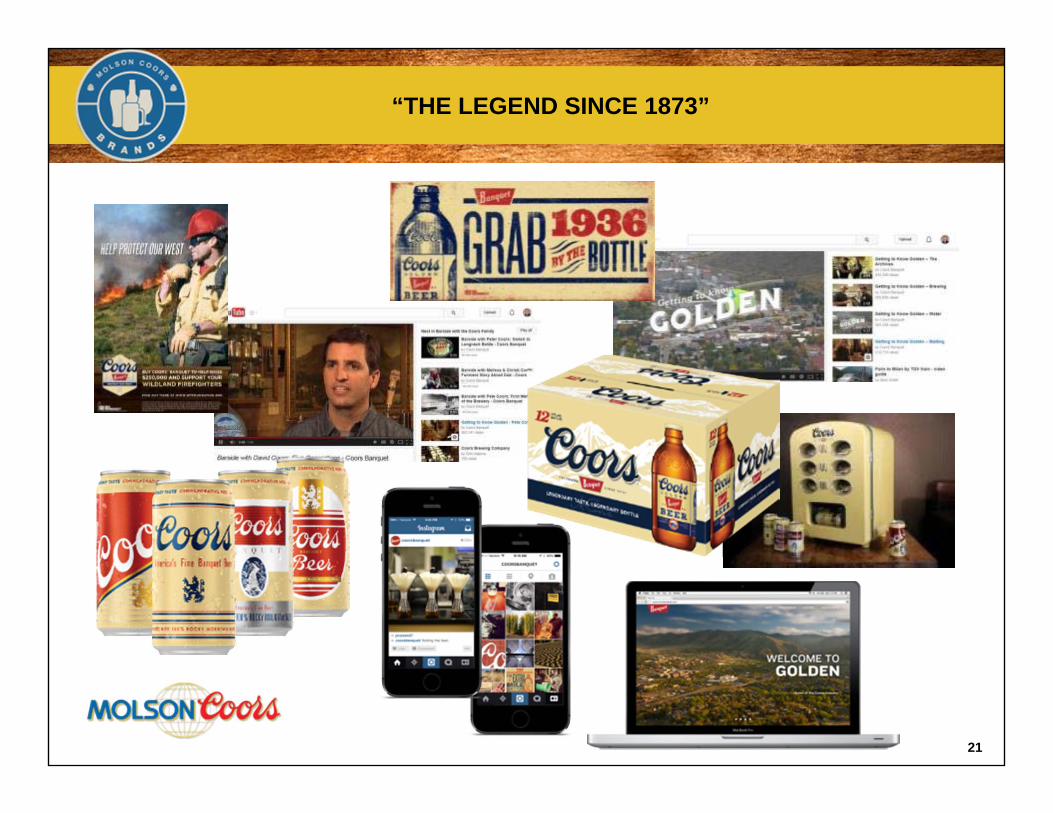
“THE LEGEND SINCE 1873”“THE LEGEND SINCE 1873”

22
• COMMERCIAL #1

23
BUILDING DISTINCTIVENESS, RELEVANCE AND SHARE OF SEGMENT
BUILDING DISTINCTIVENESS, RELEVANCE AND SHARE OF SEGMENT

24
• COMMERCIAL #1
25
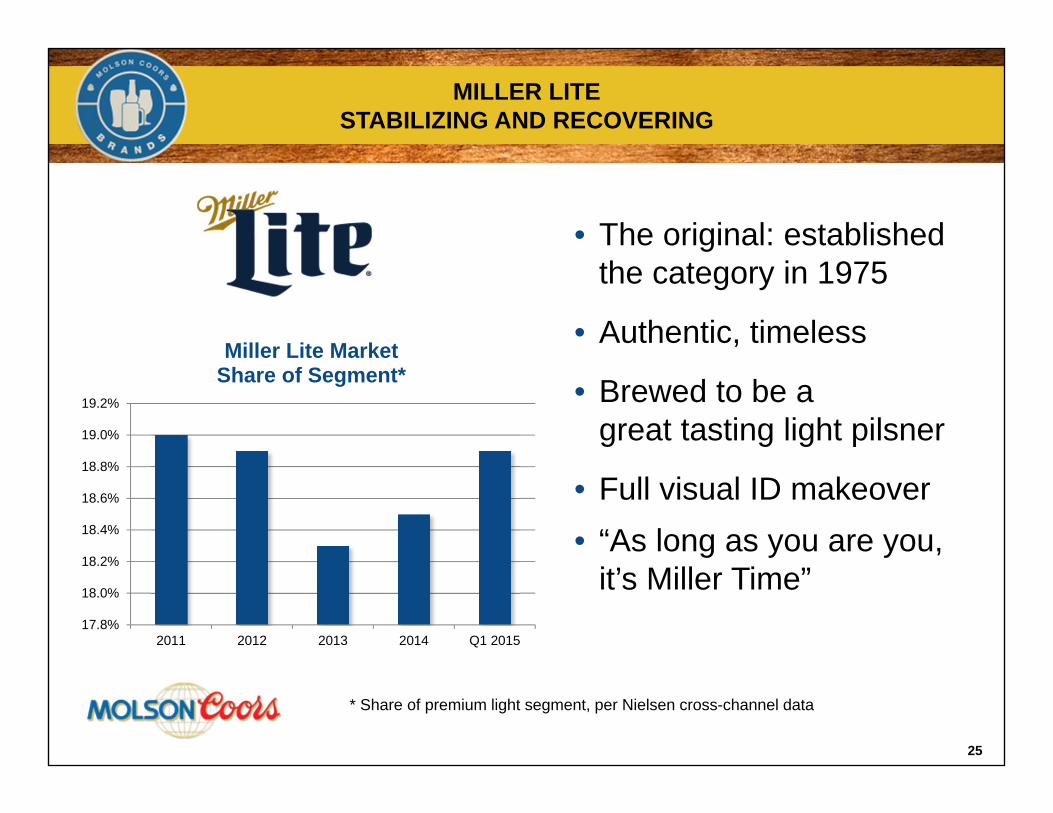
MILLER LITESTABILIZING AND RECOVERING
MILLER LITESTABILIZING AND RECOVERING
• The original: established the category in 1975
• Authentic, timeless
• Brewed to be a great tasting light pilsner
• Full visual ID makeover• “As long as you are you,
it’s Miller Time”17.8%
18.0%
18.2%
18.4%
18.6%
18.8%
19.0%
19.2%
2011 2012 2013 2014 Q1 2015
Miller Lite Market Share of Segment*
* Share of premium light segment, per Nielsen cross-channel data
26
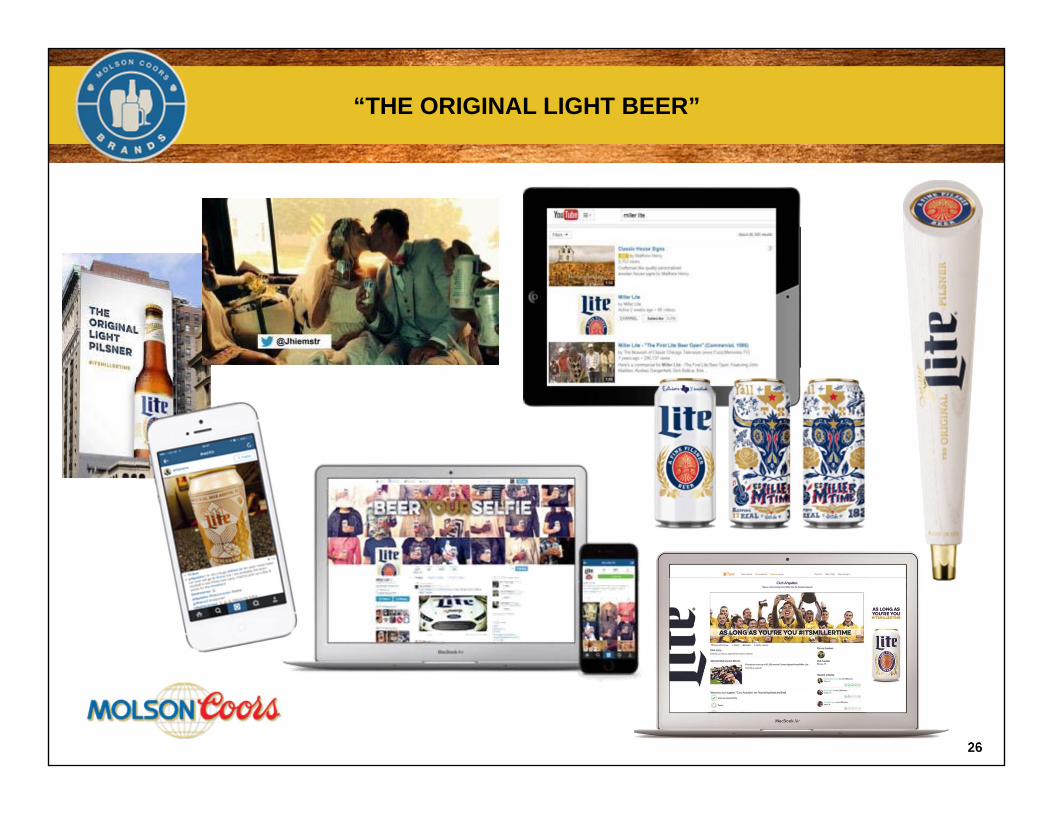
“THE ORIGINAL LIGHT BEER”“THE ORIGINAL LIGHT BEER”

27
• COMMERCIAL #1

28
BUILDING DISTINCTIVENESS, RELEVANCE AND SHARE OF SEGMENT
BUILDING DISTINCTIVENESS, RELEVANCE AND SHARE OF SEGMENT
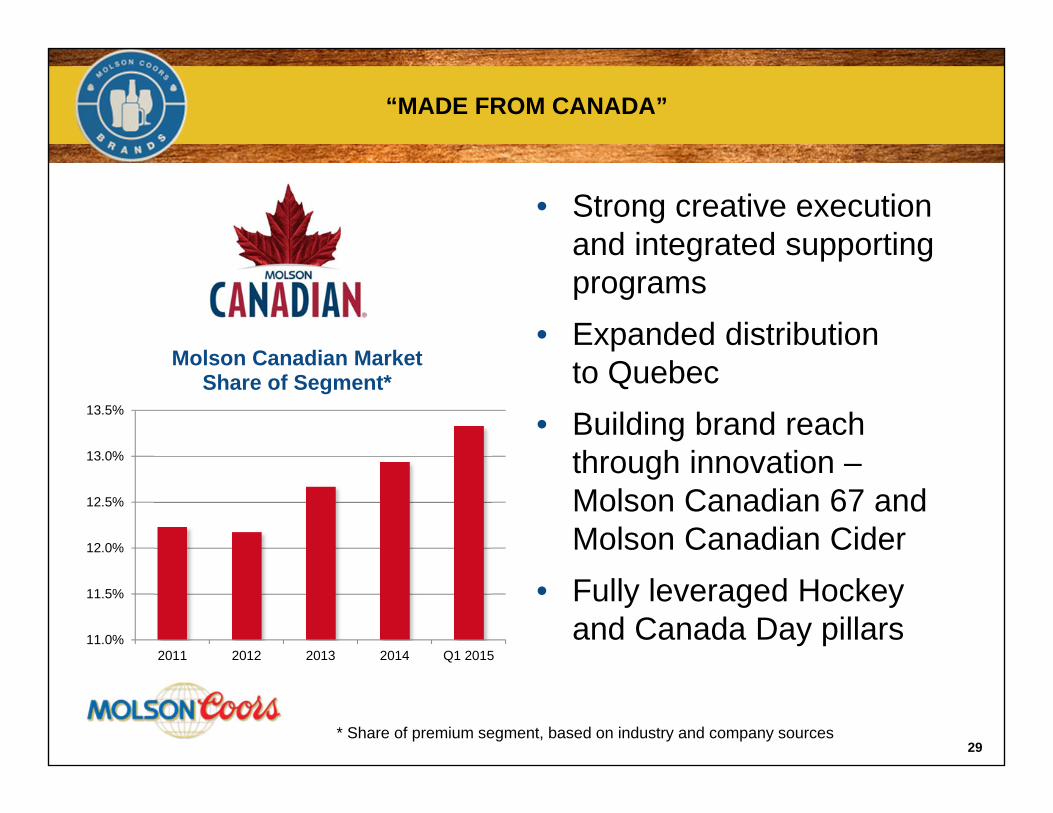
“MADE FROM CANADA”“MADE FROM CANADA”
• Strong creative execution and integrated supporting programs
• Expanded distribution to Quebec
• Building brand reach through innovation –Molson Canadian 67 and Molson Canadian Cider
• Fully leveraged Hockey and Canada Day pillars11.0%
11.5%
12.0%
12.5%
13.0%
13.5%
2011 2012 2013 2014 Q1 2015
Molson Canadian Market Share of Segment*
* Share of premium segment, based on industry and company sources29
30
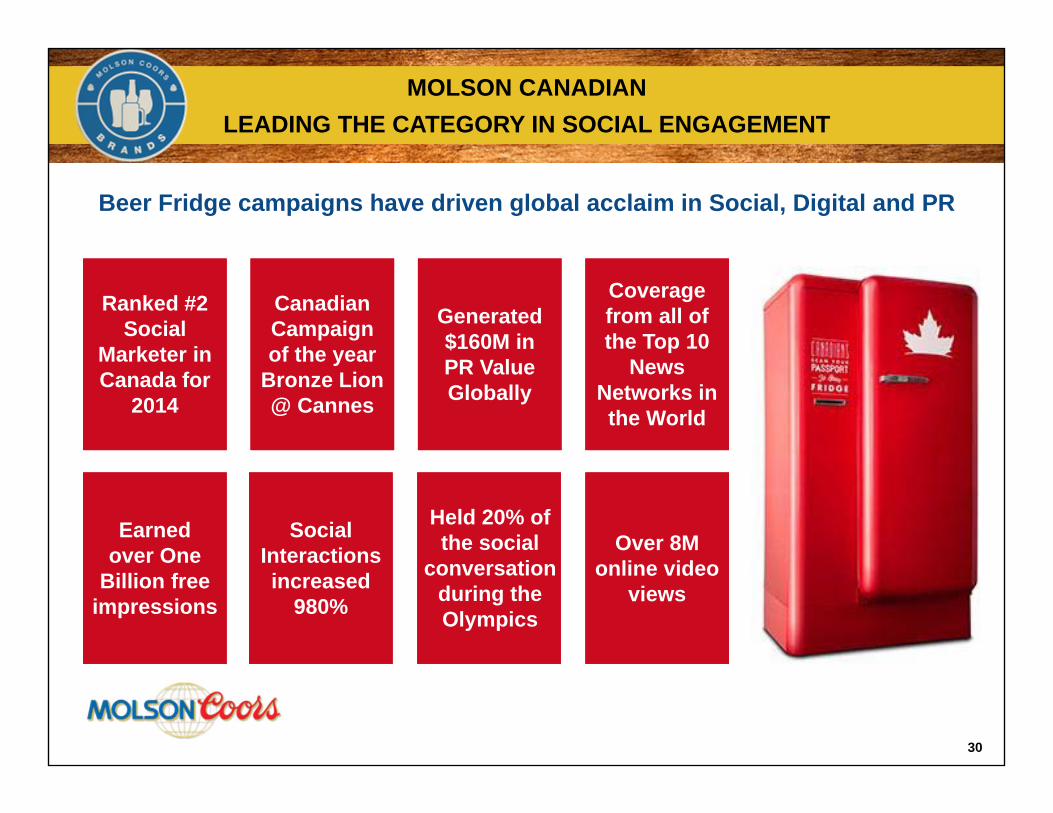
MOLSON CANADIANLEADING THE CATEGORY IN SOCIAL ENGAGEMENT
MOLSON CANADIANLEADING THE CATEGORY IN SOCIAL ENGAGEMENT
Beer Fridge campaigns have driven global acclaim in Social, Digital and PR
Ranked #2 Social
Marketer in Canada for
2014
Canadian Campaign of the year
Bronze Lion @ Cannes
Generated $160M in PR Value Globally
Coverage from all of the Top 10
News Networks in the World
Earned over One
Billion free impressions
Social Interactions increased
980%
Held 20% of the social
conversation during the Olympics
Over 8M online video
views

31
• COMMERCIAL #1
32
BUILDING DISTINCTIVENESS, RELEVANCE AND SHARE OF SEGMENT
BUILDING DISTINCTIVENESS, RELEVANCE AND SHARE OF SEGMENT
33
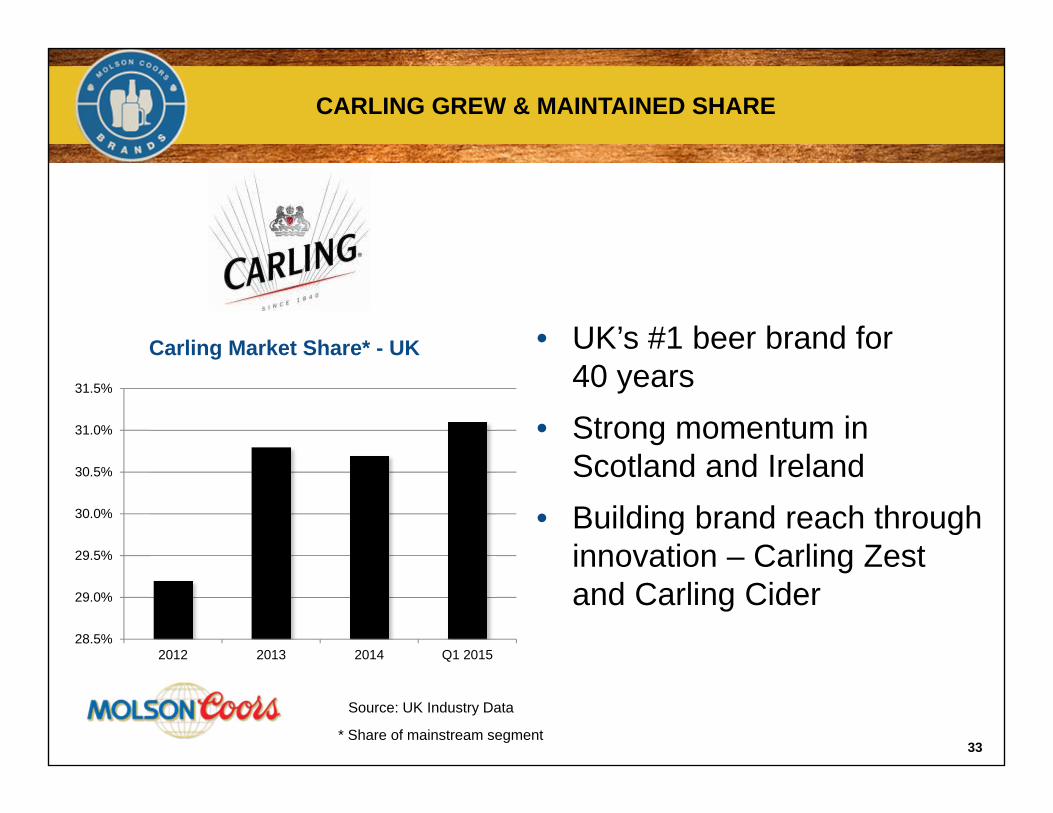
CARLING GREW & MAINTAINED SHARECARLING GREW & MAINTAINED SHARE
• UK’s #1 beer brand for 40 years
• Strong momentum in Scotland and Ireland
• Building brand reach through innovation – Carling Zest and Carling Cider
* Share of mainstream segment
28.5%
29.0%
29.5%
30.0%
30.5%
31.0%
31.5%
2012 2013 2014 Q1 2015
Carling Market Share* - UK
Source: UK Industry Data
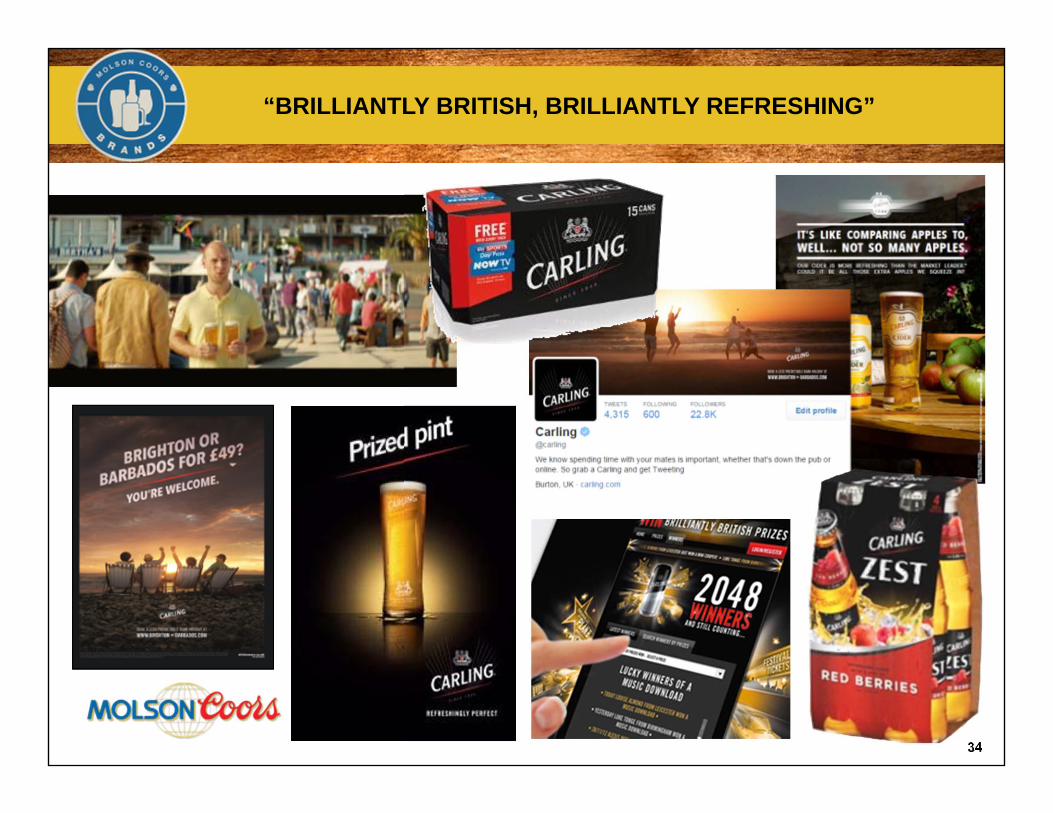
“BRILLIANTLY BRITISH, BRILLIANTLY REFRESHING”“BRILLIANTLY BRITISH, BRILLIANTLY REFRESHING”
34

35
BUILDING EXTRAORDINARY BRANDS DRIVING SHARE IN ABOVE PREMIUM, CRAFT & CIDER
BUILDING EXTRAORDINARY BRANDS DRIVING SHARE IN ABOVE PREMIUM, CRAFT & CIDER
36
37
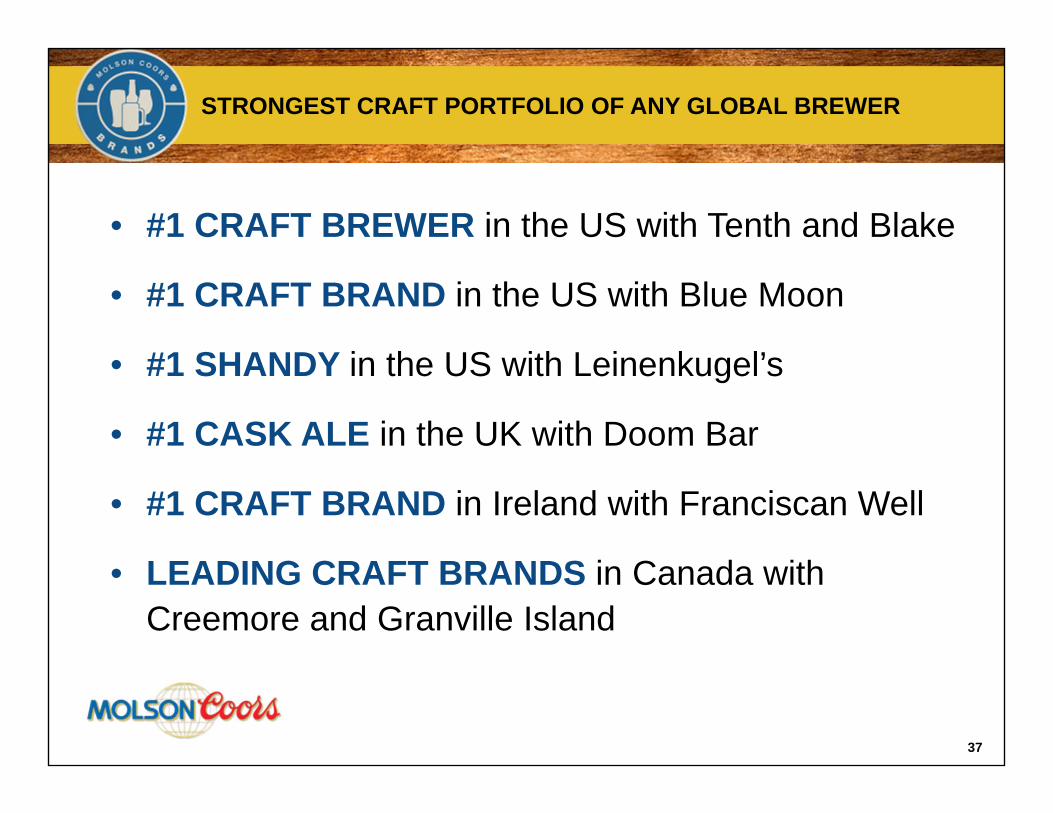
STRONGEST CRAFT PORTFOLIO OF ANY GLOBAL BREWERSTRONGEST CRAFT PORTFOLIO OF ANY GLOBAL BREWER
• #1 CRAFT BREWER in the US with Tenth and Blake
• #1 CRAFT BRAND in the US with Blue Moon
• #1 SHANDY in the US with Leinenkugel’s
• #1 CASK ALE in the UK with Doom Bar
• #1 CRAFT BRAND in Ireland with Franciscan Well
• LEADING CRAFT BRANDS in Canada with Creemore and Granville Island
38
AMERICA’S LARGEST CRAFT BREWER – TENTH AND BLAKEAMERICA’S LARGEST CRAFT BREWER – TENTH AND BLAKE
®
39
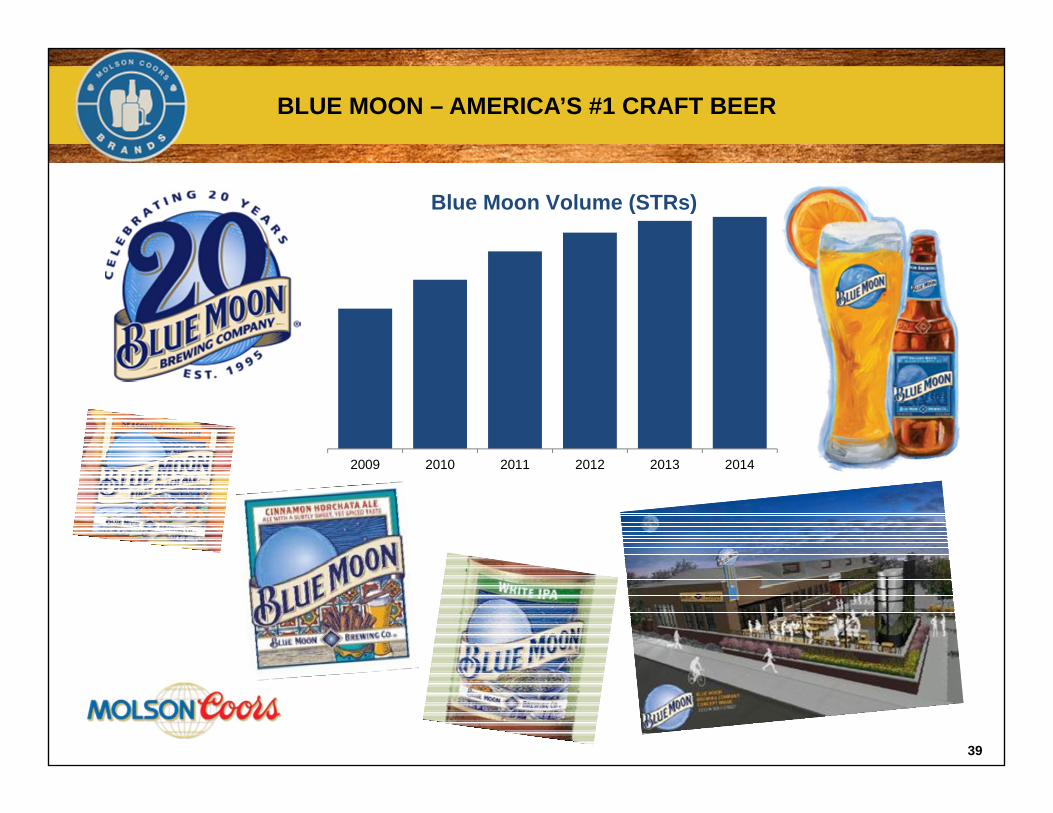
BLUE MOON – AMERICA’S #1 CRAFT BEERBLUE MOON – AMERICA’S #1 CRAFT BEER
2009 2010 2011 2012 2013 2014
Blue Moon Volume (STRs)
40
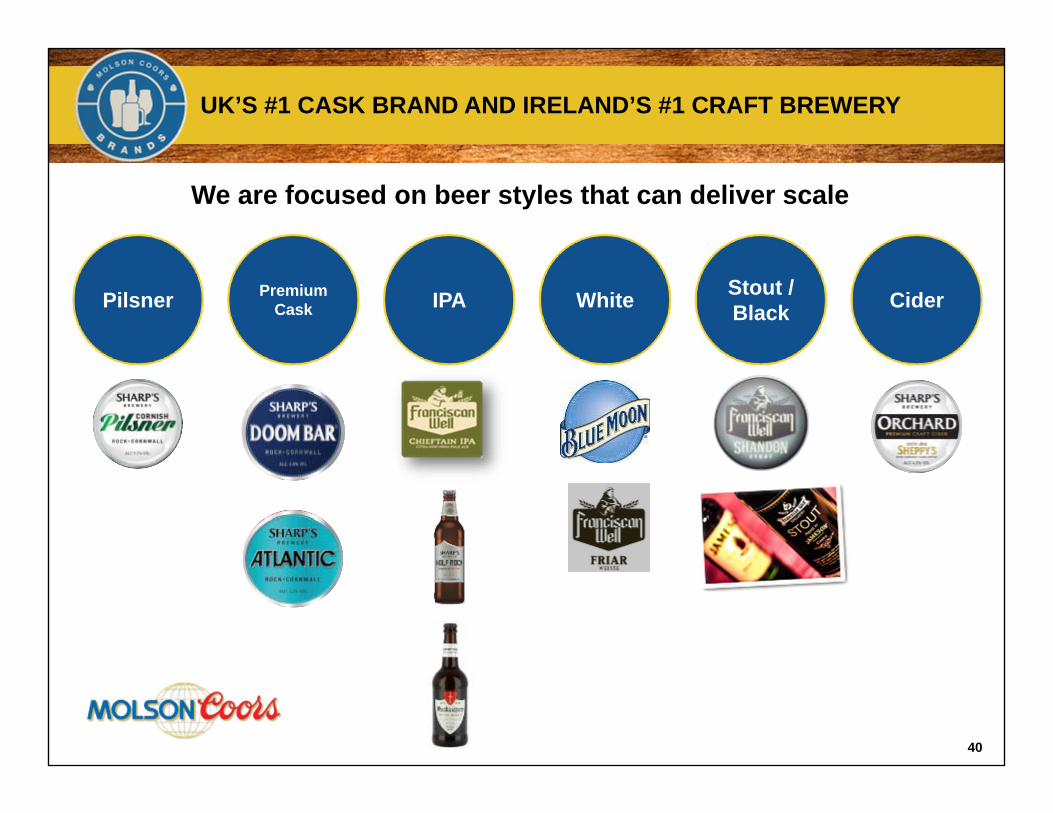
UK’S #1 CASK BRAND AND IRELAND’S #1 CRAFT BREWERY.
UK’S #1 CASK BRAND AND IRELAND’S #1 CRAFT BREWERY.
IPA White Stout / BlackPilsner Cider
We are focused on beer styles that can deliver scale
Premium Cask
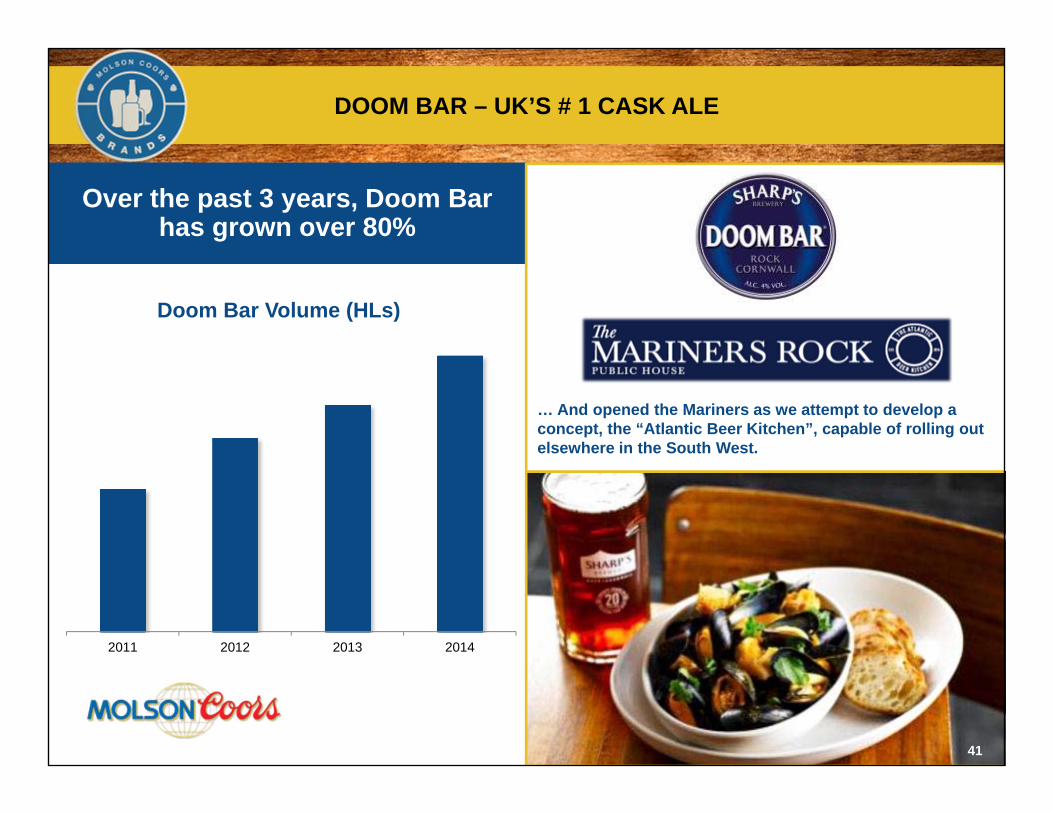
Over the past 3 years, Doom Bar has grown over 80%
41
DOOM BAR – UK’S # 1 CASK ALEDOOM BAR – UK’S # 1 CASK ALE
2011 2012 2013 2014
Doom Bar Volume (HLs)
… And opened the Mariners as we attempt to develop a concept, the “Atlantic Beer Kitchen”, capable of rolling out elsewhere in the South West.
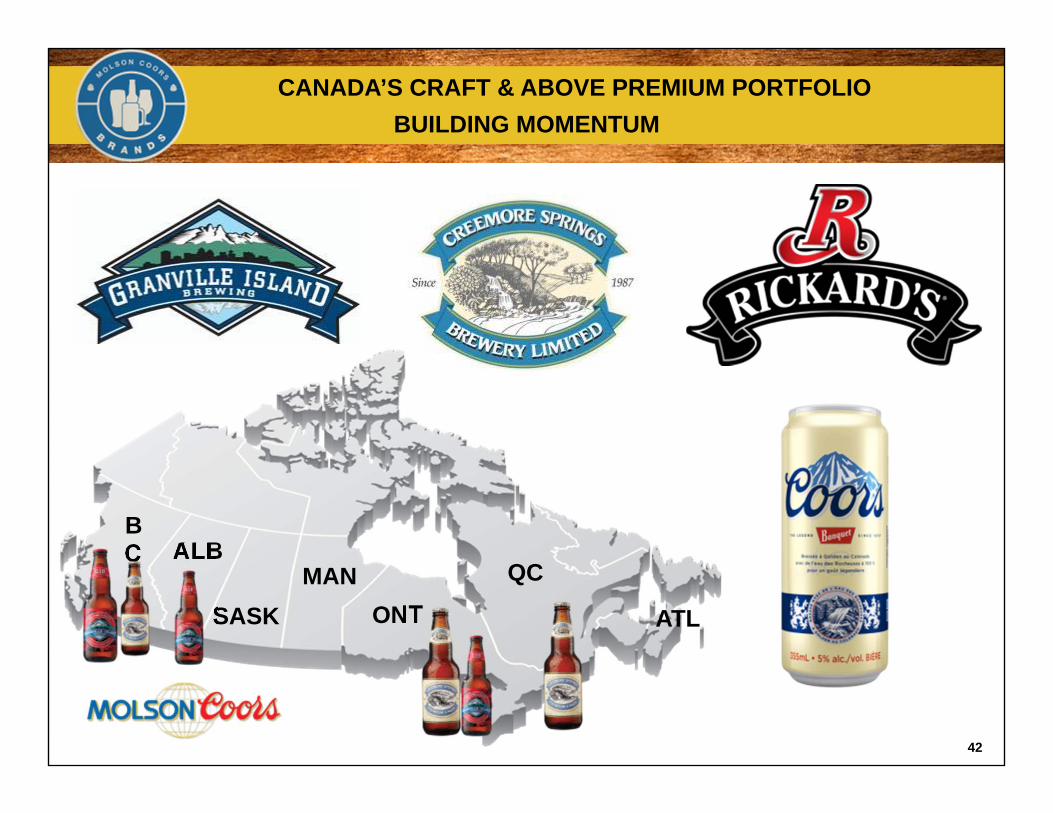
Canada Expands Above Premium Portfolio
42
CANADA’S CRAFT & ABOVE PREMIUM PORTFOLIO BUILDING MOMENTUM
CANADA’S CRAFT & ABOVE PREMIUM PORTFOLIO BUILDING MOMENTUM
BC ALB
SASKMAN
ONT
QC
ATL
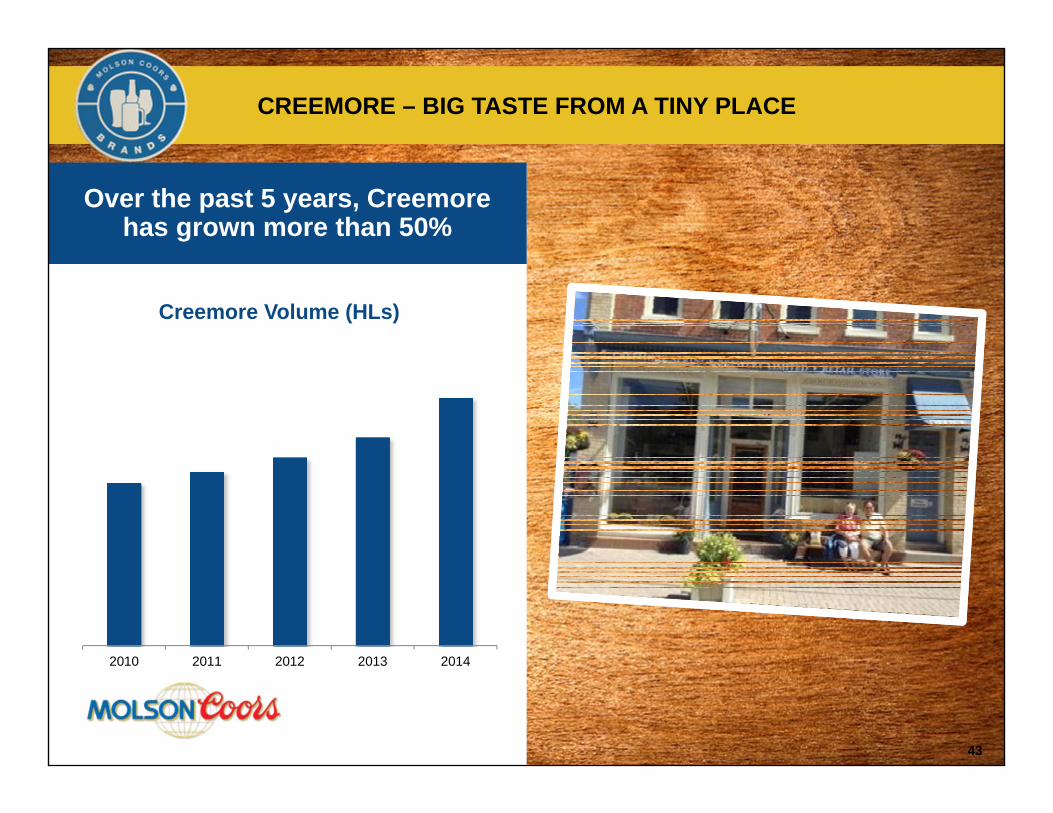
CREEMORE – BIG TASTE FROM A TINY PLACECREEMORE – BIG TASTE FROM A TINY PLACE
43
2010 2011 2012 2013 2014
Creemore Volume (HLs)
Over the past 5 years, Creemorehas grown more than 50%
TAPPING INTO FLAVOR AND NEW OCCASIONSTAPPING INTO FLAVOR AND NEW OCCASIONS
44
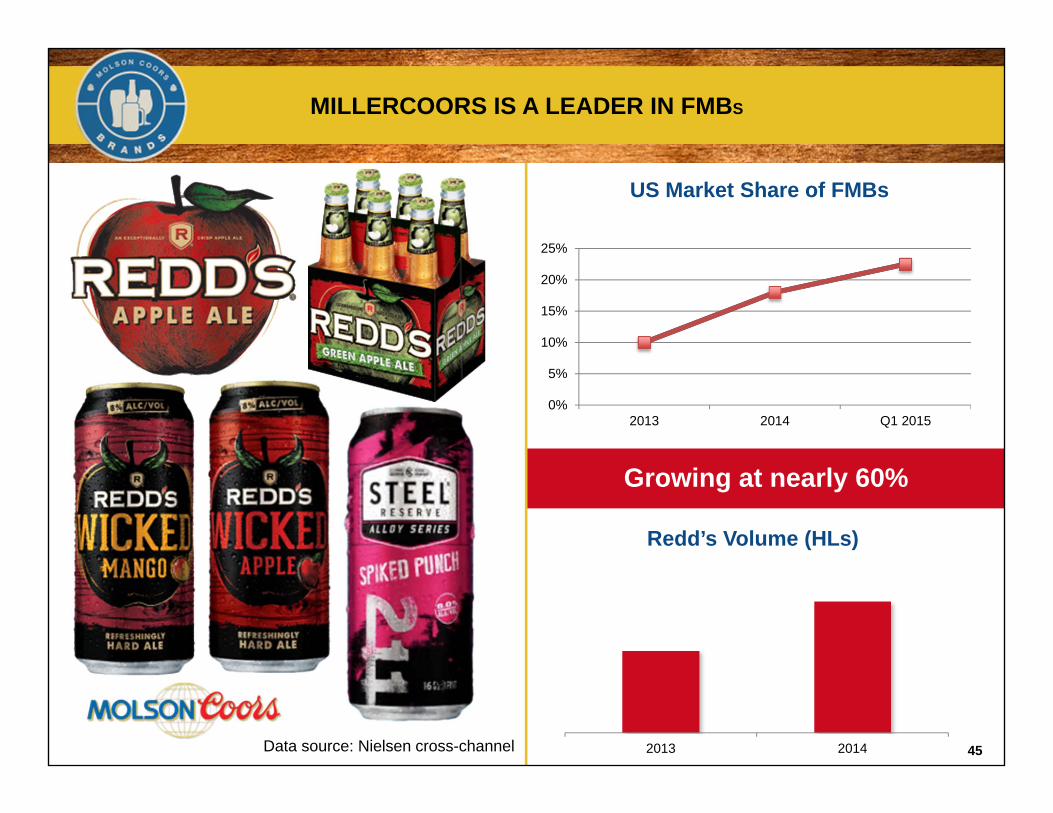
Growing at nearly 60%
45
MILLERCOORS IS A LEADER IN FMBSMILLERCOORS IS A LEADER IN FMBS
2013 2014
Redd’s Volume (HLs)
Data source: Nielsen cross-channel
US Market Share of FMBs
0%
5%
10%
15%
20%
25%
2013 2014 Q1 2015
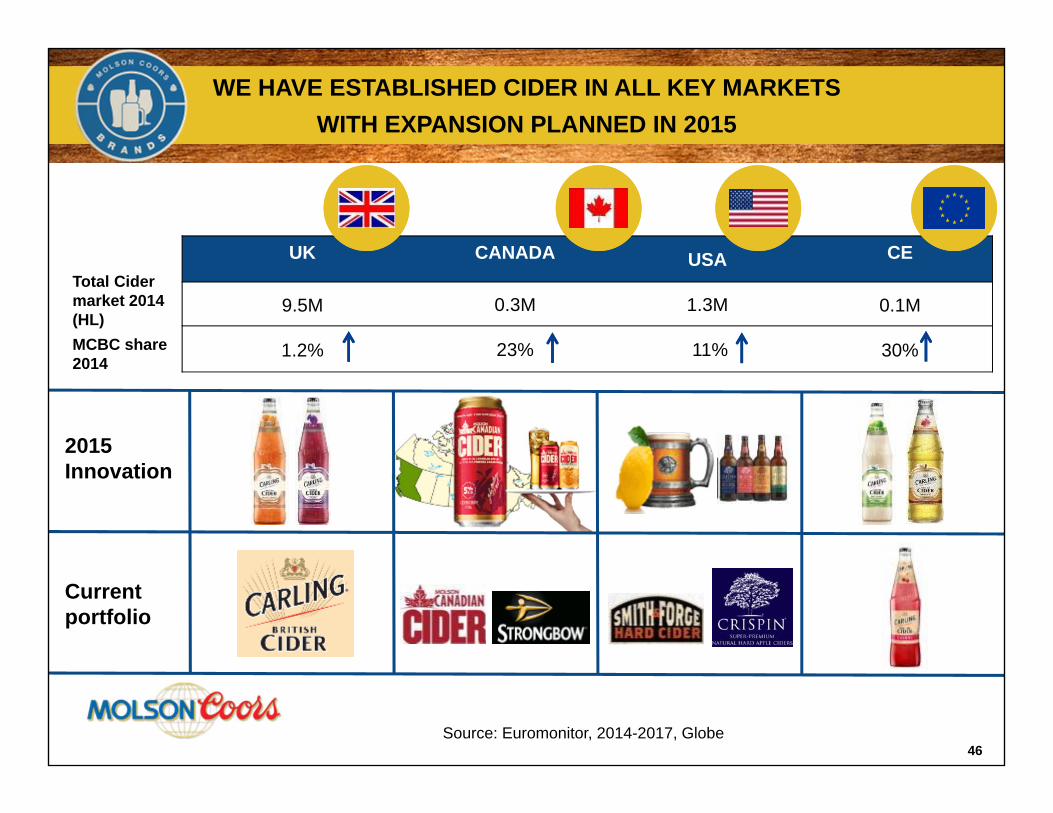
WE HAVE ESTABLISHED CIDER IN ALL KEY MARKETS WITH EXPANSION PLANNED IN 2015
WE HAVE ESTABLISHED CIDER IN ALL KEY MARKETS WITH EXPANSION PLANNED IN 2015
UK CANADA USA CE
9.5M 0.3M 1.3M 0.1M
1.2% 23% 11% 30% MCBC share 2014
Source: Euromonitor, 2014-2017, Globe
Total Cider market 2014 (HL)
2015 Innovation
Current portfolio
46
47
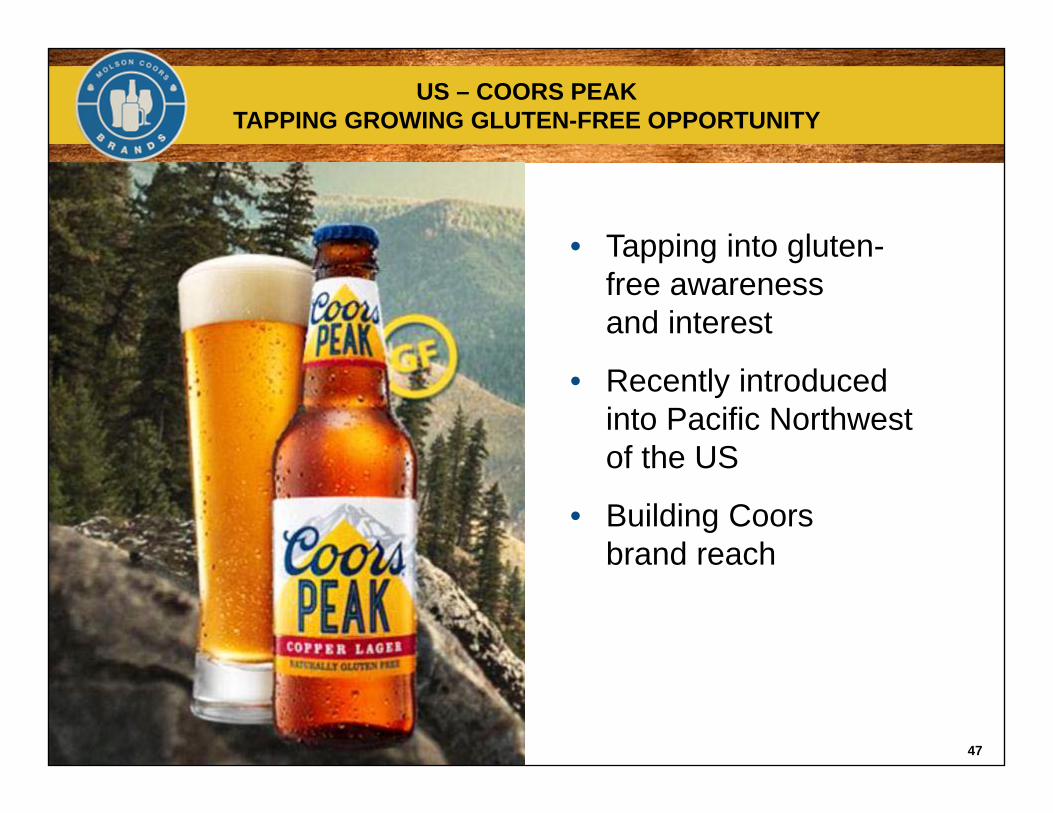
US – COORS PEAK TAPPING GROWING GLUTEN-FREE OPPORTUNITY
US – COORS PEAK TAPPING GROWING GLUTEN-FREE OPPORTUNITY
• Tapping into gluten-free awareness and interest
• Recently introduced into Pacific Northwest of the US
• Building Coors brand reach
48
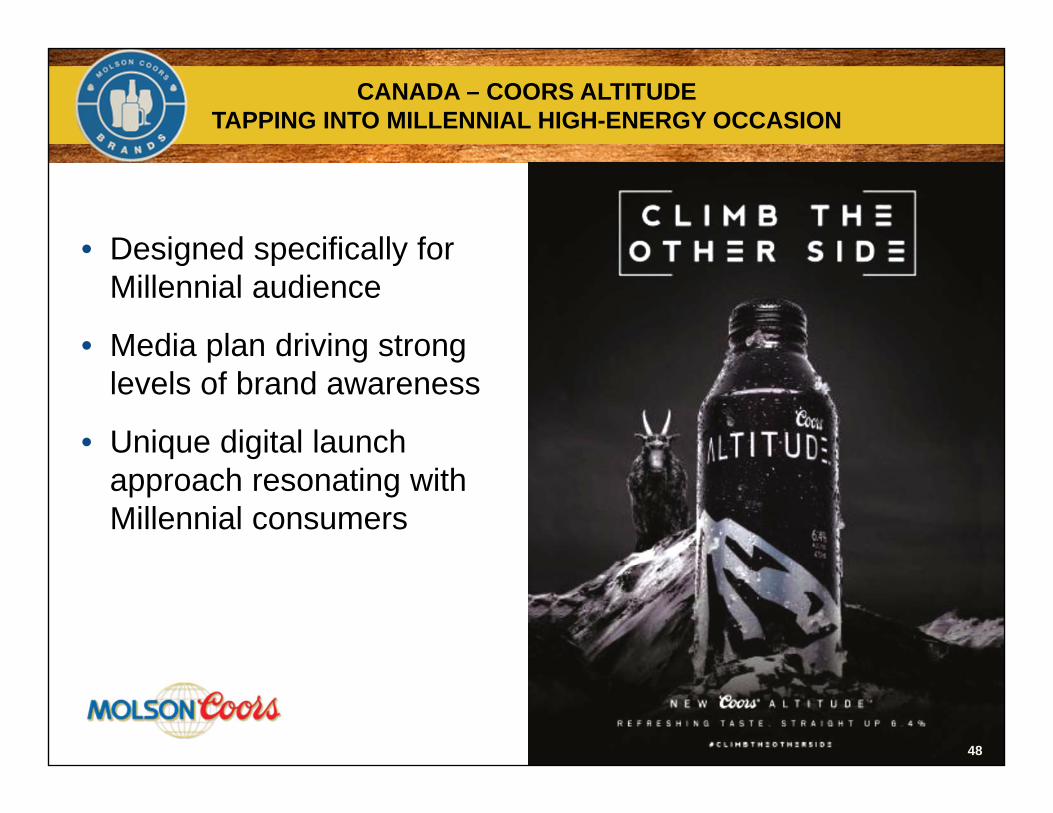
CANADA – COORS ALTITUDE TAPPING INTO MILLENNIAL HIGH-ENERGY OCCASION
CANADA – COORS ALTITUDE TAPPING INTO MILLENNIAL HIGH-ENERGY OCCASION
• Designed specifically for Millennial audience
• Media plan driving strong levels of brand awareness
• Unique digital launch approach resonating with Millennial consumers
BUILDING OUR INTERNATIONAL BRAND PORTFOLIOBUILDING OUR INTERNATIONAL BRAND PORTFOLIO
49
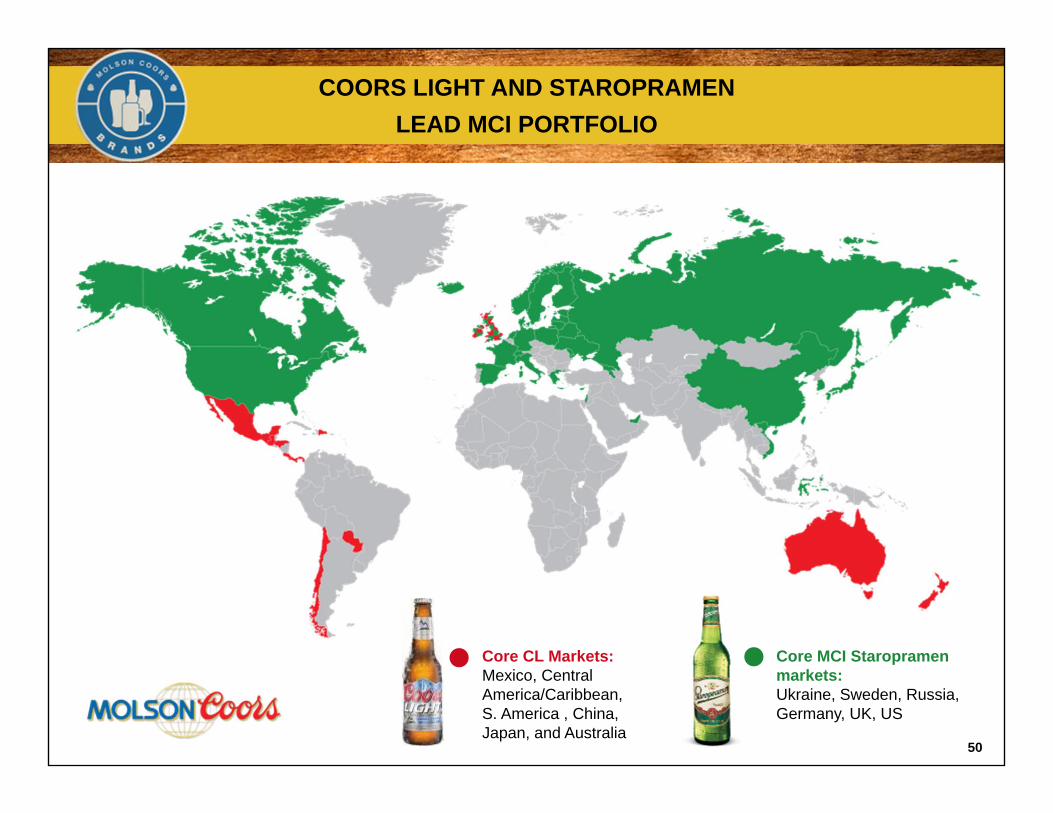
COORS LIGHT AND STAROPRAMEN LEAD MCI PORTFOLIO
COORS LIGHT AND STAROPRAMEN LEAD MCI PORTFOLIO
50
Core MCI Staropramen markets: Ukraine, Sweden, Russia, Germany, UK, US
Core CL Markets: Mexico, Central America/Caribbean, S. America , China, Japan, and Australia
51
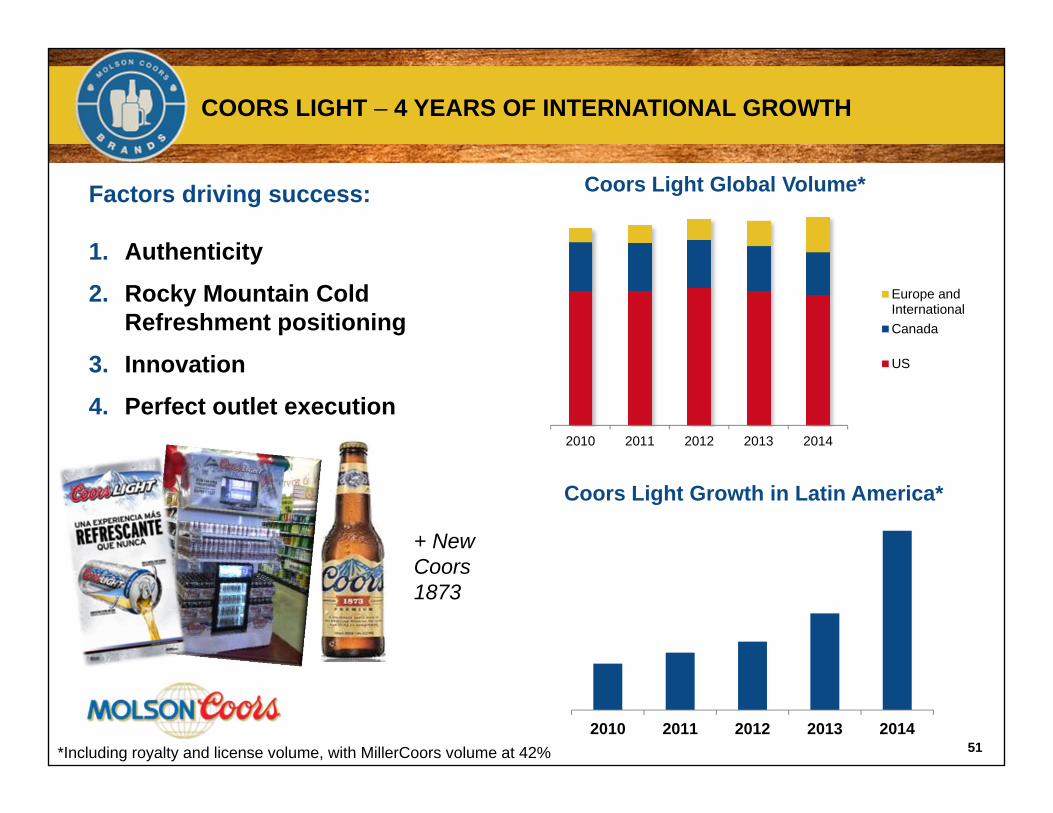
COORS LIGHT – 4 YEARS OF INTERNATIONAL GROWTH
2010 2011 2012 2013 2014
Total LACA
Coors Light Growth in Latin America*
2010 2011 2012 2013 2014
Europe andInternationalCanada
US
Coors Light Global Volume*Factors driving success:
1. Authenticity
2. Rocky Mountain Cold Refreshment positioning
3. Innovation
4. Perfect outlet execution
+ New Coors 1873
*Including royalty and license volume, with MillerCoors volume at 42%
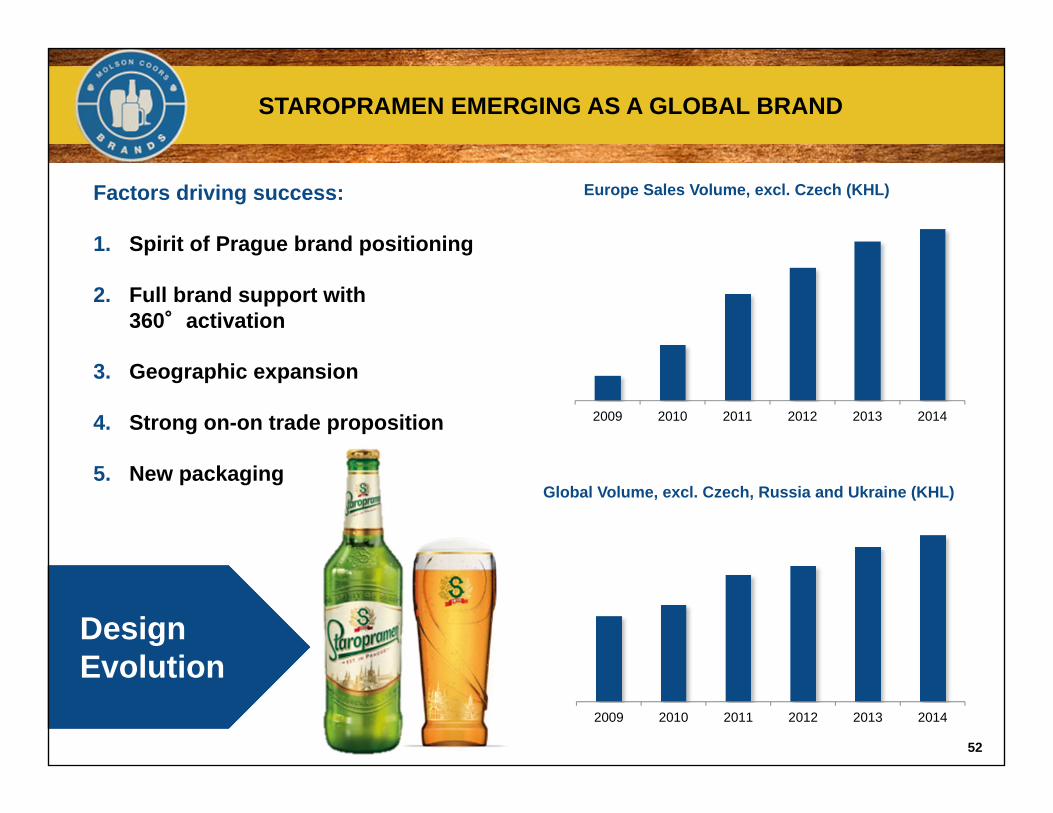
STAROPRAMEN EMERGING AS A GLOBAL BRANDSTAROPRAMEN EMERGING AS A GLOBAL BRAND
Factors driving success:
1. Spirit of Prague brand positioning
2. Full brand support with 360°activation
3. Geographic expansion
4. Strong on-on trade proposition
5. New packaging
52
Design Evolution
2009 2010 2011 2012 2013 2014
Europe Sales Volume, excl. Czech (KHL)
2009 2010 2011 2012 2013 2014
Global Volume, excl. Czech, Russia and Ukraine (KHL)
53
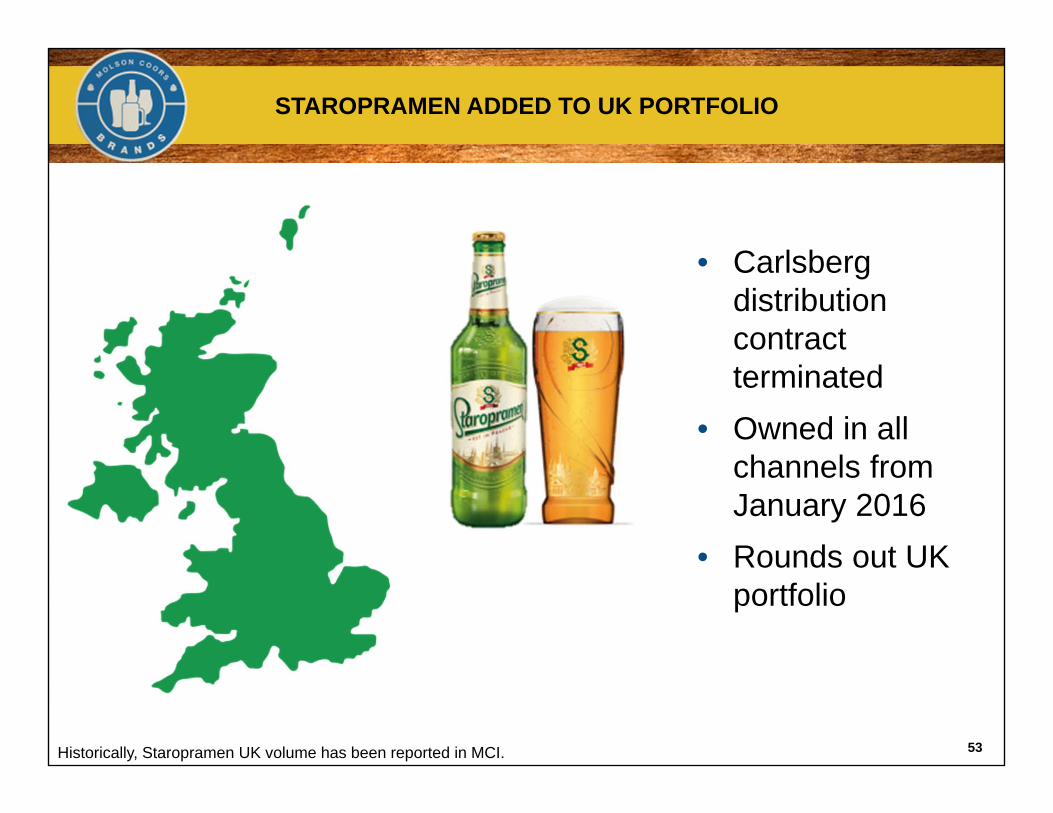
STAROPRAMEN ADDED TO UK PORTFOLIOSTAROPRAMEN ADDED TO UK PORTFOLIO
• Carlsberg distribution contract terminated
• Owned in all channels from January 2016
• Rounds out UK portfolio
Historically, Staropramen UK volume has been reported in MCI.
54
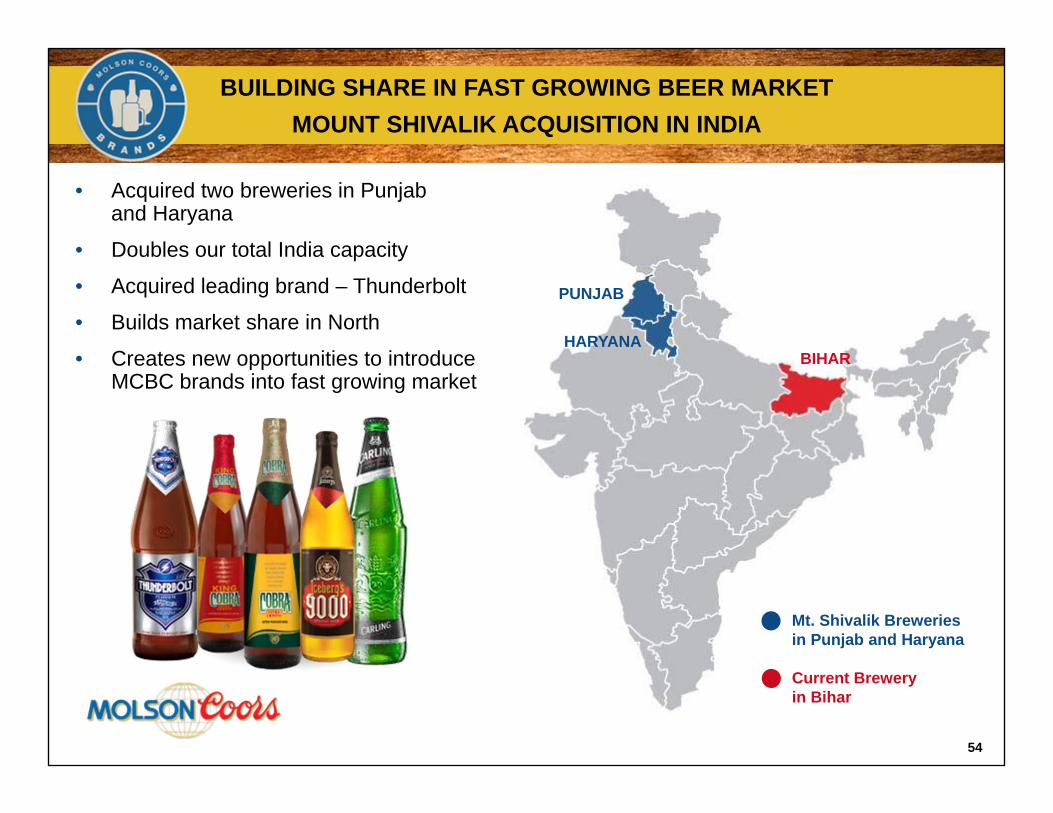
BUILDING SHARE IN FAST GROWING BEER MARKET MOUNT SHIVALIK ACQUISITION IN INDIA
BUILDING SHARE IN FAST GROWING BEER MARKET MOUNT SHIVALIK ACQUISITION IN INDIA
• Acquired two breweries in Punjab and Haryana
• Doubles our total India capacity
• Acquired leading brand – Thunderbolt
• Builds market share in North
• Creates new opportunities to introduce MCBC brands into fast growing market
Current Brewery in Bihar
Mt. Shivalik Breweries in Punjab and Haryana
PUNJAB
HARYANABIHAR
55
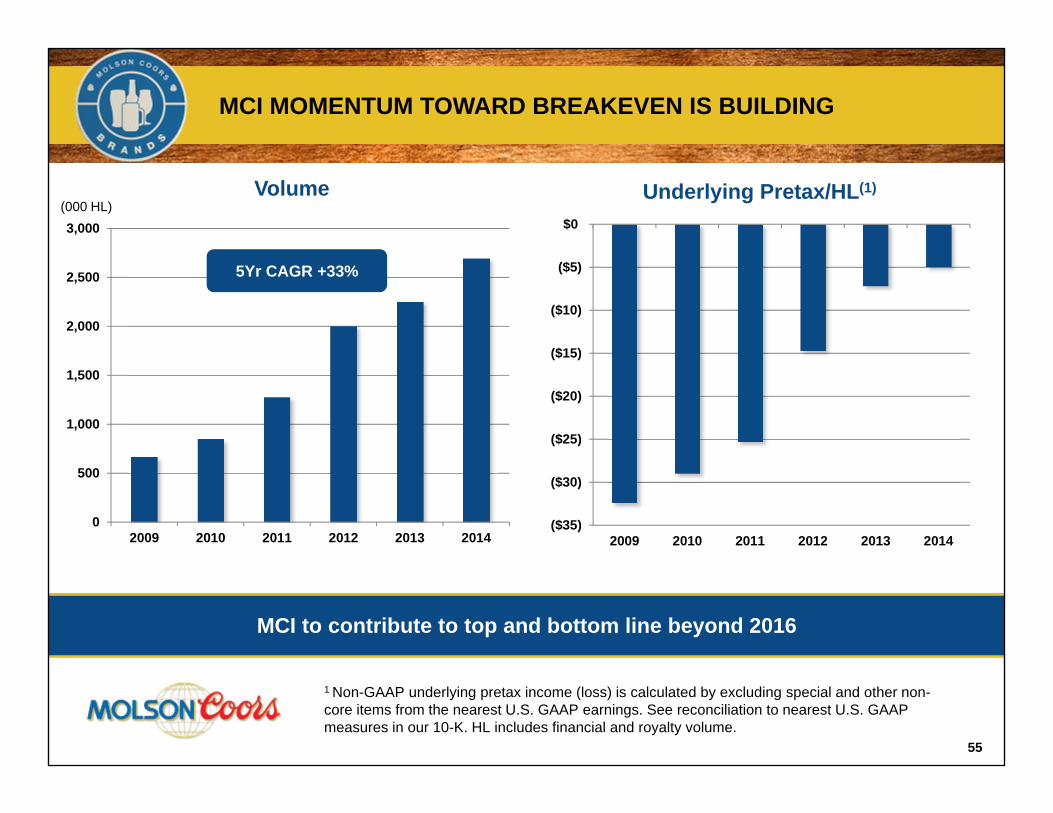
MCI MOMENTUM TOWARD BREAKEVEN IS BUILDINGMCI MOMENTUM TOWARD BREAKEVEN IS BUILDING
MCI to contribute to top and bottom line beyond 2016
($35)
($30)
($25)
($20)
($15)
($10)
($5)
$0
2009 2010 2011 2012 2013 2014
Underlying Pretax/HL(1)
0
500
1,000
1,500
2,000
2,500
3,000
2009 2010 2011 2012 2013 2014
Volume
5Yr CAGR +33%
1 Non-GAAP underlying pretax income (loss) is calculated by excluding special and other non-core items from the nearest U.S. GAAP earnings. See reconciliation to nearest U.S. GAAP measures in our 10-K. HL includes financial and royalty volume.
(000 HL)
DELIGHTING OUR CUSTOMERS VIA GREAT QUALITY, STRONG PARTNERSHIPS AND BRILLIANT EXECUTIONDELIGHTING OUR CUSTOMERS VIA GREAT QUALITY,
STRONG PARTNERSHIPS AND BRILLIANT EXECUTION
56
Commercial Excellence Capabilities
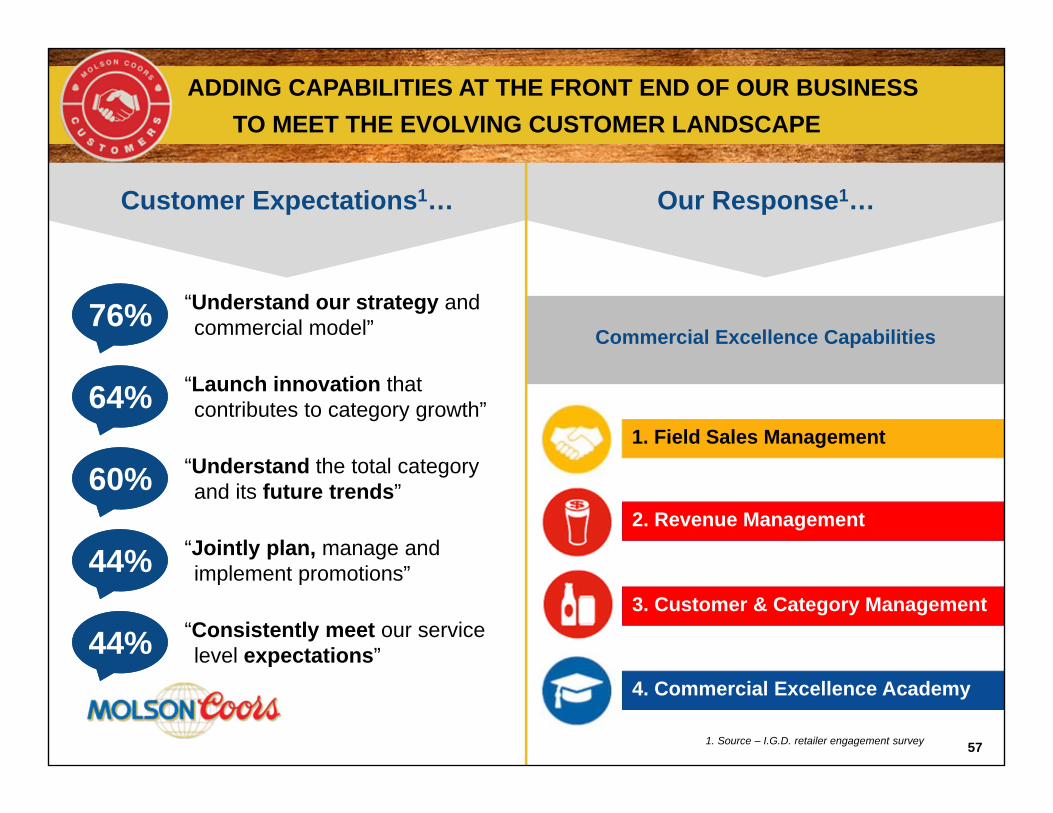
ADDING CAPABILITIES AT THE FRONT END OF OUR BUSINESS TO MEET THE EVOLVING CUSTOMER LANDSCAPE
ADDING CAPABILITIES AT THE FRONT END OF OUR BUSINESS TO MEET THE EVOLVING CUSTOMER LANDSCAPE
1. Source – I.G.D. retailer engagement survey
1. Field Sales Management
2. Revenue Management
3. Customer & Category Management
4. Commercial Excellence Academy
57
Customer Expectations1… Our Response1…
76% “Understand our strategy and commercial model”
64% “Launch innovation that contributes to category growth”
60%
60%
60% “Understand the total category and its future trends”
44% “Jointly plan, manage and implement promotions”
44% “Consistently meet our service level expectations”

SHARPENING & ENERGIZING PERFORMANCE THROUGH FIELD SALES MANAGEMENT (FSM)SHARPENING & ENERGIZING PERFORMANCE THROUGH FIELD SALES MANAGEMENT (FSM)
58
• Standard sales force processes implemented in Canada and UK
• 630 front-line Canadian and UK sales force now operating FSM
• Successful deployment of SAP ReX, sales force automation & iPads
• Route planning helping to reduce drive time
• UK daily call rate has grown 40%
• Simplified tasks, clear targets and monthly bonus
• Continuous capability improvementacross Central Europe for 1,350 front-line sales people
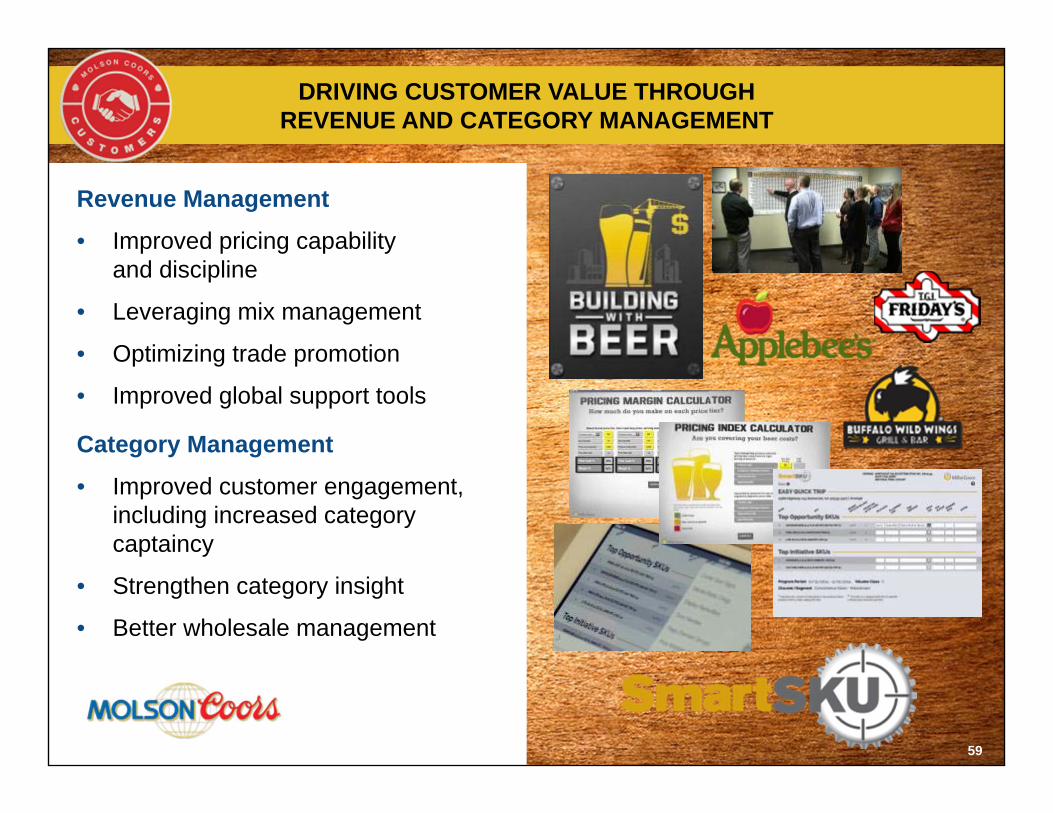
DRIVING CUSTOMER VALUE THROUGH REVENUE AND CATEGORY MANAGEMENT
DRIVING CUSTOMER VALUE THROUGH REVENUE AND CATEGORY MANAGEMENT
59
Revenue Management
• Improved pricing capability and discipline
• Leveraging mix management
• Optimizing trade promotion
• Improved global support tools
Category Management
• Improved customer engagement, including increased category captaincy
• Strengthen category insight
• Better wholesale management
60
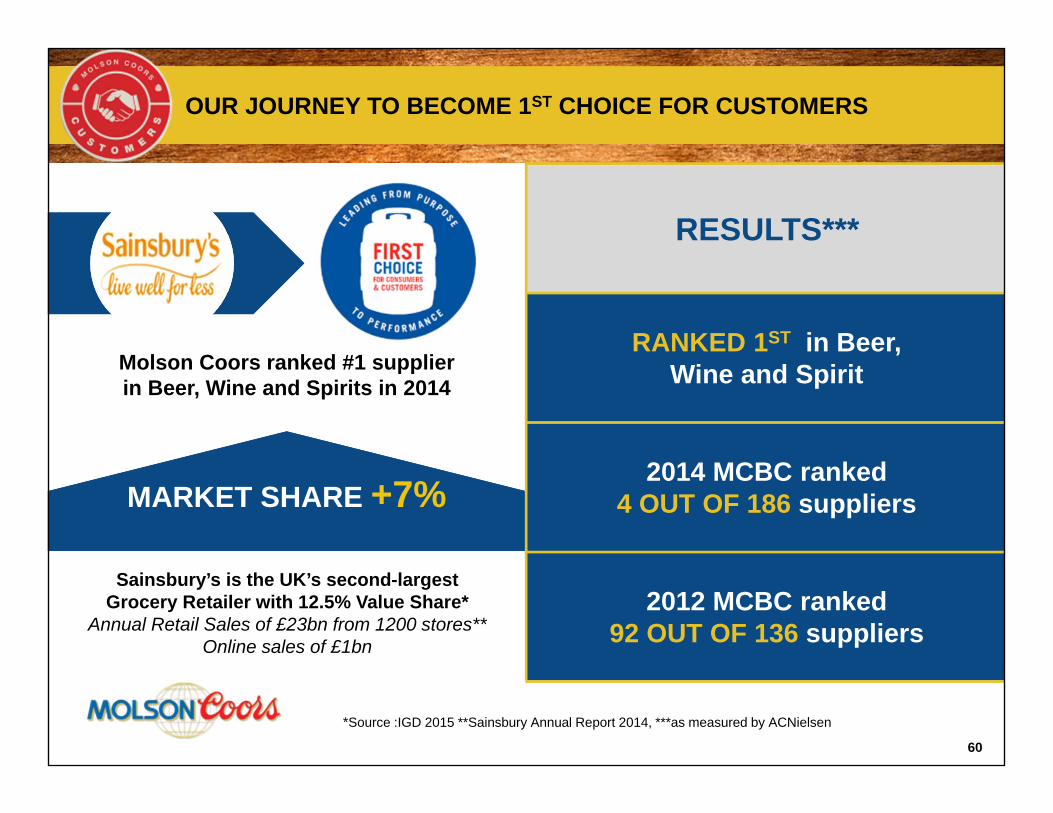
OUR JOURNEY TO BECOME 1ST CHOICE FOR CUSTOMERSOUR JOURNEY TO BECOME 1ST CHOICE FOR CUSTOMERS
*Source :IGD 2015 **Sainsbury Annual Report 2014, ***as measured by ACNielsen
Molson Coors ranked #1 supplier in Beer, Wine and Spirits in 2014
MARKET SHARE +7%
Sainsbury’s is the UK’s second-largest Grocery Retailer with 12.5% Value Share*
Annual Retail Sales of £23bn from 1200 stores**Online sales of £1bn
RANKED 1ST in Beer, Wine and Spirit
RESULTS***
2014 MCBC ranked 4 OUT OF 186 suppliers
2012 MCBC ranked 92 OUT OF 136 suppliers
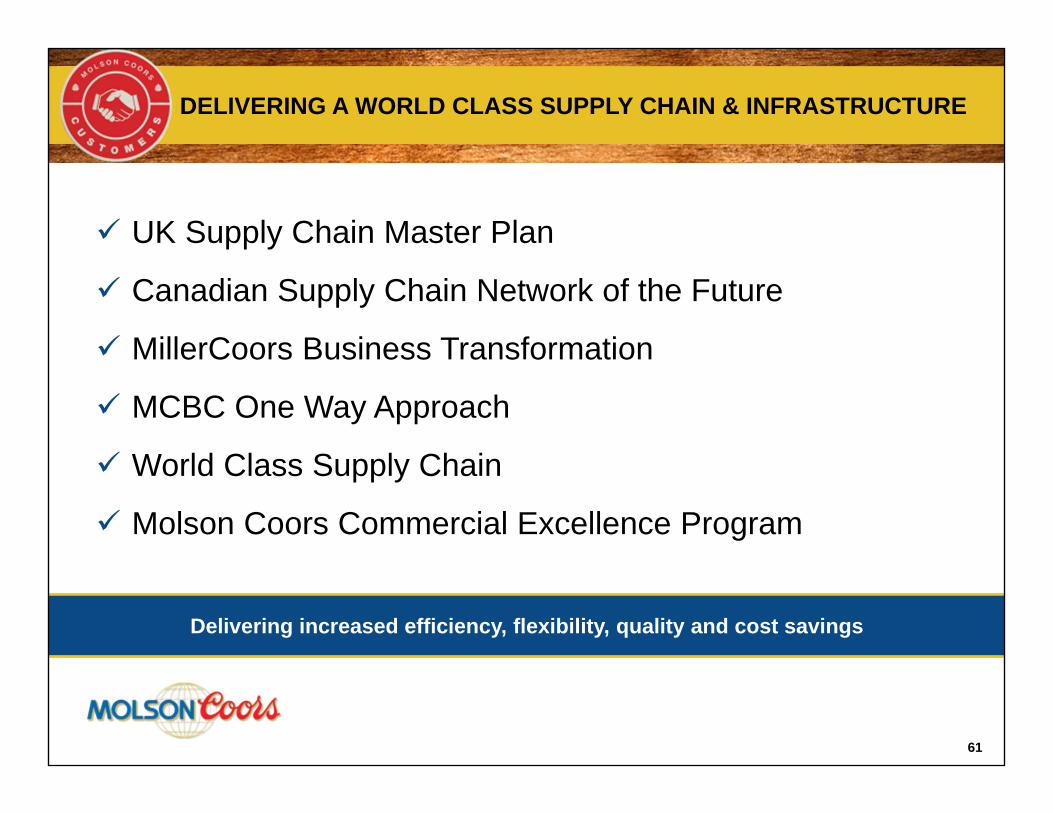
Delivering increased efficiency, flexibility, quality and cost savings
61
DELIVERING A WORLD CLASS SUPPLY CHAIN & INFRASTRUCTUREDELIVERING A WORLD CLASS SUPPLY CHAIN & INFRASTRUCTURE
UK Supply Chain Master Plan
Canadian Supply Chain Network of the Future
MillerCoors Business Transformation
MCBC One Way Approach
World Class Supply Chain
Molson Coors Commercial Excellence Program
62
FINANCIAL UPDATE: GAVIN HATTERSLEY, CFOMOLSON COORS BREWING COMPANY
FINANCIAL UPDATE: GAVIN HATTERSLEY, CFOMOLSON COORS BREWING COMPANY
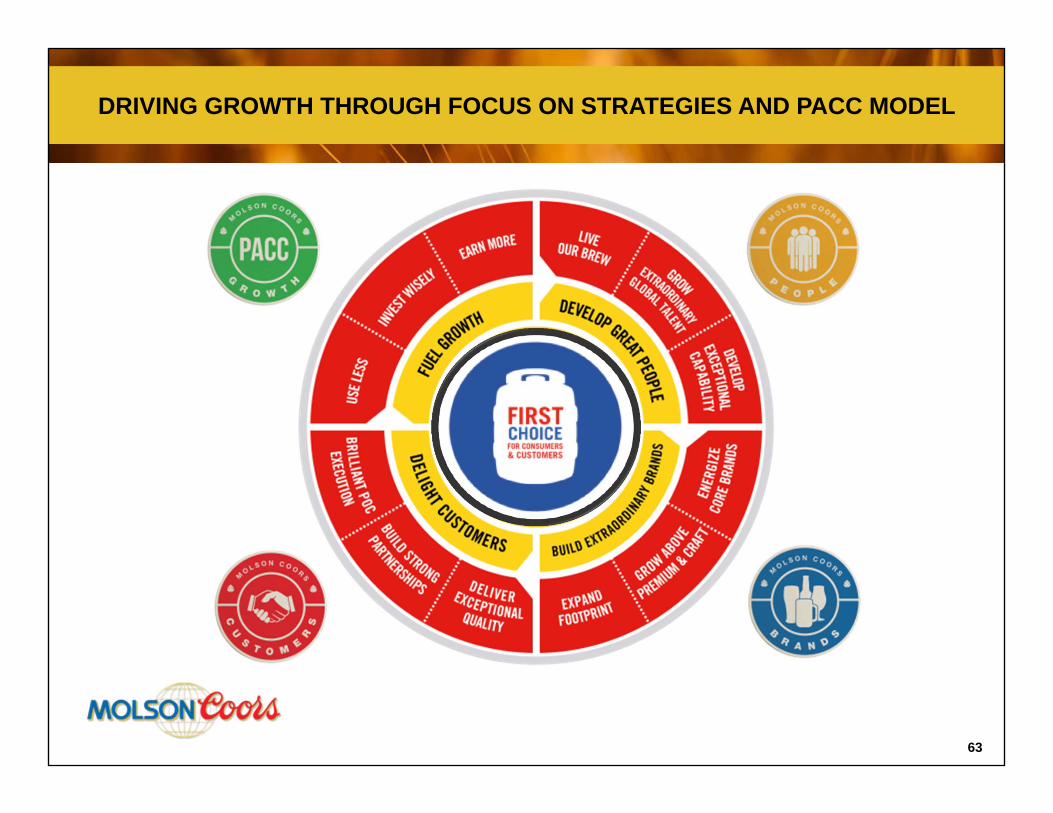
DRIVING GROWTH THROUGH FOCUS ON STRATEGIES AND PACC MODELDRIVING GROWTH THROUGH FOCUS ON STRATEGIES AND PACC MODEL
63
PACC
64
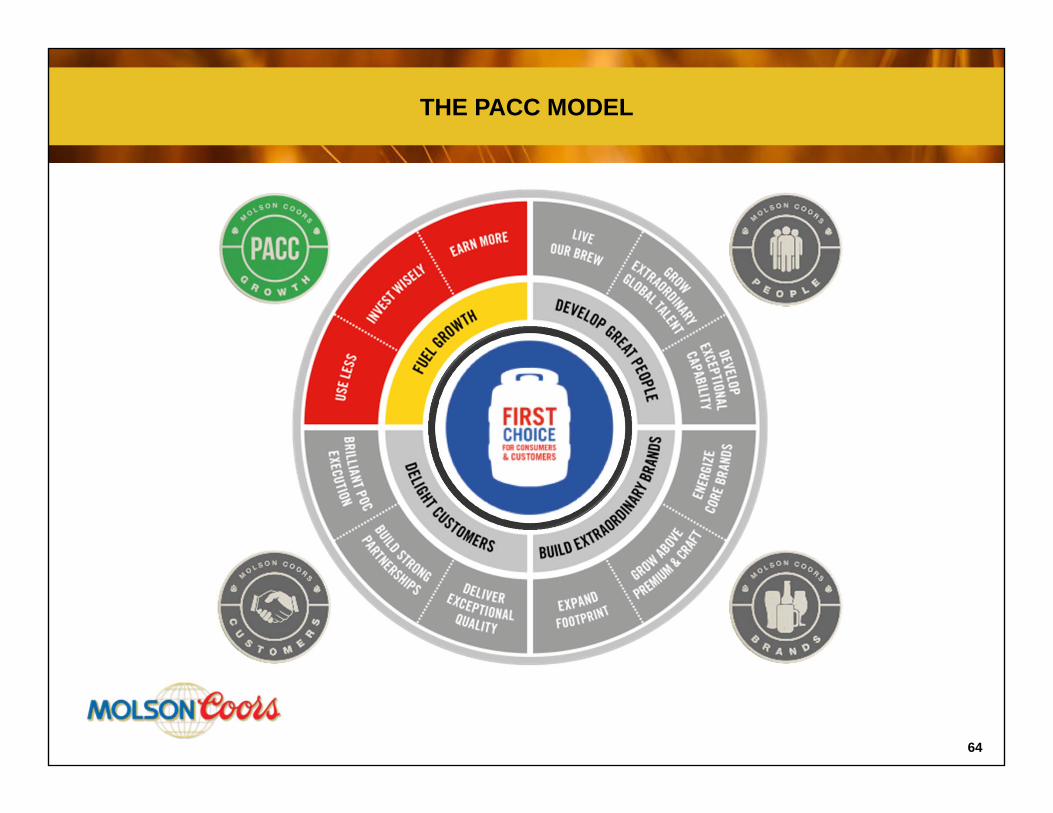
THE PACC MODELTHE PACC MODEL
PACC
65
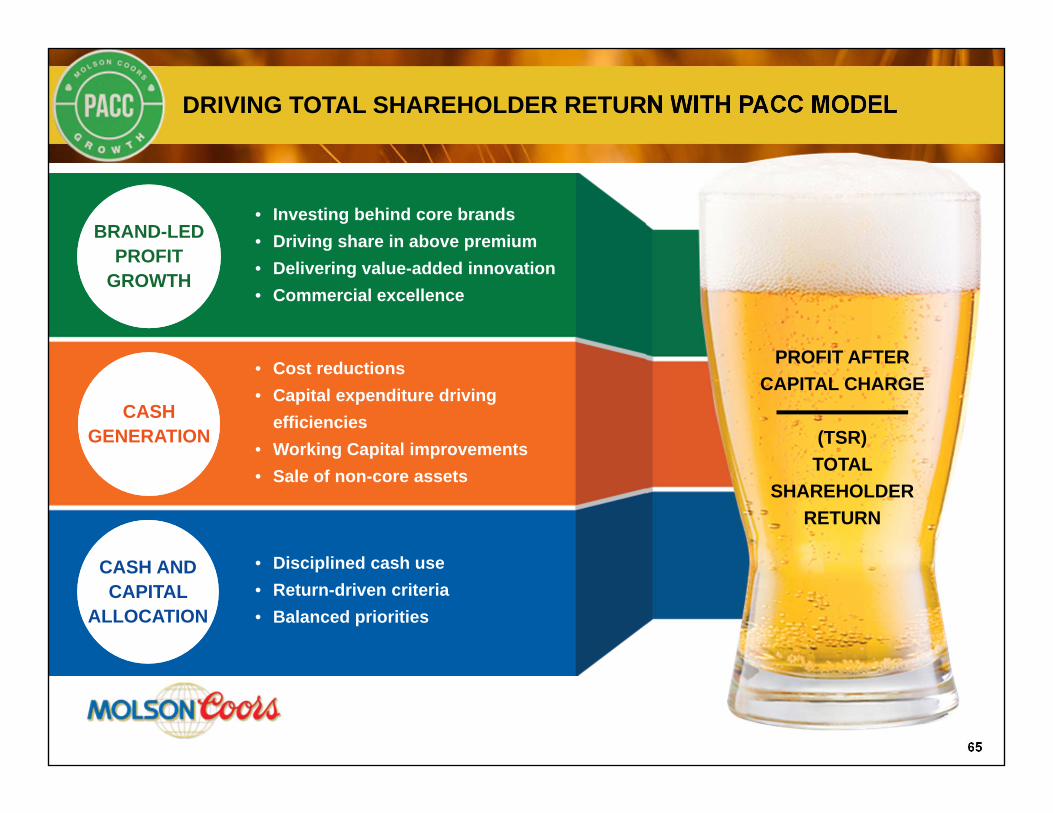
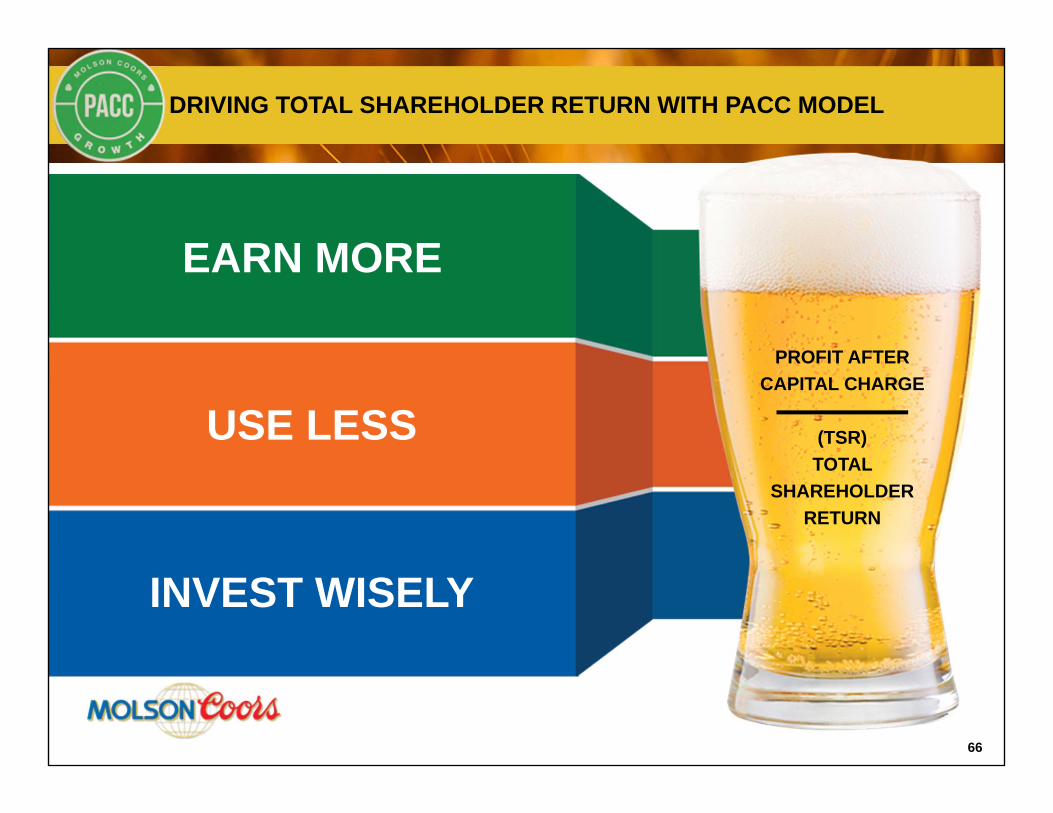
DRIVING TOTAL SHAREHOLDER RETURN WITH PACC MODELDRIVING TOTAL SHAREHOLDER RETURN WITH PACC MODEL
• Investing behind core brands• Driving share in above premium• Delivering value-added innovation• Commercial excellence
• Cost reductions• Capital expenditure driving
efficiencies• Working Capital improvements• Sale of non-core assets
• Disciplined cash use• Return-driven criteria• Balanced priorities
PROFIT AFTERCAPITAL CHARGE
(TSR)TOTAL
SHAREHOLDER RETURN
BRAND-LED PROFIT
GROWTH
CASH AND CAPITAL
ALLOCATION
CASHGENERATION
PROFIT AFTERCAPITAL CHARGE
(TSR)TOTAL
SHAREHOLDER RETURN
66
DRIVING TOTAL SHAREHOLDER RETURN WITH PACC MODELDRIVING TOTAL SHAREHOLDER RETURN WITH PACC MODEL
EARN MORE
INVEST WISELY
USE LESS

INVEST WISELYUSE LESSEARN MORE
$441 $541
$646 $642 $719
$794 $821 $865 $865
$0
$200
$400
$600
$800
2005 2006 2007 2008 2009 2010 2011 2012 2013 2014
($m
illio
ns)
MCBC Underlying Pretax Income (1)
$904
UNDERLYING EARNINGS GROWTH EVEN IN TOUGH TIMES…UNDERLYING EARNINGS GROWTH EVEN IN TOUGH TIMES…
67
(1) Non-GAAP underlying pretax income is calculated by excluding special and other non-core items from the nearest U.S. GAAP earnings. See reconciliation to nearest U.S. GAAP measures in our 10-K.
Underlying pretax income growth over the past 9 years totaled 105%

INVEST WISELYUSE LESSEARN MORE
$1,106 $1,100 $1,091 $1,127 $1,212 $1,267
$1,398 $1,469 $1,471
$0
$200
$400
$600
$800
$1,000
$1,200
$1,400
$1,600
2006 2007 2008 2009 2010 2011 2012 2013 2014
($m
illio
ns)
Underlying EBITDA(1)
…AND STEADY, STRONG, GROWING EBITDA…AND STEADY, STRONG, GROWING EBITDA
68
(1) Non-GAAP underlying EBITDA (Earnings before interest, taxes, depreciation and amortization) is calculated excluding special and other non-core items from U.S. GAAP earnings. See reconciliation to nearest U.S. GAAP measures in our 10-K. Includes 42% of MillerCoors underlying EBITDA.
Nearly $8 per share (2014)
INVEST WISELYEARN MORE USE LESS
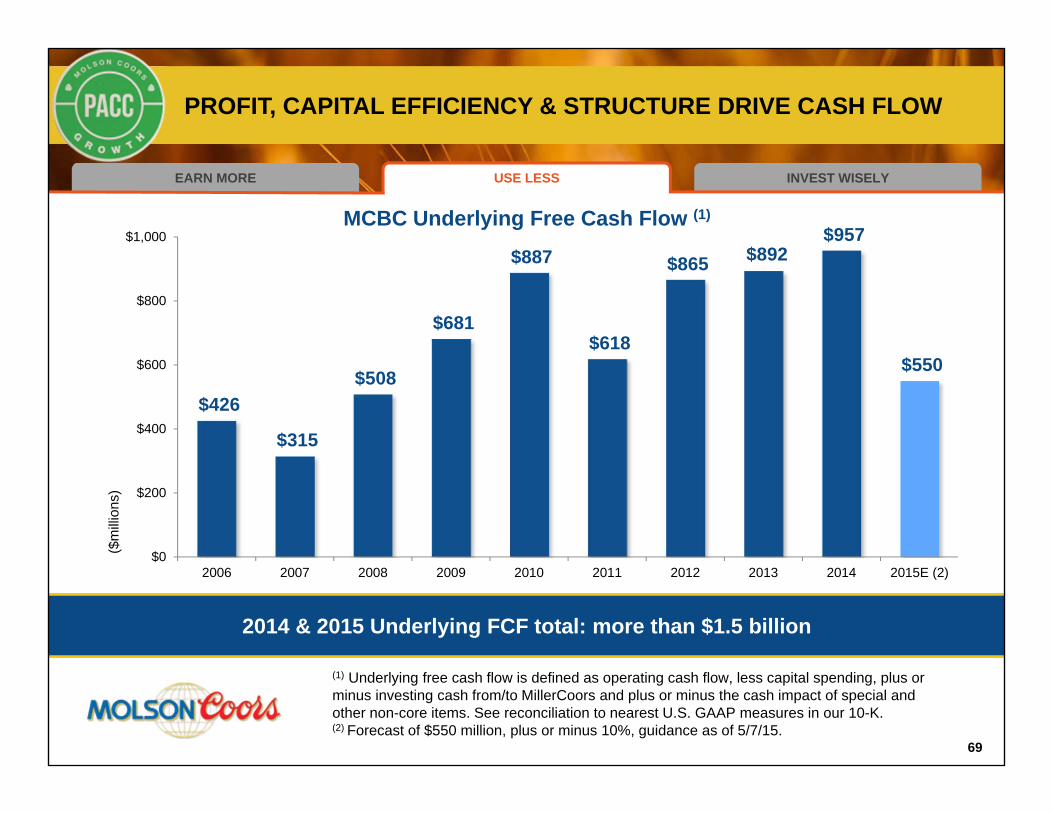
PROFIT, CAPITAL EFFICIENCY & STRUCTURE DRIVE CASH FLOWPROFIT, CAPITAL EFFICIENCY & STRUCTURE DRIVE CASH FLOW
$426
$315
$508
$681
$887
$618
$865 $892 $957
$550
$0
$200
$400
$600
$800
$1,000
2006 2007 2008 2009 2010 2011 2012 2013 2014 2015E (2)
($m
illio
ns)
MCBC Underlying Free Cash Flow (1)
69
(1) Underlying free cash flow is defined as operating cash flow, less capital spending, plus or minus investing cash from/to MillerCoors and plus or minus the cash impact of special and other non-core items. See reconciliation to nearest U.S. GAAP measures in our 10-K. (2) Forecast of $550 million, plus or minus 10%, guidance as of 5/7/15.
2014 & 2015 Underlying FCF total: more than $1.5 billion
INVEST WISELYEARN MORE USE LESS
70
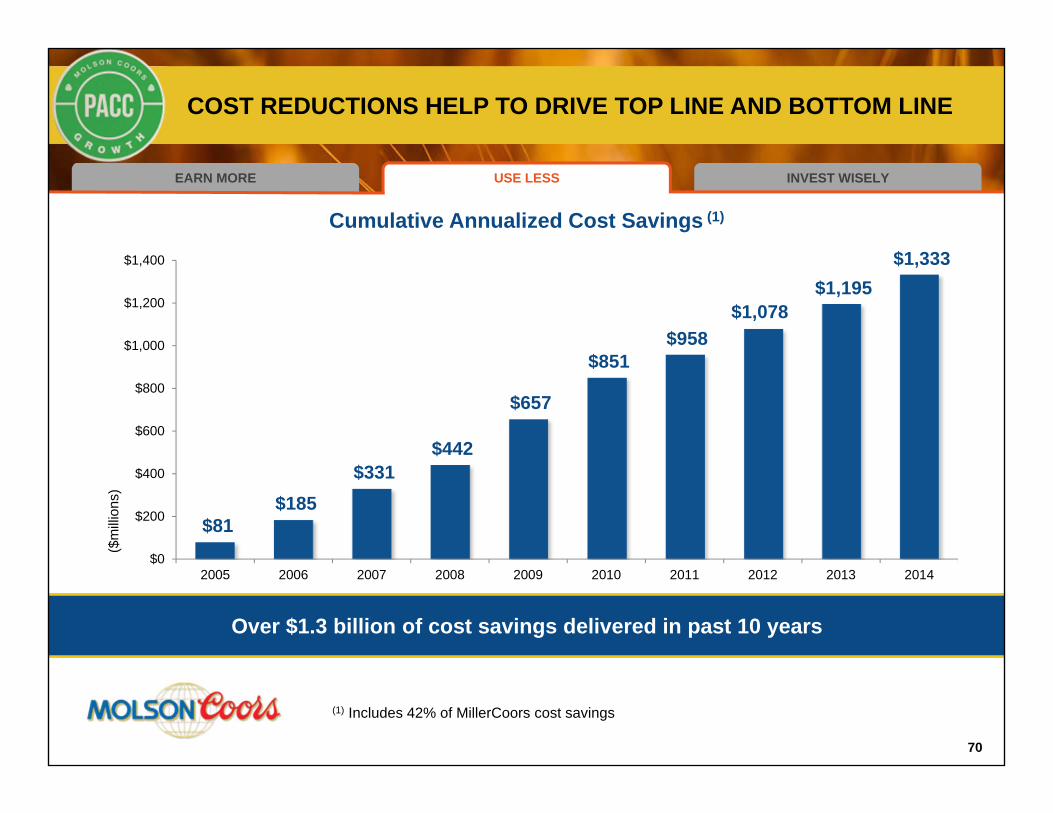
COST REDUCTIONS HELP TO DRIVE TOP LINE AND BOTTOM LINECOST REDUCTIONS HELP TO DRIVE TOP LINE AND BOTTOM LINE
(1) Includes 42% of MillerCoors cost savings
$81 $185
$331 $442
$657
$851 $958
$1,078 $1,195
$1,333
$0
$200
$400
$600
$800
$1,000
$1,200
$1,400
2005 2006 2007 2008 2009 2010 2011 2012 2013 2014
($m
illio
ns)
Cumulative Annualized Cost Savings (1)
Over $1.3 billion of cost savings delivered in past 10 years
INVEST WISELYEARN MORE USE LESS
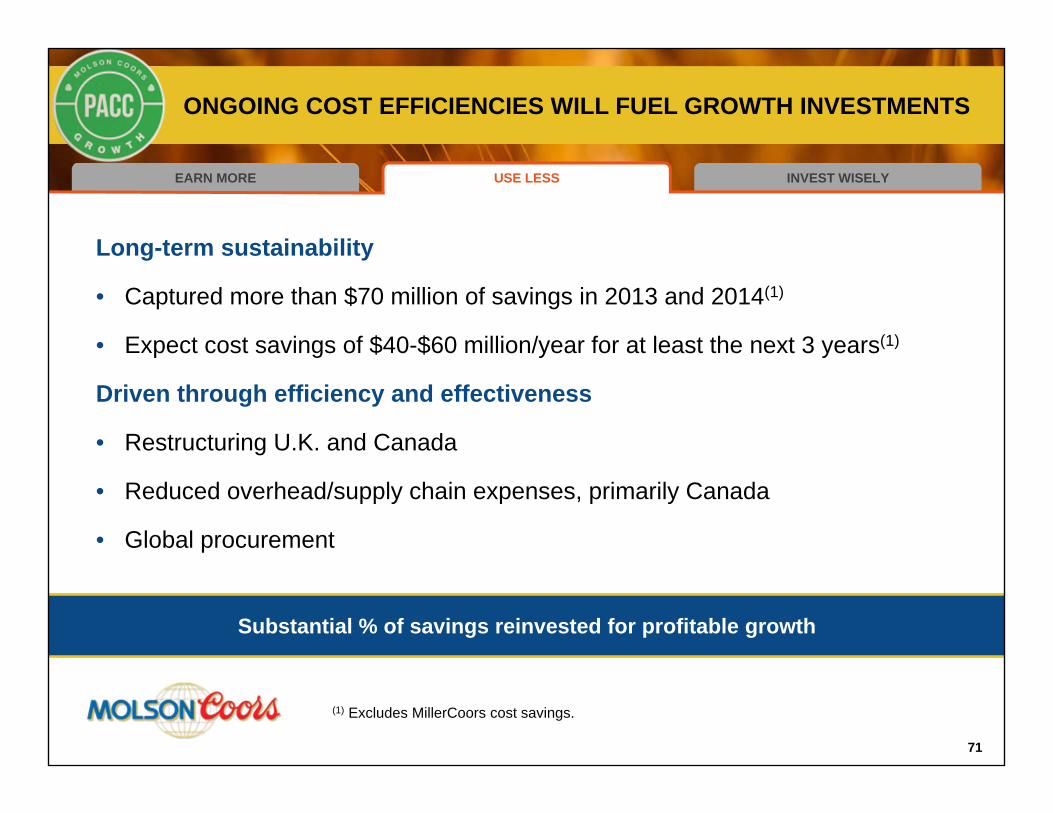
Long-term sustainability
• Captured more than $70 million of savings in 2013 and 2014(1)
• Expect cost savings of $40-$60 million/year for at least the next 3 years(1)
Driven through efficiency and effectiveness
• Restructuring U.K. and Canada
• Reduced overhead/supply chain expenses, primarily Canada
• Global procurement
71
ONGOING COST EFFICIENCIES WILL FUEL GROWTH INVESTMENTSONGOING COST EFFICIENCIES WILL FUEL GROWTH INVESTMENTS
(1) Excludes MillerCoors cost savings.
Substantial % of savings reinvested for profitable growth
INVEST WISELYEARN MORE USE LESS
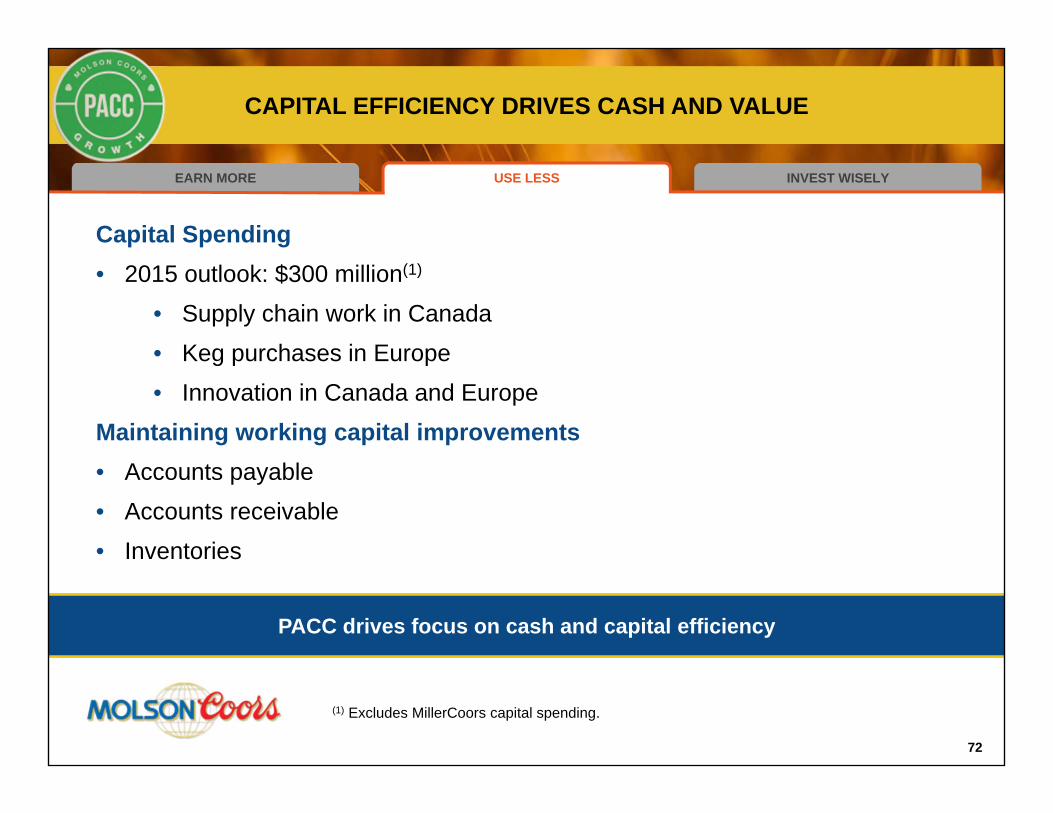
Capital Spending• 2015 outlook: $300 million(1)
• Supply chain work in Canada• Keg purchases in Europe• Innovation in Canada and Europe
Maintaining working capital improvements• Accounts payable• Accounts receivable• Inventories
72
CAPITAL EFFICIENCY DRIVES CASH AND VALUECAPITAL EFFICIENCY DRIVES CASH AND VALUE
(1) Excludes MillerCoors capital spending.
PACC drives focus on cash and capital efficiency
INVEST WISELYEARN MORE USE LESS
INCREASING WORKING CAPITAL EFFICIENCYINCREASING WORKING CAPITAL EFFICIENCY
73
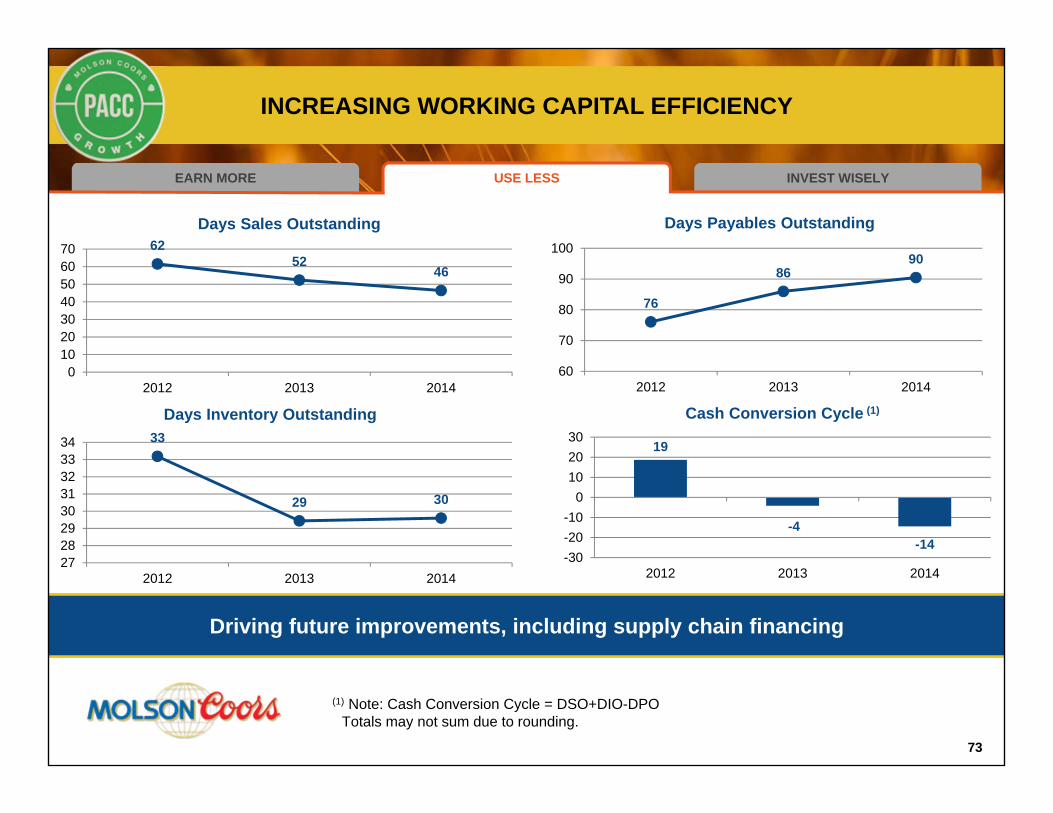
(1) Note: Cash Conversion Cycle = DSO+DIO-DPO Totals may not sum due to rounding.
Driving future improvements, including supply chain financing
6252
46
010203040506070
2012 2013 2014
Days Sales Outstanding
76
8690
60
70
80
90
100
2012 2013 2014
Days Payables Outstanding
33
29 30
2728293031323334
2012 2013 2014
Days Inventory Outstanding
19
-4-14
-30-20-10
0102030
2012 2013 2014
Cash Conversion Cycle (1)
USE LESSEARN MORE INVEST WISELY
STRONGER BALANCE SHEET, BALANCED CASH-USE PRIORITIESSTRONGER BALANCE SHEET, BALANCED CASH-USE PRIORITIES
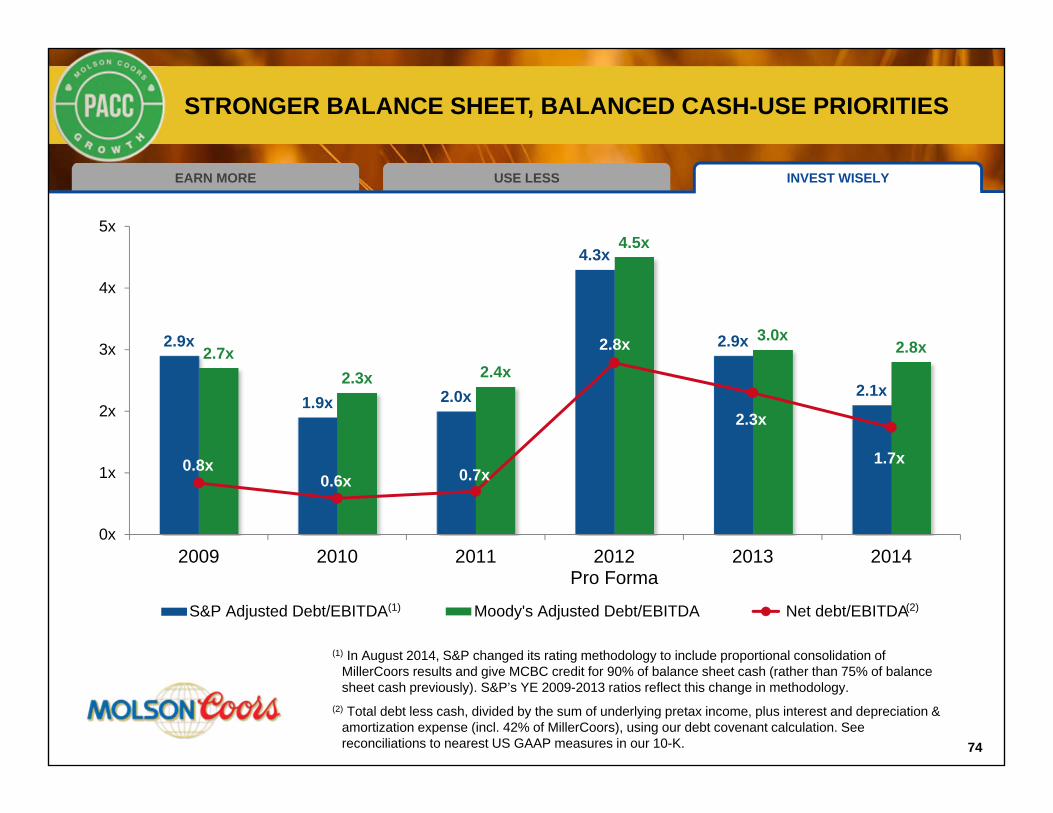
2.9x
1.9x 2.0x
4.3x
2.9x
2.1x
2.7x2.3x 2.4x
4.5x
3.0x2.8x
0.8x0.6x 0.7x
2.8x
2.3x
0x
1x
2x
3x
4x
5x
2009 2010 2011 2012Pro Forma
2013 2014
S&P Adjusted Debt/EBITDA Moody's Adjusted Debt/EBITDA Net debt/EBITDA
1.7x
(2)(1)
74
(1) In August 2014, S&P changed its rating methodology to include proportional consolidation of MillerCoors results and give MCBC credit for 90% of balance sheet cash (rather than 75% of balance sheet cash previously). S&P’s YE 2009-2013 ratios reflect this change in methodology.
(2) Total debt less cash, divided by the sum of underlying pretax income, plus interest and depreciation & amortization expense (incl. 42% of MillerCoors), using our debt covenant calculation. See reconciliations to nearest US GAAP measures in our 10-K.
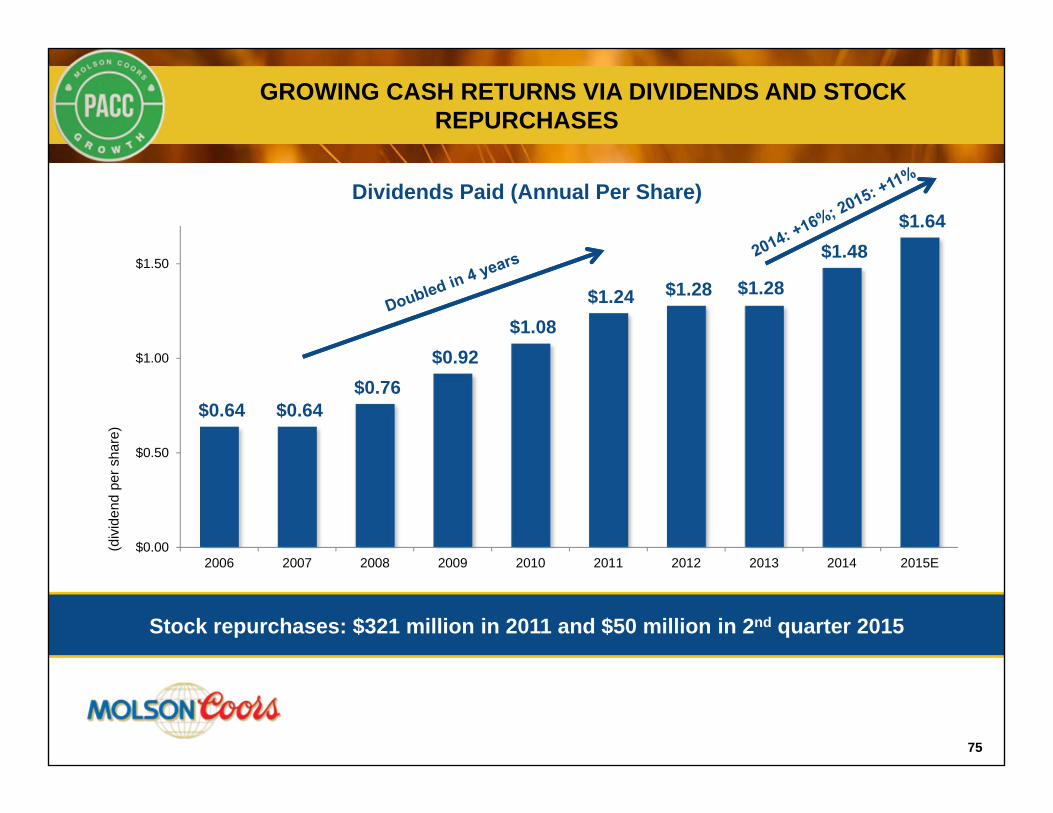
$0.64 $0.64 $0.76
$0.92 $1.08
$1.24 $1.28 $1.28
$1.48 $1.64
$0.00
$0.50
$1.00
$1.50
2006 2007 2008 2009 2010 2011 2012 2013 2014 2015E
(div
iden
d pe
r sha
re)
Dividends Paid (Annual Per Share)
75
GROWING CASH RETURNS VIA DIVIDENDS AND STOCK REPURCHASES
GROWING CASH RETURNS VIA DIVIDENDS AND STOCK REPURCHASES
Stock repurchases: $321 million in 2011 and $50 million in 2nd quarter 2015

USE LESSEARN MORE INVEST WISELY
76
DISCIPLINED CASH USEDISCIPLINED CASH USE
Cash use priorities
1. Strengthen balance sheet by reducing liabilities• 2014: $796 million reduction in net debt, $75 million of pension contributions(1)
• 2015: $227 million discretionary U.K. pension contribution and $73-93 million of other pension contributions globally(1)
2. Return cash to shareholders• 11% increase in dividend 1st Quarter 2015• New $1 billion, four-year share repurchase program -- $50 million in 2nd quarter
3. Brand-led growth opportunities • Mount Shivalik Breweries in India• Staropramen in the U.K.• Increased marketing investments in Latin America
(1) Includes 42% of MillerCoors pension contributions
Consistent return-driven criteria, anchored by PACC
77
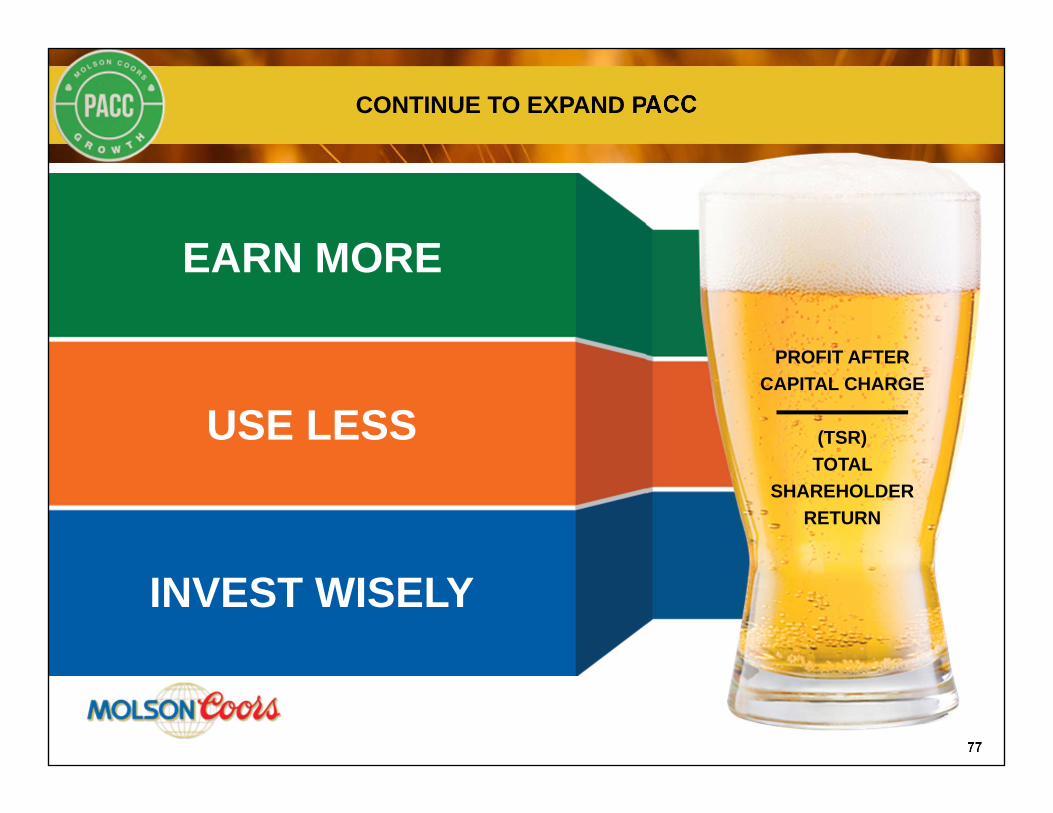
CONTINUE TO EXPAND PACCCONTINUE TO EXPAND PACC
PROFIT AFTERCAPITAL CHARGE
(TSR)TOTAL
SHAREHOLDER RETURN
EARN MORE
INVEST WISELY
USE LESS
BRAND-LED PROFITGROWTH
CASH AND CAPITAL ALLOCATION
CASHGENERATION
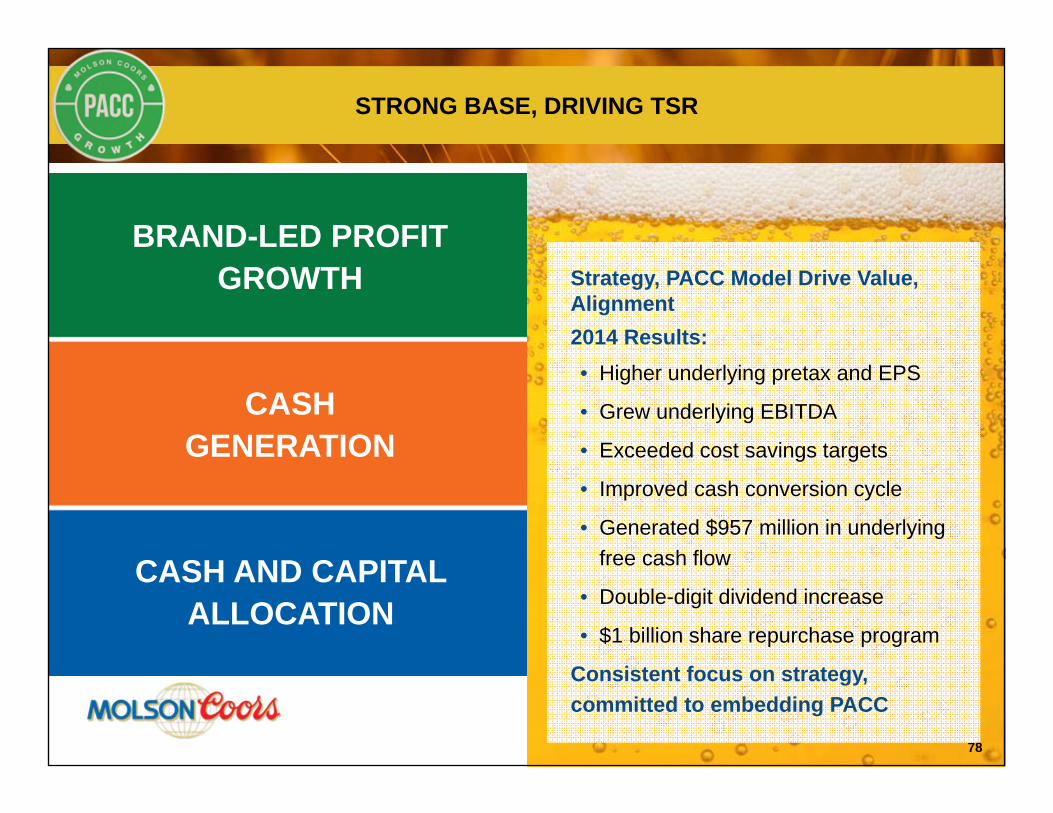
STRONG BASE, DRIVING TSRSTRONG BASE, DRIVING TSR
78
Strategy, PACC Model Drive Value, Alignment2014 Results: • Higher underlying pretax and EPS
• Grew underlying EBITDA
• Exceeded cost savings targets
• Improved cash conversion cycle
• Generated $957 million in underlying free cash flow
• Double-digit dividend increase
• $1 billion share repurchase program
Consistent focus on strategy, committed to embedding PACC

79
MARK HUNTER, PRESIDENT & CEO MOLSON COORS BREWING COMPANY
MARK HUNTER, PRESIDENT & CEO MOLSON COORS BREWING COMPANY

80
WELL POSITIONED TO DELIVER GROWTH & TOTAL SHAREHOLDER VALUE
WELL POSITIONED TO DELIVER GROWTH & TOTAL SHAREHOLDER VALUE
• Investing behind core brands• Driving share in above premium• Delivering value-added innovation• Commercial excellence
• Cost reductions• Capital expenditure driving
efficiencies• Working Capital improvements• Sale of non-core assets
• Disciplined cash use• Return-driven criteria• Balanced priorities
PROFIT AFTERCAPITAL CHARGE
(TSR)TOTAL
SHAREHOLDER RETURN
BRAND-LED PROFIT
GROWTH
CASH AND CAPITAL
ALLOCATION
CASHGENERATION
M O L S O N C O O R S B R E W I N G C O M PA N Y 2 0 1 5 N E W Y O R K I N V E S T O R / A N A LY S T M E E T I N G
J U N E 1 7 , 2 0 1 5
81