Global Transport Scenarios 2050
76
Global Transport Scenarios 2050 World Energy Council Project Partners IBM Corporation Paul Scherrer Institute
Transcript of Global Transport Scenarios 2050
Global Transport Scenarios 2050
World Energy Council Project Partners
IBM Corporation Paul Scherrer Institute
Officers of the World Energy Council
Pierre Gadonneix
Chair
Abubakar Sambo
Vice Chair, Africa
Liu Tie’nan
Vice Chair, Asia
Arup Roy Choudhury
Vice Chair, Asia Pacific & South Asia
Johannes Teyssen
Vice Chair, Europe
José Antonio Vargas Lleras
Vice Chair, Latin America/Caribbean
Abbas Ali Naqi
Vice Chair, Special Responsibility for Middle East &
Gulf States
Kevin Meyers
Vice Chair, North America
Heon Cheol Shin
Vice Chair, Daegu Congress 2013
Marie-José Nadeau
Chair, Communications & Outreach Committee
Graham Ward, CBE
Chair, Finance Committee
Michael Morris
Chair, Programme Committee
Brian Statham
Chair, Studies Committee
Christoph Frei
Secretary General
Global Transport Scenarios 2050
World Energy Council
Copyright © 2011 World Energy Council
All rights reserved. All or part of this publication may be used or
reproduced as long as the following citation is included on each
copy or transmission: ‘Used by permission of the World Energy
Council, London, www.worldenergy.org’
Published 2011 by:
World Energy Council
Regency House 1-4 Warwick Street
London W1B 5LT United Kingdom
ISBN: 978-0-946121-14-4
Global Transport Scenarios 2050
Global Transport Scenarios 2050 World Energy Council
1
Walter Böhme, Austria
Pietro Erber, Brazil
Renata Szczerbacki, Brazil
Lyudmil Kostadinov, Bulgaria
Terry Kimmel, Canada
Karim Kassam, Canada
Lesme Corredor Martinez, Colombia
José Maboya Nzalingo, Congo (DR)
Hans Larsen, Denmark
Georges Bouchard, France
Igor Czerny, France
Alain Le Duigou France
Pierre Sigonney, France
Alain Bucaille, France
Jean Eudes Moncomble , France
Simon Vinot, France
Enno Harks, Germany
Matthias Kirner, Germany
Kerstin Mayr, Germany
Alexander Stöhr , Germany
Christian Hahn, Germany
Ved Mitra, India
Anil Bakshi, India
Philip Thomas, India
Prakash Sharma, India
Antonio De Bellis, Italy
Davide Moroni, Italy
Andrea Zara, Italy
Federico Caleno, Italy
Kaoru Horie, Japan
Junhaeng Jo, Korea (Republic)
Rodolfo Lacy, Mexico
Pinehas Mutota , Namibia
Barry Blackett, New Zealand
Eli Bala, Nigeria
Mohammed Bello, Nigeria
Gabriela Prata Dias, Portugal
Alexandru Sandulescu, Romania
Ionut Purica, Romania
Alison von Ketelhodt, South Africa
Heloise Nel, South Africa
Jaime Gutiérrez, Spain
Almudena Rosas, Spain
Gunnar Bengtsson, Sweden
Jochen Kreusel, Switzerland
Abdelhamid Khalfallah, Tunisia
Sarper Saragöglu, Turkey
Martin Haigh, United Kingdom
Helen El-Mallakh, United States
Project Partner – Paul Scherrer Institute
Philipp Dietrich, Switzerland
Hal Turton, Switzerland
Martin Densing, Switzerland
Project Partner – IBM Corporation
Irina Bychkova, United Kingdom
Clay Luthy, United States
Sundar Iyer, United Kingdom
Steve Edwards, United Kingdom
Michael Valocchi, United States
Project Team
Christoph Frei, WEC, Secretary General
Karl Rose, WEC, Director Policy and Scenarios
Ayed Al-Qahtani, WEC, Senior Project Manager
Brian Statham, South Africa
Suduk Kim, Korea (Republic)
Knowledge Network Members

Global Transport Scenarios 2050 World Energy Council
2
Global Transport Scenarios 2050 World Energy Council
3
Content
Content 3
Executive Summary 4
1. Introduction 7
1.1 Background 7
1.2 Study Goals 7
1.3 Study Approach 8
2. Overview of Global Transport Sector 9
3. Driving Forces 12
3.1 Economic Growth 12
3.2 Demographic Trends 13
3.3 Urbanization and Megacities 15
3.4 Geopolitics 17
3.5 Global Oil Reserve and Supply 18
3.6 Environmental and Health Concerns 19
3.7 Policies and Regulations 19
3.8 Lifestyle Changes 21
3.9 Alternative Fuels 22
3.10 Fuel Efficiencies 25
3.11 Innovations 26
3.12 Summary 28
4. Critical Uncertainties 29
4.1 Government Regulation 29
4.2 Cooperation-Integration 29
5. Transport Scenarios 31
5.1 Freeway 31
5.2 Tollway 32
6. Regional Considerations 34
6.1 Africa and the Middle East 34
6.2 Asia 36
6.3 Europe and Russia 41
6.4 North America 43
6.5 Latin America and the Caribbean (LAC) 46
7. Modelling and Quantification 49
7.1 Model Overview 49
7.2 Modelling Results 53
7.3 Results for Freeway 53
7.4 Results for Tollway 56
7.5 Scenario Comparisons on a
Global Level 60
8. Conclusions 65
Glossary 68
Figures and Tables 69
Appendices 71

Global Transport Scenarios 2050 World Energy Council
4
Over the next four decades, the global transportation
sector will face unprecedented challenges related
to demographics, urbanization, pressure to
minimize and dislocate emissions outside urban
centres, congestion of aging transport
infrastructure and growth in fuel demand. These
challenges will all be compounded by uncertainties
emerging from government intervention and
regulation. Regional and global cooperation,
unstable global economic situations, and potential
technological breakthroughs will all have a
significant impact. In light of these challenges and
the levels of uncertainty, the World Energy Council
(WEC) decided to re-examine the future of the
transport and mobility sector by building Global
Transport Scenarios to 2050. These scenarios will
describe potential developments in transport fuels,
technologies, and mobility systems over the course
of the next forty years. Undoubtedly, the evolution
of the transport world between 2010 and 2050 will
offer many challenges, the biggest of which is
providing sustainable transport for the seven to
nine billion people at the lowest social cost
possible. These scenarios show that government
policies will play a critical role in determining the
most likely pathway into the future.
The World Energy Council believes that
constructive dialogue between national and local
policy makers, manufacturers, consumers and
producers will be essential if we are to meet these
challenges. Only with discovery, promotion and
development of new energy resources, matched to
innovation and improvements in current
technologies, catalysed by optimally formulated
policies can we hope to ensure a more sustainable
transport future for current and future generations.
Now is the time for strong leadership at both
government and enterprise levels if the transport
sector is to make a positive contribution towards
the well-being of future generations.
Regional inputs on transport policies, existing and
potential developments in both fuels and
technologies, in addition to major driving forces and
critical uncertainties were all examined and
combined into two distinct transport scenarios
“Freeway” and “Tollway.” The main difference
between these two scenarios is the degree and
style of government intervention in regulating future
transport markets.
The “Freeway” scenario envisages a world
where pure market forces prevail to create a
climate for open global competition.
The “Tollway” scenario describes a more
regulated world where governments decide to
intervene in markets to promote technology
solutions and infrastructure development that
put common interests at the forefront.
The Freeway and Tollway scenarios describe the
extreme ends of the potential futures envelope.
The reality will inevitably be between these two
scenarios with regional differences playing a major
role.
In quantifying these two scenarios, we noted that
by 2050:
Total fuel demand in all transport modes will
increase by 30% (Tollway) to 82% (Freeway)
above the 2010 levels. The growth in fuel
Executive Summary
Global Transport Scenarios 2050 World Energy Council
5
demand will be driven mainly by trucks,
buses, trains, ships, and airplanes.
Transport sector fuel mix will still depend
heavily on gasoline, diesel, fuel oil and jet
fuel, as they all will still constitute the bulk of
transport market fuels with 80% (Tollway) to
88% (Freeway) in 2050.
Demand for these major fuels will increase
by 10% (Tollway) to 68% (Freeway) over the
scenario period.
Demand for diesel and fuel oil will grow by
46% (Tollway) to 200% (Freeway).
Demand for jet fuel will grow by 200%
(Tollway) to 300% (Freeway).
Demand for gasoline is expected to drop by
16% (Freeway) to 63% (Tollway).
Biofuels will also help to satisfy the demand for
transport fuel as their use will increase almost four
fold in both scenarios. Other fuels including
electricity, hydrogen, and natural gas will increase
six to seven fold.
The additional transport fuel demand will come
from the developing countries (especially China
and India) where demand will grow by 200%
(Tollway) to 300% (Freeway). In contrast, the
transport fuel demand for the developed countries
will drop by up to 20% (Tollway). The demand of
the developing countries is expected to surpass
that of the developed ones by the year 2025, if not
earlier.
The total number of cars in the world is also
expected to increase 2.2 times (Tollway) to
2.6 times (Freeway), mainly in the developing
world, where the number of cars will increase
by 430% (Tollway) to 557% (Freeway) while
the developed countries will see an increase
of only 36% (Tollway) to 41% (Freeway).
At the end of the scenario period (2050) we
expect conventional gasoline and diesel
internal combustion engines (ICEs) to have a
market share between 26% (Tollway) and
78% (Freeway). Other drive-train technologies
will make up the rest with liquid hybrid, plug-
ins, and electric vehicles leading in Tollway,
while liquid hybrids, plug-ins and gas vehicles
lead in Freeway.
The scenarios also show significant regional
differences, with shale gas being a driver for
natural gas fuelled transport in North America,
biofuels with a continued high contribution in Latin
America, and electric mobility having a particularly
strong push in Asia/China where the growth of
megacities is most dramatic.
In 2010, the CO2 emissions from the transport
sector were about 23% of global CO2 emission
levels and emissions from cars were about 41% of
total transport emissions. With the higher levels of
transport demand, and depending on the fuel mix:
The total CO2 emissions from the
transportation sector is expected to increase
between 16% (Tollway) and 79% (Freeway),
depending mainly on the degree of the
government intervention and success in
advancing low carbon fuel systems.
Global Transport Scenarios 2050 World Energy Council
6
With this picture of the transport sector in 2050,
and in light of the major drivers, WEC believes that
the global transport sector can overcome the many
challenges of meeting the global transport demand
in the context of the Energy Trilemma. The biggest
challenge will be to provide sustainable transport
for the seven to nine billion people with the
minimum possible congestion, pollution, and noise
generated by additional traffic and freight.
Understanding the dynamics and magnitude of
these likely future developments can offer
consumers, entrepreneurs, governments, and
private businesses the opportunity to adjust their
future plans and expectations.
WEC has no doubt that the starting of a
dialogue among concerned stakeholders, the
discovery of additional conventional and
unconventional energy resources, the
expansion in the use of renewables, the
improvements in technologies, and the
selection of optimal policies tailored to suit
each region’s needs will all ensure a
sustainable transport future and will raise the
quality of life for current and future
generations.
Global Transport Scenarios 2050 World Energy Council
7
1.1 Background
The global transportation sector will face several
unprecedented challenges over the next four
decades (2010 through 2050). The world’s
population is expected to increase by 2.2 billion,
reaching 9.2 billion, with more than two-thirds of
the population living in cities compared to about
half the population of today. In addition, the number
of megacities is expected to increase from today’s
22 to between 60 and 100 megacities by 2050.
Many of these megacities, emerging mostly in Asia,
Africa, and Latin America, will face high levels of
traffic congestion, pollution, and noise.
Furthermore, such an effect will be amplified by the
two to three billion cars and trucks that could be in
circulation. Over the same period, travel and road
freight will at least double due to increased demand
for transport, along with both economic
development and improvements in standards of
living.
Driven by increases in all travel modes, some
sources expect the energy consumption of the
transport sector to increase by between 80% and
130% above today’s level. In addition, the transport
sector alone could consume more than one third of
global energy supplies (including more than half of
all oil produced). Most of this demand is expected
to come from regions undergoing strong economic
and population growth (China, India, Russia, Latin
America, and the Middle East).
Challenges relating to population demographics,
urbanization, traffic congestion, local pollution,
noise, and economics will all be compounded by
uncertainties emerging from the unpredicted
degree of government intervention and/or
regulations, regional and global cohesions or
cooperation, unpredicted global economic
situations, and potential technology breakthroughs.
In light of these challenges and uncertainties, the
transport industry faces profound questions about
how transport technologies and solutions could
emerge in the next four decades, and how these
may be able to satisfy the coming additional
transport demands.
1.2 Study Goals
Capitalizing on the successful projects conducted
in 1995, 1998 and 2007, the World Energy Council
(WEC) has again decided to examine the future
relationship between energy and transport, building
Global Transport Scenarios out to 2050. This effort
is undertaken in parallel with, and under the
umbrella of, an energy scenarios exercise, but
focuses solely on the transport sector. The aim of
this project is to construct and describe potential
global transport scenarios that reflect potential
developments in transport fuels, technologies, and
systems over the course of the next four decades.
The scenario approach has been adopted to
describe the future of transport because other
approaches, including long-term forecasting, are
regarded as insufficient or even inadequate for
addressing the vast uncertainties surrounding the
world of transport. Unlike other tools, scenarios
provide a set of plausible stories about different
possible futures, taking into account uncertainties,
critical factors, and driving forces. Furthermore,
these internally consistent stories are intended to
stimulate creativity in a challenging and yet
1. Introduction

Global Transport Scenarios 2050 World Energy Council
8
plausible way. They are not to be considered as
forecasts or exact quantification tools, but rather as
instruments for learning.
1.3 Study Approach
To achieve this goal, WEC assembled a team on
transport comprising 54 members from 29
countries. The first objective of the team was to
identify and evaluate existing and potential fuel and
transport technologies, both qualitatively and
quantitatively. The qualitative assessment was
intended to address current and potential
developments in global transport systems at
national and/or regional levels. The team used
available information from completed and ongoing
WEC studies and from proprietary and publicly
available sources. To form the foundation for the
study, the team also used case studies and
quantified examples of available and emerging
technologies and enabling policies. All this
information was then compiled into a 150-page
background document, which formed input for the
scenarios on technologies, fuels, and transport
systems.
Regional inputs on transport policies, local issues,
and major driving forces were gathered during a
series of regional workshops held, in
Johannesburg, Bangkok, London, Thessaloniki,
Washington D.C., and Rio de Janeiro. A series of
transport questions was prepared for each
workshop and discussed with local experts and
WEC member committees. The insights from these
workshops helped to form the assumptions for the
development of transport scenarios through a
bottom-up approach.
During a scenario-building workshop in London the
information developed so far was used to create a
working draft of two transport scenarios, looking
out to 2050. The working titles of the scenarios are
“Freeway” and “Tollway”.
To complete the study’s quantification
requirements, WEC identified and commissioned
the Paul Scherrer Institute (PSI) in Switzerland as a
modelling partner. The two scenarios, along with
the developed regional inputs, were translated into
numeric assumptions and fed into PSI’s transport
model.
This report starts with an overview of the global
transport sector, along with discussion of the
related major driving forces, constraints, and
uncertainties. This is followed by descriptions of the
two scenarios, Freeway and Tollway, and the
regional inputs. The remainder of the report
comprises the modelling results, concluding with
key messages extracted from these results.

Global Transport Scenarios 2050 World Energy Council
9
Figure 1 2010 transport energy by source and by mode (total ~2,200 Mtoe) Source: WEF, Repowering Transport, 2011
46%
32%
10%
8%
1%2% 1%
Gasoline
Diesel
Jet
Residual
LPG/CNG
Biofuels
Electricity
52%
17%
4%
10%
10%
3% 3%
LDV
Truck
Bus
Aviation
Marine
Rail
Other
In 2010, the global transport sector consumed
about 2,200 million tons of oil equivalent (mtoe),
constituting about 19% of global energy supplies.
As Figure 1 shows, about 96% of this amount
came from oil, while the rest was from natural gas,
biofuels, and electricity. More than 60% of the oil
consumed globally (around 51 million barrels per
day) goes to the transportation sector. As the
figure shows, road transport accounts for the bulk
(around 76%) of the transportation energy
consumption. The light-duty vehicles (LDVs),
including light trucks, light commercial vehicles,
and minibuses accounted for about 52%, while
trucks, including medium- and heavy-duty,
accounted for 17%. The remaining share of road
transport was covered by full-sized buses (4%)
and two-three wheelers (3%). Air and marine each
accounted for about 10% of total transport energy
consumption, while the railways accounted for
only 3%.
Looking at these shares over a longer period of
time, Figure 2 shows that road transport has
always dominated the transport sector, followed by
aviation and shipping.
Between1990–2006, global transport energy use
grew at an average of about 1.8% a year for OECD
countries, and about 2.8% for non-OECD countries
(Table 1). As Table 1 shows, during this period,
growth rates of transport energy use in OECD
countries rose fastest for international aviation,
followed by international shipping. For non-OECD
countries, the fastest-growing energy use was by
international shipping, followed by road transport
(LDVs, trucks, buses, and two-three wheelers).
However, looking at transport’s energy
consumption in more recent years, for example,
between 2000 and 2006, it is clear that trends have
significantly changed, since average growth for this
period was about 1.2% for OECD countries and
about 4.3% for non-OECD countries. The fastest-
growing energy use in OECD countries was by
international shipping, followed by rail, while for the
non-OECD countries, the fastest growing energy
use was international shipping, followed by
international aviation, and then road transport.
2. Overview of Global Transport Sector

Global Transport Scenarios 2050 World Energy Council
10
Table 1 Growth rates of transport energy use 1990–2006 Source: IEA, Transport, Energy and CO2, 2009
Ty
pe
o
f t
ran
sp
ort
OECD Non-OECD
Year period 90-95 95-00 00-06 90-06 90-95 95-00 00-06 90-06
International aviation 4.4% 5.0% 1.2% 3.4% -0.6% 1.7% 4.7% 2.1%
Domestic aviation -0.2% 2.5% -0.3% 0.6% -0.5% 4.9% 3.0% 2.5%
Road 2.3% 2.1% 1.4% 1.9% 2.5% 2.9% 4.2% 3.3%
Rail -0.1% -0.3% 2.3% 0.7% -4.4% 2.9% 2.3% 0.3%
International marine bunkers 1.1% 2.3% 2.5% 2.0% 4.6% 3.9% 5.4% 4.7%
Domestic navigation 0.8% 0.5% -1.0% 0.0% -2.6% 6.5% 4.0% 2.6%
Transport sector 2.1% 2.1% 1.2% 1.8% 1.1% 2.6% 4.3% 2.8%
Clearly, this growth in the use of transport energy
closely follows the economic and population growth
in the various regions. According to the World
Bank, growth in real Gross Domestic Product
(GDP) between 2000 and 2006 for OECD and non-
OECD countries was 2.5% per year and 4.9% per
year, respectively. As for population growth, over
the same period, the World Bank stated that the
OECD’s population grew by 0.7% per year, while
the non-OECD population grew by about 1.5% per
year. If income and population continue to rise in
the non-OECD countries, then it is likely that there
will be a rapid growth in transport energy use. In
contrast, for OECD countries, there are indications
of saturation in certain travel modes such as LDV,
since vehicle ownership seems to slow down
despite economic growth cycles. Economic and
population growth and the outlook of energy
demand will be discussed further later in this
report.
Despite steady growth in global energy use, various
regions and countries show not only different
energy-use growth rates per transport mode, but
also different patterns in terms of both energy use
per capita and type of fuel used (Figure 3). Some
regions such as North America (except Mexico)
consumed an average of over 2,300 tons of oil
equivalent (mtoe) per 1,000 people in 2007, while
others, such as parts of Africa, averaged less than
100 toe per 1,000 people. The figure also shows
that OECD-North America, OECD-Pacific and
Middle East depend heavily on gasoline as a
transport fuel, while OECD-Europe, China, and
Latin America depend heavily on diesel.
Figure 2
Global transport final energy use by mode (Mtoe)* Source: IEA, Energy Technology Perspectives, 2010
Non-specified
(transport)
Pipeline transport
World aviationbunkers
Domestic aviation
World marinebunkers
Domesticnavigation
Rail
Road freight
Road passenger
2500
2000
1500
1000
500
0
Mto
e
19
71
19
73
19
75
19
77
19
79
19
81
19
83
19
85
19
87
19
89
19
91
19
93
19
95
19
97
19
99
20
01
20
03
20
05
20
07
Note: 1 toe = 6.5 to 7.9 boe, depending on the type of oil
Global Transport Scenarios 2050 World Energy Council
11
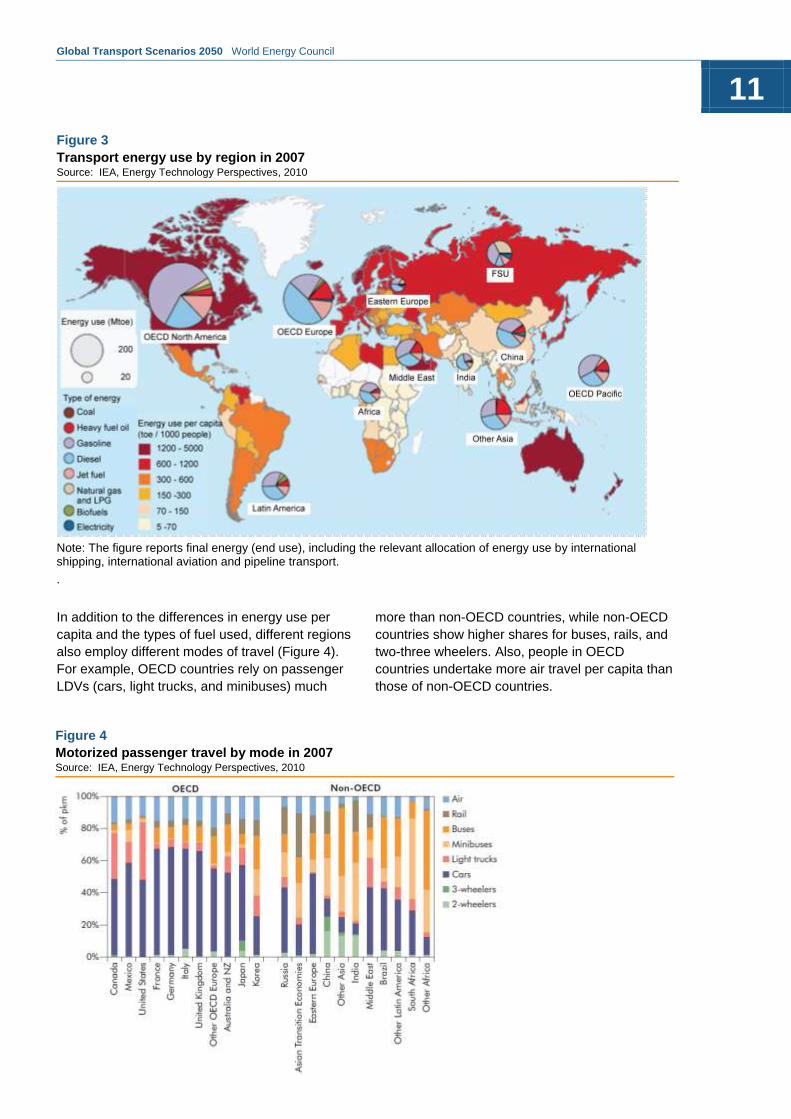
Figure 4
Motorized passenger travel by mode in 2007 Source: IEA, Energy Technology Perspectives, 2010
In addition to the differences in energy use per
capita and the types of fuel used, different regions
also employ different modes of travel (Figure 4).
For example, OECD countries rely on passenger
LDVs (cars, light trucks, and minibuses) much
more than non-OECD countries, while non-OECD
countries show higher shares for buses, rails, and
two-three wheelers. Also, people in OECD
countries undertake more air travel per capita than
those of non-OECD countries.
Figure 3
Transport energy use by region in 2007 Source: IEA, Energy Technology Perspectives, 2010
Note: The figure reports final energy (end use), including the relevant allocation of energy use by international shipping, international aviation and pipeline transport.
.

Global Transport Scenarios 2050 World Energy Council
12
The two main drivers for energy demand in
general, and transport specifically, are global
economic and population growth. Indeed, demand
growth could be constrained by geopolitical
dynamics which can limit, in some cases, the
supply of energy resources, and by concerns
surrounding environmental and health issues. In
response to these constraints, both consumers and
governments are expected to take action to alter
consumption lifestyles and introduce new
regulations. Moreover, industries will respond with
technological improvements, mainly in fuel
efficiencies and alternative fuels. In this section, we
address these driving forces, constraints, and
responses in greater detail.
3.1 Economic Growth
The principal driver of demand for all energy
sources is economic growth, namely the rate of
GDP growth. In response to recent global financial
and economic crises, most large economies
introduced fiscal stimulus packages, involving tax
reductions or spending increases, between late
2008 and mid-2009. Although these packages
have helped mitigate the effects of the crises, they
have also led to a ballooning of budget deficits and
a sharp rise in national debt in many countries,
especially in the OECD. Now many of these
countries are faced with a need to tackle these
debt problems. The fear remains that cutting debts
may result in a slowdown of economic recovery
(leading to a recession and debt spiral).
With growth prospects in the OECD countries likely
to remain relatively weak for several years as they
grapple with rising national debt, the emerging
economies will remain the main drivers of the
global economic recovery. The International
Monetary Fund (IMF) suggests that the “sustained
rapid growth” in the non-OECD countries will hinge
on their ability to absorb rising inflows of capital
and nurture domestic demand without triggering a
new boom–bust cycle. In addition, the IMF
acknowledges that the outlook for economic activity
remains unusually uncertain, and risks are
generally to the downside.
The risks to growth associated with the surge in
public debt in the advanced economies are the
most obvious, especially with respect to market
concerns about sovereign liquidity and solvency in
a few European countries (i.e., Greece, Italy,
Spain, and Portugal), and the danger that these
concerns could evolve into a full-blown and
contagious sovereign debt crisis. The International
Energy Agency (IEA) also expects that banks’
exposure to toxic assets (mortgages and
household debt) could also threaten further turmoil
in financial markets, particularly in the US and
Europe.
The IEA’s outlook on economic growth assumes
that the world economy will grow at an average of
4.4% per year over the years 2010 to 2015.
According to the IEA, these growth assumptions
are based on the IMF’s projections from the July
2010 update of its World Economic Outlook, with
some adjustments made according to more recent
information available for the OECD and other
countries from national and other sources (Table 2).
Over the longer term, the rate of growth is
assumed to slow, as emerging economies mature
3. Driving Forces

Global Transport Scenarios 2050 World Energy Council
13
and their growth rates converge with those of the
OECD economies. As the table shows, the IEA
expects that world GDP will grow by an average of
3.2% per year over the period 2008–2035, which is
very similar to the rate between 1980 and 2008.
The non-OECD countries as a group are assumed
to continue to grow more rapidly than the OECD
countries, driving up their share of world GDP. In
several leading non-OECD countries, a
combination of important macroeconomic and
microeconomic reforms, including trade
liberalization, more credible economic
management, and regulatory and structural reforms
have improved the investment climate and the
prospects for strong long-term growth.
As a result of demographic factors and its state
economic development, India is expected to
overtake China in the 2020s and become the
fastest growing region/country. Nevertheless,
India’s growth is expected to slow down from 8.1%
in 2010–2015 to 5.6% in 2015–2035, while China’s
growth rate is expected to slow down from 9.5% in
2010–2015 to 3.9% in 2020–2035, less than half
the rate at which it had been growing in recent
years. Among the OECD regions, North America is
expected to grow the fastest, at 2.1% per year on
average over the projected period, sustained by
more rapid growth in its population and labour
force, and its lower debt in comparison with Europe
and the Pacific region. Over the period 2008–2035,
the IEA’s base-case scenario expects economic
growth to slow down in OECD and non-OECD
regions, reaching 1.8% per year for OECD and
4.6% for the non-OECD.
3.2 Demographic Trends
Another critical driver for energy use is population
growth. The United Nations projects the world’s
population to grow by 0.9% per year on average,
from an estimated 6.9 billion in mid-2010, to 8.5
billion in 2035, and 9.2 billion by 2050. The
population growth is expected to slow progressively
over the projected period, in line with the long-term
historical trend, from 1.1% per year in 2008–2020
to 0.7% in 2020–2035 (Table 3). In fact, the world’s
population has expanded by 1.7% per year from
1980 to 1990, and then by 1.3% per year between
1990 and 2008.
As the table shows, this population growth will not
be evenly distributed, with most of the growth
occurring in Africa, China, India, and parts of Latin
Table 2 Real GDP growth by region (compounded average annual growth rates) Source: International Monetary Fund and World Bank databases
1980–1990 1990–2008 2008–2020 2020–2035 2008–2035
OECD 3.0% 2.5% 1.8% 1.9% 1.8%
North America 3.1% 2.8% 2.1% 2.2% 2.2%
US 3.2% 2.8% 2.0% 2.1% 2.1%
Europe 2.4% 2.2% 1.5% 1.8% 1.6%
Pacific 4.3% 2.1% 1.7% 1.2% 1.5%
Japan 3.9% 1.2% 1.0% 1.0% 1.0%
Non-OECD 3.3% 4.7% 5.6% 3.8% 4.6%
East Europe 4.0% 0.8% 3.0% 3.1% 3.1%
Caspian - 2.0% 4.6% 3.2% 3.8%
Russia - 0.6% 2.9% 3.1% 3.0%
Asia 6.6% 7.4% 7.0% 4.2% 5.4%
China 9.0% 10.0% 7.9% 3.9% 5.7%
India 5.6% 6.4% 7.4% 5.6% 6.4%
Middle East -1.3% 3.9% 4.0% 3.8% 3.9%
Africa 2.3% 3.8% 4.5% 2.8% 3.5%
Latin America 1.2% 3.5% 3.3% 2.7% 3.0%
Brazil 1.5% 3.0% 3.6% 3.1% 3.3%
World 3.1% 3.3% 3.6% 2.9% 3.2%

Global Transport Scenarios 2050 World Energy Council
14
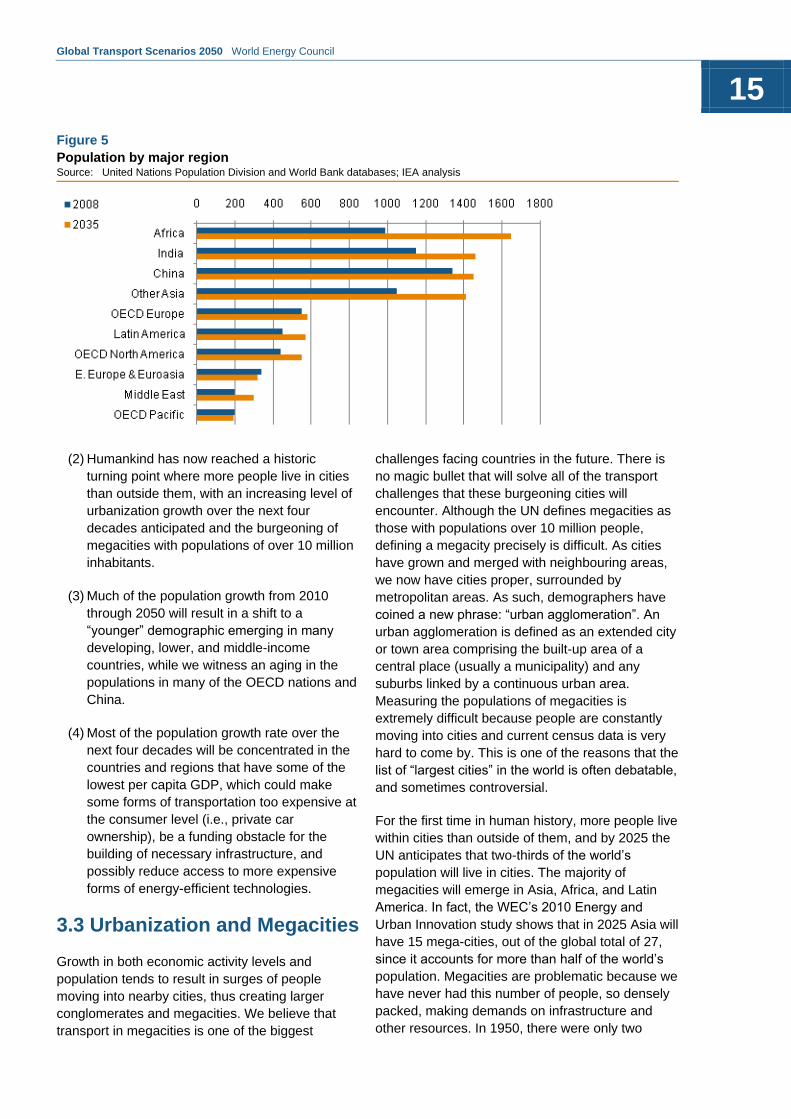
America. The increase in global population is
expected to occur overwhelmingly, in non-OECD
countries, mainly in Asia (China and India), and
Africa (Figure 5).
The non-OECD population is expected to expand
from 5.5 billion in 2008 to 7.2 billion in 2035 (its
global share rising from 82% to 85%), which is the
equivalent of an average growth rate of 1% per
year. As the figure shows, Africa is expected to see
the fastest rate of growth of about 1.9% per year.
India is expected to overtake China towards the
end of the projected period, and become the
world’s most populated country with 1.47 billion
people.
Over the same period, the population of the OECD
countries is expected to grow by only 0.4% per
year. Most of the increase in the OECD occurs in
North America, while the population of Europe will
grow slightly. In contrast, the population in the
OECD Pacific region is expected marginally to fall.
The United Nation’s Population Division expects
that all of the increase in world population will occur
in urban areas, and the rural population will decline
in most regions. It is worth noting that the world’s
urban population surpassed the rural population in
2009. The population living in urban areas is
projected to grow from 3.3 billion in 2008 to 5.2
billion 2035 (an increase of about 1.9 billion), with
most of this increase occurring in non-OECD
countries. Continuing rapid urbanization will push
up demand for modern energy services and
transportation infrastructures.
Such developments in population and hence
demographics (household size and composition,
and age structure) will have profound implications
on the future of transport technologies and fuels,
and even greater impacts on public policies that
shape transport choices and options. In general,
there are four global trends relating to population
and/or transport that are anticipated to have the
most significant impacts on transport future. These
trends and their impacts are:
(1) The countries currently experiencing the
highest population growth levels now have
relatively low motorization levels in their
current transport sectors, and often transport
inequality between urban and rural
populations and between rich and poor.
Table 3 Population growth by region (compounded average annual growth rates) Source: United Nations Population Division and World Bank databases
1980–1990 1990–2008 2008–2020 2020–2035 2008–2035
OECD 0.8% 0.7% 0.5% 0.3% 0.4%
North America 1.2% 1.2% 0.9% 0.6% 0.7%
US 0.9% 1.1% 0.9% 0.6% 0.7%
Europe 0.5% 0.5% 0.3% 0.1% 0.2%
Pacific 0.8% 0.4% 0.0% -0.3% -0.1%
Japan 0.5% 0.2% -0.2% -0.6% -0.4%
Non-OECD 2.0% 1.5% 1.2% 0.8% 1.0%
East Europe 0.8% -0.2% -0.1% -0.2% -0.2%
Caspian - 0.8% 1.0% 0.6% 0.7%
Russia - -0.2% -0.4% -0.5% 0.4%
Asia 1.8% 1.4% 1.0% 0.6% 0.8%
China 1.5% 0.9% 0.6% 0.1% 0.3%
India 2.1% 1.6% 1.2% 0.7% 1.0%
Middle East 3.6% 2.3% 1.8% 1.3% 1.5%
Africa 2.9% 2.5% 2.2% 1.7% 1.9%
Latin America 2.0% 1.5% 1.0% 0.6% 0.8%
Brazil 2.1% 1.4% 0.7% 0.3% 0.5%
World 1.7% 1.3% 1.1% 0.7% 0.9%
Global Transport Scenarios 2050 World Energy Council
15
(2) Humankind has now reached a historic
turning point where more people live in cities
than outside them, with an increasing level of
urbanization growth over the next four
decades anticipated and the burgeoning of
megacities with populations of over 10 million
inhabitants.
(3) Much of the population growth from 2010
through 2050 will result in a shift to a
“younger” demographic emerging in many
developing, lower, and middle-income
countries, while we witness an aging in the
populations in many of the OECD nations and
China.
(4) Most of the population growth rate over the
next four decades will be concentrated in the
countries and regions that have some of the
lowest per capita GDP, which could make
some forms of transportation too expensive at
the consumer level (i.e., private car
ownership), be a funding obstacle for the
building of necessary infrastructure, and
possibly reduce access to more expensive
forms of energy-efficient technologies.
3.3 Urbanization and Megacities
Growth in both economic activity levels and
population tends to result in surges of people
moving into nearby cities, thus creating larger
conglomerates and megacities. We believe that
transport in megacities is one of the biggest
challenges facing countries in the future. There is
no magic bullet that will solve all of the transport
challenges that these burgeoning cities will
encounter. Although the UN defines megacities as
those with populations over 10 million people,
defining a megacity precisely is difficult. As cities
have grown and merged with neighbouring areas,
we now have cities proper, surrounded by
metropolitan areas. As such, demographers have
coined a new phrase: “urban agglomeration”. An
urban agglomeration is defined as an extended city
or town area comprising the built-up area of a
central place (usually a municipality) and any
suburbs linked by a continuous urban area.
Measuring the populations of megacities is
extremely difficult because people are constantly
moving into cities and current census data is very
hard to come by. This is one of the reasons that the
list of “largest cities” in the world is often debatable,
and sometimes controversial.
For the first time in human history, more people live
within cities than outside of them, and by 2025 the
UN anticipates that two-thirds of the world’s
population will live in cities. The majority of
megacities will emerge in Asia, Africa, and Latin
America. In fact, the WEC’s 2010 Energy and
Urban Innovation study shows that in 2025 Asia will
have 15 mega-cities, out of the global total of 27,
since it accounts for more than half of the world’s
population. Megacities are problematic because we
have never had this number of people, so densely
packed, making demands on infrastructure and
other resources. In 1950, there were only two
Figure 5
Population by major region Source: United Nations Population Division and World Bank databases; IEA analysis

Global Transport Scenarios 2050 World Energy Council
16
megacities (New York and Tokyo); by 1975, there
were three megacities (Tokyo, New York, and
Mexico City); but by the year 2000, there were 18.
From population estimates for mid-year 2010, this
has risen to 22 megacities, as categorized by the
UN (although some experts think that the number
is closer to 30 megacities today).
We will see the growth of megacities in middle- to
upper-level income countries slow during 2010–
2050. However, the growth rates of megacities in
low- to lower-middle income countries will increase.
Furthermore, the implications are quite significant
for transport, as the megacities that will experience
the greatest growth rates are those currently
classified as less motorized. This means that even
a small increase in motorization levels for these
megacities will have a profound effect on transport
patterns, traffic, and congestion levels.
What will the number of megacities be in 2050?
There is no consensus, but very large ranges.
Some population experts expect that China alone
will have 50 megacities by 2050. Estimates range
between 60 megacities to over 100 megacities by
2050 globally. One of the major reasons why
people migrate toward megacities is for
employment and improved living standards. If
these megacities become so dysfunctional in the
future, some researchers suggest that people will
leave for smaller cities, with improved economic
opportunities and living standards. This theory
would suggest that there is a type of “feedback
loop” for megacities that could limit their size. Other
researchers suggest that our current concept of
megacities will need to be revamped and that
megacities will hold between 25 and 50 million or
more inhabitants. Another point of view on
megacities suggests that there will be major
worldwide declines in population growth due to
economic and other conditions, with megacities
peaking globally in 2050 and becoming “ghost
towns” by 2100. There is even more controversy
over which cities will be on the list by 2050 and in
which order. At some point, these assessments
become less and less valuable because of the
various assumptions used in the modelling.
More salient to this study than the list and ranking
of the largest megacities are the questions of what
types of transport challenges they share and/or will
encounter in the future, including:
(1) playing catch-up with infrastructure;
(2) making multiple forms of transport affordable,
safe, and convenient to the masses;
(3) managing transport for the poor and urban
slums;
(4) reducing congestion, pollution, accidents, and
the overall negative effects on quality of life
for inhabitants; and
(5) trying to change people’s traffic patterns so as
to redistribute demands on infrastructure.
One trend appears clear for transport: megacities
that currently have low levels of motorization are
growing faster relative to megacities with high
levels of motorization. Nearly 60% of the world’s
populations live in less-motorized countries, and 62
of the largest cities in the world are categorized as
less motorized.

Global Transport Scenarios 2050 World Energy Council
17
3.4 Geopolitics
In energy geopolitics, the team has identified two
major geopolitical drivers that could influence the
energy scene during the many decades to come.
These geopolitical drivers include the rise of China
and the potential instability of oil supplies, and
consequently oil prices, from specific regions.
Throughout the past decade, the rapid rise of oil
and commodity prices has been associated, to a
certain extent, with the rise of some emerging
economies that heavily depend on natural
resources. These economies were hit hard when
oil prices fell as a result of the global economic
crisis. In contrast, China appears to be on track for
continued economic growth. As seen earlier,
China’s growth rate has averaged about 10% per
year over the past 20 years, and is expected to
average about 6% per year until 2035. With its
relatively small debt, massive foreign reserves,
competitive manufacturing centres, and growing
consuming base, China is emerging as an
economic powerhouse that is likely to remain
strong over the long term.
China’s emergence as a significant global player
will reshape its relations with the US. Currently,
China is the largest import market and third-largest
export market for the US (creating a trade deficit of
$230 billion in 2009). In addition, China holds
around 23% of the US’s foreign debt (more than
$877 billion). These facts could cause some
bilateral tensions between the US and China in the
longer term. With its unique economic position,
China will surface as a more influential player on
global stage, and is likely to promote and protect its
own interests. Other countries and regions,
especially the US and European Union, will have to
acclimate and accept China’s rising economic and
military influence.
The other geopolitical driver likely to play a major
role in the energy future is the political instability
observed in many oil supply regions. Political
instabilities can potentially reduce, or even
eliminate, oil production, causing disruptions
throughout the global market. Undoubtedly, these
distributions have immediate repercussions on oil
price volatility, which creates serious
consequences for the future of transport in the
longer term. With 80% of the world’s oil supply in
the hands of National Oil Companies(NOCs),
government actions such as investment restrictions
can also reduce real and potential output in many
countries such as Iran, Mexico, Venezuela, Nigeria,
Indonesia, and Russia (Figure 6).
The team also expects that NOCs in resource-rich
countries will continue to rise in power, take more
aggressive positions in partnering with international
oil companies, and limit further access to the
natural resources in their countries. The wealth
generated from this energy resource is expected to
continue supporting the rapid development of many
resource-rich regions, including the Gulf States,
West Africa, Venezuela, and Russia. Unfortunately,
this enormous wealth may exacerbate, in some
cases, the problems often associated with valuable
natural resources, government corruption.
Figure 6
Evolution of oil reserves, production, and consumption between 1989 and 2009 Source: Boeing, Global Geopolitical Trends: An Overview
Global Transport Scenarios 2050 World Energy Council
18
Figure 7
Global oil production (in thousand barrels per day) Source: BP, Statistical Review of World Energy, 2011; EIA, 2010
3.5 Global Oil Reserve and
Supply
Despite the doomsday predictions of the past
decade, the good news is that the world’s
endowment of energy resources, both conventional
and unconventional, is enormous. These
resources, however, are becoming increasingly
challenging and expensive to access, produce,
convert, and deliver to where they are needed in a
cost-effective, secure, and environmentally benign
manner.
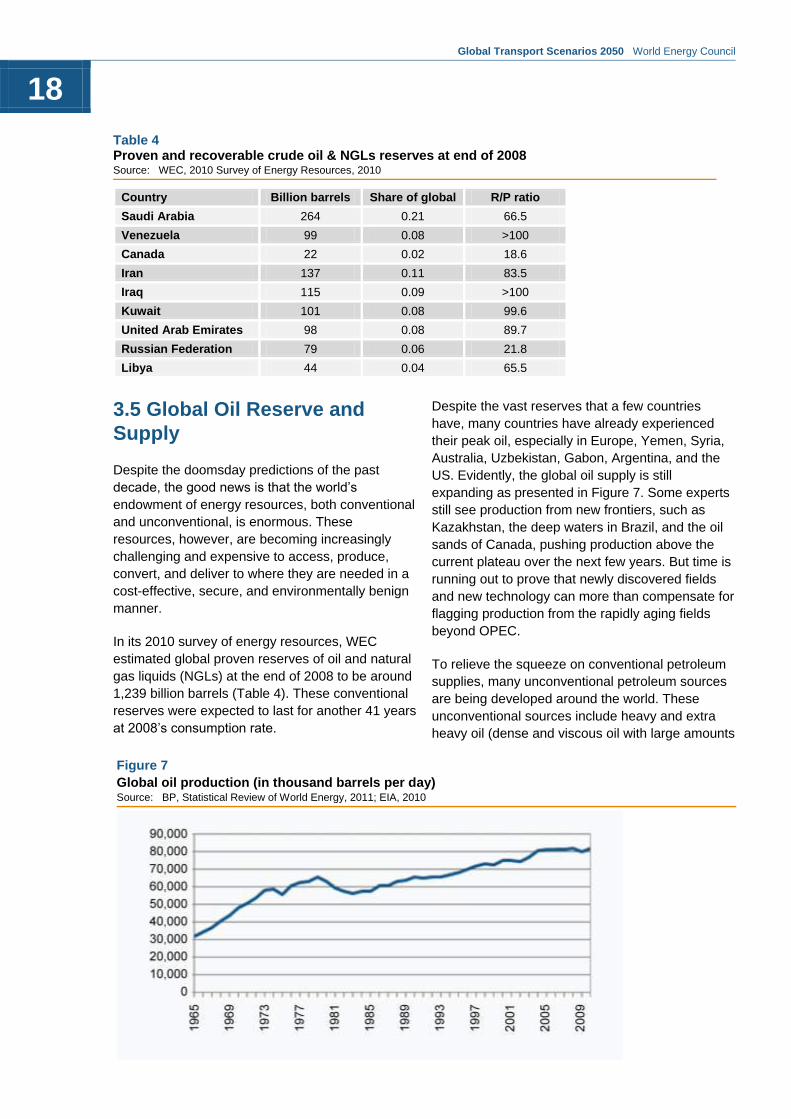
In its 2010 survey of energy resources, WEC
estimated global proven reserves of oil and natural
gas liquids (NGLs) at the end of 2008 to be around
1,239 billion barrels (Table 4). These conventional
reserves were expected to last for another 41 years
at 2008’s consumption rate.
Despite the vast reserves that a few countries
have, many countries have already experienced
their peak oil, especially in Europe, Yemen, Syria,
Australia, Uzbekistan, Gabon, Argentina, and the
US. Evidently, the global oil supply is still
expanding as presented in Figure 7. Some experts
still see production from new frontiers, such as
Kazakhstan, the deep waters in Brazil, and the oil
sands of Canada, pushing production above the
current plateau over the next few years. But time is
running out to prove that newly discovered fields
and new technology can more than compensate for
flagging production from the rapidly aging fields
beyond OPEC.
To relieve the squeeze on conventional petroleum
supplies, many unconventional petroleum sources
are being developed around the world. These
unconventional sources include heavy and extra
heavy oil (dense and viscous oil with large amounts
Table 4 Proven and recoverable crude oil & NGLs reserves at end of 2008 Source: WEC, 2010 Survey of Energy Resources, 2010
Country Billion barrels Share of global R/P ratio
Saudi Arabia 264 0.21 66.5
Venezuela 99 0.08 >100
Canada 22 0.02 18.6
Iran 137 0.11 83.5
Iraq 115 0.09 >100
Kuwait 101 0.08 99.6
United Arab Emirates 98 0.08 89.7
Russian Federation 79 0.06 21.8
Libya 44 0.04 65.5
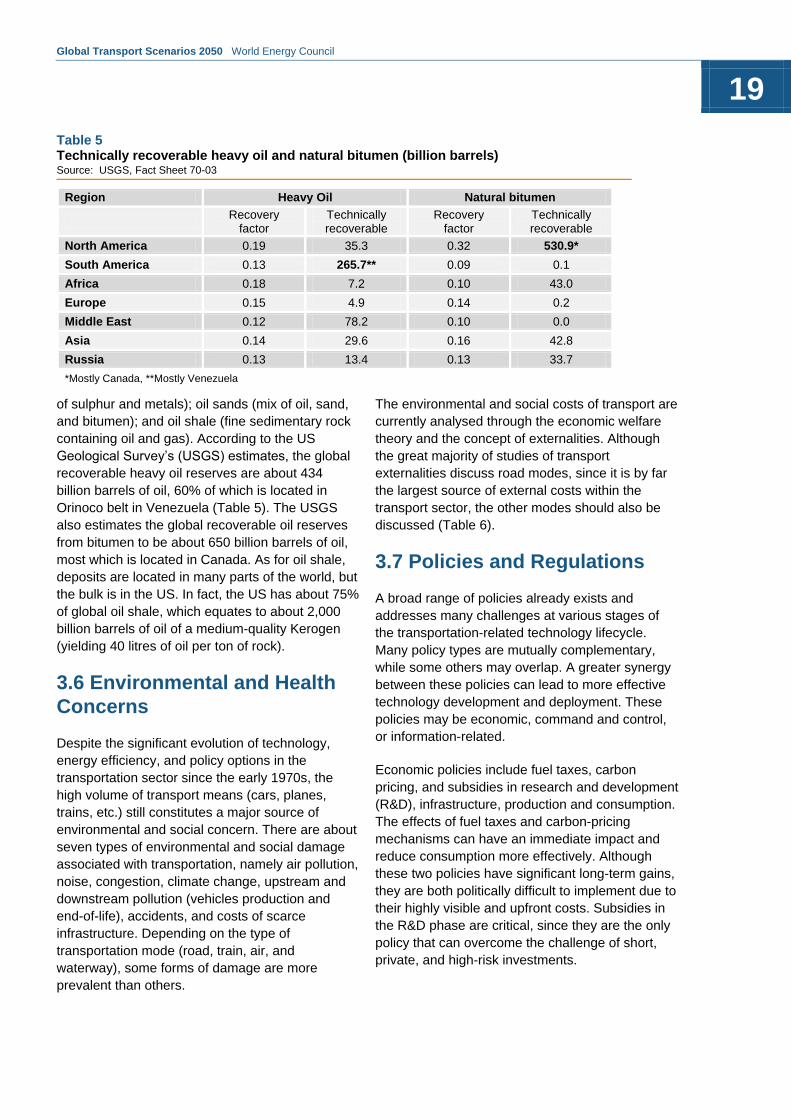
Global Transport Scenarios 2050 World Energy Council
19
of sulphur and metals); oil sands (mix of oil, sand,
and bitumen); and oil shale (fine sedimentary rock
containing oil and gas). According to the US
Geological Survey’s (USGS) estimates, the global
recoverable heavy oil reserves are about 434
billion barrels of oil, 60% of which is located in
Orinoco belt in Venezuela (Table 5). The USGS
also estimates the global recoverable oil reserves
from bitumen to be about 650 billion barrels of oil,
most which is located in Canada. As for oil shale,
deposits are located in many parts of the world, but
the bulk is in the US. In fact, the US has about 75%
of global oil shale, which equates to about 2,000
billion barrels of oil of a medium-quality Kerogen
(yielding 40 litres of oil per ton of rock).
3.6 Environmental and Health
Concerns
Despite the significant evolution of technology,
energy efficiency, and policy options in the
transportation sector since the early 1970s, the
high volume of transport means (cars, planes,
trains, etc.) still constitutes a major source of
environmental and social concern. There are about
seven types of environmental and social damage
associated with transportation, namely air pollution,
noise, congestion, climate change, upstream and
downstream pollution (vehicles production and
end-of-life), accidents, and costs of scarce
infrastructure. Depending on the type of
transportation mode (road, train, air, and
waterway), some forms of damage are more
prevalent than others.
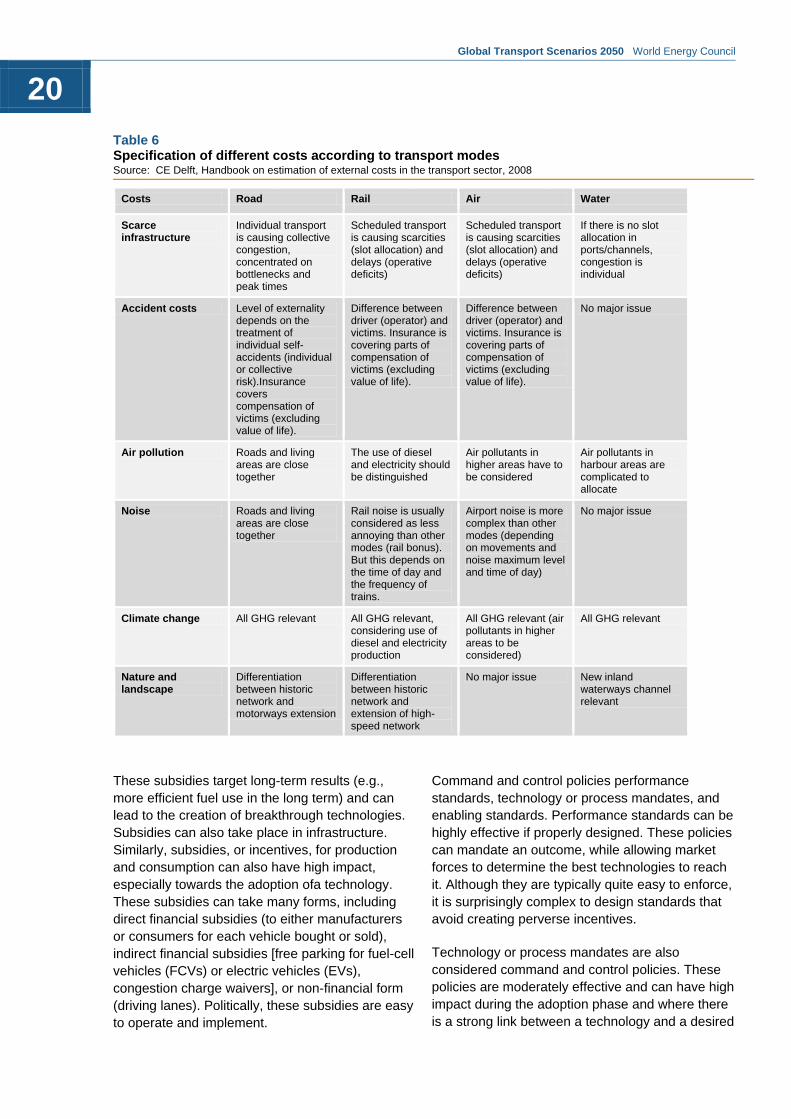
The environmental and social costs of transport are
currently analysed through the economic welfare
theory and the concept of externalities. Although
the great majority of studies of transport
externalities discuss road modes, since it is by far
the largest source of external costs within the
transport sector, the other modes should also be
discussed (Table 6).
3.7 Policies and Regulations
A broad range of policies already exists and
addresses many challenges at various stages of
the transportation-related technology lifecycle.
Many policy types are mutually complementary,
while some others may overlap. A greater synergy
between these policies can lead to more effective
technology development and deployment. These
policies may be economic, command and control,
or information-related.
Economic policies include fuel taxes, carbon
pricing, and subsidies in research and development
(R&D), infrastructure, production and consumption.
The effects of fuel taxes and carbon-pricing
mechanisms can have an immediate impact and
reduce consumption more effectively. Although
these two policies have significant long-term gains,
they are both politically difficult to implement due to
their highly visible and upfront costs. Subsidies in
the R&D phase are critical, since they are the only
policy that can overcome the challenge of short,
private, and high-risk investments.
Table 5 Technically recoverable heavy oil and natural bitumen (billion barrels) Source: USGS, Fact Sheet 70-03
Region Heavy Oil Natural bitumen
Recovery
factor Technically recoverable
Recovery factor
Technically recoverable
North America 0.19 35.3 0.32 530.9*
South America 0.13 265.7** 0.09 0.1
Africa 0.18 7.2 0.10 43.0
Europe 0.15 4.9 0.14 0.2
Middle East 0.12 78.2 0.10 0.0
Asia 0.14 29.6 0.16 42.8
Russia 0.13 13.4 0.13 33.7
*Mostly Canada, **Mostly Venezuela
Global Transport Scenarios 2050 World Energy Council
20
These subsidies target long-term results (e.g.,
more efficient fuel use in the long term) and can
lead to the creation of breakthrough technologies.
Subsidies can also take place in infrastructure.
Similarly, subsidies, or incentives, for production
and consumption can also have high impact,
especially towards the adoption ofa technology.
These subsidies can take many forms, including
direct financial subsidies (to either manufacturers
or consumers for each vehicle bought or sold),
indirect financial subsidies [free parking for fuel-cell
vehicles (FCVs) or electric vehicles (EVs),
congestion charge waivers], or non-financial form
(driving lanes). Politically, these subsidies are easy
to operate and implement.
Command and control policies performance
standards, technology or process mandates, and
enabling standards. Performance standards can be
highly effective if properly designed. These policies
can mandate an outcome, while allowing market
forces to determine the best technologies to reach
it. Although they are typically quite easy to enforce,
it is surprisingly complex to design standards that
avoid creating perverse incentives.
Technology or process mandates are also
considered command and control policies. These
policies are moderately effective and can have high
impact during the adoption phase and where there
is a strong link between a technology and a desired
Table 6 Specification of different costs according to transport modes Source: CE Delft, Handbook on estimation of external costs in the transport sector, 2008
Costs Road Rail Air Water
Scarce infrastructure
Individual transport is causing collective congestion, concentrated on bottlenecks and peak times
Scheduled transport is causing scarcities (slot allocation) and delays (operative deficits)
Scheduled transport is causing scarcities (slot allocation) and delays (operative deficits)
If there is no slot allocation in ports/channels, congestion is individual
Accident costs Level of externality depends on the treatment of individual self-accidents (individual or collective risk).Insurance covers compensation of victims (excluding value of life).
Difference between driver (operator) and victims. Insurance is covering parts of compensation of victims (excluding value of life).
Difference between driver (operator) and victims. Insurance is covering parts of compensation of victims (excluding value of life).
No major issue
Air pollution Roads and living areas are close together
The use of diesel and electricity should be distinguished
Air pollutants in higher areas have to be considered
Air pollutants in harbour areas are complicated to allocate
Noise Roads and living areas are close together
Rail noise is usually considered as less annoying than other modes (rail bonus). But this depends on the time of day and the frequency of trains.
Airport noise is more complex than other modes (depending on movements and noise maximum level and time of day)
No major issue
Climate change All GHG relevant All GHG relevant, considering use of diesel and electricity production
All GHG relevant (air pollutants in higher areas to be considered)
All GHG relevant
Nature and landscape
Differentiation between historic network and motorways extension
Differentiation between historic network and extension of high-speed network
No major issue New inland waterways channel relevant

Global Transport Scenarios 2050 World Energy Council
21
outcome. Technology or process mandates are
fairly difficult to implement. The mandates are often
expensive to enforce (i.e., building emissions-
testing stations) and politically difficult to
implement, given the contrasting interests of some
industry groups (in short-term results) and
consumers and society (in long-term impacts).
Finally, information policies include labelling and
consumer-education campaigns. In general, the
impact of these policies is moderate but rather
quick. These types of policies focus on educating
consumers, making them aware of information. A
good example is the US’s national tire fuel
efficiency education policy.
3.8 Lifestyle Changes
Predicting the impact of lifestyle changes on
transport choices is hard and the predictions are
rarely proved right. As inspiration for future
predictions, we can look back to past ideas of what
transport would look like today. Now they appear to
have been overly ambitious, full of futuristic flying
craft instead of cars.
One reason for this is the idea that new
technologies will completely shift or replace older
ones. This is unlikely: for example, the proliferation
of information technology has affected some of our
transport patterns, but not completely changed
them or made them obsolete. People still make
physical journeys even though they can use
telecommunications to have virtual meetings. A
more realistic approach suggests that there will be
a shift from one type of transport to another. For
example, the increase in online shopping in the US
has resulted in more delivery vehicles being used.
However, even though online purchases have
grown astronomically, the overall number of miles
driven per year by the average American has not
changed. Sometimes technologies are additive and
not subtractive.
To have very profound effects on transport is
ultimately difficult, but, having some impact on the
margins is more achievable. For example,
telecommuting can reduce—to some extent—the
need to commute physically. However, even with
the increase in telecommuting, we will not
necessarily see any sizeable decrease in the
aggregate level of miles driven in countries like the
US. What we might see instead is shifts in the
times at which people are driving on the roads.
While there is a current belief that “going green” will
massively change transport choices, we believe
that effect may be exaggerated. Although green
choices, such as using hybrid vehicles or electric
vehicles, may be available and popular in relatively
wealthy countries these may not be an option in
places like sub-Saharan African countries, because
of their cost.
We believe four lifestyle factors have been ignored
and need to be addressed in any transport
scenarios, in addition to information
technology/telecommunications and the adoption of
green consumer patterns. These factors are:
Gender issues: In countries with greater
gender equality, more women are mobile,
more women work outside the home, and they
utilize more types of transport. The
Global Transport Scenarios 2050 World Energy Council
22
emergence of more women working outside of
the home could have a profound effect,
especially in countries that currently have low
motorization rates. Additionally, changes in
views about women driving in specific
countries/regions of the world could have a
very significant impact on transport patterns.
Access to reliable electricity: Without reliable
electricity, telecommunications and information
technology suffer. Furthermore, the idea of
using electric vehicles will not work in the many
places that do not have access to electricity or
have frequent black- and brown-outs.
Leap-frogging technologies: This concept
suggests that countries can accelerate
development by skipping inferior, less
efficient, more expensive or more polluting
technologies and industries, and moving
directly to more advanced ones. A successful
example of this is the use of cellular phones
instead of landline phones.
Income-transport gap: One of the most
significant transport challenges the world
faces is how to offer reliable, safe, and
affordable choices of transport to an
expanding number of poor people. The
income-transport gap is the gap between
those that can afford transport choices and
those with no transport choices. Dealing with
the income-transport gap will be essential in
the megacities of the future, in order to help
manage pollution and environmental
degradation.
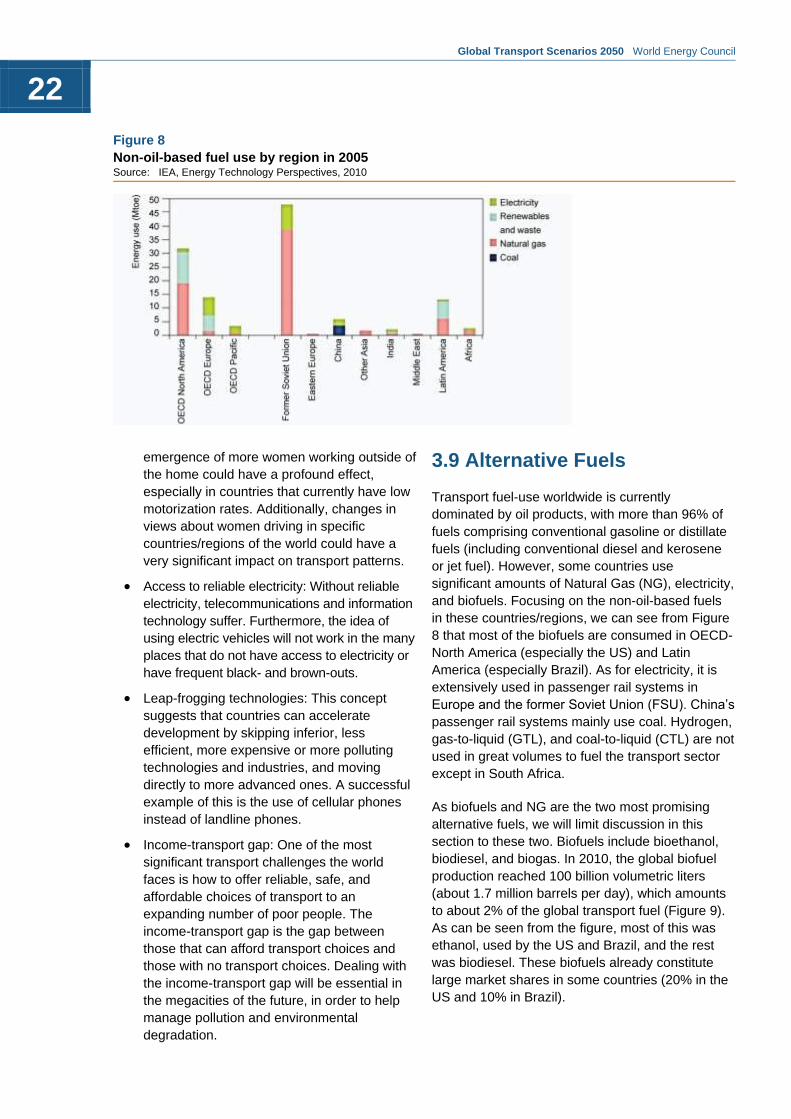
3.9 Alternative Fuels
Transport fuel-use worldwide is currently
dominated by oil products, with more than 96% of
fuels comprising conventional gasoline or distillate
fuels (including conventional diesel and kerosene
or jet fuel). However, some countries use
significant amounts of Natural Gas (NG), electricity,
and biofuels. Focusing on the non-oil-based fuels
in these countries/regions, we can see from Figure
8 that most of the biofuels are consumed in OECD-
North America (especially the US) and Latin
America (especially Brazil). As for electricity, it is
extensively used in passenger rail systems in
Europe and the former Soviet Union (FSU). China’s
passenger rail systems mainly use coal. Hydrogen,
gas-to-liquid (GTL), and coal-to-liquid (CTL) are not
used in great volumes to fuel the transport sector
except in South Africa.
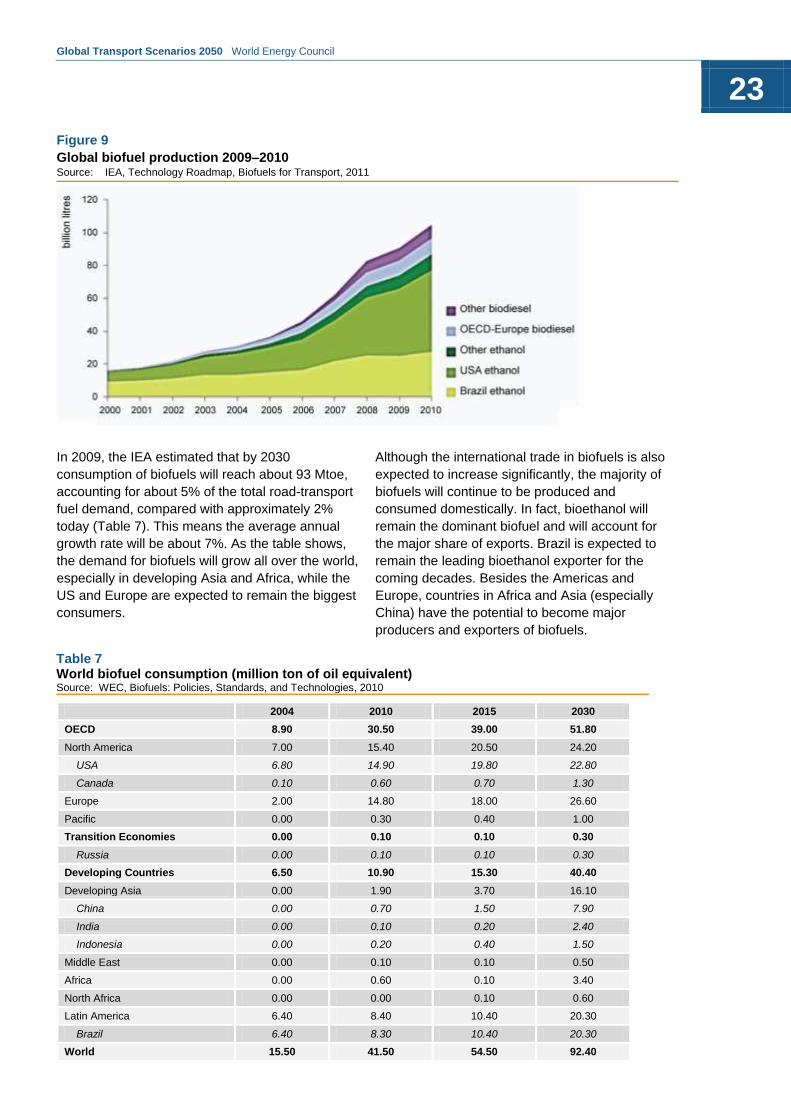
As biofuels and NG are the two most promising
alternative fuels, we will limit discussion in this
section to these two. Biofuels include bioethanol,
biodiesel, and biogas. In 2010, the global biofuel
production reached 100 billion volumetric liters
(about 1.7 million barrels per day), which amounts
to about 2% of the global transport fuel (Figure 9).
As can be seen from the figure, most of this was
ethanol, used by the US and Brazil, and the rest
was biodiesel. These biofuels already constitute
large market shares in some countries (20% in the
US and 10% in Brazil).
Figure 8
Non-oil-based fuel use by region in 2005 Source: IEA, Energy Technology Perspectives, 2010
Global Transport Scenarios 2050 World Energy Council
23
Table 7 World biofuel consumption (million ton of oil equivalent) Source: WEC, Biofuels: Policies, Standards, and Technologies, 2010
2004 2010 2015 2030
OECD 8.90 30.50 39.00 51.80
North America 7.00 15.40 20.50 24.20
USA 6.80 14.90 19.80 22.80
Canada 0.10 0.60 0.70 1.30
Europe 2.00 14.80 18.00 26.60
Pacific 0.00 0.30 0.40 1.00
Transition Economies 0.00 0.10 0.10 0.30
Russia 0.00 0.10 0.10 0.30
Developing Countries 6.50 10.90 15.30 40.40
Developing Asia 0.00 1.90 3.70 16.10
China 0.00 0.70 1.50 7.90
India 0.00 0.10 0.20 2.40
Indonesia 0.00 0.20 0.40 1.50
Middle East 0.00 0.10 0.10 0.50
Africa 0.00 0.60 0.10 3.40
North Africa 0.00 0.00 0.10 0.60
Latin America 6.40 8.40 10.40 20.30
Brazil 6.40 8.30 10.40 20.30
World 15.50 41.50 54.50 92.40
In 2009, the IEA estimated that by 2030
consumption of biofuels will reach about 93 Mtoe,
accounting for about 5% of the total road-transport
fuel demand, compared with approximately 2%
today (Table 7). This means the average annual
growth rate will be about 7%. As the table shows,
the demand for biofuels will grow all over the world,
especially in developing Asia and Africa, while the
US and Europe are expected to remain the biggest
consumers.
Although the international trade in biofuels is also
expected to increase significantly, the majority of
biofuels will continue to be produced and
consumed domestically. In fact, bioethanol will
remain the dominant biofuel and will account for
the major share of exports. Brazil is expected to
remain the leading bioethanol exporter for the
coming decades. Besides the Americas and
Europe, countries in Africa and Asia (especially
China) have the potential to become major
producers and exporters of biofuels.
Figure 9
Global biofuel production 2009–2010 Source: IEA, Technology Roadmap, Biofuels for Transport, 2011

Global Transport Scenarios 2050 World Energy Council
24
A competitive biodiesel production and export
business could develop in Southeast Asian
countries that are large palm oil producers.
However, their success would depend to a large
extent on both domestic subsidies and international
trade rules. Looking at the global biofuels
production in 2009, we can see from Figure 10 that
the US dominated producing 45%, followed by
Brazil with 27%, and the European Union (EU) with
17%.
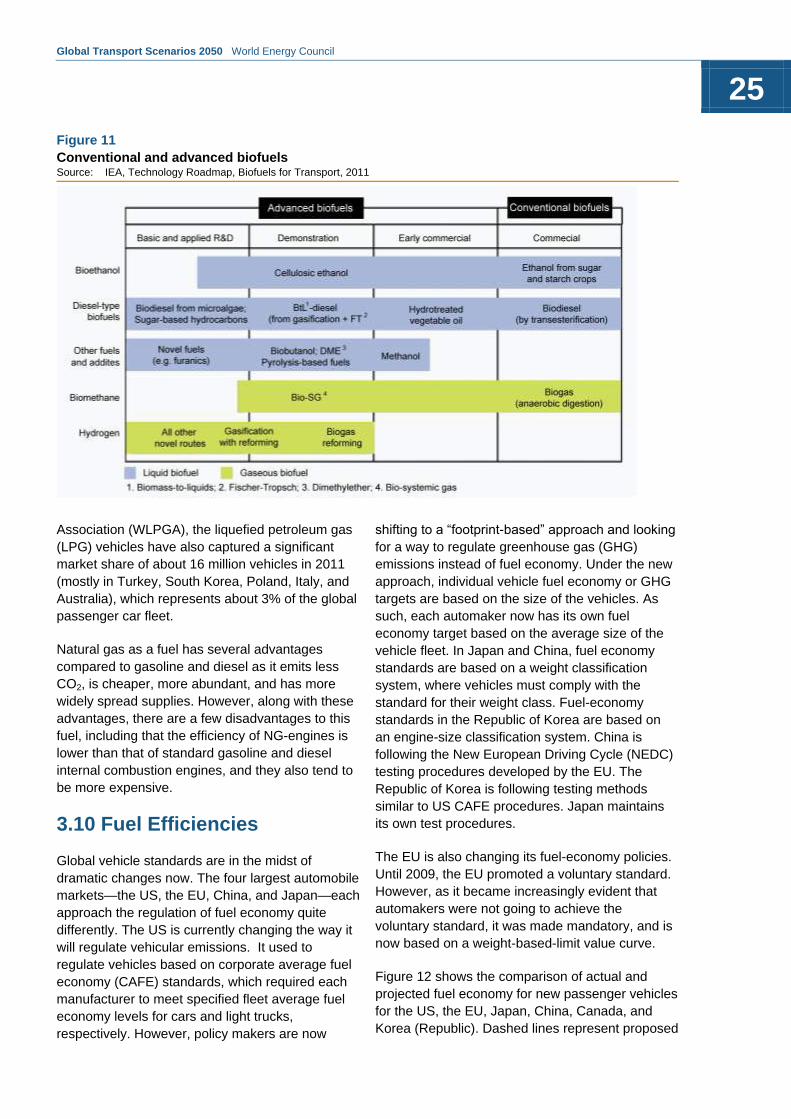
A wide variety of conventional and advanced
biofuel technologies exists today. Some of these
biofuel technologies are already commercially
available, while others are still in the demonstration
phase (Figure 11).
The future of biofuels (bio-ethanol, biodiesel, bio-
butanol, and bio-gas) will be constrained by many
factors, including the use of available arable land,
the efficiency of agricultural production methods,
the development of more advanced biofuels
technologies, and developments in the global oil
market. The future success of biofuels will depend
on two major factors: the expansion of cultivated
land, and increases in agricultural technologies and
productivity. These will require a broad political
commitment, including introduction of land reforms;
better irrigation; advancing biotechnologies;
improving plant yields; more efficient use of
fertilizers; and improvements in transport
infrastructure. The development of second- and
third-generation biofuels from non-food sources
would limit the current competition between the
production of crops for food and for biofuels,
respectively.
In 2008, the United Nations’ Food and Agriculture
Organization (FAO) estimated that biofuels were
responsible for about 10% of the food-price
increases around the world. In certain countries,
biofuels have had a significant impact on food
prices, but this was mainly because of national
agricultural support programs and protectionist
measures, rather than increased production of
biofuels. The UN also suggested that current
biofuel subsidies and trade barriers exercised by
OECD countries benefit producers in OECD
countries at the expense of producers in
developing countries. The UN report The State of
Food and Agriculture (2008) states that the
“expanded use and production of biofuels will not
necessarily contribute as much to reducing
greenhouse gas emissions as was previously
assumed,” and that “changes in land use— for
example deforestation to meet growing demand for
agricultural products—are a great threat to land
quality, biodiversity, and greenhouse gas
emissions”.
Apart from biofuels, natural gas (NG) is another
key alternative transportation fuel. According to the
International Association of Natural Gas Vehicles
(IANGV), the compressed natural gas (CNG)
vehicles base has already reached significant size,
estimated at 11.4 million vehicles in 2009 (mainly in
Pakistan, Argentina, Brazil, Iran, and India).
Similarly, and according to the World LP Gas
Figure 10
World biofuels production Source: WEF, Repowering Transport, 2011
Global Transport Scenarios 2050 World Energy Council
25
Association (WLPGA), the liquefied petroleum gas
(LPG) vehicles have also captured a significant
market share of about 16 million vehicles in 2011
(mostly in Turkey, South Korea, Poland, Italy, and
Australia), which represents about 3% of the global
passenger car fleet.
Natural gas as a fuel has several advantages
compared to gasoline and diesel as it emits less
CO2, is cheaper, more abundant, and has more
widely spread supplies. However, along with these
advantages, there are a few disadvantages to this
fuel, including that the efficiency of NG-engines is
lower than that of standard gasoline and diesel
internal combustion engines, and they also tend to
be more expensive.
3.10 Fuel Efficiencies
Global vehicle standards are in the midst of
dramatic changes now. The four largest automobile
markets—the US, the EU, China, and Japan—each
approach the regulation of fuel economy quite
differently. The US is currently changing the way it
will regulate vehicular emissions. It used to
regulate vehicles based on corporate average fuel
economy (CAFE) standards, which required each
manufacturer to meet specified fleet average fuel
economy levels for cars and light trucks,
respectively. However, policy makers are now
shifting to a “footprint-based” approach and looking
for a way to regulate greenhouse gas (GHG)
emissions instead of fuel economy. Under the new
approach, individual vehicle fuel economy or GHG
targets are based on the size of the vehicles. As
such, each automaker now has its own fuel
economy target based on the average size of the
vehicle fleet. In Japan and China, fuel economy
standards are based on a weight classification
system, where vehicles must comply with the
standard for their weight class. Fuel-economy
standards in the Republic of Korea are based on
an engine-size classification system. China is
following the New European Driving Cycle (NEDC)
testing procedures developed by the EU. The
Republic of Korea is following testing methods
similar to US CAFE procedures. Japan maintains
its own test procedures.
The EU is also changing its fuel-economy policies.
Until 2009, the EU promoted a voluntary standard.
However, as it became increasingly evident that
automakers were not going to achieve the
voluntary standard, it was made mandatory, and is
now based on a weight-based-limit value curve.
Figure 12 shows the comparison of actual and
projected fuel economy for new passenger vehicles
for the US, the EU, Japan, China, Canada, and
Korea (Republic). Dashed lines represent proposed
Figure 11
Conventional and advanced biofuels Source: IEA, Technology Roadmap, Biofuels for Transport, 2011

Global Transport Scenarios 2050 World Energy Council
26
standards under development. The figure shows
that the EU and Japan still have the most stringent
standards, and that the US has the weakest
standards in terms of fleet average-fuel-economy
rating. However, the developmental trends for
dramatically improving vehicle fuel-economy
among major nations are very clear, even though
each country’s timeframe is different.
In response to these challenging new fuel-economy
standards, higher fuel prices, and tighter emissions
controls, transport manufacturers are motivated to
find new ways to improve efficiencies and make
transport more affordable. In the long term, the
Energy Information Administration (EIA) expects
that manufacturers can potentially achieve a
reduction of about 28%–33% for the conventional
ICE engines, 41%–45% for the hybrids, and about
54%–55% for plug-in LDVs. Evidently, additional
range economy can be realized via improvements
that include aerodynamic streamlining,
improvements in tyres’ rolling resistance, improved
lighting, improved air-conditioning systems, and
optimization of the vehicle’s body using composite
materials. Improvements in trucks, buses, aviation,
and shipping are expected to improve fuel
efficiency in the long run too.
3.11 Innovations
Numerous studies on the future of transportation
envision that conventional forms of transport will no
longer be used 50 years from now. The proposed
alternative transport solutions range from fully
electric vehicles to hydrogen-fuelled individual and
mass rapid transit systems. As the trend towards
increasing urbanization becomes stronger, cities
will be forced to adopt intelligent public transport
solutions that will reduce both congestion and
pollution. Some of the solutions planned for the
future have their roots in concepts and pilot
projects being developed and tested today. The
following are a few examples of innovative
transport solutions that may grow to scale in 40–50
years’ time.
Car-sharing companies are becoming increasingly
popular. The business model spans for-profit, non-
profit, and cooperative areas. As the name
suggests, car sharing works on the principle that
cars are hired in an urban area by picking them up
from selected spots and paying for their use, before
returning them to designated areas. Prices are
structured on an hourly basis or a per-day basis.
Car sharing has its beginnings in Europe about 30
years ago, but has only become commercial in the
last decade. The largest car-sharing company
today is Zipcar, headquartered in Cambridge,
Massachusetts, US. The company operates in the
US, Canada, and UK, owns more than 9,000
vehicles, and has 605,000 members. In 2010,
Zipcar acquired the UK car-sharing company
Streetcar for $50 million. Other companies have
also entered this spac, including like Dailmer AMG
with their car2go project (2008), which operates in
the US (Austin, Texas), Canada (Vancouver), and
Figure 12
Comparison of actual and projected fuel economy for new passenger vehicles Source: Pew Centre on Global Climate Change

Global Transport Scenarios 2050 World Energy Council
27
Germany (Hamurg, Ulm). BMW and SixtAG have
also entered this sector with the rollout of their
DriveNow enterprise (2011), which currently
operates in Munich and Hamburg. In addition to
independent companies and automobile
manufacturers, traditional car-rental agencies like
Hertz are also entering the car-sharing market.
Other smaller car sharing programs/companies
also operate in US (e.g., City CarShare, Mint, eGo
CarShare, I-Go, Hourcar, Philly Car Share, Austin
Car Share, Buffalo Car Share, Community Car, U
Car Share, Car Share Vermont, Ithaca Car Share,
We Car); Canada (e.g., CommunAuto, Victoria Car
Share Co-op, Co-operative Auto Network,
VRTUCAR, AutoShare Car Sharing Network, The
People's Car Co-operative, Car-Sharing Co-Op of
Edmonton, CarShare HFX, Grand River/Hamilton
Car Share, Nelson Car Share Cooperative);
Australia and New Zealand (e.g., Cityhop, GoGet
Australia, Newtown CarShare, CharterDrive,
Flexicar); and Europe and the UK (e.g., European
Car Sharing, Mobility CarSharing Switzerland,
CARvenience, HOURCARS Salisbury,
CampusCars, CamShare, Copenhagen Car
Sharing). The car-sharing sector is growing in
Europe for a number of reasons; including freedom
from car ownership and implied costs, ease of use,
inability to own a car outright, environmental
awareness, and choice of vehicles.
Rapid transit systems fall into three categories—
bus rapid transit (BRT), personal rapid transit
(PRT), and group rapid transit (GRT). BRT is used
mainly in Brazil and China, where bus fleets
operate on dedicated roads or road sections. This
allows buses to operate with high frequency and
minimum delays. However, at present, BRT is
competing with an increasing number of cars for
road space. PRT is also called a “podcar”. It is a
public transportation mode featuring small,
automated vehicles, allowing for a maximum
passenger capacity of six persons, operating on a
network of specially built guide ways. . Currently,
there are three operating PRT systems—
Morgantown (US), Masdar City (Abu Dhabi), and
London Heathrow (UK). They are all in test phase,
and plans are being made to grow them in scale if
the pilots are successful. GRT is similar to PRT,
but with higher occupancy. It can be used in areas
of high density with more-or-less average peak-
time travel.
The application of superconductivity to rail
transport has the potential to cut conventional rail-
travel times by more than half and reduce CO2
emissions by two-thirds. Average cruising speed is
estimated to be 500kmph. Japan is planning to
connect Tokyo, Nagoya, and Osaka via SCMaglev,
which will be financed and built by JR Tokia
(Central Japan Railway Co.). High-Speed Rail
(HSR) projects are also being built in China,
Turkey, Russia, Spain, and other countries. The
US has a high potential for HSR, but needs to find
political acceptance before any plans are made.

Global Transport Scenarios 2050 World Energy Council
28
3.12 Summary
A wide spectrum of critical trends are significant for
this study, some of which are regarded as
predetermined factors, such as population growth,
while others, such as lifestyle changes and
geopolitical dynamics, are more difficult to predict.
Although economic growth is regarded as a
predetermined element, it is linked to uncertainties
such as the exact level of economic activity and the
question of how economic growth may be linked to
economic liberalization and internationalization of
trade. The discussion also revealed that changes in
demographics are also highly predictable in light of
a predetermined economic growth element. The
interaction between these two, economic growth
and demographic change, adds more complexity to
the transport picture, as new megacities develop.
As a constraint, the investigation of energy
geopolitics recognized the rise of China as a major
power competing for dominance and resources. In
addition, oil supply will not be a real constraint
throughout the study’s time horizon. The future of
the oil price will be determined by supply, demand,
and political events around major oil producers.
Health and environmental concerns will also play a
significant role in shaping the future of transport.
Certainly, how these play out will depend on the
levels of cooperation among and between consumers
and governments who will most probably respond
with new policies regarding efficiency, congestion,
and emissions. Businesses and industries will also
respond to these concerns, probably by increasing
the efficiency of the various transport modes and
offering new technologies and alternate fuels.
Global Transport Scenarios 2050 World Energy Council
29
4.1 Government Regulation
The link between the form of political
establishments and their economic governance has
always been the subject of debate. Evidently, any
government form—democratic, authoritarian or
anything in between—can either be credited with or
accused of a certain economic performance
depending on the extent of the role it plays in
deciding market rules. On the one hand,
government policies may allow and/or promote the
behaviour of free and competitive markets; on the
other hand, a government may intervene heavily to
regulate markets and aspire to attain certain
outcomes via dictating market rules.
Theoretically, that government role can be reflected
in three ways.
(1) A government may be described as
“engaged” if it is not only fully aware of the
market trends, issues, and requirements but
also ensures that required actions are taken
to reach optimal results.
(2) A government may be described as “involved”
if it carries few responsibilities and leaves the
rest to the market. This role could be viewed
as suboptimal as it has the potential to
introduce imbalances in market powers if the
government competes with other providers.
(3) Finally, a government may be described as
“interfering” with actions or regulations that
could sometimes be inefficient or even
obstructive.
As discussed earlier, under policies and
regulations, governments can deploy many
economic, command and control, and information
policies, which can influence markets dramatically.
With regard to transport, governments can impose
fuel taxes, carbon pricing, subsidies, performance
standards, technology or process mandates,
enabling standards, and labels, or it can even
dictate consumer education campaigns.
As governments quite often change their roles in
regulating markets, this project considers the
government role as quite uncertain. Therefore, the
scenarios focus on two extremes of market
regulation:
(1) “Competitive market” where governments are
minimally engaged; and
(2) “Centrally planned market” in which the
government is heavily involved in regulation.
4.2 Cooperation-Integration
The second key source of uncertainty in describing
the future of transport study arises from the degree
of cooperation–integration between the market
players, including individuals, public, corporations,
and governments, on bilateral, regional, or even
international levels. Such cooperation–integration
originates from the recognition of mutual benefits,
along with the need to share resources, suffer
consequences or realize gains, or plan a
sustainable future for all. As with the description of
government regulation above, the cooperation–
integration uncertainty has three basic possible
positions. It could be in the form of
4. Critical Uncertainties
Global Transport Scenarios 2050 World Energy Council
30
(1) an agreement between companies,
(2) a partnership between public and private, or
(3) an international agreement between two or
more international governments.
Theoretically, these agreements and/or
partnerships would further facilitate the exchange
of resources (labour, capital, raw materials, or
financial) and technologies.
In our scenarios, and in the same way as the
WEC’s energy scenarios (2007), this study also
considers the degree of cooperation–integration as
uncertain because is unclear what
politics/economics-related barriers could be
erected to defend private, public, or even national
interests. In contrast, the new global free market
governed by rules of trade is expected to liberate
markets, remove barriers, and promote
cooperation–integration.

Global Transport Scenarios 2050 World Energy Council
31
In a world with such critical drivers and
uncertainties, binding constraints, and unravelling
responses, the transport and mobility team has
mapped out two potential scenarios for global
transport, called “Freeway” and “Tollway.”
5.1 Freeway
Freeway envisages a world where market forces
prevail to create a climate for open global
competition, higher levels of privatization,
deregulation, and liberalization. It also stimulates
the role of the private sector, entrepreneurs and
global companies so that they emerge as central
players in a new international trading environment
without trade barriers.
Despite successful international coordination and
cooperation on free market mechanisms, there are
still a few trade disputes and global trade is highly
imbalanced. In the same way as goods and
services can move freely through the open global
market, capital enjoys more freedom to move, and
this incentivizes foreign direct investments (FDIs)
to higher levels. Private financing capital is
available, abundant, and easy to secure. Market-
driven technology innovation also prospers and
emerging innovation centres attract and compete
for investment capital and human resources. In
most countries, investment in infrastructure
remains limited to just a patchwork of
improvements, as capital is directed to more
profitable channels. Efforts in R&D sectors are
driven by both private and public sectors and
remain diverse.
During good economic situations (at the top of the
cycle), this scenario is characterized by high but
unevenly distributed economic growth, with
sufficient funds for new private investments. In a
bad economic situation (at the bottom of the cycle),
this scenario is characterized by low and unevenly
distributed economic growth with widespread
austerity packages, reducing new investments and
energy demand. In both economic situations, the
income per capita remains high and increases,
especially in the western world and successful new
industrial regions (Southeast Asia, Latin America,
and the Caribbean); Africa remains marginalized.
Consumer spending increases while savings drop.
Market distortions including corruption,
bureaucracy, tax regulations and subsidies
decrease in many regions with some remaining
subsidies in renewables.
In the energy sector, many countries have opened
their upstream sectors, resulting in a surge of
supply and more security of supply for consuming
nations. Oil prices remain moderate in the short
term, but high growth in energy demand leads to
higher prices by the end of the scenario period.
Reliance on fossil fuel falls but rather more
gradually. Industrial demand for energy reaches an
all-time peak, and electricity prices increase
sharply, leading to greater energy poverty.
This scenario yields more individual transport
solutions that are more short-term and lacking wide
perspectives. Evidently, higher economic growth
results in more vehicle ownership and increased
traffic and freight movement, especially in eastern
markets. Improvements in high efficiency ICEs
continue and more hybrid cars penetrate the LDVs
5. Transport Scenarios
Global Transport Scenarios 2050 World Energy Council
32
market. CNG vehicles gain ground only where gas
reserves became accessible by IOCs. For EVs,
batteries have remained expensive but with time,
R&D drives the price down. The competitive market
incentivizes new business models for battery
replacement. Innovation centres in eastern markets
and megacities drive the introduction of larger
numbers of EVs, prompted by to air-quality
concerns. In the longer term, low-cost EVs
penetrate western markets. FCVs make only a
small breakthrough as they are still expensive.
Crude oil remains necessary to fulfil the bulk of
transport demand throughout the scenario period.
In the biofuels market, the food crisis depresses
global biofuels growth. The strongest regional hubs
for biofuels remain North and South America (US
and Brazil); second- and third-generation biofuels
remain expensive.
5.2 Tollway
Tollway is best described as a regulated world
where governments and prominent politicians
decide to put common interests at the forefront and
intervene in markets. In such an environment, the
more fragmented and differentiated global
economy suffers weak cooperation on free-market
mechanisms, which results in more trade
restrictions. However, the world as a whole has
witnessed increasing international cooperation on
climate-change issues in the short to medium term.
As is the case with the movement of goods and
services, capital also suffers limited movement,
forcing FDIs to drop to lower levels. Private
financing capital is more limited and is supplied
mostly by local institutions. Large public sector
funding is limited to infrastructure and “green”
projects. As for technology, governments have
picked only the technology winners (e.g.,
photovoltaic). Technology transfer has been
facilitated mainly by international research
programs and technology “clearing houses”.
Investment in infrastructure has enjoyed a boom as
governments fully fund public projects, especially
public transportation and renewable energy.
Governments have also given greater focus to, and
exerted more international efforts towards, climate
change in the short, medium, and long term. The
world witnesses less competition over energy
resources given regionalized markets and
improvements in energy efficiency. There remains
the risk of political volatility because of a series of
backlashes to the discovery of widespread
corruption and inefficiencies linked to large
investments in infrastructure programs.
During good economic situations, this scenario is
characterized by sufficient economic performance
to fund government initiatives in energy. Overall
economic growth is more moderate than in
Freeway and is still distributed unevenly across
regions. In a bad economic situation, there is
sufficient economic performance in shielded
developing countries (for example, China and
Brazil), while growth weakens in developed
nations. As spending has been heavily dependent
on governments, the public sector accumulates
large debt levels. The effect of a downward cycle is
partially mitigated by lower energy demand and
import bills, due to gains in energy efficiency.
Wealth disparity is less obvious in industrial
countries, while the wealth level of African nations
improves slightly due to technology transfers (e.g.,
Global Transport Scenarios 2050 World Energy Council
33
Copenhagen Accord), and multi-lateral programs
(e.g., UNIDO access to energy programs).
Corruption is highest in South Asia, sub-Saharan
Africa, and transition economies. Bureaucracy
remains an issue in most regions, while tax
regulations severely constrain OECD and post-
socialist transition economies. Subsidies have
increased for green goods and services.
In the energy upstream sector, few new areas for
exploration and production have been opened
leading to tight supplies and higher energy prices
at the beginning of the scenario period, but lower
and more stable prices after a rapid transition to
renewable energy sources. Electricity prices
increase sharply, leading to more energy poverty
and requiring immediate government subsidies for
low-income citizens. Security of supply and
climate-change concerns demand reduced
dependence on fossil fuels. Large government
programs focus on energy efficiency and energy-
saving programs. This results in more effective
energy efficiency and energy saving, and a drop in
the global demand for energy in this scenario.
In contrast with Freeway, this scenario has a
stronger emphasis on public transportation, and
solutions are more long term with a wider
perspective. Shipping, aviation, rail, and trucking
have lower growth rates, because of lower
economic growth. However, HSR networks
penetrate on a larger scale, especially in the
second half of the scenario period. Car-ownerships
rates are lower as people rely more on public
transportation systems. Improvements in high
efficiency ICEs continue and hybrid cars penetrate
the market more moderately. Driven by
government directives and subject to significant
improvement to the grid systems, EVs and large-
scale use of electricity in public transportation fleets
penetrate the market more quickly. Local
governments with access to domestic gas reserves
adopt significant numbers of CNG vehicles. FCVs
are also adopted, but on a small scale just so as to
reduce dependency on foreign oil. In this scenario,
first-generation biofuels make an increasing
contribution to the fuel mix but with larger impact
on food prices.
Global Transport Scenarios 2050 World Energy Council
34
In addition to the information material collected by
network members on critical drivers and
constraints, some regional inputs were also
gathered in workshops conducted in
Johannesburg, Bangkok, Thessaloniki, London,
Rio de Janeiro, and Washington DC. This section
briefly presents some of these major inputs that
could shape the future of transport in these various
regions. A complete description and more detailed
regional inputs for the two scenarios are included in
Appendix A.
6.1 Africa and the Middle East
We have seen from the earlier discussion on
economic growth that between 1990 and 2008,
Africa’s GDP grew at about 3.8% per year, while
that of the Middle East grew at 3.9% per year (both
were higher than the global average of 3.3%).
Through 2035, Africa’s GDP is expected to grow at
about 3.5% per year, while the Middle East is
expected to grow at 3.9% per year (both higher
than the global average of 3.2%). As for wealth and
GDP levels, the region experiences an outpouring
of civil unrest due to income disparity and
increasing crime waves, especially in Africa. Sub-
Saharan Africa has the lowest GDP per capita in
the world ($1,138 versus a world average of
$8,599), but is expected to slowly improve towards
the backend of the scenario period. The North
African nations have a relatively higher per capita
GDP of close to $3,000, although this is still far
below the world’s average. The GDP of the Middle
Eastern nations are higher than most African
countries, standing at an average of $5,763.
Problems with frustrated young and poor portions
of the population are slightly alleviated due to
improving unemployment numbers, but still
unemployment is a challenging factor throughout
the scenario period.
Looking at the challenging population and
demographic statistics, we can also see that sub-
Saharan Africa has the world’s highest population
growth rate of 2.5%, relative to the global growth
rate of 1.2 %, while the Middle East and North
Africa (MENA) region has a growth rate of 1.9%
per year. Through 2035, Africa’s population is
expected to grow at about 1.9% and that of the
Middle East is expected to grow at 1.5% (both
higher than the global average of 0.9%). This
means that Africa is expected to double by 2050. In
sub-Saharan Africa, almost 43% of the population
is 14 years of age or under, while in MENA the
share is about 31% (compared with the world’s
average of 27.2%).
In terms of geopolitics, the demographic demands
in a few West African and MENA energy-rich
countries (i.e., Nigeria, Libya, Iraq, and Iran) are
having an impact on their political and social
stabilities, and their ability to export oil. Additionally,
these countries are most likely to be politically
unstable though 2050, putting critical hydrocarbon
supplies from MENA at risk. Unfortunately, the
straits of Hormuz, Bab Al-Mandab, and the Suez
Canal remain vulnerable. Conflicts and instabilities
in Libya, Sudan, Somalia, West Africa, Iraq, Iran,
Lebanon, Palestine, and Yemen are expected to
last for a few more decades. The Arab Spring in
MENA is expected to end at Libya, Yemen, and
Syria, but ensuing political reforms will take years.
Unfortunately, these conflicts are expected to slow
6. Regional Considerations

Global Transport Scenarios 2050 World Energy Council
35
down the demand for transportation in these
countries.
The lack of proper government frameworks
remains a challenge for market privatization,
liberalization, and deregulation in both Africa and
the Middle East (South Africa could be the
exception). Fortunately, there is no lack of credit
and willing investors for energy infrastructure
investment, but corruption is still a concern in most
countries (with the exception of high-income Middle
Eastern countries). Sub-Saharan Africa is the least
bureaucratic in the world. Bureaucracy in the
MENA region remains high. The region’s tax
regulations remain at about the global average.
Subsidies in West Africa and MENA countries
remain heavily dependent on subsidies, especially
subsidies related to energy resources.
With regard to infrastructure, the region’s overall
demand for road transport is expected to match the
increase in the number of roads being built over the
next decades. Investments in road-building
programs are expected to be massive. Investment
in energy infrastructure remains urgent, and access
to energy remains a top priority. Multilateral
sponsorship programs improve government
regulation, and increase private sector investments
into public sector. The divide between rural and
urban transport options increases as a result of
increased investments in urban infrastructure. In
addition, the accessibility of some rural areas
improves due to road-construction programs.
Only about 36% of sub-Saharan Africans live in
cities, compared with around 60% in MENA (the
global average is about 50%). Good economies will
invite better planning and problem solving.
Increasingly, young MENA people are migrating to
the major cities looking for employment, adding
more stress on urban infrastructure (housing,
infrastructure, and transportation). This is being
met by very little public planning, and urbanization
is growing faster than the government is
responding. Extreme congestion and pollution
problems experienced in the major urban centres
are increasing.
As for consumer behaviour and lifestyle, the
regions individuals’ interest remains at front.
Consumers in sub-Saharan Africa are still looking
for any affordable transport means. In the higher
income and more urbanized MENA, population is
frustrated with congestion and pollution problems,
mainly in major cities.
The region’s individual transport solutions are
expected to remain dominant. Electrification of
public transport systems (rail, trams, and buses) is
possible at a later stage in higher-income nations
(e.g., South Africa, Nigeria, and Namibia). In 2005,
Africa had one of the lowest levels of private car-
ownership in the world, with only 20 privately
owned cars per 1,000 people. For the Middle East,
the level is relatively higher (80 cars per 1,000
people). Private car-ownership is something that
many young Africans and Middle Easterners would
like to have, particularly in the absence of reliable,
affordable, and convenient mass-transit and public-
transportation options.
In 2005, the passenger LDV stock was about 15
million vehicles in Africa and about 15 million
vehicles in the Middle East. In the same year, new

Global Transport Scenarios 2050 World Energy Council
36
car sales in Africa were about 1.6 million per year
and about the same in the Middle East. There is a
large market for second-hand automobiles, mainly
from second-hand cars imported from the EU.
There were about 243,000 used cars flowing into
Africa in 2005 (mostly from the EU) and about
391,000 into the Middle East (mostly from the US,
followed by Japan). Conventional gasoline and
diesel ICEs dominate existing stocks of both new
and used sales. The ICE is expected to continue to
dominate through 2050. The potential for hybrids,
EVs, CNGVs, FCVs and even HSRs is expected to
remain at minimum level.
As for air traffic and freight, the region is expected
to have high growth for both passenger travel and
freight, at 5–6% per year over the next 20 years.
Africa’s passenger fleet is expected to double from
660 planes to 1,130 planes, and the Middle East to
more than double from 950 to 2440 planes. Africa
is expected to have a growth rate of about 5.5% for
passenger travel, and 6% for cargo per year
through 2029. The Middle East is expected to have
a growth rate of 7.1% for passenger and a 6.8% for
cargo per year through 2029.
Fortunately, these developments in the region’s
transportation and transport are expected to benefit
from the fact that most of the region’s countries
have energy reserves or access to them, which will
help fuel the higher level of motorization expected
through 2050. Currently, the region’s transportation
sector mostly uses conventional gasoline and
diesel. Individual transport is likely to remain largely
based on gasoline and diesel for decades to come.
In 2008, Africa consumed 28 mtoe (about 0.564
million barrels per day) of gasoline and about 38
mtoe (about 0.765 million barrels per day) of diesel.
Similarly, the Middle East consumed 46 mtoe
(about 0.939 million barrels per day) of gasoline
and about 54 mtoe (about 1,082 million barrels per
day) of diesel. By 2050, consumption is expected
to double for Africa (from about 100 mtoe to 200
mtoe) and triple for the Middle East (from about
100 to 300 mote), again mostly in gasoline and
diesel. As for the non-conventional fuels, first-
generation biofuels have a potential in areas where
they do not threaten food security (e.g., ethanol
production in Swaziland).
Regarding climate change, neither Africa nor the
Middle East is going green. Currently, the trend is
that local strategies are aimed at providing
maximum energy at the lowest cost possible.
Additional funding for energy-efficiency programs
and climate-change mitigation initiatives will
depend on foreign-funding mechanisms. There is
consensus that a consolidated approach promoting
all forms of energy is the best way forward.
6.2 Asia
Between 1990 and 2008, Asia’s GDP grew at
about 7.4% per year, almost double the global
average of 3.3%. This enormous growth was driven
by China growing at 10% a year and India at 5.7%.
Through 2035, the Asian Development Bank (ADB)
expects growth in Asia to be driven by the
economies of China, India, Indonesia, Japan,
Republic of Korea, Thailand, and Malaysia. Asia’s
GDP is expected to grow at about 5.4% per year,
which is still higher than the global average of
3.2%. Again, the growth engines are China,
growing at 5.7% and India, growing at 6.4% per

Global Transport Scenarios 2050 World Energy Council
37
year. The Japanese economy, which has been
growing at about 1.2% for the last 20 years (on
average), is expected to grow at about 1% per year
through 2035. Evidently, Japanese output has
suffered after Fukushima and its growth is
expected to be crippled by its national debt
problems. Currently, Japan’s net debt stands at
128% of its GDP (higher than Greece, which is at
124%). As for the GDP per capita levels, we can
categorize the Asian countries according to certain
economic development stages. The GDP per
capita is high for OECD members (i.e., Korea’s is
$17,078 and Japan’s is $39,738) and low for others
(i.e., China’s is $3,744 and India’s is $1,192).
As for population, Asia currently has 60% of the
world’s population (4.1 out of 6.8 billion), with
China being the most populous country today at
1.3 billion people, followed by India at 1.189 billion.
Asia’s population growth is about 0.7% a year
(China is 0.5% and India is about 1.3%), which is
lower than the global rate of 1.2%. Through 2035,
Asia’s population is expected to grow almost at the
global average (0.8% compared with a global
average of 0.9%). China will grow at 0.3%, while
India will grow at 1%. Most of the growth will come
from South Asia, with India exceeding China’s
population by 2030. Currently, almost 22% of
Asia’s population is 14 years or under (compared
with the world average of 27%). South Asia is the
youngest region (in both India and China 31% of
the population is below 14 years,). Looking at
future trends, Japan and China’s populations are
aging and declining, while the populations of India,
Pakistan, Bangladesh, and Indonesia are growing,
with increasing numbers of younger people.
Primarily, Chinese demographic change is due to
its one-child policy, the results of will kick in during
this decade. The share of Chinese under age 15
dropped 6.3%, while that of those over 60 rose by
2.93%. This represents a shrinking labour market.
Demographic decline will become a serious
concern in Japan. The United Nations estimates
that 36.5% of the Japanese population will be aged
65 or more by 2050.
Along with these changes in levels of economic
growth and population, there will also be some
political challenges. The Chinese political system is
scheduled to go through a power transfer in 2012.
The old ruling elite will step down and give way to a
newer generation. The focus will be on maintaining
a steady level of economic growth along with social
stability. Indicators of social unrest will be watched
very closely by the government. Militarily, China will
be seeking to exert its influence in the Asian region
more strongly. Stability will hinge on achieving
minimum economic growth of about 9%. Instability
in the Korean peninsula will last for a few more
decades. The threat of nuclear war between India
and Pakistan will continue for many years, until the
Kashmir problem is solved.
With regard to government frameworks,
government regulation remains high in China. Big
infrastructure programs keep large sectors of the
population employed and political reforms stay on
the back-burner. In contrast, India has a more
liberal regulation policy, but the size of its
bureaucracy limits its growth potential. Since India
liberalized in 1991, it has experienced an average
annual GDP growth rate of 4.8%. The Chinese
growth rate over the same period has been 9%.
Fortunately, foreign investment continues to flow

Global Transport Scenarios 2050 World Energy Council
38
strongly into Asian economies. In fact, the region’s
FDI levels were up 43% since last year, with 21%
of foreign equity attracted by the services sector. In
contrast, India continues to lag. India’s total FDI
inflow between 2000 and 2011 was $19billion.
Over the same period, the FDI in China for 2010
was $105.7 billion. The biggest sector for FDI in
India was services, while in China, Thailand, and
Taiwan it was manufacturing.
Corruption in Asia remains a challenge (South Asia
is the most corrupt worldwide). It continues to
plague the Indian government at the national and
state levels: India is ranked 87 in the latest
Transparency International Corruption Rankings
with a score of 3.3 (highly corrupt). China has a
policy of harshly punishing its offenders. However,
allegations of corruption against state officials
continue. The Chinese government has so far not
tolerated any strong widespread challenge and has
regularly imprisoned its harshest critics.
Bureaucracy remains very strong in Asia,
especially in India and China. All major external
investors have to deal with a major bureaucratic
element. This causes delays and higher project
costs, especially in India. Regarding tax regulation,
India has an effective statutory corporate tax rate of
30%–40% while China has an effective statutory
corporate tax rate of 25%, down from 30% in 2007.
The overall tax regulations in Asia are considered
low compared with OECD countries. Fuel and
electricity remain heavily subsidized in most Asian
countries. Any cost increase at the pumps will have
an immediate adverse impact on economic growth.
The Chinese government still subsidizes electricity
and regularly subsidizes state-owned enterprises.
While most of the manufacturing in the region is
done in China, Korea, and Japan, the R&D for
high-end electronics is carried out in countries like
Germany, Japan, US, etc. India has a number of
R&D centres for software, pharmaceuticals, and
other industries and starts to outpace China in
terms of technology development. Luckily, regional
competition is increasing. Asia as a whole (with the
exception of Japan and Korea) remains dependent
on technology transfer.
In addition to the above challenges facing Asian
governments, there will also be a few critical
challenges relating to urban planning. In 2000,
around 48% of the Asian populations lived in cities,
around 30% of the Indian population lived in urban
centres, while in China it was around 44%. These
rates are set to increase. The rural-to-urban influx
is also increasing in China and India. Internal
migration is also rising. In China, in the Bohai
Economic Rim, a series of urban centres located in
the industrial hinterland surrounding Beijing and
Tianjin is also being developed. These changes are
expected to strain public transportation systems.
The Asian public-road transport system may shift
from diesel to CNG to reduce urban air pollution. In
India, intra-city rail networks are being planned to
reduce road congestion. India also plans to further
electrify its rail system in the coming decades. At
the same time, China has embarked on an
ambitious high-speed rail (HSR) network to reduce
intercity commuting time. However, safety and
quality concerns remain as work progresses at a
fast pace under local contractors who are likely to
cut corners. Currently, China leads the world’s
HSRs with 4,840 km in operation and 15,478 km
under construction. It is planning more than 12,000

Global Transport Scenarios 2050 World Energy Council
39
km by 2020, and recent HSR accidents may not
slow down these plans. Japan has a total of 2,495
km of HSRs, Taiwan has 345 km, while South
Korea has about 412 km.
As incomes rise, there will be a shift towards a
demand for transport. In 2005, vehicle ownership
was about 11 cars per 1,000 capita in China and
about 6 cars per capita in India, compared with a
global average of 111 cars per 1,000 capita.
Recently, car ownership rate in China has been
growing at a rate of 12% per year, while in India it
has been growing at 9% per year. The demand
growth extends also to the two-three wheelers. In
fact, Asia produces 95% of global two-three
wheelers, which constitutes 75% of the stocks in
the world. China is the fastest growing two-three
wheelers market but is still within 50–100 per 1,000
capita (and this is below Malaysia and Thailand
which have 250 per 1,000 capita). China’s ban on
using gasoline motorcycles and scooters in Beijing
and Shanghai has promoted the use of E-bikes.
Currently, about 100 million E-bikes are in
circulation in China and the sales are about 20
million per year.
In 2005, the passenger LDV stock was about 14
million vehicles in China, 7 million in India, and 26
million in other parts of Asia. New car sales in 2005
were about 3.1 million in China, 1.1 million in India,
and 2.9 in other Asia. The flow of used cars to Asia
in the same year was about 274,000 cars, mostly
from Japan. Indeed, conventional ICEs dominate
the car stocks and ICE dominance is expected to
last through 2050. Diesel ICEs constituted about
25% of India’s LDV stocks in 2005, and are still
gaining popularity. This is due to the low cost of
diesel at the pump compared with petrol.
Increasing fuel efficiency, combined with
turbocharged technology, has also boosted the
demand for diesel vehicles in India. Gasoline ICEs
are greatly in demand in China and this demand
will continue to grow. Hybrid penetration in the
Asian LDV market is low. The only exception could
be the Japanese market, which had sales of about
334,000 units in 2009 and 500,000 units in 2010.
Hybrids are expected to increase market share in
high-income countries (Japan and Korea). The IEA
forecasts that globally there will be about 15–20
million hybrids by 2020 and about 80 million by
2040.
The primary Asian markets taking up EVs are
expected to be China, Japan, and Korea (together
accounting for 75% of EV purchases in the Asian
market). EV penetration is more likely in China than
India, due to the Chinese manufacturing strength
and local production of rare earths like lithium,
essential for the production of batteries and electric
vehicles in general. By 2050, EVs are expected to
remain a small fraction of the fleet (less than 5%).
For CNGVs, governments are expected to put
CNG infrastructure programs in place, as part of
the drive to reduce dependency on imported oil,
and with air quality considerations in mind. In fact,
CNG vehicles are becoming increasingly popular in
the Asian market due to their low cost of CNG per
km compared with other fuels. In 2009, Asia is
estimated to have 11.4 million vehicles, with about
72% located in Pakistan, Argentina, Brazil, Iran,
and India. However, CNGVs will still constitute a
small fraction of the total stock. FCVs are expected
to stay at minimum level and potential. An increase
in fuel efficiency will have to become a main

Global Transport Scenarios 2050 World Energy Council
40
feature of the Asian automobile market over the
scenario period.
Asian air traffic will also increase, largely due to an
increase in population and economic growth. Over
the next 20 years, the overall Asian Pacific freighter
fleet is expected to grow five-fold, rising from 16%
of global fleet to almost 40%. Similarly, the Asian
Pacific passenger fleet is expected to grow three-
fold from 4,110 planes to 12,200 planes over the
next 20 years. India’s freighter fleet alone is
expected to grow 13.5 times by 2028. India needs
3,000 additional aircraft over the next decade to
maintain economic growth. Chinese investment in
air infrastructure over the next 10 years is planned
to be US$64 billion (100 new airports). India has
earmarked US$7 billion for airport expansion over
the next five years.
In Asia, improvements in road penetration and
highways will generate much higher traffic and
increasing fuel consumption in the future. In China
and India, transport fuel consumption is expected
to rise to staggering levels, while the region will
continue to depend heavily on oil imports and will
seek increased cooperation from oil-exporting
countries like Saudi Arabia, Iran, UAE, and Russia
to service their demand. A move has begun to
exploit the resources of the central Asian region.
Consumption levels will increase across most of
the developing Asian economies. The
transportation sector will mostly use conventional
gasoline and diesel. In 2008, China consumed
about 1.3 million barrels per day of gasoline and
about 1.5 million barrels per day of diesel, OECD-
Asia consumed 1.3 million barrels per day of
gasoline and about 1.1 million barrels per day of
diesel, while the rest of Asia consumed 1.3 million
barrels per day of gasoline and about 1.7 million
barrels per day of diesel. Between 2000 and 2005,
passenger and freight transport were up 26% and
29.2%, respectively, in China. By 2050, China’s
transport-fuel consumption is expected to increase
from 150 mtoe to around 700 mtoe (mostly
conventional gasoline, diesel, and jet fuel).
Similarly, India’s transport-fuel consumption is
expected to increase from 50 mtoe to around 400
mtoe (mostly conventional gasoline, diesel, and jet
fuel). Moreover, OECD-Pacific transport-fuel
consumption is expected to remain at the current
level of around 200 mtoe (mostly conventional
gasoline, diesel, and jet fuel). Other Asia transport-
fuel consumption is expected to increase from 300
mtoe to around 550 mtoe (mostly conventional
gasoline, diesel, and jet fuel).
Developing countries in Asia are also expected to
consume 16mtoe (322,000 barrel per day) of
biofuels in 2030 (China, 7.9 mtoe; India, 2.4 mtoe;
Indonesia, 1.5 mtoe). Competitive biofuel
production can be achieved in Southeast Asian
countries which produce palm oil. In 2008, about
4% of global biofuels were produced in Asia (3 out
of 67 billion liters). While competitive biofuel
production in Asia can be achieved through the
large-scale farming of oil palms in Southeast Asia,
this can threaten local agriculture and cause
widespread ecological damage through
deforestation.
Global Transport Scenarios 2050 World Energy Council
41
6.3 Europe and Russia
Between 1990 and 2008, the EU grew by 2.2% per
year, slightly below the global average of 3.3%,
while Russia grew by 0.6% a year. In Europe, the
inflation of average consumer prices in 2010 was
about 2% while the average unemployment rate
was about 9.3%. Growth in the EU zone is
expected to slow down because of the debt crises
hitting Greece (net debt is 125% of its GDP); Italy
(net debt is 101% of its GDP); Belgium (net debt is
80% of its GDP); Portugal (net debt is 75% of its
GDP); and Ireland (net debt is 70% of its GDP). It
is widely expected that Greece will default on
paying its loans and will expose many European
banks (mainly French). Austerity measures will also
slow down growth in the EU zone. Through 2035,
the World Bank expects the EU to grow at 1.6% a
year, while Russia grows at 3%. On the GDP per
capita levels, the Euro area had a GDP per capita
of about $32,772 in 2010, while Russia had about
$8,684 per capita.
As for population, Europe’s population stood at
around 723 million in 2008. The current population
growths are about -0.1% per year for Russia and
0.4% per year for the EU. Most of the EU’s
population growth is in the northern EU (0.6% per
year). Germany, Hungary, and the UK experienced
negative population growth rate in 2010. Around
15% of the Russian population is below 14 years
old, while for the EU it is about 17%. The 2005 data
showed that the EU-25 dependency ratio grew by
1.3% per year, and reached 25% over the last
decade. Through 2035, Russia’s population is
expected to grow at 0.4% per year, while the EU’s
population is expected to grow by 0.2% a year.
With moderate growth in both economic levels and
population, these countries remain politically
stable. This is despite the fact that financial crises
have lent minor instability to Ireland, Portugal, Italy,
and Greece. Other instabilities are expected in the
northern Spanish Basque province, and in Northern
Ireland. In the German Bundestag, the Green
Parliamentary Group has come to dominate
politics. As for Russia, it continues demonstrating
its fears of NATO and suffers instabilities on its
southern borders (Chechen Republic).
With regard to government frameworks, regulations
occur at the EU level, and EU member states have
to adopt them eventually, while Russia is still
heavily regulated. The OECD Europe countries
have fully liberalized markets, while the non-OECD
Europe countries are gradually privatizing non-
performing public assets, especially in light of
financial crises. Privatization is still an issue in
Russia. Throughout the region, there is a wide
range of project-financing options. Corruption is at
a minimum in the western EU countries, but very
high for eastern EU countries and Russia (second
to South Asia). Bureaucracy is quite considerable
at the EU level. As for tax regulation, the VAT rate
at EU levels for energy products is quite low (15%
on average). Denmark, Hungary, and Sweden
have the highest VAT rates, at 25%. Tax
regulations are still a concern in most OECD
countries. The energy subsidies in the EU-15 were
estimated in 2001 to be about EUR29 billion. About
43% of these subsidies were for solid fuels, 30%
for oil and gas, 19% for renewables, and 8% for
nuclear. The EU’s average annual subsidies for
fossil fuels accounted for almost 75% of total EU
energy subsidies, with Italy, the Netherlands, and

Global Transport Scenarios 2050 World Energy Council
42
the United Kingdom providing the highest level of
support to the oil and gas sector. Subsidies are
also significant in Russia.
The region’s governments will have critical
challenges relating to infrastructure planning.
Currently, about 73% of the region’s population is
urban. The population density for EU is about 119
persons/sq km, while for Russia it is about 9
persons/sq km. The region’s transport modal split
is quite diverse. In 2008, it was about 45% roads,
11% rails, 4% inland waterways, 3% pipelines,
37% sea, and less than 1% air. To meet its
unilateral 20-20-20 commitment (cutting its
emissions by at least 20% of 1990 levels by 2020),
Europe aims to connect offshore grids in the North
Sea to consumption centres in central Europe; roll
out smart-grid technologies; diversify the gas
southern corridor (bringing gas in from Caspian
Basin, Central Asia, and Middle East); expedite the
Baltic Energy Market Interconnection Plan (to
reinforce the central European pipeline network);
and commission the first Electricity Highways by
2020. About 200 billion euros will need to be
invested until 2020 to meet these objectives.
Moreover, the existing EU-Russia transport
infrastructure is old and will be very expensive to
replace or modernize. As for HSR, about 24% of
the total EU-27 rail network is already HSR, with
about 12 HSR lines currently under construction.
Unfortunately, Russia is still lagging behind.
The increases in economic growth and population,
mainly in non-OECD Europe and Russia, will be
associated with an increase in vehicle ownership.
In 2005, OECD Europe vehicle ownership stood at
424 cars/1,000 capita while that of Eastern Europe
and Russia stood at 149 and 134 cars/1,000
capita, respectively. Through 2050, vehicle
ownership for OECD Europe is expected to
increase slightly, but will almost double for Russia
and non-OECD Europe. In Europe, diesel ICEs are
gaining popularity (constituting about 30% of
OECD’s LDV stocks). In 2005, LDV stocks stood at
about 228 million in OECD Europe, 18 million in
Eastern Europe, and 29 million in Russia. In the
same year, new car sales were about 16 million in
OECD Europe, 1.4 million in Eastern Europe, and 2
million in Russia. In addition, about 0.7 million used
cars were shipped from Western Europe to eastern
Europe, while about 0.3 million cars were shipped
from Japan to the FSU in 2005. Conventional
ICEVs dominate new sales, used sales, and
existing stocks. Through 2050, large efficiency
gains are expected in ICEVs due to improvements
in fuel and engine efficiencies. For hybrids, Europe
had sales of only 110,000 hybrid cars in 2010. In
the future, we expect an increase in the share of
hybrid vehicles in the region due to improvements
in their performances. The IEA forecasts that,
globally, there will be about 15–20 million hybrids
by 2020, and about 80 million by 2040.
Both FCVs and EVs are expected to remain at
minimum levels. The largest market for EVs is
expected to be Germany with 25% of the total
global EV market, followed by France with 20%,
and then the UK and Italy with 15% each. The EV
market will initially remain relatively small until
breakthroughs in charging and/or battery-storage
technologies are achieved post-2020. In some
countries, like Germany, Sweden, and Switzerland,
governments will introduce incentives and
regulations that will ensure the availability of

Global Transport Scenarios 2050 World Energy Council
43
electric public fleets much sooner than in other
countries. Regardless of the type of drivetrains, the
majority of car sales for EU car manufacturers will
shift towards Asia. More CNGVs are expected if
gas reserves are accessible.
For freight, the value of EU trade in 2008 (for both
export and import) was about EUR 1.4 trillion (EUR
576 billion in air, EUR 476 billion in road, and EUR
46.1 billion in rail). The region has the highest
number of commercial freight vehicles in the world
(33.97 million in 2008). Through 2029, it is
expected that Europe’s air freight will increase by
4.4% a year, while its passenger freight will
increase by 5% a year. For the Commonwealth of
Independent States (CIS), it is expected that the air
freight will grow by 4.8% and passenger freight will
grow by 5.7% a year. By 2029, the air fleet in
Europe is expected to increase from 4,300 to 7,460
airplanes, while in the Commonwealth, it is
expected to increase from 1,150 to 1,300 airplanes.
To fuel the transportation sector in Europe,
strategies that create links to Central Asia reserves
are required. With regard to gas, the EU as a whole
will remain heavily dependent on Russian supplies,
and is expected to last for a few more decades,
especially in light of the current move away from
nuclear (e.g., Germany). In 2008, the OECD
Europe transportation market was dominated by
gasoline, diesel, and jet fuel. It consumed about
two million barrels per day of gasoline and about
four million barrels per day of diesel. Non-OECD
Europe and Russia transportation markets were
similarly dominated by gasoline, diesel, and jet fuel.
They consumed about 1 million barrels per day of
gasoline and about 0.6 million barrels per day of
diesel. By 2050, fuel consumptions levels in all
countries in OECD Europe, eastern Europe, and
Russia are expected to remain almost at current
levels. The EU’s biofuels production in 2009 was
about 0.18 million barrels per day (about 17% of
the global), mostly comprising biodiesel (110,000
barrels per day and bioethanol 46,000 barrels per
day). In the optimistic 450 scenario, the IEA
expects OECD Europe biofuels consumption to be
0.97 million barrels per day () and consumption in
non-OECD EU countries to be 0.1 million barrels
per day.
6.4 North America
In 2010, the US and Canada together accounted
for 40% of the world’s GDP, which was about
US$37.2 trillion. Historically, the economic growth
rates for US and Canada have been about 2.8%
year. Through 2035, it is expected that North
American GDP growth will be around 2.2%. The
US suffers from high gross debt (annual) as a
percentage of its GDP, which is expected to
continue rising over the next two years. The net
debt currently stands at about 75% of its GDP. The
current US unemployment rate stands at 9.2% and
is expected to fall over the next five years. The
GDP per capita for the US is about $45,989, for
Canada about $39,599, and for Mexico about
$8,143; in comparison, the global average is about
$8,599.
Regarding population, the North American
population stood at around 447 million in 2008,
comprising the US with about 310 million, Mexico
with about 110 million and Canada with the
remaining 27 million. The current population growth

Global Transport Scenarios 2050 World Energy Council
44
is about 1.3% for Canada, 1% for the US, and
0.9% for Mexico. In terms of demographics, around
17% of the Canadian population is below 14 years
old. The share is about 20% for the US, and about
29%for Mexico. Mexico has only 6% of the
population above 65 years, while both Canada and
the US have about 13%. Through 2035, both the
US population and North American population are
expected to grow at 0.7%per year. The US Census
Bureau projects the US will be world’s third most
populous nation through 2050 (comprising 423
million), behind India and China.
With this growth in both population and economic
performance, the region remains politically stable.
The US is increasingly characterized by bipartisan
politics, which will lend an element of uncertainty to
long-term energy policies.
In terms of regulations, the region’s governments
will sustain fully liberal markets, encouraging
competition, focusing on increasing energy
efficiency, and boosting the contribution of
renewables. Canada will continue to develop oil
sands with international players. In R&D, the region
will remain an innovation hub (especially the US),
with many activities focused on developing new
technologies, especially electric transport. Finance
sources in the region are available and expected to
remain so in the future, depending on the economic
performance of these countries. Corruption
remains at minimum levels. Bureaucracy remains
at moderate levels. Like the rest of the OECD
countries, taxes remain high in most markets. The
US Federal subsidies for energy have more than
doubled between 1999 and 2007. In 2007, the US
government spending on energy subsidies was
about $16.6 billion: $4.8 billion for renewables, $2.8
billion for end use, $2.3 billion for refined coal, $2.1
billion for natural gas and petroleum liquids, $1.2
billion for nuclear, $1.2 billion for electricity, $0.9
billion for coal, and $0.9 billion for conservation. In
the same year, Canada spent CAD 1.4 billion on oil
and gas subsidies alone. The expenditure on oil
sands from 1996–2002 was CAD 1.2 billion. With
the exception of Mexico, energy infrastructure
across the region remains highly sophisticated.
Pipelines, especially the gas network in the US, are
fully developed. Efforts are focused on linking
Canadian oil sands to US ports and refineries via
pipelines.
With regard to urban planning, the region is the
second-highest urban land area worldwide after
Asia, and the second-lowest urban population
density after Oceania. The region has a high
urbanization rate: about 82% of the population in
the US, 77% in Mexico, and 81% Canada live in
urban areas. North American cities are quite
spread out and consequently urban consumption of
fuel is the highest in the world. Around 80% of
urban transport is via individual motorized
transport, so automobile usage is more than
10,000km/person/year. Intermodal rail traffic in the
US has significantly increased over the past two
decades.
Increasing electrification of public transport is
expected in urban areas, but the developments of
high speed railways across state boundaries are
more uncertain. Within the next 25 years, the
current US administration aims to roll out high-
speed rail to over 80% of the American population.
It has about $10 billion of grant funding available to

Global Transport Scenarios 2050 World Energy Council
45
do this, and, so far, 59 projects have been
allocated $6 billion. Currently, the US have 362 km
of HSR and plans for another 900 km. Public
support for this initiative will be crucial for success
and will depend on the development of gasoline
prices over the next decades.
For individual transport, vehicle ownership in 2005
stood at 710 vehicles per 1,000 population in the
US (with growth rate of 1.6% per year); 535 for
Canada (with growth rate of 1.6% per year); and
142 for Mexico (growth rate of 2.8% per year). ICE
technology remains the dominant transport
technology in the region, in both new and used
cars. The US government has mandated higher
energy efficiency of 22.5 miles per gallon (mpg) for
cars and 18 mpg for light trucks. LDV stocks in
2005 were at 211 million in the US, 17 million in
Canada, and 15 million in Mexico; sales were 14.7
million in US, 1.3 million in Canada, and 1.3 in
Mexico. In 2005, about 0.47 million used cars went
from the US to Mexico, and about 0.2 million went
from the US to Canada. Within the US, there were
about 0.5 million used cars sold. The US’s Federal
government acquisition of hybrids is growing
yearly, but is still at a very low level (only 4,853
vehicles in 2010). The demand and market share
for hybrids are both rising, but are still low (290,000
units sold in 2010). The total hybrid fleet is now
reaching 2 million cars (around 1%–2% of the
global stock, of which most are Toyota Prius,
followed by Honda Civic). It is expected that there
will be about 15 to 20 million hybrids by 2020, and
about 80 million by 2040.
The EV’s adoption is expected in urban areas,
where distance travelled is within the vehicle range.
The US is expected to be the second-largest EV
market after Asia. For CNGVs, the region’s market
is still at low levels, compared to its potential. It is
possible that CNG engines for heavy- and medium-
duty vehicles will be developed, since the US has
the world’s largest trucking market, and low gas
prices are projected due to abundant reserves of
unconventional gas. FCVs are still in the
development stages: the IEA believes that the
likelihood of FCVs emerging as a future low-carbon
option is lower than that of switching to EVs.
Research on fuel cells is likely to continue in the
US under government support programs.
In the US, the largest transportation market, it is
estimated that around 45% of goods by value are
handled by water, 25% by air, and 24% by land
(truck, rail, and pipelines). Between 2007 and
2050, it is expected that shipping activities will
increase by 150% to 300%. In addition, it is
expected that passenger travel in North America
will increase by 3.4% a year, while freight will
increase by about 5% a year over the next 20
years. The number of passenger planes is
expected to increase from 6,590 to 9,000 airplanes.
To fuel this transportation market, the US is
expected to remain dependent on imported oil. US
shale plays will continue to be developed in the US,
with increasing focus on developing liquid plays.
Canada will be developing its oil sands to their full
potential. In 2008, the North American
transportation market was dominated by gasoline,
diesel, and jet fuel. In fact, the region consumed
about 9 million barrels per day of gasoline and
about 3.4 million barrels per day of diesel. The US
alone consumes about 20 million barrels per day of

Global Transport Scenarios 2050 World Energy Council
46
petroleum products with the transportation sector
accounting for about 69.7% of total petroleum use
(13.3 million barrels per day, 58% gasoline, and
21% diesel). The demand in North America is
expected to increase from 700 mtoe in 2005 to
around 800 mtoe in 2050. Light trucks account for
31% of energy use, followed by cars and
motorcycles at 28%, other trucks 16%, aircraft 9%,
and boats and ships 5% (with others covered by
the remaining percentage).
In 2009, the US’s biofuels consumption was 0.7
million barrels per day, the world’s highest, while
the production was about 0.585 million barrels per
day of bioethanol and about 44,000 barrels per day
of biodiesel (about 45% of the global total, mostly
comprising bioethanol from maize). By 2035, the
IEA expects the US to account for 38% of the
global biofuels market. The US is targeting a
production level of 1.162 million barrels per day by
2022 (a growth rate of about 5% per year). Current
legislation allows for E10 blending and the farmers’
lobby remains keen on increasing it to E15. It is
expected that biofuels will continue to grow,
although there may be increasing opposition to
bioethanol subsidies. In 2009, the IEA estimated
that support for biofuels will be around US $8.1
billion.
6.5 Latin America and the
Caribbean (LAC)
Currently, the GDP per capita for LAC is about
$7,260 (about $8,230 for Brazil). The IMF expects
growth in the region to be 4.75% in 2011 and
4.25% in 2012. Through 2035, the GDP growth for
LAC is expected to be about 3% per year (about
3.3% for Brazil). Growth will be commodity-based
and driven by demand from China.
In 2008, the LAC population stood at 468 million
(42%, or 194 million, of which is in Brazil). The
region’s population growth was about 1.1% a year
(0.9% for Brazil) and has been decreasing since
the 1990s. About 28% of the total population is
under 14 years (26% in Brazil). Through 2035, LAC
is expected to grow by 0.8% a year (Brazil at
0.5%).
The region has been undergoing political turmoil,
except for Brazil, which has undergone a
presidency change and is now stable. Venezuela
continues to face uncertainty under Chavez,
especially with his failing health. The overall
political stability in the region ranges from medium
to volatile.
As for governments, most energy companies are
government-owned and run, or at least the
government is the majority shareholder. The region
began liberalizing its trade practices between 1980
and 1990, and active trading is taking place within
the region with ALADI, CARICOM, etc. R&D levels
remain low and dependent on technology transfers
from developed the more countries. Brazil started
taking a role on par with western companies in the
biofuels sector, in which a large number of
international cooperation agreements are signed.
Chile, Mexico, Argentina, and Uruguay have
consumption levels that are above world average.
Finance and funding are quite limited. Funding is
limited to infrastructure projects from China, and
international organisations like the World Bank and

Global Transport Scenarios 2050 World Energy Council
47
International Finance Corporation. Chinese funding
for infrastructure projects in energy and
commodities is currently estimated at around US$
4 billion per year. Corruption and bureaucracy
remain at high levels. Tax regulations are about
average. On subsidies, Venezuela holds the
world’s seventh highest fossil-fuel consumption
subsidy (mostly in oil), estimated at around $12
billion in 2009. Mexico also has fuel subsidies, but
these are very low in comparison.
The region also spends around 2% of its GDP per
year on infrastructure and will need to spend about
4–6% per year to sustain growth. Brazil and Chile
have invested heavily in developing their fossil and
mineral resources. Across the region, government
provides most investment in infrastructure. The
region has high levels of urbanization (78% for LAC
and 86% for Brazil) and has three megacities in the
top 25 megacities worldwide (Sao Paulo, Buenos
Aires, and Rio de Janeiro). Of these, Rio is the
fastest growing at 0.66% per year. Currently, HSR
is not yet under consideration and the railways are
undergoing privatization. The region is considered
a global leader in BSRs. The first system built was
in Curitiba, Brazil, other examples now include
Bogota, Sao Paulo, Guayaquil, etc.
The average ownership rate is about 78 cars per
1,000 capita. In Argentina, car ownership is about
186 vehicles per 1,000 population (avg. AGR:
3.1%); in Brazil about 121 vehicles per 1,000
population (avg. AGR: 4.6%); and in Chile 144
vehicles per 1,000 population (avg. AGR: 5.4%).
ICEVs are and will continue to remain dominant in
the region. Engines in Brazil are Flex Fuel Vehicles
(FFVs). In fact, the FFVs in Brazil account for 40%
of the car fleet. This is incentivized by government
policies towards biofuels. The Latin American
region have the highest number of FFVs globally
due to widespread blending of ethanol in gasoline.
Hybrids, EVs, CNGVs, and FCVs are at minimum
levels and potential. Brazil, Chile, Peru, Argentina,
and Bolivia are all set to experience economic and
transport growth in the coming decades due to
mineral wealth exploitation.
To fuel its transportation sector, Brazil has
embarked on developing its sub-salt oil reserves.
Ultra-deep water drilling has changed the oil
picture. Development of Venezuela’s hydrocarbon
reserves has slowed during the Chavez regime.
The region also has significant reserves of
conventional gas in Venezuela, Bolivia, Argentina,
Mexico, and Trinidad and Tobago. In general, the
region is still heavily dependent on conventional
gasoline, diesel, and jet fuel and is expected to
remain dependent on these fuels through 2050. In
2008, LAC consumed about 47 mtoe (about
939,000 barrels per day) of gasoline and 62 mtoe
(about 1.236 million barrels per day) of diesel. The
region’s fuel consumption is expected to double
between 2005 and 2050, from 150 mtoe to reach
around 300 mtoe. Regarding biofuels, Brazil is the
second-largest biofuel producer (after the US) with
a production level of 27% of the global total, mostly
comprising bioethanol from sugar cane (0.467
million barrels per day) and around 19,000 barrels
per day of biodiesel. Consumption of biofuels in the
region in 2009 was 0.35 million barrels per day,
with Brazil’s consumption alone accounting for 0.31
million barrels per day. The balance was exported
(mainly to the EU and US). These large increases
in biofuel cultivation are likely to put increasing
Global Transport Scenarios 2050 World Energy Council
48
pressure on sugar crops, land and water
resources, and will eventually reach natural
resource limits.
On aviation and hauling, the main mode of
transport is road. Most of the haulage is carried via
medium trucks. As for aviation, it is expected that
the number of aircraft in the region in 2029 will be
2,770, up from today’s level of 1,130. Through
2029, air cargo traffic is expected to increase by
6.9% a year, and the passenger traffic by 6.7% a
year.
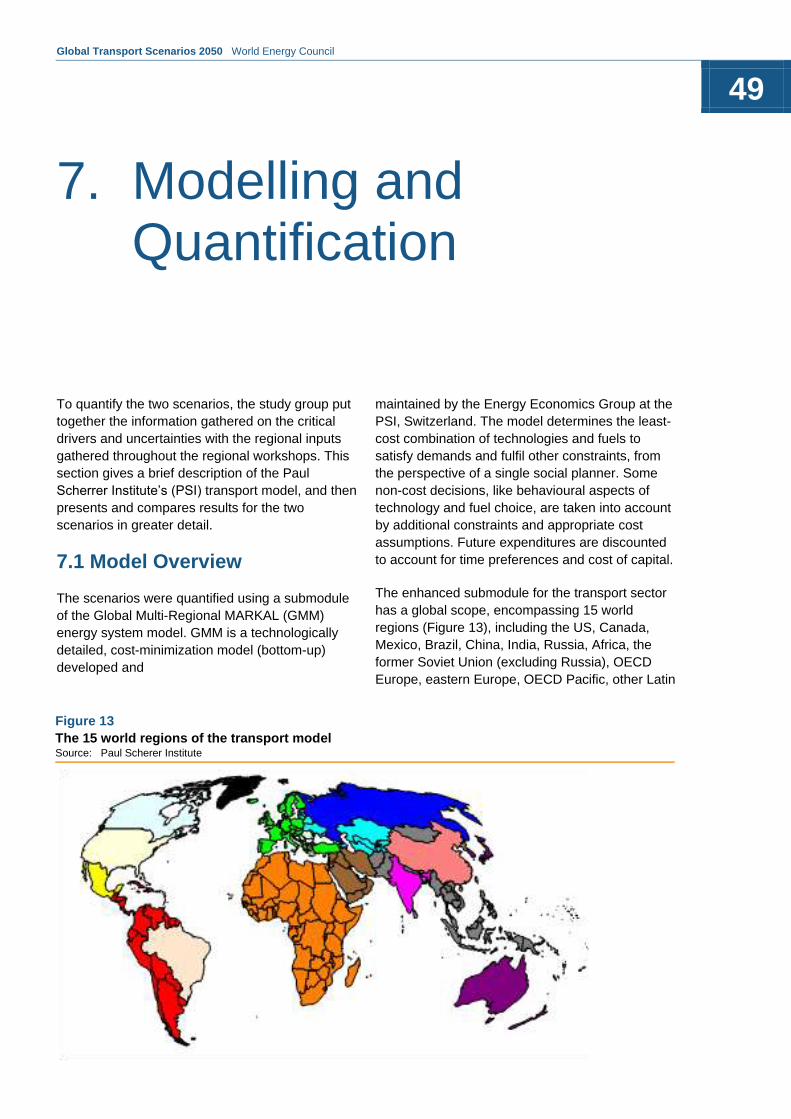
Global Transport Scenarios 2050 World Energy Council
49
Figure 13
The 15 world regions of the transport model Source: Paul Scherer Institute
To quantify the two scenarios, the study group put
together the information gathered on the critical
drivers and uncertainties with the regional inputs
gathered throughout the regional workshops. This
section gives a brief description of the Paul
Scherrer Institute’s (PSI) transport model, and then
presents and compares results for the two
scenarios in greater detail.
7.1 Model Overview
The scenarios were quantified using a submodule
of the Global Multi-Regional MARKAL (GMM)
energy system model. GMM is a technologically
detailed, cost-minimization model (bottom-up)
developed and
maintained by the Energy Economics Group at the
PSI, Switzerland. The model determines the least-
cost combination of technologies and fuels to
satisfy demands and fulfil other constraints, from
the perspective of a single social planner. Some
non-cost decisions, like behavioural aspects of
technology and fuel choice, are taken into account
by additional constraints and appropriate cost
assumptions. Future expenditures are discounted
to account for time preferences and cost of capital.
The enhanced submodule for the transport sector
has a global scope, encompassing 15 world
regions (Figure 13), including the US, Canada,
Mexico, Brazil, China, India, Russia, Africa, the
former Soviet Union (excluding Russia), OECD
Europe, eastern Europe, OECD Pacific, other Latin
7. Modelling and Quantification

Global Transport Scenarios 2050 World Energy Council
50
America and the Caribbean (excluding Brazil and
Mexico), other Asia (excluding India and China),
and the Middle East. For each region, specific
scenario assumptions are applied to the dynamics
of technology characteristics, transport demands,
and other factors. Regional and technology
differentiation leads to a large-scale optimization
model with approximately 40,000 equations and
30,000 variables.
The transport model is calibrated to technology
activity and capacity statistics for the year 2005.
The calibration includes current demands for each
subsector, currently available fuelling options, and
technology and fuel shares, as well as estimates
on current costs of fuels and of technologies. The
reported model horizon is year 2050, with a step
length of five years. To ensure a better
representation of the year 2010 for this report, the
Table 8 Input parameter (exogenous variables)
Input parameter (exogenous variables) Unit/Level
General Base year 2005
Time horizon 2050
Time step 5 year
LDV Technology lifetime 15 years
Discount rate 5%
Annual GDP growth rate %
Population million
LDV Motorization rate car/1,000 capita
Share of LDV types (base year 2005) million
LDV mileage 1000 v-km/y/car
LDV transport demand billion v-km/y
LDV efficiency MJ/km
LDV efficiency targets gCO2/km
Share of short-range cars 10 % (v-km/y)
LDV size of batteries and FCV kWh and kW / car
Fixed O&M cost $(2000)/car/y
LDV investment cost $(2000)/car/y
Investing costs for battery and FCV $(2000)/kWh
Investment cost adjustments %
MeOH & EtOH blend % (J)
Other surface transports Other surface transport demand PJ
Share of fuelling options (base year 2005) PJ
Aggregated efficiency J(in)/J(out)
Aggregated cost $(2000)/J
MeOH & EtOH % blend % (J)
Aviation Aviation transport demand PJ
Aggregated efficiency J(in)/J(out)
Aggregated cost $(2000)/J
Blend of biodiesel in aviation fuel % (J)
Fuels Share of fuels (base year 2005) % (J)
CO2-emission of fuels gC/J
CO2-taxes $(2000)/gC
Biofuel targets J or %(J)
Fuel cost $(2000)/J
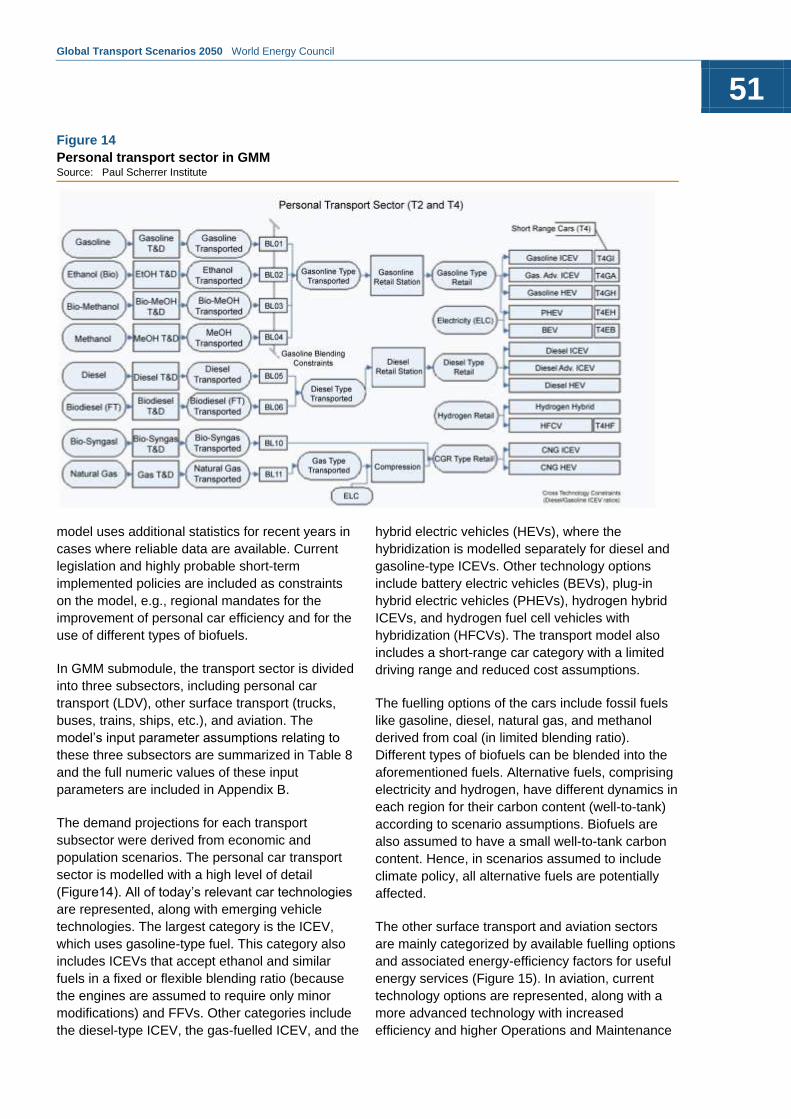
Global Transport Scenarios 2050 World Energy Council
51
model uses additional statistics for recent years in
cases where reliable data are available. Current
legislation and highly probable short-term
implemented policies are included as constraints
on the model, e.g., regional mandates for the
improvement of personal car efficiency and for the
use of different types of biofuels.
In GMM submodule, the transport sector is divided
into three subsectors, including personal car
transport (LDV), other surface transport (trucks,
buses, trains, ships, etc.), and aviation. The
model’s input parameter assumptions relating to
these three subsectors are summarized in Table 8
and the full numeric values of these input
parameters are included in Appendix B.
The demand projections for each transport
subsector were derived from economic and
population scenarios. The personal car transport
sector is modelled with a high level of detail
(Figure14). All of today’s relevant car technologies
are represented, along with emerging vehicle
technologies. The largest category is the ICEV,
which uses gasoline-type fuel. This category also
includes ICEVs that accept ethanol and similar
fuels in a fixed or flexible blending ratio (because
the engines are assumed to require only minor
modifications) and FFVs. Other categories include
the diesel-type ICEV, the gas-fuelled ICEV, and the
hybrid electric vehicles (HEVs), where the
hybridization is modelled separately for diesel and
gasoline-type ICEVs. Other technology options
include battery electric vehicles (BEVs), plug-in
hybrid electric vehicles (PHEVs), hydrogen hybrid
ICEVs, and hydrogen fuel cell vehicles with
hybridization (HFCVs). The transport model also
includes a short-range car category with a limited
driving range and reduced cost assumptions.
The fuelling options of the cars include fossil fuels
like gasoline, diesel, natural gas, and methanol
derived from coal (in limited blending ratio).
Different types of biofuels can be blended into the
aforementioned fuels. Alternative fuels, comprising
electricity and hydrogen, have different dynamics in
each region for their carbon content (well-to-tank)
according to scenario assumptions. Biofuels are
also assumed to have a small well-to-tank carbon
content. Hence, in scenarios assumed to include
climate policy, all alternative fuels are potentially
affected.
The other surface transport and aviation sectors
are mainly categorized by available fuelling options
and associated energy-efficiency factors for useful
energy services (Figure 15). In aviation, current
technology options are represented, along with a
more advanced technology with increased
efficiency and higher Operations and Maintenance
Figure 14
Personal transport sector in GMM Source: Paul Scherrer Institute

Global Transport Scenarios 2050 World Energy Council
52
Table 9 Output (endogenous variables)
Model output (endogenous variables) Unit
Fuel demand for cars J
Fuel demand for other surface transport J
Fuel demand for aviation J
LDV technology share v-km/y
Other surface transport shares J
Aviation technology share J
CO2 emissions gC
CO2 emissions from cars gC
(O&M) costs (excluding fuel costs), while fuelling
options include conventional kerosene, and
synthetic biomass- and coal-to-liquids fuels.
The statistics for calibrating the transport model
and the data for the parameter assumptions are
from various sources. Many data sets were taken
from the full GMM energy model, while some
others were taken from sources including IEA, Oak
Ridge National Laboratory’s Transportation Energy
Data book, the Annual Energy Outlook from the US
Department of Energy, hybrid-car sale statistics
from car manufacturers, and statistics from the
International Gas Union, the International Road
Federation, and the International Council on Clean
Transportation.
The calibrated model solves for the minimum cost-
optimal allocation for the global transport sector. As
Table 9 shows, the model’s output variables
include fuel demand, technology shares, and
emissions from the three main sectors of the
model, namely LDVs, other surface transport, and
aviation.
Figure 15
Other surface transport and aviation sectors in GMM Source: Paul Scherrer Institute

Global Transport Scenarios 2050 World Energy Council
53
Figure 16
Fuels for LDV cars
(a) Demand between 2010 and 2050 (b) Demand of OECD vs. non-OECD (EJ)
7.2 Modelling Results
In this section, we briefly present and discuss the
results for the two scenarios with regard to (1) fuel
demands for LDV cars, other surface transport, and
aviation, and for overall transport; (2) the number of
cars in circulation; and (3) CO2 emissions from cars
and from the overall transport sector. We also
compare the results for the two scenarios. The full
detailed modelling results are included in Appendix C.
7.3 Results for Freeway
Fuel Demand
In Freeway, global fuel consumption for cars is
expected to increase by about 51% between 2010
and 2050 (Figure 16a). The world’s car fleet will still
depend heavily on gasoline and diesel, which will
still constitute about 80% of the fuel mix in 2050.
Biofuels will constitute around 12%, while CNG will
provide about 5%. Comparing the demand pattern
between 2010 and 2050, we can note that the bulk
of the demand will be in the non-OECD countries
(increasing from 26% to 63%) rather than OECD
countries, and that the demand will still be
dominated by gasoline and diesel (Figure 16b).
Looking at global fuel consumption for the other
surface transport and aviation, the results show
that the fuel demand in 2050 will be double the
2010 level (Figure17a). Again, the world will still
depend on fossil fuels, within which diesel, fuel oil and
jet fuel will constitute around 94%, and most of the

Global Transport Scenarios 2050 World Energy Council
54
Figure 18
Fuels in all transport
(a) Demand between 2010 and 2050 (b) Demand of OECD vs. non-OECD (EJ)
0
10
20
30
40
50
60
Oth
er
(Coa
l)
Me
than
ol
Bio
-Syn
ga
s
CN
G
Ele
ctr
icity
Hydro
gen
Bio
-Je
t F
ue
ls
Bio
-Me
tha
nol
Bio
-Eth
ano
l
Bio
fue
l (D
iese
l)
Jet
Fue
ls
Ga
solin
e
Die
se
l &
Fu
elo
il
Oth
er
(Coa
l)
Me
than
ol
Bio
-Syn
ga
s
CN
G
Ele
ctr
icity
Hydro
gen
Bio
-Je
t F
ue
ls
Bio
-Me
tha
nol
Bio
-Eth
ano
l
Bio
fue
l (D
iese
l)
Jet
Fue
ls
Ga
solin
e
Die
se
l &
Fu
elo
il2010 2050
OECD Non-OECD
remaining 6% will be provided by electricity.
Between 2010 and 2050, the bulk of the demand
will be in the non-OECD countries rather than
OECD countries and will be primarily conventional
diesel (Figure 17b).
In the global transportation sector under Freeway
there will be an increase of 82% in fuel demand
and continuing dependence on gasoline (19%),
diesel and fuel oil (50%), and jet fuel (20%),
totalling 89% (Figure 18a). The remaining fuel
share will be mostly biofuels (5%) and electricity
(4%). As with the demand pattern for cars, the bulk
of the demand will shift to the non-OECD countries
(shares increasing from 40% to 67%) rather than
OECD countries, and will still be dominated by the
four major transport fuels, namely gasoline, diesel,
fuel oil and jet fuel (Figure 18b).
Figure 17
Fuel in other surface transport and aviation
(a) Demand between 2010 and 2050 (b) Demand of OECD vs. non-OECD (EJ)
0
5
10
15
20
25
30
35
40
45
50
Ele
ctr
icity
Hydro
gen
Bio
-Syn
ga
s
CN
G
Bio
fue
l (D
iese
l)
Die
se
l &
Fu
elo
il
Me
than
ol
Bio
-Me
tha
nol
Bio
-Eth
ano
l
Ga
solin
e
Bio
-Je
t F
ue
l
Jet
Fue
l
Ele
ctr
icity
Hydro
gen
Bio
-Syn
ga
s
CN
G
Bio
fue
l (D
iese
l)
Die
se
l &
Fu
elo
il
Me
than
ol
Bio
-Me
tha
nol
Bio
-Eth
ano
l
Ga
solin
e
Bio
-Je
t F
ue
l
Jet
Fue
l
2010 2050
OECD Non-OECD
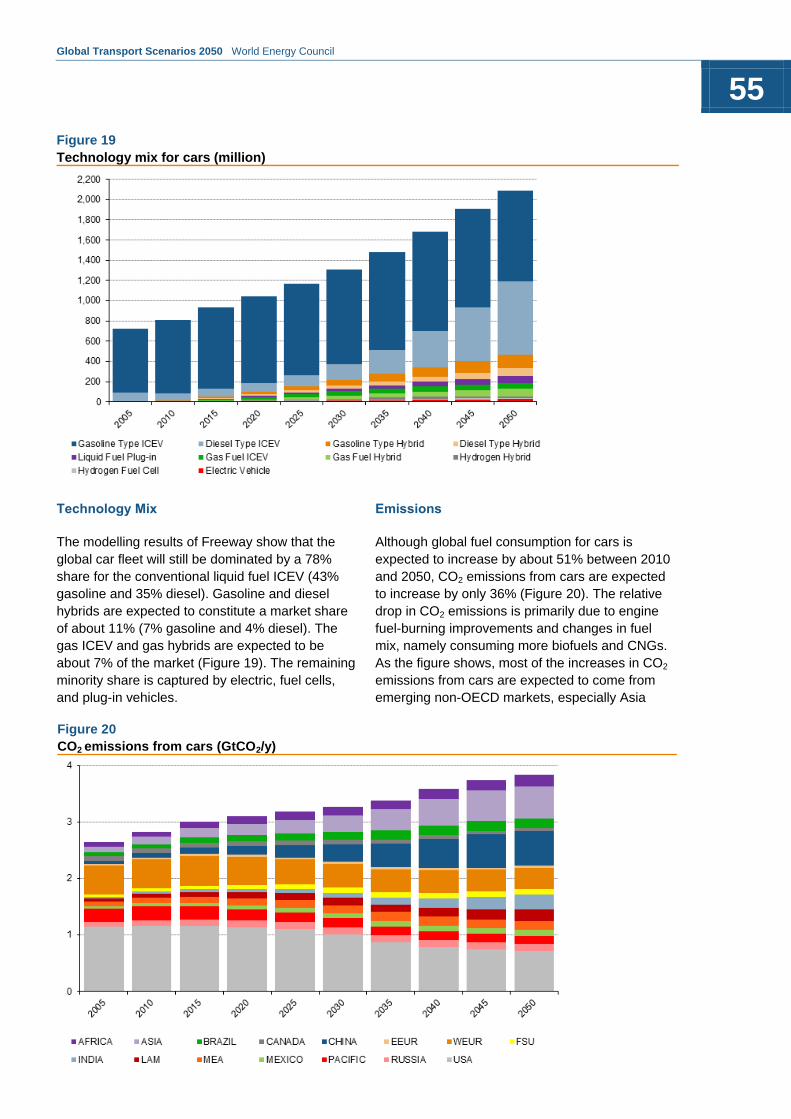
Global Transport Scenarios 2050 World Energy Council
55
Figure 20
CO2 emissions from cars (GtCO2/y)
Technology Mix
The modelling results of Freeway show that the
global car fleet will still be dominated by a 78%
share for the conventional liquid fuel ICEV (43%
gasoline and 35% diesel). Gasoline and diesel
hybrids are expected to constitute a market share
of about 11% (7% gasoline and 4% diesel). The
gas ICEV and gas hybrids are expected to be
about 7% of the market (Figure 19). The remaining
minority share is captured by electric, fuel cells,
and plug-in vehicles.
Emissions
Although global fuel consumption for cars is
expected to increase by about 51% between 2010
and 2050, CO2 emissions from cars are expected
to increase by only 36% (Figure 20). The relative
drop in CO2 emissions is primarily due to engine
fuel-burning improvements and changes in fuel
mix, namely consuming more biofuels and CNGs.
As the figure shows, most of the increases in CO2
emissions from cars are expected to come from
emerging non-OECD markets, especially Asia
Figure 19
Technology mix for cars (million)
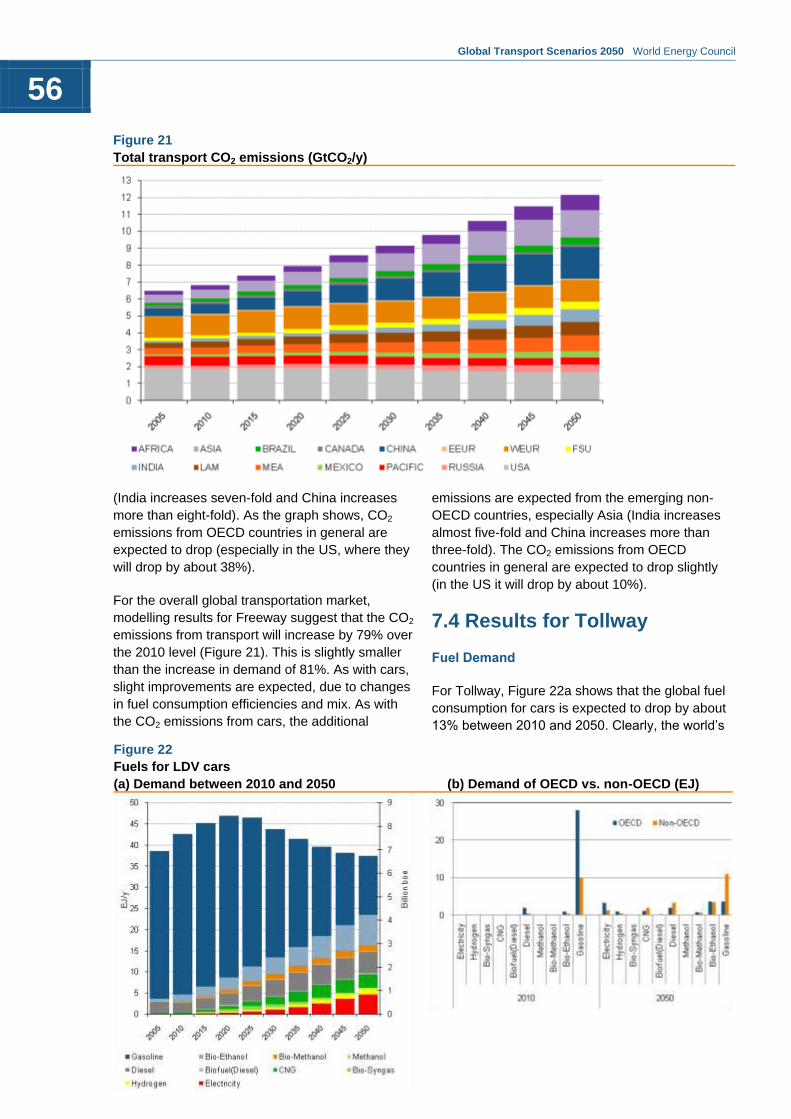
Global Transport Scenarios 2050 World Energy Council
56
Figure 22
Fuels for LDV cars
(a) Demand between 2010 and 2050 (b) Demand of OECD vs. non-OECD (EJ)
(India increases seven-fold and China increases
more than eight-fold). As the graph shows, CO2
emissions from OECD countries in general are
expected to drop (especially in the US, where they
will drop by about 38%).
For the overall global transportation market,
modelling results for Freeway suggest that the CO2
emissions from transport will increase by 79% over
the 2010 level (Figure 21). This is slightly smaller
than the increase in demand of 81%. As with cars,
slight improvements are expected, due to changes
in fuel consumption efficiencies and mix. As with
the CO2 emissions from cars, the additional
emissions are expected from the emerging non-
OECD countries, especially Asia (India increases
almost five-fold and China increases more than
three-fold). The CO2 emissions from OECD
countries in general are expected to drop slightly
(in the US it will drop by about 10%).
7.4 Results for Tollway
Fuel Demand
For Tollway, Figure 22a shows that the global fuel
consumption for cars is expected to drop by about
13% between 2010 and 2050. Clearly, the world’s
Figure 21
Total transport CO2 emissions (GtCO2/y)

Global Transport Scenarios 2050 World Energy Council
57
Figure 24
Fuels in all transport
(a) Demand between 2010 and 2050 (b) Demand of OECD vs. non-OECD (EJ)
-
5.000
10.000
15.000
20.000
25.000
30.000
35.000
40.000
45.000
Oth
er
(Coa
l)
Bio
-Je
t F
ue
l
Me
than
ol
Bio
-Me
tha
nol
Bio
-Eth
ano
l
Bio
-Syn
ga
s
CN
G
Bio
fue
l (D
iese
l)
Ele
ctr
icity
Hydro
gen
Jet
fue
ls
Ga
solin
e
Die
se
l &
Fu
elo
il
Oth
er
(Coa
l)
Bio
-Je
t F
ue
l
Me
than
ol
Bio
-Me
tha
nol
Bio
-Eth
ano
l
Bio
-Syn
ga
s
CN
G
Bio
fue
l (D
iese
l)
Ele
ctr
icity
Hydro
gen
Jet
fue
ls
Ga
solin
e
Die
se
l &
Fu
elo
il
2010 2050
OECD Non-OECD
car fleet will still depend on fossil fuels as gasoline
and diesel will still constitute about 52% of the fuel
mix in 2050, comprising 38% for gasoline and 14%
for diesel. Biofuels will increase to a higher level of
around 24%, electricity will reach 12%, while CNG
will be about 8%. The remaining demand will be
satisfied by hydrogen, methanol, and syngas.
Comparing the demand pattern for car fuels
between 2010 and 2050, we can see that the bulk
of the demand will be in the non-OECD countries
(increasing from 26% in 2010 to 62% in 2050),
rather than OECD countries, and that the demand
will still be dominated by gasoline and diesel
(Figure 22b).
Figure 23
Fuel in other surface transport and aviation
(a) Demand between 2010 and 2050 (b) Demand of OECD vs. non-OECD (EJ)
-
5.000
10.000
15.000
20.000
25.000
30.000
35.000
40.000
Ele
ctr
icity
Hydro
gen
Bio
-Syn
ga
s
CN
G
Bio
fue
l (D
iese
l)
Me
than
ol
Bio
-Me
tha
nol
Bio
-Eth
ano
l
Jet
Fue
ls
Die
se
l &
Fu
elo
il
Ga
solin
e
Bio
-Je
t F
ue
l
Ele
ctr
icity
Hydro
gen
Bio
-Syn
ga
s
CN
G
Bio
fuel (D
iesel)
Me
than
ol
Bio
-Me
tha
nol
Bio
-Eth
ano
l
Jet
Fue
ls
Die
se
l &
Fu
elo
il
Ga
solin
e
Bio
-Je
t F
ue
l
2010 2050
OECD Non-OECD
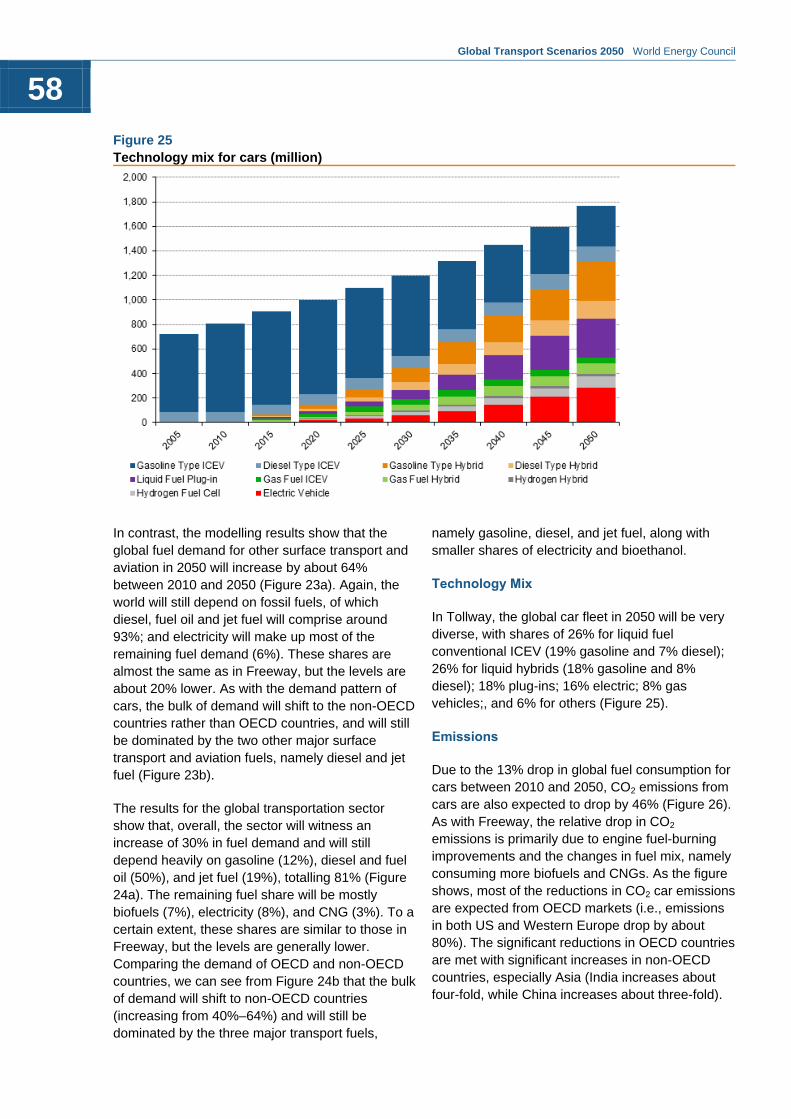
Global Transport Scenarios 2050 World Energy Council
58
In contrast, the modelling results show that the
global fuel demand for other surface transport and
aviation in 2050 will increase by about 64%
between 2010 and 2050 (Figure 23a). Again, the
world will still depend on fossil fuels, of which
diesel, fuel oil and jet fuel will comprise around
93%; and electricity will make up most of the
remaining fuel demand (6%). These shares are
almost the same as in Freeway, but the levels are
about 20% lower. As with the demand pattern of
cars, the bulk of demand will shift to the non-OECD
countries rather than OECD countries, and will still
be dominated by the two other major surface
transport and aviation fuels, namely diesel and jet
fuel (Figure 23b).
The results for the global transportation sector
show that, overall, the sector will witness an
increase of 30% in fuel demand and will still
depend heavily on gasoline (12%), diesel and fuel
oil (50%), and jet fuel (19%), totalling 81% (Figure
24a). The remaining fuel share will be mostly
biofuels (7%), electricity (8%), and CNG (3%). To a
certain extent, these shares are similar to those in
Freeway, but the levels are generally lower.
Comparing the demand of OECD and non-OECD
countries, we can see from Figure 24b that the bulk
of demand will shift to non-OECD countries
(increasing from 40%–64%) and will still be
dominated by the three major transport fuels,
namely gasoline, diesel, and jet fuel, along with
smaller shares of electricity and bioethanol.
Technology Mix
In Tollway, the global car fleet in 2050 will be very
diverse, with shares of 26% for liquid fuel
conventional ICEV (19% gasoline and 7% diesel);
26% for liquid hybrids (18% gasoline and 8%
diesel); 18% plug-ins; 16% electric; 8% gas
vehicles;, and 6% for others (Figure 25).
Emissions
Due to the 13% drop in global fuel consumption for
cars between 2010 and 2050, CO2 emissions from
cars are also expected to drop by 46% (Figure 26).
As with Freeway, the relative drop in CO2
emissions is primarily due to engine fuel-burning
improvements and the changes in fuel mix, namely
consuming more biofuels and CNGs. As the figure
shows, most of the reductions in CO2 car emissions
are expected from OECD markets (i.e., emissions
in both US and Western Europe drop by about
80%). The significant reductions in OECD countries
are met with significant increases in non-OECD
countries, especially Asia (India increases about
four-fold, while China increases about three-fold).
Figure 25
Technology mix for cars (million)
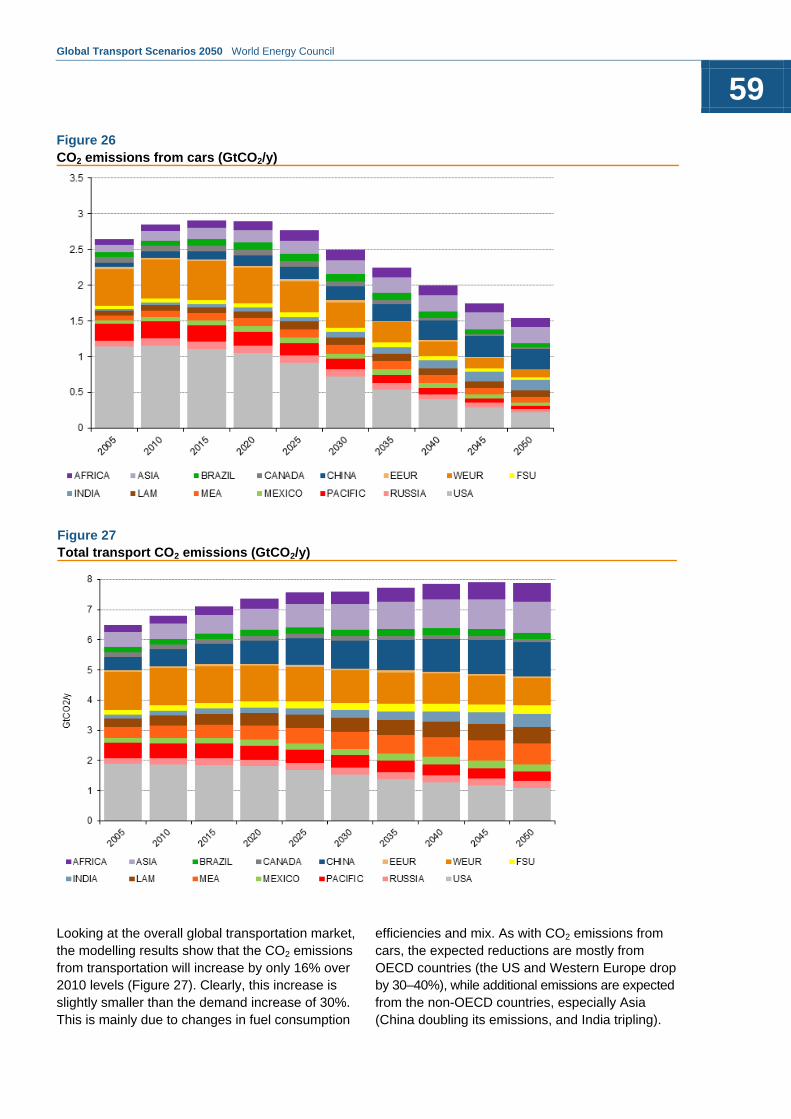
Global Transport Scenarios 2050 World Energy Council
59
Figure 27
Total transport CO2 emissions (GtCO2/y)
Looking at the overall global transportation market,
the modelling results show that the CO2 emissions
from transportation will increase by only 16% over
2010 levels (Figure 27). Clearly, this increase is
slightly smaller than the demand increase of 30%.
This is mainly due to changes in fuel consumption
efficiencies and mix. As with CO2 emissions from
cars, the expected reductions are mostly from
OECD countries (the US and Western Europe drop
by 30–40%), while additional emissions are expected
from the non-OECD countries, especially Asia
(China doubling its emissions, and India tripling).
Figure 26
CO2 emissions from cars (GtCO2/y)
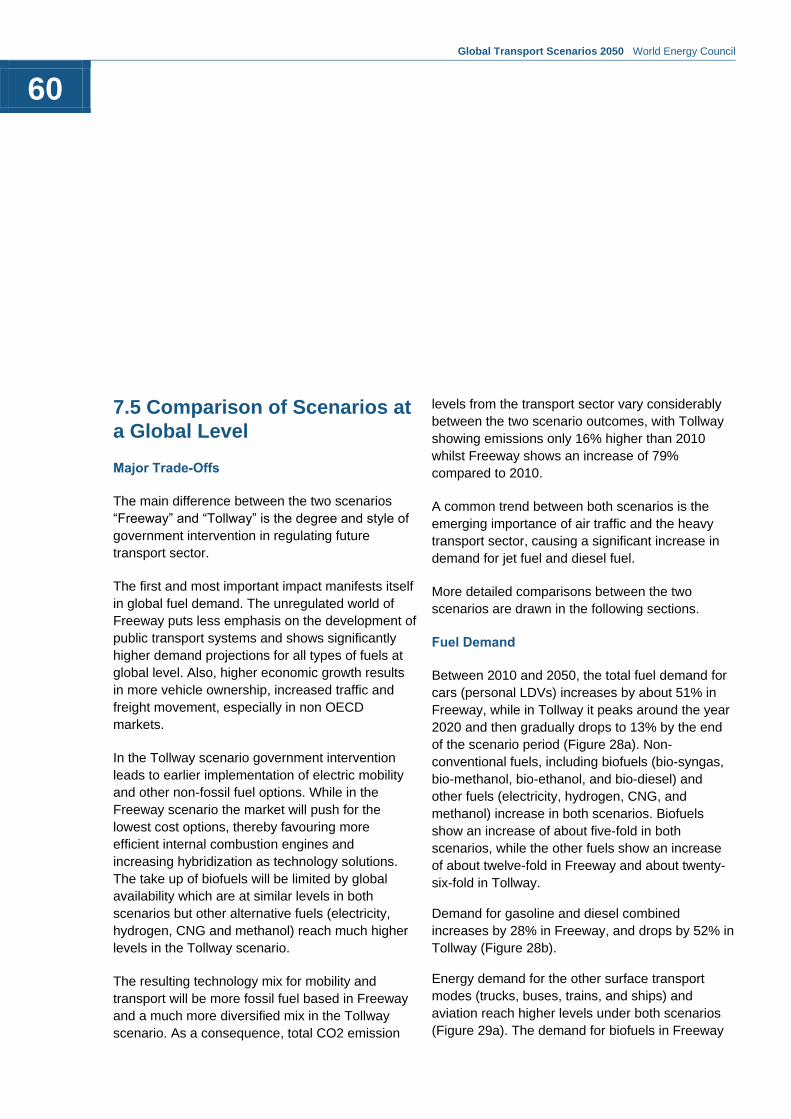
Global Transport Scenarios 2050 World Energy Council
60
7.5 Comparison of Scenarios at
a Global Level
Major Trade-Offs
The main difference between the two scenarios
“Freeway” and “Tollway” is the degree and style of
government intervention in regulating future
transport sector.
The first and most important impact manifests itself
in global fuel demand. The unregulated world of
Freeway puts less emphasis on the development of
public transport systems and shows significantly
higher demand projections for all types of fuels at
global level. Also, higher economic growth results
in more vehicle ownership, increased traffic and
freight movement, especially in non OECD
markets.
In the Tollway scenario government intervention
leads to earlier implementation of electric mobility
and other non-fossil fuel options. While in the
Freeway scenario the market will push for the
lowest cost options, thereby favouring more
efficient internal combustion engines and
increasing hybridization as technology solutions.
The take up of biofuels will be limited by global
availability which are at similar levels in both
scenarios but other alternative fuels (electricity,
hydrogen, CNG and methanol) reach much higher
levels in the Tollway scenario.
The resulting technology mix for mobility and
transport will be more fossil fuel based in Freeway
and a much more diversified mix in the Tollway
scenario. As a consequence, total CO2 emission
levels from the transport sector vary considerably
between the two scenario outcomes, with Tollway
showing emissions only 16% higher than 2010
whilst Freeway shows an increase of 79%
compared to 2010.
A common trend between both scenarios is the
emerging importance of air traffic and the heavy
transport sector, causing a significant increase in
demand for jet fuel and diesel fuel.
More detailed comparisons between the two
scenarios are drawn in the following sections.
Fuel Demand
Between 2010 and 2050, the total fuel demand for
cars (personal LDVs) increases by about 51% in
Freeway, while in Tollway it peaks around the year
2020 and then gradually drops to 13% by the end
of the scenario period (Figure 28a). Non-
conventional fuels, including biofuels (bio-syngas,
bio-methanol, bio-ethanol, and bio-diesel) and
other fuels (electricity, hydrogen, CNG, and
methanol) increase in both scenarios. Biofuels
show an increase of about five-fold in both
scenarios, while the other fuels show an increase
of about twelve-fold in Freeway and about twenty-
six-fold in Tollway.
Demand for gasoline and diesel combined
increases by 28% in Freeway, and drops by 52% in
Tollway (Figure 28b).
Energy demand for the other surface transport
modes (trucks, buses, trains, and ships) and
aviation reach higher levels under both scenarios
(Figure 29a). The demand for biofuels in Freeway
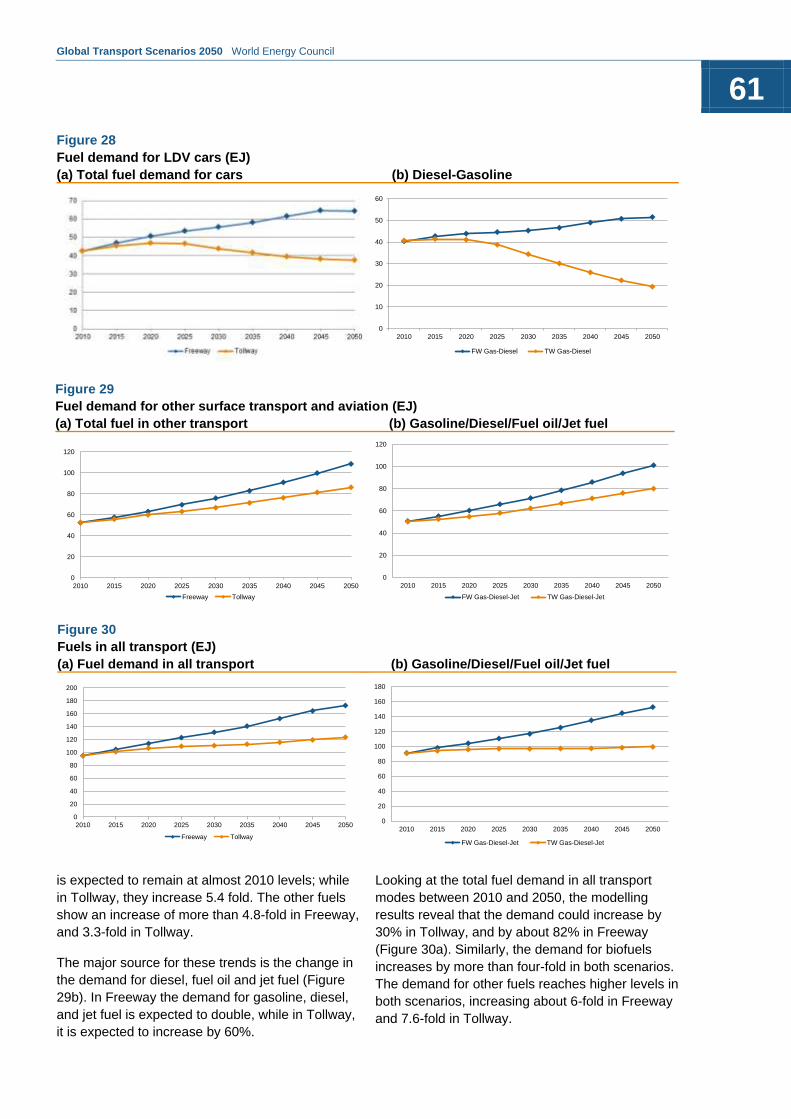
Global Transport Scenarios 2050 World Energy Council
61
Figure 29
Fuel demand for other surface transport and aviation (EJ)
(a) Total fuel in other transport (b) Gasoline/Diesel/Fuel oil/Jet fuel
0
20
40
60
80
100
120
2010 2015 2020 2025 2030 2035 2040 2045 2050
Freeway Tollway
0
20
40
60
80
100
120
2010 2015 2020 2025 2030 2035 2040 2045 2050
FW Gas-Diesel-Jet TW Gas-Diesel-Jet
Figure 30
Fuels in all transport (EJ)
(a) Fuel demand in all transport (b) Gasoline/Diesel/Fuel oil/Jet fuel
0
20
40
60
80
100
120
140
160
180
200
2010 2015 2020 2025 2030 2035 2040 2045 2050
Freeway Tollway
0
20
40
60
80
100
120
140
160
180
2010 2015 2020 2025 2030 2035 2040 2045 2050
FW Gas-Diesel-Jet TW Gas-Diesel-Jet
is expected to remain at almost 2010 levels; while
in Tollway, they increase 5.4 fold. The other fuels
show an increase of more than 4.8-fold in Freeway,
and 3.3-fold in Tollway.
The major source for these trends is the change in
the demand for diesel, fuel oil and jet fuel (Figure
29b). In Freeway the demand for gasoline, diesel,
and jet fuel is expected to double, while in Tollway,
it is expected to increase by 60%.
Looking at the total fuel demand in all transport
modes between 2010 and 2050, the modelling
results reveal that the demand could increase by
30% in Tollway, and by about 82% in Freeway
(Figure 30a). Similarly, the demand for biofuels
increases by more than four-fold in both scenarios.
The demand for other fuels reaches higher levels in
both scenarios, increasing about 6-fold in Freeway
and 7.6-fold in Tollway.
Figure 28
Fuel demand for LDV cars (EJ)
(a) Total fuel demand for cars (b) Diesel-Gasoline
0
10
20
30
40
50
60
2010 2015 2020 2025 2030 2035 2040 2045 2050
FW Gas-Diesel TW Gas-Diesel

Global Transport Scenarios 2050 World Energy Council
62
Figure 32
Technology mix for LDV cars (million)
(a) Number of cars between 2010 and 2050 (b) Cars in OECD vs. non-OECD
-
500
1,000
1,500
2,000
2,500
2010 2015 2020 2025 2030 2035 2040 2045 2050
Freeway Tollway
0
200
400
600
800
1000
1200
1400
2010 2015 2020 2025 2030 2035 2040 2045 2050
OECD FW Non-OECD FW OECD TW Non-OECD TW
Clearly, the major source for the overall difference
in fuel demand between the two scenarios is the
level of demand for gasoline, diesel, and jet fuel
(Figure 30b). In Freeway, the demand for gasoline,
diesel, and jet fuel is expected to increase by 68%
while in Tollway the demand is expected to
increase by only about 10%.
The modelling results also show that, over the next
four decades, growth in fuel demand for cars will
be driven by the non-OECD countries (Figure 31a).
As for the total demand for all transport fuels, the
non-OECD countries are expected to show a three-
fold increase in Freeway and about two-fold
increase in Tollway (Figure 31b). As the figure
shows, the non-OECD countries demand for
transport fuels is expected to exceed that of the
OECD countries by 2025 in Tollway, and earlier
than 2025 in Freeway.
Technology Mix
Due to the increase in GDP per capita and the
increasing population, especially in non-OECD
countries, the number of cars is expected to
increase in both scenarios. Modelling results show
that, over the next four decades, the number of
cars could more than double. Freeway suggests an
increase of about 2.6 times the 2010 levels, while
Tollway suggests a lower increase of 2.2 times the
2010 level (Figure 32a). The difference between
the two scenarios originates mostly from the non-
OECD countries. The number of cars in the non-
OECD countries is expected to increase 4.3-fold in
Tollway and 5.57-fold in Freeway. For the OECD
countries, the number of cars is expected to
increase by about 36% in Tollway and 41% in
Freeway (Figure 32b).
Looking at the technology used in each scenario,
we see that under Freeway, the number of
conventional ICEVs burning either gasoline or
Figure 31
Fuel demand for OECD and non-OECD countries (EJ)
(a) Fuel demand in cars (b) Fuel demand in all transport
0.0
5.0
10.0
15.0
20.0
25.0
30.0
35.0
40.0
45.0
2010 2015 2020 2025 2030 2035 2040 2045 2050
OECD FW Non-OECD FW OECD TW Non-OECD TW
0.0
20.0
40.0
60.0
80.0
100.0
120.0
140.0
2010 2015 2020 2025 2030 2035 2040 2045 2050
OECD FW Non-OECD FW OECD TW Non-OECD TW
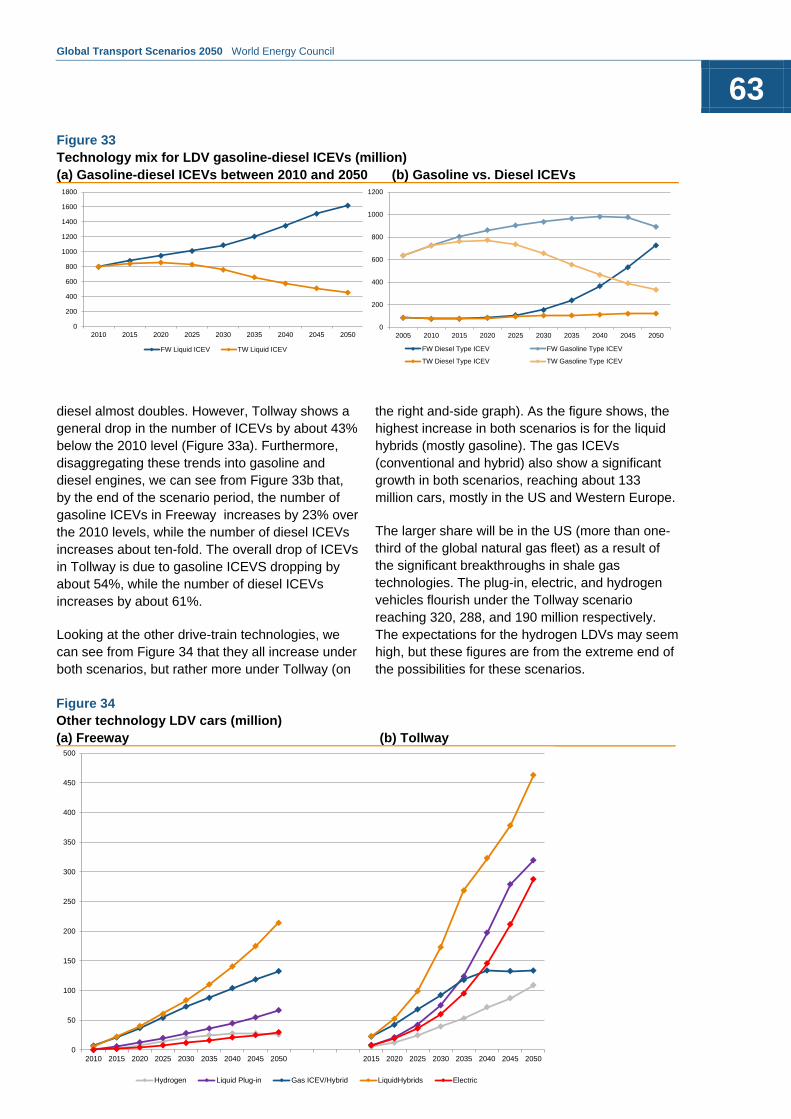
Global Transport Scenarios 2050 World Energy Council
63
Figure 34
Other technology LDV cars (million)
(a) Freeway (b) Tollway
0
50
100
150
200
250
300
350
400
450
500
2010 2015 2020 2025 2030 2035 2040 2045 2050 2015 2020 2025 2030 2035 2040 2045 2050
Hydrogen Liquid Plug-in Gas ICEV/Hybrid LiquidHybrids Electric
diesel almost doubles. However, Tollway shows a
general drop in the number of ICEVs by about 43%
below the 2010 level (Figure 33a). Furthermore,
disaggregating these trends into gasoline and
diesel engines, we can see from Figure 33b that,
by the end of the scenario period, the number of
gasoline ICEVs in Freeway increases by 23% over
the 2010 levels, while the number of diesel ICEVs
increases about ten-fold. The overall drop of ICEVs
in Tollway is due to gasoline ICEVS dropping by
about 54%, while the number of diesel ICEVs
increases by about 61%.
Looking at the other drive-train technologies, we
can see from Figure 34 that they all increase under
both scenarios, but rather more under Tollway (on
the right and-side graph). As the figure shows, the
highest increase in both scenarios is for the liquid
hybrids (mostly gasoline). The gas ICEVs
(conventional and hybrid) also show a significant
growth in both scenarios, reaching about 133
million cars, mostly in the US and Western Europe.
The larger share will be in the US (more than one-
third of the global natural gas fleet) as a result of
the significant breakthroughs in shale gas
technologies. The plug-in, electric, and hydrogen
vehicles flourish under the Tollway scenario
reaching 320, 288, and 190 million respectively.
The expectations for the hydrogen LDVs may seem
high, but these figures are from the extreme end of
the possibilities for these scenarios.
Figure 33
Technology mix for LDV gasoline-diesel ICEVs (million)
(a) Gasoline-diesel ICEVs between 2010 and 2050 (b) Gasoline vs. Diesel ICEVs
0
200
400
600
800
1000
1200
1400
1600
1800
2010 2015 2020 2025 2030 2035 2040 2045 2050
FW Liquid ICEV TW Liquid ICEV
0
200
400
600
800
1000
1200
2005 2010 2015 2020 2025 2030 2035 2040 2045 2050
FW Diesel Type ICEV FW Gasoline Type ICEV
TW Diesel Type ICEV TW Gasoline Type ICEV
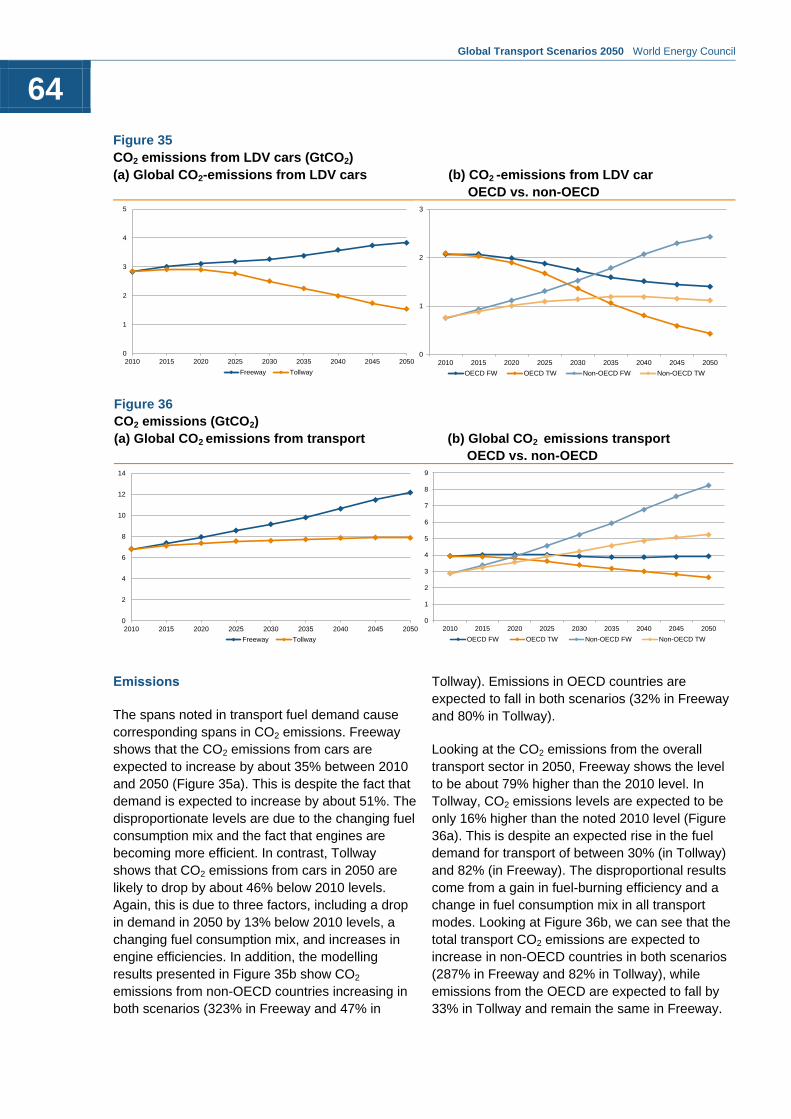
Global Transport Scenarios 2050 World Energy Council
64
Figure 36
CO2 emissions (GtCO2)
(a) Global CO2 emissions from transport (b) Global CO2 emissions transport
OECD vs. non-OECD
0
2
4
6
8
10
12
14
2010 2015 2020 2025 2030 2035 2040 2045 2050
Freeway Tollway
0
1
2
3
4
5
6
7
8
9
2010 2015 2020 2025 2030 2035 2040 2045 2050
OECD FW OECD TW Non-OECD FW Non-OECD TW
Emissions
The spans noted in transport fuel demand cause
corresponding spans in CO2 emissions. Freeway
shows that the CO2 emissions from cars are
expected to increase by about 35% between 2010
and 2050 (Figure 35a). This is despite the fact that
demand is expected to increase by about 51%. The
disproportionate levels are due to the changing fuel
consumption mix and the fact that engines are
becoming more efficient. In contrast, Tollway
shows that CO2 emissions from cars in 2050 are
likely to drop by about 46% below 2010 levels.
Again, this is due to three factors, including a drop
in demand in 2050 by 13% below 2010 levels, a
changing fuel consumption mix, and increases in
engine efficiencies. In addition, the modelling
results presented in Figure 35b show CO2
emissions from non-OECD countries increasing in
both scenarios (323% in Freeway and 47% in
Tollway). Emissions in OECD countries are
expected to fall in both scenarios (32% in Freeway
and 80% in Tollway).
Looking at the CO2 emissions from the overall
transport sector in 2050, Freeway shows the level
to be about 79% higher than the 2010 level. In
Tollway, CO2 emissions levels are expected to be
only 16% higher than the noted 2010 level (Figure
36a). This is despite an expected rise in the fuel
demand for transport of between 30% (in Tollway)
and 82% (in Freeway). The disproportional results
come from a gain in fuel-burning efficiency and a
change in fuel consumption mix in all transport
modes. Looking at Figure 36b, we can see that the
total transport CO2 emissions are expected to
increase in non-OECD countries in both scenarios
(287% in Freeway and 82% in Tollway), while
emissions from the OECD are expected to fall by
33% in Tollway and remain the same in Freeway.
Figure 35
CO2 emissions from LDV cars (GtCO2)
(a) Global CO2-emissions from LDV cars (b) CO2 -emissions from LDV car
OECD vs. non-OECD
0
1
2
3
4
5
2010 2015 2020 2025 2030 2035 2040 2045 2050
Freeway Tollway
0
1
2
3
2010 2015 2020 2025 2030 2035 2040 2045 2050
OECD FW OECD TW Non-OECD FW Non-OECD TW

Global Transport Scenarios 2050 World Energy Council
65
The two scenarios described and modelled in this
report describe two divergent global transportation
futures looking out to 2050. We envision the actual
world to be somewhere in the middle. In this
section, we summarize the findings of the
scenarios, and then briefly discuss their
implications for the future of transportation.
Between 2010 and 2050, total fuel demand in all
transport modes will increase by 30%-82% over
2010 levels. This growth is mainly driven by trucks,
buses, trains, ships, and airplanes: demand for
these forms of transport is expected to increase by
64%-200%. Fuel demand for the LDVs, which
constitutes about 52% of the transport market, is
expected to increase by 51% in Freeway and drop
by 13% in Tollway.
In addition, the transportation sector will still
depend heavily on gasoline, diesel, and jet fuel,
since they all constitute the bulk of transport market
fuels (80%–88%). The demand for these three
fuels will increase by 10%-68% over the scenario
period. Most of the growth will be in diesel and jet
fuel: diesel will grow by 46%-200%, while jet fuel
will grow by 200% to 300%. In contrast, the
demand for gasoline is expected to drop by 16%-
63%. Biofuels will also help to satisfy the demand
for transport fuel: their use will increase almost
four-fold. The demand for other fuels (electricity,
hydrogen, CNG, and methanol) will increase six- to
seven-fold.
In the LDV market, fuel demand for cars will still
depend heavily on gasoline and diesel which will
satisfy 52%–80% of the demand. However, growth
in demand will be limited to diesel, increasing by
200%-900%, while the gasoline demand drops by
16%-63%.In addition, the remaining fuel demand
from cars will be satisfied by biofuels, which will
grow about five-fold and other fuels, which will
grow twelve- to twenty-six-fold.
The rest of the transport market and the aviation
market will still depend heavily on diesel and jet
fuels, which will satisfy 93% of the fuel demand.
The demand for diesel will increase by 42%-65%,
while the demand for jet fuel will increase by 225%-
380%. The remaining demand will be satisfied by
biofuels, which are expected to increase by up to
540%, and other fuels, which will increase by
330%-480%.
Over the scenario period, all the additional
transport fuel demands will come from the non-
OECD countries, where demand will grow by
200%-300%. In contrast, the transport fuel demand
for the OECD countries will drop by up to 20%.
Similarly, fuel demand for cars in the non-OECD
countries is expected to increase by 96%-355%
while it will drop by 24%-52% in the OECD. The
total fuel demand increases in the non-OECD
countries and drops in the non-OECD countries: by
the end of the scenario period, demand in the non-
OECD countries will be 60%–70% of the demand
while that in the OECD countries will be 30%–40%
of the demand. The demand of the non-OECD
countries surpasses that of the OECD countries by
the year 2025, if not earlier.
The total number of cars in the world will also
increase 2.2 to 2.6 times, mainly in the non-OECD
countries, where the number of cars will increase
by 430%-557% while the OECD countries will see
8. Conclusions
Global Transport Scenarios 2050 World Energy Council
66
an increase of 36%-41%. By the end of the
scenario period, non-OECD countries will have
about 55%–61% of the global fleet (global fleet
estimated at 1,766 to 2,086 million cars). The
global car fleet will still depend on conventional
gasoline and diesel ICEVs, with a market share
between 26% and 78%. Growth in the global car
fleet will mainly be in diesel ICEVs, which will grow
by 61%-1,000%, while the number of gasoline
ICEVs could drop by 54% in Tollway or increase by
23% in Freeway. Other drive-train technologies will
capture the remaining market share with liquid
hybrid, plug-ins, and electric vehicles leading in
Tollway, while hybrids, plug-ins and gas vehicles
lead in Freeway.
With these higher levels of transport demands, the
total CO2 emissions from the transportation sector
are expected to increase by 16%-79%. This
increase in CO2 emissions will not be proportional
to the increase in total demand (30%–82%), due to
changes in fuel consumption mixes and increases
in efficiencies. As most of the demand (60%–70%)
will be in the non-OECD countries, the bulk of the
CO2 emissions in 2050 will also be in the non-
OECD countries (around 67%), with car emissions
constituting 20%–32% of the total.
With this picture of the transport sector in 2050,
and in light of the previously discussed major
drivers, we believe that the global transport sector
can and will overcome the many challenges of
meeting the global transport demand at the lowest
social costs. The biggest of these challenges will
be to provide sustainable transport for more than
six billion urbanized people with the minimum
possible congestion, pollution, and noise generated
by additional traffic and freight.
Indeed, understanding the dynamics and
magnitude of these likely future developments can
offer consumers, entrepreneurs, governments, and
private businesses the opportunity to adjust their
future plans and expectations. We have no doubt
that the birth of dialogue between consumers and
producers, the findings of additional conventional
and unconventional energy resources, the
expansions in the use of renewables, the
improvements in technologies, and the selection of
optimal policies tailored to suit each region’s needs
will all ensure a sustainable transport future and
will raise the quality of life for current and future
generations.
Key Takeaways for
Policymakers
At a strategic level some important messages
emerge for policy makers.
The absolute levels of increase in transport
volumes and fuel demand will largely
depend on the type of government policies
put in place over the next few decades.
Government policies will impact the number
and technology mix of cars and trucks on
the road, and emissions resulting from
additional transport activity.
We expect to experience a marked shift in
transport fuel demand from the developed
countries to the developing ones, mostly
China and India.

Global Transport Scenarios 2050 World Energy Council
67
Global transport will remain heavily
dependent on fossil fuels with a strong rise
in demand for diesel, fuel oil and jet fuel
compared to gasoline. This will have
potentially significant implications for
refiners and the downstream sector as a
whole, especially in Europe, where there is
a large emphasis on diesel fuels. The global
demand increase for diesel is largely driven
by demand from the heavy transport,
agriculture, and mining sectors. In these
segments replacement of conventional fuels
with new types of fuel technologies is
unlikely to occur prior to 2050. The same
holds true for fuel oil in shipping and jet fuel
for aviation.
The maximum level of biofuels in the liquids
markets is expected to be around four times
above current market levels. Water and land
use restrictions will prevent much further
growth. Biofuels tend to be regional
phenomena, mostly concentrated in the
Americas, with sugar cane biofuels being
dominant in Brazil and corn ethanol being
the dominant biofuel in United States. The
use of biofuels in Europe is largely a result
of government mandates. As for the
alternative fuels including natural gas,
electricity and hydrogen, the maximum level
is expected to be six to seven times above
the current levels depending on the degree
of government intervention.
It is evident that without strong government
regulation, putting public interest and
common good before individual concerns,
transport markets will tend to develop along
the lines of business as usual and little
progress will be made in developing
infrastructure and technologies to reduce
the negative impacts of transport.
Now is the time for strong leadership at both
government and enterprise levels if the transport
sector is to make a positive contribution towards
the well-being of future generations.

Global Transport Scenarios 2050 World Energy Council
68
BEV battery electric vehicle
BRT bus rapid transit
CAFE corporate average fuel economy
CNG compressed natural gas
CNGV compressed natural-gas vehicle
CTC coal to liquid
EIA US Energy Information Administration
EV electric vehicle
FAO Food and Agriculture Organization
FCV fuel cell vehicle
FDI foreign direct investment
FFV flexible fuel vehicle
FSU former Soviet Union
GDP gross domestic product
GHG greenhouse gas
GRT ground rapid transit
GTL gas to liquid
HEV hybrid electric vehicle
HFCV hydrogen fuel-cell vehicle
HFCV hybridized fuel-cell vehicle
HSR high-speed rail
IANGV International Association for Natural Gas Vehicles
ICEV internal combustion engine vehicle
IFC International Finance Corporation
IMF International Monetary Fund
LDV light duty vehicle
NEDC New European Driving Cycle
NGO non-governmental organisation
NOC national Oil Company, fully or in the majority owned by a national government
O&M operations and maintenance
OCED Organization for Economic Cooperation and Development
PRT personal rapid transit
R&D research and development
toe tonne oil equivalent
UNIDO United Nations Industrial Development Organization
UNPD United Nations Population Division
USGS United States Geological Survey
WB World Bank
WEF World Economic Forum
WTO World Trade Organisation
Glossary

Global Transport Scenarios 2050 World Energy Council
69
Figures and Tables
List of Figures
Figure 1: 2010 transport energy by source and by mode 9
Figure 2: Global transport final energy use by mode (mtoe) 10
Figure 3: Transport energy use by region in 2007 11
Figure 4: Motorized passenger travel by mode in 2007 11
Figure 5: Population by major region 15
Figure 6: Evolution of oil reserves, production, and consumption between 1989 and 2009 17
Figure 7: Global oil production (in thousand barrels per day) 18
Figure 8: Non-oil-based fuel use by region in 2005 22
Figure 9: Global biofuel production 2009–2010 23
Figure 10: World biofuels production 24
Figure 11: Conventional and advanced biofuels 25
Figure 12: Comparison of actual and projected fuel economy for new passenger vehicles. 26
Figure 13: The 15 world regions of the transport model 49
Figure 14: Personal transport sector in GMM 51
Figure 15: Other surface transport and aviation sectors in GMM 52
Figure 16: Fuels for LDV cars 53
Figure 17: Fuel in other surface transport and aviation 54
Figure 18: Fuels in all transport 54
Figure 19: Technology mix for cars (million) 55
Figure 20: CO2 emissions from cars (GtCO2/y) 55
Figure 21: Total transport CO2 emissions (GtCO2/y) 56
Figure 22: Fuels for LDV cars 56
Figure 23: Fuel in other surface transport and aviation 57
Figure 24: Fuels in all transport 57
Figure 25: Technology mix for cars (million) 58
Figure 26: CO2 emissions from cars (GtCO2/y) 59
Figure 27: Total transport CO2 emissions (GtCO2/y) 59
Figure 28: Fuel demand for LDV cars (EJ/y) 61
Figure 29: Fuel demand for other surface transport and aviation (EJ/y) 61
Figure 30: Fuels in all transport (EJ/y) 61
Figure 31: Fuel demand for OECD and non-OECD countries (EJ) 62
Figure 32: Technology mix for LDV cars (million) 62
Figure 33: Technology mix for LDV gasoline-diesel ICEVs (million) 63
Figure 34: Other technology LDV cars (million) 63
Figure 35: CO2 emissions from LDV cars (GtCO2/y) 64
Figure 36: CO2 emissions (GtCO2/y) 64
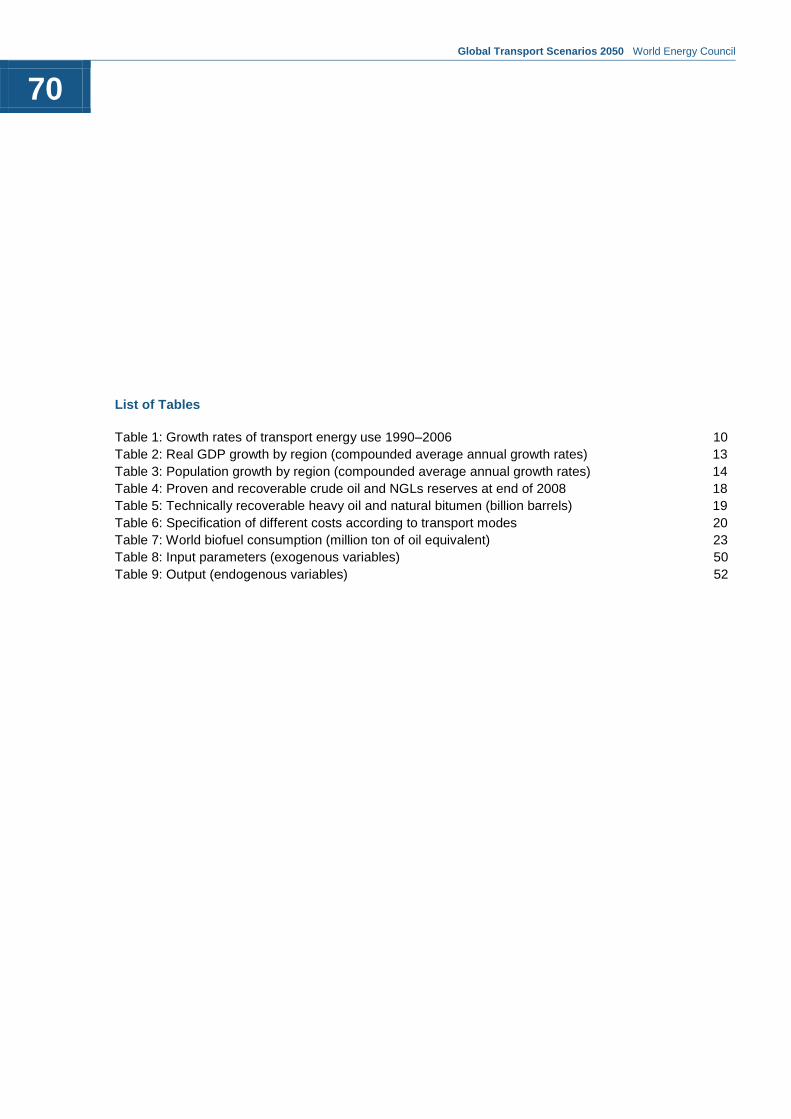
Global Transport Scenarios 2050 World Energy Council
70
List of Tables
Table 1: Growth rates of transport energy use 1990–2006 10
Table 2: Real GDP growth by region (compounded average annual growth rates) 13
Table 3: Population growth by region (compounded average annual growth rates) 14
Table 4: Proven and recoverable crude oil and NGLs reserves at end of 2008 18
Table 5: Technically recoverable heavy oil and natural bitumen (billion barrels) 19
Table 6: Specification of different costs according to transport modes 20
Table 7: World biofuel consumption (million ton of oil equivalent) 23
Table 8: Input parameters (exogenous variables) 50
Table 9: Output (endogenous variables) 52

Global Transport Scenarios 2050 World Energy Council
71
Appendix A: Detailed Scenario Description and Regional Inputs
http://www.worldenergy.org/documents/WECTransportScenariosAppendix.pdf
Appendix B: Model’s Input Assumptions (Exogenous Parameters)
http://www.worldenergy.org/documents/WECTransportScenariosAppendix.pdf
Appendix C: Model’s Outputs (Endogenous Variables)
http://www.worldenergy.org/documents/WECTransportScenariosAppendix.pdf
Apendices

Global Transport Scenarios 2050 World Energy Council
72

Albania
Algeria
Argentina
Austria
Belgium
Bolivia
Botswana
Brazil
Bulgaria
Cameroon
Canada
Chad
China
Colombia
Congo (Democratic
Republic)
Côte d'Ivoire
Croatia
Cyprus
Czech Republic
Denmark
Egypt (Arab Republic)
Estonia
Ethiopia
Finland
France
Gabon
Germany
Ghana
Greece
Hong Kong, China
Hungary
Iceland
India
Indonesia
Iran (Islamic Republic)
Ireland
Israel
Italy
Japan
Jordan
Kazakhstan
Kenya
Korea (Republic)
Kuwait
Latvia
Lebanon
Libya/GSPLAJ
Lithuania
Luxembourg
Macedonia (Republic)
Mexico
Monaco
Mongolia
Morocco
Namibia
Nepal
Netherlands
New Zealand
Niger
Nigeria
Pakistan
Paraguay
Peru
Philippines
Poland
Portugal
Qatar
Romania
Russian Federation
Saudi Arabia
Senegal
Serbia
Slovakia
Slovenia
South Africa
Spain
Sri Lanka
Swaziland
Sweden
Switzerland
Syria (Arab Republic)
Taiwan, China
Tajikistan
Tanzania
Thailand
Trinidad & Tobago
Tunisia
Turkey
Ukraine
United Arab Emirates
United Kingdom
United States
Uruguay
Member committees of the World Energy Council

World Energy Council
Regency House 1-4 Warwick Street
London W1B 5LT United Kingdom
T (+44) 20 7734 5996
F (+44) 20 7734 5926
www.worldenergy.org
For sustainable energy.
ISBN: 978-0-946121-14-4