Description of scenarios in the Energy Roadmap 2050
114
EUROPEAN COMMISSION Brussels, XXX SEC(2011) 1565 Part 2/2 COMMISSION STAFF WORKING PAPER Impact Assessment Accompanying the document COMMUNICATION FROM THE COMMISSION TO THE EUROPEAN PARLIAMENT, THE COUNCIL, THE EUROPEAN ECONOMIC AND SOCIAL COMMITTEE AND THE COMMITTEE OF THE REGIONS Energy Roadmap 2050 {COM(2011) 885} {SEC(2011) 1566} {SEC(2011) 1569}
Transcript of Description of scenarios in the Energy Roadmap 2050

EUROPEAN COMMISSION
Brussels, XXX SEC(2011) 1565
Part 2/2
COMMISSION STAFF WORKING PAPER
Impact Assessment
Accompanying the document
COMMUNICATION FROM THE COMMISSION TO THE EUROPEAN PARLIAMENT, THE COUNCIL, THE EUROPEAN ECONOMIC AND SOCIAL
COMMITTEE AND THE COMMITTEE OF THE REGIONS
Energy Roadmap 2050
{COM(2011) 885} {SEC(2011) 1566} {SEC(2011) 1569}

Annex 1 Scenarios – assumptions and results
Part B: Decarbonisation scenarios.......................................................................................... 2 1. Assumptions.......................................................................................................................... 2
1.1 Macroeconomic and demographic assumptions .............................................................. 2 1.2 Energy import prices ........................................................................................................ 2 1.3 Policy assumptions........................................................................................................... 3 1.4 Assumptions about energy infrastructure development ................................................... 7 1.5 Technology assumptions .................................................................................................. 7 1.6 Drivers.............................................................................................................................. 9
2. Results ................................................................................................................................... 9 2.1 Overview: outcome for the four main strategic directions to decarbonisation ................ 9 2.2 Energy consumption and supply structure ..................................................................... 13 2.3 Power generation............................................................................................................ 20 2.4 Other sectors................................................................................................................... 31 2.5 Security of supply........................................................................................................... 34 2.6 Policy related indicators ................................................................................................. 36 2.7 Overall system costs, competitiveness and other socio-economic impacts ................... 39 2.8 Conclusions .................................................................................................................... 53
Attachment 1: Numerical results .......................................................................................... 56 Attachment 2: Assumptions about interconnections and modelling of electricity trade. 78 Attachment 3: Short description of the models used .......................................................... 85

2
PART B: DECARBONISATION SCENARIOS
1. ASSUMPTIONS
1.1 Macroeconomic and demographic assumptions On the basis of the European Council's objective for EU decarbonisation of at least 80% below 1990 by 2050 in the context of necessary reductions by developed countries as a group1 it is assumed that competitiveness effects throughout decarbonisation would be rather limited. Therefore, the decarbonisation scenarios are based on the same demographic and macroeconomic assumptions as the Reference scenario and Current Policy Initiatives scenario. Such an assumption also facilitates comparison of the energy results across scenarios. These macro-economic (sectoral production) assumptions also hold for energy intensive industries. However, under fragmented action, measures against carbon leakage may be necessary. The analysis of this particular case (see below) deals with energy and emission effects of such measures, but does not address potential changes in sectoral production levels under fragmented action. The aim of measures against carbon leakage is indeed to avoid such relocation of energy intensive production.
1.2 Energy import prices The decarbonisation scenarios are based on "global climate action" price trajectories for oil, gas and coal2 reflecting that global action on decarbonisation will reduce fossil fuel demand worldwide and will therefore have a downward effect on fossil fuel prices. Oil, gas and coal prices are therefore lower than in the Reference scenario and Current Policy Initiative scenario. Their trajectories are an outcome of the global analysis in the Low carbon Economy Roadmap, which is similar to recent IEA projections that assessed the impacts of ambitious climate policies3.
1 European Council, 29/30 October 2009. 2 See Impact assessment accompanying Communication on Low Carbon Economy Roadmap SEC(2011)288 3 International Energy Agency, World Energy Outlook 2009, Energy Technology Perspectives 2010

3
Figure 18: Fossil fuel prices in the decarbonisation scenarios
1.3 Policy assumptions In addition to policy assumptions in the Current Policy Initiatives scenario, the following policies and measures were added to scenarios: Table 15 Measures included in all decarbonisation scenarios 1 Climate policies for respecting carbon
constraints to reach 85% energy related CO2 reductions by 2050 (40% by 2030), consistent with 80% reduction of total GHG emissions according to the "Roadmap for moving to a competitive low carbon economy in 2050" (including achievement of cumulative carbon cap) in a cost effective way
Supplementary to specific energy policies in the scenario, ETS prices and carbon values for non ETS sectors are determined in such a way as to reach the 2050 reduction goal; ETS and non ETS sectors use equal carbon prices/values (from 2025 onwards); cumulative emissions are similar across scenarios
2 Stronger RES facilitation policies Represented by higher RES-values in the model. These facilitating RES policies include for example the availability of more sites for RES, easier licensing of RES installations, greater acceptance and support deriving from the improvement of local economies and industrial development; operational aids remain at the same level as in the REF/CPI scenarios.
3 Transport measures Energy efficiency standards, internal market, infrastructure, pricing and transport planning measures leading to more fuel-efficient transport means and some modal shift Encourage the deployment of clean energy carriers by establishing the necessary supporting infrastructures4
4 The decarbonisation scenarios reflect the transport policy measures included in the White Paper "Roadmap to
a Single Transport Area – Towards a competitive and resource efficient transport system" (COM (2011) 144) with highest impact on energy demand in transport.

4
4 Guarantee funds for all low carbon generation technologies
The model reflects support to early demonstration and first of a kind commercial plants for all innovative low-carbon technologies in the energy sector (nuclear, RES and their infrastructure needs, CCS, etc.).
5 Storage and interconnections Higher penetration of variable generation leading occasionally to excess electricity is dealt with by increased pump storage and more interconnection capacity. Moreover, large parts of such excess electricity generation from variable sources is transformed into hydrogen, which is fed, up to a certain degree, into the natural gas grid, thereby providing a means for (indirect) storage of electricity and reducing the carbon content of gas delivered to final consumers enabling deeper emission cuts. Where for technical or economic reasons, simulated in the model, feeding into the natural gas grid is not feasible, excess electricity (mainly from RES) is stored in form of hydrogen at times of excess supply and transformed back into electricity when demand exceeds supply. (Hydrogen storage is used to a different degree in various decarbonisation scenarios, see also measures under Scenario 4).
Scenario 2: High energy efficiency This scenario is driven by a political commitment of very high primary energy savings by 2050. It includes a very stringent implementation of the Energy Efficiency Plan and aims at reaching close to 20% energy savings by 2020. Strong energy efficiency policies are also pursued thereafter. Table 16 Policies/measures included (in addition to measures in table 15): Measure How it is reflected in the model 1 Additional strong minimum requirements for
appliances Progressive adaptation of modelling parameters for different product groups. As requirements concern only new products, the effect will be gradual.
2 High renovation rates for existing buildings due to better/more financing and planned obligations for public buildings (more than 2% refurbishment per year)
Change of drivers (ESCOs, energy utilities obligation, energy audits) influence stock – flow parameters in the model reflecting higher renovation rates (higher than 2% pa), with account being taken of tougher requirements for public sector through specific treatment of the non-market services sector
3 Passive houses standards after 2020 All new houses after 2020 comply with passive house standards - around 20-50 KWh/m2 (depending on the country) which might to a large extent be of renewable origin
4 Marked penetration of ESCOs and higher financing availability
Enabling role of ESCOs is reflected in lower discount rates for household consumers (from 17.5% to 16% in 2015, 14% in 2020, 13% in 2025 and 12% from 2030 onwards) and for industry, agriculture and services (from 12% to 11% by 2015 and to 10% from 2020 onwards)
5 Obligation of utilities to achieve energy savings in their customers' energy use over 1.5% per year (up to 2020)
Induce more energy efficiency mainly in residential and tertiary sectors by imposing an efficiency value for grid bound energy sources

5
(electricity, gas, heat) 6 Strong minimum requirements for energy
generation, transmission and distribution including obligation that existing energy generation installations are upgraded to the BAT every time their permit needs to be updated
Higher efficiency of power plants through removing less efficient items from the generation portfolio, allowing however for efficiency losses where CCS is deployed Less transmission and distribution losses
7 Full roll-out of smart grids, smart metering Enabling more efficiency and decentralised RES; Reflected as costs in the distribution grid costs, electricity prices and overall costs of the energy system
8 Significant RES highly decentralised generation
More advanced power dispatching and ancillary services to support reliability of power supply Higher penetration of small wind, solar and hydro
Scenario 3: Diversified supply technologies scenario This option is mainly driven by carbon prices and carbon values (equal for ETS and non ETS sectors). Carbon values are a still undefined proxy for policy measures that bring about emission reduction. They do not represent a cost to economic actors outside EU ETS (where they coincide with the EU ETS price), but are economic drivers that change decision making of the modelled agents. Yet, the changes triggered by carbon values may entail costs (e.g. for investment in energy savings or for fuel switching), which are accounted for in the modelling framework. They are applied to all sectors and greenhouse gas emissions, covering ETS and Non ETS sectors. As economic drivers, they influence technology choices and demand behaviour. Their respective level is not an assumption but a result of the modelling depending among other things on the level of ambition in GHG reduction. The modelling applies equal carbon values across sectors and ensures thereby efficient reductions across sectors. This option assumes acceptance of nuclear and CCS and development of RES facilitation policies. It reproduces the "Effective and widely accepted technologies" scenario used in the Low Carbon Economy Roadmap and Roadmap on Transport on the basis of scenario 1bis. Table 17 Policies/measures included (in addition to measures in table 15): Measure How it is reflected in the model 1 MS and investors have confidence in CCS as a
credible and commercially viable technology; acceptance of storage and CO2 networks is high
2 MS, investors and society at large have confidence in nuclear as safety is considered adequate and waste issues are solved
Applicable for all countries that have not ruled out the use of nuclear, i.e. Germany and Belgium for the longer term and the currently non-nuclear countries except for Poland
Scenario 4: High RES This scenario aims at achieving very high overall RES share and very high RES penetration in power generation (around 90% share and close to 100% related to final consumption). Recalling security of supply objectives, this would be based on increasing domestic RES supply including off-shore wind from the North Sea; significant CSP and storage development, increased heat pump penetration for heating and significant micro power generation (PV, small scale wind, etc.). Regarding assumptions for the demand sectors,

6
scenario 4 is similar to scenario 3, with the exception that RES are more intensively facilitated. Table 18 Policies/measures included (in addition to measures in table 15): Measure How it is reflected in the model 1 Facilitation and enabling policies (permitting,
preferential access to the grid) Represented by significantly higher RES-values in the model than in other decarbonisation scenarios; these RES facilitating policies include for example lower lead times in construction, and involve greater progress on learning curves (e.g. small scale PV and wind) based on higher production.
2 Market integration allowing for more RES trade
Use of cooperation mechanisms or convergent support schemes coupled with declining costs/support result in optimal allocation of RES development, depending also on adequate and timely expansion of interconnection capacity (point 4);
3 Stronger policy measures in the power generation, heating and transport sectors in order to achieve high share of RES in overall energy consumption in particular in household micro power generation and increased power production at the distribution level.
Higher use of heat pumps, significant penetration of passive houses with integrated RES reflected through faster learning rates (cost reductions), higher penetration rates (e.g. due to RES building/refurbishing requirements)
4 Infrastructure, back-up, storage and demand side management
Substantial increase in interconnectors and higher net transfer capacities including DC lines from North Sea to the centre of Europe. Back-up functions done by biomass and gas fired plants. Sufficient storage capacity is provided (pumped storage, CSP, hydrogen). Smart metering allows time and supply situation dependent electricity use (peak/off-peak) reducing needs for storing variable RES electricity. All these measures allow for exploiting greater potentials for off-shore wind in the North Sea.
Scenario 5: Delayed CCS The delayed CCS scenario shows consequences of a delay in the development of CCS, reflecting acceptance difficulties for CCS regarding storage sites and transport; large scale development of CCS is therefore assumed feasible only after 2040. Table 19 Policies/measures included (in addition to measures in table 15): Measure How it is reflected in the model 1 Acceptance difficulties for CCS regarding
storage sites and transport, which allow large scale development only after 2040.
Shift of cost-potential curves to the left (higher costs reflecting delays and public opposition). The learning curve for CCS is also delayed accordingly, resulting in higher capital costs for CCS than in scenario 3
2 MS , investors and society at large have confidence in nuclear as safety is considered adequate and waste issues are solved
Low risk premiums for nuclear Applicable for all countries that have not ruled out the use of nuclear, i.e. Germany and Belgium for the longer term and the currently non-nuclear countries except for Poland
Scenario 6: Low nuclear

7
This scenario shows consequences of a low public acceptance of nuclear power plants leading to cancellation of investment projects that are currently under consideration and no life time extension after 2030. This leads to higher deployment of the substitute technologies CCS from fossil fuels on economic grounds. Table 20 Policies/measures included (in addition to measures in table 15): Measure How it is reflected in the model 1 Political decisions based on perceived risks
associated with waste and safety (especially in the aftermath of the Fukushima accident) leading to no new nuclear plants being build besides the ones presently under construction: 1600 MWe in Finland, 2x1600 MWe in France and 2x505 MWe in Slovakia. Moreover, the recourse to deciding instead on nuclear lifetime extension is available only up to 2030.
No extension of nuclear lifetime on economic grounds after 2030 No new nuclear plants are being built besides reactors under construction : 1600 MW in FIN; 2*1600 MW in FR and 2*505 MW in SK
2 MS and investors have confidence in CCS as a credible and commercially viable technology; acceptance of storage and CO2 networks is high
Low risk premiums for CCS
1.4 Assumptions about energy infrastructure development Infrastructure modelling for decarbonisation scenarios was done similarly to the approach described in Part A, section 1.4 for the Reference and Current Policy initiatives scenarios. For decarbonisation scenarios the analysis done showed that except for very high RES penetration, the 2020 interconnection capacity would allow for most intra-EU electricity trade provided that some bottlenecks would be dealt with. The identified bottlenecks concerns interconnections around Germany, in Austria-Italy-Slovenia, Balkans and Denmark-Sweden. Greater investment and capacity for these specific links were assumed. For very high RES penetration, which involves much more RES based electricity trade, stronger growth of interconnection capacity will be required. Under the assumptions of this scenario, full exploitation of off-shore wind potential at North Sea is foreseen. It is assumed that a dense DC interconnection system will develop mainly offshore but also partly onshore, to facilitate power flows from the North Sea offshore wind parks to consumption centres. In this scenario, the links of Sweden with Poland, Sweden with Lithuania, Austria with Italy, France with Italy and links in the Balkan region appear to be congested and need to be reinforced mainly with DC lines. For more details on the modelling approach and results see Attachment 2.
1.5 Technology assumptions Many technology assumptions are the same as in the Reference scenario and Current Policy Initiatives scenario (with revised assumptions about nuclear). In the decarbonisation scenarios, however, there are additional features and mechanisms that produce high decarbonisation and technology penetration.

8
Whereas all decarbonisation scenarios rely on technologies that exist today, they might become commercially mature only over time supported also by decarbonisation requirements. The uptake of the technologies is endogenous in the scenarios with their large-scale deployment leading to lower cost and higher performance, which correspond to a fully mature commercial stage. All scenarios simulate merit order dispatching for power generation with contribution of variable generation from renewables. Electricity balancing and reliability is ensured endogenously by various means such as import and export flows (in case of high RES it is facilitated by expanding interconnections), investment in flexible thermal units, pumped storage and if required hydrogen based storage. In this latter case, excess variable generation from RES at times of lower demand may be used to produce hydrogen via electrolysis which is then used to produce electricity in turbine based power plants when electricity demand exceeds production from RES and other available sources (e.g. in situations of high demand). The modelling approach also considers the possibility to mix hydrogen produced through electrolysis in the low and medium pressure natural gas distribution system (up to 30%) in order to reduce the average emission factor of the supplied blend, thereby contributing to the decarbonisation of final energy consumption. Photovoltaic in High RES Scenario evolves along more optimistic trajectories than in the Reference scenario, as it is presumed that the higher penetration of the technology leads to stronger learning by doing. The higher uptake of RES technologies is driven mainly by the lower cost potentials for RES power, which are due to policies facilitating access to resources and sites. A further change is in the Delayed CCS scenario where the development of CCS is delayed, and does not reach the same levels of development as in the other scenarios. There is also faster progress in energy efficiency related technologies due to bigger scale and carbon prices effects. The energy technologies on the demand side follow a different development from the Reference scenario variants. In any situation there are different choices to consumers regarding the energy performance of appliances, buildings and equipment (evident from e.g. energy labelling where such transparency is provided by legislation). In decarbonisation scenarios, there are stronger shifts towards the more efficient technology vintages, which improve the average energy efficiency of a given energy use (e.g. of the average lighting appliance) compared to the Reference scenario variants. Energy efficiency progress is therefore supported by consumer choice effects similar to increased learning by doing driven by consumers opting for the more efficient available technologies. The assumptions on the battery costs for the transport sector were developed along the lines of the White Paper on a Roadmap to a Single Transport Area. Efficiency improvements of ICE vehicles also occur in response to carbon values, making the overall vehicle fleet more efficient than in the Reference scenario and its variants. However, the following decarbonisation scenarios do not produce the same energy related transport outcome due to the fact that these scenarios do not handle the same transport details and that the overall framework conditions are different according to the scenario. In particular, the penetration of some alternative propulsion technologies (electric vehicles, hydrogen, etc.) might be somewhat different.
9
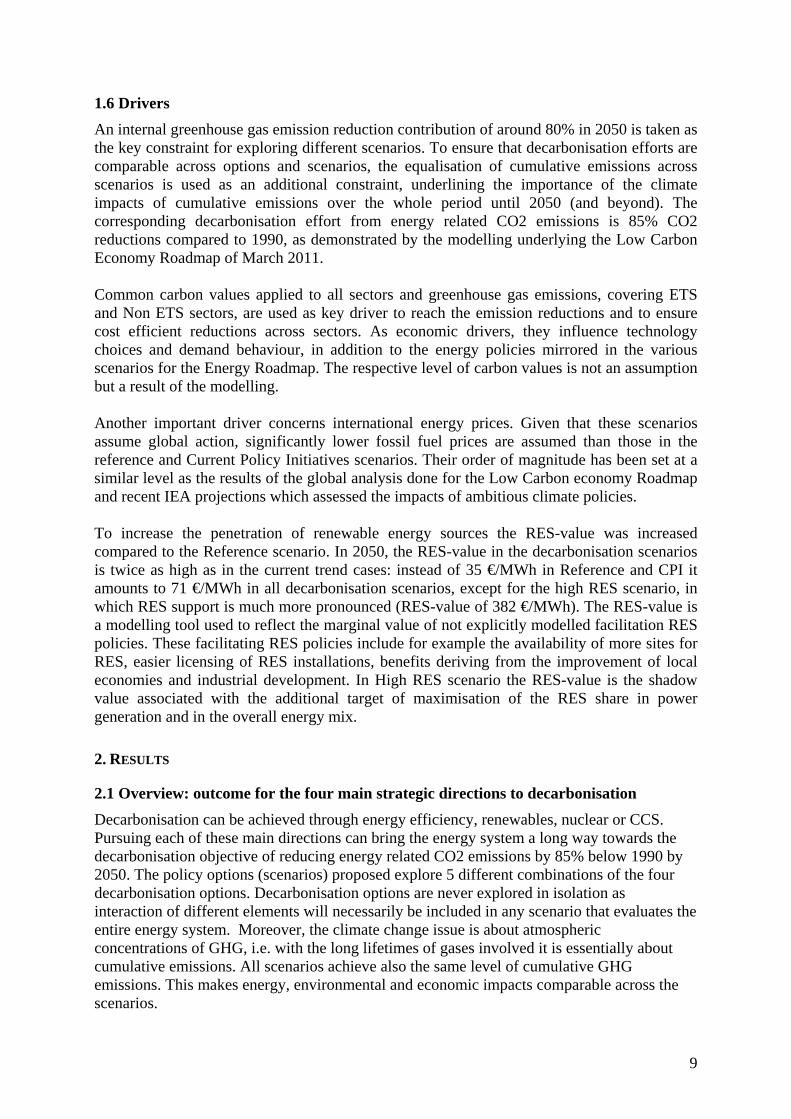
1.6 Drivers An internal greenhouse gas emission reduction contribution of around 80% in 2050 is taken as the key constraint for exploring different scenarios. To ensure that decarbonisation efforts are comparable across options and scenarios, the equalisation of cumulative emissions across scenarios is used as an additional constraint, underlining the importance of the climate impacts of cumulative emissions over the whole period until 2050 (and beyond). The corresponding decarbonisation effort from energy related CO2 emissions is 85% CO2 reductions compared to 1990, as demonstrated by the modelling underlying the Low Carbon Economy Roadmap of March 2011. Common carbon values applied to all sectors and greenhouse gas emissions, covering ETS and Non ETS sectors, are used as key driver to reach the emission reductions and to ensure cost efficient reductions across sectors. As economic drivers, they influence technology choices and demand behaviour, in addition to the energy policies mirrored in the various scenarios for the Energy Roadmap. The respective level of carbon values is not an assumption but a result of the modelling. Another important driver concerns international energy prices. Given that these scenarios assume global action, significantly lower fossil fuel prices are assumed than those in the reference and Current Policy Initiatives scenarios. Their order of magnitude has been set at a similar level as the results of the global analysis done for the Low Carbon economy Roadmap and recent IEA projections which assessed the impacts of ambitious climate policies. To increase the penetration of renewable energy sources the RES-value was increased compared to the Reference scenario. In 2050, the RES-value in the decarbonisation scenarios is twice as high as in the current trend cases: instead of 35 €/MWh in Reference and CPI it amounts to 71 €/MWh in all decarbonisation scenarios, except for the high RES scenario, in which RES support is much more pronounced (RES-value of 382 €/MWh). The RES-value is a modelling tool used to reflect the marginal value of not explicitly modelled facilitation RES policies. These facilitating RES policies include for example the availability of more sites for RES, easier licensing of RES installations, benefits deriving from the improvement of local economies and industrial development. In High RES scenario the RES-value is the shadow value associated with the additional target of maximisation of the RES share in power generation and in the overall energy mix.
2. RESULTS
2.1 Overview: outcome for the four main strategic directions to decarbonisation Decarbonisation can be achieved through energy efficiency, renewables, nuclear or CCS. Pursuing each of these main directions can bring the energy system a long way towards the decarbonisation objective of reducing energy related CO2 emissions by 85% below 1990 by 2050. The policy options (scenarios) proposed explore 5 different combinations of the four decarbonisation options. Decarbonisation options are never explored in isolation as interaction of different elements will necessarily be included in any scenario that evaluates the entire energy system. Moreover, the climate change issue is about atmospheric concentrations of GHG, i.e. with the long lifetimes of gases involved it is essentially about cumulative emissions. All scenarios achieve also the same level of cumulative GHG emissions. This makes energy, environmental and economic impacts comparable across the scenarios.

10
Energy Efficiency
Energy Efficiency is a key ingredient in all the decarbonisation pathways examined. Its contribution is most important in the Energy Efficiency scenario (Scenario 2). Energy savings in 2050 from 2005 (virtually the peak energy consumption year) amount to 41%, while GDP more than doubles over the same period of time (+104%). The lowest contribution from energy efficiency towards decarbonisation comes in the Delayed CCS scenario, having a high nuclear contribution, in which primary energy consumption declines 32% between 2005 and 2050. As GDP does not change between scenarios, these energy savings from 2005 are entirely due to energy efficiency gains in a broad sense (including structural change), but not involving income losses.
In the Energy Efficiency scenario, one unit of GDP in 2050 requires 71% less energy input than in 2005. The average annual improvement in energy intensity (primary energy consumption / GDP) amounts to 2.7% pa, which is almost a doubling from historical trends (1.4% pa in 1990 to 2005 including the major efficiency raising restructuring in former centrally planned economies). All the decarbonisation scenarios have energy intensity improvements around 2.5% pa given e.g. synergies between energy efficiency and RES.
Energy savings in the High RES scenario are almost as high as in the Energy Efficiency case (minus 38% for energy consumption in 2050 compared to 2005 instead of minus 41%), this is however achieved by different means: the energy efficiency scenario focuses on direct impacts on final demand, whereas energy savings in the high RES case come largely through highly efficient RES technologies replacing less efficient nuclear and fossil fuel technologies.
A clear result concerning the strategic energy efficiency direction is that a substantial speeding up of energy efficiency improvements from historical trends is crucial for achieving the decarbonisation objective.
RES
RES, too, are a key ingredient in any decarbonisation strategy. The RES share in gross final energy consumption (i.e. the definition for the existing 20% target) rises to at least 55% in 2050.
In the High RES scenario the RES share in gross final energy consumption reaches 75%, up 65 percentage points from current levels. The RES share in transport increases to 73%. The RES share in power generation reaches 86%. RES in electricity consumption account for even 97% given that electricity consumption calculated in line with the procedure for the calculation of the overall RES share excludes losses related to pump storage and hydrogen storage of electricity, the latter being necessary to accommodate all the available RES electricity in particular at times when electricity demand is lower than RES generation.
The second highest RES contribution (58%) materialises in the Low nuclear scenario. The RES share is also rather high under strong energy efficiency policies (57%).
The High RES scenario is the most challenging scenario regarding the restructuring of the energy system including major investments in power generation with RES capacity in 2050 reaching over 1900 GW, which is more than 8 times the current RES capacity and also more than twice today's total generation capacity (including nuclear, all fossil fuels and RES) (for more details see under power generation)
11
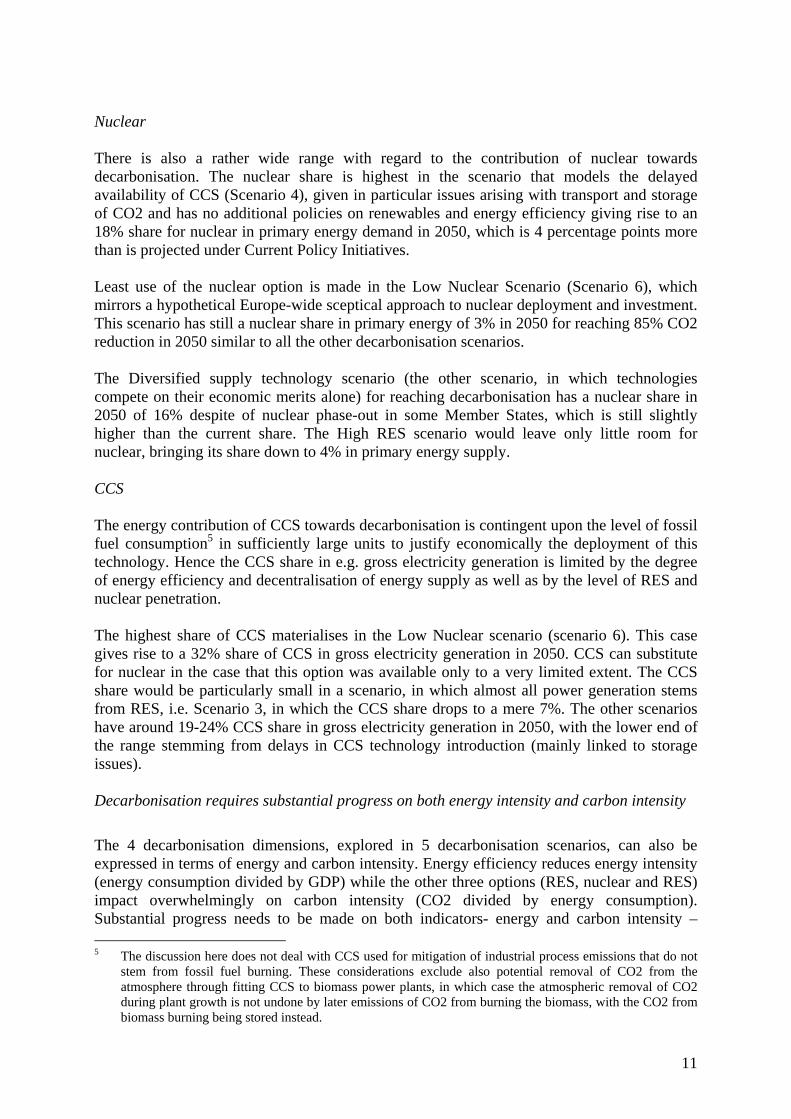
Nuclear There is also a rather wide range with regard to the contribution of nuclear towards decarbonisation. The nuclear share is highest in the scenario that models the delayed availability of CCS (Scenario 4), given in particular issues arising with transport and storage of CO2 and has no additional policies on renewables and energy efficiency giving rise to an 18% share for nuclear in primary energy demand in 2050, which is 4 percentage points more than is projected under Current Policy Initiatives. Least use of the nuclear option is made in the Low Nuclear Scenario (Scenario 6), which mirrors a hypothetical Europe-wide sceptical approach to nuclear deployment and investment. This scenario has still a nuclear share in primary energy of 3% in 2050 for reaching 85% CO2 reduction in 2050 similar to all the other decarbonisation scenarios. The Diversified supply technology scenario (the other scenario, in which technologies compete on their economic merits alone) for reaching decarbonisation has a nuclear share in 2050 of 16% despite of nuclear phase-out in some Member States, which is still slightly higher than the current share. The High RES scenario would leave only little room for nuclear, bringing its share down to 4% in primary energy supply. CCS The energy contribution of CCS towards decarbonisation is contingent upon the level of fossil fuel consumption5 in sufficiently large units to justify economically the deployment of this technology. Hence the CCS share in e.g. gross electricity generation is limited by the degree of energy efficiency and decentralisation of energy supply as well as by the level of RES and nuclear penetration. The highest share of CCS materialises in the Low Nuclear scenario (scenario 6). This case gives rise to a 32% share of CCS in gross electricity generation in 2050. CCS can substitute for nuclear in the case that this option was available only to a very limited extent. The CCS share would be particularly small in a scenario, in which almost all power generation stems from RES, i.e. Scenario 3, in which the CCS share drops to a mere 7%. The other scenarios have around 19-24% CCS share in gross electricity generation in 2050, with the lower end of the range stemming from delays in CCS technology introduction (mainly linked to storage issues). Decarbonisation requires substantial progress on both energy intensity and carbon intensity
The 4 decarbonisation dimensions, explored in 5 decarbonisation scenarios, can also be expressed in terms of energy and carbon intensity. Energy efficiency reduces energy intensity (energy consumption divided by GDP) while the other three options (RES, nuclear and RES) impact overwhelmingly on carbon intensity (CO2 divided by energy consumption). Substantial progress needs to be made on both indicators- energy and carbon intensity – 5 The discussion here does not deal with CCS used for mitigation of industrial process emissions that do not
stem from fossil fuel burning. These considerations exclude also potential removal of CO2 from the atmosphere through fitting CCS to biomass power plants, in which case the atmospheric removal of CO2 during plant growth is not undone by later emissions of CO2 from burning the biomass, with the CO2 from biomass burning being stored instead.

12
which are to some degree substitutes for each other. The more successful policies to reduce energy consumption are the less needs to be done on fuel switching towards zero/low carbon energy sources, and vice versa6 (see Figure 19). The five decarbonisation scenarios show substantial improvements in energy intensity which sinks 67%-71% compared with 2005 and 73%-76% compared with the higher 1990 level in terms of energy intensity (1990 had lower energy consumption, but also much lower GDP). Fuel switching continues in the decarbonisation scenarios up to 2050 and carbon intensity would improve substantially falling 76%-78% from 1990 (73%-75% from 2005). Figure 19: Decarbonisation scenarios: Improvements in carbon and energy intensities (reductions from 1990)
-80%
-75%
-70%
-65%
-60%
-55%
-50%Energy
efficiencyDiv. Supply
Techn.High RES Delayed
CCSLow Nuclear
energy intensity carbon intensity
With ongoing economic growth, decarbonisation poses a formidable challenge given that meeting higher demand for energy services (heating and cooling, lighting, cooking, process energy, mobility, communication, etc) is part of increasing welfare. Upward pressure on energy consumption and CO2 emissions from economic growth is substantial given that GDP might increase almost threefold between 1990 and 2050 (see figure 20). The 80% GHG reductions objective by 2050 will however require deep cuts into energy related CO2 emissions, which in turn require energy consumption to decrease substantially as well. Figure 20: Decarbonisation scenarios: development of GDP, primary energy consumption and energy related CO2 emissions: 1990 = 100
6 In this respect, carbon intensity is a summary indicator for the fuel mix, while energy intensity captures the
efficiency of energy consumption and the composition of economic activity (e.g. share of services versus (heavy) industry).

13
0
20
40
60
80
100
120
140
160
180
200
220
240
260
280
1990 1995 2000 2005 2010 2015 2020 2025 2030 2035 2040 2045 2050
Energy consumption
CO2 emissions
GDP
2.2 Energy consumption and supply structure Primary energy consumption is significantly lower in all decarbonisation scenarios as compared to the Reference scenario. This is also true for the Current Policy Initiatives scenario that shows 6 and 8% lower demand in 2030 and 2050, respectively than in the Reference scenario reflecting effects of energy efficiency measures in the Energy Efficiency Plan. The biggest decline of primary energy consumption comes in Energy Efficiency scenario (-16% in 2030 and -38% in 2050) showing effects of stringent energy efficiency policies and smart grid deployment. Compared with the actual outcome for 2005, primary energy consumption shrinks by 41%. The decrease in energy consumption compared with Reference for the decarbonisation scenarios spans a range from 11% - 16% in 2030 and from 30% to 38% in 2050. Energy efficiency is therefore an essential building block in all decarbonisation scenarios. Table 21: Total Primary energy consumption, changes compared to the Reference scenario (Mtoe) 2020 2030 2050Reference 1790 1729 1763Current policy Initiatives 1700 1629 1615
% difference to Reference -5.0% -5.8% -8.4%Energy efficiency 1644 1452 1084
% difference to Reference -8.1% -16.0% -38.5%Diversified supply technologies 1681 1534 1217
% difference to Reference -6.1% -11.3% -31.0%High RES 1679 1510 1134
% difference to Reference -6.2% -12.7% -35.7%Delayed CCS 1682 1532 1238
% difference to Reference -6.1% -11.4% -29.8%Low nuclear 1687 1489 1137
% difference to Reference -5.8% -13.9% -35.5%

14
It is important to note that these levels of reduced primary energy demand do not come from reduced activity levels (which remains the same across all scenarios). Instead they are mainly the result of technological changes on the demand and also supply side: from more efficient buildings, appliances, heating systems and vehicles and from electrification in transport and heating, which combines very efficient demand side technologies (plug-in hybrids, electric vehicles and heat pumps) with a largely decarbonised power sector. Some changes related especially to fuel switching also contribute to reducing primary energy demand, such as switching from lignite or nuclear power generation to gas or wind based electricity production, which is associated with higher conversion efficiencies. In addition, behavioural change, triggered by e.g. changes in prices, information, energy saving obligations, etc, contributes to better energy efficiency. Energy intensity of GDP (primary energy divided by GDP) reduces by 53% between 2005 and 2050 in the Reference scenario; the CPI scenario scores significantly better by improving energy intensity 57%. Energy intensity diminishes further in all decarbonisation scenarios: by at least 67% in the delayed CCS scenario. It improves 70% in the high RES and the low nuclear scenarios and even 71% in the energy efficiency scenario. Under decarbonisation, a unit of GDP in 2050 requires only one third of the energy needed today (or slightly less under e.g. a strong energy efficiency focus). By 2030, energy intensity would improve around 45% from current levels under decarbonisation, while this improvement would amount to some 40% under current policies. Absolute energy savings, not considering the doubling of GDP between now and 2050, show still impressing numbers. Compared with the recent peak in energy consumption in 2005/6, the energy efficiency scenario depicts 41% less energy consumption, which means a substantial energy saving with respect to the levels reached just before the economic crisis. Figure 21: Primary energy savings in 2050 compared to 2005
It is important to note that these levels of reduced primary energy demand do not come from reduced GDP or sectoral production levels (which remain the same in all scenarios). Instead they are mainly the result of technological changes on the demand and supply side, coming

15
from more efficient buildings, appliances, heating systems and vehicles and from electrification in transport and heating. All decarbonisation scenarios over-achieve the 20% energy saving objective in the decade 2020-2030. The scenarios are based on model assumptions, which are consistent with the input for the 2050 Low Carbon Economy Roadmap. Recognising the magnitude of the decarbonisation challenge, which implies a reversal of a secular trend towards ever increasing energy consumption, this Energy Roadmap has adopted a rather conservative approach as regards the effectiveness of policy instruments in terms of behavioural change. However, the Roadmap results should not be read as implying that the 20% energy efficiency target for 2020 cannot be reached effectively. Greater effects of the Energy Efficiency Plan are possible if the Energy Efficiency Directive is adopted swiftly and completely, followed up by vigorous implementation and marked change in the energy consumption decision making of individuals and companies.7 Not only the amount, but also the composition of energy mix would differ significantly in a decarbonised energy system. Figure 22 shows total energy consumption as well as its composition in terms of fuels in 2050 for the various scenarios. Figure 22: Total Primary Energy in 2050, by fuel
7 In modelling terms this means a significant lowering of the discount rate used in energy consumption
decision making of hundreds of millions of consumers.

16
Low and zero carbon content energy sources are strongly encouraged by going the various decarbonisation routes, each of them focusing on different aspects. This has different repercussions on the fuel mix. Energy efficiency encourages primary sources that can be used with small losses (e.g. many renewables or gas) and electricity at the level of final demand. CCS strategies affect the fuel mix by largely neutralising the high carbon content of fossil fuels, notably coal and lignite, through removal of the associated emissions. RES and nuclear routes are directly targeting the fuel mix. The modelling leads to rather wide ranges for primary energy sources with these fuel mixes in the decarbonisation cases all satisfying the decarbonisation requirement by 2050. Moreover, the development of all the fuel mixes under decarbonisation give rise to the same cumulative GHG emissions from 2011 to 2050. Table 22: Share of fuels in primary energy consumption in %
Reference scenario Current Policy
Initiatives Decarbonisation
scenarios
2005 2030 2050 2030 2050 2030 2050Solids 17.5 12.4 11.4 12.0 9.4 7.2-9.1 2.1-10.2Oil 37.1 32.8 31.8 34.1 32.0 33.4-34.4 14.1-15.5Gas 24.4 22.2 20.4 22.7 21.9 23.4-25.2 18.6-25.9Nuclear 14.1 14.3 16.7 12.1 13.5 8.4-13.2 2.6-17.5Renewables 6.8 18.4 19.9 19.3 23.3 21.9-25.6 40.8-59.6 Renewables increase their share significantly under adopted policies and would substantially rise in all decarbonisation scenarios to reach at least 22% of primary energy consumption by 2030 and 41% by 2050. The RES share is comparably low in those scenarios, in which nuclear plays a rather strong role (scenarios 4 and 5). The RES share is highest in High RES scenario reaching 60% in primary energy by 2050. It is also pretty high (44% and 46% in primary energy in 2050) in the Energy Efficiency and Low nuclear scenarios, respectively. The RES share is higher when calculated in gross final energy consumption (indicator used for the 20% RES target). It represents at least 28% (2030) and 55% (2050) in all decarbonisation scenarios and rises up to 75% in 2050 in the High RES scenario.

17
Figure 23: Range of Fuel Shares in Primary Energy in 2050 compared with 2009 outcome
0%
10%
20%
30%
40%
50%
60%
70%
RES Gas Nuclear Oil Solid Fuels0%
10%
20%
30%
40%
50%
60%
70%
2009
Nuclear developments have been significantly affected by the policy reaction in Member States after the nuclear accident in Fukushima (abandoning substantial nuclear plans in Italy, revision of nuclear policy in Germany). These reactions and the forthcoming nuclear stress tests have been reflected in the modelling assumptions for the Current Policy Initiatives scenario (1bis). The downward effects for nuclear penetration in CPI are also present in the decarbonisation scenarios, since the modelling of these cases also included the recent policy adjustments on nuclear. The share of nuclear varies depending on assumptions taken. In the scenario without new nuclear investment (except for plants under construction) and extension of lifetime only in this and the next decade, the nuclear share declines gradually to 3% by 2050. In the most ambitious nuclear scenario - Delayed CCS, the share rises to 18%8.
The share of gas under Current Policy Initiatives is higher than in the Reference scenario reflecting abandon of the nuclear programme in Italy, no new nuclear power plants in Belgium and higher costs for new plants and retrofitting. The gas share increases slightly to 26% in 2050 in the Low nuclear scenario where the CCS share in power generation is around 32%.
8 This share is considerably lower than in decarbonisation scenarios of DG CLIMA. There are three main
explanations: 1. Decarbonisation scenarios and Current Policy Initiatives scenario are based on revised assumptions on
nuclear (abandon of nuclear programme in Italy, no new nuclear plants in Belgium and upwards revision of costs for nuclear power plants).
2. Electricity demand is lower than in the Low Carbon Economy Roadmap Scenarios due to stringent energy efficiency measures.
3. Revised assumptions on the potential of electricity in transport compared to the DG CLIMA decarbonisation scenarios, following more closely the scenarios developed in the White Paper on Transport leading to lower utilisation rate of nuclear power plants than in the Low Carbon Economy Roadmap Scenarios. Electric vehicles flatten electricity demand and thus incentivise base load power generation.

18
The oil share declines only slightly until 2030 (and even 2040) due to high dependency of transport on oil based fuels. However, the decline is significant in the last decade 2040-2050 where oil in transport is replaced by biofuels and electric vehicles. The oil share drops to around 15% in 2050 when following any of the examined main directions towards decarbonisation. The share of solid fuels continues its long standing downward trend already under Reference and CPI developments. Under substantial decarbonisation the solids share shrinks further to reach levels as low as 2% in the High RES scenario in 2050 and only 4% and 5% under Energy efficiency and Delayed CCS, respectively. The solids share would remain rather high only in the Low nuclear scenario (10% in 2050) with a high CCS contribution which allows a continued use of solids in a decarbonisation context. Final energy demand declines similarly to primary energy demand. Current Policy Scenario shows around 5% decrease (in 2020-2050) compared to the Reference scenario. In the Energy Efficiency scenario the reduction on Reference in final energy demand is -14% in 2030 and -40% in 2050. The decrease in the decarbonisation scenarios is at least -8% in 2030 and -34% in 2050. Compared with actual 2005 outcome, final energy consumption decreases in 2050 by 37% in the High Energy Efficiency scenario and by around 32% in all the other decarbonisation scenarios. Sectors showing higher reductions than the average are residential, tertiary and generally also transport. Table 23: Final energy demand, changes compared to the Reference scenario
Reference scenario Current Policy
Initiatives Energy efficiency Diversified supply
technologies
202
0 203
0 205
0 202
0 203
0 205
0202
0 203
0 205
0 202
0 203
0 205
0 Final Energy Demand (Mtoe)
1227
1187
1221 -6% -4% -5% -9%
-14%
-40% -7% -9%
-34%
Industry 330 333 369 -4% -5% -5% -4% -5% -
30% -4% -5% -
26%
Residential 318 299 288 -9% -6% -4%-
13% -
20% -
43% -9% -
12% -
35%
Tertiary 181 174 181 -8% -5% -7%-
13% -
25% -
53% -8% -
15% -
42%
Transport 398 382 383 -4% -2% -6% -7% -
12% -
40% -7% -9% -
38%
High RES
Delayed CCS
Low nuclear
202
0 203
0 205
0 202
0 203
0 205
0202
0 203
0 205
0Final Energy Demand (Mtoe) -7% -8%
-34% -7%
-10%
-35% -6%
-10%
-35%
Industry -4% -4% -
25% -4% -5% -
26% -3% -6% -
26%
Residential -9% -9% -
34% -9% -
12% -
35% -9% -
13% -
36%
Tertiary -8% -
13% -
44% -8% -
16% -
42% -7% -
17% -
43%

19
Transport -7% -8% -
38% -7% -9% -
39% -7% -9% -
39% There is a lot of structural change in the fuel composition of final energy demand. Given its high efficiency and emission free nature at use, electricity makes major inroads already under current policies (increase by 9 pp between 2005 and 2050 in CPI). The electricity share soars further in decarbonisation scenarios reaching 36% - 39% in 2050, reflecting also its important role in decarbonising further final demand sectors such as heating and services and in particular transport. The electricity share would almost double by 2050. The crucial issue for any decarbonisation strategy is therefore the full decarbonisation of power generation (see below). Table 24: Final energy consumption by fuel in various scenarios
2005 2030 2050 2030 2050
Electricity 20,2% 24,5% - 25,1% 29,1% - 29,4% 25,2% - 26,0% 36,1% - 38,7%
RES (direct) 4,9% 9,1% - 9,2% 9,0% - 9,4% 8,5% - 10,5% 23,8% - 30,0%
Oil 42,2% 36,1% - 36,8% 35,0% - 35,5% 33,2% - 34,6% 14,9% - 15,6%
Gas 24,2% 18,7% - 19,1% 16,1% - 16,6% 19,4% - 20,0% 11,9% - 12,7%
Heat 3,8% 7,3% - 7,5% 8,2% - 8,6% 7,1% - 8,0% 6,7% - 10,0%
Solid fuels 4,6% 3,2% - 3,3% 2,9% - 3,1% 2,5% - 3,0% 0,3% - 0,4%
Reference/CPI Decarbonisation scenarios
Also RES make major inroads under current policies including the 2009 RES Directive. The direct use of RES in final demand (i.e. not counting here the RES input to power and distributed heat generation) rises strongly to 2030 coming close to a doubling of the share. However, without additional policy push beyond the current RES/climate change measures, this RES share could be stagnant. On the contrary, in decarbonisation scenarios the share of directly used RES (e.g. biomass, solar thermal) would go up to 24% in 2050 in almost all decarbonisation cases, except for the high RES scenario, where this share reaches even 30%. Oil has been dominating final energy for many years and might continue doing so until 2030 even in the decarbonisation scenarios, when is would still account for one third of energy deliveries to final consumers. The big changes come after 2030 when more and more parts of final energy consumption based on oil, especially in transport, are replaced by electricity (e.g. electric and plug in hybrid vehicles, heat pumps). The oil share in 2050 would drop to around 15%. The gas share has been declining in recent years and would be lower than today under both current policies and decarbonisation in 2030, when gas would account for not more than a fifth in final demand. The gas share after 2030 would be decreasing further in particular in decarbonisation scenarios, which is due to the greater role of electricity in both heating and for providing energy in productive sectors. Distributed heat would deliver 7-8% of final energy demand in 2030 under both current policies and decarbonisation, raising its share substantially from current levels. The heat share

20
in 2050 would be highest (10%) in the Low nuclear scenario where high electricity production is ensured by CCS equipped generation from gas and solids, often in a CHP mode. Solid fuels become rather obsolete in final energy demand under current policies (falling to around 3% in 2030-2050). The decline of the solids share reflects higher use of electricity and gas in heating and industry. Solid fuels become marginal under decarbonisation, especially by 2050, when most solids base processes have been replaced by electricity or other fuels. The solid fuel share in 2050 would shrink to 0.3-0.4%. Figure 24: Shares of Electricity in Current Trend and Decarbonisation Scenarios
15%
20%
25%
30%
35%
40%
2005 2010 2015 2020 2025 2030 2035 2040 2045 2050
Range for current trends scenarios:
Range regarding decarbonisation scenarios
2.3 Power generation Electricity demand increases in all scenarios compared to 2005 levels, following greater penetration of electricity using appliances, heating and propulsion systems. The increased use of electric devices is partly compensated by the increased energy efficiency of electric appliances as well as increased thermal integrity in the residential and service sectors and more rational use of energy in all sectors, but overall the effect from emerging new electricity uses at large scale for heating and transport is decisive. The development of electricity consumption varies between sectors. Transport electricity demand increases strongest. The increase of electricity use in transport is due to the electrification of road transport, in particular private cars, which can either be plug-in hybrid or pure electric vehicle; almost 80% of private passenger transport activity is carried out with these kinds of vehicles by 2050. Despite substantial progress regarding energy efficiency of appliances and for efficient heating systems, such as heat pumps, household electricity demand in 2050 under decarbonisation exceeds the current level given the additional deployment of electricity in heating and cooling. Electricity demand in the other sectors decreases or remains flat under decarbonisation. Electricity demand in services/agriculture diminishes in all decarbonisation scenarios as a result of strong energy efficiency policies, although there is a substitution from other energy

21
carriers to more efficient electric devices e.g. heat pumps. . Industrial electricity demand remains broadly at the current level by 2050 under decarbonisation. Table 25: Electricity final energy demand
2050
2005 Reference Scenario 1bis Scenario 2
Final energy demand (in TWH) 2762 4130 3951 3203 Industry 1134 1504 1426 1109 Households 795 1343 1230 913 Tertiary 759 1184 1041 518 Transport 74 100 255 663
2050 Scenario 3 Scenario 4 Scenario 5 Scenario 6
Final energy demand (in TWh) 3618 3377 3585 3552 Industry 1211 1169 1201 1191 Households 1026 938 1019 1013 Tertiary 707 605 696 677 Transport 675 664 669 671
Power generation: level and structure by fuel Given the assumed limited electricity import possibilities from third countries, the increased electricity demand will have to be generated nearly exclusively within the EU. Moreover, electricity production has to cover also power plant own consumption (e.g. for desulphurisation), the consumption of the other energy producing sectors (energy branch) as well as transmission and distribution losses. Furthermore, additional electricity generation is appropriate under strong decarbonisation objectives to produce hydrogen mixed in low and medium pressure gas networks (bringing down emission factors in final demand) and for producing hydrogen, which is used for balancing in the case of high RES scenarios. Therefore, similar to electricity demand there is a strong increase from current levels for power generation in all scenarios. Under decarbonisation, power generation will be lower in 2050 compared with Reference and CPI scenarios. The highest electricity generation level in 2050 among the decarbonisation cases comes about in case of CO2 reduction focussing particularly strongly on RES. The structure of power generation changes substantially between the scenarios. The Reference scenario and the Current Policy Initiatives scenario show renewable shares in 2050 reaching 40 and 49% respectively and fossil fuels still having a share of 33 and 31% respectively. Among the decarbonisation scenarios, only the Low nuclear scenario has a share of fossil fuels above 30%, as it makes substantial use of CCS. In the other scenarios the fossil fuel share lies below 25% and is particularly low in High RES scenario, where fossil fuels account for under 10% of electricity generation. Under decarbonisation, power generation in 2050 is based on renewables for at around 60%-65%, except for the high RES case, in which this share is much higher. Wind alone accounts for about one third of power generation in most decarbonisation scenarios. In the high RES case, the wind share reaches even close to 50% in 2050. The nuclear share falls from the

22
present level in all decarbonisation scenarios. This share is highest in 2050 under delayed CCS, in which case it is around 20%. On the contrary, in the low nuclear scenario, nuclear would account for just 2.5% of power generation. Table 26: Power generation
2050
2005
Reference Scenario 1bis Scenario 2
Electricity generation TWh 3274 4931 4620 4281
Nuclear energy 30.5 26.4 20.6 14.2
Renewables 14.3 40.3 48.8 64.2
Hydro 9.4 7.6 8.5 9.2
Wind 2.2 20.1 24.7 33.2
Solar, tidal etc. 0.0 5.1 7.0 10.6
Biomass & waste 2.6 7.3 8.4 10.9
Geothermal heat 0.2 0.2 0.2 0.3
Fossil fuels 55.2 33.3 30.6 21.6
Coal and lignite 30.0 15.2 11.1 4.8
Petroleum products 4.1 2.2 2.1 0.0
Natural gas 20.3 15.1 16.7 16.7
Coke & blast-furnace gasses 0.9 0.7 0.7 0.0
Other fuels (hydrogen, methanol)
Shar
es (%
)
0.0 0.0 0.0 0.0
2050
Scenario 3 Scenario 4 Scenario 5 Scenario 6
Electricity generation TWh 4912 5141 4872 4853
Nuclear energy 16.1 3.5 19.2 2.5
Renewables 59.1 83.1 60.7 64.8
Hydro 8.0 7.7 8.1 8.1
Wind 31.6 48.7 32.4 35.6
Solar, tidal etc. 9.9 16.4 9.9 10.8
Biomass & waste 9.3 9.6 9.9 9.8
Geothermal heat 0.3 0.6 0.4 0.4
Fossil fuels 24.8 9.6 20.1 32.7
Coal and lignite 8.1 2.1 5.1 13.1
Petroleum products 0.0 0.0 0.0 0.1
Natural gas 16.6 7.5 14.9 19.5
Coke & blast-furnace gasses 0.0 0.0 0.0 0.0
Other fuels (hydrogen, methanol)
Shar
es (%
)
0.0 3.9 0.0 0.0 NB: power generation is presented in the most comprehensive way in this table involving in a sense some "double counting" in the denominator of shares for the high RES scenario: first electricity generation from RES is counted including those parts of RES based generation that, in case supply exceeds demand, are transformed into hydrogen for later use by producing electricity for a second time from these original renewables sources. This specific representation for showing also the magnitude of hydrogen based RES electricity storage (4% in 2050) leads to total electricity generation numbers that are in a sense inflated, which in turn gives rise to lower RES share numbers in this specific representation that counts production from RES once as such and secondly

23
under hydrogen based generation (shown separately) for the part that is not lost in transformations into hydrogen and back from hydrogen to electricity. Power plant investments by fuel type (e.g. RES, nuclear, fossils with CCS, fossil without CCS) The installed capacity increases in all scenarios compared to the Reference scenario due to the additional balancing and power reserve capacities needed for the variable RES which increase in all scenarios. The scenario with the least increase is Energy Efficiency scenario which requires the least amount of electricity and therefore also the least amount of installed capacity. All scenarios still have fossil fuel fired power plants as installed capacity, which are used mainly as back-up. The share of CCS capacity in thermal power plants for the decarbonisation scenarios ranges from 48% in Low nuclear scenario to 12% in High RES scenario. The share in the other scenarios is between 35 and 44%. Table 27: Installed power capacity
2050
2005
Reference Scenario 1bis Scenario 2
Net Installed Power Capacity 715 1454 1502 1473
Nuclear energy 134 161 117 79
Renewables (without biomass/geothermal) 147 681 784 1012
Hydro (pumping excluded) 105 121 122 125
Wind power 41 382 432 548
Wind on-shore 40 262 291 370
Wind off-shore 1 120 140 177
Solar 2 171 224 330
Other renewables (tidal etc.) 0 6 7 9
Thermal power 434 613 601 382
Solids fired 187 131 104 70
Oil fired 62 168 38 15
Gas fired 167 226 366 187
Biomass-waste fired 18 87 92 108
Hydrogen plants 0 0 0 0
Geothermal heat
GW
e
1 1 1 2
2050
Scenario 3 Scenario 4 Scenario 5 Scenario 6
Net Installed Power Capacity 1621 2219 1639 1721
Nuclear energy 102 41 127 16
Renewable (without biomass/geothermal) 1081 1749 1093 1193
Hydro (pumping excluded) 126 131 126 127
Wind power 595 984 609 674
Wind on-shore 398 612 408 452
Wind off-shore 197 373 200 222
Solar
GW
e
351 603 348 381

24
Other renewables (tidal etc.) 10 30 10 11
Thermal power 439 429 419 513
Solids fired 94 62 73 125
Oil fired 19 19 18 18
Gas fired 218 182 210 255
Biomass-waste fired 106 163 115 112
Hydrogen plants * 0 0 0 0
Geothermal heat 2 4 2 2
2050
2005 Reference Scenario 1bis Scenario 2
Total CCS capacity 0 101 39 149 Solids 0 64 33 28 Oil 0 0 0 0 Gas
GW
e
0 37 6 121 2050 Scenario 3 Scenario 4 Scenario 5 Scenario 6Total CCS capacity 193 53 148 248
Solids 50 18 30 79 Oil 0 0 0 0 Gas
GW
e
142 34 118 169 * Hydrogen capacity in the above table refers only to plant technologies dedicated to specific hydrogen use,
such as fuel cells. Capacity for generating electricity from hydrogen, serving only the purpose of storing RES based electricity that was previously produced at times when electricity supply exceeded demand, is accounted for under gas fired capacity, given that hydrogen would be burnt is such types of plants, including as a mixture with natural gas.
The high RES scenario is a particularly challenging scenario regarding the restructuring of the energy system involved; RES policy related challenges in this scenario include the following:
• Huge investments in RES power capacity need to be ensured with wind capacity alone reaching over 980 GW in 2050, this is 20% more than today's (2010) total power generation capacity (including nuclear, fossil fuels and all RES); similarly, solar capacity would need to soar to 600 GW, which amounts to almost three quarters of our present total generation capacity; all RES power generation capacity (Renewables + biomass/waste + geothermal in table 27) would need to increase to over 1900 GW, which is more than 8 times the current RES capacity and also more than twice today's total generation capacity.
• It might be a challenge to ensure the raw material needed for RES technologies and there may be upward pressure on e.g. steel prices, which could be a challenge to such a development (not modelled with the energy model); other logistic challenges would relate to ensuring the maritime equipment to install and maintain the off-shore wind capacity that rises from just close to 5 GW today to over 370 GW in 2050;

25
• In order to accommodate RES production from remote sites with respect to consumption centres and to take advantage of the cost differences across Member States for cost-effectiveness reasons, the grid needs to be extended substantially and also smartened to deal with variable feed in from many dispersed sources (e.g. solar PV); the scenario analysis identified needs for grid extension beyond 2020 under a decarbonisation agenda and in addition a set of additional DC links (electricity highways) needed to accommodate a very high RES contribution to electricity supply (see attachment 2 to this Annex);
• Another challenge relates to the skilled workforce required, the lack of which can lead to a stalled development unless a major RES related education and training strategy is pursued taking account of ageing EU population over the next decades, which is even shrinking after 2035. Skilled workforce will also be needed for the construction of expanded, smart grids, which will also be necessary for the penetration of other low carbon technologies.
• In addition to economic, logistical, resource security and manpower challenges, there is the acceptance issue for new transmission lines and perhaps also regarding the substantial expansion of (on-shore) RES installations;
It will also be challenging in the other decarbonisation scenarios to ensure the required RES capacity in 2050 and to accommodate it by the grid. The Energy Efficiency scenario poses the least challenge given the lowest electricity demand, but nevertheless, RES power generation capacity would need to soar to 5 times the current level, exceeding today's total electricity generation capacity (nuclear, fossil fuel and RES combined) by more than a third. On the other hand, increased energy efficiency and decentralised RES might require more sophisticated solutions for distribution level. Other scenarios pose also substantial challenges throughout the transition. For example, higher nuclear deployment in the delayed CCS scenario leads to more requirements for nuclear fuel and more nuclear waste that needs to be safely transported and stored. Electrification of passenger transport involves many changes in car production and infrastructure provision. A smooth transition from a petrol/diesel to an electricity based system for mainly urban transport requires a lot of logistical changes. Widespread penetration of CCS will require dedicated CO2 transport grids that need to be financed, constructed and accepted. Acceptance challenges could be particularly pronounced for nuclear and CO2 storage. As carbon capture, transport and storage require significant quantities of electricity that need to be generated in addition to electricity for final use, there would be higher input demand also for fossil fuels. This effect would be particularly pronounced if global decarbonisation includes an important contribution from CCS for energy consumption and also for abatement of industrial process emissions. This could exert upward pressure on the level of world fossil fuel prices. All scenarios involve substantial changes in production, transformation, smart transmission/distribution and consumption patters for energy, requiring a skilled workforce against the background of ageing population. Enhancement of the European capacity for innovation, appropriate RTD as well as education and training will be instrumental for a cost-effective transition to a low carbon economy that fosters competitiveness and security of supply.

26
Decarbonisation requires also considerable capacity for CCS, except for the high RES scenario. The other scenarios involve around 150 GW – 250 GW CCS capacity in 2050, with the upper end materialising in Low nuclear scenario, which is the case with the greatest use of CCS for power generation (32% share In Table 28 the capacity investment per decade for the scenarios can be seen; as can be observed the highest investments take place in RES in all scenarios. As can be seen no new investment is undertaken in nuclear in Low nuclear scenario after 2030; only Delayed CCS sees higher nuclear investment than in the Reference scenario for the last two decades of the projection period. Investment continues in thermal power plants throughout the projection period in all scenarios; it is lowest in High RES and Energy efficiency scenarios. These investment numbers include lifetime extensions of existing plants, refurbishments and replacement investments on existing sites, which is particularly relevant for nuclear. These investment numbers must not be confused with additional new plants of e.g. nuclear. Table 28: Net Power Capacity Investment in GWe per decade
2011-2020 2021-2030 2031-2040 2041-2050
Nuclear energy 15 64 46 62
Renewable energy 192 169 192 259
Thermal power fossil fuels 100 78 184 183
of which: CCS 5 6 48 41
Reference
Thermal power RES 37 17 14 24
Nuclear energy 12 42 41 49
Renewable energy 187 169 245 309
Thermal power fossil fuels 101 72 169 198
of which: CCS 3 0 19 17
Scenario 1 bis
Thermal power RES 38 17 13 29
Nuclear energy 11 24 34 22
Renewable energy 204 222 318 436
Thermal power fossil fuels 86 23 92 92
of which: CCS 3 0 56 90
Scenario 2
Thermal power RES 38 19 27 29
Nuclear energy 12 46 36 35
Renewable energy 214 250 348 463
Thermal power fossil fuels 90 37 130 101
of which: CCS 3 1 91 98
Scenario 3
Thermal power RES 40 20 27 25
Nuclear energy 12 30 12 0
Renewable energy 215 396 588 817
Thermal power fossil fuels 88 35 66 91
of which: CCS 3 0 19 30
Scenario 4
Thermal power RES 38 22 55 53
Nuclear energy 12 47 56 39
Renewable energy 214 256 354 464
Scenario 5
Thermal power fossil fuels 89 36 79 115

27
of which: CCS 3 0 35 110
Thermal power RES 39 20 37 23
Nuclear energy 11 4 0 0
Renewable energy 213 281 385 515
Thermal power fossil fuels 90 50 163 121
of which: CCS 3 5 121 118
Scenario 6
Thermal power RES 39 25 26 27 Investment in generation capacity entails substantial cumulative investment expenditure in all scenarios over the period 2011-2050. Cumulative investment expenditure for power generation is most pronounced in the high RES scenario amounting to over 3 trillion € in real terms up to 2050. Among the decarbonisation scenarios cumulative investment expenditure for power generation is lowest in the Energy Efficiency scenario given the marked savings in electricity consumption. Figure 25: Cumulative investment expenditure in 2011-2050 for power generation (in € of 2008)
0 200 400 600 800 1000 1200 1400 1600 1800 2000 2200 2400 2600 2800 3000 3200
Current Policy Initiatives
Energy Efficiency
Diversified SupplyTechnologies
Low Nuclear
Delayed CCS
High RES
Bn € of 2008
These investment expenditure results impact on electricity generation costs in the different scenarios (see below) Impacts on infrastructure Infrastructure requirements differ in scenarios. Decarbonisation scenarios require more and more sophisticated infrastructures (mainly electricity lines, smart grids and storage) than Reference and CPI scenarios. High RES scenario necessitates additional DC lines mainly to transport wind electricity from the North Sea to the centre of Europe and more storage. The biggest share of costs relate to the upgrade and improvement of distribution networks including smartening of the grid. Investments needed in transmission lines are much lower and new interconnectors represent only a fraction of these transmission costs. Table 29: Grid investment costs
Grid investment costs (Bn Euro'05) 2011-2020 2021-2030 2031-2050 2011-2050

28
Reference 292 316 662 1269 CPI 293 291 774 1357 Energy Efficiency 305 352 861 1518 Diversified supply technologies 337 416 959 1712 High RES 336 536 1323 2195 Delayed CCS 336 420 961 1717 Low nuclear 339 425 1029 1793
Transmission Grid investment (bEUR) Euro'05
2011-2020
2021-2030
2031-2040
2041-2050
2011-2050
Reference 47.9 52.2 53.5 52.0 205.7 CPI 47.1 49.6 64.8 66.6 228.2 Energy Efficiency 49.0 63.1 80.3 80.1 272.5 Diversified supply technologies 52.8 70.2 88.0 86.8 297.8 High RES 52.8 95.5 137.8 134.4 420.4 Delayed CCS 52.7 71.0 88.6 87.6 299.9 Low nuclear 52.9 73.8 95.2 94.8 316.6
Distribution Grid investment (bEUR) Euro'05
2011-2020
2021-2030
2031-2040
2041-2050
2011-2050
Reference 243.7 263.5 280.5 276.0 1063.7 CPI 245.0 239.3 317.6 325.9 1127.8 Energy Efficiency 256.3 289.1 408.4 291.8 1245.5 Diversified supply technologies 284.2 345.9 454.3 329.8 1414.1 High RES 283.5 440.0 619.8 431.5 1774.8 Delayed CCS 283.4 349.4 445.1 339.6 1417.5 Low nuclear 286.4 350.8 472.5 366.5 1476.3
Investments in new electricity interconnectors Euro'08
2006-2020 2021-2030 2031-2050 Reference 13.1 0.3 0.0 CPI 21.9 9.7 0.6 High energy efficiency 21.9 9.7 0.6 Diversified supply technologies 21.9 9.7 0.6 High RES 21.9 21.2 50.8 Delayed CCS 21.9 9.7 0.6 Low nuclear 21.9 9.7 0.6
The model assumes that grid investments, that are prerequisites to the decarbonisation scenarios in this analysis, are undertaken and that costs are fully recovered in electricity prices. The reality might differ from this model situation in a sense that current regulatory regime might be more short to medium term cost minimisation oriented and might not provide sufficient incentives for long-term and innovative investments. There might also be less perfect foresight and lower coordination of investments in generation, transmission and distribution as the model predicts.

29
Power generation costs Fixed operational and capital costs for power generation increase over time in all scenarios. The increase in capital costs is more pronounced in decarbonisation scenarios, notably in the High RES case. A substantial RES contribution (high RES scenario) leads to an increase of fixed and capital costs of 155% in 2050 compared with 2005 (81% rise by 2030) due to the additional investment needs in generation, grid, storage and back-up capacities. On the contrary, the increase in variable and fuel costs over time under Reference and CPI developments would be more or less cancelled in the decarbonisation cases. This effect of shifting variable and fuel costs towards capital costs is most pronounced in the High RES scenario. In this decarbonisation case, the substantial RES contribution leads to a decline of variable and fuel costs by 45% below Reference in 2050 and also a decrease by 21% on the 2005 level. Unit costs of transmission and distribution increase substantially in all decarbonisation scenarios. The High RES case has the greatest increase. Due to the decarbonisation of the power sector in all scenarios in the last two decades of the projection period, the costs related to ETS auction payments decrease substantially. These effects on cost components allow for a decrease in electricity prices between 2030 and 2050 in all decarbonisation scenarios, except for the High RES scenario. This is in stark contrast to the period up to 2030, in which electricity prices increase due notably to increases in capital cost, grid costs and auctioning payments. The High RES case is an exception from other cases because of the very high investment requirements combined with stronger requirements on the electricity grid extension, which is not fully compensated by savings in fuel and other variable costs. Therefore the High RES case features the highest electricity prices among the decarbonisation scenarios, as it would not allow for the flattening out of the strong price increase up to 2030 (observed in all scenarios) but continues with major capital intensive changes to the power system.

30
Table 31: Electricity prices and cost structure 9 Reference Scenario 1bis Scenario 2
(Euro'08 per MWhe) 2005 2030 2050 2030 2050 2030 2050
Fixed and capital costs 39.6 56.7 52.4 57.4 54.6 63.4 61.6 Variable and fuel costs 32.0 40.6 46.2 41.1 43.5 34.8 31.2 Tax on fuels and ETS payments 1.0 9.9 5.0 8.6 6.9 5.0 1.3 Grid and sales costs 22.8 25.9 25.8 26.7 28.7 28.6 29.5
Average price of electricity (pre-tax)(*) 95.4 133.2 129.4 133.7 133.6 131.7 123.5 Average price of electricity (After-tax) (*) 109.3 154.8 151.1 156.0 156.9 154.4 146.7
Scenario 3 Scenario 4 Scenario 5 Scenario 6 (Euro'08 per MWhe)
2030 2050 2030 2050 2030 2050 2030 2050Fixed and capital costs 63.3 61.9 71.7 101.0 63.9 65.3 64.3 65.3 Variable and fuel costs 34.6 31.3 31.9 25.3 34.4 31.8 37.1 34.6 Tax on fuels and ETS payments 9.3 0.9 5.6 3.6 9.5 1.6 12.2 1.4 Grid and sales costs 29.1 29.1 31.5 41.2 29.3 29.9 30.7 31.9
Average price of electricity (pre-tax) (*) 136.4 123.2 140.7 171.0 137.1 128.6 144.3 133.2 Average price of electricity (After-tax) (*) 159.6 146.2 164.4 198.9 160.4 151.9 168.2 157.2 (*): Average price over all consumer types, including final consumers and energy branch
It is important to note that, as explained in the assumptions part, the PRIMES model makes sure that the full costs of electricity production and distribution are recovered through electricity prices. Both marginal costs and the appropriate portion of fixed capital and operation costs are allocated to the various sectors according to the Ramsey Boiteux methodology taking into account price elasticities in the allocation of fixed costs. This procedure is necessary to ensure a sustainable modelling solution because in internally consistent scenarios electricity sector investments need to be financed by the revenues from selling electricity. However, power exchanges in wholesale markets work on the basis of marginal costs for determining spot prices with suppliers having lower marginal costs that the equilibrium price being able to cover (parts of) fixed costs. In a situation with a very high contribution of capital intensive low carbon technologies with marginal costs close to zero, such as RES, all suppliers succeeding to place bids might be bidders with such RES power plants and competition at power exchanges would drive this electricity price down close to zero. Obviously, close to zero prices over very long time segments every year would not be a sustainable solution in such a scenario, as the necessary capital expenditure and investment under such market structure could not be financed from selling revenues and such a scenario would not materialise. While PRIMES, presenting functioning scenarios, presents economically sustainable electricity prices, this issue appears to be an institutional challenge for the transition to a low carbon electricity system, especially for one that is nearly entirely based on RES.
9 Average electricity prices in this table relate to a somewhat different customer base compared with
electricity prices shown in Part A by including also energy branch customers in addition to those in final demand sectors; this explains the slight differences in average prices (e.g. for 2005 between 109.3 €/MWh when including the energy branch and 110.1 €/MWh when excluding it).

31
2.4 Other sectors
Heating and cooling: distributed heat/steam and RES Demand for distributed heat in the decarbonisation scenarios rises compared to current level but is 2%-10% lower by 2030 as compared to the Reference scenario, with the greatest decline occurring in the high RES scenario. The decrease is more pronounced towards 2050 with 46% decrease as compared to Reference scenario in the High RES scenario; 26% decrease in the Energy Efficiency scenario and at least -20% decrease in other decarbonisation scenarios. The High RES scenario shows lowest distributed heat demand after 2025 due to the highest penetration of RES in power generation which leads to decrease of CHP10 and due to the shift towards electricity use for heating reducing especially district heating from fossil fuels. When comparing results for distributed heat between Reference and decarbonisation scenarios, it is important to note that final energy demand in the decarbonisation scenarios is 34% - 40% lower in 2050 than under reference developments (around 10% lower in 2030). The biggest decrease as compared to the Reference scenario in 2050 occurs in the residential sector (-63% in High RES scenario and -32-42% in all other decarbonisation scenarios) reflecting stringent energy efficiency policies in buildings. Demand stays at current levels of around 240 TWh until 2015 and then gradually declines to 69 TWh in the High RES scenario and 126 TWh in the Low nuclear by 2050, showing the higher distributed heat demand among the decarbonisation cases. The decrease in the tertiary sector is important as well with -43% in the Energy Efficiency scenario and at least -31% in all other scenarios. The demand peaks in 2015 at 120 TWh and goes down to 52 TWh in Energy Efficiency scenario and around 60 TWh in other decarbonisation scenarios. Contrarily to residential and tertiary, industrial demand for heat increases massively from 160 TWh in 2005 to reach 503 TWh in High RES scenario and up to 733 TWh in Low nuclear/High CCS scenario by 2050. Industrial demand is still lower as compared to Reference scenario by at least 17% in all decarbonisation scenarios and by -43% in High RES scenario. However, industry needs steam for some processes that can hardly be substituted by other fuels. Heat consumption is also rising in the energy branch from 54 TWh in 2005 to 71-77 TWh in 2050, with the Energy Efficiency and delayed CCS scenarios at the lower end of the range and the Low Nuclear scenario at the upper one. Following the diverging trends in different sectors the shares of sectors in total distributed heat changes significantly up to 2050.
10 CHP leads to emission reductions compared to conventional systems, but is only decarbonised when fired
with biomass. The use of biomass in PRIMES is optimally allocated endogenously and might therefore not be used for CHP.

32
Table 32: Heat/steam final consumption 2050
2005 Reference scenario
Decarbonisation scenarios
Industry 161TWh 31% 880 TWh 76% 503 - 733 TWh 81- 80%
Households 240 TWh 46% 186 TWh 16% 69 - 126 TWh 11 - 13% Tertiary 116 TWh 22% 92 TWh 8% 52 - 64 TWh 8 - 7%
Final demand 517 TWh 100% 1.159 TWh 100% 627 – 923 TWh 100%
With lower final energy demand under decarbonisation, the share of distributed heat in total heating in the residential, services and agriculture sectors rises somewhat from current level of slightly over 11% in most scenarios, except for the High RES scenario. This decrease in the share of distributed heat is compensated by the increased direct use of biomass for heating, which soars from approx. 13.5% in 2010 to approx. 33% in 2050 in the High RES scenario. Table 33: Share of distributed heat in total heating for residential and tertiary
2020 2030 2050
CPI 11.6% 12.0% 12.0%Energy Efficiency 12.0% 12.8% 13.3%Div. Supply Technology 11.6% 12.4% 13.4%High RES 11.6% 11.4% 8.5%Delayed CCS 11.6% 12.4% 12.4%Low Nuclear 11.6% 12.5% 13.7%
Heat and steam generation Heat from CHP rises from 473 TWh in 2005 to 1030 TWh by 2025 in the High RES scenario and then declines to 682 TWh by 2050. In other scenarios, including Energy Efficiency, the rise continues until 2035 with the highest CHP generation in the Low nuclear scenario at 1113, exhibiting a slight decline thereafter. CHP heat production in 2050 covers a range from 682 TWh in the high RES scenario to 1019 TWh in the low nuclear case. As in the Reference scenario the growth is driven by support policies resulting from the application of the CHP directive and ETS carbon prices. CHP share in power generation is the highest in the Low nuclear scenario reaching 22% in 2030. This share in 2030 is the lowest in the High RES scenario at 19%. By 2050, CHP share decline in all scenarios to 18% in Low nuclear and to 11% in High RES scenarios reflecting higher penetration of wind and solar in power generation (no combined production of heat possible) and electrification of heating in combination with energy efficiency policies to reduce demand for heat. District heating is already declining from its 2000 levels of almost 190 TWh and this decline continues in the Reference scenario as well as in decarbonisation scenarios to 109 TWh in the Reference scenario and 29 -52 TWh in decarbonisation scenarios. The development of district heating is due to its benefits in reducing emissions in the short and medium term but in the

33
long run, similarly to CHP plants, if district heating boilers do not use biomass, they emit GHG. RES in heating and cooling The modelling of energy demand formation by sector includes heating and cooling requirements as well as a detailed coverage of various ways of satisfying these needs including distributed heating and cooling from co-generation and district heating. As can be seen from table 34, there is very significant progress in all decarbonisation cases regarding the share of RES in heating and cooling. The RES share in heating and cooling doubles between 2005 and 2020 in all scenarios, reaching at least 44% by 2050 under decarbonisation. The highest share of well over 50% in 2050 is achieved in the High RES scenario. Table 34: Percentage share of RES in gross final consumption of heating and cooling
% share 2020 2030 2050
CPI 20.9 22.7 23.8
Energy Efficiency 21.0 23.3 44.9
Div. Supply Technology 20.9 23.8 44.0
High RES 20.9 26.8 53.5
Delayed CCS 20.9 24.2 44.9
Low Nuclear 20.8 24.3 44.6 Transport
In the decarbonisation scenarios, transport energy demand is projected to decline by close to 40% below Reference in 2050 due to active policies for tightening CO2 standards (essentially impacting on fuel efficiency), taxation, internal market and infrastructure measures11. The highest energy savings, in order of 155 Mtoe, are achieved in the Energy Efficiency scenario but all decarbonisation scenarios deliver savings in the same order of magnitude (around 150 Mtoe). Over 60% of these energy savings originate from passengers transport.
Energy intensity in passenger transport improves by slightly over 60% between 2005 and 2050 in the decarbonisation scenarios, mainly due to the enforcement of such efficiency standards. For freight transport, the efficiency standards together with measures encouraging a shift in modal choices lead to around 40% decrease in the energy intensity.
The EU transport system would remain extremely dependent on the use of fossil fuels in the Reference scenario. Oil products would still represent 88% of the EU transport sector final demand in 2030 and 2050 in the Reference scenario. Consumption of oil would decrease by 11% by 2050, relative to the Reference scenario, in the Current Policy Initiatives scenario mainly driven by the revision of the Energy Taxation Directive.
In the decarbonisation scenarios, final consumption of oil by transport is expected to decrease by almost 70% in 2050, relative to the Reference scenario; the oil share in final demand would amount to around 45%. This decline is compensated to a certain extent by the rise in the electricity demand by road and rail transport and the increased demand for biofuels, especially in aviation, inland navigation and long distance road freight, where electrification
11 The decarbonisation scenarios reflect the transport policy measures included in the White Paper
"Roadmap to a Single Transport Area – Towards a competitive and resource efficient transport system" (COM (2011) 144) with highest impact on energy demand in transport.

34
is not or less an option. Biofuels would represent slightly below 40% of energy consumption in aviation and inland navigation and 41% in long distance road freight by 2050. The role of biofuels in energy demand by passenger cars and light duty vehicles would be more limited, ranging between 13% and 15%. Electricity would provide around 65% of energy demand by passenger cars and light duty vehicles in all decarbonisation scenarios. Electro-mobility would need to be supported by the upgrade of Europe’s networks towards a European super grid and decarbonisation of electricity sector.
As a result of the higher demand for electricity and sustainable biofuels, the share of renewables in transport would increase by 2050, ranging between 62% and 73%. This difference between the decarbonisation scenarios can be explained by the different power generation mix, despite similar shares of biofuels and electricity demand in energy consumption by transport mean. Therefore, the highest share of renewables in transport is achieved in the High RES scenario.
2.5 Security of supply Import dependency in 2030 does not change substantially in decarbonisation scenarios as compared to Reference scenario and Current Policy Initiatives scenario due to decline in both gross inland consumption and imports. There is however a substantial decrease in 2050, driven by increased use of domestic resources, mainly renewables. Import dependency is only 35% in High RES scenario (compared to 58% in the Reference scenario and Current Policy Initiatives scenario) and 39-40% in all other decarbonisation scenarios besides Low nuclear scenario (45%) where it is higher due to significant use of fossil fuels with CCS. Decarbonisation will significantly reduce fossil fuel security risks. Table 35: Import dependency % 2009 2030 20501.Reference 56.4 57.61 bis Current Policy Initiatives 57.5 58.02. Energy efficiency 56.1 39.73. Diversified supply technologies 55.2 39.74. High RES 55.3 35.15. Delayed CCS 54.9 38.86. Low nuclear
53.9
57.5 45.1 Large scale electrification combined with more decentralised power generation from variable sources brings other challenges to high quality energy service at any time. An adequate stability of the grid is a precondition for the consistent modelling of all scenarios; that is why differences in indicators such as reserve margin are rather small. Utilisation rates of electric capacities decrease from 49% in 2005 to 36% in 2050 in the Reference scenario and to a range of 25% (High RES) to 33% (Diversified supply technologies scenario) in decarbonisation scenarios. This reflects higher requirements for reserve power and balancing services in order to keep supply of electricity reliable and secure in all scenarios. All scenarios see a high increase in the share of variable RES in the electricity supply; this naturally leads to higher balancing requirements in the system. In the long term the balancing is met to the greatest extent by increased pumped storage (to the extent there is still increased potential available), the development of flexible gas-based units, higher import-exports and in

35
the case of very high RES penetration with hydrogen based balancing. Thermal power plants, mainly gas fired ones, remain available as reserve power and provide ancillary services. The reduction in utilisation rates of thermal power plants is driven by economic considerations, not by predetermined exogenous inputs. Utilisation rates for steam stay stable in the Reference scenario at around 43% but decrease to a range of 26% (High RES) and 36% (Diversified supply technologies scenario) in decarbonisation scenarios. Energy savings and electrification in heating which takes place in the decarbonisation scenarios limits the scope for further expansion of distributed heat/steam and CHP, except in cases of production with carbon free (or very low carbon content) resources (e.g. biomass, gas mixed with hydrogen). Import-export flows of electricity are also driven by economic considerations in the internal market, for which simulations were carried out separately for every scenario. This allows for trade between countries and therefore for optimal use of the interconnections and generation capacities across countries, taking into consideration the limits of the interconnector capacities, which have been adapted according to the challenges posed by the different scenarios. . The simulation thus allows for a better cost optimisation of the power generation system across the EU Member States in the context of stable grid operations at European level at any time. It emerges clearly from table 36 that decarbonisation would involve greater electricity trade among Member States, which is most pronounced in the case that decarbonisation focuses overwhelmingly on RES. Table 36: Grid stability related indicators
Power Reserve Margin (%) Volume of electricity trade (TWh) Ratio of dispatchable nominal capacities with
RES contributing with (small) capacity credits divided by total peak demand (EU net
imports not included) Sum of all export and import flows of electricity as simulated by
the model (lower than in reality)
2020 2030 2050 2020 2030 2050Reference 24,1 16,0 17,7 Reference 212,1 217,6 222,3Scenario 1bis 26,8 19,1 22,0 Scenario 1bis 255,8 307,5 322,8Scenario 2 29,1 24,6 27,8 Scenario 2 303,1 450,8 618,9Scenario 3 25,7 21,2 23,8 Scenario 3 326,6 476,1 623,6Scenario 4 25,6 21,7 32,2 Scenario 4 304,4 602,8 1040,9Scenario 5 25,7 21,7 25,9 Scenario 5 322,8 489,0 648,6Scenario 6 25,1 20,4 26,3 Scenario 6 317,8 482,5 599,1
Contribution of electricity storage (%) Volume of electricity trade as % of gross final electricity demand Extraction of electricity from storage systems
as percentage of gross final demand of electricity
Sum of all export and import flows of electricity as simulated by the model (lower than in reality) as percentage of gross final
electricity demand 2020 2030 2050 2020 2030 2050
Reference 1,2 1,1 1,3 Reference 6,0 5,7 4,9Scenario 1bis 1,1 1,1 1,1 Scenario 1bis 7,4 8,6 7,4Scenario 2 1,1 1,3 1,0 Scenario 2 9,0 13,7 15,4Scenario 3 1,1 1,2 1,0 Scenario 3 9,4 13,2 13,6

36
Scenario 4 1,1 1,2 6,5 Scenario 4 8,8 17,0 24,3Scenario 5 1,1 1,2 1,0 Scenario 5 9,3 13,6 14,3Scenario 6 1,1 1,2 1,1 Scenario 6 9,1 13,7 13,4 Share of decentralised power generation (%) Investment in electricity grids (bn EUR'08)
Share of generation by small scale power plants which are connected to low voltage
and medium voltage grid over total net power generation
Investment expenditure on electricity networks over the indicated time period
2020 2030 2050 2006-2020 2021-2030 2031-2050Reference 6,3 9,1 10,6 Reference 389,9 308,0 649,0Scenario 1bis 6,5 10,0 13,9 Scenario 1bis 387,3 291,1 773,6Scenario 2 7,1 13,1 21,8 Scenario 2 405,4 352,2 860,5Scenario 3 7,2 13,0 20,9 Scenario 3 436,8 416,1 958,9Scenario 4 7,2 17,3 31,3 Scenario 4 434,4 535,5 1323,5Scenario 5 7,2 13,1 21,4 Scenario 5 436,2 420,4 960,9Scenario 6 7,1 14,0 24,3 Scenario 6 438,9 424,6 1029,0
2.6 Policy related indicators
Emissions and ETS prices All decarbonisation scenarios achieve 80% GHG reduction and close to 85% energy related CO2 reductions (83.4-84.4%) in 2050 compared to 1990 as well as equal cumulative emissions over the projection period. In 2030, energy-related CO2 emissions are between 38-41% lower, and total GHG emissions reductions are lower by 40-42%. In 2040, energy related CO2 emissions are 63-66% below their 1990 level, while total GHG emission fall by 61-63%. Power generation would be almost completely decarbonised with CO2 emissions in 2050 plummeting 96-99% compared with 1990. CO2 emission reductions by 2050 are particularly high (minus 86-88%) also in the services/agriculture sector as well as in households (minus 85-87%). Energy related CO2 emissions in industry fall 77-79% below their 1990 level. Transport CO2 emission are 60-62% lower in 2050 compared with 1990.
The ETS price rises moderately from current level until 2030 and significantly in the last two decades providing support to all low carbon technologies and energy efficiency. Concrete policy measures such as those pushing energy efficiency and/or those enabling penetration of renewables depress demand for ETS allowances which subsequently lead to lower carbon prices. Carbon prices are the lowest in the Energy Efficiency scenario where energy demand is the lowest followed by High RES scenario (second lowest in 2030 and 2040) and the Diversified supply technology scenario (second lowest in 2050). Delay in penetration of technologies (CCS) or unavailability of one decarbonisation option (nuclear) put an upwards pressure on demand for allowances and ETS prices.

37
Table 37: ETS prices in €'08/t CO2 2020 2030 2040 2050 Reference scenario 18 40 52 50
Current Policy Initiatives 15 32 49 51
Energy Efficiency 15 25 87 234
Diversifies supply technologies 25 52 95 265
High RES 25 35 92 285
Delayed CCS 25 55 190 270
Low nuclear 20 63 100 310
The same carbon value as in the ETS applies also to non-ETS sectors after 2020 assuring cost-efficient emissions abatement in the whole economy.
CCS storage needs Making use of the CCS option will require considerable storage capacities for CO2 over time. The Reference scenario developments, including a more optimistic picture on CCS demonstration and availability of storage sites, would require storage capacity for the cumulative CO2 emissions captured up to 2050 of 8 billion tonnes of CO2.
In the CPI scenario, CCS penetration is more moderate leading to storage requirements of 3 bn t CO2 up to 2050. The lowest storage needs come about under high RES scenario, in which case the additional storage requirements over CPI amount to 0.5 bn t CO2. The highest storage needs comes in the Low nuclear scenario leading to considerable CCS penetration, which requires almost 13 bn t CO2 storage capacity up to 2050. Also the Diversified Supply Technology scenario would require considerable storage capacity.
Table 38: CCS storage needs for power generation and industrial processes up to 2050 (in bn t CO2)
power generation process related CO2 total CO2
Reference 7,95 0,00 7,95
CPI 3,00 0,00 3,00
Energy Efficiency 4,08 1,52 5,59
Div. Supply Techn. 6,80 2,18 8,98
RES 1,77 1,72 3,50
delayed CCS 4,06 0,62 4,68
low nuclear 10,45 2,35 12,80

38
RES targets and biomass
The Reference scenario assumes that the RES target is reached in 2020. The RES share (as % of gross final energy consumption according to the definition of the RES directive) is slightly higher in all decarbonisation scenario in 2020 (21%), rises to at least 28% in 2030 and 55% in 2050. In the High RES scenario this share is at 31% in 2030 and 75% in 2050.
The share of renewables in power generation is even higher and stands at 86% in 2050 in the High RES scenario. The share in consumption is even higher, since with much more variable supply and demand some electricity produced needs to be stored and losses linked to such storage processes lead to lower consumption compared to production, i.e. reducing significantly the denominator of such a share. When calculating the RES-E share in line with the calculation of the overall RES share in gross final energy consumption, i.e. excluding energy losses linked to pump storage and hydrogen storage of electricity, the RES share in electricity consumption amounts to 97% in 2050 in the High RES case.
The share of renewables in transport (target of 10% for 2020 in the RES directive) is 1 percentage point higher in all decarbonisation scenarios in 2020; it rises to 19%-20% in 2030 and to 62%-73% in 2050. The share of renewables in transport in the High RES scenario is 20% in 2030 and even 73% in 2050. The increase between 2030 and 2050 as well as the difference to the Reference scenario and Current Policy Initiatives scenario of almost 50 percentage points in 2050 for the decarbonisation scenarios is remarkable and shows the importance of RES based decarbonisation of transport, either directly via biofuels or indirectly via RES based electricity. Decarbonisation efforts and RES share in transport are rather moderate till 2030 but rise significantly from 2030 to 2050.
The large share of RES in the scenarios is driven by a strong support for RES in the form of an implicit facilitation of RES in the scenarios. These lead to shifts in RES potential curves in the decarbonisation scenarios, allowing for more RES exploitation at a given deployment cost level, compared to the Reference scenario. This includes facilitation policies such as:
- For biomass: agricultural policies stimulating the production of energy crops, increased residue collection, and/or increased yield of crops;
- For wind: regarding on-shore it comprises the availability of more land area and a facilitation of the licensing requirements; for off-shore it also represents a facilitation of licensing and the development of technologies that allow placing off-shore power plants in deeper areas or further offshore; and
- For small scale solar PV and wind: development of smart grids and other facilitation policies.
The total use of biomass in the various scenarios is shown in table 39. Whereas the Reference and CPI scenarios have about 100 Mtoe more biomass use in 2050 compared with today's level, there is around 70-80 Mtoe additional biomass use in most decarbonisation scenarios in 2050, except for the high RES case, in which the additional biomass use amounts to around 120 Mtoe.

39
Table 39: Use of biomass and biofuels Reference scenario
Current policy Initiatives ktoe 2005
2030 2050 2030 2050 Total domestic biomass 86285 179649 185863 175987 188914
of which biofuels 3129 35255 36957 34295 38912 Biofuels in bunkers 0 0 0 133 2325 Total use of biomass 86285 179649 185863 176120 191239
Energy
efficiency
Diversified supply
technologies 2030 2050 2030 2050 Total domestic biomass 162716 241476 172145 253209
of which biofuels 25033 68393 26174 71047 Biofuels in bunkers 553 18062 553 17995 Total use of biomass 163268 259538 172698 271204 High RES Delayed CCS 2030 2050 2030 2050 Total domestic biomass 188675 301805 172953 252893
of which biofuels 26296 72453 26112 69370 Biofuels in bunkers 553 18060 552 17523 Total use of biomass 189227 319865 173505 270415 Low nuclear 2030 2050 Total domestic biomass 175360 257226
of which biofuels 26135 70794 Biofuels in bunkers 553 17981 Total use of biomass 175913 275206
Biofuel consumption rises by a factor of more than ten between 2005 and 2050 under current policies to reach 37-39 Mtoe in 2050. Decarbonisation of transport requires substantially greater biofuels use, which increases to 68-72 Mtoe in 2050, with the highest levels being reached in the High RES and Diversified Supply Technology scenarios.
2.7 Overall system costs, competitiveness and other socio-economic impacts This section deals with the costs for providing the energy services to the EU economy and society. One key element of such costs is the external fuel bill, i.e. the amount of money that they EU economy has to pay to the outside world for procuring all the net imports of oil, gas and solid fuels from the rest of the world. The external fuel bill arising from the net imports of fossil fuels decreases below 2005 levels in all decarbonisation scenarios by 2050. This result stems from the pursuit of this major decarbonisation as a part of a global effort with industrial countries as a group reducing GHG emissions by 80%. In such a global setting, fossil fuel import prices will be much lower (see part on assumptions) and actual imports of fossil fuel will be much lower, too. These both effects reduce the expenditure for each of the fossil fuels and thereby the total external fuel bill of the EU. The decrease of the fuel bill in the decarbonisation scenarios is smallest in the

40
Low Nuclear scenario at 31% and highest in the high RES scenario with 43% with RES replacing most fossil fuels.
Compared with current level, all decarbonisation scenarios increase the external fuel bill in 2030, but to much lower levels than the Reference and Current Policy Initiative scenarios. While the external fuel bill would double between 2005 and 2030 under Reference and Current Policy Initiatives developments, this increase would be limited to around 40% under these decarbonisation policies. Table 40: External fossil fuel bill (in bn € (08)) Reference CPI
2005 2030 2050 2030 2050
Bn. EUR'08 269.1 549.2 752.2 531.9 704.2 Diff. to 2005 104% 180% 98% 162% Energy Efficiency Diversified supply technologies 2030 2050 2030 2050 Bn. EUR'08 364.5 165.7 379.0 180.1 Diff. to 2005 35% -38% 41% -33% High RES Delayed CCS 2030 2050 2030 2050 Bn. EUR'08 374.8 154.2 377.0 180.4 Diff. to 2005 39% -43% 40% -33% Low nuclear 2030 2050 Bn. EUR'08 382.0 186.4 Diff. to 2005 42% -31%
Savings in the external fuel bill are most striking in 2050. Compared with Current Policy Initiatives, the EU economy could save in 2050 between 518 and 550 bn € (08) by going this strong decarbonisation route under global climate action. The largest energy bill savings come about in the high RES scenario. Such fuel bill savings have strong impacts on overall energy system costs.
Total costs for the entire energy system include capital costs (for energy installations such as power plants and energy infrastructure, energy using equipment, appliances and vehicles), fuel and electricity costs and direct efficiency investment costs (house insulation, control systems, energy management, etc), the latter being also expenditures of capital nature. Capital costs are expressed in annuity payments. Total costs exclude disutility and auction payments. Auction payments are expenditures for individual actors/sectors that are not costs for the economy as a whole, since the auctioning revenues are recycled back to the economy. Disutility costs are a concept that captures losses in utility from adaptations of individuals to policy impulses or other influences through changing behaviour and energy consumption patterns that might bring them on a lower level in their utility function. Such disutility costs correspond to a monetary estimation (income compensating variation) of lower utility from useful energy services (lighting, heating, mobility, etc.) resulting from a more rational use behaviour by consumers who for example adjusts thermostats, switch lighting off or travel less in order to adapt to higher costs of useful energy services. Such costs monetisation captures relevant issues regarding new consumption patterns especially for a short to medium time horizon, but becomes more challenging and uncertain in the long term, given that monetisation requires the comparison with a counterfactual development assuming unchanged tastes, habits and values over up to 40 years.12
12 The PRIMES model having a micro-economic foundation, deals with utility maximisation and can
calculate such perceived utility losses via the concept of compensating variations. However, this

41
Table 41: Energy system costs Average annual energy system costs 2011-2050
Bn. EUR'08 Ref CPI High Energy effic.
Div. supply techn. High RES Delayed
CCS Low nuclear
Capital cost 955 995 1115 1100 1089 1094 1104
Energy purchases 1622 1611 1220 1295 1355 1297 1311
Direct efficiency inv. costs * 28 36 295 160 164 161 161
Total system cost excl. all auction payments and disutility ** 2582 2619 2615 2535 2590 2525 2552
Absolute Difference to Reference
Bn. EUR'08 High Energy effic.
Div. supply techn. High RES Delayed
CCS Low nuclear
∆ Capital cost 160 145 134 139 149
∆ Energy purchases -402 -327 -267 -325 -312
∆ Direct efficiency inv. costs * 267 132 135 133 133
∆ Total system cost excl. all auction payments and disutility ** 33 -47 8 -57 -29
Absolute Difference to CPI
Bn. EUR'08 High Energy effic.
Div. supply techn. High RES Delayed
CCS Low nuclear
∆ Capital cost 120 105 94 99 109
∆ Energy purchases -391 -316 -256 -314 -300
∆ Direct efficiency inv. costs * 260 125 128 126 125
∆ Total system cost excl. all auction payments and disutility ** -4 -84 -29 -94 -67
Percentage change to Reference
% High Energy effic.
Div. supply techn. High RES Delayed
CCS Low nuclear
Capital cost 16,8 15,2 14,0 14,6 15,6
Energy purchases -24,8 -20,2 -16,5 -20,0 -19,2
Direct efficiency inv. costs * 937,3 462,4 475,0 466,9 465,5 Total system cost excl. all auction payments and disutility **
1,3 -1,8 0,3 -2,2 -1,1
Percentage change to CPI
% High Energy effic.
Div. supply techn. High RES Delayed
CCS Low nuclear
concept has to assume that preferences and values remain the same, even over 40 years, and has to compare utility with a hypothetical state of no policy or no change in framework conditions. Examples of such decreases are lowering thermostat in space heating, reducing cooling services in offices, switching light off, staying home instead of travelling, using a bicycle instead of a car, etc.

42
Capital cost 12,0 10,5 9,5 10,0 10,9
Energy purchases -24,3 -19,6 -15,9 -19,5 -18,6
Direct efficiency inv. costs * 729,5 349,8 359,9 353,4 352,2 Total system cost excl. all auction payments and disutility **
-0,1 -3,2 -1,1 -3,6 -2,5
* Include costs for insulation, double/triple glazing and for efficiency enhancing changes in production
processes not accounted for under energy capital and fuel/electricity purchase costs; ** These macroeconomic costs do not include ETS auctioning payments that represent a cost from the
individual economic actors point of view, but do not present a cost to society given that auctioning revenues are recycled back to the economy (societal perspective); auctioning payments are partly included in energy purchase costs (e.g. in electricity prices) and partly paid directly by actors subject to ETS; total costs in table 41 differ from the sum of the items shown; table 42 on additional information below gives more detail
Table 42: Additional information on auctioning payments, disutility and total costs from the individual economic actor's point of view (bn € (08) per year on average in 2011-2050)
Bn. EUR'08 Ref CPI High
Energy effic.
Div. supply techn. High RES Delayed
CCS Low
nuclear
Auctioning payments 30 28 20 27 24 36 30
Total energy system cost (a) 2612 2647 2635 2562 2614 2561 2583
Disutility costs (b) 92 112 153 174 181 211 190
Total energy system costs including auction payments and disutility (c) 2704 2759 2788 2735 2795 2773 2772
(a) From the individual economic actors' point of view, including direct and indirect (via purchase of e.g.
electricity) auctioning costs, but excluding disutility costs; (b) Disutility costs are costs stemming from behavioural change, such as changing lighting quality, lowering
thermostat temperature, replacing fuel consuming mobility with other types of mobility (e.g. bikes) or telecommunication that are not accounted for by expenditure flows in the model, but change the level of utility of consumers; such changes are linked to carbon values in non-ETS (which do not represent a cost in cash terms), but are a proxy for policy measures bringing about such behavioural change; direct costs of such change in terms of investment and fuel bills are accounted for in the normal modelling procedure; given the long time horizon and possibly changing preference, the estimation of disutility costs is surrounded with uncertainty.
(c) From the individual economic actors' point of view, including direct and indirect (via purchase of e.g. electricity) auctioning costs as well as disutility costs;
NB: The lower system cost (without auctioning revenue and disutility) in the Delayed CCS scenario compared
with the Diversified supply technologies scenario (that is unrestricted regarding technology) is not present when auctioning revenues and disutility costs are included, i.e. the point of view of the economic actors is taken (numbers denoted with (c) above). In this case, the Diversified Supply Technology scenario has the lowest costs. The modelling approach simulates the system from the point of view of economic actors, who perceive auctioning payments and disutility as cost to them that they want to minimise. Disutility costs are however surrounded with uncertainty given the long time horizon and their dependence on preferences and values. Moreover they represent a monetary equivalent in terms of imputed income compensation of changes in utility and are not associated with payments represented in the process of modelling (e.g. energy purchases, investment sums). Given the uncertain and somewhat controversial nature of disutility costs for a 40 year time horizon this long term assessment of economic impacts reports on costs without disutility. Furthermore, taking a macro-economic perspective auctioning revenues can be seen as transfers as they are supposed to be recycled, justifying their exclusion from the macro-economic cost evaluation.
The average additional energy system cost per year from 2011 to 2050 compared with the Reference and Current Policy Initiatives scenario are rather small due to the pursuit of this

43
major decarbonisation as a part of a global effort. Given that the Current Policy Initiatives scenario is the most up to date current trend scenario and that all decarbonisation scenarios base themselves on this updated baseline, the following comparison starts from the CPI scenario (1bis). The Delayed CCS scenarios and the Diversified Supply Technologies have the lowest level of average annual energy system costs, representing even a cost saving compared with CPI (of 94 bn €(08) and 84 bn €(08), respectively) given the large fossil fuel import cost savings discussed above. These are scenarios, in which there is a rather high nuclear penetration in addition to substantial RES penetration and strong energy efficiency progress. Given these fossil fuel import bill effects, also the Low Nuclear Scenario would produce average annual fuel bill savings of 67 bn € (08) when compared with CPI. The High RES scenario gives rise to a annual energy system cost saving of 29 bn € (08) when compared with CPI, while the annual cost savings for the Energy Efficiency scenario amount to 4 bn €(08). The cost savings in the Energy Efficiency scenario are smaller (4 bn €) given that very high energy efficiency progress requires strong action on the building stock entailing major expenditure for accelerated building renovation, in addition to costs for other energy efficient equipment including the costly transition to electric and plug in hybrid vehicles. High renovation rates are one of the salient features of the energy efficiency scenario. Electro-mobility also provides for greater energy efficiency in the system. However, this higher cost does not disqualify energy efficiency policies as such, as strong energy efficiency policies leading to substantial improvements and energy savings, are present in all scenarios. The Energy efficiency scenario just shows that there are certain limits from where on other decarbonisation routes are less costly than further reductions of energy consumption. All scenarios show higher annual costs in the last two decades 2031-2050 reflecting mainly increased investments in transport equipment as the major transition to electric and plug in hybrids vehicles is projected after 2030. In High RES scenario costs are also linked to significant expansion of RES based power generation capacity. Cumulative auction payments are lowest in Energy efficiency scenario due to the reduced energy consumption, decreasing emissions and therefore the necessity to buy ETS permits. The scenario with the highest auction revenues is Delayed CCS where the delay in the use of CCS leads to high carbon prices in the long-term to ensure the achievement of the decarbonisation target via the uptake of this technology in these later years. The PRIMES model works with perfect foresight in the supply side module, therefore the high carbon prices are expected, influencing choices already in previous years. The auction revenues represent an equivalent of around 1% of total cumulative energy system costs. When relating the cumulative costs to the GDP (which remains constant in these scenarios) the ratio of costs to GDP is similar across the scenarios (around 14.1% to 14.6%) exhibiting costs at the low end of the range in case of diversified supply technologies and delayed CCS. Table 43: Energy system costs (without auction payments and disutility) related to GDP
Cumulative costs as percentage of
GDP (*) Reference 14.37% CPI 14.58%

44
Energy Efficiency 14.56% Diversified Supply Technology 14.11% High RES 14.42% Delayed CCS 14.06% Low Nuclear 14.21%
Change in cost structure: fixed costs versus variable costs The composition of energy costs changes over time and varies across scenarios. The share of fixed cost (capital costs including for e.g. insulation) rises in all scenarios. Following larger capital expenditure for e.g. power generation, grids, energy efficiency investment over time energy, the progress in energy efficiency, greater use of technologies with low operating costs (most RES) and lower world fossil fuel prices in the decarbonisation scenarios bring lower fuel and emission allowances costs. Consequently, the share of capital costs increases over time, especially in the Energy Efficiency and High RES scenarios, which have the highest fixed cost shares (see table 44). Table 44: Share of fixed costs* in total energy costs** (averages over the time periods indicated)
2011-2030 2031-2050 2011-2050
Reference 44% 53% 49%
Current Policy Initiatives 45% 54% 50%
Energy Efficiency 52% 74% 65%
Diversified Supply Technologies 50% 70% 62%
High RES 50% 71% 63%
Delayed CCS 50% 70% 62%
Low Nuclear 50% 70% 62%
* capital costs for equipment, appliances, and energy efficiency investment (e.g. insulation), more efficient and cleaner vehicles ** total energy cost from the economic actors' point of view: including auctioning costs
Energy related costs for companies Energy related costs in relation to sectoral value added rise from 5.8% in 2005 to 7.8% in 2030 in the Reference/CPI cases and to around 7.5% in the decarbonisation scenarios. In 2050, under current policies, this indicator declines to 7.5% and even more so in the decarbonisation scenarios falling to under 7%. Long term energy costs relative to value added of companies under decarbonisation are lower in the decarbonisation cases than under current policies thanks to substantial global decarbonisation efforts. Whereas relative costs for stationary use (heating, process energy, appliances, lighting, etc) in the decarbonisation scenarios remain at the current level by 2030, there is a strong increase in costs related to value added for transport services. After 2030, both stationary and transport energy costs decline somewhat when related to value added. Overall, energy costs relative to value added in 2050 are only somewhat higher than they were in 2005 under decarbonisation, whereas there would be a much more pronounced increase of such costs in the absence of such decarbonisation under significant global climate action.

45
Table 15: Energy related costs of companies Reference Scenario 1 bis % 2005
2030 2050 2030 2050Ratio of energy related costs to value added 5.8 7.8 7.5 7.8 7.5
of which stationary uses 4.3 4.8 4.5 4.6 4.3of which transportation uses 1.5 3.0 2.9 3.1 3.1
Scenario 2 Scenario 3 2030 2050 2030 2050Ratio of energy related costs to value added 7.6 6.6 7.4 6.4
of which stationary uses 4.4 3.9 4.2 3.8of which transportation uses 3.2 2.7 3.1 2.6
Scenario 4 Scenario 5 2030 2050 2030 2050Ratio of energy related costs to value added 7.3 6.9 7.4 6.3
of which stationary uses 4.3 4.1 4.2 3.8of which transportation uses 3.0 2.7 3.2 2.5
Scenario 6 2030 2050 Ratio of energy related costs to value added 7.5 6.5
of which stationary uses 4.3 3.8 of which transportation uses 3.2 2.7
Energy intensive industries face particularly high energy costs for their highly energy consuming production processes. Five industrial sectors (iron and steel, non-ferrous metals, non metallic mineral products, chemicals, paper and pulp industries) have such high energy costs and are therefore particularly concerned by potential changes from decarbonisation in the energy component of their costs. Table 46 shows for these energy intensive industries combined the ratio of energy related costs for production processes and other stationary use, on the one hand, and their value added, on the other. Table46: Ratio of energy related costs to value added for energy intensive industries
2005 2030 2050 Reference 33.7% 40.8% 40.5% CPI 39.4% 39.5% Energy Efficiency 35.6% 30.6% Diversified Supply Technologies
36.4% 32.4%
High RES 36.1% 34.8% Delayed CCS 36.5% 33.2% Low Nuclear 37.1% 33.5%

46
Energy costs of energy intensive industries relative to value added would increase under Reference and CPI developments. This development stems also from rising world fossil fuel prices under current trends. It is worth noting that under global climate action bringing with it lower energy import prices and due to substantial energy efficiency progress, the ratio of energy costs to value added in energy intensive industries would decline in all decarbonisation scenarios – most markedly in the Energy Efficiency scenario Effects of fragmented climate action: competitiveness and energy consequences of safeguards for energy intensive industries This Energy Roadmap has assumed the implementation of the European Council's decarbonisation objective that includes similar efforts by industrialised countries as a group. The analysis presented focuses on energy consequences. A more comprehensive analysis of different global paths to decarbonisation was presented in the Low Carbon Economy Roadmap 205013 exploring impacts of three global climate situations: a) business as usual; b) global climate action and c) fragmented action. Fragmented action assumes strong EU climate action that is however followed globally only by the low end of Copenhagen pledges up to 2020 and afterwards the ambition level of the pledges is assumed to stay constant. It analyses impacts on energy intensive industries (EII) both in a global macroeconomic modelling framework to address carbon leakage issues and by means of energy system modelling to address effects of fragmented action, including electricity costs for companies. Electricity costs are, in fact, higher in the fragmented action scenarios as compared to global action scenarios due to higher energy import prices. On the other hand, carbon prices are lower under fragmented action. A "fragmented" action scenario including measures against carbon leakage was not analysed in this IA report as the challenges for the energy sector arising from decarbonisation are the biggest under "global climate action" assumption, given that fragmented action with measures against carbon leakage will deliver lower GHG reductions by 2050. Decarbonisation scenarios that accommodate action against carbon leakage under fragmented action would either go for lower ambitions in terms of GHG reduction or would have measures included that imply such lower efforts for energy intensive industries and consequently for the total energy system14. With action on carbon leakage the challenge for the transition in the energy system would be smaller given lower efforts in parts of the system. Such results are however modified through countervailing effects from lower world fossil fuel prices under global action that encourage somewhat higher energy consumption and emissions. In any case, the implementation of measures will be crucial. The real difference for industrial and thereby climate policy might come from the concrete design of policy instruments that is not discussed in this Energy Roadmap Impact Assessment (e.g. special provisions on ETS for EII). From the analysis undertaken for the Low Carbon Economy Roadmap it can be concluded that under fragmented action with the EU reducing emissions much more than other regions, certain industries supplying low carbon technologies would benefit from improved competitiveness due to higher internal demand and first mover advantages. However, EII would suffer from higher costs for allowances and/or significant mitigation costs in order to avoid the need to purchase such allowances. Furthermore, under fragmented action they
13 Impact assessment report SEC(2011)288 final, section 5

47
would not benefit from the fuel and electricity price reductions stemming from a global climate deal that lowers world fossil fuel prices. This situation of fragmented action might require countervailing action to combat carbon leakage, which was investigated in the Low Carbon Economy Roadmap, notably by exploring a scenario, in which energy intensive industries (iron and steel, non-ferrous metals, chemicals, non metallic minerals, paper and pulp industries) would benefit from the same ETS prices that prevail in the reference scenario, whereas other sectors would be exposed to higher carbon costs. These provisions have only a limited impact on the CO2 emission reduction of all sectors, which instead of reaching minus 86% on 1990 under fragmented action (85% under global action) would amount to 78% with these specific provisions for EII. Clearly, the CO2 emission reduction for EII, i.e. their level of effort, would be reduced more markedly, falling from 87% reduction below 1990 under fragmented action (88% under global action) to only 51% by 2050. These measures keeping the ETS price for energy intensive industries at the reference case levels lead to significant cost savings for purchasing fuel, electricity, steam and energy using equipment. Compared with the reference case situation with no additional climate action, the average costs in 2011-2050 decrease by 6 bn € (08) annually over 40 years. Higher energy, especially electricity prices from decarbonisation action together with the still significant carbon price signal lead to significant energy savings in energy intensive industries (22.7% in 2050 from Reference). These cost savings take into account that electricity prices rise significantly under fragmented action (7% in 2050 compared with Reference) and this to a higher degree than under global action given that the cost reducing effect through lower fossil fuel input prices (global action reducing world fossil fuel demand) would not materialise. Electricity prices in 2050 would be 6 % lower on average under global climate action compared with fragmented action with specific measures for EII. Under global action, the energy saving effect of energy intensive industries is reinforced through higher carbon prices, entailing even greater energy savings. Combined with lower fossil fuel import and therefore final consumer prices, there would be additional cost savings, amounting to 21 bn € per year from 2011 to 2050 when comparing global climate action with fragmented action with less effort for EII.15 Table 47 compares the energy related results of decarbonisation scenario under fragmented action with specific carbon leakage measures for energy intensive industries with the Reference case. It includes also a comparison between global action and fragmented action with these specific measures for energy intensive industries. The energy results for this analysis are taken from the energy modelling results for the Low Carbon Economy Roadmap, which includes, in addition to the Reference scenario, the Fragmented action, effective technology and less effort for EII scenario and the Effective Technology Global Action scenario.
15 The energy modelling did not include possible changes in value added of energy intensive industries as a
reaction to climate policy measures. However, the low carbon economy roadmap includes a complementary analysis of macroeconomic and industrial competitiveness effects of a fragmented action scenario (SEC (2011)650, section 5.1.3) which provides further insights on these issues.

48
The effective technology scenarios are driven by carbon prices and assume the absence of significant obstacles for technology penetration, especially CCS and nuclear, as well as the absence of specific strong push for RES and energy efficiency. The rationale of these scenarios is similar to the Diversified Supply Technologies scenario, which includes however recent policy initiatives, especially on energy efficiency and energy taxation as well as recent changes in nuclear policies. The most relevant comparison of energy results when dealing with carbon leakage in the case of Fragmented action, effective technology and less effort for EII is therefore in relation to Reference (no additional climate action), on the one hand, and Effective Technology under global climate action, on the other. Table 47: Comparison of energy results for 2050* between fragmented action with specific measures for energy intensive industries (FAEII) and Reference as well as between global action and FAEII Less effort for EII
compared with Reference
Global action compared with less
effort for EII Final energy consumption EII Other sectors
Primary energy consumption
Gross electricity generation **
Average electricity prices
Energy related CO2 emissions
Import dependency
RES share in gross final energy demand
Cumulative investment expenditure in power generation
Average annual fuel, electricity and equipment costs
-22.7% -33.6%
-24.1%
+10.3%
+7.2%
-72.4%
-26.2 pp
+26.6 pp
+30.1%
-6 bn
-11.2% +1.6%
+2.5%
+6.6%
-5.7%
+1.2%
+1.3 pp
-0.3 pp
+1.2%
-21 bn
* For investment expenditure and costs this comparison relates to the 40 year period up to 2050 ** including new uses, such as hydrogen as a means for electricity storage and for feeding into the gas grid
thereby contributing to decarbonisation by lowering the carbon content of the gas supplied Climate action with specific measures for EII against carbon leakages leads to quite significant energy consequences in 2050 compared to reference regarding energy consumption, fuel and electricity costs, prices and emissions. Import dependency would fall strongly, whereas the RES share would rise to a large extent. Investment in power generation would also need to rise strongly while average costs would fall significantly. Energy consumption of EII would drop further significantly when undertaking decarbonisation in the context of global action, as EII would face higher carbon prices in this case (the same as other sectors). The small increase of energy consumption and emission levels (outside EII) when moving to global action stem from the markedly lower fossil fuel prices under globally reduced demand. Energy related results are either reinforced, if the policy response to climate change moved from fragmented action with specific carbon

49
leakage measures for EII to global action without such measures, or they are modified reflecting the impacts from lower fossil fuel prices. Energy related expenditures of households Affordability of energy services as regards fuel and electricity costs but also equipment (insulation, more efficient appliances, etc) is one of the essential elements of the analysis. The sector that is mostly concerned is households. All decarbonisation scenarios show significant fuel savings compared to the Reference and CPI scenarios but also higher costs for energy appliances, boilers and insulation. Energy related expenditures for heating and cooling of households as well as for lighting and appliances almost double from around 2000 EUR'08/year today to 3800 to 3900 EUR'08 in 2050 in the Reference and CPI scenarios reflecting rising fuel and electricity prices and increasing direct household investments in energy efficiency. Expenditures per household amount to some 4500 EUR'08 in most decarbonisation scenarios in 2050, with expenditure per household reaching some 4800 € (08) and almost 4900 € (08) in the Energy Efficiency and high RES scenarios respectively. It is important to note that per capita income in 2050 will also almost double from today's level, but also that households will be composed of fewer members reflecting aging and changing lifestyles. Energy costs per household exceed the Reference/CPI case level by 16-17% in 2050 in most decarbonisation scenarios. They are 25-27% higher in the Energy Efficiency and High RES scenarios, as these scenarios are particularly intensive in investment. While these costs might be affordable by an average household, vulnerable consumers might need specific support to cope with increased expenditures due to decarbonisation. Households spend money on transport services, too. Such costs concern expenses on tickets for rail, bus, metro, air and other travel as well as costs for purchasing privately owned vehicles and paying for other fuel and operational expenses. These transport costs per household would even almost triple by 2050 reaching 3900 € (08) and 4100 € (08) in the Reference and CPI case, respectively. The strong growth of such costs reflects rising oil prices as well as changes in the vehicle fleet towards more efficient cars (hybrids, plug in hybrids, electric cars) that involve higher costs16. In the decarbonisation scenarios, transport related energy costs per households are lower in 2050 than under Reference or CPI developments, markedly so (broadly around 10%) under Diversified Supply Technologies and delayed CCS, given substantial improvements in energy efficiency in transport and limited price increases with respect to reference for transport fuel. Relating the costs of households for stationary energy use (heating, appliances, etc) plus those for transport to household expenditure gives the following picture. The share of energy in household expenditure rises over time in all scenarios from 10% in 2005 to around 16% in 2030, decreasing thereafter to around 15-16% by 2050. Among the decarbonisation scenarios, the Delayed CCS and the Diversified Supply Technology scenarios have costs at the lower end of this range, whereas the High RES and Energy efficiency scenarios show 2050 costs at the upper end of the range.
16 It should be noted that costs of engines and propulsion cannot be separated from the rest of vehicle
costs and that these numbers include therefore the costs for owning the entire vehicle.

50
Table 48: Energy related expenditures of household for stationary use and transport
Reference Scenario 1 bis % 2005 2030 2050 2030 2050
Share of energy related costs in household expenditure 9.9 15.9 14.6 16.1 15.1
of which stationary uses 5.7 8.0 7.3 7.9 7.3of which transportation uses 4.2 7.9 7.3 8.2 7.8
Scenario 2 Scenario 3 2030 2050 2030 2050Share of energy related costs in household expenditure 16.5 16.1 15.9 15.4
of which stationary uses 7.9 9.1 7.5 8.4of which transportation uses 8.6 7.0 8.4 6.9
Scenario 4 Scenario 5 2030 2050 2030 2050Share of energy related costs in household expenditure 15.8 16.4 15.9 15.1
of which stationary uses 7.7 9.2 7.5 8.5of which transportation uses 8.1 7.1 8.4 6.6
Scenario 6 2030 2050 Share of energy related costs in household expenditure 16.1 15.5
of which stationary uses 7.5 8.5 of which transportation uses 8.6 7.0
Whereas companies enjoy long term energy costs relative to value added that are lower (or at most as high) as such costs under current policy initiatives, the 2050 energy costs of households relative to household expenditure generally exceed such costs without strong decarbonisation albeit only to a rather small extent, especially under Delayed CCS and Diversified Supply Technologies. Electricity prices Another important indicator on costs relates to final consumer prices especially the prices of electricity for industrial, household and services consumers as well as the average price. Electricity prices are calculated in such a way that total costs of power generation, balancing, transmission and distribution are recovered, ensuring that investments can be financed. Table 49 shows the average price for electricity in the EU27 for different sectors; the residential sector has the highest user price and industry the lowest as it is currently the case. In 2050, average electricity costs are highest in High RES scenario reaching 199 €/MWh. The lowest electricity prices are in Diversified supply and Energy efficiency scenario, with prices below the Reference and Current Policy Initiatives scenarios because of cheaper procurement of fossil fuels under global climate action. Average prices of electricity are rising compared to current levels until 2030 and continue increasing in the High RES scenario. In the Energy Efficiency and Diversified Supply Technology scenarios, electricity prices remain similar to those in the Reference/CPI scenario up to 2030 thanks to lower fossil fuel input costs with lower world market prices. With
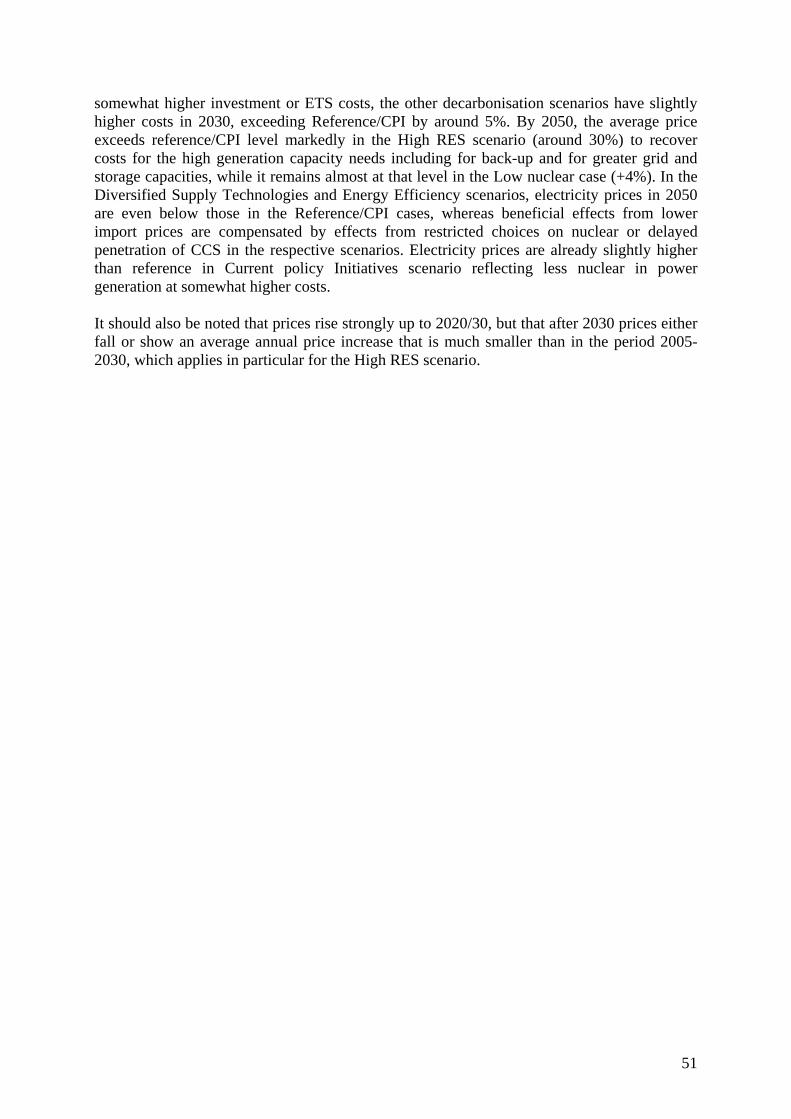
51
somewhat higher investment or ETS costs, the other decarbonisation scenarios have slightly higher costs in 2030, exceeding Reference/CPI by around 5%. By 2050, the average price exceeds reference/CPI level markedly in the High RES scenario (around 30%) to recover costs for the high generation capacity needs including for back-up and for greater grid and storage capacities, while it remains almost at that level in the Low nuclear case (+4%). In the Diversified Supply Technologies and Energy Efficiency scenarios, electricity prices in 2050 are even below those in the Reference/CPI cases, whereas beneficial effects from lower import prices are compensated by effects from restricted choices on nuclear or delayed penetration of CCS in the respective scenarios. Electricity prices are already slightly higher than reference in Current policy Initiatives scenario reflecting less nuclear in power generation at somewhat higher costs. It should also be noted that prices rise strongly up to 2020/30, but that after 2030 prices either fall or show an average annual price increase that is much smaller than in the period 2005-2030, which applies in particular for the High RES scenario.
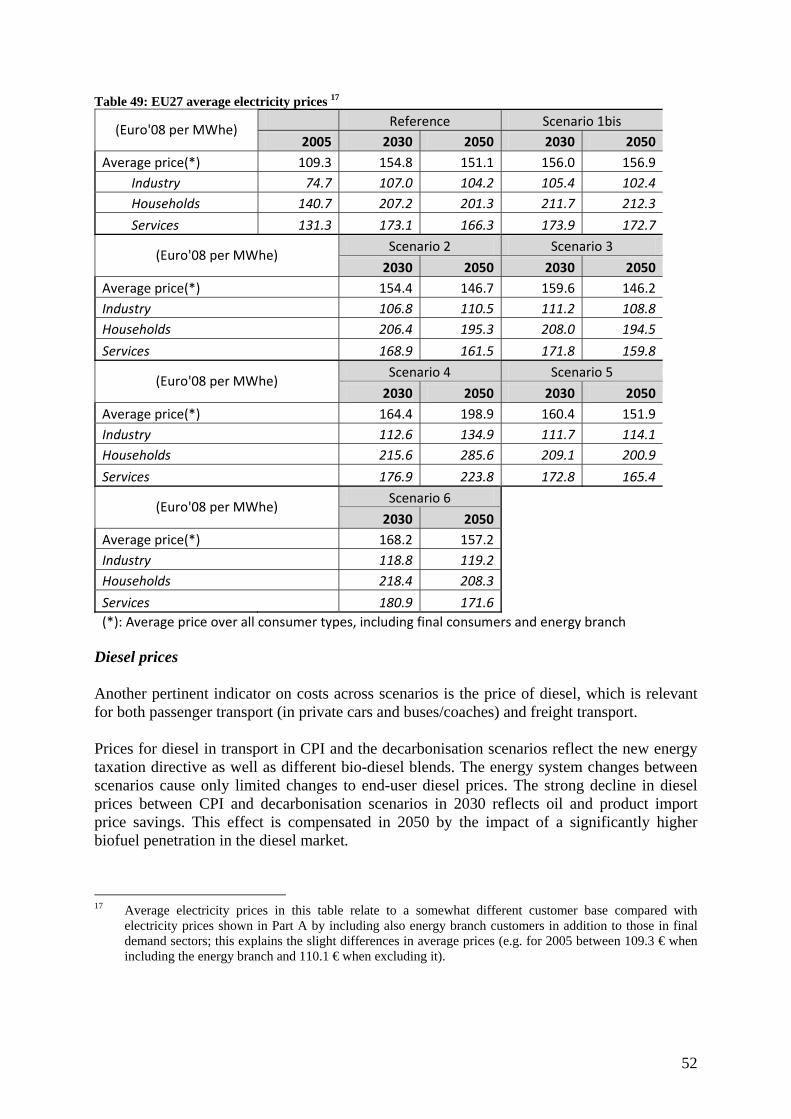
52
Table 49: EU27 average electricity prices 17 Reference Scenario 1bis
(Euro'08 per MWhe) 2005 2030 2050 2030 2050
Average price(*) 109.3 154.8 151.1 156.0 156.9Industry 74.7 107.0 104.2 105.4 102.4Households 140.7 207.2 201.3 211.7 212.3
Services 131.3 173.1 166.3 173.9 172.7
Scenario 2 Scenario 3 (Euro'08 per MWhe)
2030 2050 2030 2050Average price(*) 154.4 146.7 159.6 146.2Industry 106.8 110.5 111.2 108.8Households 206.4 195.3 208.0 194.5
Services 168.9 161.5 171.8 159.8
Scenario 4 Scenario 5 (Euro'08 per MWhe)
2030 2050 2030 2050Average price(*) 164.4 198.9 160.4 151.9Industry 112.6 134.9 111.7 114.1Households 215.6 285.6 209.1 200.9
Services 176.9 223.8 172.8 165.4
Scenario 6 (Euro'08 per MWhe)
2030 2050 Average price(*) 168.2 157.2 Industry 118.8 119.2 Households 218.4 208.3
Services 180.9 171.6 (*): Average price over all consumer types, including final consumers and energy branch
Diesel prices Another pertinent indicator on costs across scenarios is the price of diesel, which is relevant for both passenger transport (in private cars and buses/coaches) and freight transport. Prices for diesel in transport in CPI and the decarbonisation scenarios reflect the new energy taxation directive as well as different bio-diesel blends. The energy system changes between scenarios cause only limited changes to end-user diesel prices. The strong decline in diesel prices between CPI and decarbonisation scenarios in 2030 reflects oil and product import price savings. This effect is compensated in 2050 by the impact of a significantly higher biofuel penetration in the diesel market.
17 Average electricity prices in this table relate to a somewhat different customer base compared with
electricity prices shown in Part A by including also energy branch customers in addition to those in final demand sectors; this explains the slight differences in average prices (e.g. for 2005 between 109.3 € when including the energy branch and 110.1 € when excluding it).

53
Table 50: Average EU27 diesel (including blended biodiesel) end –user prices for private transport18 2005 2030 2050Reference (EUR(08)/toe) 1271 1877 2250
CPI 0% 20% 16%
Energy Efficiency 0% 3% 17%
Diversified Supply Technology 0% 3% 19%
High RES 0% 3% 21%
Delayed CCS 0% 2% 18%
Low Nuclear % d
iff. t
o Re
fere
nce
0% 3% 22%
2.8 Conclusions The Commission services conducted a model-based analysis of decarbonisation scenarios exploring energy consequences of the European Council's objective to reach 80% GHG reductions by 2050 (as compared to 1990), provided that industrialised countries as a group undertake similar efforts. These scenarios explore also the energy security and competitiveness dimension of such energy developments. Businesses as usual projections show only half the GHG emission reductions needed; increased import dependency, in particular for gas; and rising electricity prices and energy costs. Several decarbonisation scenarios highlighting the implications of pursuing each of the four main decarbonisation routes for the energy sector – energy efficiency, renewables, nuclear and CCS - were examined by modelling a high and low end for each of them. The model relies on a series of input assumptions and internal mechanisms to provide the outputs. The most relevant assumptions and mechanisms of the model
All scenarios were conducted under the hypothesis that the whole world is acting on climate change which leads to lower demand for fossil fuel prices and subsequently lower prices.
The model assumes perfect foresight regarding, policy thrust, energy prices and technology developments which assures a very low level of uncertainty for investors, enabling them to make particular cost-effective investment choices without stranded investments. There is also no problem with uncertainty on whether all the infrastructure and other interrelated investment (e.g. grid connections) needed to make a particular investment work will be in place in time.
Regulatory framework in model allows for investments to be built and costs fully recovered. The model assumes a "representative" or average household or consumer while in reality there is a
more diversified picture of investors and consumers. The model assumes continuous improvements of technologies.
The model-based analysis has shown that decarbonisation of the energy sector is feasible; that it can be achieved through various combinations of energy efficiency, renewables, nuclear and CCS contributions; and that the costs are affordable. The aim of the analysis was not to pick preferred options, a choice that would be surrounded with great uncertainty, but to show some prototype of pathways to decarbonise the energy system while improving energy security and competitiveness and identify common features from scenario analysis.
18 The average EU price of diesel is calculated with the weighted average of country prices; differences
between scenarios are therefore also due to different amounts of diesel used in the countries per scenario; in addition there are different blending ratios; the different taxation regime between the Reference scenario and the other scenarios including CPI reflecting the new proposal for the energy taxation directive.

54
Common elements to scenario analysis There is a need for an integrated approach, e.g.; decarbonisation of heating and transport relies
heavily on the availability of decarbonised electricity supply, which in turn depends on very low carbon investments in generation capacity as well as significant grid expansions and smartening.
Electricity (given its high efficiency and emission free nature at use) makes major inroads in decarbonisation scenarios reaching a 36-39% share in 2050 (almost doubling from current level and becoming the most important final energy source). Decarbonisation in 2050 will require a virtually carbon free electricity sector in the EU, and around 60% CO2 reduction by 2030.
Significant energy efficiency improvements happen in all decarbonisation scenarios. One unit of GDP in 2050 requires around 70% less energy input compared with 2005. The average annual improvement in energy intensity amounts to around 2.5% pa.
The share of renewables rises substantially in all scenarios, achieving at least 55% in gross final energy consumption in 2050, up 45 percentage points from the current level (a high RES case explores the consequences of raising this share to 75%).
The increased use of renewable energy as well as energy efficiency improvements require modern, reliable and smart infrastructure including electrical storage.
Nuclear has a significant role in decarbonisation in Member States where it is accepted, especially if CCS deployment were delayed.
CCS contributes significantly towards decarbonisation in most scenarios with a particularly strong role in case there were problems with nuclear investment and deployment. Developing CCS can be also seen as an insurance against energy efficiency, RES and nuclear (in some Member States) delivering less or not that quickly.
All scenarios show a transition from high fuel/operational expenditures to high capital expenditure.
Substantial changes in the period up to 2030 will be crucial for a cost-efficient long term transition to a decarbonised world19. Economic costs are manageable if action starts early so that the restructuring of the energy system goes in parallel with investment cycles thereby avoiding stranded investment as well as costly lock-ins of medium carbon intensive technology.
The costs of such deep decarbonisation are low in all scenarios given lower fuel procurement costs with cost savings shown mainly in scenarios relying on all four main decarbonisation options.
Costs are unequally distributed across sectors, with households shouldering the greatest cost increase due to higher costs of direct energy efficiency expenditures in appliances, vehicles and insulation.
The external EU energy bill for importing oil, gas and coal will be substantially lower under decarbonisation due to substantial reduction in import quantities and prices dependent on global climate action lowering world fossil fuel demand substantially.
When considering these scenario results it might be useful to consider as well that energy supply structures are being transformed. Today we have, for the most part, concentrated rather invisible items, such as mines, import terminals, large power plants outside towns, and underground pipelines for energy dense fossil fuels and nuclear energy. Under decarbonisation we would increasingly have well visible land consuming configurations, such as very large numbers of wind turbines, solar devices, biomass plantation, and additional transmission lines. This might raise issues with public acceptance and local opposition.
Deployment of nuclear technologies is fraught with acceptance problems in a large number of Member States. CCS is already now experiencing local opposition in some Member States. Temporary delays in CCS were modelled but not the complete unavailability of this option. Permanent unavailability of CCS could mean that decarbonisation would almost entirely hinge upon very strong progress with RES penetration (and energy efficiency) given the
19 Scenarios for the Low Carbon Economy Roadmap of March 2011 show the additional costs of delayed
action.

55
existing limitations to nuclear with many Member States having opted out. In the high RES scenario with much energy efficiency (discussed above), the CCS role is very small, given the predominance of RES, requiring in turn large efforts in terms of financing and finding accepted sites for very substantial investments in production and transmission.
Some policy relevant conclusions can be drawn based both on the results of the scenario analysis as well as on a comparison of the hypothetical situation of ideal market and technological conditions needed for modelling purposes and what is found in the much more complex reality. Implications for future policy making
Successful decarbonisation while preserving competitiveness of the EU economy is possible. Without global climate action, carbon leakage might be an issue and appropriate instruments could be needed to preserve the competitiveness of energy intensive industries.
Predictability and stability of policy and regulatory framework creates a favourable environment for low carbon investments. While the regulatory framework to 2020 is mainly given, discussions about policies for 2020-2030 should start now leading to firm decisions that provide certainty for long-term low-carbon investments. Uncertainty can lead to a sub-optimal situation where only investment with low initial capital costs is realised.
A well functioning internal market is necessary to encourage investment where it is most cost-effective. However, the process of decarbonisation brings new challenges in the context, for example, of. electricity price determination in power exchanges: deep decarbonisation increases substantially the bids based on zero marginal costs leading in many instances to prices rather close to zero, not allowing cost recovery in power generation. Similarly, the necessary expansion and innovation of grids for decarbonisation may be hampered if regulated transmission and distribution focuses on costs minimisation alone. Building of adequate infrastructure needs to be assured and supported either by adequate regulation and/or public funding (e.g. financed by auctioning revenues).
Energy efficiency tends to show better results in a model than in reality. Energy efficiency improvements are often hampered by split incentives, cash problems of some group of customers; imperfect knowledge and foresight leading to lock-in of some outdated technologies, etc. There is thus a strong need for targeted support policies and public funding supporting more energy efficient consumer choices.
Strong support should be given to R&D in order to bring down costs of low-carbon technologies. Due attention should be given to public acceptance of all low carbon technologies and
infrastructure as well willingness of consumers to undertake implied changes and bear higher costs. This will require the engagement of both the public and private sectors early in the process.
Social policies might need to be considered early in the process given that households shoulder large parts of the costs. While these costs might be affordable by an average household, vulnerable consumers might need specific support to cope with increased expenditures. In addition, transition to a decarbonised economy may involve shifts to more highly skilled jobs, with a possibly difficult adaptation period.
Flexibility. The future is uncertain and nobody can predict it. That is why preserving flexibility is important for a cost efficient approach, but certain decisions are needed already at this stage in order to start the process that needs innovation and investment, for which investors require a reasonable degree of certainty from reduced policy and regulatory risk.
External dimension, in particular relations with energy suppliers, should be dealt with pro-actively and at an early stage given the implications of global decarbonisation on fossil fuel export revenues and the necessary production and energy transport investments during the transition phase to decarbonisation; new areas for co-operation could include renewable energy supplies and technology development.

Attachments
ATTACHMENT 1: NUMERICAL RESULTS
1. Reference scenario
SUMMARY ENERGY BALANCE AND INDICATORS (A) ktoe 1990 1995 2000 2005 2010 2015 2020 2025 2030 2035 2040 2045 2050 '90-'00 '00-'10 '10-'20 '20-'30 '30-'40 '40-'50
Annual % ChangeProduction 936047 950181 941860 900326 844792 805284 789524 780783 778102 783807 795430 794964 772011 0,1 -1,1 -0,7 -0,1 0,2 -0,3
Solids 366477 277810 213423 196277 182257 167613 148129 140256 118616 109353 117163 118171 115722 -5,3 -1,6 -2,1 -2,2 -0,1 -0,1Oil 129551 171052 173006 134290 104398 74104 49136 40242 36706 31989 25325 17092 8469 2,9 -4,9 -7,3 -2,9 -3,6 -10,4Natural gas 162447 188965 207559 188677 164866 129069 110851 90833 74513 63722 51825 38563 29267 2,5 -2,3 -3,9 -3,9 -3,6 -5,6Nuclear 202589 223028 243761 257360 238923 239158 222988 231786 247611 268937 283439 298546 294933 1,9 -0,2 -0,7 1,1 1,4 0,4Renewable energy sources 74984 89326 104111 123722 154349 195340 258420 277667 300657 309806 317677 322592 323620 3,3 4,0 5,3 1,5 0,6 0,2
Hydro 25101 28054 30374 26395 27808 28635 29328 30145 30668 31048 31418 31756 32023 1,9 -0,9 0,5 0,4 0,2 0,2Biomass & Waste 46473 57201 67982 85129 102433 122385 152662 158880 162784 160925 162098 161497 157972 3,9 4,2 4,1 0,6 0,0 -0,3Wind 67 350 1913 6061 13850 27580 47984 57378 70750 77239 80764 83535 85243 39,8 21,9 13,2 4,0 1,3 0,5Solar and others 153 274 421 807 3425 9348 19507 22078 27031 30808 33323 35658 38139 10,7 23,3 19,0 3,3 2,1 1,4Geothermal 3190 3447 3421 5331 6832 7393 8940 9186 9424 9785 10073 10145 10243 0,7 7,2 2,7 0,5 0,7 0,2
Net Imports 756079 738600 826299 986048 980012 1054520 1053827 1043130 1006495 1001103 1008427 1028026 1049689 0,9 1,7 0,7 -0,5 0,0 0,4Solids 81846 79338 98645 126639 121822 122965 114982 118206 96064 82294 78558 81785 84511 1,9 2,1 -0,6 -1,8 -2,0 0,7Oil 535645 512185 533039 599851 581600 610760 619288 609026 586837 588234 592904 601403 610189 0,0 0,9 0,6 -0,5 0,1 0,3 - Crude oil and Feedstocks 508460 494000 513725 581995 579010 612729 625088 619901 602209 604393 609655 618641 628328 0,1 1,2 0,8 -0,4 0,1 0,3 - Oil products 27185 18185 19314 17856 2590 -1970 -5800 -10875 -15372 -16159 -16750 -17239 -18140 -3,4 -18,2Natural gas 135121 145288 192531 257366 272497 314077 301734 302919 308809 314094 317843 322968 329585 3,6 3,5 1,0 0,2 0,3 0,4Electricity 3323 1508 1686 971 264 -544 -1754 -1942 -2080 -2327 -2342 -2395 -2487 -6,6 -16,9Renewable energy forms 144 279 397 1222 3829 7262 19577 14921 16865 18808 21463 24266 27892 10,7 25,4 17,7 -1,5 2,4 2,7
Gross Inland Consumption 1660159 1662517 1723099 1825989 1774753 1807688 1790021 1769445 1728783 1728020 1746001 1764359 1762783 0,4 0,3 0,1 -0,3 0,1 0,1Solids 452940 364248 321007 319922 304079 290578 263112 258462 214680 191647 195722 199956 200233 -3,4 -0,5 -1,4 -2,0 -0,9 0,2Oil 631058 650858 658727 676859 635947 632747 615094 594800 567728 563333 560374 559863 559741 0,4 -0,4 -0,3 -0,8 -0,1 0,0Natural gas 294905 333268 393417 445998 437362 443147 412585 393752 383322 377816 369668 361531 358852 2,9 1,1 -0,6 -0,7 -0,4 -0,3Nuclear 202589 223028 243761 257360 238923 239158 222988 231786 247611 268937 283439 298546 294933 1,9 -0,2 -0,7 1,1 1,4 0,4Electricity 3323 1508 1686 971 264 -544 -1754 -1942 -2080 -2327 -2342 -2395 -2487 -6,6 -16,9Renewable energy forms 75343 89606 104501 124880 158178 202602 277997 292587 317522 328614 339140 346857 351512 3,3 4,2 5,8 1,3 0,7 0,4
as % in Gross Inland ConsumptionSolids 27,3 21,9 18,6 17,5 17,1 16,1 14,7 14,6 12,4 11,1 11,2 11,3 11,4Oil 38,0 39,1 38,2 37,1 35,8 35,0 34,4 33,6 32,8 32,6 32,1 31,7 31,8Natural gas 17,8 20,0 22,8 24,4 24,6 24,5 23,0 22,3 22,2 21,9 21,2 20,5 20,4Nuclear 12,2 13,4 14,1 14,1 13,5 13,2 12,5 13,1 14,3 15,6 16,2 16,9 16,7Renewable energy forms 4,5 5,4 6,1 6,8 8,9 11,2 15,5 16,5 18,4 19,0 19,4 19,7 19,9
Gross Electricity Generation in GWhe 2562823 2712209 2991720 3274121 3410155 3615644 3766750 3987027 4066714 4284467 4539591 4761463 4931154 1,6 1,3 1,0 0,8 1,1 0,8Nuclear 794718 881662 944823 997519 926564 928349 871028 920581 995206 1089783 1154633 1246116 1303832 1,7 -0,2 -0,6 1,3 1,5 1,2Hydro & wind 292648 330306 375545 378836 501839 686819 967260 1108094 1313567 1428648 1500812 1564161 1615455 2,5 2,9 6,8 3,1 1,3 0,7Thermal (incl. biomass) 1475456 1500241 1671352 1897765 1981751 2000476 1928462 1958352 1757941 1766036 1884147 1951186 2011867 1,3 1,7 -0,3 -0,9 0,7 0,7
Fuel Inputs for Thermal Power Generation 383492 362334 382613 424208 434230 431464 413869 417433 379617 365574 374301 378407 383164 0,0 1,3 -0,5 -0,9 -0,1 0,2Solids 263837 230040 223012 229245 232681 220385 196207 193344 154957 135202 139484 143039 143607 -1,7 0,4 -1,7 -2,3 -1,0 0,3Oil (including refinery gas) 54404 51463 39294 29780 17242 16281 11177 14071 14919 17125 20185 22924 23179 -3,2 -7,9 -4,2 2,9 3,1 1,4Gas 56754 67806 102408 134637 143444 139931 125482 121522 116857 119958 119786 118254 120825 6,1 3,4 -1,3 -0,7 0,2 0,1Biomass & Waste 5724 10033 14960 25901 35036 48979 74871 81932 85857 85982 87223 86510 87817 10,1 8,9 7,9 1,4 0,2 0,1Geothermal heat 2774 2992 2939 4645 5828 5888 6132 6564 7027 7307 7623 7681 7737 0,6 7,1 0,5 1,4 0,8 0,1Hydrogen - Methanol 0 0 0 0 0 0 0 0 0 0 0 0 0
Fuel Input in other transformation proc. 839073 814654 827098 842975 794117 805120 800342 784837 759949 756205 754190 754073 753750 -0,1 -0,4 0,1 -0,5 -0,1 0,0Refineries 679426 705954 735244 758152 718853 722167 708598 693191 670478 667636 665791 666042 666769 0,8 -0,2 -0,1 -0,6 -0,1 0,0Biofuels and hydrogen production 2 202 610 3129 12210 19624 30328 31995 35283 36667 37229 37256 36990 79,6 34,9 9,5 1,5 0,5 -0,1District heating 32960 23240 19323 16212 15609 15836 15578 15568 13831 13509 12932 11659 11451 -5,2 -2,1 0,0 -1,2 -0,7 -1,2Others 126685 85258 71921 65482 47445 47493 45838 44083 40357 38392 38238 39115 38540 -5,5 -4,1 -0,3 -1,3 -0,5 0,1
Energy Branch Consumption 82379 88696 88176 96033 92203 90715 89395 88187 82583 83526 87023 89342 89820 0,7 0,4 -0,3 -0,8 0,5 0,3Non-Energy Uses 97931 110541 112495 117477 111512 115317 117892 118700 119686 120719 121626 122538 123283 1,4 -0,1 0,6 0,2 0,2 0,1Final Energy Demand 1068710 1069989 1112989 1173676 1165873 1215397 1227169 1206870 1187036 1192289 1201689 1214718 1220944 0,4 0,5 0,5 -0,3 0,1 0,2by sectorIndustry 365650 328513 326949 326308 312402 322907 330271 332209 332530 337637 347017 357606 369219 -1,1 -0,5 0,6 0,1 0,4 0,6 - energy intensive industries 234722 214526 213112 210991 193227 196685 198535 196310 193411 192595 194763 196810 198992 -1,0 -1,0 0,3 -0,3 0,1 0,2 - other industrial sectors 130928 113987 113837 115317 119175 126222 131736 135899 139120 145042 152254 160796 170228 -1,4 0,5 1,0 0,5 0,9 1,1Residential 264307 280418 286784 308104 308364 320385 317623 303962 299095 296158 293213 292149 288195 0,8 0,7 0,3 -0,6 -0,2 -0,2Tertiary 158484 160442 159866 176859 175095 182934 181325 176861 173822 175990 178125 180740 180850 0,1 0,9 0,4 -0,4 0,2 0,2Transport 280269 300617 339389 362405 370012 389172 397950 393838 381589 382505 383333 384224 382680 1,9 0,9 0,7 -0,4 0,0 0,0by fuel
Solids 125031 84977 61454 54486 47419 46274 44102 42716 38479 36813 36731 37803 37714 -6,9 -2,6 -0,7 -1,4 -0,5 0,3Oil 444429 456959 478882 495857 476505 477401 467526 451334 428648 426107 424509 425057 422388 0,7 0,0 -0,2 -0,9 -0,1 -0,1Gas 227902 245996 265552 283524 265060 271959 253998 234748 227256 217035 207872 201799 196468 1,5 0,0 -0,4 -1,1 -0,9 -0,6Electricity 184145 193367 216403 237537 248412 264598 274801 290291 297955 312733 328782 343339 355216 1,6 1,4 1,0 0,8 1,0 0,8Heat (from CHP and District Heating) (A) 48610 44616 40061 44441 59328 71796 78280 83792 86854 92259 94996 97320 99656 -1,9 4,0 2,8 1,0 0,9 0,5Other 38592 44073 50640 57832 69149 83367 108462 103990 107845 107343 108800 109399 109503 2,8 3,2 4,6 -0,1 0,1 0,1
CO2 Emissions (Mt of CO2 - sec approach) 4030,6 3800,1 3810,6 3946,6 3771,6 3713,4 3442,0 3273,4 2982,8 2755,5 2565,5 2451,4 2400,4 -0,6 -0,1 -0,9 -1,4 -1,5 -0,7Power generation/District heating 1484,3 1321,2 1320,8 1381,1 1365,6 1304,8 1124,2 1066,8 890,6 715,2 561,6 463,8 434,0 -1,2 0,3 -1,9 -2,3 -4,5 -2,5Energy Branch 152,2 171,0 170,2 181,6 157,3 146,0 135,6 124,4 113,8 100,4 90,6 79,7 78,9 1,1 -0,8 -1,5 -1,7 -2,3 -1,4Industry 781,4 678,1 623,0 581,9 490,5 475,1 459,1 440,7 420,4 407,6 406,5 416,3 424,8 -2,2 -2,4 -0,7 -0,9 -0,3 0,4Residential 499,4 481,6 466,2 486,7 465,3 465,8 426,2 382,4 361,1 345,6 328,0 315,3 297,5 -0,7 0,0 -0,9 -1,6 -1,0 -1,0Tertiary 300,5 275,3 242,0 262,2 244,5 238,3 220,3 200,5 187,2 179,0 170,5 165,5 158,3 -2,1 0,1 -1,0 -1,6 -0,9 -0,7Transport 812,7 872,9 988,5 1053,1 1048,3 1083,3 1076,7 1058,5 1009,7 1007,7 1008,3 1010,7 1007,0 2,0 0,6 0,3 -0,6 0,0 0,0
CO2 Emissions Index (1990=100) 100,0 94,3 94,5 97,9 93,6 92,1 85,4 81,2 74,0 68,4 63,7 60,8 59,6CO2 Emissions (Mt of CO2 - ref approach) 4172,0 3950,7 3922,7 4087,6 3837,5 3780,3 3511,3 3342,5 3053,6 2824,8 2632,9 2516,8 2470,2 -0,6 -0,2 -0,9 -1,4 -1,5 -0,6
EU27: Reference scenario with updated world energy prices
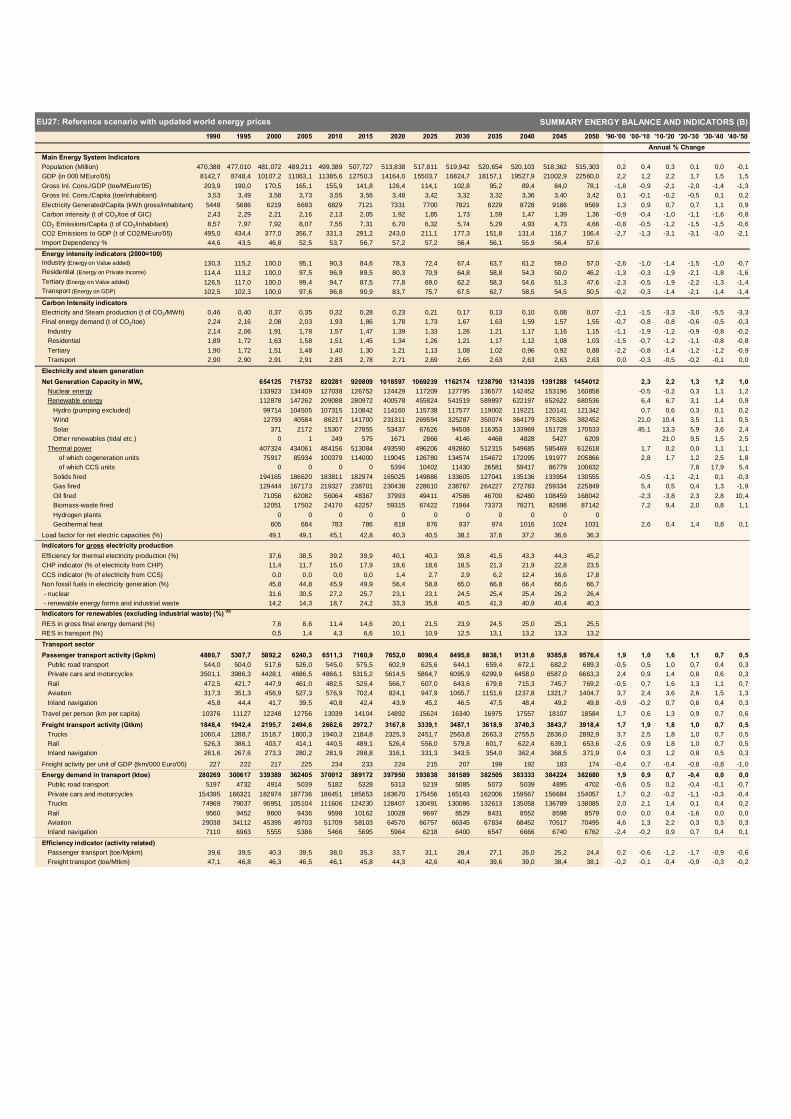
SUMMARY ENERGY BALANCE AND INDICATORS (B)
1990 1995 2000 2005 2010 2015 2020 2025 2030 2035 2040 2045 2050 '90-'00 '00-'10 '10-'20 '20-'30 '30-'40 '40-'50Annual % Change
Main Energy System IndicatorsPopulation (Million) 470,388 477,010 481,072 489,211 499,389 507,727 513,838 517,811 519,942 520,654 520,103 518,362 515,303 0,2 0,4 0,3 0,1 0,0 -0,1GDP (in 000 MEuro'05) 8142,7 8748,4 10107,2 11063,1 11385,6 12750,3 14164,0 15503,7 16824,7 18157,1 19527,9 21002,9 22560,0 2,2 1,2 2,2 1,7 1,5 1,5Gross Inl. Cons./GDP (toe/MEuro'05) 203,9 190,0 170,5 165,1 155,9 141,8 126,4 114,1 102,8 95,2 89,4 84,0 78,1 -1,8 -0,9 -2,1 -2,0 -1,4 -1,3Gross Inl. Cons./Capita (toe/inhabitant) 3,53 3,49 3,58 3,73 3,55 3,56 3,48 3,42 3,32 3,32 3,36 3,40 3,42 0,1 -0,1 -0,2 -0,5 0,1 0,2Electricity Generated/Capita (kWh gross/inhabitant) 5448 5686 6219 6693 6829 7121 7331 7700 7821 8229 8728 9186 9569 1,3 0,9 0,7 0,7 1,1 0,9Carbon intensity (t of CO2/toe of GIC) 2,43 2,29 2,21 2,16 2,13 2,05 1,92 1,85 1,73 1,59 1,47 1,39 1,36 -0,9 -0,4 -1,0 -1,1 -1,6 -0,8CO2 Emissions/Capita (t of CO2/inhabitant) 8,57 7,97 7,92 8,07 7,55 7,31 6,70 6,32 5,74 5,29 4,93 4,73 4,66 -0,8 -0,5 -1,2 -1,5 -1,5 -0,6CO2 Emissions to GDP (t of CO2/MEuro'05) 495,0 434,4 377,0 356,7 331,3 291,2 243,0 211,1 177,3 151,8 131,4 116,7 106,4 -2,7 -1,3 -3,1 -3,1 -3,0 -2,1Import Dependency % 44,6 43,5 46,8 52,5 53,7 56,7 57,2 57,2 56,4 56,1 55,9 56,4 57,6
Energy intensity indicators (2000=100)Industry (Energy on Value added) 130,3 115,2 100,0 95,1 90,3 84,6 78,3 72,4 67,4 63,7 61,2 59,0 57,0 -2,6 -1,0 -1,4 -1,5 -1,0 -0,7Residential (Energy on Private Income) 114,4 113,2 100,0 97,5 96,9 89,5 80,3 70,9 64,8 58,8 54,3 50,0 46,2 -1,3 -0,3 -1,9 -2,1 -1,8 -1,6Tertiary (Energy on Value added) 126,5 117,0 100,0 99,4 94,7 87,5 77,8 69,0 62,2 58,3 54,6 51,3 47,6 -2,3 -0,5 -1,9 -2,2 -1,3 -1,4Transport (Energy on GDP) 102,5 102,3 100,0 97,6 96,8 90,9 83,7 75,7 67,5 62,7 58,5 54,5 50,5 -0,2 -0,3 -1,4 -2,1 -1,4 -1,4
Carbon Intensity indicatorsElectricity and Steam production (t of CO2/MWh) 0,46 0,40 0,37 0,35 0,32 0,28 0,23 0,21 0,17 0,13 0,10 0,08 0,07 -2,1 -1,5 -3,3 -3,0 -5,5 -3,3Final energy demand (t of CO2/toe) 2,24 2,16 2,08 2,03 1,93 1,86 1,78 1,73 1,67 1,63 1,59 1,57 1,55 -0,7 -0,8 -0,8 -0,6 -0,5 -0,3
Industry 2,14 2,06 1,91 1,78 1,57 1,47 1,39 1,33 1,26 1,21 1,17 1,16 1,15 -1,1 -1,9 -1,2 -0,9 -0,8 -0,2Residential 1,89 1,72 1,63 1,58 1,51 1,45 1,34 1,26 1,21 1,17 1,12 1,08 1,03 -1,5 -0,7 -1,2 -1,1 -0,8 -0,8Tertiary 1,90 1,72 1,51 1,48 1,40 1,30 1,21 1,13 1,08 1,02 0,96 0,92 0,88 -2,2 -0,8 -1,4 -1,2 -1,2 -0,9Transport 2,90 2,90 2,91 2,91 2,83 2,78 2,71 2,69 2,65 2,63 2,63 2,63 2,63 0,0 -0,3 -0,5 -0,2 -0,1 0,0
Electricity and steam generationNet Generation Capacity in MWe 654125 715732 820281 920809 1018597 1069239 1162174 1238790 1314335 1391288 1454012 2,3 2,2 1,3 1,2 1,0
Nuclear energy 133923 134409 127038 126752 124429 117209 127795 136577 142452 153196 160858 -0,5 -0,2 0,3 1,1 1,2Renewable energy 112878 147262 209088 280972 400578 455824 541519 589897 622197 652622 680536 6,4 6,7 3,1 1,4 0,9
Hydro (pumping excluded) 99714 104505 107315 110842 114160 115738 117577 119002 119221 120141 121342 0,7 0,6 0,3 0,1 0,2Wind 12793 40584 86217 141700 231311 269594 325287 350074 364179 375326 382452 21,0 10,4 3,5 1,1 0,5Solar 371 2172 15307 27855 53437 67626 94508 116353 133969 151728 170533 45,1 13,3 5,9 3,6 2,4Other renewables (tidal etc.) 0 1 249 575 1671 2866 4146 4468 4828 5427 6209 21,0 9,5 1,5 2,5
Thermal power 407324 434061 484156 513084 493590 496206 492860 512315 549685 585469 612618 1,7 0,2 0,0 1,1 1,1of which cogeneration units 75917 85934 100379 114000 119045 126780 134574 154672 172095 191977 205866 2,8 1,7 1,2 2,5 1,8of which CCS units 0 0 0 0 5394 10402 11430 26581 59417 86779 100632 7,8 17,9 5,4
Solids fired 194165 186620 183811 182974 165025 149886 133605 127041 135136 133954 130555 -0,5 -1,1 -2,1 0,1 -0,3Gas fired 129444 167173 219327 238701 230438 228610 238767 264227 272783 259334 225849 5,4 0,5 0,4 1,3 -1,9Oil fired 71058 62082 56064 48367 37993 49411 47586 46700 62480 108459 168042 -2,3 -3,8 2,3 2,8 10,4Biomass-waste fired 12051 17502 24170 42257 59315 67422 71964 73373 78271 82698 87142 7,2 9,4 2,0 0,8 1,1Hydrogen plants 0 0 0 0 0 0 0 0 0 0 0Geothermal heat 605 684 783 786 818 876 937 974 1016 1024 1031 2,6 0,4 1,4 0,8 0,1
Load factor for net electric capacities (%) 49,1 49,1 45,1 42,8 40,3 40,5 38,1 37,6 37,2 36,6 36,3Indicators for gross electricity productionEfficiency for thermal electricity production (%) 37,6 38,5 39,2 39,9 40,1 40,3 39,8 41,5 43,3 44,3 45,2CHP indicator (% of electricity from CHP) 11,4 11,7 15,0 17,9 18,6 18,6 18,5 21,3 21,9 22,8 23,5CCS indicator (% of electricity from CCS) 0,0 0,0 0,0 0,0 1,4 2,7 2,9 6,2 12,4 16,6 17,8Non fossil fuels in electricity generation (%) 45,8 44,8 45,9 49,9 56,4 58,8 65,0 66,8 66,4 66,6 66,7 - nuclear 31,6 30,5 27,2 25,7 23,1 23,1 24,5 25,4 25,4 26,2 26,4 - renewable energy forms and industrial waste 14,2 14,3 18,7 24,2 33,3 35,8 40,5 41,3 40,9 40,4 40,3Indicators for renewables (excluding industrial waste) (%) (B)
RES in gross final energy demand (%) 7,6 8,6 11,4 14,6 20,1 21,5 23,9 24,5 25,0 25,1 25,5RES in transport (%) 0,5 1,4 4,3 6,6 10,1 10,9 12,5 13,1 13,2 13,3 13,2
Transport sectorPassenger transport activity (Gpkm) 4880,7 5307,7 5892,2 6240,3 6511,3 7160,9 7652,0 8090,4 8495,8 8838,1 9131,6 9385,8 9576,4 1,9 1,0 1,6 1,1 0,7 0,5
Public road transport 544,0 504,0 517,6 526,0 545,0 575,5 602,9 625,6 644,1 659,4 672,1 682,2 689,3 -0,5 0,5 1,0 0,7 0,4 0,3Private cars and motorcycles 3501,1 3986,3 4428,1 4686,5 4866,1 5315,2 5614,5 5864,7 6095,9 6299,9 6458,0 6587,0 6663,3 2,4 0,9 1,4 0,8 0,6 0,3Rail 472,5 421,7 447,9 461,0 482,5 525,4 566,7 607,0 643,6 679,8 715,3 745,7 769,2 -0,5 0,7 1,6 1,3 1,1 0,7Aviation 317,3 351,3 456,9 527,3 576,9 702,4 824,1 947,9 1065,7 1151,6 1237,8 1321,7 1404,7 3,7 2,4 3,6 2,6 1,5 1,3Inland navigation 45,8 44,4 41,7 39,5 40,8 42,4 43,9 45,2 46,5 47,5 48,4 49,2 49,8 -0,9 -0,2 0,7 0,6 0,4 0,3
Travel per person (km per capita) 10376 11127 12248 12756 13039 14104 14892 15624 16340 16975 17557 18107 18584 1,7 0,6 1,3 0,9 0,7 0,6
Freight transport activity (Gtkm) 1848,4 1942,4 2195,7 2494,6 2662,6 2972,7 3167,8 3339,1 3487,1 3618,9 3740,3 3843,7 3918,4 1,7 1,9 1,8 1,0 0,7 0,5Trucks 1060,4 1288,7 1518,7 1800,3 1940,3 2184,8 2325,3 2451,7 2563,8 2663,3 2755,5 2836,0 2892,9 3,7 2,5 1,8 1,0 0,7 0,5Rail 526,3 386,1 403,7 414,1 440,5 489,1 526,4 556,0 579,8 601,7 622,4 639,1 653,6 -2,6 0,9 1,8 1,0 0,7 0,5Inland navigation 261,6 267,6 273,3 280,2 281,9 298,8 316,1 331,3 343,5 354,0 362,4 368,5 371,9 0,4 0,3 1,2 0,8 0,5 0,3
Freight activity per unit of GDP (tkm/000 Euro'05) 227 222 217 225 234 233 224 215 207 199 192 183 174 -0,4 0,7 -0,4 -0,8 -0,8 -1,0Energy demand in transport (ktoe) 280269 300617 339389 362405 370012 389172 397950 393838 381589 382505 383333 384224 382680 1,9 0,9 0,7 -0,4 0,0 0,0
Public road transport 5197 4732 4914 5039 5182 5328 5313 5219 5085 5073 5039 4895 4702 -0,6 0,5 0,2 -0,4 -0,1 -0,7Private cars and motorcycles 154395 166321 182974 187736 186451 185653 183670 175456 165143 162006 159567 156684 154057 1,7 0,2 -0,2 -1,1 -0,3 -0,4Trucks 74969 79037 90951 105104 111606 124230 128407 130491 130086 132613 135058 136789 138085 2,0 2,1 1,4 0,1 0,4 0,2Rail 9560 9452 9600 9436 9598 10162 10028 9697 8529 8431 8552 8598 8579 0,0 0,0 0,4 -1,6 0,0 0,0Aviation 29038 34112 45395 49703 51709 58103 64570 66757 66345 67834 68452 70517 70495 4,6 1,3 2,2 0,3 0,3 0,3Inland navigation 7110 6963 5555 5386 5466 5695 5964 6218 6400 6547 6666 6740 6762 -2,4 -0,2 0,9 0,7 0,4 0,1
Efficiency indicator (activity related)Passenger transport (toe/Mpkm) 39,6 39,5 40,3 39,5 38,0 35,3 33,7 31,1 28,4 27,1 26,0 25,2 24,4 0,2 -0,6 -1,2 -1,7 -0,9 -0,6Freight transport (toe/Mtkm) 47,1 46,8 46,3 46,5 46,1 45,8 44,3 42,6 40,4 39,6 39,0 38,4 38,1 -0,2 -0,1 -0,4 -0,9 -0,3 -0,2
EU27: Reference scenario with updated world energy prices

Reference scenario with Low energy import prices - 58
Reference scenario with Low energy import prices
SUMMARY ENERGY BALANCE AND INDICATORS (A) ktoe 1990 1995 2000 2005 2010 2015 2020 2025 2030 2035 2040 2045 2050 '90-'00 '00-'10 '10-'20 '20-'30 '30-'40 '40-'50
Annual % ChangeProduction 936047 950181 941860 900326 844956 806743 774724 751351 744210 744394 741954 734990 708730 0,1 -1,1 -0,9 -0,4 0,0 -0,5
Solids 366477 277810 213423 196277 182280 164596 141188 132111 109418 97710 98461 96608 94609 -5,3 -1,6 -2,5 -2,5 -1,0 -0,4Oil 129551 171052 173006 134290 104398 72796 47932 39066 35740 30959 24367 16344 8048 2,9 -4,9 -7,5 -2,9 -3,8 -10,5Natural gas 162447 188965 207559 188677 164866 128886 110612 89928 74766 63734 51574 37757 28571 2,5 -2,3 -3,9 -3,8 -3,6 -5,7Nuclear 202589 223028 243761 257360 238969 238621 211913 219161 233511 255202 264660 280156 273839 1,9 -0,2 -1,2 1,0 1,3 0,3Renewable energy sources 74984 89326 104111 123722 154443 201844 263080 271084 290775 296788 302892 304123 303663 3,3 4,0 5,5 1,0 0,4 0,0
Hydro 25101 28054 30374 26395 27808 28667 29384 30172 30686 31046 31438 31763 32030 1,9 -0,9 0,6 0,4 0,2 0,2Biomass & Waste 46473 57201 67982 85129 102533 125584 154190 153488 156021 151788 151961 148643 144551 3,9 4,2 4,2 0,1 -0,3 -0,5Wind 67 350 1913 6061 13850 28183 49055 56866 68578 74921 77976 80382 81533 39,8 21,9 13,5 3,4 1,3 0,4Solar and others 153 274 421 807 3421 11577 21121 21807 26354 29679 31944 33731 35899 10,7 23,3 20,0 2,2 1,9 1,2Geothermal 3190 3447 3421 5331 6831 7832 9330 8752 9136 9354 9573 9604 9650 0,7 7,2 3,2 -0,2 0,5 0,1
Net Imports 756079 738600 826299 986048 980090 1051609 1078844 1098644 1060765 1072010 1100097 1131483 1165250 0,9 1,7 1,0 -0,2 0,4 0,6Solids 81846 79338 98645 126639 122164 116566 105939 117078 90957 81132 82882 84342 89999 1,9 2,2 -1,4 -1,5 -0,9 0,8Oil 535645 512185 533039 599851 581355 597240 616521 612915 587072 593828 607030 620899 640530 0,0 0,9 0,6 -0,5 0,3 0,5 - Crude oil and Feedstocks 508460 494000 513725 581995 578837 602248 623376 623292 602837 609643 622423 636129 655377 0,1 1,2 0,7 -0,3 0,3 0,5 - Oil products 27185 18185 19314 17856 2517 -5008 -6855 -10377 -15765 -15815 -15393 -15230 -14846 -3,4 -18,4Natural gas 135121 145288 192531 257366 272452 329264 337551 356119 368775 381532 392415 406919 412529 3,6 3,5 2,2 0,9 0,6 0,5Electricity 3323 1508 1686 971 264 -544 -1754 -1942 -2080 -2327 -2342 -2395 -2487 -6,6 -16,9Renewable energy forms 144 279 397 1222 3856 9083 20587 14474 16042 17845 20112 21719 24679 10,7 25,5 18,2 -2,5 2,3 2,1
Gross Inland Consumption 1660159 1662517 1723099 1825989 1774995 1806264 1799631 1794481 1748222 1758104 1782256 1805519 1812059 0,4 0,3 0,1 -0,3 0,2 0,2Solids 452940 364248 321007 319922 304443 281163 247127 249190 200375 178842 181343 180950 184608 -3,4 -0,5 -2,1 -2,1 -1,0 0,2Oil 631058 650858 658727 676859 635701 617947 610515 596467 566059 566488 571602 576289 586657 0,4 -0,4 -0,4 -0,8 0,1 0,3Natural gas 294905 333268 393417 445998 437318 458150 448164 446048 443541 445266 443990 444676 441099 2,9 1,1 0,2 -0,1 0,0 -0,1Nuclear 202589 223028 243761 257360 238969 238621 211913 219161 233511 255202 264660 280156 273839 1,9 -0,2 -1,2 1,0 1,3 0,3Electricity 3323 1508 1686 971 264 -544 -1754 -1942 -2080 -2327 -2342 -2395 -2487 -6,6 -16,9Renewable energy forms 75343 89606 104501 124880 158300 210927 283667 285558 306817 314633 323004 325842 328343 3,3 4,2 6,0 0,8 0,5 0,2
as % in Gross Inland ConsumptionSolids 27,3 21,9 18,6 17,5 17,2 15,6 13,7 13,9 11,5 10,2 10,2 10,0 10,2Oil 38,0 39,1 38,2 37,1 35,8 34,2 33,9 33,2 32,4 32,2 32,1 31,9 32,4Natural gas 17,8 20,0 22,8 24,4 24,6 25,4 24,9 24,9 25,4 25,3 24,9 24,6 24,3Nuclear 12,2 13,4 14,1 14,1 13,5 13,2 11,8 12,2 13,4 14,5 14,8 15,5 15,1Renewable energy forms 4,5 5,4 6,1 6,8 8,9 11,7 15,8 15,9 17,6 17,9 18,1 18,0 18,1
Gross Electricity Generation in GWhe 2562823 2712209 2991720 3274121 3409540 3579990 3696830 3910011 4002791 4206235 4459038 4677810 4840859 1,6 1,3 0,8 0,8 1,1 0,8Nuclear 794718 881662 944823 997519 926744 926184 827462 867959 937530 1033820 1076501 1167142 1206811 1,7 -0,2 -1,1 1,3 1,4 1,1Hydro & wind 292648 330306 375545 378836 501839 694261 986726 1108021 1289057 1400094 1465847 1519821 1561038 2,5 2,9 7,0 2,7 1,3 0,6Thermal (incl. biomass) 1475456 1500241 1671352 1897765 1980957 1959545 1882642 1934031 1776205 1772322 1916691 1990847 2073010 1,3 1,7 -0,5 -0,6 0,8 0,8
Fuel Inputs for Thermal Power Generation 383492 362334 382613 424208 433918 421402 402095 411216 376607 364739 375750 379562 387716 0,0 1,3 -0,8 -0,7 0,0 0,3Solids 263837 230040 223012 229245 232690 210625 177884 179755 136173 118027 121339 120857 125456 -1,7 0,4 -2,7 -2,6 -1,1 0,3Oil (including refinery gas) 54404 51463 39294 29780 17274 13069 9463 11650 14063 17353 20001 22883 23246 -3,2 -7,9 -5,8 4,0 3,6 1,5Gas 56754 67806 102408 134637 142867 140128 130086 130096 132413 132211 131843 133444 135557 6,1 3,4 -0,9 0,2 0,0 0,3Biomass & Waste 5724 10033 14960 25901 35260 51578 78413 83034 86815 89750 94852 94605 95629 10,1 9,0 8,3 1,0 0,9 0,1Geothermal heat 2774 2992 2939 4645 5828 6002 6248 6680 7142 7399 7714 7772 7828 0,6 7,1 0,7 1,3 0,8 0,1Hydrogen - Methanol 0 0 0 0 0 0 0 0 0 0 0 0 0
Fuel Input in other transformation proc. 839073 814654 827098 842975 793957 795764 800355 789915 760997 760282 765231 768953 776720 -0,1 -0,4 0,1 -0,5 0,1 0,1Refineries 679426 705954 735244 758152 718673 709499 704546 694320 668973 670763 676613 681957 693075 0,8 -0,2 -0,2 -0,5 0,1 0,2Biofuels and hydrogen production 2 202 610 3129 12210 22098 31041 30036 32808 32930 31851 30343 28482 79,6 34,9 9,8 0,6 -0,3 -1,1District heating 32960 23240 19323 16212 15391 16282 16195 16766 13946 12649 12385 11718 11220 -5,2 -2,2 0,5 -1,5 -1,2 -1,0Others 126685 85258 71921 65482 47683 47885 48573 48793 45270 43940 44382 44935 43944 -5,5 -4,0 0,2 -0,7 -0,2 -0,1
Energy Branch Consumption 82379 88696 88176 96033 92073 90331 89465 88531 82892 83756 87792 90666 92099 0,7 0,4 -0,3 -0,8 0,6 0,5Non-Energy Uses 97931 110541 112495 117477 111488 115337 118650 120217 121239 122827 124273 125527 126852 1,4 -0,1 0,6 0,2 0,2 0,2Final Energy Demand 1068710 1069989 1112989 1173676 1165917 1220192 1249573 1240531 1215419 1227393 1243913 1260655 1271891 0,4 0,5 0,7 -0,3 0,2 0,2by sectorIndustry 365650 328513 326949 326308 312454 324447 333795 338272 339167 345310 354837 365648 377451 -1,1 -0,5 0,7 0,2 0,5 0,6 - energy intensive industries 234722 214526 213112 210991 193330 197669 201270 201148 198722 198885 201189 203183 205315 -1,0 -1,0 0,4 -0,1 0,1 0,2 - other industrial sectors 130928 113987 113837 115317 119124 126778 132525 137124 140445 146425 153648 162465 172136 -1,4 0,5 1,1 0,6 0,9 1,1Residential 264307 280418 286784 308104 308342 323961 327748 318361 313344 312171 310506 309942 305872 0,8 0,7 0,6 -0,4 -0,1 -0,2Tertiary 158484 160442 159866 176859 175109 183861 185722 185006 181447 185957 189860 193857 194991 0,1 0,9 0,6 -0,2 0,5 0,3Transport 280269 300617 339389 362405 370012 387924 402308 398891 381461 383956 388710 391208 393577 1,9 0,9 0,8 -0,5 0,2 0,1by fuel
Solids 125031 84977 61454 54486 47716 45211 43809 43651 39646 37714 37400 37901 37314 -6,9 -2,5 -0,9 -1,0 -0,6 0,0Oil 444429 456959 478882 495857 476263 468996 467417 457110 429572 431142 436619 441663 447464 0,7 -0,1 -0,2 -0,8 0,2 0,2Gas 227902 245996 265552 283524 265632 284726 282238 274985 269218 267413 263648 260587 256524 1,5 0,0 0,6 -0,5 -0,2 -0,3Electricity 184145 193367 216403 237537 248325 262052 269809 284714 293227 307051 322625 336298 347174 1,6 1,4 0,8 0,8 1,0 0,7Heat (from CHP and District Heating) (A) 48610 44616 40061 44441 58782 70830 77358 83767 84875 89632 91077 92866 93819 -1,9 3,9 2,8 0,9 0,7 0,3Other 38592 44073 50640 57832 69199 88377 108942 96302 98882 94442 92544 91340 89596 2,8 3,2 4,6 -1,0 -0,7 -0,3
CO2 Emissions (Mt of CO2 - sec approach) 4030,6 3800,1 3810,6 3946,6 3772,2 3666,1 3442,2 3356,5 3051,9 2871,4 2705,7 2587,3 2556,8 -0,6 -0,1 -0,9 -1,2 -1,2 -0,6Power generation/District heating 1484,3 1321,2 1320,8 1381,1 1364,1 1258,9 1057,7 1028,7 847,8 683,4 517,4 394,4 360,5 -1,2 0,3 -2,5 -2,2 -4,8 -3,5Energy Branch 152,2 171,0 170,2 181,6 157,4 143,8 136,5 128,2 117,6 108,5 102,6 97,2 95,3 1,1 -0,8 -1,4 -1,5 -1,4 -0,7Industry 781,4 678,1 623,0 581,9 492,9 482,0 478,6 472,9 459,9 455,9 460,2 470,0 483,0 -2,2 -2,3 -0,3 -0,4 0,0 0,5Residential 499,4 481,6 466,2 486,7 465,1 470,5 451,4 426,8 405,2 397,8 386,0 375,5 359,0 -0,7 0,0 -0,3 -1,1 -0,5 -0,7Tertiary 300,5 275,3 242,0 262,2 244,3 238,8 230,7 220,2 204,3 202,2 198,7 197,4 193,5 -2,1 0,1 -0,6 -1,2 -0,3 -0,3Transport 812,7 872,9 988,5 1053,1 1048,3 1072,0 1087,3 1079,6 1017,1 1023,6 1040,8 1052,7 1065,6 2,0 0,6 0,4 -0,7 0,2 0,2
CO2 Emissions Index (1990=100) 100,0 94,3 94,5 97,9 93,6 91,0 85,4 83,3 75,7 71,2 67,1 64,2 63,4CO2 Emissions (Mt of CO2 - ref approach) 4172,0 3950,7 3922,7 4087,6 3838,2 3737,7 3519,7 3433,5 3131,3 2949,5 2782,0 2661,6 2634,4 -0,6 -0,2 -0,9 -1,2 -1,2 -0,5
EU27: Reference scenario with low world energy prices
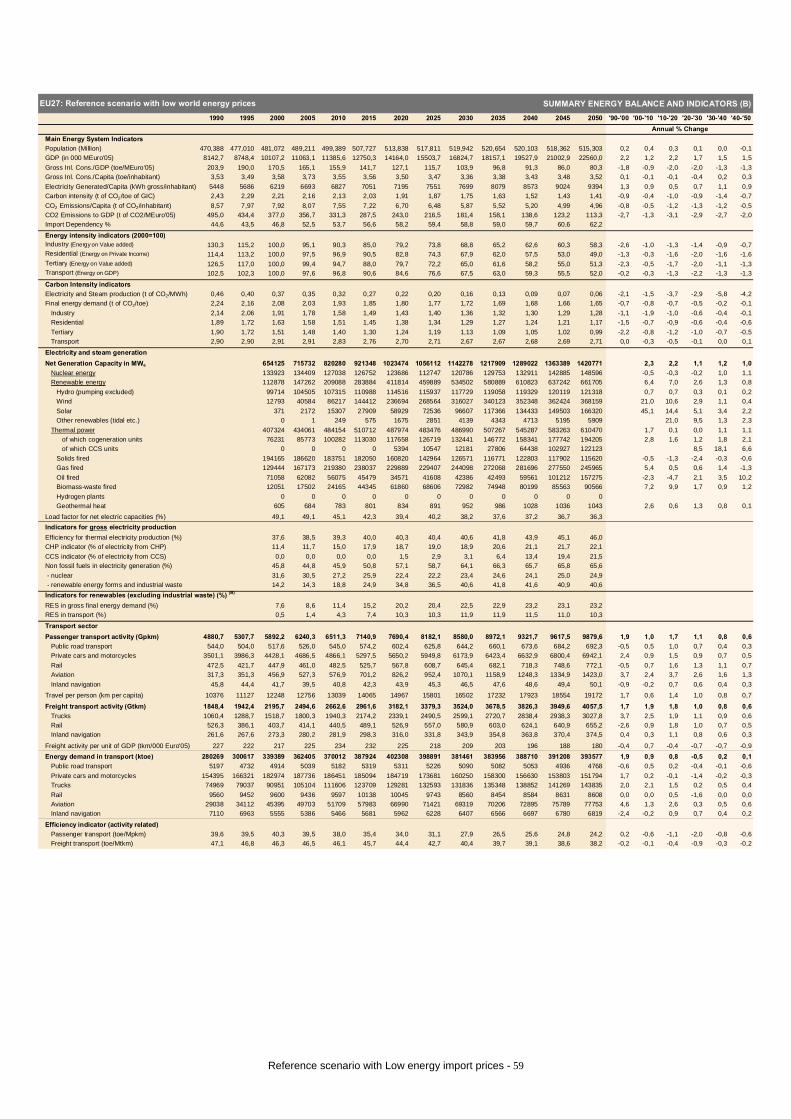
Reference scenario with Low energy import prices - 59
SUMMARY ENERGY BALANCE AND INDICATORS (B)1990 1995 2000 2005 2010 2015 2020 2025 2030 2035 2040 2045 2050 '90-'00 '00-'10 '10-'20 '20-'30 '30-'40 '40-'50
Annual % ChangeMain Energy System IndicatorsPopulation (Million) 470,388 477,010 481,072 489,211 499,389 507,727 513,838 517,811 519,942 520,654 520,103 518,362 515,303 0,2 0,4 0,3 0,1 0,0 -0,1GDP (in 000 MEuro'05) 8142,7 8748,4 10107,2 11063,1 11385,6 12750,3 14164,0 15503,7 16824,7 18157,1 19527,9 21002,9 22560,0 2,2 1,2 2,2 1,7 1,5 1,5Gross Inl. Cons./GDP (toe/MEuro'05) 203,9 190,0 170,5 165,1 155,9 141,7 127,1 115,7 103,9 96,8 91,3 86,0 80,3 -1,8 -0,9 -2,0 -2,0 -1,3 -1,3Gross Inl. Cons./Capita (toe/inhabitant) 3,53 3,49 3,58 3,73 3,55 3,56 3,50 3,47 3,36 3,38 3,43 3,48 3,52 0,1 -0,1 -0,1 -0,4 0,2 0,3Electricity Generated/Capita (kWh gross/inhabitant) 5448 5686 6219 6693 6827 7051 7195 7551 7699 8079 8573 9024 9394 1,3 0,9 0,5 0,7 1,1 0,9Carbon intensity (t of CO2/toe of GIC) 2,43 2,29 2,21 2,16 2,13 2,03 1,91 1,87 1,75 1,63 1,52 1,43 1,41 -0,9 -0,4 -1,0 -0,9 -1,4 -0,7CO2 Emissions/Capita (t of CO2/inhabitant) 8,57 7,97 7,92 8,07 7,55 7,22 6,70 6,48 5,87 5,52 5,20 4,99 4,96 -0,8 -0,5 -1,2 -1,3 -1,2 -0,5CO2 Emissions to GDP (t of CO2/MEuro'05) 495,0 434,4 377,0 356,7 331,3 287,5 243,0 216,5 181,4 158,1 138,6 123,2 113,3 -2,7 -1,3 -3,1 -2,9 -2,7 -2,0Import Dependency % 44,6 43,5 46,8 52,5 53,7 56,6 58,2 59,4 58,8 59,0 59,7 60,6 62,2
Energy intensity indicators (2000=100)Industry (Energy on Value added) 130,3 115,2 100,0 95,1 90,3 85,0 79,2 73,8 68,8 65,2 62,6 60,3 58,3 -2,6 -1,0 -1,3 -1,4 -0,9 -0,7Residential (Energy on Private Income) 114,4 113,2 100,0 97,5 96,9 90,5 82,8 74,3 67,9 62,0 57,5 53,0 49,0 -1,3 -0,3 -1,6 -2,0 -1,6 -1,6Tertiary (Energy on Value added) 126,5 117,0 100,0 99,4 94,7 88,0 79,7 72,2 65,0 61,6 58,2 55,0 51,3 -2,3 -0,5 -1,7 -2,0 -1,1 -1,3Transport (Energy on GDP) 102,5 102,3 100,0 97,6 96,8 90,6 84,6 76,6 67,5 63,0 59,3 55,5 52,0 -0,2 -0,3 -1,3 -2,2 -1,3 -1,3
Carbon Intensity indicatorsElectricity and Steam production (t of CO2/MWh) 0,46 0,40 0,37 0,35 0,32 0,27 0,22 0,20 0,16 0,13 0,09 0,07 0,06 -2,1 -1,5 -3,7 -2,9 -5,8 -4,2Final energy demand (t of CO2/toe) 2,24 2,16 2,08 2,03 1,93 1,85 1,80 1,77 1,72 1,69 1,68 1,66 1,65 -0,7 -0,8 -0,7 -0,5 -0,2 -0,1
Industry 2,14 2,06 1,91 1,78 1,58 1,49 1,43 1,40 1,36 1,32 1,30 1,29 1,28 -1,1 -1,9 -1,0 -0,6 -0,4 -0,1Residential 1,89 1,72 1,63 1,58 1,51 1,45 1,38 1,34 1,29 1,27 1,24 1,21 1,17 -1,5 -0,7 -0,9 -0,6 -0,4 -0,6Tertiary 1,90 1,72 1,51 1,48 1,40 1,30 1,24 1,19 1,13 1,09 1,05 1,02 0,99 -2,2 -0,8 -1,2 -1,0 -0,7 -0,5Transport 2,90 2,90 2,91 2,91 2,83 2,76 2,70 2,71 2,67 2,67 2,68 2,69 2,71 0,0 -0,3 -0,5 -0,1 0,0 0,1
Electricity and steam generationNet Generation Capacity in MWe 654125 715732 820280 921348 1023474 1056112 1142278 1217909 1289022 1363389 1420771 2,3 2,2 1,1 1,2 1,0
Nuclear energy 133923 134409 127038 126752 123686 112747 120786 129753 132911 142885 148596 -0,5 -0,3 -0,2 1,0 1,1Renewable energy 112878 147262 209088 283884 411814 459889 534502 580889 610823 637242 661705 6,4 7,0 2,6 1,3 0,8
Hydro (pumping excluded) 99714 104505 107315 110988 114516 115937 117729 119058 119329 120119 121318 0,7 0,7 0,3 0,1 0,2Wind 12793 40584 86217 144412 236694 268564 316027 340123 352348 362424 368159 21,0 10,6 2,9 1,1 0,4Solar 371 2172 15307 27909 58929 72536 96607 117366 134433 149503 166320 45,1 14,4 5,1 3,4 2,2Other renewables (tidal etc.) 0 1 249 575 1675 2851 4139 4343 4713 5195 5909 21,0 9,5 1,3 2,3
Thermal power 407324 434061 484154 510712 487974 483476 486990 507267 545287 583263 610470 1,7 0,1 0,0 1,1 1,1of which cogeneration units 76231 85773 100282 113030 117658 126719 132441 146772 158341 177742 194205 2,8 1,6 1,2 1,8 2,1of which CCS units 0 0 0 0 5394 10547 12181 27806 64438 102927 122123 8,5 18,1 6,6
Solids fired 194165 186620 183751 182050 160820 142964 126571 116771 122803 117902 115620 -0,5 -1,3 -2,4 -0,3 -0,6Gas fired 129444 167173 219380 238037 229889 229407 244098 272068 281696 277550 245965 5,4 0,5 0,6 1,4 -1,3Oil fired 71058 62082 56075 45479 34571 41608 42386 42493 59561 101212 157275 -2,3 -4,7 2,1 3,5 10,2Biomass-waste fired 12051 17502 24165 44345 61860 68606 72982 74948 80199 85563 90566 7,2 9,9 1,7 0,9 1,2Hydrogen plants 0 0 0 0 0 0 0 0 0 0 0Geothermal heat 605 684 783 801 834 891 952 986 1028 1036 1043 2,6 0,6 1,3 0,8 0,1
Load factor for net electric capacities (%) 49,1 49,1 45,1 42,3 39,4 40,2 38,2 37,6 37,2 36,7 36,3Indicators for gross electricity productionEfficiency for thermal electricity production (%) 37,6 38,5 39,3 40,0 40,3 40,4 40,6 41,8 43,9 45,1 46,0CHP indicator (% of electricity from CHP) 11,4 11,7 15,0 17,9 18,7 19,0 18,9 20,6 21,1 21,7 22,1CCS indicator (% of electricity from CCS) 0,0 0,0 0,0 0,0 1,5 2,9 3,1 6,4 13,4 19,4 21,5Non fossil fuels in electricity generation (%) 45,8 44,8 45,9 50,8 57,1 58,7 64,1 66,3 65,7 65,8 65,6 - nuclear 31,6 30,5 27,2 25,9 22,4 22,2 23,4 24,6 24,1 25,0 24,9 - renewable energy forms and industrial waste 14,2 14,3 18,8 24,9 34,8 36,5 40,6 41,8 41,6 40,9 40,6Indicators for renewables (excluding industrial waste) (%) (B)
RES in gross final energy demand (%) 7,6 8,6 11,4 15,2 20,2 20,4 22,5 22,9 23,2 23,1 23,2RES in transport (%) 0,5 1,4 4,3 7,4 10,3 10,3 11,9 11,9 11,5 11,0 10,3
Transport sectorPassenger transport activity (Gpkm) 4880,7 5307,7 5892,2 6240,3 6511,3 7140,9 7690,4 8182,1 8580,0 8972,1 9321,7 9617,5 9879,6 1,9 1,0 1,7 1,1 0,8 0,6
Public road transport 544,0 504,0 517,6 526,0 545,0 574,2 602,4 625,8 644,2 660,1 673,6 684,2 692,3 -0,5 0,5 1,0 0,7 0,4 0,3Private cars and motorcycles 3501,1 3986,3 4428,1 4686,5 4866,1 5297,5 5650,2 5949,8 6173,9 6423,4 6632,9 6800,4 6942,1 2,4 0,9 1,5 0,9 0,7 0,5Rail 472,5 421,7 447,9 461,0 482,5 525,7 567,8 608,7 645,4 682,1 718,3 748,6 772,1 -0,5 0,7 1,6 1,3 1,1 0,7Aviation 317,3 351,3 456,9 527,3 576,9 701,2 826,2 952,4 1070,1 1158,9 1248,3 1334,9 1423,0 3,7 2,4 3,7 2,6 1,6 1,3Inland navigation 45,8 44,4 41,7 39,5 40,8 42,3 43,9 45,3 46,5 47,6 48,6 49,4 50,1 -0,9 -0,2 0,7 0,6 0,4 0,3
Travel per person (km per capita) 10376 11127 12248 12756 13039 14065 14967 15801 16502 17232 17923 18554 19172 1,7 0,6 1,4 1,0 0,8 0,7
Freight transport activity (Gtkm) 1848,4 1942,4 2195,7 2494,6 2662,6 2961,6 3182,1 3379,3 3524,0 3678,5 3826,3 3949,6 4057,5 1,7 1,9 1,8 1,0 0,8 0,6Trucks 1060,4 1288,7 1518,7 1800,3 1940,3 2174,2 2339,1 2490,5 2599,1 2720,7 2838,4 2938,3 3027,8 3,7 2,5 1,9 1,1 0,9 0,6Rail 526,3 386,1 403,7 414,1 440,5 489,1 526,9 557,0 580,9 603,0 624,1 640,9 655,2 -2,6 0,9 1,8 1,0 0,7 0,5Inland navigation 261,6 267,6 273,3 280,2 281,9 298,3 316,0 331,8 343,9 354,8 363,8 370,4 374,5 0,4 0,3 1,1 0,8 0,6 0,3
Freight activity per unit of GDP (tkm/000 Euro'05) 227 222 217 225 234 232 225 218 209 203 196 188 180 -0,4 0,7 -0,4 -0,7 -0,7 -0,9Energy demand in transport (ktoe) 280269 300617 339389 362405 370012 387924 402308 398891 381461 383956 388710 391208 393577 1,9 0,9 0,8 -0,5 0,2 0,1
Public road transport 5197 4732 4914 5039 5182 5319 5311 5226 5090 5082 5053 4936 4768 -0,6 0,5 0,2 -0,4 -0,1 -0,6Private cars and motorcycles 154395 166321 182974 187736 186451 185094 184719 173681 160250 158300 156630 153803 151794 1,7 0,2 -0,1 -1,4 -0,2 -0,3Trucks 74969 79037 90951 105104 111606 123709 129281 132593 131836 135348 138852 141269 143835 2,0 2,1 1,5 0,2 0,5 0,4Rail 9560 9452 9600 9436 9597 10138 10045 9743 8560 8454 8584 8631 8608 0,0 0,0 0,5 -1,6 0,0 0,0Aviation 29038 34112 45395 49703 51709 57983 66990 71421 69319 70206 72895 75789 77753 4,6 1,3 2,6 0,3 0,5 0,6Inland navigation 7110 6963 5555 5386 5466 5681 5962 6228 6407 6566 6697 6780 6819 -2,4 -0,2 0,9 0,7 0,4 0,2
Efficiency indicator (activity related)Passenger transport (toe/Mpkm) 39,6 39,5 40,3 39,5 38,0 35,4 34,0 31,1 27,9 26,5 25,6 24,8 24,2 0,2 -0,6 -1,1 -2,0 -0,8 -0,6Freight transport (toe/Mtkm) 47,1 46,8 46,3 46,5 46,1 45,7 44,4 42,7 40,4 39,7 39,1 38,6 38,2 -0,2 -0,1 -0,4 -0,9 -0,3 -0,2
EU27: Reference scenario with low world energy prices

Reference scenario with High energy import prices - 60
Reference scenario with High energy import prices
SUMMARY ENERGY BALANCE AND INDICATORS (A) ktoe 1990 1995 2000 2005 2010 2015 2020 2025 2030 2035 2040 2045 2050 '90-'00 '00-'10 '10-'20 '20-'30 '30-'40 '40-'50
Annual % ChangeProduction 936047 950181 941860 900326 845064 817644 811737 802723 806224 819143 828965 830368 808009 0,1 -1,1 -0,4 -0,1 0,3 -0,3
Solids 366477 277810 213423 196277 182270 168669 150313 143980 124519 118672 122786 125237 121804 -5,3 -1,6 -1,9 -1,9 -0,1 -0,1Oil 129551 171052 173006 134290 104398 76134 50651 41472 37934 32861 26090 17729 8791 2,9 -4,9 -7,0 -2,8 -3,7 -10,3Natural gas 162447 188965 207559 188677 164866 129314 111043 90249 73816 62450 50163 35926 28407 2,5 -2,3 -3,9 -4,0 -3,8 -5,5Nuclear 202589 223028 243761 257360 238928 239919 232763 240570 259190 285393 299892 314633 307768 1,9 -0,2 -0,3 1,1 1,5 0,3Renewable energy sources 74984 89326 104111 123722 154603 203608 266968 286451 310764 319767 330034 336842 341239 3,3 4,0 5,6 1,5 0,6 0,3
Hydro 25101 28054 30374 26395 27809 28656 29340 30157 30709 31057 31432 31770 32037 1,9 -0,9 0,5 0,5 0,2 0,2Biomass & Waste 46473 57201 67982 85129 102686 129128 158774 165107 169467 166943 168423 168652 165401 3,9 4,2 4,5 0,7 -0,1 -0,2Wind 67 350 1913 6061 13850 28279 48857 58566 72773 79868 84707 87539 91473 39,8 21,9 13,4 4,1 1,5 0,8Solar and others 153 274 421 807 3426 9777 20392 22915 27915 31657 34964 38294 41603 10,7 23,3 19,5 3,2 2,3 1,8Geothermal 3190 3447 3421 5331 6832 7769 9605 9706 9899 10242 10508 10588 10724 0,7 7,2 3,5 0,3 0,6 0,2
Net Imports 756079 738600 826299 986048 979634 996340 976160 969612 934871 930538 939404 958614 976996 0,9 1,7 0,0 -0,4 0,0 0,4Solids 81846 79338 98645 126639 121083 125097 114259 119071 94503 75261 73956 80428 82826 1,9 2,1 -0,6 -1,9 -2,4 1,1Oil 535645 512185 533039 599851 581740 570199 570016 574724 555108 565209 571220 578921 589646 0,0 0,9 -0,2 -0,3 0,3 0,3 - Crude oil and Feedstocks 508460 494000 513725 581995 579069 582182 587445 593537 577975 587962 594853 603766 614849 0,1 1,2 0,1 -0,2 0,3 0,3 - Oil products 27185 18185 19314 17856 2671 -11983 -17429 -18813 -22867 -22753 -23633 -24845 -25203 -3,4 -18,0Natural gas 135121 145288 192531 257366 272703 291744 270028 261629 269564 272811 274291 276043 277755 3,6 3,5 -0,1 0,0 0,2 0,1Electricity 3323 1508 1686 971 264 -544 -1754 -1942 -2080 -2327 -2342 -2395 -2487 -6,6 -16,9Renewable energy forms 144 279 397 1222 3844 9844 23611 16129 17776 19584 22280 25618 29256 10,7 25,5 19,9 -2,8 2,3 2,8
Gross Inland Consumption 1660159 1662517 1723099 1825989 1774646 1763688 1736895 1719762 1687461 1694492 1712132 1732055 1727780 0,4 0,3 -0,2 -0,3 0,1 0,1Solids 452940 364248 321007 319922 303353 293765 264572 263052 219023 193933 196742 205665 204631 -3,4 -0,6 -1,4 -1,9 -1,1 0,4Oil 631058 650858 658727 676859 636086 596037 569665 563624 539408 542881 541072 539723 541212 0,4 -0,3 -1,1 -0,5 0,0 0,0Natural gas 294905 333268 393417 445998 437569 421058 381071 351878 343380 335262 324454 311969 306162 2,9 1,1 -1,4 -1,0 -0,6 -0,6Nuclear 202589 223028 243761 257360 238928 239919 232763 240570 259190 285393 299892 314633 307768 1,9 -0,2 -0,3 1,1 1,5 0,3Electricity 3323 1508 1686 971 264 -544 -1754 -1942 -2080 -2327 -2342 -2395 -2487 -6,6 -16,9Renewable energy forms 75343 89606 104501 124880 158447 213452 290578 302580 328540 339351 352313 362460 370494 3,3 4,3 6,3 1,2 0,7 0,5
as % in Gross Inland ConsumptionSolids 27,3 21,9 18,6 17,5 17,1 16,7 15,2 15,3 13,0 11,4 11,5 11,9 11,8Oil 38,0 39,1 38,2 37,1 35,8 33,8 32,8 32,8 32,0 32,0 31,6 31,2 31,3Natural gas 17,8 20,0 22,8 24,4 24,7 23,9 21,9 20,5 20,3 19,8 19,0 18,0 17,7Nuclear 12,2 13,4 14,1 14,1 13,5 13,6 13,4 14,0 15,4 16,8 17,5 18,2 17,8Renewable energy forms 4,5 5,4 6,1 6,8 8,9 12,1 16,7 17,6 19,5 20,0 20,6 20,9 21,4
Gross Electricity Generation in GWhe 2562823 2712209 2991720 3274121 3407994 3649338 3829651 4022391 4103132 4315174 4551703 4780126 4952373 1,6 1,3 1,2 0,7 1,0 0,8Nuclear 794718 881662 944823 997519 926585 931441 909499 955534 1042329 1158788 1223333 1317803 1358930 1,7 -0,2 -0,2 1,4 1,6 1,1Hydro & wind 292648 330306 375545 378836 501843 695188 981856 1126533 1343293 1465093 1561740 1637554 1723986 2,5 2,9 6,9 3,2 1,5 1,0Thermal (incl. biomass) 1475456 1500241 1671352 1897765 1979566 2022709 1938295 1940325 1717510 1691293 1766629 1824769 1869457 1,3 1,7 -0,2 -1,2 0,3 0,6
Fuel Inputs for Thermal Power Generation 383492 362334 382613 424208 433841 438221 416849 417554 375542 353660 356466 360088 362549 0,0 1,3 -0,4 -1,0 -0,5 0,2Solids 263837 230040 223012 229245 232197 226359 203525 204145 165170 141391 143479 150650 149576 -1,7 0,4 -1,3 -2,1 -1,4 0,4Oil (including refinery gas) 54404 51463 39294 29780 17272 18159 10913 14759 16135 18128 20317 22824 23408 -3,2 -7,9 -4,5 4,0 2,3 1,4Gas 56754 67806 102408 134637 143441 136528 122263 112413 103910 104935 100885 94232 96430 6,1 3,4 -1,6 -1,6 -0,3 -0,5Biomass & Waste 5724 10033 14960 25901 35103 51226 73957 79613 83240 81838 84102 84642 85338 10,1 8,9 7,7 1,2 0,1 0,1Geothermal heat 2774 2992 2939 4645 5828 5948 6192 6624 7087 7367 7683 7741 7796 0,6 7,1 0,6 1,4 0,8 0,1Hydrogen - Methanol 0 0 0 0 0 0 0 0 0 0 0 0 0
Fuel Input in other transformation proc. 839073 814654 827098 842975 794172 776152 761745 754684 735363 739846 740552 741618 742387 -0,1 -0,4 -0,4 -0,4 0,1 0,0Refineries 679426 705954 735244 758152 718914 692861 670292 666502 645621 650704 650516 650617 652619 0,8 -0,2 -0,7 -0,4 0,1 0,0Biofuels and hydrogen production 2 202 610 3129 12210 23763 35550 35146 39958 40788 41351 41636 41566 79,6 34,9 11,3 1,2 0,3 0,1District heating 32960 23240 19323 16212 15753 15139 15502 14613 14811 14766 14058 13524 13189 -5,2 -2,0 -0,2 -0,5 -0,5 -0,6Others 126685 85258 71921 65482 47295 44389 40401 38422 34973 33588 34627 35841 35013 -5,5 -4,1 -1,6 -1,4 -0,1 0,1
Energy Branch Consumption 82379 88696 88176 96033 92137 87501 85947 84593 79313 81018 83550 85872 86160 0,7 0,4 -0,7 -0,8 0,5 0,3Non-Energy Uses 97931 110541 112495 117477 111501 113287 112238 113456 114233 115811 116974 118021 118943 1,4 -0,1 0,1 0,2 0,2 0,2Final Energy Demand 1068710 1069989 1112989 1173676 1165705 1174920 1175499 1160215 1146712 1160317 1171818 1186237 1192996 0,4 0,5 0,1 -0,2 0,2 0,2by sectorIndustry 365650 328513 326949 326308 312250 318093 322166 323799 324906 331579 341702 353194 364625 -1,1 -0,5 0,3 0,1 0,5 0,7 - energy intensive industries 234722 214526 213112 210991 193108 193323 192248 190048 187681 188143 190297 193252 195353 -1,0 -1,0 0,0 -0,2 0,1 0,3 - other industrial sectors 130928 113987 113837 115317 119142 124770 129918 133752 137225 143435 151406 159943 169272 -1,4 0,5 0,9 0,5 1,0 1,1Residential 264307 280418 286784 308104 308348 309577 302416 287509 283321 282620 281006 280748 277506 0,8 0,7 -0,2 -0,7 -0,1 -0,1Tertiary 158484 160442 159866 176859 175094 175481 170920 167882 164661 167797 169952 172634 172323 0,1 0,9 -0,2 -0,4 0,3 0,1Transport 280269 300617 339389 362405 370013 371769 379996 381024 373824 378321 379157 379661 378542 1,9 0,9 0,3 -0,2 0,1 0,0by fuel
Solids 125031 84977 61454 54486 47150 45242 41185 39623 35511 34847 35271 37068 37325 -6,9 -2,6 -1,3 -1,5 -0,1 0,6Oil 444429 456959 478882 495857 476489 445159 431408 426242 406172 410602 409732 409357 407578 0,7 -0,1 -1,0 -0,6 0,1 -0,1Gas 227902 245996 265552 283524 265148 251152 223763 202020 199347 189879 183030 180174 173591 1,5 0,0 -1,7 -1,1 -0,9 -0,5Electricity 184145 193367 216403 237537 248253 267293 279771 293982 301562 315775 331364 346422 358647 1,6 1,4 1,2 0,8 0,9 0,8Heat (from CHP and District Heating) (A) 48610 44616 40061 44441 59296 74882 79075 84024 86377 91915 94315 96906 99536 -1,9 4,0 2,9 0,9 0,9 0,5Other 38592 44073 50640 57832 69369 91192 120297 114324 117742 117298 118106 116311 116319 2,8 3,2 5,7 -0,2 0,0 -0,2
CO2 Emissions (Mt of CO2 - sec approach) 4030,6 3800,1 3810,6 3946,6 3769,7 3573,0 3257,4 3163,1 2889,4 2675,0 2503,8 2397,4 2335,4 -0,6 -0,1 -1,4 -1,2 -1,4 -0,7Power generation/District heating 1484,3 1321,2 1320,8 1381,1 1364,3 1323,0 1142,1 1130,6 953,1 764,1 617,4 524,3 484,6 -1,2 0,3 -1,8 -1,8 -4,2 -2,4Energy Branch 152,2 171,0 170,2 181,6 157,6 138,2 126,1 117,1 105,1 91,2 83,5 66,8 63,7 1,1 -0,8 -2,2 -1,8 -2,3 -2,7Industry 781,4 678,1 623,0 581,9 489,9 449,0 418,1 396,0 382,3 373,3 377,1 396,3 404,9 -2,2 -2,4 -1,6 -0,9 -0,1 0,7Residential 499,4 481,6 466,2 486,7 465,0 426,5 373,0 331,0 312,8 304,9 291,7 280,8 263,6 -0,7 0,0 -2,2 -1,7 -0,7 -1,0Tertiary 300,5 275,3 242,0 262,2 244,5 217,6 190,9 177,9 163,8 158,9 150,9 145,4 137,8 -2,1 0,1 -2,4 -1,5 -0,8 -0,9Transport 812,7 872,9 988,5 1053,1 1048,3 1018,8 1007,2 1010,5 972,2 982,6 983,2 983,8 980,8 2,0 0,6 -0,4 -0,4 0,1 0,0
CO2 Emissions Index (1990=100) 100,0 94,3 94,5 97,9 93,5 88,6 80,8 78,5 71,7 66,4 62,1 59,5 57,9CO2 Emissions (Mt of CO2 - ref approach) 4172,0 3950,7 3922,7 4087,6 3835,6 3637,6 3325,0 3227,5 2957,6 2741,6 2568,2 2459,9 2402,7 -0,6 -0,2 -1,4 -1,2 -1,4 -0,7
EU27: Reference scenario with high world energy prices
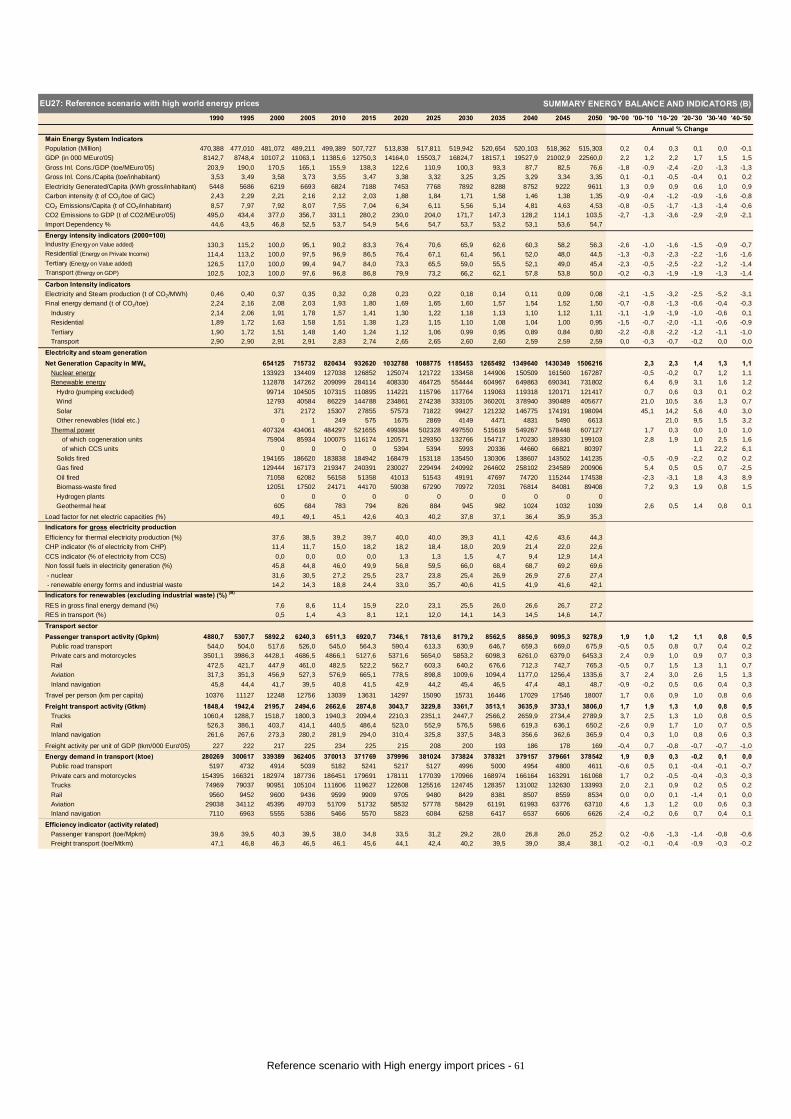
Reference scenario with High energy import prices - 61
SUMMARY ENERGY BALANCE AND INDICATORS (B)1990 1995 2000 2005 2010 2015 2020 2025 2030 2035 2040 2045 2050 '90-'00 '00-'10 '10-'20 '20-'30 '30-'40 '40-'50
Annual % ChangeMain Energy System IndicatorsPopulation (Million) 470,388 477,010 481,072 489,211 499,389 507,727 513,838 517,811 519,942 520,654 520,103 518,362 515,303 0,2 0,4 0,3 0,1 0,0 -0,1GDP (in 000 MEuro'05) 8142,7 8748,4 10107,2 11063,1 11385,6 12750,3 14164,0 15503,7 16824,7 18157,1 19527,9 21002,9 22560,0 2,2 1,2 2,2 1,7 1,5 1,5Gross Inl. Cons./GDP (toe/MEuro'05) 203,9 190,0 170,5 165,1 155,9 138,3 122,6 110,9 100,3 93,3 87,7 82,5 76,6 -1,8 -0,9 -2,4 -2,0 -1,3 -1,3Gross Inl. Cons./Capita (toe/inhabitant) 3,53 3,49 3,58 3,73 3,55 3,47 3,38 3,32 3,25 3,25 3,29 3,34 3,35 0,1 -0,1 -0,5 -0,4 0,1 0,2Electricity Generated/Capita (kWh gross/inhabitant) 5448 5686 6219 6693 6824 7188 7453 7768 7892 8288 8752 9222 9611 1,3 0,9 0,9 0,6 1,0 0,9Carbon intensity (t of CO2/toe of GIC) 2,43 2,29 2,21 2,16 2,12 2,03 1,88 1,84 1,71 1,58 1,46 1,38 1,35 -0,9 -0,4 -1,2 -0,9 -1,6 -0,8CO2 Emissions/Capita (t of CO2/inhabitant) 8,57 7,97 7,92 8,07 7,55 7,04 6,34 6,11 5,56 5,14 4,81 4,63 4,53 -0,8 -0,5 -1,7 -1,3 -1,4 -0,6CO2 Emissions to GDP (t of CO2/MEuro'05) 495,0 434,4 377,0 356,7 331,1 280,2 230,0 204,0 171,7 147,3 128,2 114,1 103,5 -2,7 -1,3 -3,6 -2,9 -2,9 -2,1Import Dependency % 44,6 43,5 46,8 52,5 53,7 54,9 54,6 54,7 53,7 53,2 53,1 53,6 54,7
Energy intensity indicators (2000=100)Industry (Energy on Value added) 130,3 115,2 100,0 95,1 90,2 83,3 76,4 70,6 65,9 62,6 60,3 58,2 56,3 -2,6 -1,0 -1,6 -1,5 -0,9 -0,7Residential (Energy on Private Income) 114,4 113,2 100,0 97,5 96,9 86,5 76,4 67,1 61,4 56,1 52,0 48,0 44,5 -1,3 -0,3 -2,3 -2,2 -1,6 -1,6Tertiary (Energy on Value added) 126,5 117,0 100,0 99,4 94,7 84,0 73,3 65,5 59,0 55,5 52,1 49,0 45,4 -2,3 -0,5 -2,5 -2,2 -1,2 -1,4Transport (Energy on GDP) 102,5 102,3 100,0 97,6 96,8 86,8 79,9 73,2 66,2 62,1 57,8 53,8 50,0 -0,2 -0,3 -1,9 -1,9 -1,3 -1,4
Carbon Intensity indicatorsElectricity and Steam production (t of CO2/MWh) 0,46 0,40 0,37 0,35 0,32 0,28 0,23 0,22 0,18 0,14 0,11 0,09 0,08 -2,1 -1,5 -3,2 -2,5 -5,2 -3,1Final energy demand (t of CO2/toe) 2,24 2,16 2,08 2,03 1,93 1,80 1,69 1,65 1,60 1,57 1,54 1,52 1,50 -0,7 -0,8 -1,3 -0,6 -0,4 -0,3
Industry 2,14 2,06 1,91 1,78 1,57 1,41 1,30 1,22 1,18 1,13 1,10 1,12 1,11 -1,1 -1,9 -1,9 -1,0 -0,6 0,1Residential 1,89 1,72 1,63 1,58 1,51 1,38 1,23 1,15 1,10 1,08 1,04 1,00 0,95 -1,5 -0,7 -2,0 -1,1 -0,6 -0,9Tertiary 1,90 1,72 1,51 1,48 1,40 1,24 1,12 1,06 0,99 0,95 0,89 0,84 0,80 -2,2 -0,8 -2,2 -1,2 -1,1 -1,0Transport 2,90 2,90 2,91 2,91 2,83 2,74 2,65 2,65 2,60 2,60 2,59 2,59 2,59 0,0 -0,3 -0,7 -0,2 0,0 0,0
Electricity and steam generationNet Generation Capacity in MWe 654125 715732 820434 932620 1032788 1088775 1185453 1265492 1349640 1430349 1506216 2,3 2,3 1,4 1,3 1,1
Nuclear energy 133923 134409 127038 126852 125074 121722 133458 144906 150509 161560 167287 -0,5 -0,2 0,7 1,2 1,1Renewable energy 112878 147262 209099 284114 408330 464725 554444 604967 649863 690341 731802 6,4 6,9 3,1 1,6 1,2
Hydro (pumping excluded) 99714 104505 107315 110895 114221 115796 117764 119063 119318 120171 121417 0,7 0,6 0,3 0,1 0,2Wind 12793 40584 86229 144788 234861 274238 333105 360201 378940 390489 405677 21,0 10,5 3,6 1,3 0,7Solar 371 2172 15307 27855 57573 71822 99427 121232 146775 174191 198094 45,1 14,2 5,6 4,0 3,0Other renewables (tidal etc.) 0 1 249 575 1675 2869 4149 4471 4831 5490 6613 21,0 9,5 1,5 3,2
Thermal power 407324 434061 484297 521655 499384 502328 497550 515619 549267 578448 607127 1,7 0,3 0,0 1,0 1,0of which cogeneration units 75904 85934 100075 116174 120571 129350 132766 154717 170230 189330 199103 2,8 1,9 1,0 2,5 1,6of which CCS units 0 0 0 0 5394 5394 5993 20336 44660 66821 80397 1,1 22,2 6,1
Solids fired 194165 186620 183838 184942 168479 153118 135450 130306 138607 143502 141235 -0,5 -0,9 -2,2 0,2 0,2Gas fired 129444 167173 219347 240391 230027 229494 240992 264602 258102 234589 200906 5,4 0,5 0,5 0,7 -2,5Oil fired 71058 62082 56158 51358 41013 51543 49191 47697 74720 115244 174538 -2,3 -3,1 1,8 4,3 8,9Biomass-waste fired 12051 17502 24171 44170 59038 67290 70972 72031 76814 84081 89408 7,2 9,3 1,9 0,8 1,5Hydrogen plants 0 0 0 0 0 0 0 0 0 0 0Geothermal heat 605 684 783 794 826 884 945 982 1024 1032 1039 2,6 0,5 1,4 0,8 0,1
Load factor for net electric capacities (%) 49,1 49,1 45,1 42,6 40,3 40,2 37,8 37,1 36,4 35,9 35,3Indicators for gross electricity productionEfficiency for thermal electricity production (%) 37,6 38,5 39,2 39,7 40,0 40,0 39,3 41,1 42,6 43,6 44,3CHP indicator (% of electricity from CHP) 11,4 11,7 15,0 18,2 18,2 18,4 18,0 20,9 21,4 22,0 22,6CCS indicator (% of electricity from CCS) 0,0 0,0 0,0 0,0 1,3 1,3 1,5 4,7 9,4 12,9 14,4Non fossil fuels in electricity generation (%) 45,8 44,8 46,0 49,9 56,8 59,5 66,0 68,4 68,7 69,2 69,6 - nuclear 31,6 30,5 27,2 25,5 23,7 23,8 25,4 26,9 26,9 27,6 27,4 - renewable energy forms and industrial waste 14,2 14,3 18,8 24,4 33,0 35,7 40,6 41,5 41,9 41,6 42,1Indicators for renewables (excluding industrial waste) (%) (B)
RES in gross final energy demand (%) 7,6 8,6 11,4 15,9 22,0 23,1 25,5 26,0 26,6 26,7 27,2RES in transport (%) 0,5 1,4 4,3 8,1 12,1 12,0 14,1 14,3 14,5 14,6 14,7
Transport sectorPassenger transport activity (Gpkm) 4880,7 5307,7 5892,2 6240,3 6511,3 6920,7 7346,1 7813,6 8179,2 8562,5 8856,9 9095,3 9278,9 1,9 1,0 1,2 1,1 0,8 0,5
Public road transport 544,0 504,0 517,6 526,0 545,0 564,3 590,4 613,3 630,9 646,7 659,3 669,0 675,9 -0,5 0,5 0,8 0,7 0,4 0,2Private cars and motorcycles 3501,1 3986,3 4428,1 4686,5 4866,1 5127,6 5371,6 5654,0 5853,2 6098,3 6261,0 6379,0 6453,3 2,4 0,9 1,0 0,9 0,7 0,3Rail 472,5 421,7 447,9 461,0 482,5 522,2 562,7 603,3 640,2 676,6 712,3 742,7 765,3 -0,5 0,7 1,5 1,3 1,1 0,7Aviation 317,3 351,3 456,9 527,3 576,9 665,1 778,5 898,8 1009,6 1094,4 1177,0 1256,4 1335,6 3,7 2,4 3,0 2,6 1,5 1,3Inland navigation 45,8 44,4 41,7 39,5 40,8 41,5 42,9 44,2 45,4 46,5 47,4 48,1 48,7 -0,9 -0,2 0,5 0,6 0,4 0,3
Travel per person (km per capita) 10376 11127 12248 12756 13039 13631 14297 15090 15731 16446 17029 17546 18007 1,7 0,6 0,9 1,0 0,8 0,6
Freight transport activity (Gtkm) 1848,4 1942,4 2195,7 2494,6 2662,6 2874,8 3043,7 3229,8 3361,7 3513,1 3635,9 3733,1 3806,0 1,7 1,9 1,3 1,0 0,8 0,5Trucks 1060,4 1288,7 1518,7 1800,3 1940,3 2094,4 2210,3 2351,1 2447,7 2566,2 2659,9 2734,4 2789,9 3,7 2,5 1,3 1,0 0,8 0,5Rail 526,3 386,1 403,7 414,1 440,5 486,4 523,0 552,9 576,5 598,6 619,3 636,1 650,2 -2,6 0,9 1,7 1,0 0,7 0,5Inland navigation 261,6 267,6 273,3 280,2 281,9 294,0 310,4 325,8 337,5 348,3 356,6 362,6 365,9 0,4 0,3 1,0 0,8 0,6 0,3
Freight activity per unit of GDP (tkm/000 Euro'05) 227 222 217 225 234 225 215 208 200 193 186 178 169 -0,4 0,7 -0,8 -0,7 -0,7 -1,0Energy demand in transport (ktoe) 280269 300617 339389 362405 370013 371769 379996 381024 373824 378321 379157 379661 378542 1,9 0,9 0,3 -0,2 0,1 0,0
Public road transport 5197 4732 4914 5039 5182 5241 5217 5127 4996 5000 4954 4800 4611 -0,6 0,5 0,1 -0,4 -0,1 -0,7Private cars and motorcycles 154395 166321 182974 187736 186451 179691 178111 177039 170966 168974 166164 163291 161068 1,7 0,2 -0,5 -0,4 -0,3 -0,3Trucks 74969 79037 90951 105104 111606 119627 122608 125516 124745 128357 131002 132630 133993 2,0 2,1 0,9 0,2 0,5 0,2Rail 9560 9452 9600 9436 9599 9909 9705 9480 8429 8381 8507 8559 8534 0,0 0,0 0,1 -1,4 0,1 0,0Aviation 29038 34112 45395 49703 51709 51732 58532 57778 58429 61191 61993 63776 63710 4,6 1,3 1,2 0,0 0,6 0,3Inland navigation 7110 6963 5555 5386 5466 5570 5823 6084 6258 6417 6537 6606 6626 -2,4 -0,2 0,6 0,7 0,4 0,1
Efficiency indicator (activity related)Passenger transport (toe/Mpkm) 39,6 39,5 40,3 39,5 38,0 34,8 33,5 31,2 29,2 28,0 26,8 26,0 25,2 0,2 -0,6 -1,3 -1,4 -0,8 -0,6Freight transport (toe/Mtkm) 47,1 46,8 46,3 46,5 46,1 45,6 44,1 42,4 40,2 39,5 39,0 38,4 38,1 -0,2 -0,1 -0,4 -0,9 -0,3 -0,2
EU27: Reference scenario with high world energy prices

Reference scenario with High GDP- 62
Reference scenario with High GDP
SUMMARY ENERGY BALANCE AND INDICATORS (A) ktoe 1990 1995 2000 2005 2010 2015 2020 2025 2030 2035 2040 2045 2050 '90-'00 '00-'10 '10-'20 '20-'30 '30-'40 '40-'50
Annual % ChangeProduction 936047 950181 941860 900326 844795 805982 796733 793722 804699 829870 845820 851510 837989 0,1 -1,1 -0,6 0,1 0,5 -0,1
Solids 366477 277810 213423 196277 182261 166301 146303 139267 120159 117873 123351 127247 125408 -5,3 -1,6 -2,2 -1,9 0,3 0,2Oil 129551 171052 173006 134290 104398 74368 49705 41001 37493 32839 26195 17846 8973 2,9 -4,9 -7,2 -2,8 -3,5 -10,2Natural gas 162447 188965 207559 188677 164866 129073 110925 90885 74874 64386 52719 39166 29766 2,5 -2,3 -3,9 -3,9 -3,4 -5,6Nuclear 202589 223028 243761 257360 238966 240206 228713 240108 263627 296309 317134 332743 333617 1,9 -0,2 -0,4 1,4 1,9 0,5Renewable energy sources 74984 89326 104111 123722 154305 196035 261087 282462 308546 318464 326422 334508 340226 3,3 4,0 5,4 1,7 0,6 0,4
Hydro 25101 28054 30374 26395 27808 28644 29330 30146 30666 31053 31422 31760 32027 1,9 -0,9 0,5 0,4 0,2 0,2Biomass & Waste 46473 57201 67982 85129 102388 122697 154221 162033 167512 165469 165881 167713 165312 3,9 4,2 4,2 0,8 -0,1 0,0Wind 67 350 1913 6061 13850 27893 48425 58176 72406 79767 83465 86748 91095 39,8 21,9 13,3 4,1 1,4 0,9Solar and others 153 274 421 807 3426 9356 20069 22772 28368 32197 35350 37880 41257 10,7 23,3 19,3 3,5 2,2 1,6Geothermal 3190 3447 3421 5331 6833 7444 9041 9335 9594 9979 10304 10407 10535 0,7 7,2 2,8 0,6 0,7 0,2
Net Imports 756079 738600 826299 986048 980018 1057089 1074775 1073938 1041883 1047990 1073402 1108378 1139953 0,9 1,7 0,9 -0,3 0,3 0,6Solids 81846 79338 98645 126639 121884 122639 115056 123838 94444 86849 95985 98324 104049 1,9 2,1 -0,6 -2,0 0,2 0,8Oil 535645 512185 533039 599851 581718 611820 627907 623035 606259 613906 623192 638522 653294 0,0 0,9 0,8 -0,4 0,3 0,5 - Crude oil and Feedstocks 508460 494000 513725 581995 579041 613293 633140 632742 619281 627290 636576 651754 666926 0,1 1,2 0,9 -0,2 0,3 0,5 - Oil products 27185 18185 19314 17856 2678 -1473 -5233 -9706 -13021 -13384 -13384 -13233 -13633 -3,4 -17,9Natural gas 135121 145288 192531 257366 272319 315863 313499 313865 326151 330246 334777 348769 356333 3,6 3,5 1,4 0,4 0,3 0,6Electricity 3323 1508 1686 971 264 -544 -1754 -1942 -2080 -2327 -2342 -2395 -2487 -6,6 -16,9Renewable energy forms 144 279 397 1222 3834 7311 20067 15142 17109 19317 21790 25158 28765 10,7 25,4 18,0 -1,6 2,4 2,8
Gross Inland Consumption 1660159 1662517 1723099 1825989 1774762 1811013 1817263 1811162 1787554 1816497 1855568 1894099 1910524 0,4 0,3 0,2 -0,2 0,4 0,3Solids 452940 364248 321007 319922 304145 288940 261360 263105 214603 204722 219336 225571 229456 -3,4 -0,5 -1,5 -2,0 0,2 0,5Oil 631058 650858 658727 676859 636065 634131 623367 607538 584725 585381 585733 590579 594848 0,4 -0,3 -0,2 -0,6 0,0 0,2Natural gas 294905 333268 393417 445998 437184 444936 424424 404750 401026 394632 387496 387935 386099 2,9 1,1 -0,3 -0,6 -0,3 0,0Nuclear 202589 223028 243761 257360 238966 240206 228713 240108 263627 296309 317134 332743 333617 1,9 -0,2 -0,4 1,4 1,9 0,5Electricity 3323 1508 1686 971 264 -544 -1754 -1942 -2080 -2327 -2342 -2395 -2487 -6,6 -16,9Renewable energy forms 75343 89606 104501 124880 158139 203345 281154 297604 325654 337781 348212 359665 368991 3,3 4,2 5,9 1,5 0,7 0,6
as % in Gross Inland ConsumptionSolids 27,3 21,9 18,6 17,5 17,1 16,0 14,4 14,5 12,0 11,3 11,8 11,9 12,0Oil 38,0 39,1 38,2 37,1 35,8 35,0 34,3 33,5 32,7 32,2 31,6 31,2 31,1Natural gas 17,8 20,0 22,8 24,4 24,6 24,6 23,4 22,3 22,4 21,7 20,9 20,5 20,2Nuclear 12,2 13,4 14,1 14,1 13,5 13,3 12,6 13,3 14,7 16,3 17,1 17,6 17,5Renewable energy forms 4,5 5,4 6,1 6,8 8,9 11,2 15,5 16,4 18,2 18,6 18,8 19,0 19,3
Gross Electricity Generation in GWhe 2562823 2712209 2991720 3274121 3409095 3621318 3828968 4091878 4228912 4537561 4857644 5154945 5386239 1,6 1,3 1,2 1,0 1,4 1,0Nuclear 794718 881662 944823 997519 926731 932507 893541 953446 1060642 1206092 1298803 1400788 1475992 1,7 -0,2 -0,4 1,7 2,0 1,3Hydro & wind 292648 330306 375545 378836 501839 690568 975998 1120891 1341556 1465426 1545707 1615257 1705595 2,5 2,9 6,9 3,2 1,4 1,0Thermal (incl. biomass) 1475456 1500241 1671352 1897765 1980524 1998244 1959429 2017541 1826713 1866043 2013134 2138899 2204651 1,3 1,7 -0,1 -0,7 1,0 0,9
Fuel Inputs for Thermal Power Generation 383492 362334 382613 424208 434107 430405 418618 427545 388791 383108 399468 411556 418690 0,0 1,3 -0,4 -0,7 0,3 0,5Solids 263837 230040 223012 229245 232504 218931 194258 198294 154921 146530 159714 163990 167715 -1,7 0,4 -1,8 -2,2 0,3 0,5Oil (including refinery gas) 54404 51463 39294 29780 17334 16556 11415 14021 14737 17472 20189 23532 24049 -3,2 -7,9 -4,1 2,6 3,2 1,8Gas 56754 67806 102408 134637 143332 139894 131289 125399 124477 124863 123931 126928 127935 6,1 3,4 -0,9 -0,5 0,0 0,3Biomass & Waste 5724 10033 14960 25901 35109 49098 75487 83207 87570 86876 87928 89343 91171 10,1 8,9 8,0 1,5 0,0 0,4Geothermal heat 2774 2992 2939 4645 5828 5925 6169 6624 7086 7366 7706 7763 7819 0,6 7,1 0,6 1,4 0,8 0,1Hydrogen - Methanol 0 0 0 0 0 0 0 0 0 0 0 0 0
Fuel Input in other transformation proc. 839073 814654 827098 842975 794418 806148 810199 799928 779857 783664 787709 795474 800639 -0,1 -0,4 0,2 -0,4 0,1 0,2Refineries 679426 705954 735244 758152 718881 723084 717498 707606 689558 692938 695366 702005 708441 0,8 -0,2 0,0 -0,4 0,1 0,2Biofuels and hydrogen production 2 202 610 3129 12210 19684 30839 32756 36418 38224 39050 39460 39487 79,6 34,9 9,7 1,7 0,7 0,1District heating 32960 23240 19323 16212 15817 16087 16095 15726 14180 13407 12900 12828 12598 -5,2 -2,0 0,2 -1,3 -0,9 -0,2Others 126685 85258 71921 65482 47510 47293 45766 43839 39701 39095 40393 41180 40113 -5,5 -4,1 -0,4 -1,4 0,2 -0,1
Energy Branch Consumption 82379 88696 88176 96033 92198 90788 90471 89968 85921 88889 93395 96777 98155 0,7 0,4 -0,2 -0,5 0,8 0,5Non-Energy Uses 97931 110541 112495 117477 111500 115433 119102 121307 123892 126644 129190 131854 134077 1,4 -0,1 0,7 0,4 0,4 0,4Final Energy Demand 1068710 1069989 1112989 1173676 1165859 1218531 1246318 1234451 1225255 1245750 1266720 1294011 1310550 0,4 0,5 0,7 -0,2 0,3 0,3by sectorIndustry 365650 328513 326949 326308 312372 322924 333322 339324 344326 356127 372071 389175 405600 -1,1 -0,5 0,7 0,3 0,8 0,9 - energy intensive industries 234722 214526 213112 210991 193231 196619 199939 199567 199113 201995 207814 212529 216414 -1,0 -1,0 0,3 0,0 0,4 0,4 - other industrial sectors 130928 113987 113837 115317 119142 126305 133383 139757 145213 154132 164258 176646 189186 -1,4 0,5 1,1 0,9 1,2 1,4Residential 264307 280418 286784 308104 308383 322112 323297 309148 304520 302824 298664 298297 293592 0,8 0,7 0,5 -0,6 -0,2 -0,2Tertiary 158484 160442 159866 176859 175093 183577 185456 184433 184752 190957 197191 203880 207732 0,1 0,9 0,6 0,0 0,7 0,5Transport 280269 300617 339389 362405 370011 389918 404242 401547 391657 395841 398794 402658 403627 1,9 0,9 0,9 -0,3 0,2 0,1by fuel
Solids 125031 84977 61454 54486 47491 46096 44227 42397 38492 37764 38962 41320 41896 -6,9 -2,5 -0,7 -1,4 0,1 0,7Oil 444429 456959 478882 495857 476571 478214 474500 460227 440224 441351 442253 446490 446418 0,7 0,0 0,0 -0,7 0,0 0,1Gas 227902 245996 265552 283524 264953 273631 258825 242087 237168 228479 221069 217048 213656 1,5 0,0 -0,2 -0,9 -0,7 -0,3Electricity 184145 193367 216403 237537 248326 265073 279453 298023 309264 329949 350504 370481 386639 1,6 1,4 1,2 1,0 1,3 1,0Heat (from CHP and District Heating) (A) 48610 44616 40061 44441 59517 71959 79203 85228 88610 95932 100990 104078 106474 -1,9 4,0 2,9 1,1 1,3 0,5Other 38592 44073 50640 57832 69001 83557 110108 106489 111496 112276 112941 114593 115468 2,8 3,1 4,8 0,1 0,1 0,2
CO2 Emissions (Mt of CO2 - sec approach) 4030,6 3800,1 3810,6 3946,6 3771,8 3714,7 3482,3 3342,8 3018,1 2804,4 2649,7 2560,6 2527,9 -0,6 -0,1 -0,8 -1,4 -1,3 -0,5Power generation/District heating 1484,3 1321,2 1320,8 1381,1 1365,6 1300,3 1130,7 1090,9 864,2 682,0 546,0 453,8 426,2 -1,2 0,3 -1,9 -2,7 -4,5 -2,4Energy Branch 152,2 171,0 170,2 181,6 157,2 146,3 136,7 127,2 117,6 105,5 95,1 83,7 83,5 1,1 -0,8 -1,4 -1,5 -2,1 -1,3Industry 781,4 678,1 623,0 581,9 490,8 474,8 462,5 448,2 433,7 428,4 439,7 458,0 475,7 -2,2 -2,4 -0,6 -0,6 0,1 0,8Residential 499,4 481,6 466,2 486,7 465,3 468,7 434,1 389,3 368,3 353,7 333,9 322,6 303,4 -0,7 0,0 -0,7 -1,6 -1,0 -1,0Tertiary 300,5 275,3 242,0 262,2 244,5 239,4 224,7 208,4 198,7 192,8 187,0 184,6 178,2 -2,1 0,1 -0,8 -1,2 -0,6 -0,5Transport 812,7 872,9 988,5 1053,1 1048,3 1085,2 1093,5 1078,8 1035,7 1042,0 1048,0 1058,0 1060,8 2,0 0,6 0,4 -0,5 0,1 0,1
CO2 Emissions Index (1990=100) 100,0 94,3 94,5 97,9 93,6 92,2 86,4 82,9 74,9 69,6 65,7 63,5 62,7CO2 Emissions (Mt of CO2 - ref approach) 4172,0 3950,7 3922,7 4087,6 3837,8 3781,1 3552,7 3412,0 3090,1 2875,5 2719,7 2629,1 2600,6 -0,6 -0,2 -0,8 -1,4 -1,3 -0,4
EU27: Reference High Economic Growth scenario

Reference scenario with High GDP- 63
SUMMARY ENERGY BALANCE AND INDICATORS (B)1990 1995 2000 2005 2010 2015 2020 2025 2030 2035 2040 2045 2050 '90-'00 '00-'10 '10-'20 '20-'30 '30-'40 '40-'50
Annual % ChangeMain Energy System IndicatorsPopulation (Million) 470,388 477,010 481,072 489,211 499,389 507,727 513,838 517,811 519,942 520,654 520,103 518,362 515,303 0,2 0,4 0,3 0,1 0,0 -0,1GDP (in 000 MEuro'05) 8142,7 8748,4 10107,2 11063,1 11385,6 12801,7 14487,7 16165,8 17888,9 19687,4 21595,7 23690,1 25953,1 2,2 1,2 2,4 2,1 1,9 1,9Gross Inl. Cons./GDP (toe/MEuro'05) 203,9 190,0 170,5 165,1 155,9 141,5 125,4 112,0 99,9 92,3 85,9 80,0 73,6 -1,8 -0,9 -2,1 -2,2 -1,5 -1,5Gross Inl. Cons./Capita (toe/inhabitant) 3,53 3,49 3,58 3,73 3,55 3,57 3,54 3,50 3,44 3,49 3,57 3,65 3,71 0,1 -0,1 0,0 -0,3 0,4 0,4Electricity Generated/Capita (kWh gross/inhabitant) 5448 5686 6219 6693 6827 7132 7452 7902 8133 8715 9340 9945 10453 1,3 0,9 0,9 0,9 1,4 1,1Carbon intensity (t of CO2/toe of GIC) 2,43 2,29 2,21 2,16 2,13 2,05 1,92 1,85 1,69 1,54 1,43 1,35 1,32 -0,9 -0,4 -1,0 -1,3 -1,7 -0,8CO2 Emissions/Capita (t of CO2/inhabitant) 8,57 7,97 7,92 8,07 7,55 7,32 6,78 6,46 5,80 5,39 5,09 4,94 4,91 -0,8 -0,5 -1,1 -1,5 -1,3 -0,4CO2 Emissions to GDP (t of CO2/MEuro'05) 495,0 434,4 377,0 356,7 331,3 290,2 240,4 206,8 168,7 142,4 122,7 108,1 97,4 -2,7 -1,3 -3,2 -3,5 -3,1 -2,3Import Dependency % 44,6 43,5 46,8 52,5 53,7 56,7 57,4 57,5 56,4 55,8 55,9 56,6 57,6
Energy intensity indicators (2000=100)Industry (Energy on Value added) 130,3 115,2 100,0 95,1 90,3 84,2 77,7 71,7 66,7 63,1 60,7 58,4 56,2 -2,6 -1,0 -1,5 -1,5 -0,9 -0,8Residential (Energy on Private Income) 114,4 113,2 100,0 97,5 96,9 89,6 80,2 70,9 64,8 58,8 54,3 50,0 46,2 -1,3 -0,3 -1,9 -2,1 -1,8 -1,6Tertiary (Energy on Value added) 126,5 117,0 100,0 99,4 94,7 87,5 77,6 68,7 61,9 57,9 54,2 50,9 47,0 -2,3 -0,5 -2,0 -2,2 -1,3 -1,4Transport (Energy on GDP) 102,5 102,3 100,0 97,6 96,8 90,7 83,1 74,0 65,2 59,9 55,0 50,6 46,3 -0,2 -0,3 -1,5 -2,4 -1,7 -1,7
Carbon Intensity indicatorsElectricity and Steam production (t of CO2/MWh) 0,46 0,40 0,37 0,35 0,32 0,28 0,23 0,21 0,16 0,12 0,09 0,07 0,06 -2,1 -1,5 -3,3 -3,6 -5,8 -3,3Final energy demand (t of CO2/toe) 2,24 2,16 2,08 2,03 1,93 1,86 1,78 1,72 1,66 1,62 1,59 1,56 1,54 -0,7 -0,8 -0,8 -0,7 -0,5 -0,3
Industry 2,14 2,06 1,91 1,78 1,57 1,47 1,39 1,32 1,26 1,20 1,18 1,18 1,17 -1,1 -1,9 -1,2 -1,0 -0,6 -0,1Residential 1,89 1,72 1,63 1,58 1,51 1,46 1,34 1,26 1,21 1,17 1,12 1,08 1,03 -1,5 -0,7 -1,2 -1,0 -0,8 -0,8Tertiary 1,90 1,72 1,51 1,48 1,40 1,30 1,21 1,13 1,08 1,01 0,95 0,91 0,86 -2,2 -0,8 -1,4 -1,2 -1,2 -1,0Transport 2,90 2,90 2,91 2,91 2,83 2,78 2,71 2,69 2,64 2,63 2,63 2,63 2,63 0,0 -0,3 -0,5 -0,2 -0,1 0,0
Electricity and steam generationNet Generation Capacity in MWe 654125 715732 820290 923627 1029084 1089097 1196428 1294316 1386766 1481291 1570140 2,3 2,3 1,5 1,5 1,2
Nuclear energy 133923 134409 127038 126752 124722 120598 134152 149442 159029 171948 182410 -0,5 -0,2 0,7 1,7 1,4Renewable energy 112878 147262 209088 282215 405981 462606 554904 605631 641787 674521 717321 6,4 6,9 3,2 1,5 1,1
Hydro (pumping excluded) 99714 104505 107315 110860 114167 115744 117580 119033 119293 120198 121500 0,7 0,6 0,3 0,1 0,2Wind 12793 40584 86217 142925 233040 272784 331498 359395 374199 387366 404075 21,0 10,5 3,6 1,2 0,8Solar 371 2172 15307 27855 57104 71209 101678 122732 143464 161404 185077 45,1 14,1 5,9 3,5 2,6Other renewables (tidal etc.) 0 1 249 575 1671 2869 4148 4471 4831 5552 6669 21,0 9,5 1,5 3,3
Thermal power 407324 434061 484164 514659 498381 505893 507371 539243 585950 634823 670409 1,7 0,3 0,2 1,5 1,4of which cogeneration units 75904 85934 100381 114328 119605 131172 137134 161453 186324 210378 227948 2,8 1,8 1,4 3,1 2,0of which CCS units 0 0 0 0 5394 11086 17169 40385 77112 110122 126199 12,3 16,2 5,0
Solids fired 194165 186620 183827 183101 166344 152693 141300 140709 150515 149707 147538 -0,5 -1,0 -1,6 0,6 -0,2Gas fired 129444 167173 219320 239092 231438 230128 239996 270827 283217 275309 239631 5,4 0,5 0,4 1,7 -1,7Oil fired 71058 62082 56063 49370 39978 53722 52024 51793 71234 122299 192448 -2,3 -3,3 2,7 3,2 10,4Biomass-waste fired 12051 17502 24170 42305 59797 68467 73107 74933 79957 86474 89751 7,2 9,5 2,0 0,9 1,2Hydrogen plants 0 0 0 0 0 0 0 0 0 0 0Geothermal heat 605 684 783 791 823 884 945 982 1027 1035 1042 2,6 0,5 1,4 0,8 0,1
Load factor for net electric capacities (%) 49,1 49,1 45,1 42,7 40,5 40,8 38,4 37,9 37,5 37,1 36,5Indicators for gross electricity productionEfficiency for thermal electricity production (%) 37,6 38,5 39,2 39,9 40,3 40,6 40,4 41,9 43,3 44,7 45,3CHP indicator (% of electricity from CHP) 11,4 11,7 15,0 18,0 18,5 18,6 18,3 20,8 22,1 23,0 23,2CCS indicator (% of electricity from CCS) 0,0 0,0 0,0 0,0 1,4 2,8 4,2 8,8 14,9 19,2 20,3Non fossil fuels in electricity generation (%) 45,8 44,8 45,9 50,1 56,4 58,6 64,9 66,5 65,9 65,7 66,2 - nuclear 31,6 30,5 27,2 25,8 23,3 23,3 25,1 26,6 26,7 27,2 27,4 - renewable energy forms and industrial waste 14,2 14,3 18,7 24,3 33,0 35,3 39,8 39,9 39,2 38,5 38,8Indicators for renewables (excluding industrial waste) (%) (B)
RES in gross final energy demand (%) 7,6 8,6 11,4 14,6 20,1 21,4 23,7 24,1 24,3 24,4 24,9RES in transport (%) 0,5 1,4 4,3 6,6 10,1 10,9 12,5 13,1 13,2 13,3 13,2
Transport sectorPassenger transport activity (Gpkm) 4880,7 5307,7 5892,2 6240,3 6511,3 7186,5 7787,5 8227,1 8648,1 9035,3 9300,3 9581,3 9754,9 1,9 1,0 1,8 1,1 0,7 0,5
Public road transport 544,0 504,0 517,6 526,0 545,0 576,1 613,5 636,3 655,6 673,9 684,6 696,5 702,5 -0,5 0,5 1,2 0,7 0,4 0,3Private cars and motorcycles 3501,1 3986,3 4428,1 4686,5 4866,1 5341,1 5715,6 5965,4 6208,3 6441,8 6577,7 6726,0 6788,8 2,4 0,9 1,6 0,8 0,6 0,3Rail 472,5 421,7 447,9 461,0 482,5 528,0 576,4 616,5 654,6 694,6 727,7 760,6 782,9 -0,5 0,7 1,8 1,3 1,1 0,7Aviation 317,3 351,3 456,9 527,3 576,9 699,0 837,4 962,9 1082,5 1176,4 1260,9 1348,0 1429,9 3,7 2,4 3,8 2,6 1,5 1,3Inland navigation 45,8 44,4 41,7 39,5 40,8 42,3 44,6 46,0 47,2 48,6 49,4 50,3 50,8 -0,9 -0,2 0,9 0,6 0,4 0,3
Travel per person (km per capita) 10376 11127 12248 12756 13039 14154 15155 15888 16633 17354 17882 18484 18930 1,7 0,6 1,5 0,9 0,7 0,6
Freight transport activity (Gtkm) 1848,4 1942,4 2195,7 2494,6 2662,6 2980,3 3234,9 3473,5 3699,4 3915,2 4127,1 4325,5 4496,8 1,7 1,9 2,0 1,4 1,1 0,9Trucks 1060,4 1288,7 1518,7 1800,3 1940,3 2188,4 2372,4 2548,2 2717,3 2878,5 3037,6 3188,6 3317,0 3,7 2,5 2,0 1,4 1,1 0,9Rail 526,3 386,1 403,7 414,1 440,5 492,3 539,8 580,3 617,4 653,5 689,4 722,0 752,7 -2,6 0,9 2,1 1,4 1,1 0,9Inland navigation 261,6 267,6 273,3 280,2 281,9 299,5 322,8 345,1 364,7 383,2 400,1 414,9 427,1 0,4 0,3 1,4 1,2 0,9 0,7
Freight activity per unit of GDP (tkm/000 Euro'05) 227 222 217 225 234 233 223 215 207 199 191 183 173 -0,4 0,7 -0,5 -0,8 -0,8 -1,0Energy demand in transport (ktoe) 280269 300617 339389 362405 370011 389918 404242 401547 391657 395841 398794 402658 403627 1,9 0,9 0,9 -0,3 0,2 0,1
Public road transport 5197 4732 4914 5039 5182 5334 5391 5284 5145 5147 5092 4956 4753 -0,6 0,5 0,4 -0,5 -0,1 -0,7Private cars and motorcycles 154395 166321 182974 187736 186451 186412 186566 177813 167337 164525 161244 158521 155378 1,7 0,2 0,0 -1,1 -0,4 -0,4Trucks 74969 79037 90951 105104 111606 124207 130639 135054 136977 142062 147194 151609 155668 2,0 2,1 1,6 0,5 0,7 0,6Rail 9560 9452 9600 9436 9597 10196 10221 9997 8889 8890 9101 9246 9314 0,0 0,0 0,6 -1,4 0,2 0,2Aviation 29038 34112 45395 49703 51709 58128 65393 67031 66684 68344 69089 71088 71173 4,6 1,3 2,4 0,2 0,4 0,3Inland navigation 7110 6963 5555 5386 5466 5642 6033 6368 6625 6873 7074 7239 7341 -2,4 -0,2 1,0 0,9 0,7 0,4
Efficiency indicator (activity related)Passenger transport (toe/Mpkm) 39,6 39,5 40,3 39,5 38,0 35,3 33,6 30,9 28,2 26,8 25,8 24,9 24,2 0,2 -0,6 -1,2 -1,7 -0,9 -0,7Freight transport (toe/Mtkm) 47,1 46,8 46,3 46,5 46,1 45,6 44,1 42,4 40,0 39,2 38,5 37,8 37,3 -0,2 -0,1 -0,4 -1,0 -0,4 -0,3
EU27: Reference High Economic Growth scenario
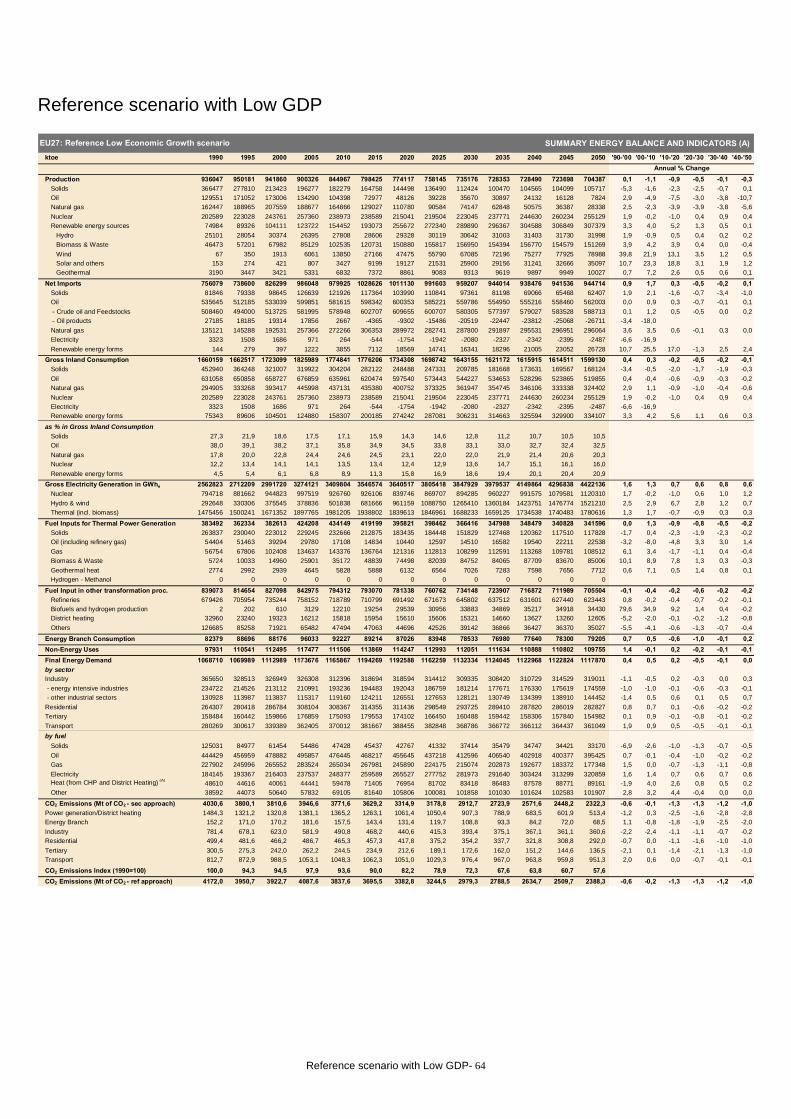
Reference scenario with Low GDP- 64
Reference scenario with Low GDP
SUMMARY ENERGY BALANCE AND INDICATORS (A) ktoe 1990 1995 2000 2005 2010 2015 2020 2025 2030 2035 2040 2045 2050 '90-'00 '00-'10 '10-'20 '20-'30 '30-'40 '40-'50
Annual % ChangeProduction 936047 950181 941860 900326 844967 798425 774117 758145 735176 728353 728490 723698 704387 0,1 -1,1 -0,9 -0,5 -0,1 -0,3
Solids 366477 277810 213423 196277 182279 164758 144498 136490 112424 100470 104565 104099 105717 -5,3 -1,6 -2,3 -2,5 -0,7 0,1Oil 129551 171052 173006 134290 104398 72977 48126 39228 35670 30897 24132 16128 7824 2,9 -4,9 -7,5 -3,0 -3,8 -10,7Natural gas 162447 188965 207559 188677 164866 129027 110780 90584 74147 62848 50575 36387 28338 2,5 -2,3 -3,9 -3,9 -3,8 -5,6Nuclear 202589 223028 243761 257360 238973 238589 215041 219504 223045 237771 244630 260234 255129 1,9 -0,2 -1,0 0,4 0,9 0,4Renewable energy sources 74984 89326 104111 123722 154452 193073 255672 272340 289890 296367 304588 306849 307379 3,3 4,0 5,2 1,3 0,5 0,1
Hydro 25101 28054 30374 26395 27808 28606 29328 30119 30642 31003 31403 31730 31998 1,9 -0,9 0,5 0,4 0,2 0,2Biomass & Waste 46473 57201 67982 85129 102535 120731 150880 155817 156950 154394 156770 154579 151269 3,9 4,2 3,9 0,4 0,0 -0,4Wind 67 350 1913 6061 13850 27166 47475 55790 67085 72196 75277 77925 78988 39,8 21,9 13,1 3,5 1,2 0,5Solar and others 153 274 421 807 3427 9199 19127 21531 25900 29156 31241 32666 35097 10,7 23,3 18,8 3,1 1,9 1,2Geothermal 3190 3447 3421 5331 6832 7372 8861 9083 9313 9619 9897 9949 10027 0,7 7,2 2,6 0,5 0,6 0,1
Net Imports 756079 738600 826299 986048 979925 1028626 1011130 991603 959207 944014 938476 941536 944714 0,9 1,7 0,3 -0,5 -0,2 0,1Solids 81846 79338 98645 126639 121926 117364 103990 110841 97361 81198 69066 65468 62407 1,9 2,1 -1,6 -0,7 -3,4 -1,0Oil 535645 512185 533039 599851 581615 598342 600353 585221 559786 554950 555216 558460 562003 0,0 0,9 0,3 -0,7 -0,1 0,1 - Crude oil and Feedstocks 508460 494000 513725 581995 578948 602707 609655 600707 580305 577397 579027 583528 588713 0,1 1,2 0,5 -0,5 0,0 0,2 - Oil products 27185 18185 19314 17856 2667 -4365 -9302 -15486 -20519 -22447 -23812 -25068 -26711 -3,4 -18,0Natural gas 135121 145288 192531 257366 272266 306353 289972 282741 287800 291897 295531 296951 296064 3,6 3,5 0,6 -0,1 0,3 0,0Electricity 3323 1508 1686 971 264 -544 -1754 -1942 -2080 -2327 -2342 -2395 -2487 -6,6 -16,9Renewable energy forms 144 279 397 1222 3855 7112 18569 14741 16341 18296 21005 23052 26728 10,7 25,5 17,0 -1,3 2,5 2,4
Gross Inland Consumption 1660159 1662517 1723099 1825989 1774841 1776206 1734308 1698742 1643155 1621172 1615915 1614511 1599130 0,4 0,3 -0,2 -0,5 -0,2 -0,1Solids 452940 364248 321007 319922 304204 282122 248488 247331 209785 181668 173631 169567 168124 -3,4 -0,5 -2,0 -1,7 -1,9 -0,3Oil 631058 650858 658727 676859 635961 620474 597540 573443 544227 534653 528296 523865 519855 0,4 -0,4 -0,6 -0,9 -0,3 -0,2Natural gas 294905 333268 393417 445998 437131 435380 400752 373325 361947 354745 346106 333338 324402 2,9 1,1 -0,9 -1,0 -0,4 -0,6Nuclear 202589 223028 243761 257360 238973 238589 215041 219504 223045 237771 244630 260234 255129 1,9 -0,2 -1,0 0,4 0,9 0,4Electricity 3323 1508 1686 971 264 -544 -1754 -1942 -2080 -2327 -2342 -2395 -2487 -6,6 -16,9Renewable energy forms 75343 89606 104501 124880 158307 200185 274242 287081 306231 314663 325594 329900 334107 3,3 4,2 5,6 1,1 0,6 0,3
as % in Gross Inland ConsumptionSolids 27,3 21,9 18,6 17,5 17,1 15,9 14,3 14,6 12,8 11,2 10,7 10,5 10,5Oil 38,0 39,1 38,2 37,1 35,8 34,9 34,5 33,8 33,1 33,0 32,7 32,4 32,5Natural gas 17,8 20,0 22,8 24,4 24,6 24,5 23,1 22,0 22,0 21,9 21,4 20,6 20,3Nuclear 12,2 13,4 14,1 14,1 13,5 13,4 12,4 12,9 13,6 14,7 15,1 16,1 16,0Renewable energy forms 4,5 5,4 6,1 6,8 8,9 11,3 15,8 16,9 18,6 19,4 20,1 20,4 20,9
Gross Electricity Generation in GWhe 2562823 2712209 2991720 3274121 3409804 3546574 3640517 3805418 3847929 3979537 4149864 4296838 4422136 1,6 1,3 0,7 0,6 0,8 0,6Nuclear 794718 881662 944823 997519 926760 926106 839746 869707 894285 960227 991575 1079581 1120310 1,7 -0,2 -1,0 0,6 1,0 1,2Hydro & wind 292648 330306 375545 378836 501838 681666 961159 1088750 1265410 1360184 1423751 1476774 1521210 2,5 2,9 6,7 2,8 1,2 0,7Thermal (incl. biomass) 1475456 1500241 1671352 1897765 1981205 1938802 1839613 1846961 1688233 1659125 1734538 1740483 1780616 1,3 1,7 -0,7 -0,9 0,3 0,3
Fuel Inputs for Thermal Power Generation 383492 362334 382613 424208 434149 419199 395821 398462 366416 347988 348479 340828 341596 0,0 1,3 -0,9 -0,8 -0,5 -0,2Solids 263837 230040 223012 229245 232666 212875 183435 184448 151829 127468 120362 117510 117828 -1,7 0,4 -2,3 -1,9 -2,3 -0,2Oil (including refinery gas) 54404 51463 39294 29780 17108 14834 10440 12597 14510 16582 19540 22211 22538 -3,2 -8,0 -4,8 3,3 3,0 1,4Gas 56754 67806 102408 134637 143376 136764 121316 112813 108299 112591 113268 109781 108512 6,1 3,4 -1,7 -1,1 0,4 -0,4Biomass & Waste 5724 10033 14960 25901 35172 48839 74498 82039 84752 84065 87709 83670 85006 10,1 8,9 7,8 1,3 0,3 -0,3Geothermal heat 2774 2992 2939 4645 5828 5888 6132 6564 7026 7283 7598 7656 7712 0,6 7,1 0,5 1,4 0,8 0,1Hydrogen - Methanol 0 0 0 0 0 0 0 0 0 0 0 0 0
Fuel Input in other transformation proc. 839073 814654 827098 842975 794312 793070 781338 760762 734148 723907 716872 711989 705504 -0,1 -0,4 -0,2 -0,6 -0,2 -0,2Refineries 679426 705954 735244 758152 718789 710799 691492 671673 645802 637512 631601 627440 623443 0,8 -0,2 -0,4 -0,7 -0,2 -0,1Biofuels and hydrogen production 2 202 610 3129 12210 19254 29539 30956 33883 34869 35217 34918 34430 79,6 34,9 9,2 1,4 0,4 -0,2District heating 32960 23240 19323 16212 15818 15954 15610 15606 15321 14660 13627 13260 12605 -5,2 -2,0 -0,1 -0,2 -1,2 -0,8Others 126685 85258 71921 65482 47494 47063 44696 42526 39142 36866 36427 36370 35027 -5,5 -4,1 -0,6 -1,3 -0,7 -0,4
Energy Branch Consumption 82379 88696 88176 96033 92227 89214 87026 83948 78533 76980 77640 78300 79205 0,7 0,5 -0,6 -1,0 -0,1 0,2Non-Energy Uses 97931 110541 112495 117477 111506 113869 114247 112993 112051 111634 110888 110802 109755 1,4 -0,1 0,2 -0,2 -0,1 -0,1Final Energy Demand 1068710 1069989 1112989 1173676 1165867 1194269 1192588 1162259 1132334 1124045 1122968 1122824 1117870 0,4 0,5 0,2 -0,5 -0,1 0,0by sectorIndustry 365650 328513 326949 326308 312396 318694 318594 314412 309335 308420 310729 314529 319011 -1,1 -0,5 0,2 -0,3 0,0 0,3 - energy intensive industries 234722 214526 213112 210991 193236 194483 192043 186759 181214 177671 176330 175619 174559 -1,0 -1,0 -0,1 -0,6 -0,3 -0,1 - other industrial sectors 130928 113987 113837 115317 119160 124211 126551 127653 128121 130749 134399 138910 144452 -1,4 0,5 0,6 0,1 0,5 0,7Residential 264307 280418 286784 308104 308367 314355 311436 298549 293725 289410 287820 286019 282827 0,8 0,7 0,1 -0,6 -0,2 -0,2Tertiary 158484 160442 159866 176859 175093 179553 174102 166450 160488 159442 158306 157840 154982 0,1 0,9 -0,1 -0,8 -0,1 -0,2Transport 280269 300617 339389 362405 370012 381667 388455 382848 368786 366772 366112 364437 361049 1,9 0,9 0,5 -0,5 -0,1 -0,1by fuel
Solids 125031 84977 61454 54486 47428 45437 42767 41332 37414 35479 34747 34421 33170 -6,9 -2,6 -1,0 -1,3 -0,7 -0,5Oil 444429 456959 478882 495857 476445 468217 455645 437218 412596 406540 402918 400377 395425 0,7 -0,1 -0,4 -1,0 -0,2 -0,2Gas 227902 245996 265552 283524 265034 267981 245890 224175 215074 202873 192677 183372 177348 1,5 0,0 -0,7 -1,3 -1,1 -0,8Electricity 184145 193367 216403 237537 248377 259589 265527 277752 281973 291640 303424 313299 320859 1,6 1,4 0,7 0,6 0,7 0,6Heat (from CHP and District Heating) (A) 48610 44616 40061 44441 59478 71405 76954 81702 83418 86483 87578 88771 89161 -1,9 4,0 2,6 0,8 0,5 0,2Other 38592 44073 50640 57832 69105 81640 105806 100081 101858 101030 101624 102583 101907 2,8 3,2 4,4 -0,4 0,0 0,0
CO2 Emissions (Mt of CO2 - sec approach) 4030,6 3800,1 3810,6 3946,6 3771,6 3629,2 3314,9 3178,8 2912,7 2723,9 2571,6 2448,2 2322,3 -0,6 -0,1 -1,3 -1,3 -1,2 -1,0Power generation/District heating 1484,3 1321,2 1320,8 1381,1 1365,2 1263,1 1061,4 1050,4 907,3 788,9 683,5 601,9 513,4 -1,2 0,3 -2,5 -1,6 -2,8 -2,8Energy Branch 152,2 171,0 170,2 181,6 157,5 143,4 131,4 119,7 108,8 93,3 84,2 72,0 68,5 1,1 -0,8 -1,8 -1,9 -2,5 -2,0Industry 781,4 678,1 623,0 581,9 490,8 468,2 440,6 415,3 393,4 375,1 367,1 361,1 360,6 -2,2 -2,4 -1,1 -1,1 -0,7 -0,2Residential 499,4 481,6 466,2 486,7 465,3 457,3 417,8 375,2 354,2 337,7 321,8 308,8 292,0 -0,7 0,0 -1,1 -1,6 -1,0 -1,0Tertiary 300,5 275,3 242,0 262,2 244,5 234,9 212,6 189,1 172,6 162,0 151,2 144,6 136,5 -2,1 0,1 -1,4 -2,1 -1,3 -1,0Transport 812,7 872,9 988,5 1053,1 1048,3 1062,3 1051,0 1029,3 976,4 967,0 963,8 959,8 951,3 2,0 0,6 0,0 -0,7 -0,1 -0,1
CO2 Emissions Index (1990=100) 100,0 94,3 94,5 97,9 93,6 90,0 82,2 78,9 72,3 67,6 63,8 60,7 57,6CO2 Emissions (Mt of CO2 - ref approach) 4172,0 3950,7 3922,7 4087,6 3837,6 3695,5 3382,8 3244,5 2979,3 2788,5 2634,7 2509,7 2388,3 -0,6 -0,2 -1,3 -1,3 -1,2 -1,0
EU27: Reference Low Economic Growth scenario

Reference scenario with Low GDP- 65
SUMMARY ENERGY BALANCE AND INDICATORS (B)1990 1995 2000 2005 2010 2015 2020 2025 2030 2035 2040 2045 2050 '90-'00 '00-'10 '10-'20 '20-'30 '30-'40 '40-'50
Annual % ChangeMain Energy System IndicatorsPopulation (Million) 470,388 477,010 481,072 489,211 499,389 507,727 513,838 517,811 519,942 520,654 520,103 518,362 515,303 0,2 0,4 0,3 0,1 0,0 -0,1GDP (in 000 MEuro'05) 8142,7 8748,4 10107,2 11063,1 11385,6 12503,7 13605,2 14595,0 15526,6 16426,8 17322,2 18267,5 19239,1 2,2 1,2 1,8 1,3 1,1 1,1Gross Inl. Cons./GDP (toe/MEuro'05) 203,9 190,0 170,5 165,1 155,9 142,1 127,5 116,4 105,8 98,7 93,3 88,4 83,1 -1,8 -0,9 -2,0 -1,8 -1,3 -1,1Gross Inl. Cons./Capita (toe/inhabitant) 3,53 3,49 3,58 3,73 3,55 3,50 3,38 3,28 3,16 3,11 3,11 3,11 3,10 0,1 -0,1 -0,5 -0,7 -0,2 0,0Electricity Generated/Capita (kWh gross/inhabitant) 5448 5686 6219 6693 6828 6985 7085 7349 7401 7643 7979 8289 8582 1,3 0,9 0,4 0,4 0,8 0,7Carbon intensity (t of CO2/toe of GIC) 2,43 2,29 2,21 2,16 2,13 2,04 1,91 1,87 1,77 1,68 1,59 1,52 1,45 -0,9 -0,4 -1,1 -0,8 -1,1 -0,9CO2 Emissions/Capita (t of CO2/inhabitant) 8,57 7,97 7,92 8,07 7,55 7,15 6,45 6,14 5,60 5,23 4,94 4,72 4,51 -0,8 -0,5 -1,6 -1,4 -1,2 -0,9CO2 Emissions to GDP (t of CO2/MEuro'05) 495,0 434,4 377,0 356,7 331,3 290,2 243,7 217,8 187,6 165,8 148,5 134,0 120,7 -2,7 -1,3 -3,0 -2,6 -2,3 -2,0Import Dependency % 44,6 43,5 46,8 52,5 53,7 56,3 56,6 56,7 56,6 56,4 56,3 56,5 57,3
Energy intensity indicators (2000=100)Industry (Energy on Value added) 130,3 115,2 100,0 95,1 90,3 84,8 78,5 72,6 67,7 64,2 61,7 59,5 57,6 -2,6 -1,0 -1,4 -1,5 -0,9 -0,7Residential (Energy on Private Income) 114,4 113,2 100,0 97,5 96,9 89,6 80,3 70,9 64,8 58,8 54,3 50,0 46,2 -1,3 -0,3 -1,9 -2,1 -1,8 -1,6Tertiary (Energy on Value added) 126,5 117,0 100,0 99,4 94,7 87,7 77,8 69,1 62,3 58,4 54,8 51,5 47,9 -2,3 -0,5 -1,9 -2,2 -1,3 -1,3Transport (Energy on GDP) 102,5 102,3 100,0 97,6 96,8 90,9 85,0 78,1 70,7 66,5 62,9 59,4 55,9 -0,2 -0,3 -1,3 -1,8 -1,2 -1,2
Carbon Intensity indicatorsElectricity and Steam production (t of CO2/MWh) 0,46 0,40 0,37 0,35 0,32 0,28 0,22 0,21 0,18 0,15 0,13 0,11 0,09 -2,1 -1,5 -3,5 -2,1 -3,5 -3,3Final energy demand (t of CO2/toe) 2,24 2,16 2,08 2,03 1,93 1,86 1,78 1,73 1,67 1,64 1,61 1,58 1,56 -0,7 -0,8 -0,8 -0,6 -0,4 -0,3
Industry 2,14 2,06 1,91 1,78 1,57 1,47 1,38 1,32 1,27 1,22 1,18 1,15 1,13 -1,1 -1,9 -1,3 -0,8 -0,7 -0,4Residential 1,89 1,72 1,63 1,58 1,51 1,45 1,34 1,26 1,21 1,17 1,12 1,08 1,03 -1,5 -0,7 -1,2 -1,1 -0,8 -0,8Tertiary 1,90 1,72 1,51 1,48 1,40 1,31 1,22 1,14 1,08 1,02 0,96 0,92 0,88 -2,2 -0,8 -1,3 -1,3 -1,2 -0,8Transport 2,90 2,90 2,91 2,91 2,83 2,78 2,71 2,69 2,65 2,64 2,63 2,63 2,63 0,0 -0,3 -0,5 -0,2 -0,1 0,0
Electricity and steam generationNet Generation Capacity in MWe 654125 715732 820302 917001 1008635 1041998 1114218 1167080 1223532 1282130 1332260 2,3 2,1 1,0 0,9 0,9
Nuclear energy 133923 134409 127038 126752 123736 113246 115835 122226 124174 132588 138575 -0,5 -0,3 -0,7 0,7 1,1Renewable energy 112878 147262 209023 279278 397750 448906 522682 563776 591587 616938 643052 6,4 6,6 2,8 1,2 0,8
Hydro (pumping excluded) 99714 104505 107315 110765 114160 115440 117367 118744 119046 119875 121060 0,7 0,6 0,3 0,1 0,2Wind 12793 40584 86153 140082 228571 263271 309575 329210 341594 352536 357648 21,0 10,2 3,1 1,0 0,5Solar 371 2172 15307 27855 53352 67338 91599 111359 126122 139101 158252 45,1 13,3 5,6 3,2 2,3Other renewables (tidal etc.) 0 1 249 575 1667 2857 4141 4463 4825 5425 6092 21,0 9,5 1,5 2,4
Thermal power 407324 434061 484241 510971 487149 479846 475701 481078 507771 532603 550632 1,7 0,1 -0,2 0,7 0,8of which cogeneration units 75904 85934 100505 111834 115771 122900 127450 138698 154273 169250 172553 2,8 1,4 1,0 1,9 1,1of which CCS units 0 0 0 0 5394 5434 6107 11077 25615 41330 60069 1,2 15,4 8,9
Solids fired 194165 186620 183870 182485 163133 146101 128524 114275 113957 110176 110793 -0,5 -1,2 -2,4 -1,2 -0,3Gas fired 129444 167173 219348 238458 228127 224079 234770 255062 258866 245279 212265 5,4 0,4 0,3 1,0 -2,0Oil fired 71058 62082 56070 47003 36127 41149 39971 38440 57337 95207 141825 -2,3 -4,3 1,0 3,7 9,5Biomass-waste fired 12051 17502 24171 42238 58943 67641 71498 72330 76598 80921 84721 7,2 9,3 1,9 0,7 1,0Hydrogen plants 0 0 0 0 0 0 0 0 0 0 0Geothermal heat 605 684 783 786 818 876 937 971 1013 1021 1028 2,6 0,4 1,4 0,8 0,1
Load factor for net electric capacities (%) 49,1 49,1 45,1 42,1 39,3 39,8 37,7 37,3 36,9 36,4 35,8Indicators for gross electricity productionEfficiency for thermal electricity production (%) 37,6 38,5 39,2 39,8 40,0 39,9 39,6 41,0 42,8 43,9 44,8CHP indicator (% of electricity from CHP) 11,4 11,7 15,0 17,8 18,8 18,8 18,6 20,2 21,4 22,3 22,0CCS indicator (% of electricity from CCS) 0,0 0,0 0,0 0,0 1,4 1,4 1,6 2,8 5,7 8,6 12,1Non fossil fuels in electricity generation (%) 45,8 44,8 45,9 50,6 57,3 59,8 64,7 66,7 66,9 67,7 67,9 - nuclear 31,6 30,5 27,2 26,1 23,1 22,9 23,2 24,1 23,9 25,1 25,3 - renewable energy forms and industrial waste 14,2 14,3 18,7 24,5 34,2 37,0 41,5 42,5 43,0 42,5 42,5Indicators for renewables (excluding industrial waste) (%) (B)
RES in gross final energy demand (%) 7,6 8,6 11,4 14,7 20,4 21,9 24,1 24,9 25,7 25,9 26,4RES in transport (%) 0,5 1,4 4,3 6,6 10,1 10,9 12,6 13,1 13,3 13,3 13,3
Transport sectorPassenger transport activity (Gpkm) 4880,7 5307,7 5892,2 6240,3 6511,3 7013,0 7503,5 7946,7 8344,0 8643,1 8964,8 9191,6 9398,3 1,9 1,0 1,4 1,1 0,7 0,5
Public road transport 544,0 504,0 517,6 526,0 545,0 562,1 591,3 614,6 632,7 645,1 659,9 668,2 676,2 -0,5 0,5 0,8 0,7 0,4 0,2Private cars and motorcycles 3501,1 3986,3 4428,1 4686,5 4866,1 5211,0 5505,7 5759,4 5986,6 6159,8 6340,8 6450,0 6539,2 2,4 0,9 1,2 0,8 0,6 0,3Rail 472,5 421,7 447,9 461,0 482,5 515,6 555,5 596,2 631,8 664,9 701,9 729,8 754,6 -0,5 0,7 1,4 1,3 1,1 0,7Aviation 317,3 351,3 456,9 527,3 576,9 683,0 808,0 932,1 1047,4 1127,1 1214,9 1295,5 1379,4 3,7 2,4 3,4 2,6 1,5 1,3Inland navigation 45,8 44,4 41,7 39,5 40,8 41,2 42,9 44,5 45,5 46,3 47,4 48,0 48,8 -0,9 -0,2 0,5 0,6 0,4 0,3
Travel per person (km per capita) 10376 11127 12248 12756 13039 13813 14603 15347 16048 16601 17237 17732 18238 1,7 0,6 1,1 0,9 0,7 0,6
Freight transport activity (Gtkm) 1848,4 1942,4 2195,7 2494,6 2662,6 2911,2 3038,4 3137,2 3212,2 3268,1 3311,5 3336,5 3334,5 1,7 1,9 1,3 0,6 0,3 0,1Trucks 1060,4 1288,7 1518,7 1800,3 1940,3 2137,7 2228,2 2301,2 2359,2 2402,5 2437,3 2459,4 2459,4 3,7 2,5 1,4 0,6 0,3 0,1Rail 526,3 386,1 403,7 414,1 440,5 481,0 507,1 524,5 536,5 545,8 553,3 557,2 558,6 -2,6 0,9 1,4 0,6 0,3 0,1Inland navigation 261,6 267,6 273,3 280,2 281,9 292,5 303,1 311,5 316,5 319,7 320,9 319,9 316,6 0,4 0,3 0,7 0,4 0,1 -0,1
Freight activity per unit of GDP (tkm/000 Euro'05) 227 222 217 225 234 233 223 215 207 199 191 183 173 -0,4 0,7 -0,5 -0,8 -0,8 -1,0Energy demand in transport (ktoe) 280269 300617 339389 362405 370012 381667 388455 382848 368786 366772 366112 364437 361049 1,9 0,9 0,5 -0,5 -0,1 -0,1
Public road transport 5197 4732 4914 5039 5182 5223 5239 5161 5030 5003 4988 4835 4650 -0,6 0,5 0,1 -0,4 -0,1 -0,7Private cars and motorcycles 154395 166321 182974 187736 186451 182339 180817 173226 163247 159731 158146 155069 152943 1,7 0,2 -0,3 -1,0 -0,3 -0,3Trucks 74969 79037 90951 105104 111606 121467 123197 122945 120492 120737 120885 120408 119478 2,0 2,1 1,0 -0,2 0,0 -0,1Rail 9560 9452 9600 9436 9597 9983 9722 9298 8103 7935 7972 7934 7843 0,0 0,0 0,1 -1,8 -0,2 -0,2Aviation 29038 34112 45395 49703 51709 57141 63744 66294 65892 67281 67991 70062 70046 4,6 1,3 2,1 0,3 0,3 0,3Inland navigation 7110 6963 5555 5386 5466 5514 5737 5924 6022 6085 6131 6129 6089 -2,4 -0,2 0,5 0,5 0,2 -0,1
Efficiency indicator (activity related)Passenger transport (toe/Mpkm) 39,6 39,5 40,3 39,5 38,0 35,5 33,8 31,3 28,6 27,3 26,3 25,5 24,7 0,2 -0,6 -1,2 -1,7 -0,8 -0,6Freight transport (toe/Mtkm) 47,1 46,8 46,3 46,5 46,1 45,7 44,3 42,7 40,6 39,9 39,5 39,0 38,7 -0,2 -0,1 -0,4 -0,9 -0,3 -0,2
EU27: Reference Low Economic Growth scenario

Current Policy Initiatives scenario - 66
1bis. Current Policy Initiatives scenario
SUMMARY ENERGY BALANCE AND INDICATORS (A) ktoe 1990 1995 2000 2005 2010 2015 2020 2025 2030 2035 2040 2045 2050 '90-'00 '00-'10 '10-'20 '20-'30 '30-'40 '40-'50
Annual % ChangeProduction 936047 950181 941860 900326 837026 805387 776345 746662 716019 722881 723028 725625 702833 0,1 -1,2 -0,7 -0,8 0,1 -0,3
Solids 366477 277810 213423 196277 177948 167710 142792 133720 108664 102483 94040 98126 97033 -5,3 -1,8 -2,2 -2,7 -1,4 0,3Oil 129551 171052 173006 134290 104398 74031 47982 39510 36057 31092 24091 15949 7609 2,9 -4,9 -7,5 -2,8 -4,0 -10,9Natural gas 162447 188965 207559 188677 164866 129037 110504 91051 76179 65307 54304 39637 30443 2,5 -2,3 -3,9 -3,7 -3,3 -5,6Nuclear 202589 223028 243761 257360 235016 237233 223904 211481 197877 217023 224567 232068 218790 1,9 -0,4 -0,5 -1,2 1,3 -0,3Renewable energy sources 74984 89326 104111 123722 154799 197376 251162 270899 297242 306976 326026 339846 348958 3,3 4,0 5,0 1,7 0,9 0,7
Hydro 25101 28054 30374 26395 30008 30230 30742 31447 31950 32393 32885 33307 33634 1,9 -0,1 0,2 0,4 0,3 0,2Biomass & Waste 46473 57201 67982 85129 102157 123309 146810 154243 159433 156911 160094 164043 162408 3,9 4,2 3,7 0,8 0,0 0,1Wind 67 350 1913 6061 12781 26970 46373 54479 69420 76665 85809 91856 98027 39,8 20,9 13,8 4,1 2,1 1,3Solar and others 153 274 421 807 3449 9398 18597 21678 26902 31099 37025 40331 44463 10,7 23,4 18,4 3,8 3,2 1,8Geothermal 3190 3447 3421 5331 6404 7468 8640 9053 9537 9908 10213 10309 10427 0,7 6,5 3,0 1,0 0,7 0,2
Net Imports 756079 738600 826299 986048 965395 1049565 977353 982714 969153 960489 952968 956662 970866 0,9 1,6 0,1 -0,1 -0,2 0,2Solids 81846 79338 98645 126639 102078 115497 95406 96317 86298 71531 59790 53306 55097 1,9 0,3 -0,7 -1,0 -3,6 -0,8Oil 535645 512185 533039 599851 580911 609332 595279 593366 574554 568907 564756 564377 565740 0,0 0,9 0,2 -0,4 -0,2 0,0 - Crude oil and Feedstocks 508460 494000 513725 581995 578386 611451 607203 607062 591933 587692 585536 586758 590001 0,1 1,2 0,5 -0,3 -0,1 0,1 - Oil products 27185 18185 19314 17856 2525 -2119 -11924 -13696 -17379 -18786 -20781 -22380 -24262 -3,4 -18,4Natural gas 135121 145288 192531 257366 277819 318023 271055 280810 293286 303378 309596 316761 323814 3,6 3,7 -0,2 0,8 0,5 0,5Electricity 3323 1508 1686 971 696 -540 -1990 -2558 -1672 -1689 -2228 -2318 -2616 -6,6 -8,5Renewable energy forms 144 279 397 1222 3891 7253 17603 14779 16687 18362 21055 24536 28832 10,7 25,6 16,3 -0,5 2,4 3,2
Gross Inland Consumption 1660159 1662517 1723099 1825989 1752370 1802836 1700364 1674909 1629357 1626479 1618141 1623657 1614786 0,4 0,2 -0,3 -0,4 -0,1 0,0Solids 452940 364248 321007 319922 280026 283208 238198 230037 194962 174014 153830 151432 152130 -3,4 -1,4 -1,6 -2,0 -2,3 -0,1Oil 631058 650858 658727 676859 635257 631246 589927 578409 554930 543281 531352 522826 516760 0,4 -0,4 -0,7 -0,6 -0,4 -0,3Natural gas 294905 333268 393417 445998 442685 447060 381559 371862 369465 368685 363900 356397 354256 2,9 1,2 -1,5 -0,3 -0,2 -0,3Nuclear 202589 223028 243761 257360 235016 237233 223904 211481 197877 217023 224567 232068 218790 1,9 -0,4 -0,5 -1,2 1,3 -0,3Electricity 3323 1508 1686 971 696 -540 -1990 -2558 -1672 -1689 -2228 -2318 -2616 -6,6 -8,5Renewable energy forms 75343 89606 104501 124880 158690 204629 268766 285678 313796 325165 346720 363253 375464 3,3 4,3 5,4 1,6 1,0 0,8
as % in Gross Inland ConsumptionSolids 27,3 21,9 18,6 17,5 16,0 15,7 14,0 13,7 12,0 10,7 9,5 9,3 9,4Oil 38,0 39,1 38,2 37,1 36,3 35,0 34,7 34,5 34,1 33,4 32,8 32,2 32,0Natural gas 17,8 20,0 22,8 24,4 25,3 24,8 22,4 22,2 22,7 22,7 22,5 22,0 21,9Nuclear 12,2 13,4 14,1 14,1 13,4 13,2 13,2 12,6 12,1 13,3 13,9 14,3 13,5Renewable energy forms 4,5 5,4 6,1 6,8 9,1 11,4 15,8 17,1 19,3 20,0 21,4 22,4 23,3
Gross Electricity Generation in GWhe 2562823 2712209 2991720 3274121 3312980 3613745 3645321 3762072 3780339 3990186 4222325 4447319 4620421 1,6 1,0 1,0 0,4 1,1 0,9Nuclear 794718 881662 944823 997519 911418 920491 871965 833383 782075 864300 898050 944006 952038 1,7 -0,4 -0,4 -1,1 1,4 0,6Hydro & wind 292648 330306 375545 378836 514979 698335 967118 1093798 1316289 1445535 1620977 1735525 1855756 2,5 3,2 6,5 3,1 2,1 1,4Thermal (incl. biomass) 1475456 1500241 1671352 1897765 1886583 1994918 1806239 1834891 1681975 1680351 1703298 1767788 1812628 1,3 1,2 -0,4 -0,7 0,1 0,6
Fuel Inputs for Thermal Power Generation 383492 362334 382613 424208 410755 427883 389444 392044 361342 350349 339566 339866 343621 0,0 0,7 -0,5 -0,7 -0,6 0,1Solids 263837 230040 223012 229245 208913 212061 172763 167428 136756 118877 100480 98977 99662 -1,7 -0,7 -1,9 -2,3 -3,0 -0,1Oil (including refinery gas) 54404 51463 39294 29780 15695 15188 8979 12402 12388 15436 17387 20231 20607 -3,2 -8,8 -5,4 3,3 3,4 1,7Gas 56754 67806 102408 134637 145390 142400 125116 122606 120044 123468 125568 121715 124120 6,1 3,6 -1,5 -0,4 0,5 -0,1Biomass & Waste 5724 10033 14960 25901 35356 52271 76372 82943 85031 85162 88407 91143 91361 10,1 9,0 8,0 1,1 0,4 0,3Geothermal heat 2774 2992 2939 4645 5400 5963 6213 6664 7122 7406 7724 7800 7872 0,6 6,3 1,4 1,4 0,8 0,2Hydrogen - Methanol 0 0 0 0 0 0 0 0 0 0 0 0 0
Fuel Input in other transformation proc. 839073 814654 827098 842975 793113 803071 776300 766396 746743 736376 724836 717189 711318 -0,1 -0,4 -0,2 -0,4 -0,3 -0,2Refineries 679426 705954 735244 758152 718218 720744 689515 679553 659477 649983 640382 632962 627528 0,8 -0,2 -0,4 -0,4 -0,3 -0,2Biofuels and hydrogen production 2 202 610 3129 12209 19513 28618 30946 34309 34435 34686 35133 35769 79,6 34,9 8,9 1,8 0,1 0,3District heating 32960 23240 19323 16212 15409 15322 13687 13190 13423 14265 13242 12207 11198 -5,2 -2,2 -1,2 -0,2 -0,1 -1,7Others 126685 85258 71921 65482 47277 47493 44479 42707 39533 37694 36527 36887 36823 -5,5 -4,1 -0,6 -1,2 -0,8 0,1
Energy Branch Consumption 82379 88696 88176 96033 91074 90307 85126 83086 77769 76037 75036 74997 74079 0,7 0,3 -0,7 -0,9 -0,4 -0,1Non-Energy Uses 97931 110541 112495 117477 111510 115326 117845 118225 119183 120291 121266 122262 123092 1,4 -0,1 0,6 0,1 0,2 0,1Final Energy Demand 1068710 1069989 1112989 1173676 1160910 1214761 1157872 1148252 1136214 1138392 1141619 1151330 1156559 0,4 0,4 0,0 -0,2 0,0 0,1by sectorIndustry 365650 328513 326949 326308 310965 322828 318673 315968 314300 318427 327826 338492 350391 -1,1 -0,5 0,2 -0,1 0,4 0,7 - energy intensive industries 234722 214526 213112 210991 192086 196730 191465 187221 183614 182826 184911 187198 189754 -1,0 -1,0 0,0 -0,4 0,1 0,3 - other industrial sectors 130928 113987 113837 115317 118878 126099 127208 128747 130686 135602 142915 151294 160638 -1,4 0,4 0,7 0,3 0,9 1,2Residential 264307 280418 286784 308104 306404 320964 289275 282307 281757 281704 280210 280297 277205 0,8 0,7 -0,6 -0,3 -0,1 -0,1Tertiary 158484 160442 159866 176859 173576 183822 167174 165382 164934 166522 167126 168815 168144 0,1 0,8 -0,4 -0,1 0,1 0,1Transport 280269 300617 339389 362405 369964 387147 382749 384595 375223 371739 366457 363726 360820 1,9 0,9 0,3 -0,2 -0,2 -0,2by fuel
Solids 125031 84977 61454 54486 47496 47065 43019 40725 37186 34923 34368 34026 33887 -6,9 -2,5 -1,0 -1,4 -0,8 -0,1Oil 444429 456959 478882 495857 477192 477043 445487 437131 418452 409529 399224 392154 383567 0,7 0,0 -0,7 -0,6 -0,5 -0,4Gas 227902 245996 265552 283524 268367 273535 226044 214901 212684 205436 198786 196074 192096 1,5 0,1 -1,7 -0,6 -0,7 -0,3Electricity 184145 193367 216403 237537 241828 264545 267064 275001 278517 294300 310981 327092 339827 1,6 1,1 1,0 0,4 1,1 0,9Heat (from CHP and District Heating) (A) 48610 44616 40061 44441 57335 71257 77936 82605 85099 91632 93998 96950 98920 -1,9 3,7 3,1 0,9 1,0 0,5Other 38592 44073 50640 57832 68692 81316 98321 97888 104276 102572 104261 105034 108261 2,8 3,1 3,7 0,6 0,0 0,4
CO2 Emissions (Mt of CO2 - sec approach) 4030,6 3800,1 3810,6 3946,6 3686,1 3688,6 3211,3 3122,7 2904,1 2753,4 2536,8 2414,6 2367,4 -0,6 -0,3 -1,4 -1,0 -1,3 -0,7Power generation/District heating 1484,3 1321,2 1320,8 1381,1 1269,1 1273,8 1035,4 1017,4 886,4 803,7 647,7 564,8 553,3 -1,2 -0,4 -2,0 -1,5 -3,1 -1,6Energy Branch 152,2 171,0 170,2 181,6 157,4 146,3 130,1 121,3 110,3 94,8 82,6 68,6 68,3 1,1 -0,8 -1,9 -1,6 -2,8 -1,9Industry 781,4 678,1 623,0 581,9 497,8 483,8 442,1 419,0 399,4 383,3 382,1 391,4 399,3 -2,2 -2,2 -1,2 -1,0 -0,4 0,4Residential 499,4 481,6 466,2 486,7 467,3 467,1 380,6 351,3 341,7 332,1 318,6 308,7 293,1 -0,7 0,0 -2,0 -1,1 -0,7 -0,8Tertiary 300,5 275,3 242,0 262,2 246,3 240,1 187,0 180,9 178,7 173,8 166,7 162,6 156,8 -2,1 0,2 -2,7 -0,5 -0,7 -0,6Transport 812,7 872,9 988,5 1053,1 1048,2 1077,6 1036,1 1032,8 987,7 965,8 939,1 918,6 896,6 2,0 0,6 -0,1 -0,5 -0,5 -0,5
CO2 Emissions Index (1990=100) 100,0 94,3 94,5 97,9 91,5 91,5 79,7 77,5 72,1 68,3 62,9 59,9 58,7CO2 Emissions (Mt of CO2 - ref approach) 4172,0 3950,7 3922,7 4087,6 3753,2 3756,3 3280,2 3189,8 2972,4 2819,5 2601,4 2477,3 2434,3 -0,6 -0,4 -1,3 -1,0 -1,3 -0,7
EU27: Current Policy Initiatives scenario
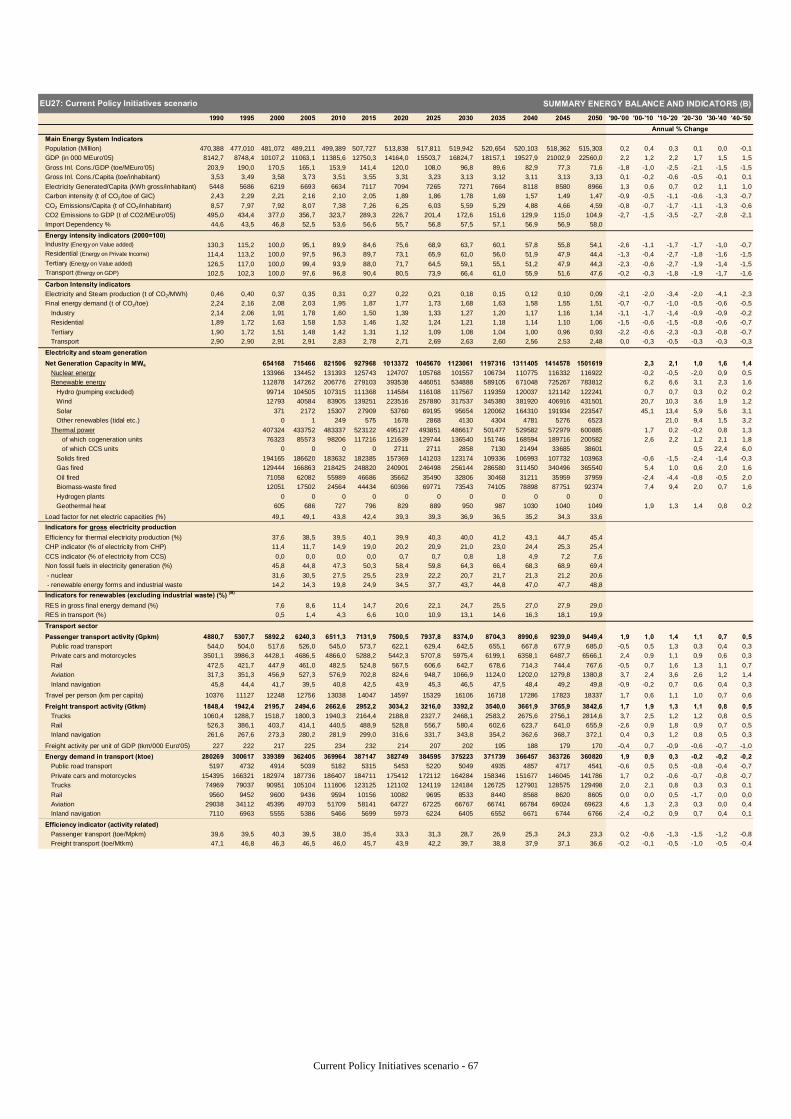
Current Policy Initiatives scenario - 67
SUMMARY ENERGY BALANCE AND INDICATORS (B)1990 1995 2000 2005 2010 2015 2020 2025 2030 2035 2040 2045 2050 '90-'00 '00-'10 '10-'20 '20-'30 '30-'40 '40-'50
Annual % ChangeMain Energy System IndicatorsPopulation (Million) 470,388 477,010 481,072 489,211 499,389 507,727 513,838 517,811 519,942 520,654 520,103 518,362 515,303 0,2 0,4 0,3 0,1 0,0 -0,1GDP (in 000 MEuro'05) 8142,7 8748,4 10107,2 11063,1 11385,6 12750,3 14164,0 15503,7 16824,7 18157,1 19527,9 21002,9 22560,0 2,2 1,2 2,2 1,7 1,5 1,5Gross Inl. Cons./GDP (toe/MEuro'05) 203,9 190,0 170,5 165,1 153,9 141,4 120,0 108,0 96,8 89,6 82,9 77,3 71,6 -1,8 -1,0 -2,5 -2,1 -1,5 -1,5Gross Inl. Cons./Capita (toe/inhabitant) 3,53 3,49 3,58 3,73 3,51 3,55 3,31 3,23 3,13 3,12 3,11 3,13 3,13 0,1 -0,2 -0,6 -0,5 -0,1 0,1Electricity Generated/Capita (kWh gross/inhabitant) 5448 5686 6219 6693 6634 7117 7094 7265 7271 7664 8118 8580 8966 1,3 0,6 0,7 0,2 1,1 1,0Carbon intensity (t of CO2/toe of GIC) 2,43 2,29 2,21 2,16 2,10 2,05 1,89 1,86 1,78 1,69 1,57 1,49 1,47 -0,9 -0,5 -1,1 -0,6 -1,3 -0,7CO2 Emissions/Capita (t of CO2/inhabitant) 8,57 7,97 7,92 8,07 7,38 7,26 6,25 6,03 5,59 5,29 4,88 4,66 4,59 -0,8 -0,7 -1,7 -1,1 -1,3 -0,6CO2 Emissions to GDP (t of CO2/MEuro'05) 495,0 434,4 377,0 356,7 323,7 289,3 226,7 201,4 172,6 151,6 129,9 115,0 104,9 -2,7 -1,5 -3,5 -2,7 -2,8 -2,1Import Dependency % 44,6 43,5 46,8 52,5 53,6 56,6 55,7 56,8 57,5 57,1 56,9 56,9 58,0
Energy intensity indicators (2000=100)Industry (Energy on Value added) 130,3 115,2 100,0 95,1 89,9 84,6 75,6 68,9 63,7 60,1 57,8 55,8 54,1 -2,6 -1,1 -1,7 -1,7 -1,0 -0,7Residential (Energy on Private Income) 114,4 113,2 100,0 97,5 96,3 89,7 73,1 65,9 61,0 56,0 51,9 47,9 44,4 -1,3 -0,4 -2,7 -1,8 -1,6 -1,5Tertiary (Energy on Value added) 126,5 117,0 100,0 99,4 93,9 88,0 71,7 64,5 59,1 55,1 51,2 47,9 44,3 -2,3 -0,6 -2,7 -1,9 -1,4 -1,5Transport (Energy on GDP) 102,5 102,3 100,0 97,6 96,8 90,4 80,5 73,9 66,4 61,0 55,9 51,6 47,6 -0,2 -0,3 -1,8 -1,9 -1,7 -1,6
Carbon Intensity indicatorsElectricity and Steam production (t of CO2/MWh) 0,46 0,40 0,37 0,35 0,31 0,27 0,22 0,21 0,18 0,15 0,12 0,10 0,09 -2,1 -2,0 -3,4 -2,0 -4,1 -2,3Final energy demand (t of CO2/toe) 2,24 2,16 2,08 2,03 1,95 1,87 1,77 1,73 1,68 1,63 1,58 1,55 1,51 -0,7 -0,7 -1,0 -0,5 -0,6 -0,5
Industry 2,14 2,06 1,91 1,78 1,60 1,50 1,39 1,33 1,27 1,20 1,17 1,16 1,14 -1,1 -1,7 -1,4 -0,9 -0,9 -0,2Residential 1,89 1,72 1,63 1,58 1,53 1,46 1,32 1,24 1,21 1,18 1,14 1,10 1,06 -1,5 -0,6 -1,5 -0,8 -0,6 -0,7Tertiary 1,90 1,72 1,51 1,48 1,42 1,31 1,12 1,09 1,08 1,04 1,00 0,96 0,93 -2,2 -0,6 -2,3 -0,3 -0,8 -0,7Transport 2,90 2,90 2,91 2,91 2,83 2,78 2,71 2,69 2,63 2,60 2,56 2,53 2,48 0,0 -0,3 -0,5 -0,3 -0,3 -0,3
Electricity and steam generationNet Generation Capacity in MWe 654168 715466 821506 927968 1013372 1045670 1123061 1197316 1311405 1414578 1501619 2,3 2,1 1,0 1,6 1,4
Nuclear energy 133966 134452 131393 125743 124707 105768 101557 106734 110775 116332 116922 -0,2 -0,5 -2,0 0,9 0,5Renewable energy 112878 147262 206776 279103 393538 446051 534888 589105 671048 725267 783812 6,2 6,6 3,1 2,3 1,6
Hydro (pumping excluded) 99714 104505 107315 111368 114584 116108 117567 119359 120037 121142 122241 0,7 0,7 0,3 0,2 0,2Wind 12793 40584 83905 139251 223516 257880 317537 345380 381920 406916 431501 20,7 10,3 3,6 1,9 1,2Solar 371 2172 15307 27909 53760 69195 95654 120062 164310 191934 223547 45,1 13,4 5,9 5,6 3,1Other renewables (tidal etc.) 0 1 249 575 1678 2868 4130 4304 4781 5276 6523 21,0 9,4 1,5 3,2
Thermal power 407324 433752 483337 523122 495127 493851 486617 501477 529582 572979 600885 1,7 0,2 -0,2 0,8 1,3of which cogeneration units 76323 85573 98206 117216 121639 129744 136540 151746 168594 189716 200582 2,6 2,2 1,2 2,1 1,8of which CCS units 0 0 0 0 2711 2711 2858 7130 21494 33685 38601 0,5 22,4 6,0
Solids fired 194165 186620 183632 182385 157369 141203 123174 109336 106993 107732 103963 -0,6 -1,5 -2,4 -1,4 -0,3Gas fired 129444 166863 218425 248820 240901 246498 256144 286580 311450 340496 365540 5,4 1,0 0,6 2,0 1,6Oil fired 71058 62082 55989 46686 35662 35490 32806 30468 31211 35959 37959 -2,4 -4,4 -0,8 -0,5 2,0Biomass-waste fired 12051 17502 24564 44434 60366 69771 73543 74105 78898 87751 92374 7,4 9,4 2,0 0,7 1,6Hydrogen plants 0 0 0 0 0 0 0 0 0 0 0Geothermal heat 605 686 727 796 829 889 950 987 1030 1040 1049 1,9 1,3 1,4 0,8 0,2
Load factor for net electric capacities (%) 49,1 49,1 43,8 42,4 39,3 39,3 36,9 36,5 35,2 34,3 33,6Indicators for gross electricity productionEfficiency for thermal electricity production (%) 37,6 38,5 39,5 40,1 39,9 40,3 40,0 41,2 43,1 44,7 45,4CHP indicator (% of electricity from CHP) 11,4 11,7 14,9 19,0 20,2 20,9 21,0 23,0 24,4 25,3 25,4CCS indicator (% of electricity from CCS) 0,0 0,0 0,0 0,0 0,7 0,7 0,8 1,8 4,9 7,2 7,6Non fossil fuels in electricity generation (%) 45,8 44,8 47,3 50,3 58,4 59,8 64,3 66,4 68,3 68,9 69,4 - nuclear 31,6 30,5 27,5 25,5 23,9 22,2 20,7 21,7 21,3 21,2 20,6 - renewable energy forms and industrial waste 14,2 14,3 19,8 24,9 34,5 37,7 43,7 44,8 47,0 47,7 48,8Indicators for renewables (excluding industrial waste) (%) (B)
RES in gross final energy demand (%) 7,6 8,6 11,4 14,7 20,6 22,1 24,7 25,5 27,0 27,9 29,0RES in transport (%) 0,5 1,4 4,3 6,6 10,0 10,9 13,1 14,6 16,3 18,1 19,9
Transport sectorPassenger transport activity (Gpkm) 4880,7 5307,7 5892,2 6240,3 6511,3 7131,9 7500,5 7937,8 8374,0 8704,3 8990,6 9239,0 9449,4 1,9 1,0 1,4 1,1 0,7 0,5
Public road transport 544,0 504,0 517,6 526,0 545,0 573,7 622,1 629,4 642,5 655,1 667,8 677,9 685,0 -0,5 0,5 1,3 0,3 0,4 0,3Private cars and motorcycles 3501,1 3986,3 4428,1 4686,5 4866,0 5288,2 5442,3 5707,8 5975,4 6199,1 6358,1 6487,7 6566,1 2,4 0,9 1,1 0,9 0,6 0,3Rail 472,5 421,7 447,9 461,0 482,5 524,8 567,5 606,6 642,7 678,6 714,3 744,4 767,6 -0,5 0,7 1,6 1,3 1,1 0,7Aviation 317,3 351,3 456,9 527,3 576,9 702,8 824,6 948,7 1066,9 1124,0 1202,0 1279,8 1380,8 3,7 2,4 3,6 2,6 1,2 1,4Inland navigation 45,8 44,4 41,7 39,5 40,8 42,5 43,9 45,3 46,5 47,5 48,4 49,2 49,8 -0,9 -0,2 0,7 0,6 0,4 0,3
Travel per person (km per capita) 10376 11127 12248 12756 13038 14047 14597 15329 16106 16718 17286 17823 18337 1,7 0,6 1,1 1,0 0,7 0,6
Freight transport activity (Gtkm) 1848,4 1942,4 2195,7 2494,6 2662,6 2952,2 3034,2 3216,0 3392,2 3540,0 3661,9 3765,9 3842,6 1,7 1,9 1,3 1,1 0,8 0,5Trucks 1060,4 1288,7 1518,7 1800,3 1940,3 2164,4 2188,8 2327,7 2468,1 2583,2 2675,6 2756,1 2814,6 3,7 2,5 1,2 1,2 0,8 0,5Rail 526,3 386,1 403,7 414,1 440,5 488,9 528,8 556,7 580,4 602,6 623,7 641,0 655,9 -2,6 0,9 1,8 0,9 0,7 0,5Inland navigation 261,6 267,6 273,3 280,2 281,9 299,0 316,6 331,7 343,8 354,2 362,6 368,7 372,1 0,4 0,3 1,2 0,8 0,5 0,3
Freight activity per unit of GDP (tkm/000 Euro'05) 227 222 217 225 234 232 214 207 202 195 188 179 170 -0,4 0,7 -0,9 -0,6 -0,7 -1,0Energy demand in transport (ktoe) 280269 300617 339389 362405 369964 387147 382749 384595 375223 371739 366457 363726 360820 1,9 0,9 0,3 -0,2 -0,2 -0,2
Public road transport 5197 4732 4914 5039 5182 5315 5453 5220 5049 4935 4857 4717 4541 -0,6 0,5 0,5 -0,8 -0,4 -0,7Private cars and motorcycles 154395 166321 182974 187736 186407 184711 175412 172112 164284 158346 151677 146045 141786 1,7 0,2 -0,6 -0,7 -0,8 -0,7Trucks 74969 79037 90951 105104 111606 123125 121102 124119 124184 126725 127901 128575 129498 2,0 2,1 0,8 0,3 0,3 0,1Rail 9560 9452 9600 9436 9594 10156 10082 9695 8533 8440 8568 8620 8605 0,0 0,0 0,5 -1,7 0,0 0,0Aviation 29038 34112 45395 49703 51709 58141 64727 67225 66767 66741 66784 69024 69623 4,6 1,3 2,3 0,3 0,0 0,4Inland navigation 7110 6963 5555 5386 5466 5699 5973 6224 6405 6552 6671 6744 6766 -2,4 -0,2 0,9 0,7 0,4 0,1
Efficiency indicator (activity related)Passenger transport (toe/Mpkm) 39,6 39,5 40,3 39,5 38,0 35,4 33,3 31,3 28,7 26,9 25,3 24,3 23,3 0,2 -0,6 -1,3 -1,5 -1,2 -0,8Freight transport (toe/Mtkm) 47,1 46,8 46,3 46,5 46,0 45,7 43,9 42,2 39,7 38,8 37,9 37,1 36,6 -0,2 -0,1 -0,5 -1,0 -0,5 -0,4
EU27: Current Policy Initiatives scenario

Energy Efficiency scenario - 68
2. Energy Efficiency scenario
SUMMARY ENERGY BALANCE AND INDICATORS (A) ktoe 1990 1995 2000 2005 2010 2015 2020 2025 2030 2035 2040 2045 2050 '90-'00 '00-'10 '10-'20 '20-'30 '30-'40 '40-'50
Annual % ChangeProduction 936047 950181 941860 900326 833839 803043 761596 694780 659682 659971 677363 685507 680022 0,1 -1,2 -0,9 -1,4 0,3 0,0
Solids 366477 277810 213423 196277 177968 165896 132685 105933 84105 61497 48888 45343 41400 -5,3 -1,8 -2,9 -4,5 -5,3 -1,6Oil 129551 171052 173006 134290 104398 73498 46081 34968 31144 22909 14606 6974 2193 2,9 -4,9 -7,9 -3,8 -7,3 -17,3Natural gas 162447 188965 207559 188677 164866 129035 110135 89779 73329 60554 48415 33392 23763 2,5 -2,3 -4,0 -4,0 -4,1 -6,9Nuclear 202589 223028 243761 257360 235016 237212 217631 187614 161520 165771 165576 157847 146133 1,9 -0,4 -0,8 -2,9 0,2 -1,2Renewable energy sources 74984 89326 104111 123722 151591 197402 255065 276486 309583 349241 399878 441951 466532 3,3 3,8 5,3 2,0 2,6 1,6
Hydro 25101 28054 30374 26395 30008 30262 30768 31520 32079 32558 33059 33517 33906 1,9 -0,1 0,3 0,4 0,3 0,3Biomass & Waste 46473 57201 67982 85129 98969 122484 146500 151294 154860 177498 203668 227210 235869 3,9 3,8 4,0 0,6 2,8 1,5Wind 67 350 1913 6061 12781 27714 50673 61151 80495 90167 105631 115095 122373 39,8 20,9 14,8 4,7 2,8 1,5Solar and others 153 274 421 807 3436 9426 18321 22558 29364 35042 42746 49933 57105 10,7 23,3 18,2 4,8 3,8 2,9Geothermal 3190 3447 3421 5331 6398 7515 8803 9963 12785 13977 14775 16196 17279 0,7 6,5 3,2 3,8 1,5 1,6
Net Imports 756079 738600 826299 986048 969505 1045609 935509 869497 843906 748776 638784 540949 447418 0,9 1,6 -0,4 -1,0 -2,7 -3,5Solids 81846 79338 98645 126639 103139 114716 90982 66752 47554 25532 10900 787 2967 1,9 0,4 -1,2 -6,3 -13,7 -12,2Oil 535645 512185 533039 599851 580690 607132 577878 538823 515852 442342 350767 255642 190463 0,0 0,9 0,0 -1,1 -3,8 -5,9 - Crude oil and Feedstocks 508460 494000 513725 581995 578257 599933 574739 540765 519973 449730 362486 278648 213455 0,1 1,2 -0,1 -1,0 -3,5 -5,2 - Oil products 27185 18185 19314 17856 2433 7199 3139 -1942 -4121 -7388 -11719 -23005 -22993 -3,4 -18,7 2,6Natural gas 135121 145288 192531 257366 277990 316766 254933 258021 274177 272660 266365 268387 232950 3,6 3,7 -0,9 0,7 -0,3 -1,3Electricity 3323 1508 1686 971 696 -620 -2172 -2767 -2085 -2423 -2391 -2221 -2631 -6,6 -8,5Renewable energy forms 144 279 397 1222 6989 7615 13889 8669 8409 10664 13142 18355 23669 10,7 33,2 7,1 -4,9 4,6 6,1
Gross Inland Consumption 1660159 1662517 1723099 1825989 1753292 1796536 1644191 1511566 1451696 1359670 1269261 1181523 1084235 0,4 0,2 -0,6 -1,2 -1,3 -1,6Solids 452940 364248 321007 319922 281108 280612 223666 172685 131659 87029 59788 46130 44367 -3,4 -1,3 -2,3 -5,2 -7,6 -2,9Oil 631058 650858 658727 676859 635036 628513 571044 521079 495657 419240 326444 232336 167513 0,4 -0,4 -1,1 -1,4 -4,1 -6,5Natural gas 294905 333268 393417 445998 442856 445801 365068 347800 347506 333214 314780 301779 256714 2,9 1,2 -1,9 -0,5 -1,0 -2,0Nuclear 202589 223028 243761 257360 235016 237212 217631 187614 161520 165771 165576 157847 146133 1,9 -0,4 -0,8 -2,9 0,2 -1,2Electricity 3323 1508 1686 971 696 -620 -2172 -2767 -2085 -2423 -2391 -2221 -2631 -6,6 -8,5Renewable energy forms 75343 89606 104501 124880 158580 205017 268954 285155 317439 356839 405063 445653 472139 3,3 4,3 5,4 1,7 2,5 1,5
as % in Gross Inland ConsumptionSolids 27,3 21,9 18,6 17,5 16,0 15,6 13,6 11,4 9,1 6,4 4,7 3,9 4,1Oil 38,0 39,1 38,2 37,1 36,2 35,0 34,7 34,5 34,1 30,8 25,7 19,7 15,4Natural gas 17,8 20,0 22,8 24,4 25,3 24,8 22,2 23,0 23,9 24,5 24,8 25,5 23,7Nuclear 12,2 13,4 14,1 14,1 13,4 13,2 13,2 12,4 11,1 12,2 13,0 13,4 13,5Renewable energy forms 4,5 5,4 6,1 6,8 9,0 11,4 16,4 18,9 21,9 26,2 31,9 37,7 43,5
Gross Electricity Generation in GWhe 2562823 2712209 2991720 3274121 3319449 3587278 3554658 3441083 3444401 3644175 3966432 4189457 4280835 1,6 1,0 0,7 -0,3 1,4 0,8Nuclear 794718 881662 944823 997519 911418 920404 846514 734218 639274 659717 661427 634217 608141 1,7 -0,4 -0,7 -2,8 0,3 -0,8Hydro & wind 292648 330306 375545 378836 514979 707557 1017720 1177498 1473125 1649559 1912200 2105358 2269402 2,5 3,2 7,0 3,8 2,6 1,7Thermal (incl. biomass) 1475456 1500241 1671352 1897765 1893052 1959318 1690425 1529367 1332002 1334900 1392805 1449882 1403292 1,3 1,3 -1,1 -2,4 0,4 0,1
Fuel Inputs for Thermal Power Generation 383492 362334 382613 424208 412218 422207 367293 329297 295031 283734 282175 281605 269007 0,0 0,7 -1,1 -2,2 -0,4 -0,5Solids 263837 230040 223012 229245 209766 210376 158208 111997 75238 45028 30014 32184 37868 -1,7 -0,6 -2,8 -7,2 -8,8 2,4Oil (including refinery gas) 54404 51463 39294 29780 15651 13381 8038 7615 7868 8538 7631 5403 380 -3,2 -8,8 -6,4 -0,2 -0,3 -25,9Gas 56754 67806 102408 134637 145862 139967 117729 117389 112273 122652 124658 118231 105581 6,1 3,6 -2,1 -0,5 1,1 -1,6Biomass & Waste 5724 10033 14960 25901 35540 52481 76900 85207 89700 96904 108643 113964 113081 10,1 9,0 8,0 1,6 1,9 0,4Geothermal heat 2774 2992 2939 4645 5400 6002 6418 7089 9951 10612 11229 11824 12096 0,6 6,3 1,7 4,5 1,2 0,7Hydrogen - Methanol 0 0 0 0 0 0 0 0 0 0 0 0 0
Fuel Input in other transformation proc. 839073 814654 827098 842975 793734 792139 742125 692832 665908 588045 492738 389690 316019 -0,1 -0,4 -0,7 -1,1 -3,0 -4,3Refineries 679426 705954 735244 758152 718088 708691 655435 609166 583170 502456 402373 299193 221469 0,8 -0,2 -0,9 -1,2 -3,6 -5,8Biofuels and hydrogen production 2 202 610 3129 12208 19510 26660 24758 24625 40526 57665 73263 85684 79,6 34,9 8,1 -0,8 8,9 4,0District heating 32960 23240 19323 16212 15967 15982 13707 13042 12473 9350 7007 5001 3072 -5,2 -1,9 -1,5 -0,9 -5,6 -7,9Others 126685 85258 71921 65482 47470 47956 46323 45867 45640 35714 25692 12234 5794 -5,5 -4,1 -0,2 -0,1 -5,6 -13,8
Energy Branch Consumption 82379 88696 88176 96033 91099 89852 82278 75017 70319 64303 59086 59346 55593 0,7 0,3 -1,0 -1,6 -1,7 -0,6Non-Energy Uses 97931 110541 112495 117477 111500 115323 118064 119577 121352 118886 116180 106083 98084 1,4 -0,1 0,6 0,3 -0,4 -1,7Final Energy Demand 1068710 1069989 1112989 1173676 1160767 1212131 1120527 1044943 1024697 954176 877444 807998 738230 0,4 0,4 -0,4 -0,9 -1,5 -1,7by sectorIndustry 365650 328513 326949 326308 310910 322853 317442 316773 317290 303896 294495 276110 259502 -1,1 -0,5 0,2 0,0 -0,7 -1,3 - energy intensive industries 234722 214526 213112 210991 192094 196880 191006 188606 186913 175155 165311 150100 136307 -1,0 -1,0 -0,1 -0,2 -1,2 -1,9 - other industrial sectors 130928 113987 113837 115317 118816 125973 126437 128167 130376 128742 129184 126010 123194 -1,4 0,4 0,6 0,3 -0,1 -0,5Residential 264307 280418 286784 308104 306282 320006 275661 248067 240692 224271 205576 188243 165480 0,8 0,7 -1,0 -1,3 -1,6 -2,1Tertiary 158484 160442 159866 176859 173610 182117 158198 133819 130461 116183 102818 93756 84424 0,1 0,8 -0,9 -1,9 -2,4 -2,0Transport 280269 300617 339389 362405 369965 387155 369225 346283 336253 309827 274555 249888 228825 1,9 0,9 0,0 -0,9 -2,0 -1,8by fuel
Solids 125031 84977 61454 54486 47354 44926 40766 35674 30340 20573 14313 6593 2733 -6,9 -2,6 -1,5 -2,9 -7,2 -15,3Oil 444429 456959 478882 495857 476981 476342 428033 386634 363986 299457 222062 158764 115466 0,7 0,0 -1,1 -1,6 -4,8 -6,3Gas 227902 245996 265552 283524 267988 275277 219884 200299 204484 178877 150969 127025 91728 1,5 0,1 -2,0 -0,7 -3,0 -4,9Electricity 184145 193367 216403 237537 242288 262641 261006 255066 258178 268371 280557 280314 275498 1,6 1,1 0,7 -0,1 0,8 -0,2Heat (from CHP and District Heating) (A) 48610 44616 40061 44441 57863 72183 77278 79968 80195 81302 80089 77103 74105 -1,9 3,7 2,9 0,4 0,0 -0,8Other 38592 44073 50640 57832 68292 80762 93560 87302 87515 105596 129454 158199 178701 2,8 3,0 3,2 -0,7 4,0 3,3
CO2 Emissions (Mt of CO2 - sec approach) 4030,6 3800,1 3810,6 3946,6 3690,0 3666,5 3062,8 2666,1 2419,0 1945,1 1429,3 967,6 628,5 -0,6 -0,3 -1,8 -2,3 -5,1 -7,9Power generation/District heating 1484,3 1321,2 1320,8 1381,1 1275,0 1258,0 963,2 772,0 609,0 456,6 283,6 118,6 26,9 -1,2 -0,4 -2,8 -4,5 -7,4 -21,0Energy Branch 152,2 171,0 170,2 181,6 157,2 145,6 126,9 110,4 102,9 76,9 59,4 43,5 27,2 1,1 -0,8 -2,1 -2,1 -5,4 -7,5Industry 781,4 678,1 623,0 581,9 497,7 480,4 441,8 428,5 426,1 360,9 304,4 233,9 167,5 -2,2 -2,2 -1,2 -0,4 -3,3 -5,8Residential 499,4 481,6 466,2 486,7 466,4 465,5 360,8 298,8 285,1 230,4 165,8 114,5 62,7 -0,7 0,0 -2,5 -2,3 -5,3 -9,3Tertiary 300,5 275,3 242,0 262,2 245,5 239,4 180,9 151,3 146,4 119,5 87,9 59,3 34,9 -2,1 0,1 -3,0 -2,1 -5,0 -8,8Transport 812,7 872,9 988,5 1053,1 1048,2 1077,6 989,2 905,1 849,5 700,8 528,3 397,8 309,3 2,0 0,6 -0,6 -1,5 -4,6 -5,2
CO2 Emissions Index (1990=100) 100,0 94,3 94,5 97,9 91,5 91,0 76,0 66,1 60,0 48,3 35,5 24,0 15,6CO2 Emissions (Mt of CO2 - ref approach) 4172,0 3950,7 3922,7 4087,6 3757,3 3735,2 3129,3 2730,3 2485,1 2006,8 1494,1 1053,4 727,7 -0,6 -0,4 -1,8 -2,3 -5,0 -6,9
EU27: Energy efficiency

Energy Efficiency scenario - 69
SUMMARY ENERGY BALANCE AND INDICATORS (B)1990 1995 2000 2005 2010 2015 2020 2025 2030 2035 2040 2045 2050 '90-'00 '00-'10 '10-'20 '20-'30 '30-'40 '40-'50
Annual % ChangeMain Energy System IndicatorsPopulation (Million) 470,388 477,010 481,072 489,211 499,389 507,727 513,838 517,811 519,942 520,654 520,103 518,362 515,303 0,2 0,4 0,3 0,1 0,0 -0,1GDP (in 000 MEuro'05) 8142,7 8748,4 10107,2 11063,1 11385,6 12750,3 14164,0 15503,7 16824,7 18157,1 19527,9 21002,9 22560,0 2,2 1,2 2,2 1,7 1,5 1,5Gross Inl. Cons./GDP (toe/MEuro'05) 203,9 190,0 170,5 165,1 154,0 140,9 116,1 97,5 86,3 74,9 65,0 56,3 48,1 -1,8 -1,0 -2,8 -2,9 -2,8 -3,0Gross Inl. Cons./Capita (toe/inhabitant) 3,53 3,49 3,58 3,73 3,51 3,54 3,20 2,92 2,79 2,61 2,44 2,28 2,10 0,1 -0,2 -0,9 -1,4 -1,3 -1,5Electricity Generated/Capita (kWh gross/inhabitant) 5448 5686 6219 6693 6647 7065 6918 6645 6625 6999 7626 8082 8307 1,3 0,7 0,4 -0,4 1,4 0,9Carbon intensity (t of CO2/toe of GIC) 2,43 2,29 2,21 2,16 2,10 2,04 1,86 1,76 1,67 1,43 1,13 0,82 0,58 -0,9 -0,5 -1,2 -1,1 -3,8 -6,4CO2 Emissions/Capita (t of CO2/inhabitant) 8,57 7,97 7,92 8,07 7,39 7,22 5,96 5,15 4,65 3,74 2,75 1,87 1,22 -0,8 -0,7 -2,1 -2,4 -5,1 -7,8CO2 Emissions to GDP (t of CO2/MEuro'05) 495,0 434,4 377,0 356,7 324,1 287,6 216,2 172,0 143,8 107,1 73,2 46,1 27,9 -2,7 -1,5 -4,0 -4,0 -6,5 -9,2Import Dependency % 44,6 43,5 46,8 52,5 53,8 56,6 55,1 55,6 56,1 53,2 48,5 44,1 39,7
Energy intensity indicators (2000=100)Industry (Energy on Value added) 130,3 115,2 100,0 95,1 89,9 84,6 75,3 69,1 64,3 57,4 52,0 45,5 40,0 -2,6 -1,1 -1,8 -1,6 -2,1 -2,6Residential (Energy on Private Income) 114,4 113,2 100,0 97,5 96,2 89,4 69,7 57,9 52,1 44,6 38,1 32,2 26,5 -1,3 -0,4 -3,2 -2,9 -3,1 -3,6Tertiary (Energy on Value added) 126,5 117,0 100,0 99,4 93,9 87,1 67,9 52,2 46,7 38,5 31,5 26,6 22,2 -2,3 -0,6 -3,2 -3,7 -3,9 -3,4Transport (Energy on GDP) 102,5 102,3 100,0 97,6 96,8 90,4 77,6 66,5 59,5 50,8 41,9 35,4 30,2 -0,2 -0,3 -2,2 -2,6 -3,5 -3,2
Carbon Intensity indicatorsElectricity and Steam production (t of CO2/MWh) 0,46 0,40 0,37 0,35 0,31 0,27 0,21 0,17 0,13 0,10 0,06 0,02 0,01 -2,1 -1,9 -3,9 -4,3 -8,3Final energy demand (t of CO2/toe) 2,24 2,16 2,08 2,03 1,95 1,87 1,76 1,71 1,67 1,48 1,24 1,00 0,78 -0,7 -0,7 -1,0 -0,6 -2,9 -4,5
Industry 2,14 2,06 1,91 1,78 1,60 1,49 1,39 1,35 1,34 1,19 1,03 0,85 0,65 -1,1 -1,7 -1,4 -0,4 -2,6 -4,6Residential 1,89 1,72 1,63 1,58 1,52 1,45 1,31 1,20 1,18 1,03 0,81 0,61 0,38 -1,5 -0,7 -1,5 -1,0 -3,8 -7,3Tertiary 1,90 1,72 1,51 1,48 1,41 1,31 1,14 1,13 1,12 1,03 0,85 0,63 0,41 -2,2 -0,7 -2,1 -0,2 -2,7 -7,0Transport 2,90 2,90 2,91 2,91 2,83 2,78 2,68 2,61 2,53 2,26 1,92 1,59 1,35 0,0 -0,3 -0,6 -0,6 -2,7 -3,5
Electricity and steam generationNet Generation Capacity in MWe 654168 715466 821516 922175 1012749 1024363 1111329 1171937 1305302 1401647 1472585 2,3 2,1 0,9 1,6 1,2
Nuclear energy 133966 134452 131393 125743 123107 100140 81678 83169 84304 83228 78908 -0,2 -0,6 -4,0 0,3 -0,7Renewable energy 112878 147262 206776 281934 409965 475929 604380 689196 812765 912993 1011756 6,2 7,1 4,0 3,0 2,2
Hydro (pumping excluded) 99714 104505 107315 111511 114720 116661 118615 120810 121774 123301 125416 0,7 0,7 0,3 0,3 0,3Wind 12793 40584 83905 141830 239169 283249 366453 408508 472133 513679 547588 20,7 11,0 4,4 2,6 1,5Solar 371 2172 15307 28018 54353 73156 115047 155244 213167 269202 329948 45,1 13,5 7,8 6,4 4,5Other renewables (tidal etc.) 0 1 249 575 1724 2863 4265 4635 5691 6811 8804 21,4 9,5 2,9 4,5
Thermal power 407324 433752 483347 514498 479676 448294 425271 399571 408232 405427 381921 1,7 -0,1 -1,2 -0,4 -0,7of which cogeneration units 76247 85453 98320 120241 121929 125299 132343 142413 150906 151283 152391 2,6 2,2 0,8 1,3 0,1of which CCS units 0 0 0 0 2711 2711 2711 17421 59014 110509 148782 0,0 36,1 9,7
Solids fired 194165 186620 183619 182252 153772 126961 106137 84672 74814 73155 70193 -0,6 -1,8 -3,6 -3,4 -0,6Gas fired 129444 166863 218530 240906 229892 222902 218995 211695 220205 211816 187304 5,4 0,5 -0,5 0,1 -1,6Oil fired 71058 62082 55901 46054 34548 27877 24196 20255 17577 15867 14705 -2,4 -4,7 -3,5 -3,1 -1,8Biomass-waste fired 12051 17502 24569 44484 60608 69609 74617 81537 94142 103016 108110 7,4 9,4 2,1 2,4 1,4Hydrogen plants 0 0 0 0 0 0 0 0 0 0 0Geothermal heat 605 686 727 801 856 945 1325 1413 1495 1574 1610 1,9 1,6 4,5 1,2 0,7
Load factor for net electric capacities (%) 49,1 49,1 43,9 42,4 38,4 36,9 34,2 34,3 33,3 32,5 31,5Indicators for gross electricity productionEfficiency for thermal electricity production (%) 37,6 38,5 39,5 39,9 39,6 39,9 38,8 40,5 42,4 44,3 44,9CHP indicator (% of electricity from CHP) 11,4 11,7 14,9 19,0 20,1 21,4 20,4 21,1 19,8 19,0 17,9CCS indicator (% of electricity from CCS) 0,0 0,0 0,0 0,0 0,5 0,6 0,7 3,3 10,0 17,2 20,5Non fossil fuels in electricity generation (%) 45,8 44,8 47,2 51,0 60,6 65,2 71,4 74,0 76,1 76,8 78,4 - nuclear 31,6 30,5 27,5 25,7 23,8 21,3 18,6 18,1 16,7 15,1 14,2 - renewable energy forms and industrial waste 14,2 14,3 19,7 25,3 36,8 43,8 52,9 55,9 59,5 61,7 64,2Indicators for renewables (excluding industrial waste) (%) (B)
RES in gross final energy demand (%) 7,6 8,6 11,4 14,7 21,3 24,3 27,6 33,3 41,3 49,5 57,3RES in transport (%) 0,5 1,4 4,3 6,6 10,9 14,1 19,1 31,0 44,7 55,6 63,7
Transport sectorPassenger transport activity (Gpkm) 4880,7 5307,7 5892,2 6240,3 6511,3 7132,8 7455,9 7747,0 8191,1 8478,2 8718,8 8969,1 9155,4 1,9 1,0 1,4 0,9 0,6 0,5
Public road transport 544,0 504,0 517,6 526,0 545,0 573,7 643,5 703,6 750,2 796,5 837,2 876,4 915,3 -0,5 0,5 1,7 1,5 1,1 0,9Private cars and motorcycles 3501,1 3986,3 4428,1 4686,5 4866,0 5288,2 5387,0 5471,6 5714,0 5823,0 5913,0 5993,6 6037,2 2,4 0,9 1,0 0,6 0,3 0,2Rail 472,5 421,7 447,9 461,0 482,5 525,7 611,8 675,0 735,2 795,9 852,4 923,3 999,7 -0,5 0,7 2,4 1,9 1,5 1,6Aviation 317,3 351,3 456,9 527,3 576,9 702,8 770,7 852,5 945,0 1014,0 1065,5 1123,4 1149,4 3,7 2,4 2,9 2,1 1,2 0,8Inland navigation 45,8 44,4 41,7 39,5 40,8 42,5 43,0 44,3 46,7 48,8 50,7 52,4 53,8 -0,9 -0,2 0,5 0,8 0,8 0,6
Travel per person (km per capita) 10376 11127 12248 12756 13038 14048 14510 14961 15754 16284 16764 17303 17767 1,7 0,6 1,1 0,8 0,6 0,6
Freight transport activity (Gtkm) 1848,4 1942,4 2195,7 2494,6 2662,6 2952,5 3044,6 3126,6 3290,4 3393,0 3492,5 3558,0 3575,6 1,7 1,9 1,3 0,8 0,6 0,2Trucks 1060,4 1288,7 1518,7 1800,3 1940,3 2164,3 2135,3 2124,4 2218,2 2246,4 2271,7 2269,4 2222,9 3,7 2,5 1,0 0,4 0,2 -0,2Rail 526,3 386,1 403,7 414,1 440,5 489,2 580,8 647,8 698,7 753,4 811,6 864,6 916,6 -2,6 0,9 2,8 1,9 1,5 1,2Inland navigation 261,6 267,6 273,3 280,2 281,9 299,0 328,5 354,5 373,6 393,2 409,2 424,1 436,0 0,4 0,3 1,5 1,3 0,9 0,6
Freight activity per unit of GDP (tkm/000 Euro'05) 227 222 217 225 234 232 215 202 196 187 179 169 158 -0,4 0,7 -0,8 -0,9 -0,9 -1,2Energy demand in transport (ktoe) 280269 300617 339389 362405 369965 387155 369225 346283 336253 309827 274555 249888 228825 1,9 0,9 0,0 -0,9 -2,0 -1,8
Public road transport 5197 4732 4914 5039 5182 5315 5450 5424 5067 4778 4027 3552 3413 -0,6 0,5 0,5 -0,7 -2,3 -1,6Private cars and motorcycles 154395 166321 182974 187736 186407 184712 166635 144181 134057 114545 92322 80824 71252 1,7 0,2 -1,1 -2,2 -3,7 -2,6Trucks 74969 79037 90951 105104 111606 123126 118018 114862 115960 110166 101954 91543 82474 2,0 2,1 0,6 -0,2 -1,3 -2,1Rail 9560 9452 9600 9436 9595 10163 11135 11258 10127 9926 9624 9080 8645 0,0 0,0 1,5 -0,9 -0,5 -1,1Aviation 29038 34112 45395 49703 51709 58141 61911 64123 64281 63437 59545 57841 56124 4,6 1,3 1,8 0,4 -0,8 -0,6Inland navigation 7110 6963 5555 5386 5466 5699 6076 6435 6761 6975 7083 7048 6917 -2,4 -0,2 1,1 1,1 0,5 -0,2
Efficiency indicator (activity related)Passenger transport (toe/Mpkm) 39,6 39,5 40,3 39,5 38,0 35,4 31,9 28,1 25,4 22,1 18,4 16,3 14,7 0,2 -0,6 -1,7 -2,3 -3,2 -2,2Freight transport (toe/Mtkm) 47,1 46,8 46,3 46,5 46,0 45,7 43,1 41,0 39,0 36,1 32,7 29,1 26,2 -0,2 -0,1 -0,7 -1,0 -1,7 -2,2
EU27: Energy efficiency

Diversified supply technologies scenario - 70
3. Diversified supply technologies scenario
SUMMARY ENERGY BALANCE AND INDICATORS (A) ktoe 1990 1995 2000 2005 2010 2015 2020 2025 2030 2035 2040 2045 2050 '90-'00 '00-'10 '10-'20 '20-'30 '30-'40 '40-'50
Annual % ChangeProduction 936047 950181 941860 900326 833819 806219 782568 741273 710247 736535 769462 779947 759856 0,1 -1,2 -0,6 -1,0 0,8 -0,1
Solids 366477 277810 213423 196277 177950 167093 132831 105139 76032 67826 62855 58584 54278 -5,3 -1,8 -2,9 -5,4 -1,9 -1,5Oil 129551 171052 173006 134290 104398 73577 46284 35883 31973 23886 14992 6914 2258 2,9 -4,9 -7,8 -3,6 -7,3 -17,2Natural gas 162447 188965 207559 188677 164866 129039 110512 89498 72741 61103 48339 33115 23552 2,5 -2,3 -3,9 -4,1 -4,0 -6,9Nuclear 202589 223028 243761 257360 235016 237362 230060 218921 200382 211834 218666 214369 186613 1,9 -0,4 -0,2 -1,4 0,9 -1,6Renewable energy sources 74984 89326 104111 123722 151589 199149 262880 291833 329118 371886 424609 466965 493156 3,3 3,8 5,7 2,3 2,6 1,5
Hydro 25101 28054 30374 26395 30008 30276 30808 31576 32124 32602 33117 33578 33950 1,9 -0,1 0,3 0,4 0,3 0,2Biomass & Waste 46473 57201 67982 85129 98966 122954 149764 158637 164137 186903 212324 236947 246870 3,9 3,8 4,2 0,9 2,6 1,5Wind 67 350 1913 6061 12781 28237 52537 65980 85195 96030 113177 122694 133309 39,8 20,9 15,2 5,0 2,9 1,7Solar and others 153 274 421 807 3436 9380 18828 23562 32182 39368 48097 54414 58226 10,7 23,3 18,5 5,5 4,1 1,9Geothermal 3190 3447 3421 5331 6398 8301 10944 12077 15480 16983 17894 19331 20801 0,7 6,5 5,5 3,5 1,5 1,5
Net Imports 756079 738600 826299 986048 969466 1048683 951682 911619 875818 799693 700305 591212 500125 0,9 1,6 -0,2 -0,8 -2,2 -3,3Solids 81846 79338 98645 126639 102995 116197 85995 68840 43409 34083 27730 17546 22441 1,9 0,4 -1,8 -6,6 -4,4 -2,1Oil 535645 512185 533039 599851 580687 608084 582484 556160 531957 460462 365970 263491 197447 0,0 0,9 0,0 -0,9 -3,7 -6,0 - Crude oil and Feedstocks 508460 494000 513725 581995 578249 601419 578003 555498 534379 465684 375120 285786 219420 0,1 1,2 0,0 -0,8 -3,5 -5,2 - Oil products 27185 18185 19314 17856 2438 6665 4481 662 -2423 -5222 -9150 -22295 -21973 -3,4 -18,7 6,3Natural gas 135121 145288 192531 257366 278100 317390 271194 280220 293381 295569 294978 293594 258514 3,6 3,7 -0,3 0,8 0,1 -1,3Electricity 3323 1508 1686 971 696 -620 -2139 -2574 -1489 -1854 -1898 -2254 -2610 -6,6 -8,5Renewable energy forms 144 279 397 1222 6988 7631 14148 8973 8561 11433 13525 18836 24334 10,7 33,2 7,3 -4,9 4,7 6,0
Gross Inland Consumption 1660159 1662517 1723099 1825989 1753233 1802785 1681336 1600181 1534173 1487363 1423147 1326691 1217114 0,4 0,2 -0,4 -0,9 -0,7 -1,6Solids 452940 364248 321007 319922 280945 283290 218827 173979 119442 101910 90585 76130 76719 -3,4 -1,3 -2,5 -5,9 -2,7 -1,6Oil 631058 650858 658727 676859 635033 629544 575853 539331 512591 438574 342295 240510 174832 0,4 -0,4 -1,0 -1,2 -4,0 -6,5Natural gas 294905 333268 393417 445998 442965 446429 381707 369718 366122 356672 343318 326709 282066 2,9 1,2 -1,5 -0,4 -0,6 -1,9Nuclear 202589 223028 243761 257360 235016 237362 230060 218921 200382 211834 218666 214369 186613 1,9 -0,4 -0,2 -1,4 0,9 -1,6Electricity 3323 1508 1686 971 696 -620 -2139 -2574 -1489 -1854 -1898 -2254 -2610 -6,6 -8,5Renewable energy forms 75343 89606 104501 124880 158577 206780 277028 300806 337126 380226 430181 471227 499495 3,3 4,3 5,7 2,0 2,5 1,5
as % in Gross Inland ConsumptionSolids 27,3 21,9 18,6 17,5 16,0 15,7 13,0 10,9 7,8 6,9 6,4 5,7 6,3Oil 38,0 39,1 38,2 37,1 36,2 34,9 34,2 33,7 33,4 29,5 24,1 18,1 14,4Natural gas 17,8 20,0 22,8 24,4 25,3 24,8 22,7 23,1 23,9 24,0 24,1 24,6 23,2Nuclear 12,2 13,4 14,1 14,1 13,4 13,2 13,7 13,7 13,1 14,2 15,4 16,2 15,3Renewable energy forms 4,5 5,4 6,1 6,8 9,0 11,5 16,5 18,8 22,0 25,6 30,2 35,5 41,0
Gross Electricity Generation in GWhe 2562823 2712209 2991720 3274121 3319422 3623036 3677371 3767945 3758199 4096405 4594818 4816170 4912423 1,6 1,0 1,0 0,2 2,0 0,7Nuclear 794718 881662 944823 997519 911418 921025 896138 863846 794926 842821 872584 867140 793221 1,7 -0,4 -0,2 -1,2 0,9 -0,9Hydro & wind 292648 330306 375545 378836 514979 713802 1042725 1246880 1552240 1744992 2045510 2241384 2429406 2,5 3,2 7,3 4,1 2,8 1,7Thermal (incl. biomass) 1475456 1500241 1671352 1897765 1893025 1988209 1738508 1657219 1411033 1508593 1676725 1707645 1689795 1,3 1,3 -0,8 -2,1 1,7 0,1
Fuel Inputs for Thermal Power Generation 383492 362334 382613 424208 412181 427685 374835 351638 306109 313991 330702 323691 317428 0,0 0,7 -0,9 -2,0 0,8 -0,4Solids 263837 230040 223012 229245 209629 213287 154828 115993 66591 60848 61708 63081 70510 -1,7 -0,6 -3,0 -8,1 -0,8 1,3Oil (including refinery gas) 54404 51463 39294 29780 15656 14040 8336 9901 9869 10226 9542 4516 325 -3,2 -8,8 -6,1 1,7 -0,3 -28,7Gas 56754 67806 102408 134637 145944 141085 125040 128464 123552 131159 136724 128716 120269 6,1 3,6 -1,5 -0,1 1,0 -1,3Biomass & Waste 5724 10033 14960 25901 35552 52468 78092 88039 93583 98566 108908 112965 111576 10,1 9,0 8,2 1,8 1,5 0,2Geothermal heat 2774 2992 2939 4645 5400 6804 8541 9240 12513 13192 13819 14414 14724 0,6 6,3 4,7 3,9 1,0 0,6Hydrogen - Methanol 0 0 0 0 0 0 0 0 0 0 0 0 24
Fuel Input in other transformation proc. 839073 814654 827098 842975 793702 793187 744905 708154 678462 607383 509199 400936 328041 -0,1 -0,4 -0,6 -0,9 -2,8 -4,3Refineries 679426 705954 735244 758152 718083 710257 658909 624834 598425 519944 416361 307164 228035 0,8 -0,2 -0,9 -1,0 -3,6 -5,8Biofuels and hydrogen production 2 202 610 3129 12208 19510 26830 25839 25763 43488 61535 78040 91677 79,6 34,9 8,2 -0,4 9,1 4,1District heating 32960 23240 19323 16212 15971 15665 13851 13263 11109 9104 6816 4746 2992 -5,2 -1,9 -1,4 -2,2 -4,8 -7,9Others 126685 85258 71921 65482 47441 47756 45315 44219 43165 34847 24487 10986 5338 -5,5 -4,1 -0,5 -0,5 -5,5 -14,1
Energy Branch Consumption 82379 88696 88176 96033 91098 90066 83512 77683 72431 69908 70530 67360 63157 0,7 0,3 -0,9 -1,4 -0,3 -1,1Non-Energy Uses 97931 110541 112495 117477 111507 115321 118126 119713 121498 121009 120142 112694 105832 1,4 -0,1 0,6 0,3 -0,1 -1,3Final Energy Demand 1068710 1069989 1112989 1173676 1160735 1214824 1145596 1097606 1074761 1025779 953643 878642 803921 0,4 0,4 -0,1 -0,6 -1,2 -1,7by sectorIndustry 365650 328513 326949 326308 310880 322813 317708 315743 316063 310591 306942 290646 274547 -1,1 -0,5 0,2 -0,1 -0,3 -1,1 - energy intensive industries 234722 214526 213112 210991 192062 196771 190586 187062 185196 177815 170666 156799 142350 -1,0 -1,0 -0,1 -0,3 -0,8 -1,8 - other industrial sectors 130928 113987 113837 115317 118818 126041 127123 128681 130867 132776 136275 133847 132197 -1,4 0,4 0,7 0,3 0,4 -0,3Residential 264307 280418 286784 308104 306282 320909 290029 271190 264030 253170 234190 214118 188059 0,8 0,7 -0,5 -0,9 -1,2 -2,2Tertiary 158484 160442 159866 176859 173607 183950 167348 153008 147122 139991 128571 117233 105749 0,1 0,8 -0,4 -1,3 -1,3 -1,9Transport 280269 300617 339389 362405 369965 387152 370511 357665 347547 322028 283941 256645 235565 1,9 0,9 0,0 -0,6 -2,0 -1,9by fuel
Solids 125031 84977 61454 54486 47328 44821 39468 33134 27358 19957 14093 6229 2505 -6,9 -2,6 -1,8 -3,6 -6,4 -15,9Oil 444429 456959 478882 495857 476962 476697 433056 401972 378688 314889 232777 164528 119592 0,7 0,0 -1,0 -1,3 -4,7 -6,4Gas 227902 245996 265552 283524 268020 274969 227765 210034 212569 192780 165157 137545 99173 1,5 0,1 -1,6 -0,7 -2,5 -5,0Electricity 184145 193367 216403 237537 242290 265247 270039 277419 279654 296944 315278 316478 311115 1,6 1,1 1,1 0,4 1,2 -0,1Heat (from CHP and District Heating) (A) 48610 44616 40061 44441 57860 71946 79127 83114 83271 84600 84302 81349 79040 -1,9 3,7 3,2 0,5 0,1 -0,6Other 38592 44073 50640 57832 68275 81145 96140 91933 93222 116609 142036 172513 192494 2,8 3,0 3,5 -0,3 4,3 3,1
CO2 Emissions (Mt of CO2 - sec approach) 4030,6 3800,1 3810,6 3946,6 3689,6 3682,0 3093,4 2773,2 2456,8 2024,6 1481,8 979,3 648,2 -0,6 -0,3 -1,7 -2,3 -4,9 -7,9Power generation/District heating 1484,3 1321,2 1320,8 1381,1 1274,7 1273,7 965,3 818,5 597,7 458,1 270,2 89,7 18,9 -1,2 -0,4 -2,7 -4,7 -7,6 -23,3Energy Branch 152,2 171,0 170,2 181,6 157,2 145,6 127,6 113,4 102,9 79,2 61,3 44,6 26,2 1,1 -0,8 -2,1 -2,1 -5,1 -8,1Industry 781,4 678,1 623,0 581,9 497,5 479,6 435,0 414,2 408,2 359,8 309,5 233,2 170,4 -2,2 -2,2 -1,3 -0,6 -2,7 -5,8Residential 499,4 481,6 466,2 486,7 466,4 466,2 383,9 326,4 311,5 262,3 194,0 135,2 74,6 -0,7 0,0 -1,9 -2,1 -4,6 -9,1Tertiary 300,5 275,3 242,0 262,2 245,6 239,3 188,8 164,1 156,5 135,6 99,9 67,8 39,4 -2,1 0,1 -2,6 -1,9 -4,4 -8,9Transport 812,7 872,9 988,5 1053,1 1048,2 1077,6 992,8 936,7 880,0 729,6 546,9 408,9 318,6 2,0 0,6 -0,5 -1,2 -4,6 -5,3
CO2 Emissions Index (1990=100) 100,0 94,3 94,5 97,9 91,5 91,3 76,7 68,8 61,0 50,2 36,8 24,3 16,1CO2 Emissions (Mt of CO2 - ref approach) 4172,0 3950,7 3922,7 4087,6 3756,9 3749,7 3161,4 2840,1 2525,4 2087,6 1547,5 1068,6 753,3 -0,6 -0,4 -1,7 -2,2 -4,8 -6,9
EU27: Diversified supply technologies scenario

Diversified supply technologies scenario - 71
SUMMARY ENERGY BALANCE AND INDICATORS (B)1990 1995 2000 2005 2010 2015 2020 2025 2030 2035 2040 2045 2050 '90-'00 '00-'10 '10-'20 '20-'30 '30-'40 '40-'50
Annual % ChangeMain Energy System IndicatorsPopulation (Million) 470,388 477,010 481,072 489,211 499,389 507,727 513,838 517,811 519,942 520,654 520,103 518,362 515,303 0,2 0,4 0,3 0,1 0,0 -0,1GDP (in 000 MEuro'05) 8142,7 8748,4 10107,2 11063,1 11385,6 12750,3 14164,0 15503,7 16824,7 18157,1 19527,9 21002,9 22560,0 2,2 1,2 2,2 1,7 1,5 1,5Gross Inl. Cons./GDP (toe/MEuro'05) 203,9 190,0 170,5 165,1 154,0 141,4 118,7 103,2 91,2 81,9 72,9 63,2 54,0 -1,8 -1,0 -2,6 -2,6 -2,2 -3,0Gross Inl. Cons./Capita (toe/inhabitant) 3,53 3,49 3,58 3,73 3,51 3,55 3,27 3,09 2,95 2,86 2,74 2,56 2,36 0,1 -0,2 -0,7 -1,0 -0,8 -1,5Electricity Generated/Capita (kWh gross/inhabitant) 5448 5686 6219 6693 6647 7136 7157 7277 7228 7868 8834 9291 9533 1,3 0,7 0,7 0,1 2,0 0,8Carbon intensity (t of CO2/toe of GIC) 2,43 2,29 2,21 2,16 2,10 2,04 1,84 1,73 1,60 1,36 1,04 0,74 0,53 -0,9 -0,5 -1,3 -1,4 -4,2 -6,5CO2 Emissions/Capita (t of CO2/inhabitant) 8,57 7,97 7,92 8,07 7,39 7,25 6,02 5,36 4,73 3,89 2,85 1,89 1,26 -0,8 -0,7 -2,0 -2,4 -4,9 -7,9CO2 Emissions to GDP (t of CO2/MEuro'05) 495,0 434,4 377,0 356,7 324,1 288,8 218,4 178,9 146,0 111,5 75,9 46,6 28,7 -2,7 -1,5 -3,9 -3,9 -6,3 -9,3Import Dependency % 44,6 43,5 46,8 52,5 53,8 56,5 54,9 55,2 55,2 52,1 47,6 43,1 39,7
Energy intensity indicators (2000=100)Industry (Energy on Value added) 130,3 115,2 100,0 95,1 89,9 84,5 75,4 68,9 64,1 58,6 54,1 47,9 42,4 -2,6 -1,1 -1,7 -1,6 -1,7 -2,4Residential (Energy on Private Income) 114,4 113,2 100,0 97,5 96,2 89,6 73,3 63,3 57,2 50,3 43,4 36,6 30,1 -1,3 -0,4 -2,7 -2,4 -2,7 -3,6Tertiary (Energy on Value added) 126,5 117,0 100,0 99,4 93,9 88,0 71,8 59,7 52,7 46,3 39,4 33,3 27,8 -2,3 -0,6 -2,6 -3,1 -2,9 -3,4Transport (Energy on GDP) 102,5 102,3 100,0 97,6 96,8 90,4 77,9 68,7 61,5 52,8 43,3 36,4 31,1 -0,2 -0,3 -2,1 -2,3 -3,5 -3,3
Carbon Intensity indicatorsElectricity and Steam production (t of CO2/MWh) 0,46 0,40 0,37 0,35 0,31 0,27 0,20 0,17 0,12 0,09 0,05 0,02 0,00 -2,1 -1,9 -4,1 -4,9 -9,0Final energy demand (t of CO2/toe) 2,24 2,16 2,08 2,03 1,95 1,86 1,75 1,68 1,63 1,45 1,21 0,96 0,75 -0,7 -0,7 -1,1 -0,7 -3,0 -4,6
Industry 2,14 2,06 1,91 1,78 1,60 1,49 1,37 1,31 1,29 1,16 1,01 0,80 0,62 -1,1 -1,7 -1,5 -0,6 -2,4 -4,7Residential 1,89 1,72 1,63 1,58 1,52 1,45 1,32 1,20 1,18 1,04 0,83 0,63 0,40 -1,5 -0,7 -1,4 -1,1 -3,5 -7,1Tertiary 1,90 1,72 1,51 1,48 1,41 1,30 1,13 1,07 1,06 0,97 0,78 0,58 0,37 -2,2 -0,7 -2,2 -0,6 -3,1 -7,1Transport 2,90 2,90 2,91 2,91 2,83 2,78 2,68 2,62 2,53 2,27 1,93 1,59 1,35 0,0 -0,3 -0,6 -0,6 -2,7 -3,5
Electricity and steam generationNet Generation Capacity in MWe 654168 715466 821492 926838 1030076 1077932 1192511 1274724 1452239 1565336 1620951 2,3 2,3 1,5 2,0 1,1
Nuclear energy 133966 134452 131393 125743 124707 106684 104841 106207 109310 114100 101712 -0,2 -0,5 -1,7 0,4 -0,7Renewable energy 112878 147262 206776 283873 420168 503915 642175 733432 878759 980140 1080701 6,2 7,3 4,3 3,2 2,1
Hydro (pumping excluded) 99714 104505 107315 111550 114915 116945 118918 121015 122055 123611 125633 0,7 0,7 0,3 0,3 0,3Wind 12793 40584 83905 143729 247338 302919 386165 433350 505776 546147 594652 20,7 11,4 4,6 2,7 1,6Solar 371 2172 15307 28018 56183 81070 132827 173250 244150 302357 350540 45,1 13,9 9,0 6,3 3,7Other renewables (tidal etc.) 0 1 249 575 1732 2981 4265 5818 6778 8026 9876 21,4 9,4 4,7 3,8
Thermal power 407324 433752 483323 517222 485201 467333 445495 435085 464169 471095 438539 1,7 0,0 -0,9 0,4 -0,6of which cogeneration units 76247 85453 98242 119491 124538 132761 141487 153435 157838 162549 161436 2,6 2,4 1,3 1,1 0,2of which CCS units 0 0 0 0 2711 2711 3436 31909 94816 160119 192600 2,4 39,3 7,3
Solids fired 194165 186620 183617 182688 154351 128492 107941 96189 95149 94999 93591 -0,6 -1,7 -3,5 -1,3 -0,2Gas fired 129444 166863 218508 242854 232921 233881 229826 226031 246728 249817 218321 5,4 0,6 -0,1 0,7 -1,2Oil fired 71058 62082 55901 46070 34961 32427 29356 27364 24397 19764 18894 -2,4 -4,6 -1,7 -1,8 -2,5Biomass-waste fired 12051 17502 24570 44703 61830 71302 76706 83745 96056 104597 105774 7,4 9,7 2,2 2,3 1,0Hydrogen plants 0 0 0 0 0 0 0 0 0 0 0Geothermal heat 605 686 727 908 1138 1231 1665 1755 1839 1918 1959 1,9 4,6 3,9 1,0 0,6
Load factor for net electric capacities (%) 49,1 49,1 43,9 42,6 39,0 38,4 34,8 35,2 34,3 33,1 32,5Indicators for gross electricity productionEfficiency for thermal electricity production (%) 37,6 38,5 39,5 40,0 39,9 40,5 39,6 41,3 43,6 45,4 45,8CHP indicator (% of electricity from CHP) 11,4 11,7 14,9 19,0 20,3 21,1 20,7 20,2 18,4 18,2 16,9CCS indicator (% of electricity from CCS) 0,0 0,0 0,0 0,0 0,6 0,6 0,8 6,1 14,9 21,8 24,2Non fossil fuels in electricity generation (%) 45,8 44,8 47,2 50,7 60,9 65,3 72,4 73,0 73,4 74,5 75,2 - nuclear 31,6 30,5 27,5 25,4 24,4 22,9 21,2 20,6 19,0 18,0 16,1 - renewable energy forms and industrial waste 14,2 14,3 19,7 25,3 36,6 42,4 51,2 52,4 54,4 56,5 59,1Indicators for renewables (excluding industrial waste) (%) (B)
RES in gross final energy demand (%) 7,6 8,6 11,4 14,8 21,3 24,2 27,7 32,6 39,8 47,4 54,6RES in transport (%) 0,5 1,4 4,3 6,6 10,9 13,8 18,6 29,8 43,0 53,7 61,9
Transport sectorPassenger transport activity (Gpkm) 4880,7 5307,7 5892,2 6240,3 6511,3 7132,6 7479,8 7914,0 8358,8 8672,0 8919,9 9164,8 9355,2 1,9 1,0 1,4 1,1 0,7 0,5
Public road transport 544,0 504,0 517,6 526,0 545,0 573,7 639,6 675,1 721,4 766,9 807,1 846,7 886,3 -0,5 0,5 1,6 1,2 1,1 0,9Private cars and motorcycles 3501,1 3986,3 4428,1 4686,5 4866,0 5288,2 5414,1 5648,7 5889,0 6019,0 6113,2 6186,1 6231,5 2,4 0,9 1,1 0,8 0,4 0,2Rail 472,5 421,7 447,9 461,0 482,5 525,5 607,2 645,5 704,3 764,1 819,8 890,5 966,4 -0,5 0,7 2,3 1,5 1,5 1,7Aviation 317,3 351,3 456,9 527,3 576,9 702,8 775,7 899,7 996,7 1072,4 1128,5 1188,4 1216,3 3,7 2,4 3,0 2,5 1,2 0,8Inland navigation 45,8 44,4 41,7 39,5 40,8 42,5 43,1 45,0 47,4 49,6 51,5 53,1 54,6 -0,9 -0,2 0,6 1,0 0,8 0,6
Travel per person (km per capita) 10376 11127 12248 12756 13038 14048 14557 15283 16076 16656 17150 17680 18155 1,7 0,6 1,1 1,0 0,6 0,6
Freight transport activity (Gtkm) 1848,4 1942,4 2195,7 2494,6 2662,6 2952,5 3058,1 3212,4 3375,0 3493,1 3597,3 3655,5 3666,4 1,7 1,9 1,4 1,0 0,6 0,2Trucks 1060,4 1288,7 1518,7 1800,3 1940,3 2164,3 2155,1 2255,0 2349,0 2393,5 2424,7 2414,9 2362,3 3,7 2,5 1,1 0,9 0,3 -0,3Rail 526,3 386,1 403,7 414,1 440,5 489,1 575,1 608,3 658,0 711,9 769,0 822,1 874,1 -2,6 0,9 2,7 1,4 1,6 1,3Inland navigation 261,6 267,6 273,3 280,2 281,9 299,0 327,8 349,1 368,0 387,8 403,6 418,4 430,0 0,4 0,3 1,5 1,2 0,9 0,6
Freight activity per unit of GDP (tkm/000 Euro'05) 227 222 217 225 234 232 216 207 201 192 184 174 163 -0,4 0,7 -0,8 -0,7 -0,8 -1,2Energy demand in transport (ktoe) 280269 300617 339389 362405 369965 387152 370511 357665 347547 322028 283941 256645 235565 1,9 0,9 0,0 -0,6 -2,0 -1,9
Public road transport 5197 4732 4914 5039 5182 5315 5423 5237 4922 4644 3847 3429 3315 -0,6 0,5 0,5 -1,0 -2,4 -1,5Private cars and motorcycles 154395 166321 182974 187736 186407 184711 167399 148661 139252 120689 95654 83490 73071 1,7 0,2 -1,1 -1,8 -3,7 -2,7Trucks 74969 79037 90951 105104 111606 123126 119059 121497 122053 116030 107072 95127 86415 2,0 2,1 0,6 0,2 -1,3 -2,1Rail 9560 9452 9600 9436 9595 10161 11030 10601 9637 9494 9225 8719 8326 0,0 0,0 1,4 -1,3 -0,4 -1,0Aviation 29038 34112 45395 49703 51709 58141 61530 65280 64973 64251 61125 58944 57623 4,6 1,3 1,8 0,5 -0,6 -0,6Inland navigation 7110 6963 5555 5386 5466 5699 6070 6387 6710 6919 7018 6936 6816 -2,4 -0,2 1,1 1,0 0,5 -0,3
Efficiency indicator (activity related)Passenger transport (toe/Mpkm) 39,6 39,5 40,3 39,5 38,0 35,4 31,9 28,2 25,5 22,4 18,5 16,4 14,8 0,2 -0,6 -1,7 -2,2 -3,2 -2,2Freight transport (toe/Mtkm) 47,1 46,8 46,3 46,5 46,0 45,7 43,2 41,8 39,7 36,6 33,1 29,1 26,6 -0,2 -0,1 -0,6 -0,8 -1,8 -2,2
EU27: Diversified supply technologies scenario

High RES scenario- 72
4. High RES scenario
SUMMARY ENERGY BALANCE AND INDICATORS (A) ktoe 1990 1995 2000 2005 2010 2015 2020 2025 2030 2035 2040 2045 2050 '90-'00 '00-'10 '10-'20 '20-'30 '30-'40 '40-'50
Annual % ChangeProduction 936047 950181 941860 900326 833310 806698 779610 742056 698518 699081 731599 752101 764124 0,1 -1,2 -0,7 -1,1 0,5 0,4
Solids 366477 277810 213423 196277 177924 167143 130847 105741 70120 50626 42866 34971 29452 -5,3 -1,8 -3,0 -6,0 -4,8 -3,7Oil 129551 171052 173006 134290 104398 73819 46224 35904 31670 23560 14980 7066 2278 2,9 -4,9 -7,8 -3,7 -7,2 -17,2Natural gas 162447 188965 207559 188677 164866 129037 110518 89489 71627 58053 44334 29044 19735 2,5 -2,3 -3,9 -4,2 -4,7 -7,8Nuclear 202589 223028 243761 257360 235016 237344 229652 213206 145795 112636 85647 64628 43640 1,9 -0,4 -0,2 -4,4 -5,2 -6,5Renewable energy sources 74984 89326 104111 123722 151107 199354 262370 297715 379306 454205 543773 616393 669019 3,3 3,8 5,7 3,8 3,7 2,1
Hydro 25101 28054 30374 26395 30008 30294 30817 31604 32220 32722 33245 33693 34059 1,9 -0,1 0,3 0,4 0,3 0,2Biomass & Waste 46473 57201 67982 85129 98472 122897 149005 159999 180886 218149 253415 282753 294621 3,9 3,8 4,2 2,0 3,4 1,5Wind 67 350 1913 6061 12781 28465 52714 67465 103030 125049 161406 189752 215507 39,8 20,9 15,2 6,9 4,6 2,9Solar and others 153 274 421 807 3446 9395 19017 26413 40371 52058 67572 79864 90649 10,7 23,4 18,6 7,8 5,3 3,0Geothermal 3190 3447 3421 5331 6400 8305 10817 12234 22800 26227 28134 30331 34182 0,7 6,5 5,4 7,7 2,1 2,0
Net Imports 756079 738600 826299 986048 969129 1046554 952439 911227 863234 767139 631727 510481 413127 0,9 1,6 -0,2 -1,0 -3,1 -4,2Solids 81846 79338 98645 126639 102268 112548 86128 69892 38524 19365 7407 -6329 -6046 1,9 0,4 -1,7 -7,7 -15,2Oil 535645 512185 533039 599851 580795 609089 582627 557236 533764 460454 364573 263832 198402 0,0 0,9 0,0 -0,9 -3,7 -5,9 - Crude oil and Feedstocks 508460 494000 513725 581995 578276 603822 577997 556269 534989 464675 373779 285995 221344 0,1 1,2 0,0 -0,8 -3,5 -5,1 - Oil products 27185 18185 19314 17856 2519 5267 4630 967 -1225 -4221 -9206 -22163 -22942 -3,4 -18,4 6,3Natural gas 135121 145288 192531 257366 278450 317916 271631 276670 282045 273453 241524 227188 190699 3,6 3,8 -0,2 0,4 -1,5 -2,3Electricity 3323 1508 1686 971 696 -634 -2118 -1959 558 1723 3146 4397 4829 -6,6 -8,5 18,9 4,4Renewable energy forms 144 279 397 1222 6921 7636 14171 9388 8342 12143 15077 21393 25243 10,7 33,1 7,4 -5,2 6,1 5,3
Gross Inland Consumption 1660159 1662517 1723099 1825989 1752388 1801136 1679135 1600572 1509860 1417185 1316560 1217955 1134336 0,4 0,2 -0,4 -1,1 -1,4 -1,5Solids 452940 364248 321007 319922 280191 279691 216975 175633 108644 69991 50272 28642 23406 -3,4 -1,4 -2,5 -6,7 -7,4 -7,4Oil 631058 650858 658727 676859 635141 630791 575936 540429 514095 438052 340749 240880 175825 0,4 -0,4 -1,0 -1,1 -4,0 -6,4Natural gas 294905 333268 393417 445998 443315 446953 382149 366159 353672 331506 285858 256232 210434 2,9 1,2 -1,5 -0,8 -2,1 -3,0Nuclear 202589 223028 243761 257360 235016 237344 229652 213206 145795 112636 85647 64628 43640 1,9 -0,4 -0,2 -4,4 -5,2 -6,5Electricity 3323 1508 1686 971 696 -634 -2118 -1959 558 1723 3146 4397 4829 -6,6 -8,5 18,9 4,4Renewable energy forms 75343 89606 104501 124880 158028 206990 276541 307103 387095 463277 550887 623177 676202 3,3 4,2 5,8 3,4 3,6 2,1
as % in Gross Inland ConsumptionSolids 27,3 21,9 18,6 17,5 16,0 15,5 12,9 11,0 7,2 4,9 3,8 2,4 2,1Oil 38,0 39,1 38,2 37,1 36,2 35,0 34,3 33,8 34,0 30,9 25,9 19,8 15,5Natural gas 17,8 20,0 22,8 24,4 25,3 24,8 22,8 22,9 23,4 23,4 21,7 21,0 18,6Nuclear 12,2 13,4 14,1 14,1 13,4 13,2 13,7 13,3 9,7 7,9 6,5 5,3 3,8Renewable energy forms 4,5 5,4 6,1 6,8 9,0 11,5 16,5 19,2 25,6 32,7 41,8 51,2 59,6
Gross Electricity Generation in GWhe 2562823 2712209 2991720 3274121 3310017 3609375 3665380 3751472 3666305 3879733 4357597 4726244 5140565 1,6 1,0 1,0 0,0 1,7 1,7Nuclear 794718 881662 944823 997519 911418 920951 894470 840519 578404 449157 344218 260161 179105 1,7 -0,4 -0,2 -4,3 -5,1 -6,3Hydro & wind 292648 330306 375545 378836 514979 716559 1046829 1280628 1838420 2222236 2819421 3298070 3744893 2,5 3,2 7,4 5,8 4,4 2,9Thermal (incl. biomass) 1475456 1500241 1671352 1897765 1883620 1971864 1724081 1630325 1249481 1208340 1193958 1168013 1216567 1,3 1,2 -0,9 -3,2 -0,5 0,2
Fuel Inputs for Thermal Power Generation 383492 362334 382613 424208 410954 424609 371495 346950 280705 264227 256594 249960 264725 0,0 0,7 -1,0 -2,8 -0,9 0,3Solids 263837 230040 223012 229245 208905 209783 153229 116717 53950 29831 22172 15880 17556 -1,7 -0,7 -3,1 -9,9 -8,5 -2,3Oil (including refinery gas) 54404 51463 39294 29780 15595 14589 8560 10199 9028 8466 6629 2096 246 -3,2 -8,8 -5,8 0,5 -3,0 -28,0Gas 56754 67806 102408 134637 145869 141081 124787 126024 110577 110044 85265 66166 55752 6,1 3,6 -1,5 -1,2 -2,6 -4,2Biomass & Waste 5724 10033 14960 25901 35185 52352 76511 84921 88926 94230 107154 111032 109233 10,1 8,9 8,1 1,5 1,9 0,2Geothermal heat 2774 2992 2939 4645 5400 6804 8409 9089 18156 20713 22294 23895 26799 0,6 6,3 4,5 8,0 2,1 1,9Hydrogen - Methanol 0 0 0 0 0 0 0 0 69 942 13079 30891 55138 69,0 15,5
Fuel Input in other transformation proc. 839073 814654 827098 842975 793843 795868 744588 709740 683212 609457 525856 442356 399684 -0,1 -0,4 -0,6 -0,9 -2,6 -2,7Refineries 679426 705954 735244 758152 718104 712903 658842 625630 598726 518600 415000 307676 230223 0,8 -0,2 -0,9 -1,0 -3,6 -5,7Biofuels and hydrogen production 2 202 610 3129 12208 19510 26833 25850 25967 44429 77991 116325 158393 79,6 34,9 8,2 -0,3 11,6 7,3District heating 32960 23240 19323 16212 15983 15699 13874 13522 13912 11437 8920 6722 5813 -5,2 -1,9 -1,4 0,0 -4,3 -4,2Others 126685 85258 71921 65482 47547 47757 45039 44738 44607 34990 23945 11634 5255 -5,5 -4,1 -0,5 -0,1 -6,0 -14,1
Energy Branch Consumption 82379 88696 88176 96033 90926 90041 83106 77580 70485 63523 56656 52976 48370 0,7 0,3 -0,9 -1,6 -2,2 -1,6Non-Energy Uses 97931 110541 112495 117477 111488 115324 118124 119728 121483 120976 120110 112142 105116 1,4 -0,1 0,6 0,3 -0,1 -1,3Final Energy Demand 1068710 1069989 1112989 1173676 1160711 1214573 1145345 1103544 1093422 1039229 965315 885616 804231 0,4 0,4 -0,1 -0,5 -1,2 -1,8by sectorIndustry 365650 328513 326949 326308 310794 322842 317478 316730 319583 314659 311272 291614 275822 -1,1 -0,5 0,2 0,1 -0,3 -1,2 - energy intensive industries 234722 214526 213112 210991 192050 196819 190503 188016 187697 180244 173169 157044 142999 -1,0 -1,0 -0,1 -0,1 -0,8 -1,9 - other industrial sectors 130928 113987 113837 115317 118743 126023 126975 128714 131887 134414 138104 134570 132823 -1,4 0,4 0,7 0,4 0,5 -0,4Residential 264307 280418 286784 308104 306349 320875 289859 273993 273054 260550 240796 220031 190190 0,8 0,7 -0,6 -0,6 -1,2 -2,3Tertiary 158484 160442 159866 176859 173601 183698 167475 154457 151363 140799 126815 114332 100614 0,1 0,8 -0,4 -1,0 -1,8 -2,3Transport 280269 300617 339389 362405 369967 387158 370533 358363 349421 323222 286432 259639 237605 1,9 0,9 0,0 -0,6 -2,0 -1,9by fuel
Solids 125031 84977 61454 54486 47220 44757 39481 33969 29050 19765 14092 5914 2458 -6,9 -2,6 -1,8 -3,0 -7,0 -16,0Oil 444429 456959 478882 495857 477402 476889 433240 403337 382481 317430 235116 166879 120383 0,7 0,0 -1,0 -1,2 -4,7 -6,5Gas 227902 245996 265552 283524 268457 275889 227971 209061 212137 193706 165069 137402 95510 1,5 0,1 -1,6 -0,7 -2,5 -5,3Electricity 184145 193367 216403 237537 241593 264268 269375 277243 277332 290261 301824 296091 290419 1,6 1,1 1,1 0,3 0,8 -0,4Heat (from CHP and District Heating) (A) 48610 44616 40061 44441 57920 71519 78393 82568 78039 71951 69538 61492 53924 -1,9 3,8 3,1 0,0 -1,1 -2,5Other 38592 44073 50640 57832 68119 81250 96886 97365 114383 146118 179676 217838 241538 2,8 3,0 3,6 1,7 4,6 3,0
CO2 Emissions (Mt of CO2 - sec approach) 4030,6 3800,1 3810,6 3946,6 3687,8 3672,9 3087,1 2776,2 2394,9 1964,4 1454,9 986,9 670,0 -0,6 -0,3 -1,8 -2,5 -4,9 -7,5Power generation/District heating 1484,3 1321,2 1320,8 1381,1 1271,6 1261,5 957,9 817,6 523,3 403,4 250,3 103,5 52,5 -1,2 -0,4 -2,8 -5,9 -7,1 -14,5Energy Branch 152,2 171,0 170,2 181,6 156,5 146,2 127,7 112,0 97,6 65,1 48,0 33,0 21,1 1,1 -0,8 -2,0 -2,7 -6,8 -7,9Industry 781,4 678,1 623,0 581,9 498,3 480,6 434,7 412,7 407,6 363,6 314,0 238,3 165,7 -2,2 -2,2 -1,4 -0,6 -2,6 -6,2Residential 499,4 481,6 466,2 486,7 466,9 466,9 384,3 329,2 318,5 260,1 186,8 125,4 66,6 -0,7 0,0 -1,9 -1,9 -5,2 -9,8Tertiary 300,5 275,3 242,0 262,2 246,3 240,1 189,7 166,1 162,3 138,4 102,2 70,7 41,0 -2,1 0,2 -2,6 -1,5 -4,5 -8,7Transport 812,7 872,9 988,5 1053,1 1048,2 1077,6 992,9 938,6 885,6 733,8 553,5 416,0 323,1 2,0 0,6 -0,5 -1,1 -4,6 -5,2
CO2 Emissions Index (1990=100) 100,0 94,3 94,5 97,9 91,5 91,1 76,6 68,9 59,4 48,7 36,1 24,5 16,6CO2 Emissions (Mt of CO2 - ref approach) 4172,0 3950,7 3922,7 4087,6 3755,2 3740,5 3154,9 2843,0 2463,7 2028,4 1522,0 1075,6 775,5 -0,6 -0,4 -1,7 -2,4 -4,7 -6,5
EU27: High RES scenario

High RES scenario- 73
SUMMARY ENERGY BALANCE AND INDICATORS (B)1990 1995 2000 2005 2010 2015 2020 2025 2030 2035 2040 2045 2050 '90-'00 '00-'10 '10-'20 '20-'30 '30-'40 '40-'50
Annual % ChangeMain Energy System IndicatorsPopulation (Million) 470,388 477,010 481,072 489,211 499,389 507,727 513,838 517,811 519,942 520,654 520,103 518,362 515,303 0,2 0,4 0,3 0,1 0,0 -0,1GDP (in 000 MEuro'05) 8142,7 8748,4 10107,2 11063,1 11385,6 12750,3 14164,0 15503,7 16824,7 18157,1 19527,9 21002,9 22560,0 2,2 1,2 2,2 1,7 1,5 1,5Gross Inl. Cons./GDP (toe/MEuro'05) 203,9 190,0 170,5 165,1 153,9 141,3 118,5 103,2 89,7 78,1 67,4 58,0 50,3 -1,8 -1,0 -2,6 -2,7 -2,8 -2,9Gross Inl. Cons./Capita (toe/inhabitant) 3,53 3,49 3,58 3,73 3,51 3,55 3,27 3,09 2,90 2,72 2,53 2,35 2,20 0,1 -0,2 -0,7 -1,2 -1,4 -1,4Electricity Generated/Capita (kWh gross/inhabitant) 5448 5686 6219 6693 6628 7109 7133 7245 7051 7452 8378 9118 9976 1,3 0,6 0,7 -0,1 1,7 1,8Carbon intensity (t of CO2/toe of GIC) 2,43 2,29 2,21 2,16 2,10 2,04 1,84 1,73 1,59 1,39 1,11 0,81 0,59 -0,9 -0,5 -1,3 -1,5 -3,5 -6,1CO2 Emissions/Capita (t of CO2/inhabitant) 8,57 7,97 7,92 8,07 7,38 7,23 6,01 5,36 4,61 3,77 2,80 1,90 1,30 -0,8 -0,7 -2,0 -2,6 -4,9 -7,4CO2 Emissions to GDP (t of CO2/MEuro'05) 495,0 434,4 377,0 356,7 323,9 288,1 218,0 179,1 142,3 108,2 74,5 47,0 29,7 -2,7 -1,5 -3,9 -4,2 -6,3 -8,8Import Dependency % 44,6 43,5 46,8 52,5 53,8 56,5 55,0 55,1 55,3 52,3 46,3 40,4 35,1
Energy intensity indicators (2000=100)Industry (Energy on Value added) 130,3 115,2 100,0 95,1 89,8 84,6 75,3 69,1 64,8 59,4 54,9 48,1 42,6 -2,6 -1,1 -1,7 -1,5 -1,6 -2,5Residential (Energy on Private Income) 114,4 113,2 100,0 97,5 96,3 89,6 73,3 63,9 59,1 51,8 44,6 37,6 30,5 -1,3 -0,4 -2,7 -2,1 -2,8 -3,7Tertiary (Energy on Value added) 126,5 117,0 100,0 99,4 93,9 87,9 71,9 60,3 54,2 46,6 38,9 32,5 26,5 -2,3 -0,6 -2,6 -2,8 -3,3 -3,8Transport (Energy on GDP) 102,5 102,3 100,0 97,6 96,8 90,4 77,9 68,8 61,8 53,0 43,7 36,8 31,4 -0,2 -0,3 -2,1 -2,3 -3,4 -3,3
Carbon Intensity indicatorsElectricity and Steam production (t of CO2/MWh) 0,46 0,40 0,37 0,35 0,31 0,27 0,20 0,17 0,11 0,08 0,05 0,02 0,01 -2,1 -2,0 -4,2 -5,8 -8,1Final energy demand (t of CO2/toe) 2,24 2,16 2,08 2,03 1,95 1,87 1,75 1,67 1,62 1,44 1,20 0,96 0,74 -0,7 -0,7 -1,1 -0,7 -3,0 -4,7
Industry 2,14 2,06 1,91 1,78 1,60 1,49 1,37 1,30 1,28 1,16 1,01 0,82 0,60 -1,1 -1,7 -1,6 -0,7 -2,3 -5,0Residential 1,89 1,72 1,63 1,58 1,52 1,45 1,33 1,20 1,17 1,00 0,78 0,57 0,35 -1,5 -0,6 -1,4 -1,3 -4,0 -7,6Tertiary 1,90 1,72 1,51 1,48 1,42 1,31 1,13 1,08 1,07 0,98 0,81 0,62 0,41 -2,2 -0,6 -2,2 -0,5 -2,8 -6,6Transport 2,90 2,90 2,91 2,91 2,83 2,78 2,68 2,62 2,53 2,27 1,93 1,60 1,36 0,0 -0,3 -0,6 -0,6 -2,7 -3,5
Electricity and steam generationNet Generation Capacity in MWe 654168 715466 821393 925364 1028870 1093152 1323971 1473174 1763357 2002770 2219028 2,3 2,3 2,6 2,9 2,3
Nuclear energy 133966 134452 131393 125743 124752 106542 89509 74531 70208 59974 40649 -0,2 -0,5 -3,3 -2,4 -5,3Renewable energy 112878 147262 206776 284863 421571 520864 790367 975140 1266151 1510674 1748963 6,2 7,4 6,5 4,8 3,3
Hydro (pumping excluded) 99714 104505 107315 111624 114963 117041 120084 124646 127086 129206 131439 0,7 0,7 0,4 0,6 0,3Wind 12793 40584 83905 144765 247477 308743 469770 567394 734513 865683 984455 20,7 11,4 6,6 4,6 3,0Solar 371 2172 15307 27898 57398 92099 195255 272546 385411 491250 602883 45,1 14,1 13,0 7,0 4,6Other renewables (tidal etc.) 0 1 249 575 1732 2981 5259 10554 19140 24534 30187 21,4 11,7 13,8 4,7
Thermal power 407324 433752 483224 514758 482548 465746 444095 423503 426999 432122 429416 1,7 0,0 -0,8 -0,4 0,1of which cogeneration units 76247 85453 97871 118960 124171 132317 135857 154830 170519 176464 178477 2,5 2,4 0,9 2,3 0,5of which CCS units 0 0 0 0 2711 2711 2711 6268 22077 42460 52528 0,0 23,3 9,1
Solids fired 194165 186620 183457 182723 154491 129046 107532 83960 73806 67977 62189 -0,6 -1,7 -3,6 -3,7 -1,7Gas fired 129444 166863 218569 241148 231203 231452 227152 215553 204223 193967 181585 5,4 0,6 -0,2 -1,1 -1,2Oil fired 71058 62082 55901 45785 34998 33937 29321 24824 20949 20026 18956 -2,4 -4,6 -1,8 -3,3 -1,0Biomass-waste fired 12051 17502 24569 44194 60735 70101 77673 96413 125058 146976 163125 7,4 9,5 2,5 4,9 2,7Hydrogen plants 0 0 0 0 0 0 0 0 0 0 0Geothermal heat 605 686 727 908 1121 1211 2418 2754 2964 3176 3562 1,9 4,4 8,0 2,1 1,9
Load factor for net electric capacities (%) 49,1 49,1 43,8 42,5 39,0 37,7 30,7 29,3 27,0 25,5 24,8Indicators for gross electricity productionEfficiency for thermal electricity production (%) 37,6 38,5 39,4 39,9 39,9 40,4 38,3 39,3 40,0 40,2 39,5CHP indicator (% of electricity from CHP) 11,4 11,7 14,8 18,8 20,2 21,1 18,5 17,5 15,2 13,0 10,5CCS indicator (% of electricity from CCS) 0,0 0,0 0,0 0,0 0,6 0,6 0,6 0,9 3,3 6,0 6,9Non fossil fuels in electricity generation (%) 45,8 44,8 47,3 50,9 61,0 65,6 75,6 79,2 84,8 88,5 90,0 - nuclear 31,6 30,5 27,5 25,5 24,4 22,4 15,8 11,6 8,0 5,7 3,6 - renewable energy forms and industrial waste 14,2 14,3 19,8 25,4 36,6 43,2 59,8 67,6 76,8 82,9 86,4Indicators for renewables (excluding industrial waste) (%) (B)
RES in gross final energy demand (%) 7,6 8,6 11,4 14,8 21,3 24,6 31,2 39,1 50,6 63,0 75,2RES in transport (%) 0,5 1,4 4,3 6,6 10,9 13,9 20,0 33,3 50,2 63,2 73,5
Transport sectorPassenger transport activity (Gpkm) 4880,7 5307,7 5892,2 6240,3 6511,3 7133,0 7480,3 7921,8 8379,5 8681,7 8912,2 9140,9 9287,2 1,9 1,0 1,4 1,1 0,6 0,4
Public road transport 544,0 504,0 517,6 526,0 545,0 573,7 639,6 675,1 721,1 766,5 806,9 846,2 887,8 -0,5 0,5 1,6 1,2 1,1 1,0Private cars and motorcycles 3501,1 3986,3 4428,1 4686,5 4866,0 5288,2 5414,1 5655,3 5908,7 6030,5 6111,5 6174,0 6179,1 2,4 0,9 1,1 0,9 0,3 0,1Rail 472,5 421,7 447,9 461,0 482,5 525,9 607,7 646,0 703,3 761,5 813,5 878,4 953,4 -0,5 0,7 2,3 1,5 1,5 1,6Aviation 317,3 351,3 456,9 527,3 576,9 702,8 775,7 900,3 999,1 1073,6 1128,9 1189,1 1212,4 3,7 2,4 3,0 2,6 1,2 0,7Inland navigation 45,8 44,4 41,7 39,5 40,8 42,5 43,1 45,0 47,4 49,6 51,5 53,2 54,5 -0,9 -0,2 0,6 1,0 0,8 0,6
Travel per person (km per capita) 10376 11127 12248 12756 13038 14049 14558 15299 16116 16675 17135 17634 18023 1,7 0,6 1,1 1,0 0,6 0,5
Freight transport activity (Gtkm) 1848,4 1942,4 2195,7 2494,6 2662,6 2952,6 3058,2 3216,8 3387,8 3499,1 3597,1 3654,0 3646,6 1,7 1,9 1,4 1,0 0,6 0,1Trucks 1060,4 1288,7 1518,7 1800,3 1940,3 2164,3 2155,1 2259,0 2362,1 2400,8 2427,4 2419,1 2347,9 3,7 2,5 1,1 0,9 0,3 -0,3Rail 526,3 386,1 403,7 414,1 440,5 489,3 575,3 608,5 657,5 710,6 766,1 816,4 868,7 -2,6 0,9 2,7 1,3 1,5 1,3Inland navigation 261,6 267,6 273,3 280,2 281,9 299,0 327,8 349,2 368,2 387,8 403,6 418,4 430,0 0,4 0,3 1,5 1,2 0,9 0,6
Freight activity per unit of GDP (tkm/000 Euro'05) 227 222 217 225 234 232 216 207 201 193 184 174 162 -0,4 0,7 -0,8 -0,7 -0,9 -1,3Energy demand in transport (ktoe) 280269 300617 339389 362405 369967 387158 370533 358363 349421 323222 286432 259639 237605 1,9 0,9 0,0 -0,6 -2,0 -1,9
Public road transport 5197 4732 4914 5039 5182 5315 5423 5239 4928 4673 3910 3474 3317 -0,6 0,5 0,5 -1,0 -2,3 -1,6Private cars and motorcycles 154395 166321 182974 187736 186407 184712 167417 148591 139470 120494 97075 85366 75653 1,7 0,2 -1,1 -1,8 -3,6 -2,5Trucks 74969 79037 90951 105104 111606 123126 119059 121710 122731 116740 107691 95806 86075 2,0 2,1 0,6 0,3 -1,3 -2,2Rail 9560 9452 9600 9436 9597 10166 11035 10609 9631 9491 9275 8779 8356 0,0 0,0 1,4 -1,4 -0,4 -1,0Aviation 29038 34112 45395 49703 51709 58141 61530 65826 65945 64896 61450 59255 57377 4,6 1,3 1,8 0,7 -0,7 -0,7Inland navigation 7110 6963 5555 5386 5466 5699 6070 6389 6715 6929 7030 6958 6827 -2,4 -0,2 1,1 1,0 0,5 -0,3
Efficiency indicator (activity related)Passenger transport (toe/Mpkm) 39,6 39,5 40,3 39,5 38,0 35,4 31,9 28,3 25,6 22,4 18,7 16,7 15,1 0,2 -0,6 -1,7 -2,2 -3,1 -2,1Freight transport (toe/Mtkm) 47,1 46,8 46,3 46,5 46,1 45,7 43,2 41,8 39,8 36,8 33,3 29,4 26,6 -0,2 -0,1 -0,6 -0,8 -1,8 -2,2
EU27: High RES scenario

Delayed CCS scenario - 74
5. Delayed CCS scenario
SUMMARY ENERGY BALANCE AND INDICATORS (A) ktoe 1990 1995 2000 2005 2010 2015 2020 2025 2030 2035 2040 2045 2050 '90-'00 '00-'10 '10-'20 '20-'30 '30-'40 '40-'50
Annual % ChangeProduction 936047 950181 941860 900326 833867 806385 782247 742604 714997 744879 778988 793313 782885 0,1 -1,2 -0,6 -0,9 0,9 0,0
Solids 366477 277810 213423 196277 177999 167124 133606 105175 74570 49694 40615 42623 41972 -5,3 -1,8 -2,8 -5,7 -5,9 0,3Oil 129551 171052 173006 134290 104398 73701 46270 35888 31924 22671 14122 6825 2229 2,9 -4,9 -7,8 -3,6 -7,8 -16,9Natural gas 162447 188965 207559 188677 164866 129039 110511 89429 72639 58928 47180 33038 23566 2,5 -2,3 -3,9 -4,1 -4,2 -6,7Nuclear 202589 223028 243761 257360 235016 237360 229121 218234 202468 231475 244015 237692 216897 1,9 -0,4 -0,3 -1,2 1,9 -1,2Renewable energy sources 74984 89326 104111 123722 151588 199161 262739 293879 333395 382111 433056 473134 498221 3,3 3,8 5,7 2,4 2,6 1,4
Hydro 25101 28054 30374 26395 30008 30276 30808 31569 32129 32612 33132 33587 33949 1,9 -0,1 0,3 0,4 0,3 0,2Biomass & Waste 46473 57201 67982 85129 98965 122967 149650 159101 164958 193397 216805 238746 246615 3,9 3,8 4,2 1,0 2,8 1,3Wind 67 350 1913 6061 12781 28237 52499 65906 86270 98019 115112 124712 135662 39,8 20,9 15,2 5,1 2,9 1,7Solar and others 153 274 421 807 3436 9380 18834 24906 32945 38957 47498 53628 58134 10,7 23,3 18,5 5,8 3,7 2,0Geothermal 3190 3447 3421 5331 6398 8301 10949 12396 17094 19125 20509 22461 23861 0,7 6,5 5,5 4,6 1,8 1,5
Net Imports 756079 738600 826299 986048 969437 1048749 952256 910645 868793 732708 629866 552711 496822 0,9 1,6 -0,2 -0,9 -3,2 -2,3Solids 81846 79338 98645 126639 103003 116164 86465 68874 39638 13851 1793 -3503 14624 1,9 0,4 -1,7 -7,5 -26,6 23,4Oil 535645 512185 533039 599851 580674 608334 582557 556019 530722 440649 345390 255622 196721 0,0 0,9 0,0 -0,9 -4,2 -5,5 - Crude oil and Feedstocks 508460 494000 513725 581995 578242 602274 577961 555450 533431 449575 355767 277010 218651 0,1 1,2 0,0 -0,8 -4,0 -4,8 - Oil products 27185 18185 19314 17856 2432 6060 4596 569 -2710 -8927 -10377 -21388 -21930 -3,4 -18,7 6,6Natural gas 135121 145288 192531 257366 278078 317239 271247 279361 291381 268296 271060 284030 264006 3,6 3,7 -0,2 0,7 -0,7 -0,3Electricity 3323 1508 1686 971 696 -620 -2172 -2596 -1495 -1775 -1859 -1911 -2329 -6,6 -8,5Renewable energy forms 144 279 397 1222 6987 7633 14159 8987 8547 11689 13483 18473 23800 10,7 33,2 7,3 -4,9 4,7 5,8
Gross Inland Consumption 1660159 1662517 1723099 1825989 1753252 1803017 1681588 1600538 1531898 1430568 1364649 1303197 1237672 0,4 0,2 -0,4 -0,9 -1,1 -1,0Solids 452940 364248 321007 319922 281002 283287 220071 174049 114209 63545 42408 39120 56596 -3,4 -1,3 -2,4 -6,3 -9,4 2,9Oil 631058 650858 658727 676859 635020 629918 575912 539195 511306 419492 323152 233738 174438 0,4 -0,4 -1,0 -1,2 -4,5 -6,0Natural gas 294905 333268 393417 445998 442944 446277 381758 368790 364020 327224 318239 317068 287572 2,9 1,2 -1,5 -0,5 -1,3 -1,0Nuclear 202589 223028 243761 257360 235016 237360 229121 218234 202468 231475 244015 237692 216897 1,9 -0,4 -0,3 -1,2 1,9 -1,2Electricity 3323 1508 1686 971 696 -620 -2172 -2596 -1495 -1775 -1859 -1911 -2329 -6,6 -8,5Renewable energy forms 75343 89606 104501 124880 158574 206794 276898 302865 341391 390608 438694 477489 504498 3,3 4,3 5,7 2,1 2,5 1,4
as % in Gross Inland ConsumptionSolids 27,3 21,9 18,6 17,5 16,0 15,7 13,1 10,9 7,5 4,4 3,1 3,0 4,6Oil 38,0 39,1 38,2 37,1 36,2 34,9 34,2 33,7 33,4 29,3 23,7 17,9 14,1Natural gas 17,8 20,0 22,8 24,4 25,3 24,8 22,7 23,0 23,8 22,9 23,3 24,3 23,2Nuclear 12,2 13,4 14,1 14,1 13,4 13,2 13,6 13,6 13,2 16,2 17,9 18,2 17,5Renewable energy forms 4,5 5,4 6,1 6,8 9,0 11,5 16,5 18,9 22,3 27,3 32,1 36,6 40,8
Gross Electricity Generation in GWhe 2562823 2712209 2991720 3274121 3320232 3622963 3676708 3761247 3747228 3940991 4353762 4593478 4872341 1,6 1,0 1,0 0,2 1,5 1,1Nuclear 794718 881662 944823 997519 911418 921018 892305 861315 803812 932416 987532 970241 935346 1,7 -0,4 -0,2 -1,0 2,1 -0,5Hydro & wind 292648 330306 375545 378836 514979 713811 1042328 1245697 1564951 1770491 2068888 2259430 2454950 2,5 3,2 7,3 4,1 2,8 1,7Thermal (incl. biomass) 1475456 1500241 1671352 1897765 1893835 1988135 1742075 1654234 1378465 1238085 1297342 1363807 1482045 1,3 1,3 -0,8 -2,3 -0,6 1,3
Fuel Inputs for Thermal Power Generation 383492 362334 382613 424208 412247 427642 375988 351192 301418 271283 279041 289489 306228 0,0 0,7 -0,9 -2,2 -0,8 0,9Solids 263837 230040 223012 229245 209696 213286 156039 116096 61973 32175 22100 28286 50501 -1,7 -0,6 -2,9 -8,8 -9,8 8,6Oil (including refinery gas) 54404 51463 39294 29780 15655 14092 8297 9759 9226 8443 7380 4179 384 -3,2 -8,8 -6,2 1,1 -2,2 -25,6Gas 56754 67806 102408 134637 145953 140938 125048 128301 122409 113218 120162 120907 119922 6,1 3,6 -1,5 -0,2 -0,2 0,0Biomass & Waste 5724 10033 14960 25901 35542 52522 78058 87794 93906 102341 113230 118669 117637 10,1 9,0 8,2 1,9 1,9 0,4Geothermal heat 2774 2992 2939 4645 5400 6804 8546 9240 13904 15106 16169 17448 17743 0,6 6,3 4,7 5,0 1,5 0,9Hydrogen - Methanol 0 0 0 0 0 0 0 0 0 0 0 0 41
Fuel Input in other transformation proc. 839073 814654 827098 842975 793682 794123 744759 707996 677216 584335 477770 387931 326515 -0,1 -0,4 -0,6 -0,9 -3,4 -3,7Refineries 679426 705954 735244 758152 718075 711235 658854 624792 597431 502676 396234 298395 227316 0,8 -0,2 -0,9 -1,0 -4,0 -5,4Biofuels and hydrogen production 2 202 610 3129 12206 19490 26745 25790 25703 44990 59174 75061 90453 79,6 34,9 8,2 -0,4 8,7 4,3District heating 32960 23240 19323 16212 15970 15644 13844 13201 11307 10760 7205 4860 3443 -5,2 -1,9 -1,4 -2,0 -4,4 -7,1Others 126685 85258 71921 65482 47431 47753 45316 44213 42775 25908 15158 9616 5304 -5,5 -4,1 -0,5 -0,6 -9,9 -10,0
Energy Branch Consumption 82379 88696 88176 96033 91103 90108 83563 77664 72262 64800 59023 56033 62866 0,7 0,3 -0,9 -1,4 -2,0 0,6Non-Energy Uses 97931 110541 112495 117477 111508 115320 118130 119715 121502 121019 120132 112308 105651 1,4 -0,1 0,6 0,3 -0,1 -1,3Final Energy Demand 1068710 1069989 1112989 1173676 1160719 1214911 1145539 1098479 1073123 979418 906948 853415 796953 0,4 0,4 -0,1 -0,7 -1,7 -1,3by sectorIndustry 365650 328513 326949 326308 310867 322893 317727 315774 315746 304794 301680 286024 273050 -1,1 -0,5 0,2 -0,1 -0,5 -1,0 - energy intensive industries 234722 214526 213112 210991 192045 196810 190595 187117 184911 172601 165966 153150 141629 -1,0 -1,0 -0,1 -0,3 -1,1 -1,6 - other industrial sectors 130928 113987 113837 115317 118822 126082 127133 128658 130835 132193 135714 132874 131421 -1,4 0,4 0,7 0,3 0,4 -0,3Residential 264307 280418 286784 308104 306277 320909 289992 272097 263833 237654 220271 208125 186747 0,8 0,7 -0,5 -0,9 -1,8 -1,6Tertiary 158484 160442 159866 176859 173611 183954 167277 152932 146319 127074 116899 112028 104394 0,1 0,8 -0,4 -1,3 -2,2 -1,1Transport 280269 300617 339389 362405 369965 387156 370542 357676 347225 309896 268098 247238 232762 1,9 0,9 0,0 -0,6 -2,6 -1,4by fuel
Solids 125031 84977 61454 54486 47313 44817 39498 33100 26905 15091 10585 4716 2465 -6,9 -2,6 -1,8 -3,8 -8,9 -13,6Oil 444429 456959 478882 495857 476944 476736 433195 401949 377958 298182 216449 157751 119008 0,7 0,0 -1,0 -1,4 -5,4 -5,8Gas 227902 245996 265552 283524 268007 275220 227782 209417 211385 176861 152774 135736 101462 1,5 0,1 -1,6 -0,7 -3,2 -4,0Electricity 184145 193367 216403 237537 242353 265245 269920 276873 278937 288677 307654 310406 308281 1,6 1,1 1,1 0,3 1,0 0,0Heat (from CHP and District Heating) (A) 48610 44616 40061 44441 57826 71764 79088 82821 83257 82387 80019 77480 76437 -1,9 3,7 3,2 0,5 -0,4 -0,5Other 38592 44073 50640 57832 68276 81129 96056 94319 94681 118220 139467 167325 189301 2,8 3,0 3,5 -0,1 3,9 3,1
CO2 Emissions (Mt of CO2 - sec approach) 4030,6 3800,1 3810,6 3946,6 3689,7 3682,8 3098,2 2771,6 2430,3 1831,0 1374,9 993,4 668,6 -0,6 -0,3 -1,7 -2,4 -5,5 -7,0Power generation/District heating 1484,3 1321,2 1320,8 1381,1 1274,9 1273,5 969,6 818,5 578,3 379,7 263,1 136,0 30,3 -1,2 -0,4 -2,7 -5,0 -7,6 -19,4Energy Branch 152,2 171,0 170,2 181,6 157,2 145,9 127,6 113,4 102,9 74,6 57,5 44,2 32,0 1,1 -0,8 -2,1 -2,1 -5,7 -5,7Industry 781,4 678,1 623,0 581,9 497,5 480,1 435,1 414,5 405,9 332,9 290,8 234,3 176,2 -2,2 -2,2 -1,3 -0,7 -3,3 -4,9Residential 499,4 481,6 466,2 486,7 466,4 466,2 383,9 325,0 308,6 229,5 167,8 125,0 74,1 -0,7 0,0 -1,9 -2,2 -5,9 -7,8Tertiary 300,5 275,3 242,0 262,2 245,5 239,3 188,8 163,4 155,3 118,6 85,7 62,1 39,3 -2,1 0,1 -2,6 -1,9 -5,8 -7,5Transport 812,7 872,9 988,5 1053,1 1048,2 1077,7 993,1 936,9 879,3 695,8 510,0 391,7 316,7 2,0 0,6 -0,5 -1,2 -5,3 -4,7
CO2 Emissions Index (1990=100) 100,0 94,3 94,5 97,9 91,5 91,4 76,9 68,8 60,3 45,4 34,1 24,6 16,6CO2 Emissions (Mt of CO2 - ref approach) 4172,0 3950,7 3922,7 4087,6 3757,0 3750,6 3166,2 2838,5 2498,9 1893,9 1440,7 1082,8 774,3 -0,6 -0,4 -1,7 -2,3 -5,4 -6,0
EU27: Delayed CCS scenario

Delayed CCS scenario - 75
SUMMARY ENERGY BALANCE AND INDICATORS (B)1990 1995 2000 2005 2010 2015 2020 2025 2030 2035 2040 2045 2050 '90-'00 '00-'10 '10-'20 '20-'30 '30-'40 '40-'50
Annual % ChangeMain Energy System IndicatorsPopulation (Million) 470,388 477,010 481,072 489,211 499,389 507,727 513,838 517,811 519,942 520,654 520,103 518,362 515,303 0,2 0,4 0,3 0,1 0,0 -0,1GDP (in 000 MEuro'05) 8142,7 8748,4 10107,2 11063,1 11385,6 12750,3 14164,0 15503,7 16824,7 18157,1 19527,9 21002,9 22560,0 2,2 1,2 2,2 1,7 1,5 1,5Gross Inl. Cons./GDP (toe/MEuro'05) 203,9 190,0 170,5 165,1 154,0 141,4 118,7 103,2 91,1 78,8 69,9 62,0 54,9 -1,8 -1,0 -2,6 -2,6 -2,6 -2,4Gross Inl. Cons./Capita (toe/inhabitant) 3,53 3,49 3,58 3,73 3,51 3,55 3,27 3,09 2,95 2,75 2,62 2,51 2,40 0,1 -0,2 -0,7 -1,0 -1,2 -0,9Electricity Generated/Capita (kWh gross/inhabitant) 5448 5686 6219 6693 6649 7136 7155 7264 7207 7569 8371 8862 9455 1,3 0,7 0,7 0,1 1,5 1,2Carbon intensity (t of CO2/toe of GIC) 2,43 2,29 2,21 2,16 2,10 2,04 1,84 1,73 1,59 1,28 1,01 0,76 0,54 -0,9 -0,5 -1,3 -1,5 -4,4 -6,0CO2 Emissions/Capita (t of CO2/inhabitant) 8,57 7,97 7,92 8,07 7,39 7,25 6,03 5,35 4,67 3,52 2,64 1,92 1,30 -0,8 -0,7 -2,0 -2,5 -5,5 -6,9CO2 Emissions to GDP (t of CO2/MEuro'05) 495,0 434,4 377,0 356,7 324,1 288,8 218,7 178,8 144,4 100,8 70,4 47,3 29,6 -2,7 -1,5 -3,9 -4,1 -6,9 -8,3Import Dependency % 44,6 43,5 46,8 52,5 53,8 56,5 54,9 55,1 54,9 49,6 44,7 41,1 38,8
Energy intensity indicators (2000=100)Industry (Energy on Value added) 130,3 115,2 100,0 95,1 89,8 84,6 75,4 68,9 64,0 57,5 53,2 47,2 42,1 -2,6 -1,1 -1,7 -1,6 -1,8 -2,3Residential (Energy on Private Income) 114,4 113,2 100,0 97,5 96,2 89,6 73,3 63,5 57,2 47,2 40,8 35,6 29,9 -1,3 -0,4 -2,7 -2,5 -3,3 -3,1Tertiary (Energy on Value added) 126,5 117,0 100,0 99,4 93,9 88,0 71,8 59,7 52,4 42,1 35,8 31,8 27,5 -2,3 -0,6 -2,7 -3,1 -3,7 -2,6Transport (Energy on GDP) 102,5 102,3 100,0 97,6 96,8 90,4 77,9 68,7 61,5 50,8 40,9 35,1 30,7 -0,2 -0,3 -2,1 -2,3 -4,0 -2,8
Carbon Intensity indicatorsElectricity and Steam production (t of CO2/MWh) 0,46 0,40 0,37 0,35 0,31 0,27 0,20 0,17 0,12 0,07 0,05 0,02 0,01 -2,1 -1,9 -4,1 -5,2 -8,5Final energy demand (t of CO2/toe) 2,24 2,16 2,08 2,03 1,94 1,86 1,75 1,67 1,63 1,41 1,16 0,95 0,76 -0,7 -0,7 -1,1 -0,7 -3,3 -4,2
Industry 2,14 2,06 1,91 1,78 1,60 1,49 1,37 1,31 1,29 1,09 0,96 0,82 0,65 -1,1 -1,7 -1,5 -0,6 -2,8 -3,9Residential 1,89 1,72 1,63 1,58 1,52 1,45 1,32 1,19 1,17 0,97 0,76 0,60 0,40 -1,5 -0,7 -1,4 -1,2 -4,2 -6,3Tertiary 1,90 1,72 1,51 1,48 1,41 1,30 1,13 1,07 1,06 0,93 0,73 0,55 0,38 -2,2 -0,7 -2,2 -0,6 -3,6 -6,5Transport 2,90 2,90 2,91 2,91 2,83 2,78 2,68 2,62 2,53 2,25 1,90 1,58 1,36 0,0 -0,3 -0,6 -0,6 -2,8 -3,3
Electricity and steam generationNet Generation Capacity in MWe 654168 715466 821505 926251 1029593 1076048 1199296 1286867 1445606 1536466 1638739 2,3 2,3 1,5 1,9 1,3
Nuclear energy 133966 134452 131393 125743 124707 106393 106421 122512 130739 131701 126606 -0,2 -0,5 -1,6 2,1 -0,3Renewable energy 112878 147262 206776 283876 420035 503365 648548 744990 891318 989081 1093433 6,2 7,3 4,4 3,2 2,1
Hydro (pumping excluded) 99714 104505 107315 111550 114915 116917 118978 121120 122702 124346 126055 0,7 0,7 0,3 0,3 0,3Wind 12793 40584 83905 143733 247153 302574 391801 442429 515971 557736 608692 20,7 11,4 4,7 2,8 1,7Solar 371 2172 15307 28018 56235 80894 133467 175455 245538 298509 348458 45,1 13,9 9,0 6,3 3,6Other renewables (tidal etc.) 0 1 249 575 1732 2981 4302 5986 7108 8491 10228 21,4 9,5 5,1 3,7
Thermal power 407324 433752 483337 516631 484851 466290 444327 419365 423549 415684 418700 1,7 0,0 -0,9 -0,5 -0,1of which cogeneration units 76247 85453 98258 119251 124528 132706 141144 158032 163436 153848 150789 2,6 2,4 1,3 1,5 -0,8of which CCS units 0 0 0 0 2657 2657 2862 8816 37677 81789 147663 0,7 29,4 14,6
Solids fired 194165 186620 183624 182691 154302 128370 107078 84751 70835 67409 73335 -0,6 -1,7 -3,6 -4,0 0,3Gas fired 129444 166863 218517 242663 232712 232853 230370 220033 222262 212082 209830 5,4 0,6 -0,1 -0,4 -0,6Oil fired 71058 62082 55901 46066 34927 32601 28143 24422 21533 19758 18477 -2,4 -4,6 -2,1 -2,6 -1,5Biomass-waste fired 12051 17502 24567 44304 61771 71235 76886 88149 106768 114115 114699 7,4 9,7 2,2 3,3 0,7Hydrogen plants 0 0 0 0 0 0 0 0 0 0 0Geothermal heat 605 686 727 908 1139 1231 1850 2010 2151 2320 2360 1,9 4,6 5,0 1,5 0,9
Load factor for net electric capacities (%) 49,1 49,1 43,9 42,6 39,0 38,4 34,5 33,8 33,1 32,5 32,0Indicators for gross electricity productionEfficiency for thermal electricity production (%) 37,6 38,5 39,5 40,0 39,8 40,5 39,3 39,2 40,0 40,5 41,6CHP indicator (% of electricity from CHP) 11,4 11,7 14,9 19,0 20,3 21,0 20,6 19,4 17,1 15,4 14,2CCS indicator (% of electricity from CCS) 0,0 0,0 0,0 0,0 0,6 0,6 0,7 2,2 6,3 12,0 19,0Non fossil fuels in electricity generation (%) 45,8 44,8 47,2 50,7 60,8 65,3 73,2 79,1 81,0 81,2 79,9 - nuclear 31,6 30,5 27,5 25,4 24,3 22,9 21,5 23,7 22,7 21,1 19,2 - renewable energy forms and industrial waste 14,2 14,3 19,7 25,3 36,5 42,4 51,7 55,4 58,3 60,0 60,7Indicators for renewables (excluding industrial waste) (%) (B)
RES in gross final energy demand (%) 7,6 8,6 11,4 14,8 21,3 24,4 28,0 35,0 42,6 49,3 55,7RES in transport (%) 0,5 1,4 4,3 6,6 10,8 13,8 18,7 30,7 44,8 55,1 62,2
Transport sectorPassenger transport activity (Gpkm) 4880,7 5307,7 5892,2 6240,3 6511,3 7132,6 7480,0 7913,9 8355,1 8560,1 8778,9 9046,4 9246,8 1,9 1,0 1,4 1,1 0,5 0,5
Public road transport 544,0 504,0 517,6 526,0 545,0 573,7 639,6 675,1 721,5 770,2 812,8 850,1 885,5 -0,5 0,5 1,6 1,2 1,2 0,9Private cars and motorcycles 3501,1 3986,3 4428,1 4686,5 4866,0 5288,3 5414,7 5648,9 5886,0 5915,0 5980,5 6072,8 6126,7 2,4 0,9 1,1 0,8 0,2 0,2Rail 472,5 421,7 447,9 461,0 482,5 525,5 607,0 645,1 704,0 765,4 821,9 891,8 964,6 -0,5 0,7 2,3 1,5 1,6 1,6Aviation 317,3 351,3 456,9 527,3 576,9 702,8 775,7 899,7 996,3 1060,1 1112,4 1178,5 1215,4 3,7 2,4 3,0 2,5 1,1 0,9Inland navigation 45,8 44,4 41,7 39,5 40,8 42,5 43,1 45,0 47,4 49,4 51,3 53,1 54,6 -0,9 -0,2 0,6 0,9 0,8 0,6
Travel per person (km per capita) 10376 11127 12248 12756 13038 14048 14557 15283 16069 16441 16879 17452 17944 1,7 0,6 1,1 1,0 0,5 0,6
Freight transport activity (Gtkm) 1848,4 1942,4 2195,7 2494,6 2662,6 2952,5 3058,3 3212,4 3372,9 3425,4 3520,0 3610,5 3657,4 1,7 1,9 1,4 1,0 0,4 0,4Trucks 1060,4 1288,7 1518,7 1800,3 1940,3 2164,4 2155,4 2255,1 2346,9 2323,1 2341,6 2366,1 2353,6 3,7 2,5 1,1 0,9 0,0 0,1Rail 526,3 386,1 403,7 414,1 440,5 489,1 575,1 608,2 658,0 715,2 775,1 826,0 873,5 -2,6 0,9 2,7 1,4 1,7 1,2Inland navigation 261,6 267,6 273,3 280,2 281,9 299,0 327,8 349,1 368,0 387,2 403,3 418,4 430,3 0,4 0,3 1,5 1,2 0,9 0,6
Freight activity per unit of GDP (tkm/000 Euro'05) 227 222 217 225 234 232 216 207 200 189 180 172 162 -0,4 0,7 -0,8 -0,7 -1,1 -1,1Energy demand in transport (ktoe) 280269 300617 339389 362405 369965 387156 370542 357676 347225 309896 268098 247238 232762 1,9 0,9 0,0 -0,6 -2,6 -1,4
Public road transport 5197 4732 4914 5039 5182 5315 5423 5238 4922 4142 3401 3287 3262 -0,6 0,5 0,5 -1,0 -3,6 -0,4Private cars and motorcycles 154395 166321 182974 187736 186407 184714 167418 148669 139189 123023 96945 85240 74097 1,7 0,2 -1,1 -1,8 -3,6 -2,7Trucks 74969 79037 90951 105104 111606 123128 119072 121502 121946 109612 96681 88458 84019 2,0 2,1 0,6 0,2 -2,3 -1,4Rail 9560 9452 9600 9436 9594 10160 11029 10599 9635 9281 8671 8127 7909 0,0 0,0 1,4 -1,3 -1,0 -0,9Aviation 29038 34112 45395 49703 51709 58141 61531 65280 64824 57081 55657 55427 56812 4,6 1,3 1,8 0,5 -1,5 0,2Inland navigation 7110 6963 5555 5386 5466 5699 6071 6387 6709 6758 6743 6699 6663 -2,4 -0,2 1,1 1,0 0,1 -0,1
Efficiency indicator (activity related)Passenger transport (toe/Mpkm) 39,6 39,5 40,3 39,5 38,0 35,4 31,9 28,2 25,5 22,0 18,2 16,4 15,0 0,2 -0,6 -1,7 -2,2 -3,3 -2,0Freight transport (toe/Mtkm) 47,1 46,8 46,3 46,5 46,0 45,7 43,2 41,8 39,7 35,4 30,7 27,5 25,8 -0,2 -0,1 -0,6 -0,8 -2,5 -1,7
EU27: Delayed CCS scenario

Delayed CCS scenario - 76
6. Low nuclear scenario
SUMMARY ENERGY BALANCE AND INDICATORS (A) ktoe 1990 1995 2000 2005 2010 2015 2020 2025 2030 2035 2040 2045 2050 '90-'00 '00-'10 '10-'20 '20-'30 '30-'40 '40-'50
Annual % ChangeProduction 936047 950181 941860 900326 833880 806302 783208 729856 655412 634719 652843 647364 647871 0,1 -1,2 -0,6 -1,8 0,0 -0,1
Solids 366477 277810 213423 196277 177975 167224 136642 110080 83810 81928 83306 78964 73504 -5,3 -1,8 -2,6 -4,8 -0,1 -1,2Oil 129551 171052 173006 134290 104398 73687 46256 35838 31856 23740 14974 7052 2225 2,9 -4,9 -7,8 -3,7 -7,3 -17,4Natural gas 162447 188965 207559 188677 164866 129038 110475 89793 73132 61058 48751 33622 22827 2,5 -2,3 -3,9 -4,0 -4,0 -7,3Nuclear 202589 223028 243761 257360 235016 237465 227497 199311 125368 79056 62962 37271 29326 1,9 -0,4 -0,3 -5,8 -6,7 -7,4Renewable energy sources 74984 89326 104111 123722 151625 198889 262338 294836 341246 388937 442850 490455 519989 3,3 3,8 5,6 2,7 2,6 1,6
Hydro 25101 28054 30374 26395 30008 30274 30795 31570 32111 32594 33116 33579 33949 1,9 -0,1 0,3 0,4 0,3 0,2Biomass & Waste 46473 57201 67982 85129 99000 122712 149289 159128 167569 191670 215871 241554 251459 3,9 3,8 4,2 1,2 2,6 1,5Wind 67 350 1913 6061 12781 28217 52300 66202 89644 103804 122309 135561 148699 39,8 20,9 15,1 5,5 3,2 2,0Solar and others 153 274 421 807 3438 9384 18817 24998 33382 40619 50366 56988 61610 10,7 23,4 18,5 5,9 4,2 2,0Geothermal 3190 3447 3421 5331 6399 8302 11137 12937 18541 20250 21188 22774 24271 0,7 6,5 5,7 5,2 1,3 1,4
Net Imports 756079 738600 826299 986048 969296 1048783 956523 912998 884995 824651 740294 632191 531930 0,9 1,6 -0,1 -0,8 -1,8 -3,3Solids 81846 79338 98645 126639 102765 116218 91199 70928 45170 48601 51530 40660 42204 1,9 0,4 -1,2 -6,8 1,3 -2,0Oil 535645 512185 533039 599851 580732 608318 582774 555199 530926 459431 365668 263723 195890 0,0 0,9 0,0 -0,9 -3,7 -6,1 - Crude oil and Feedstocks 508460 494000 513725 581995 578269 602162 578385 555029 534076 465431 374988 285683 218147 0,1 1,2 0,0 -0,8 -3,5 -5,3 - Oil products 27185 18185 19314 17856 2463 6155 4390 171 -3150 -6000 -9320 -21960 -22257 -3,4 -18,6 6,0Natural gas 135121 145288 192531 257366 278116 317218 270529 280183 301835 306217 311090 310690 271546 3,6 3,7 -0,3 1,1 0,3 -1,4Electricity 3323 1508 1686 971 696 -620 -2153 -2586 -1280 -839 -1192 -1292 -1457 -6,6 -8,5Renewable energy forms 144 279 397 1222 6987 7649 14174 9273 8344 11241 13199 18409 23747 10,7 33,2 7,3 -5,2 4,7 6,0
Gross Inland Consumption 1660159 1662517 1723099 1825989 1753125 1802969 1686817 1590142 1488516 1410951 1346846 1235421 1137200 0,4 0,2 -0,4 -1,2 -1,0 -1,7Solids 452940 364248 321007 319922 280741 283442 227841 181007 128981 130529 134836 119624 115708 -3,4 -1,3 -2,1 -5,5 0,4 -1,5Oil 631058 650858 658727 676859 635078 629888 576116 538325 511443 437880 342273 241138 173496 0,4 -0,4 -1,0 -1,2 -3,9 -6,6Natural gas 294905 333268 393417 445998 442981 446256 381003 369976 374967 367275 359841 344312 294373 2,9 1,2 -1,5 -0,2 -0,4 -2,0Nuclear 202589 223028 243761 257360 235016 237465 227497 199311 125368 79056 62962 37271 29326 1,9 -0,4 -0,3 -5,8 -6,7 -7,4Electricity 3323 1508 1686 971 696 -620 -2153 -2586 -1280 -839 -1192 -1292 -1457 -6,6 -8,5Renewable energy forms 75343 89606 104501 124880 158613 206538 276512 304109 349038 397050 448127 494367 525755 3,3 4,3 5,7 2,4 2,5 1,6
as % in Gross Inland ConsumptionSolids 27,3 21,9 18,6 17,5 16,0 15,7 13,5 11,4 8,7 9,3 10,0 9,7 10,2Oil 38,0 39,1 38,2 37,1 36,2 34,9 34,2 33,9 34,4 31,0 25,4 19,5 15,3Natural gas 17,8 20,0 22,8 24,4 25,3 24,8 22,6 23,3 25,2 26,0 26,7 27,9 25,9Nuclear 12,2 13,4 14,1 14,1 13,4 13,2 13,5 12,5 8,4 5,6 4,7 3,0 2,6Renewable energy forms 4,5 5,4 6,1 6,8 9,0 11,5 16,4 19,1 23,4 28,1 33,3 40,0 46,2
Gross Electricity Generation in GWhe 2562823 2712209 2991720 3274121 3319118 3622155 3692684 3749635 3684346 4003032 4530075 4732533 4852610 1,6 1,0 1,1 0,0 2,1 0,7Nuclear 794718 881662 944823 997519 911418 921451 885417 779772 492435 313482 251187 151146 120339 1,7 -0,4 -0,3 -5,7 -6,5 -7,1Hydro & wind 292648 330306 375545 378836 514979 713551 1039903 1250333 1608849 1848852 2175334 2418050 2646680 2,5 3,2 7,3 4,5 3,1 2,0Thermal (incl. biomass) 1475456 1500241 1671352 1897765 1892721 1987153 1767363 1719529 1583062 1840698 2103554 2163336 2085591 1,3 1,3 -0,7 -1,1 2,9 -0,1
Fuel Inputs for Thermal Power Generation 383492 362334 382613 424208 412058 427495 382177 362656 335562 367803 399473 395402 379404 0,0 0,7 -0,7 -1,3 1,8 -0,5Solids 263837 230040 223012 229245 209496 213465 162971 123186 76816 91592 105773 106405 109961 -1,7 -0,6 -2,5 -7,2 3,3 0,4Oil (including refinery gas) 54404 51463 39294 29780 15656 14147 8067 10169 10353 10963 10330 5005 485 -3,2 -8,8 -6,4 2,5 0,0 -26,4Gas 56754 67806 102408 134637 145959 140766 124249 130766 134700 145212 152853 147900 137605 6,1 3,6 -1,6 0,8 1,3 -1,0Biomass & Waste 5724 10033 14960 25901 35546 52312 78156 88761 98393 103707 113533 118393 113326 10,1 9,0 8,2 2,3 1,4 0,0Geothermal heat 2774 2992 2939 4645 5400 6804 8733 9773 15299 16328 16985 17700 18008 0,6 6,3 4,9 5,8 1,1 0,6Hydrogen - Methanol 0 0 0 0 0 0 0 0 0 0 0 0 19
Fuel Input in other transformation proc. 839073 814654 827098 842975 793665 794095 745841 707244 678415 607425 509797 401404 325061 -0,1 -0,4 -0,6 -0,9 -2,8 -4,4Refineries 679426 705954 735244 758152 718103 711109 659266 624319 598003 519578 416258 307345 226788 0,8 -0,2 -0,9 -1,0 -3,6 -5,9Biofuels and hydrogen production 2 202 610 3129 12208 19510 26828 25818 25726 44241 61725 77999 90412 79,6 34,9 8,2 -0,4 9,1 3,9District heating 32960 23240 19323 16212 15962 15725 13843 13081 11533 9119 6389 4527 3004 -5,2 -1,9 -1,4 -1,8 -5,7 -7,3Others 126685 85258 71921 65482 47391 47751 45903 44025 43154 34487 25425 11533 4857 -5,5 -4,1 -0,3 -0,6 -5,2 -15,3
Energy Branch Consumption 82379 88696 88176 96033 91094 90076 83701 77476 72395 73565 74797 71351 66487 0,7 0,3 -0,8 -1,4 0,3 -1,2Non-Energy Uses 97931 110541 112495 117477 111511 115318 118137 119710 121465 120967 120103 112174 105679 1,4 -0,1 0,6 0,3 -0,1 -1,3Final Energy Demand 1068710 1069989 1112989 1173676 1160743 1214869 1147435 1095212 1065310 1011338 946291 868740 793419 0,4 0,4 -0,1 -0,7 -1,2 -1,7by sectorIndustry 365650 328513 326949 326308 310858 322787 318753 315293 313987 307432 305065 286550 271549 -1,1 -0,5 0,3 -0,2 -0,3 -1,2 - energy intensive industries 234722 214526 213112 210991 192040 196748 191503 186743 183733 175684 169784 154005 140471 -1,0 -1,0 0,0 -0,4 -0,8 -1,9 - other industrial sectors 130928 113987 113837 115317 118818 126039 127250 128550 130254 131748 135281 132545 131078 -1,4 0,4 0,7 0,2 0,4 -0,3Residential 264307 280418 286784 308104 306318 320952 290108 270925 261270 248474 232717 212334 185477 0,8 0,7 -0,5 -1,0 -1,2 -2,2Tertiary 158484 160442 159866 176859 173603 183981 167740 152016 143445 134612 125926 114755 102850 0,1 0,8 -0,3 -1,6 -1,3 -2,0Transport 280269 300617 339389 362405 369964 387148 370834 356978 346607 320820 282583 255101 233542 1,9 0,9 0,0 -0,7 -2,0 -1,9by fuel
Solids 125031 84977 61454 54486 47270 44790 40209 32886 26273 17616 13511 5906 2239 -6,9 -2,6 -1,6 -4,2 -6,4 -16,5Oil 444429 456959 478882 495857 476999 476739 433211 400710 377138 313365 232377 164064 117903 0,7 0,0 -1,0 -1,4 -4,7 -6,6Gas 227902 245996 265552 283524 268025 275255 228194 208413 210001 189505 166301 137513 95784 1,5 0,1 -1,6 -0,8 -2,3 -5,4Electricity 184145 193367 216403 237537 242283 265184 271120 276033 274027 287361 307103 307121 305497 1,6 1,1 1,1 0,1 1,1 -0,1Heat (from CHP and District Heating) (A) 48610 44616 40061 44441 57849 71838 79028 83235 84786 87142 86190 82369 79380 -1,9 3,7 3,2 0,7 0,2 -0,8Other 38592 44073 50640 57832 68316 81063 95672 93936 93084 116348 140809 171767 192616 2,8 3,0 3,4 -0,3 4,2 3,2
CO2 Emissions (Mt of CO2 - sec approach) 4030,6 3800,1 3810,6 3946,6 3688,9 3683,2 3131,7 2796,9 2481,5 1993,9 1495,0 986,5 634,3 -0,6 -0,3 -1,6 -2,3 -4,9 -8,2Power generation/District heating 1484,3 1321,2 1320,8 1381,1 1274,2 1273,9 998,2 851,2 637,7 449,5 284,9 98,8 21,2 -1,2 -0,4 -2,4 -4,4 -7,7 -22,9Energy Branch 152,2 171,0 170,2 181,6 157,2 145,9 128,4 113,0 103,1 79,7 61,0 45,6 24,4 1,1 -0,8 -2,0 -2,2 -5,1 -8,7Industry 781,4 678,1 623,0 581,9 497,0 480,0 439,5 412,8 404,1 349,1 308,2 234,9 165,5 -2,2 -2,2 -1,2 -0,8 -2,7 -6,0Residential 499,4 481,6 466,2 486,7 466,7 466,4 383,8 322,8 304,8 255,7 194,5 132,9 70,8 -0,7 0,0 -1,9 -2,3 -4,4 -9,6Tertiary 300,5 275,3 242,0 262,2 245,7 239,4 188,2 162,4 154,1 133,5 102,0 68,3 38,2 -2,1 0,2 -2,6 -2,0 -4,0 -9,4Transport 812,7 872,9 988,5 1053,1 1048,2 1077,6 993,7 934,7 877,7 726,3 544,5 406,0 314,2 2,0 0,6 -0,5 -1,2 -4,7 -5,3
CO2 Emissions Index (1990=100) 100,0 94,3 94,5 97,9 91,5 91,4 77,7 69,4 61,6 49,5 37,1 24,5 15,7CO2 Emissions (Mt of CO2 - ref approach) 4172,0 3950,7 3922,7 4087,6 3756,3 3751,1 3199,3 2863,6 2550,6 2056,8 1560,2 1073,7 737,6 -0,6 -0,4 -1,6 -2,2 -4,8 -7,2
EU27: Low nuclear scenario

Delayed CCS scenario - 77
SUMMARY ENERGY BALANCE AND INDICATORS (B)
1990 1995 2000 2005 2010 2015 2020 2025 2030 2035 2040 2045 2050 '90-'00 '00-'10 '10-'20 '20-'30 '30-'40 '40-'50Annual % Change
Main Energy System IndicatorsPopulation (Million) 470,388 477,010 481,072 489,211 499,389 507,727 513,838 517,811 519,942 520,654 520,103 518,362 515,303 0,2 0,4 0,3 0,1 0,0 -0,1GDP (in 000 MEuro'05) 8142,7 8748,4 10107,2 11063,1 11385,6 12750,3 14164,0 15503,7 16824,7 18157,1 19527,9 21002,9 22560,0 2,2 1,2 2,2 1,7 1,5 1,5Gross Inl. Cons./GDP (toe/MEuro'05) 203,9 190,0 170,5 165,1 154,0 141,4 119,1 102,6 88,5 77,7 69,0 58,8 50,4 -1,8 -1,0 -2,5 -2,9 -2,5 -3,1Gross Inl. Cons./Capita (toe/inhabitant) 3,53 3,49 3,58 3,73 3,51 3,55 3,28 3,07 2,86 2,71 2,59 2,38 2,21 0,1 -0,2 -0,7 -1,4 -1,0 -1,6Electricity Generated/Capita (kWh gross/inhabitant) 5448 5686 6219 6693 6646 7134 7186 7241 7086 7688 8710 9130 9417 1,3 0,7 0,8 -0,1 2,1 0,8Carbon intensity (t of CO2/toe of GIC) 2,43 2,29 2,21 2,16 2,10 2,04 1,86 1,76 1,67 1,41 1,11 0,80 0,56 -0,9 -0,5 -1,2 -1,1 -4,0 -6,7CO2 Emissions/Capita (t of CO2/inhabitant) 8,57 7,97 7,92 8,07 7,39 7,25 6,09 5,40 4,77 3,83 2,87 1,90 1,23 -0,8 -0,7 -1,9 -2,4 -4,9 -8,1CO2 Emissions to GDP (t of CO2/MEuro'05) 495,0 434,4 377,0 356,7 324,0 288,9 221,1 180,4 147,5 109,8 76,6 47,0 28,1 -2,7 -1,5 -3,7 -4,0 -6,3 -9,5Import Dependency % 44,6 43,5 46,8 52,5 53,8 56,5 55,0 55,6 57,5 56,5 53,1 49,4 45,1
Energy intensity indicators (2000=100)Industry (Energy on Value added) 130,3 115,2 100,0 95,1 89,8 84,5 75,6 68,8 63,7 58,0 53,8 47,2 41,9 -2,6 -1,1 -1,7 -1,7 -1,7 -2,5Residential (Energy on Private Income) 114,4 113,2 100,0 97,5 96,3 89,7 73,3 63,2 56,6 49,4 43,1 36,3 29,7 -1,3 -0,4 -2,7 -2,6 -2,7 -3,7Tertiary (Energy on Value added) 126,5 117,0 100,0 99,4 93,9 88,0 72,0 59,3 51,4 44,6 38,6 32,6 27,1 -2,3 -0,6 -2,6 -3,3 -2,8 -3,5Transport (Energy on GDP) 102,5 102,3 100,0 97,6 96,8 90,4 78,0 68,6 61,4 52,6 43,1 36,2 30,8 -0,2 -0,3 -2,1 -2,4 -3,5 -3,3
Carbon Intensity indicatorsElectricity and Steam production (t of CO2/MWh) 0,46 0,40 0,37 0,35 0,31 0,27 0,21 0,17 0,13 0,09 0,05 0,02 0,00 -2,1 -2,0 -3,8 -4,5 -9,2Final energy demand (t of CO2/toe) 2,24 2,16 2,08 2,03 1,94 1,86 1,75 1,67 1,63 1,45 1,21 0,97 0,74 -0,7 -0,7 -1,1 -0,7 -2,9 -4,8
Industry 2,14 2,06 1,91 1,78 1,60 1,49 1,38 1,31 1,29 1,14 1,01 0,82 0,61 -1,1 -1,7 -1,5 -0,7 -2,4 -4,9Residential 1,89 1,72 1,63 1,58 1,52 1,45 1,32 1,19 1,17 1,03 0,84 0,63 0,38 -1,5 -0,6 -1,4 -1,2 -3,3 -7,5Tertiary 1,90 1,72 1,51 1,48 1,42 1,30 1,12 1,07 1,07 0,99 0,81 0,60 0,37 -2,2 -0,7 -2,3 -0,4 -2,8 -7,5Transport 2,90 2,90 2,91 2,91 2,83 2,78 2,68 2,62 2,53 2,26 1,93 1,59 1,35 0,0 -0,3 -0,6 -0,6 -2,7 -3,5
Electricity and steam generationNet Generation Capacity in MWe 654168 715466 821498 926071 1028502 1075129 1198871 1305721 1493474 1630142 1721011 2,3 2,3 1,5 2,2 1,4
Nuclear energy 133966 134452 131393 125743 123641 96195 62110 38502 30675 19846 15501 -0,2 -0,6 -6,7 -6,8 -6,6Renewable energy 112878 147262 206776 283787 419250 505806 672162 784712 945955 1069262 1192680 6,2 7,3 4,8 3,5 2,3
Hydro (pumping excluded) 99714 104505 107315 111540 114859 116960 119176 121256 122464 124554 126859 0,7 0,7 0,4 0,3 0,4Wind 12793 40584 83905 143654 246396 303989 411622 473458 554340 612137 674115 20,7 11,4 5,3 3,0 2,0Solar 371 2172 15307 28018 56262 81851 137038 183893 261900 323804 380723 45,1 13,9 9,3 6,7 3,8Other renewables (tidal etc.) 0 1 249 575 1732 3005 4327 6105 7252 8767 10982 21,4 9,6 5,3 4,2
Thermal power 407324 433752 483329 516541 485612 473129 464599 482506 516844 541034 512830 1,7 0,0 -0,4 1,1 -0,1of which cogeneration units 76247 85453 98311 119406 125133 135436 149703 163897 164135 169283 170040 2,6 2,4 1,8 0,9 0,4of which CCS units 0 0 0 0 2711 2711 8209 61535 129400 213141 247835 11,7 31,8 6,7
Solids fired 194165 186620 183620 182825 154527 131745 115037 122760 128280 125565 124868 -0,6 -1,7 -2,9 1,1 -0,3Gas fired 129444 166863 218514 242623 233617 236189 236679 240491 261180 285925 255451 5,4 0,7 0,1 1,0 -0,2Oil fired 71058 62082 55901 46087 34821 32248 29516 28203 24752 18766 17720 -2,4 -4,6 -1,6 -1,7 -3,3Biomass-waste fired 12051 17502 24567 44098 61483 71646 81332 88881 100373 108425 112395 7,4 9,6 2,8 2,1 1,1Hydrogen plants 0 0 0 0 0 0 0 0 0 0 0Geothermal heat 605 686 727 908 1164 1302 2035 2172 2259 2354 2395 1,9 4,8 5,8 1,0 0,6
Load factor for net electric capacities (%) 49,1 49,1 43,9 42,6 39,3 38,3 33,9 33,2 32,5 30,9 30,0Indicators for gross electricity productionEfficiency for thermal electricity production (%) 37,6 38,5 39,5 40,0 39,8 40,8 40,6 43,0 45,3 47,1 47,3CHP indicator (% of electricity from CHP) 11,4 11,7 14,9 19,0 20,3 21,7 22,4 22,2 20,3 19,9 18,1CCS indicator (% of electricity from CCS) 0,0 0,0 0,0 0,0 0,5 0,7 2,1 12,8 22,2 30,4 31,9Non fossil fuels in electricity generation (%) 45,8 44,8 47,2 50,7 60,3 63,6 68,0 64,9 64,4 65,3 67,3 - nuclear 31,6 30,5 27,5 25,4 24,0 20,8 13,4 7,8 5,5 3,2 2,5 - renewable energy forms and industrial waste 14,2 14,3 19,7 25,3 36,4 42,8 54,6 57,1 58,8 62,1 64,8Indicators for renewables (excluding industrial waste) (%) (B)
RES in gross final energy demand (%) 7,6 8,6 11,4 14,8 21,2 24,5 28,8 34,3 41,3 49,7 57,5RES in transport (%) 0,5 1,4 4,3 6,6 10,9 13,9 19,1 30,9 44,6 55,8 64,2
Transport sectorPassenger transport activity (Gpkm) 4880,7 5307,7 5892,2 6240,3 6511,3 7132,2 7480,2 7908,5 8340,8 8638,2 8897,8 9145,0 9321,6 1,9 1,0 1,4 1,1 0,6 0,5
Public road transport 544,0 504,0 517,6 526,0 545,0 573,7 639,6 675,1 721,6 767,7 807,3 847,3 890,0 -0,5 0,5 1,6 1,2 1,1 1,0Private cars and motorcycles 3501,1 3986,3 4428,1 4686,5 4866,0 5288,2 5414,2 5644,5 5875,4 5992,2 6097,9 6172,9 6203,9 2,4 0,9 1,1 0,8 0,4 0,2Rail 472,5 421,7 447,9 461,0 482,5 525,1 607,1 644,5 701,2 759,1 813,6 885,0 964,8 -0,5 0,7 2,3 1,5 1,5 1,7Aviation 317,3 351,3 456,9 527,3 576,9 702,8 776,2 899,4 995,2 1069,7 1127,6 1186,6 1208,4 3,7 2,4 3,0 2,5 1,3 0,7Inland navigation 45,8 44,4 41,7 39,5 40,8 42,5 43,1 45,0 47,4 49,5 51,5 53,1 54,5 -0,9 -0,2 0,6 0,9 0,8 0,6
Travel per person (km per capita) 10376 11127 12248 12756 13038 14047 14557 15273 16042 16591 17108 17642 18090 1,7 0,6 1,1 1,0 0,6 0,6
Freight transport activity (Gtkm) 1848,4 1942,4 2195,7 2494,6 2662,6 2952,3 3058,2 3209,7 3365,7 3475,9 3590,6 3645,4 3636,4 1,7 1,9 1,4 1,0 0,6 0,1Trucks 1060,4 1288,7 1518,7 1800,3 1940,3 2164,3 2155,1 2252,5 2340,6 2377,1 2419,5 2405,9 2330,1 3,7 2,5 1,1 0,8 0,3 -0,4Rail 526,3 386,1 403,7 414,1 440,5 489,0 575,3 608,0 657,2 711,2 767,4 821,0 876,3 -2,6 0,9 2,7 1,3 1,6 1,3Inland navigation 261,6 267,6 273,3 280,2 281,9 299,0 327,8 349,1 367,9 387,7 403,7 418,5 430,0 0,4 0,3 1,5 1,2 0,9 0,6
Freight activity per unit of GDP (tkm/000 Euro'05) 227 222 217 225 234 232 216 207 200 191 184 174 161 -0,4 0,7 -0,8 -0,8 -0,8 -1,3Energy demand in transport (ktoe) 280269 300617 339389 362405 369964 387148 370834 356978 346607 320820 282583 255101 233542 1,9 0,9 0,0 -0,7 -2,0 -1,9
Public road transport 5197 4732 4914 5039 5182 5315 5422 5236 4925 4637 3789 3404 3320 -0,6 0,5 0,5 -1,0 -2,6 -1,3Private cars and motorcycles 154395 166321 182974 187736 186407 184711 167383 148571 139304 122019 96088 83957 73503 1,7 0,2 -1,1 -1,8 -3,6 -2,6Trucks 74969 79037 90951 105104 111606 123126 119058 121370 121625 114475 105852 93858 84726 2,0 2,1 0,6 0,2 -1,4 -2,2Rail 9560 9452 9600 9436 9594 10157 11032 10594 9617 9386 9087 8656 8299 0,0 0,0 1,4 -1,4 -0,6 -0,9Aviation 29038 34112 45395 49703 51709 58141 61868 64820 64430 63407 60777 58327 56916 4,6 1,3 1,8 0,4 -0,6 -0,7Inland navigation 7110 6963 5555 5386 5466 5699 6070 6386 6706 6895 6990 6899 6778 -2,4 -0,2 1,1 1,0 0,4 -0,3
Efficiency indicator (activity related)Passenger transport (toe/Mpkm) 39,6 39,5 40,3 39,5 38,0 35,4 31,9 28,2 25,5 22,5 18,5 16,4 14,8 0,2 -0,6 -1,7 -2,2 -3,2 -2,2Freight transport (toe/Mtkm) 47,1 46,8 46,3 46,5 46,0 45,7 43,2 41,8 39,7 36,4 32,8 28,9 26,3 -0,2 -0,1 -0,6 -0,8 -1,9 -2,2
EU27: Low nuclear scenario

- 78 -
ATTACHMENT 2: ASSUMPTIONS ABOUT INTERCONNECTIONS AND MODELLING OF ELECTRICITY TRADE
Short description of the model The electricity trade model of PRIMES covers all countries in the European continent except countries of the CIS and Turkey. Interconnector capacities at the various country borders are determined exogenously. The model performs unit commitment, endogenous use of interconnectors (with given capacities and Net Transfer Capacities (NTC)) and also optimal power generation capacity expansion planning in a perfect foresight manner until 2050. Simulations of different electricity demand levels with the model allow identification of bottlenecks and of the amount of investment in interconnectors necessary to remove such bottlenecks. The model covers demand both for electricity and CHP steam/heat, as given from results of the entire PRIMES model. Demand for electricity and for steam/heat is supposed to be given and is represented through two typical days (for winter and summer). Investment in new power plants is endogenous. The rate of use of power capacities and interconnectors is endogenous. Regarding the use of interconnectors the model performs a linear Direct Current optimal power flow under oriented NTC constraints defined per each couple of countries. The model makes distinction between AC lines and DC lines, the use of the latter being controlled by operators. All interconnectors existing today or planned to be constructed in the future are represented (one by one) in the model. Among the inputs, the model considers non linear cost-supply curves for fuels used in power generation and non linear investment cost curves for nuclear and renewable energy power plants, which are a function of total installed capacity (unit investment costs increase as approaching the potential). The electricity model, used in stage 1, is identical to the model used in the entire PRIMES model, but could be used with endogenous electricity trade only for the work during stage 1 because of very long computing times for each model run when iterations are performed between demand and supply and for meeting carbon targets. Assumptions for the modelling exercise All data about NTCs and interconnection capacities were taken from ENTSOe databases. Information on new constructions was taken from the latest “Ten-year network development plan 2010-2020”, complemented, where necessary, with information from the Nordic Pool TSOs and the Energy Community (for South East Europe). Some of the planned new constructions would justify increase of NTCs values until 2020, as mentioned in the ENTSOe’s TYNDP document. Other mentioned new constructions regard directly the building of new interconnection lines which are introduced as such in the model database. According to assumptions agreed with the Energy DG of the European Commission, the following three cases were formulated regarding the NTC values:
a) NTC-0: keeping the NTC values of 2020, which are much higher than today, unchanged until 2050; the projection of NTC values to the year 2020 from today

- 79 -
levels follows a study by KEMA, except few cases either because the links were not included in that study or because ENTSOe’s NTC values announced for 2010-2011 were exceeding the KEMA’s values. This assumption does not use the TYNDP information about new constructions aiming at increasing the NTC values in the future, except indirectly if in some cases the KEMA values for 2020 increase from today’s levels.
b) NTC-2: apply a doubling of 2020 NTC values between 2020 and 2050 and interpolate linearly between 2020 and 2050; increase capacities of interconnectors where necessary so as to keep NTC values lower than total interconnection capacity by individual couples of countries. Some additional DC lines were added (linking Italy with western Balkans).
c) NTC-4: apply a quadrupling of 2020 NTC values by 2050 and interpolate with extension of interconnection capacities where needed.
Two energy demand and pricing contexts were considered to analyze the implications from the above mentioned NTC assumptions, which are as follows:
1. Reference scenario: demand, prices, taxes and ETS carbon prices are taken as identical to the DG ENER Reference scenario. Some adjustments on electricity demand figures were made only for year 2010, based on monthly statistics for 2010, in order to be able to simulate the true NTC values for this year.
2. Decarbonisation scenario: demand, prices and ETS carbon prices, as well as the parameters mirroring RES facilitation and other policies, are taken from the DG CLIMA “Decarbonisation scenario under effective technologies and global climate action” scenario.
Discussion of model results for the Reference scenario with three NTC value cases The model results show that the NTC values retained for the year 2020 do not lead to substantial changes compared to results for the standard Reference scenario, i.e. the Reference scenario referred to in the Low Carbon Economy Roadmap). The countries projected to be net exporters in the standard reference scenario remain so in the model results presented here; the same applies to countries projected to be net importers in the standard reference scenario. There are differences in the magnitude of exports or imports for the year 2020, as for example for Belgium, Portugal, Lithuania and Latvia (higher net imports), for Hungary and Denmark (lower net imports) and for Slovenia, Slovakia, Sweden and Bulgaria (more net exports). It is reminded that for the standard Reference scenario import-exports of electricity were derived following a different methodology, which applied common balancing by region, contrasting the pan-European balancing applied for the model runs presented here. NTC-0 case. Regarding the scenario with NTC values remaining unchanged at the year 2020, the model results provide information about congestion by considering whether the NTC constraints are binding or close to be binding for couples of countries. The findings from this analysis regarding the projected NTC values for 2020 are summarized below
• Link Switzerland-Germany: appears congested and NTC is 32% of capacity • Link Germany-Poland: appears congested and NTC is 17% of capacity • Link Denmark-Sweden: appears congested and NTC is 54% of capacity • Link Austria-Italy: appears very congested and NTC is 16% of capacity • Link Italy-Slovenia: appears congested and NTC is 15% of capacity

- 80 -
• Link Austria-Hungary: appears congested and NTC is 31% of capacity • Link Slovenia-Croatia: appears congested and NTC is 18% of capacity • Links in the Balkans (FYROM-Greece, Albania-Greece, Bulgaria-Greece, Serbia-
FYROM, Romania-Serbia, Serbia-Albania, Bulgaria-FYROM) appear very congested and NTC are below 30% of capacity, except Greece-Bulgaria NTC which is 68% of capacity
Congestion is detected in the model runs due to NTCs that are only a small part of existing capacities. One option for dealing with congestion would be to increase NTC without necessarily construct new lines. From the above overview it can be seen that the congestions after 2020 remain between Germany and neighbours to the east and south, between Austria, Italy, Slovenia, and Hungary, and finally in the Balkans, both within the Balkans and the linkages with northern neighbours. NTC-2 and NTC-4 cases The NTC-2 and NTC-4 cases assume doubling and quadrupling of NTC values, respectively from 2020 to2050, with linear interpolation applied between 2020 and 2050. The model results show that this way of uniformly increasing the NTC values does not really solve the problem of systematic congestions mentioned above for the case NTC-0. These congestions are removed only in the case NTC-4 and after 2030, with the exception of the Austria-Italy and Germany-Poland links, which remain congested until 2050 despite the quadrupled NTCs. The congestion problems in the Balkans are removed only in the NTC-4 case after 2030, but the area remains strongly congested under the NTC-2 assumptions. The congestions in links with Germany (Switzerland, Poland, Czech Rep. and Austria) are not removed in the NTC-2 case. The doubling and quadrupling of NTCs values do not provide any advantages concerning the large list of links, which are not found congested under the NTC-0 assumptions. The doubling of NTCs under the assumptions of NTC-2 case lead to lower rates of use of interconnection capacities (reported as percentage of NTCs), compared with NTC-0 results in the following cases:
• UK-Ireland: 17 percentage points less use • France, Belgium, Netherlands, Luxembourg, Germany: between 15 and 30 percentage
points less use • Nordic area: around 15 percentage points less use • Czech Rep., Slovakia, Poland, Hungary, Romania, Croatia: between 20 and 30
percentage points less use • Latvia-Estonia: 20 percentage points less use
Passing from the doubling to the quadrupling implies even lower rates of use of interconnection possibilities. Both cases NTC-2 and NTC-4 have adverse implications on the rate of use of DC lines leading to lower rates of use compared to case NTC-0, which under NTC-4 are close to zero in some cases. The NTC constraints help using the DC links for which the NTC values are usually equal to the interconnection capacities. Excessively high NTC constraints, which also

- 81 -
mean more AC links, imply much less use of DC lines, which of course is unrealistic, as the DC lines correspond to today known constructions and are furthermore expensive. So the companies would not build so many new AC lines as the ones corresponding to NTC-4 on economic grounds including the adverse effects on DC lines. A major issue with NTC-2 and NTC-4 cases regards the investment cost implicitly associated with the increase of interconnection capacities stemming from the doubling and quadrupling of NTC values. Total interconnection capacity is projected to increase by 43% in 2020 compared to 2010 levels, as a result of implementing the construction program of the TYNDP. In NTC-0 the capacity remains roughly unchanged until 2050. But in NTC-2 the capacity has to increase by 95% in 2050 compared to 2020 levels and in NTC-4 this increase is 277%. Such a construction program exceeds by far capacity requirements and would unnecessarily penalize costs and electricity prices in the scenarios. According to the model results, we obtain the following changes in energy terms from NTC-2 and NTC-4 assumptions compared to NTC-0 results:
• Total volume of electricity traded increases by 5% in NTC-2 and by 8% in NTC-4 compared to NTC-0 in cumulative terms for the period 2015-2050. It is evident that the additional cost of interconnectors cannot be justified by such small increases in total traded volumes (i.e. adding absolute values of flows between countries).
• Total electricity production costs decrease by 0.13% in NTC-2 and by 0.23% in NTC-4 compared to NTC-0 in cumulative terms 2015-2050
• CO2 emissions from electricity production decrease by 0.8% in NTC-2 and by 0.9% in NTC-4 compared to NTC-0 in cumulative terms 2015-2050
• Nuclear and RES cumulative production are found slightly higher in NTC-2 and NTC-4 compared to NTC-0, but the changes are less than 1% in cumulative terms.
It can therefore be concluded that the NTC expansion according to the NTC-2 and NTC-4 assumptions are not needed for the functioning of the electricity system and would entail high unnecessary cost without providing any noticeable benefit. These assumptions do not solve the serious congestion issues, do not provide gains for the non congested areas and have adverse effects on the economics of DC lines. The conclusion for a Reference or Current Policy Initiatives framework is therefore to follow an approach that focuses on identified bottlenecks. For stage 2 of the modelling it is appropriate to increase NTC values and interconnection capacities after 2020 in a selective way, with priority to areas that would be congested in the future according to the reference scenario results. Such areas are the southern and eastern connections of Germany, the area linking Italy, Austria and Slovenia, the linkages of Balkans with northern neighbours and the linkages within Balkans. Some NTC additions should be also made for the linkages Denmark-Sweden and Latvia-Estonia. With lower electricity demand due to the assumed strong energy efficiency policies, these results also hold for the Current Policy Initiatives scenario.

- 82 -
Discussion of model results for a Decarbonisation scenario with three NTC value cases Under the assumptions of the decarbonisation scenario, total demand for electricity (in the 32 countries included in the model) increases by 15% in 2050 compared to the Reference scenario for year 2050. , It is assumed that the renewable facilitation policies develop in all countries in favour of domestic renewable potential. The scenario does not assume inflows of RES electricity from outside EU countries (e.g. North Africa) and does not include the possibility of exploitation of offshore wind located at long distance from the coasts. The results from the model show that the NTC values retained for the period until 2020 do not alter the electricity trade pattern projected in previous decarbonisation exercises and compared to the Reference scenario. The congestions identified in the context of the decarbonisation scenario for the year 2020 are the same as in the context of the reference scenario (see previous section). Under the assumptions of the NTC-0 case the results show congestions similar to those found for the reference scenario, i.e. in south and east of Germany, in the Balkans, in the northern connections of the Balkans, in the linkages between Italy, Austria and Slovenia. Some additional congestion cases, found in the context of decarbonisation, relate to the link Germany-Sweden, Norway-UK and Germany-UK which are based on DC-links and do not concern the NTC values. The doubling of NTC values under the assumptions of the NTC-2 case does not help removing the congestions. The quadrupling of NTC values (NTC-4 case) helps removing the congestions only in the long term, after 2040. So the linear interpolation method seems not to be useful as it brings little benefits and entails high costs for building new interconnectors. Increase of NTC values in a selective way and at an early stage after 2020 seems more suitable. In the context of the decarbonisation scenario, the NTC-2 case allows increase of total volumes traded by 12% when compared to NTC-0. The increase obtained for the NTC-4 case is 14% (up from NTC-0). NTC-2 reduces total power generation costs roughly by 0.85% in cumulative terms compared to NTC-0. In NTC-4, the additional effect on power generation costs is smaller, NTC-4 power generation costs are 0.2%) lower compared with NTC-2. It is important to note that these statements related to power generation costs, and that the move from NTC-0 to NTC-2 and even more NTC-4 involves large costs for grid investment. NTC-2 has small impacts favouring slightly more nuclear and RES generation, whereas NTC-4 add very little to NTC-2 effects. Overall conclusions on decarbonisation scenarios (except for those with very strong reliance on RES) Following these economic modelling results, the approach for further modelling was chosen to start fromNTC-0 assumptions and to increase in selective way NTC values immediately after 2020 for the linkages found to be congested. This concerns interconnections around Germany, in Austria-Italy-Slovenia, Balkans and Denmark-Sweden.

- 83 -
For very high RES penetration, such linkages may not be sufficient. Therefore, this case has been examined separately. The results of this analysis are reported in the following chapter. Assumptions about interconnections in the Decarbonisation scenario with High RES deployment both domestically and in the North Sea Under the assumptions of this decarbonisation scenario, full exploitation of off-shore wind potential at North Sea is foreseen. In this modelling, exploiting the highest possible offshore wind potential is envisaged for Denmark, the UK, France, Germany, Netherlands, Sweden, Norway, Belgium and Ireland, according to the division of the sea in economic zones. Data on potentials come from published reports (e.g. EEA); the additional potentials, compared to standard RES scenario, are remarkably high for Norway, UK and Netherlands. It is assumed that a dense DC interconnection system will develop mainly offshore but also partly onshore, to facilitate power flows from the North Sea offshore wind parks. After several model runs with different DC topology configurations and after considering elimination of congestions arising from wind offshore power flows, we have concluded to the following assumptions about the additional DC interconnections:
In MW Investment in additional new interconnectors in the 4.1 scenario – North Sea
2030 2035 2040 2045 2050 Total
Ireland UK 0 0 1000 0 0 1000
Spain France 1000 0 1000 0 0 2000
France Germany 0 0 1000 1000 0 2000
France Belgium 0 0 1000 0 0 1000
Belgium Netherlands 0 0 1000 1000 0 2000
Netherlands Germany 0 500 1000 1000 0 2500
UK France 1000 0 1000 500 0 2500
UK Belgium 1000 0 500 0 0 1500
UK Netherlands 0 0 1000 0 0 1000
UK Germany 1000 0 1000 1000 0 3000
Norway Belgium 1000 1000 1000 1000 1000 5000
Norway Netherlands 1000 1000 500 500 0 3000
Norway Germany 1000 1000 1000 1000 1000 5000
Germany Denmark 0 1000 2000 1000 500 4500
Norway Denmark 1000 0 0 0 0 1000
UK Norway 0 1000 0 1000 0 2000
Norway Sweden 1000 0 0 0 0 1000
Sweden Poland 1000 2000 2000 2000 3000 10000
Netherlands Denmark 500 500 1000 500 0 2500
Denmark Sweden 500 500 1000 1000 1000 4000
Germany Poland 0 1000 1000 1500 1500 5000
Denmark Poland 0 1000 2000 2500 500 6000
Total 11000 10500 21000 16500 8500 67500 The NTC values are identical to the DC capacities, as assumed for all DC lines.

- 84 -
The congestions in this scenario are related to the wheeling of electricity from the North Sea region to consumption centres. The links of Sweden with Poland, Sweden with Lithuania, Austria with Italy, France with Italy and links in the Balkan region appear to be congested. In this scenario, the electricity trade changes drastically. The United Kingdom, Netherlands, Denmark, Sweden, Norway export large amount of electricity while France, Belgium Germany, Italy, Czech Republic, Slovakia, Poland become or remain importing countries. This changes the results for the decarbonisation scenario as regards several countries.

- 85 -
ATTACHMENT 3: SHORT DESCRIPTION OF THE MODELS USED The scenarios were derived with the PRIMES model by a consortium led by the National Technical University of Athens (E3MLab), supported by some more specialised models (e.g. GEM-E3 model that has been used for projections for the value added by branch of activity and PROMETHEUS model that has been deployed for projections of world energy prices). GEM-E3
The GEM-E3 (World and Europe) model is an applied general equilibrium model, simultaneously representing World regions and European countries, linked through endogenous bilateral trade flows and environmental flows. The European model is including the EU countries, the Accession Countries and Switzerland. The world model version includes 18 regions among which a grouping of European Union states. GEM-E3 aims at covering the interactions between the economy, the energy system and the environment. It is a comprehensive model of the economy, the productive sectors, consumption, price formation of commodities, labour and capital, investment and dynamic growth. The model is dynamic, recursive over time, driven by accumulation of capital and equipment. Technology progress is explicitly represented in the production function, either exogenous or endogenous, depending on R&D expenditure by private and public sector and taking into account spillovers effects. The current GEM-E3 version has been updated to the GTAP7 database (base year 2004) and has been updated with the latest Eurostat statistics for the EU Member States. PRIMES model
The PRIMES model simulates the response of energy consumers and the energy supply systems to different pathways of economic development and exogenous constraints and drivers. It is a modelling system that simulates a market equilibrium solution in the European Union and its member states. The model determines the equilibrium by finding the prices of each energy form such that the quantity producers find best to supply match the quantity consumers wish to use. The equilibrium is forwarding looking and includes dynamic relationships for capital accumulation and technology vintages. The model is behavioural formulating agents’ decisions according to microeconomic theory, but it also represents in an explicit and detailed way the available energy demand and supply technologies and pollution abatement technologies. The system reflects considerations about market competition economics, industry structure, energy /environmental policies and regulation. These are conceived so as to influence market behaviour of energy system agents. The modular structure of PRIMES reflects a distribution of decision making among agents that decide individually about their supply, demand, combined supply and demand, and prices. Then the market integrating part of PRIMES simulates market clearing. PRIMES is a partial equilibrium model simulating the entire energy system both in demand and in supply; it contains a mixed representations of bottom-up and top-down elements. The PRIMES model covers the 27 EU Member States as well as candidate and neighbour states (Norway, Switzerland, Turkey, South East Europe). The timeframe of the model is 2000 to 2050 by five-year periods; the years up to 2005 are calibrated to Eurostat data. The level of detail of the model is large as it contains:

- 86 -
• 12 industrial sectors, subdivided into 26 sub-sectors using energy in 12 generic processes (e.g. air compression, furnaces)
• 5 tertiary sectors, using energy in 6 processes (e.g. air conditioning, office equipment) • 4 dwelling types using energy in 5 processes (e.g. water heating, cooking) and 12
types of electrical durable goods (e.g. refrigerator, washing machine, television) • 4 transport modes, 10 transport means (e.g. cars, buses, motorcycles, trucks, airplanes)
and 10 vehicle technologies (e.g. internal combustion engine, hybrid cars) • 14 fossil fuel types, new fuel carriers (hydrogen, biofuels) 10 renewable energy types • Main Supply System: power and steam generation with 150 power and steam
technologies and 240 grid interconnections • Other sub-systems: refineries, gas supply, biomass supply, hydrogen supply, primary
energy production • 7 types of emissions from energy processing (e.g. SO2, NOx, PM) • CO2 emissions from industrial processes • GHG emissions and abatement (using IIASA’s marginal abatement cost curves for
non CO2 GHGs). For further information see http://www.e3mlab.ntua.gr/e3mlab/index.php?option=com_content&view=article&id=58%3Amanual-for-primes-model&catid=35%3Aprimes&Itemid=80&lang=en Prometheus model
A fully stochastic World energy model used for assessing uncertainties and risks associated with the main energy aggregates including uncertainties associated with economic growth and resource endowment as well as the impact of policy actions (R&D on specific technologies, taxes, standards, subsidies and other supports). The model projects endogenously to the future the world energy prices, supply, demand and emissions for 10 World regions. World fossil fuel price trajectories are used for the EU modelling as import price assumptions for PRIMES.

- 87 -
Annex 2 - Energy Roadmap 2050 – Selected Stakeholders' Scenarios
1. INTRODUCTION 2. SCANNING OF STAKEHOLDER SCENARIOS 3. COMPARATIVE ANALYSIS OF SCENARIO STUDIES
3.1 Policy Assumptions and Targets
3.2 Economic Assumptions
3.3 Assumptions on Social Issues
3.4 Further Technology Assumptions
3.5 Key Results of Scenarios
3.6 Models Used and Interdependencies Between Studies 4. SUMMARY OF COMPARISON References
- 88 -
1. INTRODUCTION Stakeholders are continuing their work on scenarios for long term transformation of energy systems. These analyses, using a variety of models and assumptions and exploring a variety of constraints, all help in assessing the robustness of conclusions on policy actions needed in the coming years. The bulk of this report, chapters 2-4, is a systematic presentation of a representative sample of European long term energy scenarios. Their policy targets, assumptions on various economic, social and technological factors, and resulting outcomes of model-based analyses are compared. The purpose is not to judge the outcomes of the scenarios but to try to understand and clearly describe the similarities and differences in the scenarios20. This work was completed in April 2011. Since then, several scenarios this year explore consequences of the Fukushima accident and unconventional gas. In the IEA21's global scenario to 2035 entitled The Golden Age of Gas, ample availability of gas, much of it unconventional, keeps average gas prices well below levels assumed in WEO-2010. Especially in growing economies in China and other non-OECD countries, gas consumption increases throughout the energy system, driven by price, improved access to supplies, efficiency improvements in technologies, also emissions benefits. Its flexibility is a distinct benefit in a perspective of much change in energy systems and much uncertainty about how drivers will play out. In Europe, scenario analyses by the European Gas Advocacy Forum22 and Eurogas23 underline this flexibility and how it can be used. EGAF argues that with greater use of gas in the short to medium term, to 2030 or so, implementation risks in the early years of a long-term strategy focused on renewables24 can be reduced as well as overall costs. Eurogas similarly argues that the balance which will emerge between renewables and CCS/fossil fuels cannot be known today and that investing in gas keeps these long-term options open. The importance of CCS in these strategies in the long term is evident in the IEA scenario which does not assume availability of CCS by 2035. In this scenario, the long-term trajectory for CO2 emissions is towards 650ppm, thus a probable temperature rise well above the 2 degrees C target. The European Climate Foundation in this year’s phase of its Roadmap 2050 work, concentrates on trade-offs in the period till 2030, exploring coherent policy actions needed to keep the European energy system on track to 2050. With further analyses of its 60% renewables and high renewables scenarios for the power sector25, trade-offs among additional grid infrastructures, generation capacities and their location, storage and demand side management are examined. Additional grid investments beyond 2020, although substantial, are low compared to generation investments. If these grid investments are not made, the result 20 Key references for this work are: (1) "Analysis and Comparison of Relevant Mid- and Long-term
Energy Scenarios for EU and their Key Underlying Assumptions" (PROGNOS, 2011) [8], and (2) "Key Factors Affecting the Deployment of Electricity Generation Technologies in Energy Technology Scenarios" (Paul Scherrer Institut, 2009) [9].
21 World Energy Outlook 2011 - special early insights: "Are We Entering A Golden Age Of Gas?" International Energy Agency, June 2011 (complete WEO 2011 due 9 November)
22 "Making the Green Journey Work", European Gas Advocacy Forum, February 2011 23 Eurogas Roadmap 2050, 13 October 2011 24 EGAF refers to European Climate Foundation's 60% RES scenario for the power sector (Roadmap
2050, 2010) 25 "Power Perspectives 2030", European Climate Foundation, 7 November 2011; scenarios from Roadmap
2050, ECF, 2010.

- 89 -
is an increase in back-up and operational costs amounting to far more than the grid investments saved. Demand response, within day, reduces the need for additional transmission infrastructure. The deployment of renewables in order of productiveness across Europe reduces cumulative generation capital costs by over a fifth by 2030 compared to a Member State by Member State approach. ECF also examines price setting in regional markets and utilisation rates of additional back-up plant, crucial for understanding market design issues. Greenpeace concentrated on grids in its 2011 scenario analyses26, building on its earlier Renewables 24/7 study. Looking beyond 2030, a High Grid scenario encompassing much trade and North African solar resources and a Low Grid scenario with more local solutions within Europe are explored. With adequate transmission, both would imply shrinking utilisation rates for coal and nuclear plants and later for gas fired plants, which could then be converted to biogas. Scenarios for sustained transformation of the energy system are now being developed by a whole range of organisations, at local, Member State and European level27. Many look explicitly at the European market and policy context28. The conclusions of these scenario analyses and the analyses by the Commission are consistent on many but not all issues. All agree on the importance of energy efficiency in any strategy. The increased reliance on capital investments in the transformation of the energy system and in energy efficiency improvements is evident in all scenarios, raising financing, risk management and cost of capital issues to the top of the agenda. All see a much stronger reliance on renewables than currently, which raises issues notably for the power system. Flexibility from all sources is increasingly important. Grid investments and the market developments that go with them look like a no-regrets policy, at least in the period to 2030. Areas of difference among scenarios often concern timing. They include the degree of early reliance on electrification as opposed to direct use of, notably, gas, in heating, transport and industry. Estimates of total system costs in scenarios are still very different. They are not easy to compare. 2. SCANNING OF STAKEHOLDER SCENARIOS A variety of international organisations, industry associations, individual companies, NGOs and research/academic institutions have put forward mid- and long-term energy scenarios. In order to make a representative sample, 28 studies were identified by screening contributions and publications from stakeholders. A representative set of 7 studies was selected (see Table 1). The criteria used were time horizon until at least 2030, geographical coverage of EU-27 (or Europe29), public availability of main results in a quantitative form, coverage of at least the electricity sector, level of detail, and the scenarios being well known and discussed internationally. For example, studies covering only the world as a whole without defining Europe as a region were not selected. The time horizon, geographical and sectorial coverages, as well as the level of detail, vary greatly among the scanned studies.
26 “Battle of the Grids”, Greenpeace supported by Energynautics, 2011 27 For example, members of European Environment and Sustainable Development Advisory Councils 28 Eg. DIW work for review of German energy concept 29 "Europe" is sometimes defined as OECD-Europe, EU-25 (for older scenario studies) or EU-27.
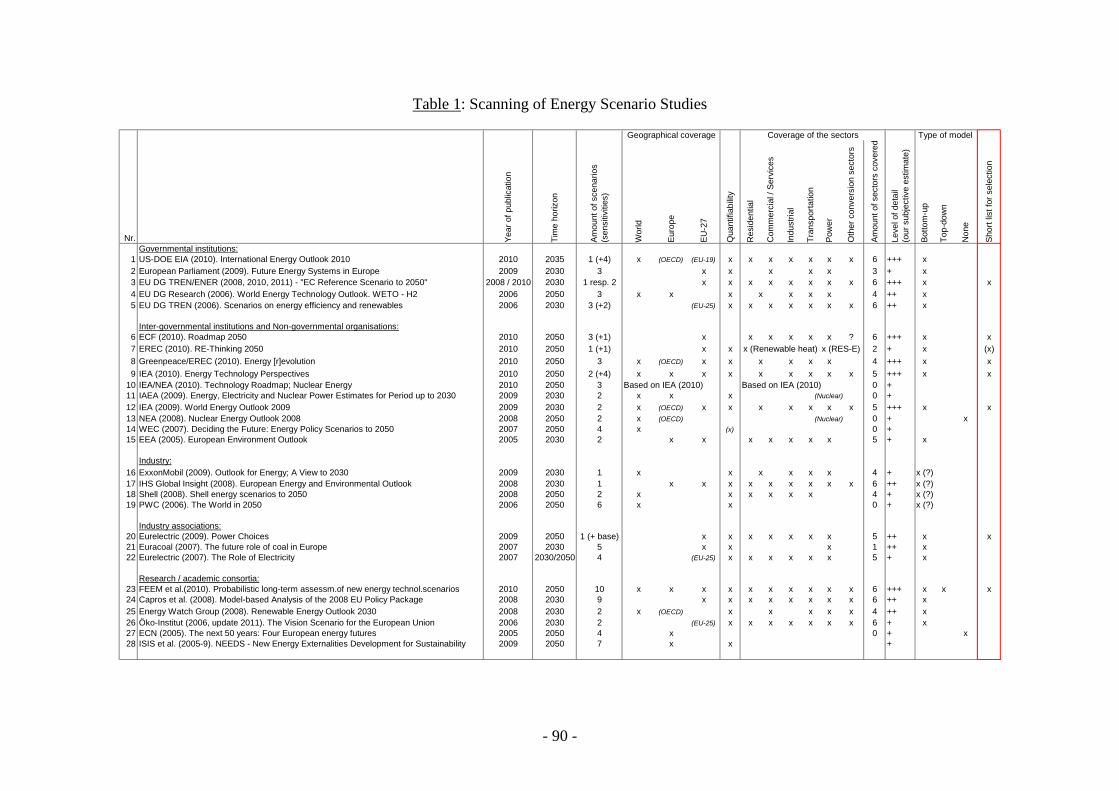
- 90 -
Table 1: Scanning of Energy Scenario Studies
Nr. Year
of p
ublic
atio
n
Tim
e ho
rizon
Amou
nt o
f sce
nario
s (s
ensi
tiviti
es)
Wor
ld
Euro
pe
EU-2
7
Qua
ntifi
abilit
y
Res
iden
tial
Com
mer
cial
/ Se
rvic
es
Indu
stria
l
Tran
spor
tatio
n
Pow
er
Oth
er c
onve
rsio
n se
ctor
s
Amou
nt o
f sec
tors
cov
ered
Leve
l of d
etai
l(o
ur s
ubje
ctiv
e es
timat
e)
Botto
m-u
p
Top-
dow
n
Non
e
Shor
t lis
t for
sel
ectio
n
Governmental institutions:1 US-DOE EIA (2010). International Energy Outlook 2010 2010 2035 1 (+4) x (OECD) (EU-19) x x x x x x x 6 +++ x2 European Parliament (2009). Future Energy Systems in Europe 2009 2030 3 x x x x 3 + x3 EU DG TREN/ENER (2008, 2010, 2011) - "EC Reference Scenario to 2050" 2008 / 2010 2030 1 resp. 2 x x x x x x x x 6 +++ x x4 EU DG Research (2006). World Energy Technology Outlook. WETO - H2 2006 2050 3 x x x x x x 4 ++ x5 EU DG TREN (2006). Scenarios on energy efficiency and renewables 2006 2030 3 (+2) (EU-25) x x x x x x x 6 ++ x
Inter-governmental institutions and Non-governmental organisations:6 ECF (2010). Roadmap 2050 2010 2050 3 (+1) x x x x x x ? 6 +++ x x7 EREC (2010). RE-Thinking 2050 2010 2050 1 (+1) x x x (RES-E) 2 + x (x)8 Greenpeace/EREC (2010). Energy [r]evolution 2010 2050 3 x (OECD) x x x x x 4 +++ x x9 IEA (2010). Energy Technology Perspectives 2010 2050 2 (+4) x x x x x x x x 5 +++ x x
10 IEA/NEA (2010). Technology Roadmap; Nuclear Energy 2010 2050 3 Based on IEA (2010) Based on IEA (2010) 0 +11 IAEA (2009). Energy, Electricity and Nuclear Power Estimates for Period up to 2030 2009 2030 2 x x x (Nuclear) 0 +12 IEA (2009). World Energy Outlook 2009 2009 2030 2 x (OECD) x x x x x x 5 +++ x x13 NEA (2008). Nuclear Energy Outlook 2008 2008 2050 2 x (OECD) (Nuclear) 0 + x14 WEC (2007). Deciding the Future: Energy Policy Scenarios to 2050 2007 2050 4 x (x) 0 +15 EEA (2005). European Environment Outlook 2005 2030 2 x x x x x x x 5 + x
Industry:16 ExxonMobil (2009). Outlook for Energy; A View to 2030 2009 2030 1 x x x x x 4 + x (?)17 IHS Global Insight (2008). European Energy and Environmental Outlook 2008 2030 1 x x x x x x x x x 6 ++ x (?)18 Shell (2008). Shell energy scenarios to 2050 2008 2050 2 x x x x x x 4 + x (?)19 PWC (2006). The World in 2050 2006 2050 6 x x 0 + x (?)
Industry associations:20 Eurelectric (2009). Power Choices 2009 2050 1 (+ base) x x x x x x x 5 ++ x x21 Euracoal (2007). The future role of coal in Europe 2007 2030 5 x x x 1 ++ x22 Eurelectric (2007). The Role of Electricity 2007 2030/2050 4 (EU-25) x x x x x x 5 + x
Research / academic consortia:23 FEEM et al.(2010). Probabilistic long-term assessm.of new energy technol.scenarios 2010 2050 10 x x x x x x x x x x 6 +++ x x x24 Capros et al. (2008). Model-based Analysis of the 2008 EU Policy Package 2008 2030 9 x x x x x x x x 6 ++ x25 Energy Watch Group (2008). Renewable Energy Outlook 2030 2008 2030 2 x (OECD) x x x x 4 ++ x26 Öko-Institut (2006, update 2011). The Vision Scenario for the European Union 2006 2030 2 (EU-25) x x x x x x x 6 + x27 ECN (2005). The next 50 years: Four European energy futures 2005 2050 4 x 0 + x28 ISIS et al. (2005-9). NEEDS - New Energy Externalities Development for Sustainability 2009 2050 7 x x +
Type of model Coverage of the sectors
x
x
x (Renewable heat)
x
x
Geographical coverage
x
x
x

91
The 7 studies selected to be compared in detail are, as follows (see full references at the end of this report): • European Commission Reference Scenario to 2050, published in 2011, [1]:
o "The 2050 Reference scenario depicts energy and greenhouse gas (GHG) emission developments on the basis of policies implemented up to March 2010, mirroring as well the achievement of the legally binding 2020 targets on renewables (RES) and GHG and the implementation of the ETS Directive. It shows the magnitude of the additional effort needed for EU policies to achieve the European Council's GHG mitigation objective."
• European Climate Foundation (ECF) – Roadmap 2050, 2010, [2]:
o "The objectives of the Roadmap 2050 are: a) to investigate the technical and economic feasibility of achieving at least an 80% reduction in greenhouse gas emissions below 1990 levels by 2050, while maintaining or improving today's levels of electricity supply reliability, energy security, economic growth and prosperity; and b) to derive the implications for the European energy system over the next 5 to 10 years."
• Greenpeace/EREC – Energy [R]evolution (+EREC (2010), Re-thinking 2050), 2010, [3]:
o "The report demonstrates how the world can get from where we are now, to where we need to be in terms of phasing out fossil fuels, cutting CO2 while ensuring energy security. This includes illustrating how the world's carbon emissions from the energy and transport sectors alone can peak by 2015 and be cut by over 80% by 2050."
• International Energy Agency (IEA) – Energy Technologies Perspectives (ETP), 2010, [4]:
o "The goal of the analysis in this book is to provide an IEA perspective on the potential for energy technologies to contribute to deep emission reduction targets and the associated costs and benefits. It uses a techno-economic approach to identify the role of both current and new technologies in reducing CO2 emissions and improving energy security."
• IEA – World Energy Outlook (WEO), 2009, [5]:
o "The results of the analysis presented here aim to provide policy makers, investors and energy consumers alike with a rigorous, quantitative framework for assessing likely future trends in energy markets and the cost-effectiveness of new policies to tackle climate change, energy insecurity and other pressing energy-related policy challenges." (Reference scenario);
o "More specifically, this report is intended to inform the climate negotiations by providing an analytical basis for the adoption and implementation of commitments and plans to reduce greenhouse-gas emissions." (450 Scenario).
• Eurelectric – Power Choices, 2009, [6]:
o "The Eurelectric Power Choices study was set up to examine how the vision, of cutting Greenhouse Gas (GHG) emissions by 75% in 2050, can be made reality. Power Choices looks into the technological developments that will be needed in the coming decades and examines some of the policy options that will have to be put in place within the EU to attain a deep cut in carbon emissions by mid-century."
• FEEM30 et al., EU-RTD Project PLANETS: Probabilistic Long-term Assessment of New
Energy Technology Scenarios, 2010, [7]: o "PLANETS is a research project funded by the EC under the 7th Framework Programme with the scope
of devising robust scenarios for the evolution of energy technologies in the next 50 years. The project aims to assess the impact of technology development and deployment at world and European levels, by means of an ensemble of analytical tools designed to foresee the best technological hedging policy in response to future environmental and energy policies."
30 Fondazione Eni Enrico Mattei (FEEM).

92
3. COMPARATIVE ANALYSIS OF SCENARIO STUDIES 3.1 Policy Assumptions and Targets All scenario studies analysed use a "baseline scenario" to show the impact of presently implemented policies (e.g. until 2009). These baseline scenarios are used as a basis for assessing impacts of alternative scenarios. The "alternative scenarios" all aim at reducing GHG or CO2 emissions (and are generally in line with the EU 2020 target of -20% and to the long term target of -80% to -95% by 2050). Most models concentrate on the electricity sector and are much less detailed (or provide no details) on developments in the heating and transport sectors (except insofar as they may assume major electrification in these sectors). Table 2 gives an overview of main pre-defined policy assumptions and targets across the scenarios (for EU-27 or OECD-Europe, depending on study) for: • GHG or CO2 emissions reduction (economy-wide), • Share of renewables (RES), • Role of nuclear, • Efficiency, • Emission Trading System (ETS) and remarks on status of policies taken into account. Table 2: Overview of Main Policy Assumptions and Pre-Defined Targets in the Scenarios
Short name scenario
GHG or CO2-emissions reduction,
economy-wide
Share of renewables in
gross final energy
consumption
Share of nuclear in power generation
Reduction in primary energy
by improved energy
efficiency
Carbon policy
WEO Ref GHG: -20% below 1990 levels by 2020 for EU
20% by 2020 for EU
20% by 2020 for EU
Policies until mid 2009
ETS
WEO 450 ppm
GHG: -20% below 1990 levels by 2020 and -80% by 2050
20% by 2020 20% by 2020 Policies until mid-2009
ETS (OECD+, OME)
ETP BL OECD Europe
GHG: -20% below 1990 levels by 2020 for EU
20% by 2020 for EU
20% by 2020 for EU
Policies until mid-2009
ETS
ETP Blue Map OECD Europe
CO2eq: -74% below 2007 levels by 2050
GHG: -20% below 1990 levels by 2020 for EU
20% by 2020 for EU
20% by 2020 for EU
Policies until mid-2009
ETS (OECD+, OME)
EC Reference Scenario to 2050
GHG: -20% below 1990 levels by 2020 (in Reference scenario)
20% by 2020 (in the Reference scenario)
Economic modelling with currently non nuclear MS remaining non nuclear except Poland and Italy;
Implemented Policies until March 2010 & achievement of legally binding

93
phase-out in 2 MS targets
Revised ETS Directive applied until 2050
ECF BL GHG: -20% below 1990 levels by 2020 for EU
20% by 2020 for EU
20% by 2020 for EU
Policies until mid-2009
ETS
ECF 80% RES
GHG: -80% below 1990 levels by 2050
80% RES of power generation by 2050
10% nuclear of power generation by 2050
20% by 2020 for EU
ETS (OECD+OME)
ECF 60% RES
GHG: -80% below 1990 levels by 2050
60% RES of power generation by 2050
20% nuclear of power generation by 2050
20% by 2020 for EU
ETS (OECD+OME)
ECF 40% RES
GHG: -80% below 1990 levels by 2050
40% RES of power generation by 2050
30% nuclear of power generation by 2050
20% by 2020 for EU
ETS (OECD+OME)
E[R] Ref No specific targets or policies mentioned
E[R] CO2: -80% below 1990 levels by 2050
Phasing out No specific targets or policies mentioned
E[R] Adv CO2: -95% below 1990 levels by 2050
High RES share: "Close to fully renewable energy system" by 2050
Phasing out No specific targets or policies mentioned
Eurelectric BL
Germany and Belgium phased out
Policies until mid-2009
ETS
Eurelectric Power Choices
GHG: -40% below 1990 levels by 2030 and -75% by 2050
20% by 2020 Germany and Belgium phased out
20% by 2020 for EU
Policies until mid-2009
ETS (all sectors)
FEEM-WITCH
No exogenous constraint
Abbreviations used: ETS: Emissions Trading System, GHG: Greenhouse Gas, OME: Other Major Economies (Brazil, Russia, South Africa and the countries of the Middle East), MS: EU Member States.

94
From Table 2 it can be seen that: In relation to reduction of GHG emissions, • Most of the studies do not take into account negative or positive effects of climate change
on the economy in the models used. One exception found are the FEEM-scenarios where the WITCH-model incorporates an integrated assessment module which is able to take into account a dynamic linkage of climate change and economic activity.
• In general, some form of European Emissions Trading (ETS) is considered in most studies
(exceptions are Greenpeace/EREC and FEEM), some models used for scenarios development even have specific modules which simulate a market for emission allowances31 (e.g. PRIMES used by both Commission services and Eurelectric).
• The scenarios differ in their assumptions about future emissions trading markets. There is
a large consensus about the sectors included, but not about the geographical coverage. Some studies assume no extension of the current EU emissions trading, others assume an expansion of the market from OECD+ up to a global dimension. With the Clean Development Mechanism (CDM), another possibility to enlarge the geographic coverage of the allowances market exists. The EU DG ENER scenarios focus on this issue, other scenarios give little information. Finally, some scenarios envisage small deviations from the current status of the allocation process, assuming full auctioning in the power sector and grandfathering in the other sectors. Other scenarios tend towards a general full auctioning of allowances.
Carbon pricing in the different scenarios is shown in Table 3:
Table 3: Comparison of Carbon Pricing in the Scenarios
Scenario Sectoral coverage Geographical coverage Auctioning or grandfathering CDM
IEA – WEO Existing EU-ETS, including aviation
n/a n/a CDM taken into account
IEA – WEO 450 ppm
n/a OECD+ in 2013, major economies as of 2021
n/a CDM taken into account
IEA – ETP Reference
n/a n/a n/a n/a
IEA – ETP Blueline
n/a n/a n/a n/a
EU DG ENER Reference
Existing EU-ETS including aviation
n/a Auctioning in power sector, grandfathering for other-sectors
CDM taken into account
EU DG ENER Baseline
n/a n/a Auctioning in power sector, grandfathering for other-sectors
Limited use of CDM-credits
ECF Roadmap Reference
Industry, power sector, aviation
n/a n/a n/a
ECF Roadmap Pathways
Industry, power sector, aviation
Until 2020 OECD-countries, from 2020 including developing countries
n/a n/a
31 ETS is explicitly modelled by the Commission services' scenarios that derive ETS prices endogenously.

95
Energy [R]evolution n/a Global CO2 trading system in the long term
n/a n/a
Energy [R]evolution Advanced
n/a Global CO2 trading system in the long term
All allowances should be auctioned
n/a
Eurelectric Baseline
n/a n/a Full auctioning as of 2015 (except some new Member States)
n/a
Eurelectric Power Choices
ETS extended to all major economic sectors after 2020
International carbon market after 2020
Full auctioning as of 2015 (except some new Member States)
n/a
FEEM et al. - Planets n/a n/a n/a n/a
In relation to future energy mixes,
• A few studies use pre-defined future energy mix targets, by preferring or excluding certain technologies from the beginning (in a "back-casting approach"):
• Predetermined Role of Renewables (RES): Only Greenpeace/EREC and ECF make specifications on the desired shares of RES energies in 2050: o Greenpeace/EREC sets in its advanced Energy [R]evolution scenario the 2050
RES target share at 100% (all sectors). o ECF sets in its alternative scenarios the 2050 power sector RES target share at
40%, 60% and 80%, respectively. • Predetermined Role of Nuclear Energy (NUC) and Carbon Capture & Storage (CCS):
Greenpeace/EREC and ECF specify pre-defined shares of NUC and CCS in 2050: o Greenpeace/EREC sets in its advanced Energy [R]evolution scenario the 2050
NUC as well as CCS target shares to 0%. o ECF focuses on the RES share. For the purposes of the analysis, particularly of
infrastructure needs, it divides the remaining share equally between NUC and CCS, thus 30%, 20% and 10% for each, in the three alternative scenarios32.
The other scenarios determine the contribution of NUC and CCS on the basis of cost assumptions and optimisation rather than pre-defined policy targets. In relation to sustainability aspects other than GHG reduction, Economic constraints or the issue of maintaining high levels of grid stability and overall system reliability are in most cases either not considered or at least not fully quantified: • Economic constraints, e.g.:
o Minimisation of private financial costs (investment in new generation capacities and infrastructure (an exception is e.g. ECF)),
o Minimisation of social costs, such as environmental externalities (costs of GHG
avoided, other environmental pollution, land use, etc.)33. Maintaining high levels of grid stability and overall system reliability34, e.g.:
32 and 20% Demand-Side Management (DSM) by 2050 in the ECF study. 33 In scenarios mirroring cost-effective achievement of GHG reduction, PRIMES scenarios make sure that
marginal costs are equal across sectors and MS. 34 In a study published by KEMA and Imperial College London in 2010 and performed for ECF, these issues
went at least partly into the modelling.

96
The high relevance of this issue is due to the fact that scenarios with high shares of RES energy sources, particularly wind and solar energy, increase the need for backup capacity or other means of ensuring grid stability. Substitution of electricity for FOS fuels in buildings and transportation, results in higher electricity demand but also expanded possibilities for demand management. These challenges are addressed by all of the studies in one way or another. Several approaches can be identified in the scenarios:
o Flexible thermal power plants (NUC, FOS) for load-following operation and back-up capacity,
o Greater use of non variable RES energy (biomass, solar with storage, geothermal, hydro with pumped storage facilities),
o Transmission expansion. This approach is constrained in some of the scenarios by model limitations. In PRIMES, interconnections are exogenous. The model used in ECF's scenarios derives transmission needs,
o Large-scale storage o Smart grids and demand side management developments.
Maintaining high levels of system reliability and thus high levels of power supply security is qualitatively mentioned across most studies as a key objective and in some studies also as a key challenge.
Regarding realisation, particularly studies with ambitious GHG reduction targets implicitly assume significant progress in grid technology (ECF maintains that they use existing technologies) and social acceptance related to transmission expansion to be able to achieve their targets. However, analysis is typically not taken further35 from such largely qualitative statements and it is usually concluded that financing needs to be found for the large increases in pan-European transmission and storage capacities to be able to cope with the expected large future shares of intermittent generation.
Implications for distribution networks are not addressed by most of the studies. This is particularly concerning as almost all studies emphasize at the same time the relevance of technologically advanced smart grids and smart metering, especially those confronted with ambitious emission reductions (Energy [R]evolution, ECF Pathways, ETP Blueline, Eurelectric Power Choices).
In relation to security of supply of energy resources, • All scenarios expect reserves of natural gas to be sufficient to meet future demands.
Unconventional oil reserves are expected to be deployed in some scenarios without ambitious emission reductions (e.g. ETP Reference). No indictors of security of supply are developed. Possible indicators (diversity of imports, stability of exports, reliability of supply, diversity of supply, etc.) are not developed.
3.2 Economic Assumptions Regarding general economic assumptions, • The scenarios assume a steady increase of GDP of ∼1-2% per year until 2030/2050. The
recent financial crisis is taken into account in the projections of GDP.
35 Only one study was identified containing specific data in this field (ECF/KEMA).

97
Regarding fossil fuel prices, • Fossil fuel prices are often exogenously determined (in PRIMES scenarios by using a
separate modelling framework). ECF and Greenpeace/EREC use price developments from WEO 2009. In WEO 2009, international fossil fuel prices are based on a top-down assessment of prices which would create enough investment to meet energy demand over the projection period (global balance of supply and demand). Therefore, fossil fuel prices in WEO are endogenously determined and sensitive to scenario assumptions. ETP takes prices up to 2030 from WEO 2009 and calculates prices for the period beyond 2030 by taking into account the long-term oil supply cost curve.
• Recent studies suggest a range of ∼90-120 USD/barrel until 2030 and 2050 for the oil
price. Only Greenpeace/EREC considers an oil price that increases to 150 USD/barrel in 2030. Oil prices in Greenpeace/EREC and ECF are assumed to stay constant after 2030.
• Until 2030 most scenarios presume an increasing gas price. In the IEA alternative
scenarios the prices of gas, as for oil, stabilise or decrease after 2030 due to weaker energy demand, while in the reference case gas prices increase in respond to increasing demand (e.g. from additional gas-fired power plants).
• Most studies agree on the idea that gas prices will keep their linkage with oil prices, i.e.
the ratio of gas and oil prices remains quite constant36. Main exceptions are the Greenpeace/EREC Energy [R]evolution and – to some extent – the alternative scenario of the PLANETS-WITCH project (see Figure 1). The PLANETS alternative scenario assumes a higher increase of gas prices than oil prices, motivated by the high gas demand and relatively low oil demand.
Figure 1: Development of Gas to Oil Prices, in %
0%
10%
20%
30%
40%
50%
60%
70%
80%
90%
100%
110%
2005 2010 2015 2020 2025 2030 2035 2040 2045 2050
gas
pric
e / o
il pr
ice
BP Gas Import DE / Oil price BrentWEO Ref WEO 450ppmETP ref ETP blueEU DG Tren 2007 EU HOG BLEU DG Tren 2009 EurelectricE [R] ECFPLANETS (WITCH)* Reference PLANETS (WITCH)* FB 3p2
36 WEO expects US gas prices to be partly disconnected from oil prices, due to large indigenous gas reserves.

98
• A moderate increase of coal prices is assumed in most of the scenarios. Some differences
exist in expectations of future gas-to-coal price ratios. Most of the studies (e.g. Eurelectric) expect coal prices to increase at far lower rates than gas prices. A slight decoupling can be observed in most of the scenario studies. In contrast to the other studies, the Energy [R]evolution of Greenpeace/EREC and the alternative scenario of the PLANETS-WITCH project show a stronger increase of coal than oil prices in the long run.
Regarding incentives for RES, • Some studies (e.g. Eurelectric Power Choices) explicitly assume decreasing direct
incentives for RES in the future due to assumed increasing cost-competitiveness. Regarding CO2-certificate prices, • Different developments for the (typically assumed) CO2-certificate prices are to some part
also determined by targets set and the resulting CO2-emissions development. As shown in Figure 2, emissions in the ECF Pathways and the WEO 450 ppm show a faster decline than emissions in the Eurelectric Power Choices scenario, which seems to allow a higher degree of flexibility to reach the targets set for 2050. Furthermore, the sharp increase of CO2-certificate prices in the Eurelectric Power Choices scenario from 2030 onwards partly results from the assumed removal of mandatory RES-targets after 2020. Therefore, carbon prices gain high importance to deliver required emission reductions by 2050.
Figure 2: Development of CO2-certificate prices, in EUR2008/t CO2
29 3420
4147
24 2517
2537
75
3046
93
2639
19
52 50 46
93103
0
20
40
60
80
100
120
EUR
2008
/ t
2020 2030 2050
On the other hand, assumed geographical extension of emission trading systems (e.g. in the ECF Pathways, WEO 450 ppm and the Power Choices scenario international carbon markets are assumed not later than 2020) can be interpreted to prevent carbon prices from rising unlimited. This effect is due to more abundant and cheap opportunities for emission reduction outside the EU/OECD.
Relatively low prices for emission certificates in the Greenpeace/EREC study may be partly determined by the idea that the process of emission trading remains unclear and is not able to help RES energy expansion (and is thus not considered adequate to become an important parameter for Greenpeace/EREC in their model).

99
In summary, the pre-defined importance of carbon prices as an instrument in different scenario studies may also explain their different resulting price levels (e.g. in the Power Choices scenario, carbon prices are assumed to be important to reach emission targets).
Regarding investment costs, • All scenarios confronted with high emission reduction requirements estimate a
considerable increase in capital expenditure. Even baseline scenarios suggest an increase in capital expenditure in the coming years. The somewhat higher estimation in the emissions reduction scenarios is generally based on several effects: higher capital intensity of RES technologies in terms of costs per power produced and the need for higher power transmission capacity due to intermittency of most of the expected new RES (investment in power transmission capacity is roughly estimated to be 20-50 % higher in most of the alternative scenarios, compared to Baseline or Reference scenarios); higher capital intensity of new NUC and CCS investments. The scenarios also agree in the estimation of lower expenses for FOS fuels in due course due to large substitutions of RES for FOS fuels and energy efficiency improvements.
• Overall, these effects lead to somewhat different total cost results across scenarios with
large methodological uncertainties, strongly influenced by different modelling mechanisms (e.g. cost-optimization vs. accounting frameworks), framework parameters (e.g. price developments; see above) and conventions for cost-estimations. Furthermore, results are often not available for the same timeframes and geographical boundaries.
• Results on future investment costs are also strongly influenced by the chosen assumptions
on technological developments in energy transformation and end-user applications. A lot depends on learning rates For example, in ECF, learning rates are 5% for wind offshore/onshore, 15% for solar PV and 12% for CCS and yearly reductions in investments costs per capacity are estimated at 1% for biomass and geothermal plants, compared to 0,5% for FOS-fired plants.
• Table 4 shows compliance costs available in alternative scenarios, differentiated into total
costs and grid costs or investment: Table 4: Comparison of Compliance and Grid Costs/Investment in Alternative Scenarios
Scenario Estimated compliance costs/investment Estimated grid costs/investment Comments
IEA – WEO 450 ppm
EU-27: +1600 bn USD (vs. Ref.) cumulative investment in the energy sector (incl. grid costs) till 2035
Global: 5100 bn USD (20% lower vs. Ref.) cumulative investment till 2035
External costs not included (except GHG)
Grid investment (Ref.): 25% transmission, 75% distribution
IEA – ETP Blue Map
EU-27: additional cumulative invest-ment (energy sector) compensated by cumulative fuel savings: 7100 bn USD vs. 13100 bn USD till 2050 (vs. Bas.)
Global: 12300 bn USD (incl. smart grids) cumulative grid-investment till 2050 (+50% vs. Bas.)
Grid investment (Ref.): 30% transmission, 70% distribution
Back-up costs may be considered implicitly
EU DG ENER Ref.
∼175 bn € p.a. (2030) capital and O&M costs in power generation (i.e. 51,0 €/MWh)
EU-27: grid costs of 10,8 €/MWh (2030) vs. 7,4 (2010), i.e. ∼165 bn € cumulative grid costs
Distribution grid not included
Back-up costs

100
considered implicitly
ECF Roadmap 80% RES
Lower fuel costs dominate capital cost expenses: overall -80 bn € in 2020 (-205 bn € in 2030) vs. Ref.
Cumulative additional transmission capex: 95-129 bn €, additional back-up capex: 63-99 bn € (vs. Ref.)
Cumulative additional distribution capex: 200-300 bn €
Amount by which distribution costs are incremental to the Ref. is unclear
Energy [R]evolution Advanced
Global: 292 bn USD add. investment p.a. 2007-2030 (vs. Ref.)
42 bn € additional investment p.a., fuel savings of 62 bn € p.a. (2007-2050, vs. Ref.)
Costs of 209 bn € p.a. for the assumed new European "Supergrid"
Grid costs estimated externally, cost structure of grid costs not further specified
Eurelectric Power Choices
Capital and O&M costs of 53,3 €/MWh in 2030
Grid-costs rise from 7,3 to 12,6 €/MWh (2050)
Cumulative grid investment: 1.500 bn € (+35% vs. Baseline)
No external costs besides CO2-costs
Not clear if back-up costs are considered implicitly
FEEM et al. - Planets
Global: ∼800 (2030) and 2500 (2050) bn € yearly costs (i.e. 1-2,5 % of GDP)
n/a Costs are measured as consumption losses vs. the Reference scenario
• Table 4 shows that:
o A comparison of total cost results from the different scenario studies is hardly
possible as the underlying assumptions on methods and data used are in most cases not presented sufficiently transparently to give a clear picture on the dependability of figures presented (see also above discussion about grid costs).
o Macroeconomic costs or benefits are not provided, so the net economic cost or
benefit (e.g. including the gains or losses from competitiveness factors) are not available.
o Distribution costs are hardly ever estimated although they seem to represent
the majority of necessary grid investments. This makes it doubtful that costs for infrastructure changes are realistically included in most scenarios.
Regarding electricity prices, • Electricity prices increase in most of the studies at least in the medium term (up to 2030).
Some studies with high emission reduction targets expect a decrease of electricity prices in the long term (up to 2050), mainly driven by lower consumption of FOS fuels in the power sector in combination with assumed technological improvements for RES power plants. Not all studies actually calculate electricity prices for a market environment with supply of and demand for electricity. Therefore Table 5, providing an overview on electricity prices and their main drivers, displays electricity generation costs as a proxy for electricity prices in these cases.

101
Table 5: Comparison of Properties of Electricity Prices in the Different Scenarios Study and scenario Electricity price/cost developments Main drivers
IEA – WEO Ref and 450 ppm
No data for Europe No data for Europe
IEA – ETP Ref and Blue Map
No data for Europe No data for Europe
EU DG ENER Reference
1.4% average annual rise 2000-2030, declining after 2025
Increasing fuel prices, higher capital costs of RES, NUC and CCS, auctioning of CO2-allowances
EU DG ENER Baseline
1.5% average annual rise 2000-2030, declining after 2025
Increasing fuel prices, higher capital costs of RES, NUC and CCS, auctioning of CO2-allowances
ECF Roadmap Reference
n/a Carbon prices, fossil-fuel prices, technology learning rates
ECF Roadmap Pathways
Higher levelised costs of electricity (LCOE) than in the Ref. (short term), slightly higher LCOE by 2050
Carbon prices, fossil-fuel prices, technology learning rates
Energy [R]evolution
Generation costs increase up to 2020, upward tendency until 2050
Fossil fuel prices, technology improvements of RES-technologies, costs for CO2-allowances
Energy [R]evolution Advanced
Generation costs increase up to 2030 and decrease afterwards (-34-43 % 2050 compared to the Baseline)
Fossil fuel prices, technology improvements of RES-technologies, costs for CO2-allowances
Eurelectric Baseline
Strong increase up to 2025, stabili-zation afterwards
Fossil fuel prices, restructuring of the power plant fleet
Eurelectric Power Choices
Strong increase up to 2025, slight decrease afterwards
Fossil fuel prices, restructuring of the power plant fleet, lower fossil fuel consumption and lower demand for CO2-allowances)
FEEM et al. – Planets
Electricity prices stay almost constant
Restructuring of power generation
FEEM et al. – Planets Fb 3.2
Increase until 2015, stagnation 2015 to 2035, sharp increase after 2035
Restructuring of power generation, increasing electricity demand

102
Key points:
• The economic performances of all energy technologies – FOS, NUC and RES – are reflected by their specific generation costs which are heavily influenced by assumed future fuel and carbon prices, and assumed technology learning rates.
• Technology-neutral studies, such as from IEA, DG ENER or Eurelectric, give high importance to the carbon price as a key driver to deploy the most competitive low-carbon technologies and leave it then to the market to develop the future energy mix.
• Comparison of total costs for developing a more sustainable EU energy system by 2050 is hardly possible due to lack of transparency in most scenarios on methodological and data assumptions.
• Most scenarios seem to lack a realistic consideration of the costs for necessary infrastructure changes. For example, although investments in the distribution grid represents the majority of necessary grid investments, in almost all scenarios only transmission costs (if at all) are considered.
• Electricity prices increase in most of the studies at least in the medium term (2030).

103
3.3 Assumptions on Social Issues The most important effect in the EU social structure considered in the scenarios is change in size of population. Throughout the studies, a slight increase of the EU population is expected in the medium term (immigration), with the tendency to a stabilised population in the long term. Some studies also assume a significant decrease in the size of households. However, in none of the scenarios analyzed evidence on fundamental changes in the behavioural patterns of the economic agents was found. Some studies (e.g. PRIMES-based Eurelectric, DG TREN, FEEM) apply fixed microeconomic decisions of economic agents concerning demand for energy related products and investment in energy supply equipment. These scenarios partly take into account different levels of risk-awareness of agents (higher levels for individuals than for enterprises, reflected by high discount rates for individuals), lack of information, market barriers for new technologies and rebound-effects in energy-efficiency investments. Investment decisions are modelled under full information and perfect foresight assumptions. Only very little information concerning trends and effects on the labour market was found in the studies. However, in some scenarios (ECF pathways, Energy [R]evolution) sectorial shifts on the labour market from traditional energy sectors (e.g. FOS fuels) to sectors linked to RES installations are expected. Magnitudes of these effects are very differently estimated, usually ignoring the related loss of employment and market leadership in more traditional sectors. The risk of loss of global competitiveness of energy intensive industries and related deindustrialisation in Europe is usually not considered explicitly. Issues of public acceptance regarding deployment of new power plants (large-scale RES, new NUC, low-carbon FOS), new RES-support infrastructure (pan-European grid, large storage) or new enforced consumer behaviour (smart metering) are nowhere explicitly modelled (implicitly only for NUC by assuming e.g. growth rates being much more limited than economic optimisation would suggest).
Key points:
• Only few studies explicitly model changes in the behaviour of economic agents with regard to changes in consumer behaviour or public acceptance of deployment of new power generation plants and RES-support infrastructures,
• Effects on the EU labour market and the economy as a whole (e.g. risk of deindustrialisation) as a consequence of visions of a future EU energy mix are not consistently modelled in any scenario study and are usually limited to presenting short-term positive effects of preferred technological solutions.

104
3.4 Further Technology Assumptions The following conclusions on technology assumptions in the different scenarios are in addition to the technology-related assumptions already evaluated and compared under Sections 3.1 (Policy Assumptions and Targets) and 3.2 (Economic Assumptions): • In all of the studies, a Baseline or Reference scenario is compared with scenarios which
are more ambitious in reducing GHG-emissions. These "GHG-ambitious scenarios" mostly assume significant growth rates in RES energy sources for power generation (up to shares of e.g. 50% in the ETP Blueline and 97% in the Energy [R]evolution scenario by 2050) and agree on the main RES electricity generation technologies: onshore/offshore wind, biomass and solar-PV.
• The studies are more diverse regarding the estimations for the shares of thermal and
hydro-RES: Of course, higher shares of FOS fuels are estimated in the absence of additional policies promoting RES-deployment. In the scenarios with more ambitious emission-reduction policies, gas-fired power plants often have a high relevance in serving peak-loads and load-following, due to the high shares of variable RES sources. Nuclear power plants, without t restrictions on development, are often considered as a vital option to help significantly reducing GHG-emissions from power generation in a cost-effective way (e.g. ETP Blueline).
• Innovative solutions for road transport (electric vehicles, biofuels) and other new power
and energy technologies are identified as crucial for future energy systems throughout the studies. Most of the studies focus on electric vehicles and biofuels besides power sector restructuring.
• The scope for biomass technology improvements to 2050 is not explored in most cases,
nor is the prospect of productivity increases driven by rising demand for biomass. • Most of the studies emphasize the importance of policies concerning end-user efficiency
(residential and industrial energy demand) and some studies describe measures in this field as crucial factors in the short run (2010 to 2030) to reach the emission targets set for the long run (e.g. ETP Blueline). The proposed measures comprise the thermal integrity of buildings, heat pumps, technological development in the processes of energy-intensive industries and more energy-efficient vehicles.
• Efficiency considerations on the one hand affect end-user efficiency and on the other hand
the energy transformation sector (mainly power generation). There is little information on the latter and if, the studies estimate improvements in the efficiency of traditional power generation technologies, but only small ones compared to current state of the art (e.g. in the ECF Reference efficiencies of 60 % are assumed for CCGT-plants and 50 % for coal-fired plants in 2050).
• In most scenarios except those of ECF, grid development is not modelled or optimised for
the given energy mix; it is pre-determined. Given the expected burst in electrification, the role of "smart grid" technology developments, increased balancing needs and distributed generation, the assumptions about grid development equate to assumptions regarding costs and energy mixes.

105
Key points: In addition to the technology-related "Key points" already presented at the end of Sections 3.1 (Policy Assumptions and Targets) and 3.2 (Economic Assumptions), the following key conclusions on technology assumptions in the different scenarios can be made: • Most scenarios assume significant growth rates in the use of RES energy sources for
power generation.
• NUC, without restrictions on development, is often considered as a vital option to help significantly reducing GHG-emissions from power generation in a cost-effective way.
• Competitiveness of CCS depends strongly on the carbon price.
• Problems in extended use of biomass needed to counter-balance future shares of intermittent wind and solar are nowhere analysed in detail.
• Estimated future investment costs are strongly influenced by chosen assumptions on technological developments in energy technologies..
• Innovative solutions for road transport (electric vehicles, biofuels) are identified as crucial for future energy systems throughout the studies.
• Most studies emphasize the importance of policies concerning end-user efficiency (residential and industrial energy demand) and some studies describe measures in this field as crucial factors in the short run to reach emission targets set for the long run.

106
3.5 Key Results of Scenarios From the above modelling assumptions taken by different stakeholders, scenario models result in often different, sometimes similar projections regarding specific future trends: • Future primary energy demand has to be seen in relation with the final energy demand
and the technologies used. As shown in Figure 3, whereas the baseline scenarios show generally slightly increasing primary energy demands, the alternative scenarios aiming at reducing GHG-emissions show generally declining demands:
Figure 3: Development of Economy-Wide Primary Energy Demand, in PJ
40.000
50.000
60.000
70.000
80.000
90.000
100.000
110.000
2000 2005 2010 2015 2020 2025 2030 2035 2040 2045 2050
PJ
Eurostat IEA Statistics EU-27 IEA Statistics OECD Eur
WEO Ref WEO Ref OECD Eur WEO 450ppm
ETP BL OECD Eur ETP Blue OECD Eur
EU Trends 2007 EU Trends 2009 BL EU Trends 2009 Ref
Eur PowCh E [R] Ref E [R]
E [R] Adv PLANETS WI Ref* PLANETS WI FB 3p2** • As can be seen from Figure 4, without new energy policies to reduce energy demand or
GHG-emissions, final energy demand will increase, similar to GDP-development. With new stringent policy measures, final energy demand can be reduced by 20-25% until 2050.
Figure 4: Development of Economy-Wide Final Energy Demand, in PJ
30.000
35.000
40.000
45.000
50.000
55.000
60.000
65.000
70.000
75.000
2000 2005 2010 2015 2020 2025 2030 2035 2040 2045 2050
PJ
Eurostat IEA Statistics EU-27 IEA Statistics OECD Eur
WEO Ref WEO Ref OECD Eur WEO 450ppm
EU Trends 2007 EU Trends 2009 BL EU Trends 2009 Ref
Eur PowCh E [R] Ref E [R]
E [R] Adv ECF Ref PLANETS WI Ref*
PLANETS WI FB 3p2**

107
• Compared to primary energy demand, long term developments in final energy demand are also influenced by the structure of the power generation sector (see Figure 4).
• It has to be noted, that in some cases, differences in efficiency targets may lead to major
differences in projected energy demand. For example, ambitious energy efficiency measures are implemented in the Greenpeace/EREC Energy [R]evolution scenarios and in the Eurelectric Power Choices scenario, even in the medium term up to 2020. This results in significant declines of final energy demand and also primary energy demand, if measures aim at reducing energy demand of end-consumers.
• Looking at future electricity demand, a steady increase can be seen in all scenarios.
Compared to the picture of the final energy demand, in general a substitution towards electricity can be observed. This tendency is especially relevant for scenarios with high GHG-reduction targets as these scenarios focus on decarbonisation of power generation and substitution for FOS fuels in transportation (e.g. electric vehicles) and buildings (e.g. heat pumps). Generally, this substitution process is induced through cost-optimization, either for individuals (DG ENER, Eurelectric), or for the whole region (e.g. ECF, FEEM), with the exception of the Greenpeace/EREC Energy [R]evolution scenarios. Beneath this substitution effect, electricity demand also increases due to higher income and economic activity. Figure 5 clearly shows that reductions in electricity demand due to energy-efficiency policies are outweighed by additional demand caused by the mentioned factors.
Figure 5: Development of Economy-Wide Electricity Demand, in TWh
0
500
1.000
1.500
2.000
2.500
3.000
3.500
4.000
4.500
5.000
5.500
6.000
2000 2005 2010 2015 2020 2025 2030 2035 2040 2045 2050
TWh
Eurostat IEA Statistics EU-27 IEA Statistics OECD EurWEO Ref WEO Ref OECD Eur WEO 450ppmETP BL OECD Eur ETP Blue OECD EurEU Trends 2007 EU Trends 2009 BL EU Trends 2009 RefEur PowCh E [R] Ref E [R]E [R] Adv ECF PLANETS WI Ref*PLANETS WI FB 3p2**
• The changes in electricity generation (development as well as structure), which are
shown in Figure 6 for 2050 depend on:
• GHG and RES targets set in the scenarios, • competitiveness of power plants assumed differently in different scenarios (capital
costs, fixed and variable O&M costs, fuel and CO2-prices), • pre-defined RES-targets set in "back-casting" scenarios (Greenpeace/EREC, ECF), • bounds set for deployment of NUC/CCS in some scenarios (Greenpeace/EREC,
ECF).

108
Figure 6: Electricity Generation in 2050, in TWh
8491273
662 864490
9801470 1355
1783
2607
2225
66
2146
376 92
2304965
2665
174
610
490
980
1470
528
0
499
2012
2393
1921
28924110
1584
3969
2842
1862 1928
1277
2118
0
1.000
2.000
3.000
4.000
5.000
6.000
TWh
2050renewables fossil - CCS fossil nuclear
In the medium term, up to 2030 and especially up to 2020, differences between the alternative scenarios are relatively small. Of course, even in the medium term, differences between scenarios with emission reduction targets and reference scenarios are considerable: Ambitious scenarios generally show higher shares for RES and NUC, with diverse views on CCS, except when NUC and CCS are excluded from the beginning. In the long term, even differences between alternative scenarios are considerable. In the Eurelectric Power Choices and the ETP Blueline scenarios, nuclear power plants are estimated to obtain a high relevance in reaching the emission reduction targets. Nuclear power plants are assumed to be the most economic option to serve baseload in these scenarios, whereas FOS-fuelled plants are mainly used for load following (gas-fired plants), with the exemption of coal-fired plants with CCS. Differences between the two scenarios could be due to slightly different geographical coverage (ETP focusing on OECD-Europe, including Norway and Switzerland, both with high RES-shares) and differences in the estimated competitiveness of CCS / FOS fuels vis-à-vis NUC and RES power generation. Deployment of CCS is of importance for all alternative scenarios (except Energy [R]evolution where it is excluded), but significantly higher in the Power Choices scenario and the ECF-pathways. Deployment for this form of emission abatement starts typically in the period from 2020 to 2030, but is assumed to gain importance only after 2030 (ETP, ECF, Eurelectric, PLANETS). The outcomes in the basic and advanced Greenpeace/EREC Energy [R]evolution scenarios are significantly different, due to exclusion of NUC and CCS in these scenarios. In the low carbon scenarios examined, the quantity of electricity from RES produced by 2050 ranges from 1862 TWh to 4110 TWh. Fossil fuel generated electricity deploying CCS ranges from 490 TWh to 1470. Nuclear powered electricity production ranges from 490 TWh to 2607 TWh.

109
Key points:
• Without new energy policies to reduce energy demand or GHG-emissions, final energy demand will increase, similar to GDP-development.
• The significant differences across scenarios on assumptions on feasibility of efficiency improvements lead to major differences in projected energy demand.
• Compared to primary energy demand, long term developments in final energy demand are also influenced by the structure of the power generation sector. Higher decreases of final energy demand in relation to primary energy demand can be achieved by a technology-neutral approach in developing future power generation mixes (i.e. resulting in higher shares for CCS and NUC).
• Electricity demand increases across all scenarios due to higher income and economic activity. Reductions due to energy-efficiency policies are outweighed by additional demand.
• If a technology-neutral approach is chosen, high prices of CO2-certificates are the main driver for deployment of both RES and NUC, but also for development of CCS. Therefore, GHG-ambitious technology-neutral scenarios generally show higher shares for RES and NUC, except when NUC and CCS are excluded from the beginning.

110
3.6 Models Used and Interdependencies Between Studies In all scenario studies analysed bottom-up models are used, some of them in combination with top-down models, as summarised (for the main models) in Table 6: Table 6: Characteristics of Models Used
Study Models used Type of model Characteristic
IEA - WEO World Energy Model Bottom-up-model (with additive top-down model)
Simulation
IEA - ETP ETP MARKAL/TIMES
Bottom-up-model Optimization (lead costs)
EU DG TREN PRIMES Mixed representation: Bottom-up and top-down model
Partial market equilibrium
ECF Roadmap a.o. McKinsey Power Generation Model
Bottom-Up-Model (with additive top-down model)
Simulation
Greenpeace/EREC Energy [R]evolution
MESAP/PlaNet Bottom-up model Simulation
Eurelectric Power Choices
PRIMES Mixed representation: Bottom-up and top-down model
Partial market equilibrium
Not least because of the use of the same models by different scenario studies, a variety of studies uses the input and output of other studies. Two main studies can be indentified: IEA World Energy Outlook and DG ENER / PRIMES. • The IEA Energy Technology Perspectives, the ECF Roadmap 2050, Eurelectric's Power
Choices and Greenpeace/EREC's Energy [R]evolution use the WEO baseline. • Input and output of the DG ENER PRIMES study are used for the Eurelectric study.

111
4. SUMMARY OF COMPARISON From the comparison of stakeholder scenarios presented in this report, the following conclusions can be drawn: • Overall Goal:
o Scenarios are marked by GHG and/or RES targets and development of future energy mixes is primarily based on optimising this parameter.
o Security of supply indicators are not created (or optimised), except for the grid-
oriented modelling of ECF. o Competitiveness indicators are limited, partial and not optimised.
• Basic Modelling Approaches used by Stakeholders:
o Models used for scenario studies can broadly be grouped into market-based optimisation models ("fore-casts") and models which use exogenously defined market shares ("back-casts").
o If market-based optimisation is applied (i.e. a technology-neutral approach
chosen), deployment of the different energy technologies (FOS, NUC, RES) mainly depends on their relative total costs.
o Grid modelling (and its major implications) are modelled by ECF; in most
other scenario analyses, they are pre-determined. • Energy/Electricity Demand:
o Without new policy measures demand will increase due to GDP growth. Final energy consumption in 2030 in low carbon scenarios range from 41000 PJ to 61000 PJ; in 2050 from 34000 PJ to 49000 PJ.
o Electrification is assumed in (almost) all scenarios. Electricity is estimated to
gain higher shares in final energy demand, especially in scenarios confronted with ambitious GHG-targets (mainly as a substitute for fossil fuels).
• Development of More Sustainable Future Energy Systems:
o Most scenarios, such as those generated by the PRIMES model, optimise to determine the final energy mix ("technology neutrality"), based on cost input and technology learning assumptions. Greenpeace/EREC and the ECF scenarios backcast from several targeted generation shares, the former excluding NUC and CCS...
o Estimated future investment costs are also strongly influenced by chosen
assumptions on technological developments in energy technologies whose dependability is often difficult or impossible to verify.
o Most scenarios seem to lack a clear consideration of the costs for necessary
infrastructure changes to enable further deployment of variable RES. For example, although investments in the distribution grid seem to represent the majority of necessary grid investments and although all studies stress the

112
importance of smart grids, in almost all scenarios merely transmission (if at all) is considered.
o Few studies explicitly model changes in the behaviour of economic agents with
regard to changes in consumer behaviour.
o Effects on the EU labour market and the economy as a whole (e.g. risk of deindustrialisation) are not consistently modelled in any scenario study.
o Electricity prices increase in most studies at least in the medium term (2030).
Some studies with high emission reduction targets expect a decrease of electricity prices in the long term (up to 2050), due to lower fossil-fuel consumption.
• Renewables:
o Absolute and relative increases of RES in the power sector across all scenarios.
o Investment costs for RES decrease across all scenarios, especially in a long term perspective.
• Nuclear Power:
o When optimised purely on costs, nuclear power tends to expand and gain increasing shares.
• Fossil fuel plants:
o CCS plays an increasing role in scenarios with a focus on a strong future role of the carbon price.

113
References [1] European Commission Reference Scenario to 2050 (2011), European Commission,
Brussels, Belgium. [2] ECF (2010): Roadmap 2050 – A practical guide to a prosperous, low-carbon Europe,
European Climate Foundation, The Hague, The Netherlands. [3] Greenpeace/EREC (2010): Energy [R]evolution – Towards a fully renewable energy
supply in the EU 27, Greenpeace International, Amsterdam, The Netherlands, and European Renewable Energy Council (EREC), Brussels, Belgium.
[4] IEA (2010): Energy Technology Perspectives (ETP) 2010 – Scenarios & Strategies to
2050, International Energy Agency, Paris, France. [5] IEA (2009): World Energy Outlook 2009, International Energy Agency, Paris, France. [6] Eurelectric (2009): Power Choices – Pathways to Carbon-Neutral Electricity in
Europe by 2050, Union of the Electricity Industry (Eurelectric), Brussels, Belgium. [7] FEEM et al. (2010): PLANETS – Probabilistic Long-term Assessment of New Energy
Technology Scenarios, Fondazione Eni Enrico Mattei (FEEM) et al., Milan, Italy, RTD Project Sponsored by the European Commission under the Seventh EU Research Framework Programme (Project No. 211859).
[8] Analysis and Comparison of Relevant Mid- and Long-term Energy Scenarios for EU
and their Key Underlying Assumptions, Study performed by PROGNOS for EC – DG ENER, Basel, 2011.
[9] Key Factors Affecting the Deployment of Electricity Generation Technologies in
Energy Technology Scenarios, Paul Scherrer Institut, Villigen, Switzerland, 2009.