Global Energy Scenarios 2050 25. Juni 2013. Paul Scherrer Institute, Switzerland Global Energy...
20
25. Juni 2013 PSI, 25. Juni 2013 PSI, Paul Scherrer Institute, Switzerland Global Energy Scenarios 2050 of the World Energy Council IEW 2013, Paris Martin Densing, Hal Turton, Evangelos Panos, Kathrin Volkart
Transcript of Global Energy Scenarios 2050 25. Juni 2013. Paul Scherrer Institute, Switzerland Global Energy...
25. Juni 2013PSI, 25. Juni 2013PSI,
Paul Scherrer Institute, Switzerland
Global Energy Scenarios 2050of the World Energy Council
IEW 2013, Paris
Martin Densing, Hal Turton, Evangelos Panos, Kathrin Volkart

Seite 2
Contents
• Why another global energy-system scenario-study?
• Regional disaggregation of the PSI/WEC model
• Model structure, scenario assumptions, and resultsfocusing on transport sector sub-model
[PSI/WEC Global Mobility 2050]
Global results of whole energy system are launched atWorld Energy Congress in Daegu, South Korea, Oct. 2013

Seite 3
Global energy scenarios: TPES and CO2 emissions
0204060
tCO
2/y
NA
Total Primary Energy Supply, year 2030
0%
20%
40%
60%
80%
100%6D
S
4DS
2DS
New
Pol
icy
Cur
rent
Pol
icy
450
Sup
ply
Effi
cien
cy Mix
Ref
eren
ce
Mou
ntai
ns
Oce
ans
Ref
eren
ce
Rev
olut
ion
New
norm
al
Out
look
ETP WEO GEA EIA Shell Green-peace
BNEFExxon
OthersRenewablesBiomassNuclearGasOilCoalFossil
Seite 4
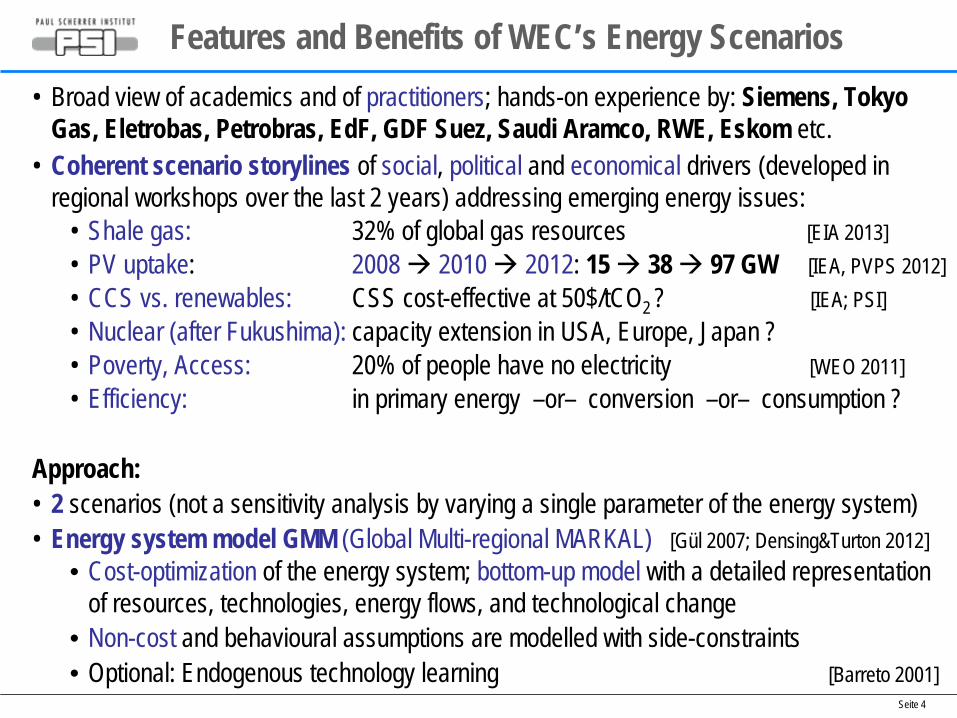
Features and Benefits of WEC’s Energy Scenarios• Broad view of academics and of practitioners; hands-on experience by: Siemens, Tokyo
Gas, Eletrobas, Petrobras, EdF, GDF Suez, Saudi Aramco, RWE, Eskom etc. • Coherent scenario storylines of social, political and economical drivers (developed in
regional workshops over the last 2 years) addressing emerging energy issues:• Shale gas: 32% of global gas resources [EIA 2013]• PV uptake: 2008 2010 2012: 15 38 97 GW [IEA, PVPS 2012]• CCS vs. renewables: CSS cost-effective at 50$/tCO2 ? [IEA; PSI]• Nuclear (after Fukushima): capacity extension in USA, Europe, Japan ?• Poverty, Access: 20% of people have no electricity [WEO 2011]• Efficiency: in primary energy –or– conversion –or– consumption ?
Approach:• 2 scenarios (not a sensitivity analysis by varying a single parameter of the energy system)• Energy system model GMM (Global Multi-regional MARKAL) [Gül 2007; Densing&Turton 2012]
• Cost-optimization of the energy system; bottom-up model with a detailed representation of resources, technologies, energy flows, and technological change
• Non-cost and behavioural assumptions are modelled with side-constraints• Optional: Endogenous technology learning [Barreto 2001]
Seite 5
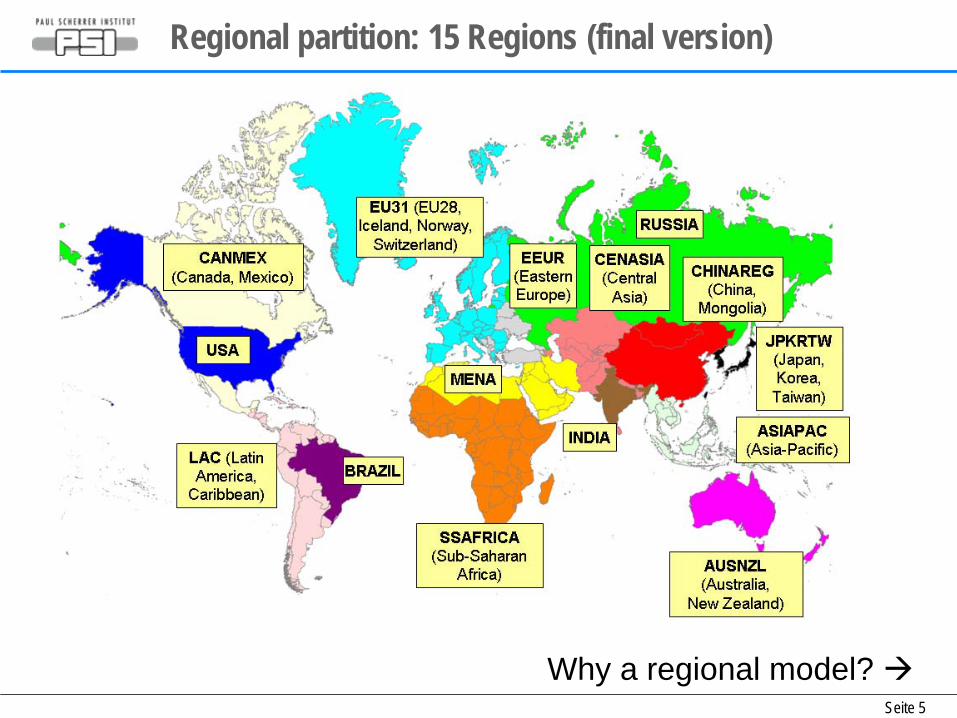
Regional partition: 15 Regions (final version)
Why a regional model?

Seite 6
Regional partition: Diversity of TPES and of trade
Domestic production of primary energy(year 2010)
Net import(% of total primary energy supply)
0%
10%
20%
30%
40%
50%
60%
70%
80%
90%
100%
ASIAPAC
AUSNZL
BRAZIL
CANMEX
CENASIA
CHINAREG
EEUREU31
INDIA
JPKRTW LA
CMENA
RUSSIA
SSAFRICA
USAWorld
GeothermalSolarWindHydroBiomassNuclearGasOilCoal
-150%
-100%
-50%
0%
50%
100%
ASIAPAC
AUSNZLBRAZIL
CANMEXCENASIA
CHINAREGEEUREU31IN
DIAJP
KRTW
LAC
MENARUSSIA
SSAFRICA
USA
BRAZIL: Bio -0.4%, Oil: 0.1%; CHINAREG: Gas 0.5%; INDIA: Gas 1.5%; LAC: Bio -0.4%; EU31: Bio: 0.3%
BiomassGasOilCoal
Source: IEA (2012), Energy Balances. Nuclear effi. 33%; geothermal effi. = 10%; solar, hydro and wind: actual production.
Seite 7
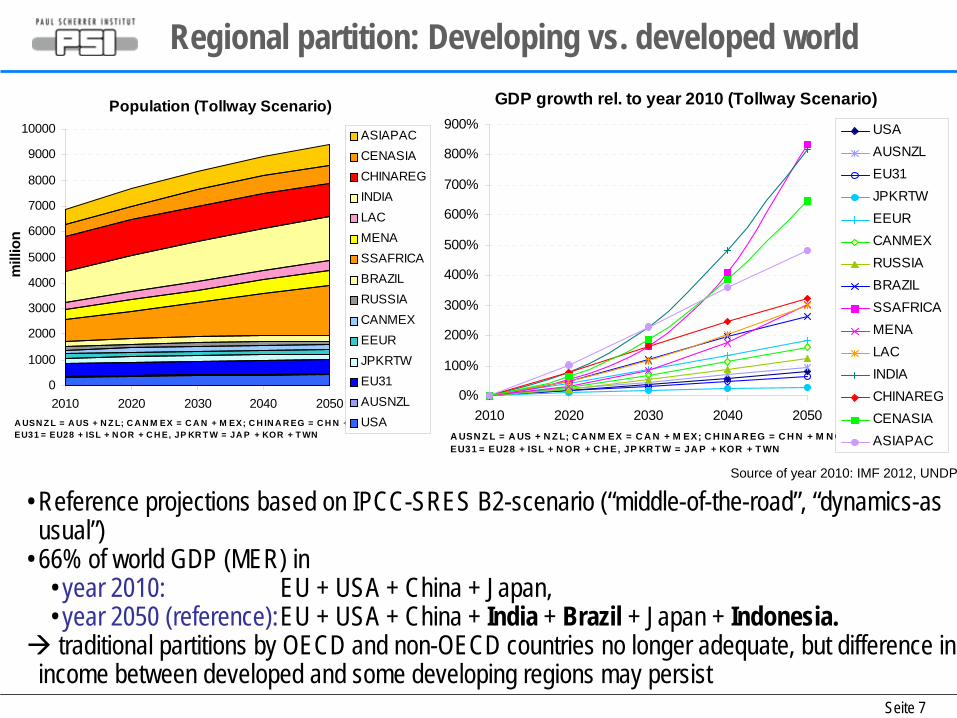
Regional partition: Developing vs. developed world
• Reference projections based on IPCC-SRES B2-scenario (“middle-of-the-road”, “dynamics-as usual”)
• 66% of world GDP (MER) in • year 2010: EU + USA + China + Japan, • year 2050 (reference):EU + USA + China + India + Brazil + Japan + Indonesia.
traditional partitions by OECD and non-OECD countries no longer adequate, but difference in income between developed and some developing regions may persist
Population (Tollway Scenario)
0
1000
2000
3000
4000
5000
6000
7000
8000
9000
10000
2010 2020 2030 2040 2050A USN Z L = A US + N Z L; C A N M EX = C A N + M EX; C H IN A R EG = C H N + M N G; EU31 = EU28 + ISL + N OR + C H E, JP KR T W = JA P + KOR + T WN
mill
ion
ASIAPACCENASIACHINAREGINDIALACMENASSAFRICABRAZILRUSSIACANMEXEEURJPKRTWEU31AUSNZLUSA
GDP growth rel. to year 2010 (Tollway Scenario)
0%
100%
200%
300%
400%
500%
600%
700%
800%
900%
2010 2020 2030 2040 2050A USN Z L = A US + N Z L; C A N M EX = C A N + M EX; C H IN A R EG = C H N + M N G; EU31 = EU28 + ISL + N OR + C H E, JP KR T W = JA P + KOR + T WN
USAAUSNZLEU31JPKRTWEEURCANMEXRUSSIABRAZILSSAFRICAMENALACINDIACHINAREGCENASIAASIAPAC
Source of year 2010: IMF 2012, UNDP

Seite 8
Reference Energy System (Flow of Energy Carriers)
GMM has approx. 400 technologies per region T&D: Transport and Distribution
Conversion ProcessesResources End-Use
Oil
Natural Gas
Biomass
OtherRenewables
Uranium
Coal
Refinery
Heat Plants
Methanol fromNatural Gas
BiofuelsProduction
Power Plants
HydrogenProduction
T&D
T&D
T&D
CNG
Residential/Commercial
Thermal
Residential/Commercial
Specific
Industry Specific
Industry Thermal
PersonalTransport
Aviation
Other Transport
Non-commercialBiomass
Oil Products
Coal
T&D
T&D
T&D
Transport Sector

Seite 9
Personal Transport Sector• Drivetrains: Internal Combustion Engine Vehicle (ICEV), Advanced ICEV, Hybrid Electric (HEV),
Plug-in (PHEV), Battery Electric (BEV), Hydrogen Fuel Cell with hybridisation (HFCV)• Fuels: conventional liquid (gasoline, diesel); alternatives fuels: natural gas, electricity, hydrogen,
different biofuels; fuel blending (e.g. maximal 10% (Bio-)Methanol into gasoline)
Gasoline ICEV
Gas. Adv. ICEV
Gasoline HEV
Diesel ICEV
Diesel Advanced ICEV
Diesel HEV
CNG ICEV
CNG HEV
BEV
PHEV
Hydrogen Hybrid
HFCVHydrogen Retail
Electricity (ELC)
Compression
Gasoline Retail Station
Diesel Retail Station
blend
blend
blend
blend
blend
blend
blend
blend
ELC
Blending Constraints
Short-Range Car Version
T&D
T&D
T&D
T&DEthanol (Bio)
Bio-Methanol
Biodiesel (FT)
Bio-Syngas
T&DDiesel
T&DGasoline
T&DMethanol
T&DNatural Gas
WEC/PSI (2011): Global Transport Scenarios 2050
~100 km actual drive
range

Seite 10
Other Surface Transport and Aviation Sector
• Trucks, buses, other commercial road vehicles, 2-wheel, rail, ships: aggregated by fuel option• Aviation: current + future technology
technologies categorized by• fuelling option, and• engine type
WEC/PSI (2011): Global Transport Scenarios 2050
Seite 11
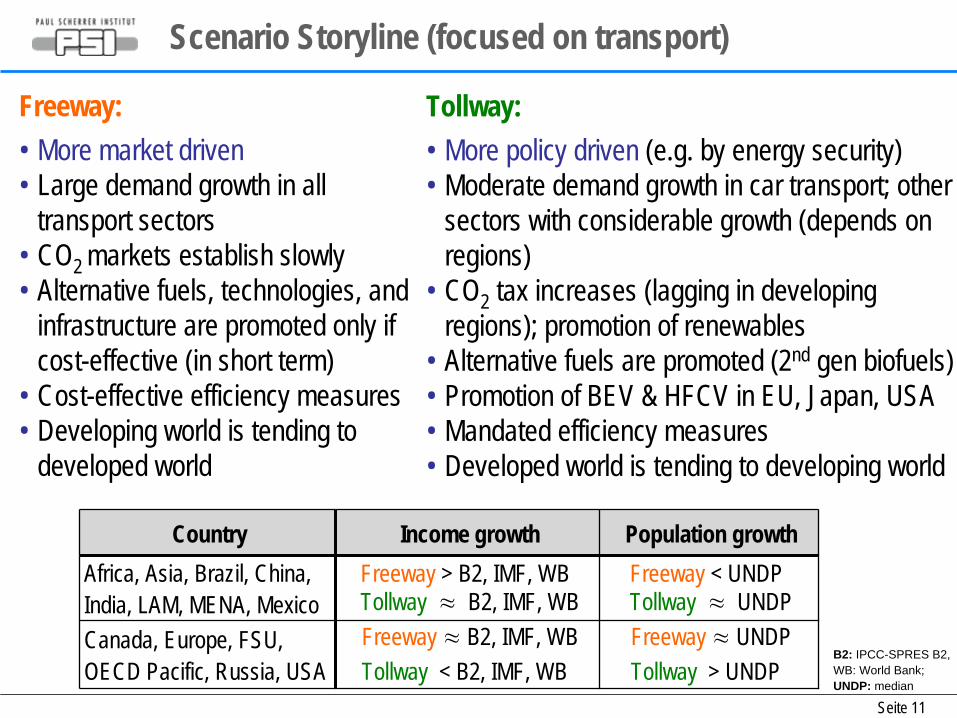
Scenario Storyline (focused on transport)
Freeway:• More market driven• Large demand growth in all
transport sectors• CO2 markets establish slowly• Alternative fuels, technologies, and
infrastructure are promoted only if cost-effective (in short term)
• Cost-effective efficiency measures• Developing world is tending to
developed world
Tollway:• More policy driven (e.g. by energy security)• Moderate demand growth in car transport; other
sectors with considerable growth (depends on regions)
• CO2 tax increases (lagging in developing regions); promotion of renewables
• Alternative fuels are promoted (2nd gen biofuels)• Promotion of BEV & HFCV in EU, Japan, USA• Mandated efficiency measures• Developed world is tending to developing world
Country Income growth Population growthAfrica, Asia, Brazil, China, India, LAM, MENA, Mexico
Freeway > B2, IMF, WBTollway ≈
B2, IMF, WBFreeway < UNDPTollway ≈
UNDPCanada, Europe, FSU, OECD Pacific, Russia, USA
Freeway ≈ B2, IMF, WBTollway < B2, IMF, WB
Freeway ≈ UNDPTollway > UNDP
B2: IPCC-SPRES B2, WB: World Bank; UNDP: median
Seite 12
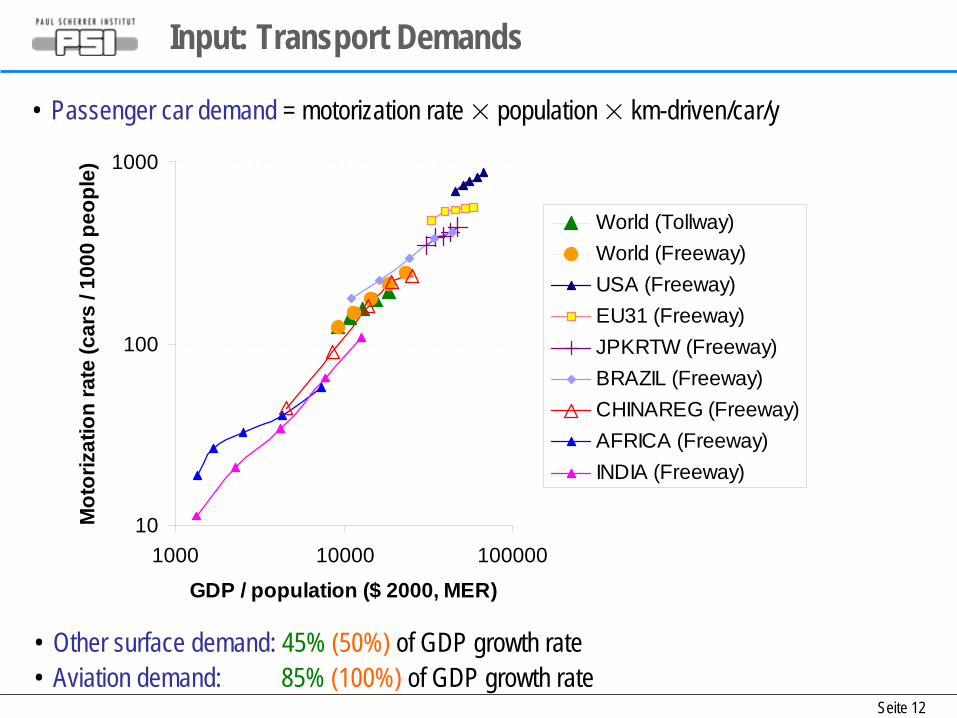
Input: Transport Demands
• Passenger car demand = motorization rate × population × km-driven/car/y
• Other surface demand: 45% (50%) of GDP growth rate• Aviation demand: 85% (100%) of GDP growth rate
10
100
1000
1000 10000 100000
GDP / population ($ 2000, MER)
Mot
oriz
atio
n ra
te (c
ars
/ 100
0 pe
ople
)
World (Tollway)World (Freeway)USA (Freeway)EU31 (Freeway)JPKRTW (Freeway)BRAZIL (Freeway)CHINAREG (Freeway)AFRICA (Freeway)INDIA (Freeway)
Seite 13
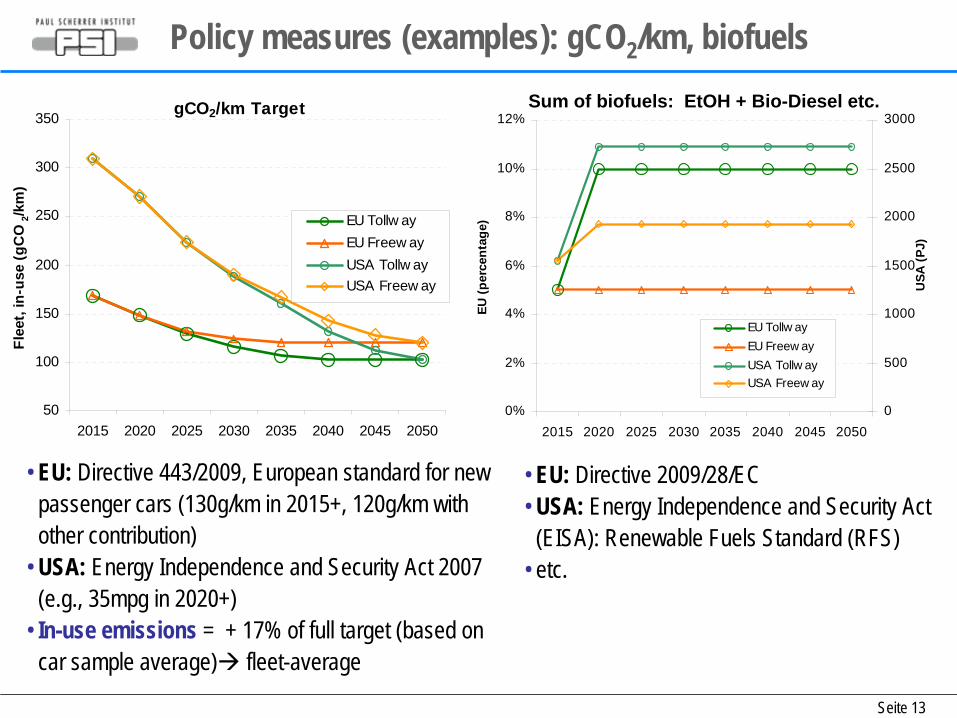
Policy measures (examples): gCO2 /km, biofuels
• EU: Directive 443/2009, European standard for new passenger cars (130g/km in 2015+, 120g/km with other contribution)
• USA: Energy Independence and Security Act 2007 (e.g., 35mpg in 2020+)
• In-use emissions = + 17% of full target (based on car sample average) fleet-average
• EU: Directive 2009/28/EC• USA: Energy Independence and Security Act
(EISA): Renewable Fuels Standard (RFS)• etc.
gCO2/km Target
50
100
150
200
250
300
350
2015 2020 2025 2030 2035 2040 2045 2050
Flee
t, in
-use
(gC
O2/k
m)
EU Tollw ayEU Freew ayUSA Tollw ayUSA Freew ay
Biofuel Target (Tollway vs. Freeway Scenario)
0%
2%
4%
6%
8%
10%
12%
2015 2020 2025 2030 2035 2040 2045 2050
EU (p
erce
ntag
e)
0
500
1000
1500
2000
2500
3000
USA
(PJ)
EU Tollw ayEU Freew ayUSA Tollw ayUSA Freew ay
Sum of biofuels: EtOH + Bio-Diesel etc.
Seite 14
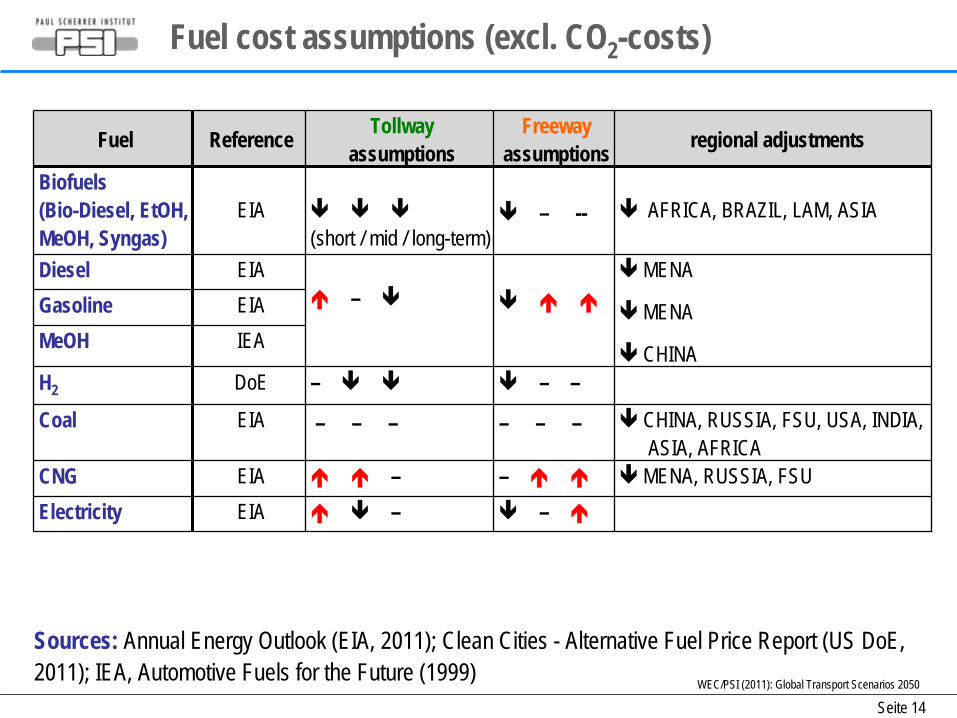
Fuel cost assumptions (excl. CO2 -costs)
WEC/PSI (2011): Global Transport Scenarios 2050
Sources: Annual Energy Outlook (EIA, 2011); Clean Cities - Alternative Fuel Price Report (US DoE, 2011); IEA, Automotive Fuels for the Future (1999)
Fuel Reference Tollwayassumptions
Freewayassumptions regional adjustments
Biofuels(Bio-Diesel, EtOH, MeOH, Syngas)
EIA (short / mid / long-term)
– --
AFRICA, BRAZIL, LAM, ASIA
Diesel EIA
–
MENA
MENA
CHINA
Gasoline EIAMeOH IEA
H2 DoE –
– –Coal EIA – – – – – – CHINA, RUSSIA, FSU, USA, INDIA,
ASIA, AFRICACNG EIA – – MENA, RUSSIA, FSUElectricity EIA
–
–

Seite 15
0
5000
10000
15000
20000
25000
30000
2005
2010
2015
2020
2025
2030
2035
2040
2045
2050
billi
on v
-km
/y
Scenarios: Assumptions and Personal Car ResultsFreeway:• Market driven (market power)• Large demand growth in all transport
sectors• CO2 price is very slowly developing• Alternative fuels, technologies, and
infrastructure are promoted only if they are short-term cost-effective
0
5000
10000
15000
20000
25000
30000
2005
2010
2015
2020
2025
2030
2035
2040
2045
2050
billi
on v
-km
/y
Tollway:• More regulative power of citizen/voter• Moderate demand growth in car transport; other sectors
with considerable growth (depends on regions)• CO2 price increases (lagging in developing regions)• Alternative fuels are promoted: 2nd generation biofuels
(larger targets), lower-carbon electricity• Promotion of BEV and HFCV in EU, Japan, and USA
Freeway Personal Cars: Tollway Personal Cars:
Liquid Fuel ICEVLiquid Fuel HybridLiquid Fuel Plug-inGas Fuel ICEVGas Fuel HybridHydrogen HybridHydrogen Fuel CellElectric Vehicle
WEC/PSI: Global Transport Scenarios 2050
• large increase in hybridisation (electric motor) in different degrees: HEV PHEV BEV
• moderate share of CNG and hydrogen FC vehicles
Seite 16
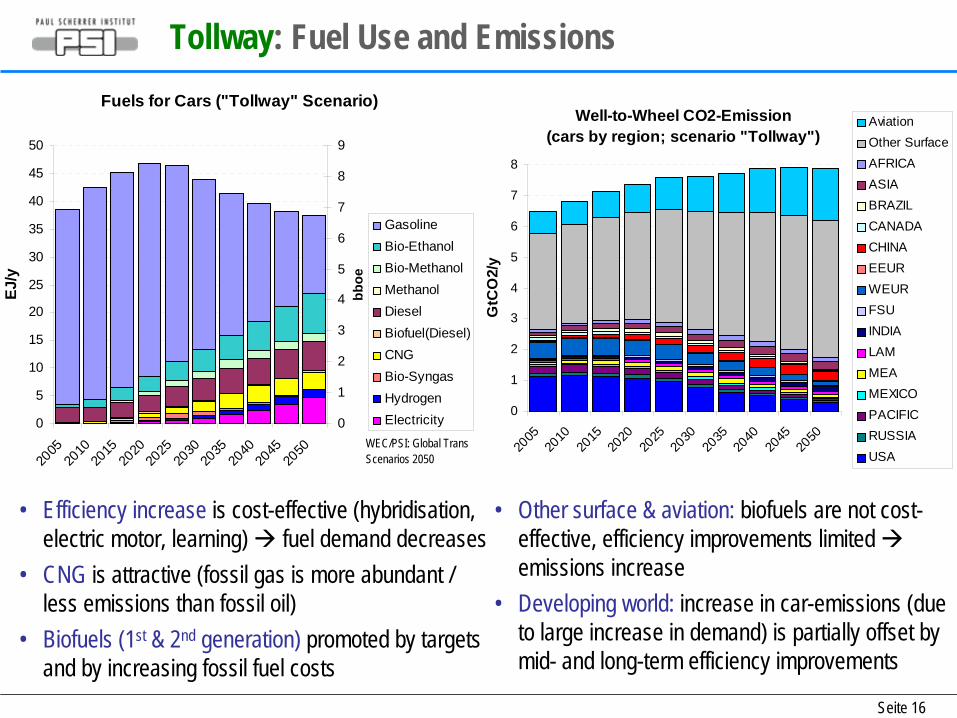
Tollway: Fuel Use and Emissions
• Other surface & aviation: biofuels are not cost- effective, efficiency improvements limited
emissions increase
• Developing world: increase in car-emissions (due to large increase in demand) is partially offset by mid- and long-term efficiency improvements
Fuels for Cars ("Tollway" Scenario)
0
5
10
15
20
25
30
35
40
45
50
2005
2010
2015
2020
2025
2030
2035
2040
2045
2050
EJ/y
0
1
2
3
4
5
6
7
8
9
bboe
• Efficiency increase is cost-effective (hybridisation, electric motor, learning) fuel demand decreases
• CNG is attractive (fossil gas is more abundant / less emissions than fossil oil)
• Biofuels (1st & 2nd generation) promoted by targets and by increasing fossil fuel costs
WEC/PSI: Global Transport Scenarios 2050
Well-to-Wheel CO2-Emission(cars by region; scenario "Tollway")
0
1
2
3
4
5
6
7
8
2005
2010
2015
2020
2025
2030
2035
2040
2045
2050
GtC
O2/
y
AviationOther SurfaceAFRICAASIABRAZILCANADACHINAEEURWEURFSUINDIALAMMEAMEXICOPACIFICRUSSIAUSA
GasolineBio-EthanolBio-MethanolMethanolDieselBiofuel(Diesel)CNGBio-SyngasHydrogenElectricity
Seite 17
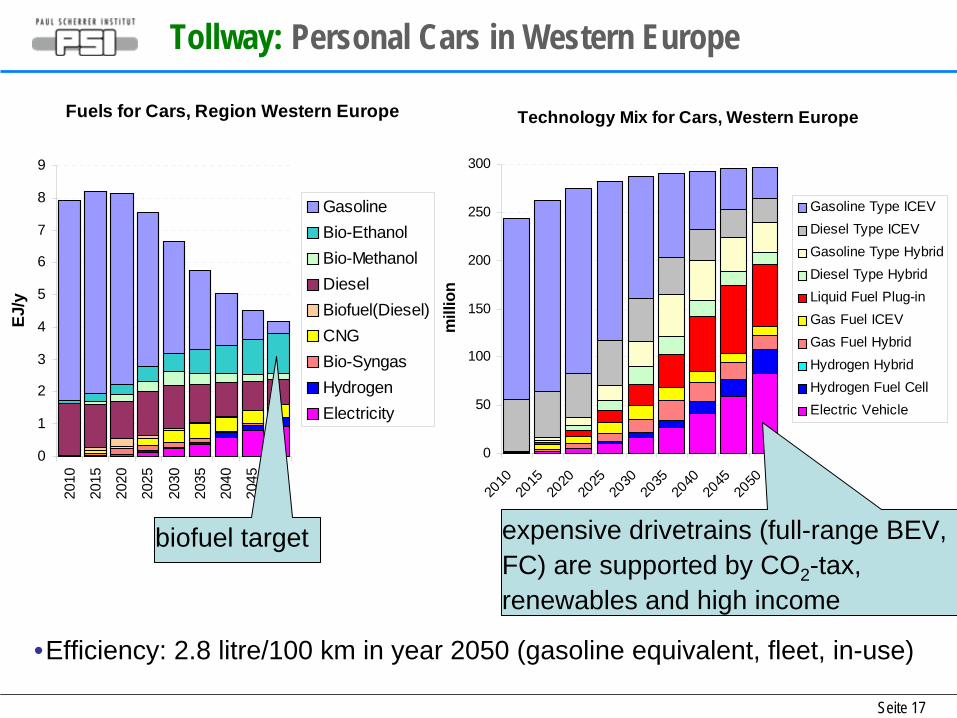
Tollway: Personal Cars in Western Europe
•Efficiency: 2.8 litre/100 km in year 2050 (gasoline equivalent, fleet, in-use)
Technology Mix for Cars, Western Europe
0
50
100
150
200
250
300
2010
2015
2020
2025
2030
2035
2040
2045
2050
mill
ion
Gasoline Type ICEVDiesel Type ICEVGasoline Type HybridDiesel Type HybridLiquid Fuel Plug-inGas Fuel ICEVGas Fuel HybridHydrogen HybridHydrogen Fuel CellElectric Vehicle
Fuels for Cars, Region Western Europe
0
1
2
3
4
5
6
7
8
9
2010
2015
2020
2025
2030
2035
2040
2045
2050
EJ/y
GasolineBio-EthanolBio-MethanolDieselBiofuel(Diesel)CNGBio-SyngasHydrogenElectricity
expensive drivetrains (full-range BEV, FC) are supported by CO2 -tax, renewables and high income
biofuel target

Seite 18
Tollway: Personal Cars in Latin America (excl. Brazil)
• Efficiency: 3.6 litre/100 km in year 2050 (gasoline equivalent, fleet, in-use)
Technology Mix for Cars, Region LAM
0
10
20
30
40
50
60
70
80
2010
2015
2020
2025
2030
2035
2040
2045
2050
mill
ion
Gasoline Type ICEVDiesel Type ICEVGasoline Type HybridDiesel Type HybridLiquid Fuel Plug-inGas Fuel ICEVGas Fuel HybridHydrogen HybridHydrogen Fuel CellElectric Vehicle
Fuels for Cars, Region LAM
0
0.2
0.4
0.6
0.8
1
1.2
1.4
1.6
1.8
2
2010
2015
2020
2025
2030
2035
2040
2045
2050
EJ/y
GasolineBio-EthanolBio-MethanolDieselBiofuel(Diesel)CNGBio-SyngasHydrogenElectricity
• Energy Security Gas

Seite 19
Conclusion
• Demand growth especially in aviation and personal cars in developing regions
• Gas in transport is a cost-effective option: low CO2 -emissions, gas resources are still abundant
• Alternative drivetrains enter gradually: HEV PHEV BEV• Commercial surface transport:
• Existing engines are relatively efficient (e.g. only few start-stop cycles disfavour electric motors)
• Aviation: Biofuels, Synfuels?
Outlook:• Launch of study for full energy system in Oct. 2013 in Daegu• Model Extensions: LCA integration,…
25. Juni 2013PSI,
Thank you!