GB Potatoes 2015-2016.pdf
32
GB Potatoes Market Intelligence 2015-2016
-
Upload
hoangxuyen -
Category
Documents
-
view
218 -
download
2
Transcript of GB Potatoes 2015-2016.pdf
GB Potatoes
Market Intelligence
2015-2016

Foreword
We enter the 2015/16 season cautiously optimistic. After two
years of strong production, a delay in planting and crop
development this year has enabled remaining old crop
supplies in store to be used, more than we’d expected.
Quality of the lifted crop is said to be generally good and
early yield reports suggest that they could be better than
expected. Yields were expected to be lower, due to
unfavourable conditions that hindered their development. A
smaller production is anticipated on mainland Europe which,
if realised, could create less import pressure for GB and
there may be export opportunities. Consumer retail demand
for fresh potatoes is steady, and for processed potato
products demand remains strong.
Regardless of market conditions, we can ensure that the
market information we provide equips our levy payers and
stakeholders with the information needed to make the best
possible business decisions. Compiled by the AHDB Potato
Market Intelligence team, the aim of this annual publication is
to provide trusted, key information about the GB potato
market in order to inform decision-making and provide
answers for common questions about the industry. This
publication provides final figures for the 2014/15 crop year
and provisional area figures for the 2015/16 season (as of
August 2015).
The AHDB Market Intelligence (MI) division’s role is to
communicate accurate, timely, independent and transparent
information on potato markets and prices. Senior Analyst
Sara Maslowski and Analyst Arthur Marshall provide potato
expertise in the Market Specialists team, an integral part of
the MI division. They can draw on the support of consumer
specialist Rebecca Hughes and database teams to give their
work context and assured quality. Their role is to provide
information to help growers and purchasers understand the
business environment for potatoes, giving them the tools to
make fully informed business decisions. The information they
provide also aims to support a sustained demand for
potatoes grown by AHDB levy payers. We would like to
express our thanks to the many individuals and organisations
that have provided us with information and support for this
publication.
Rob
Strategy Director, AHDB Potatoes
3
Contents
4
Sou
rce:
Ga
ry N
ayl
or
Pho
tog
raph
y
Season overview
The GB
Figure 1: Yield per ha and total production 1960-2014
Figure 2: Planted area 1960-2015
Trends in planted area
Figure 3: Planted area and number of owers 1960-2014
Figure 4: Planted area per grower 1960-2014
Table 1: Planted area by market sector in hectares
Figure 5: Proportion of planted area by intended market
sector 2015
Consolidation of the industry
Figure 6: Number of potato growers by size band in
hectares
Figure 7: Total number of registered potato growers
(>3ha)
Figure 8: Percentage of area grown by size band in hectar
How price affects planting decisions
Figure 9: Price and area relationship
Figure 10: Main production areas
Table 2: Planted area by region (hectares)
Figure 11: Proportion of planted area by region 2015
Figure 12: Planted area of most popular varieties
(ware potatoes)
Most popular varieties by planted area
Table 3: Top ten varieties by planted area in 2015
Figure 13: Planted area by top ten varieties
Farmgate potato prices
Figure 14: GB Weekly Average Prices trends
Figure 15: GB Weekly Average and Free-Buy Price Trends
Figure 16: Potato supply flowchart
GB potato imports and exports
Figure 17: UK exports and imports of potatoes by sector
Figure 18: UK exports and imports of potato products by
segment
GB potato purchases
Figure 19: UK household purchases of potatoes
Figure 20: UK household purchases of potato products
GB potatoes retail market
Figure 21: Size and share of the carbohydrates market
by value of sales
Figure 22: Volume versus value relationship
GB potatoes retail sales
Figure 23: Value sales of carbohydrates market (£000)
Figure 24: Volume sales of carbohydrates market (tonnes)
Figure 25: Fresh potatoes and frozen products sales trends
GB potatoes consumers
Figure 26: Consumer profile - fresh potatoes and frozen
potato products
Figure 27: In-home meal occasions - Carbohydrates
Figure 28: Total out-of-home servings of potatoes
6
7
7
8
8
8
8
8
9
9
9
9
10
10
11
11
11
12
13
13
13
14
14
14
15
16
16
16
17
17
17
18
18
18
19
19
19
19
20
20
20
20
5
Sou
rce:
Ga
ry N
ayl
or
Pho
tog
rap
hy
The North-Western European Potato Growers
The Belgian potato market
The French potato market
The German potato market
The Netherlands potato market
Figure 29: North-western European potato production
Figure 30: North-western European potato area
Figure 31: North-western European imports to the UK
Figure 32: North-western European exports from the UK
Figure 33: EU-28 imports to the UK
Figure 34: EU-28 exports from the UK
Table 4: World top 20 potato consumers
Table 5: World top 20 potato producers
Table 6: World production by commodity
Figure 35: Non-EU imports to the UK
Figure 36: Non-EU exports from the UK
Appendix 1: AHDB Potatoes Market Information
Committee
Appendix 2: Data sources
Figure 37: Grower Panel crop
Appendix 3: GB areas, production and prices 1960-2015
Appendix 4: Glossary
Contacts
21
21
21
22
22
22
22
23
23
23
23
24
25
25
25
25
26
27
27
28
29
30
Season overview
Early indications for the 2015/16 season stand out in contrast
to 2014/15. While 2014/15 saw a record low area, production
reached 5.74Mt, with strong yields contributing to a 3% year-on
-year increase. For 2015/16 the picture is different. The latest
AHDB estimate of the GB planted area for 2015/16 (at the time
of writing) is the lowest recorded at 111,600ha, 7.8% less than
last year. An official production estimate is not yet available,
and anecdotal field reports vary from extraordinarily high, with
larger than planned tubers to the underperforming and hard to
harvest. A five-year average yield of 44.7t/ha would result in a
harvest of around 4.9-5.0Mt. GB potato production has only
been below 5Mt in three other years since 1960, with the most
recent low point in the exceptional 2012 season at 4.5Mt. Even
if yields this year achieve 2014 levels, the scale of the area cut
would still result in the fourth lowest production since 1960.
After two years of plentiful supply this season is set to be much
tighter.
The fluctuations in yields from year to year, compounded by a
reduction in area, has driven volatility in prices between
seasons. While it remains to be seen how price trends will
develop in 2015/16, the past three seasons have featured the
widest range in average GB farmgate prices between seasons
ever recorded by AHDB.
This time last year, movement of stocks into an already well-
supplied market put pressure on prices. Into early 2015, stocks
in stores were in generally good condition, aside from odd
reports of breakdown and sprouting in ambient stores and
prices were expected to remain under pressure.
While planting began well, mixed weather conditions meant
that 2015 crop planting was frequently interrupted and
generally lagged behind typical progress, particularly in
Scotland. Early growing conditions, although not poor, have
also been less than ideal, with dry days and colder than
average nights leading to a delay in crop development. In
Scotland in particular, crop growth was reported as being
delayed by up to three weeks, but this has been marked by
large variability from field to field.
As delays with 2015 crops became more apparent, the market
for the remaining 2014 crop increasingly tightened. With limited
availability of new season supplies, demand centred on the
best quality stored supplies, resulting in an unexpected firming
of free-buy prices, which carried through into the start of the
2015/16 season.
New crop lifting started well and while crop development was
delayed, sufficient supplies were available to fulfil
requirements. Prices followed the usual trend, easing as more
supplies became available, and had relatively little differences
between overall (contract and free-buy) and free-buy average
prices. Wet weather over the summer months slowed lifting,
with the ground often difficult to work. While recent dry weather
has enabled lifting to gather momentum, it is still behind typical
progress. Quality of the lifted crop is reported to be good and
yields, while better than many expected, are variable.
On mainland Europe, the planted area has also reduced this
year, albeit to a lesser extent than for GB. Unfavourable
growing conditions have affected yields. A lower production
year for potatoes on the continent is also expected, creating
less import pressure and more potential export opportunities.
After more than three years of decline, retail demand for fresh
potatoes appears to be stabilising and demand for processed
potato products remains generally strong. The challenge will
be ensuring that this trend continues in a changing consumer
landscape.
6
The GB potato industry
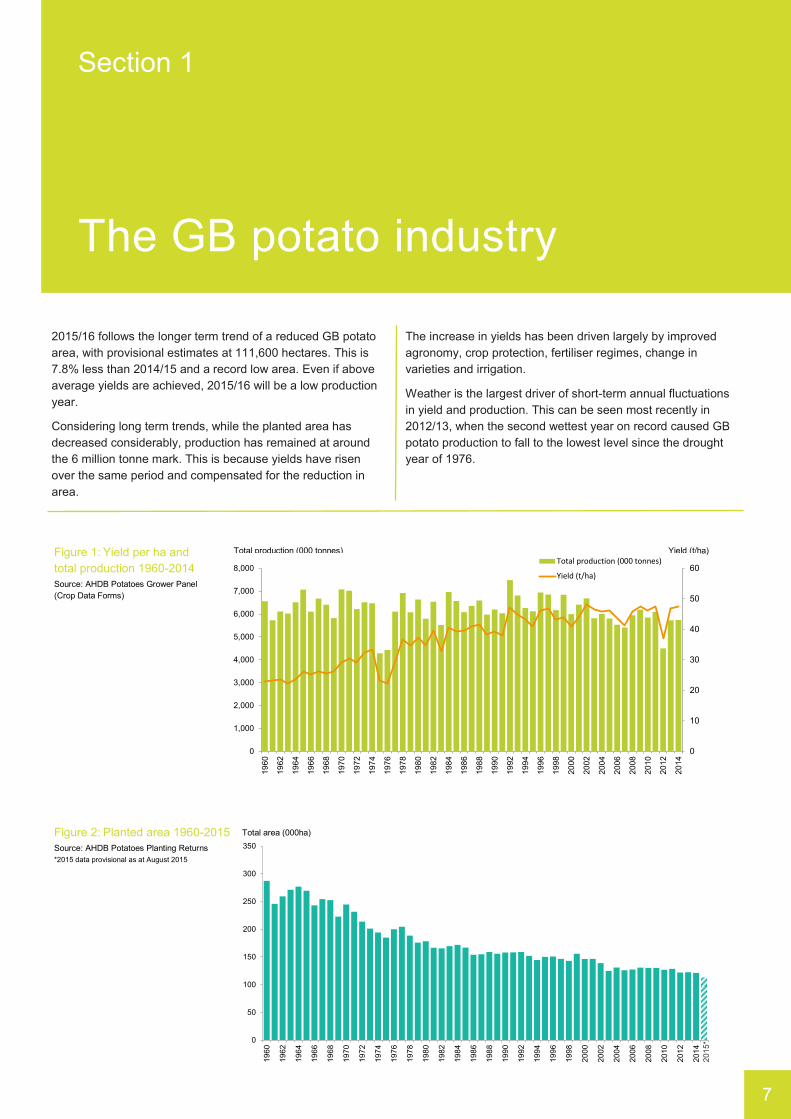
Section 1
2015/16 follows the longer term trend of a reduced GB potato
area, with provisional estimates at 111,600 hectares. This is
7.8% less than 2014/15 and a record low area. Even if above
average yields are achieved, 2015/16 will be a low production
year.
Considering long term trends, while the planted area has
decreased considerably, production has remained at around
the 6 million tonne mark. This is because yields have risen
over the same period and compensated for the reduction in
area.
The increase in yields has been driven largely by improved
agronomy, crop protection, fertiliser regimes, change in
varieties and irrigation.
Weather is the largest driver of short-term annual fluctuations
in yield and production. This can be seen most recently in
2012/13, when the second wettest year on record caused GB
potato production to fall to the lowest level since the drought
year of 1976.
Figure 1: Yield per ha and
total production 1960-2014
Source: AHDB Potatoes Grower Panel
(Crop Data Forms)
Figure 2: Planted area 1960-2015
Source: AHDB Potatoes Planting Returns
*2015 data provisional as at August 2015
Total area (000ha)
0
50
100
150
200
250
300
350
19
60
19
62
19
64
19
66
19
68
19
70
19
72
19
74
19
76
19
78
19
80
19
82
19
84
19
86
19
88
19
90
19
92
19
94
19
96
19
98
20
00
20
02
20
04
20
06
20
08
20
10
20
12
20
14
20
15
*
7
Yield (t/ha) Total production (000 tonnes)
0
10
20
30
40
50
60
0
1,000
2,000
3,000
4,000
5,000
6,000
7,000
8,000
19
60
19
62
19
64
19
66
19
68
19
70
19
72
19
74
19
76
19
78
19
80
19
82
19
84
19
86
19
88
19
90
19
92
19
94
19
96
19
98
20
00
20
02
20
04
20
06
20
08
20
10
20
12
20
14
Total production (000 tonnes)
Yield (t/ha)

The GB potato industry
Trends in planted area
In 2014, the number of registered growers was down slightly
at 2,160. A figure for 2015 will not be published until early
2016.
The area per grower has been steadily increasing since the
1960s. However, provisional estimates suggest that the area
per grower in 2013 and 2014 has remained steady at around
53 hectares. This may indicate that the consolidation of the
industry is slowing, however, it is too early to know for sure.
The largest proportion of the planted area grown is intended for
use in the pre-pack market, around 35%.
Potatoes grown intended for the processing sector make up
the second largest area, with 30% of the total area in 2015.
The area has increased from 28% of plantings in 2014, in line
with a rising consumer demand for processed potato products.
Figure 3: Planted area and number of growers 1960-2014
Source: AHDB Potatoes Planting Returns
Figure 4: Planted area per grower 1960-2014
Source: AHDB Potatoes Planting Returns
Table 1: Planted area by intended market sector in hectares*
Source: AHDB Potatoes Planting Returns
*2015 data provisional as at August 2015
† Totals may not tally exactly due to rounding
Figure 5: Proportion of planted area by intended
market sector 2015*
Source: AHDB Potatoes Planting Returns
*2015 data provisional as at August 2015
Market sector 2011 2012 2013 2014 2015*
Fresh bags 7,680 6,920 7,040 7,040 6,240
Fresh chipping 15,830 14,540 14,380 13,940 13,410
Pre-pack 47,710 44,960 46,030 43,030 39,380
Processing 35,560 34,630 33,790 34,320 33,700
Other ware 5,180 4,750 5,180 6,260 3,720
Seed 16,470 16,040 16,030 16,490 15,120
Total † 128,430 121,820 122,440 121,070 111,600
Area per grower
(ha)
0
10
20
30
40
50
60
196
0
196
2
196
4
196
6
196
8
197
0
197
2
197
4
197
6
197
8
198
0
198
2
198
4
198
6
198
8
199
0
199
2
199
4
199
6
199
8
200
0
200
2
200
4
200
6
200
8
201
0
201
2
201
4
6%
12%
35%30%
3% 14%
Fresh bags Fresh chipping
Pre-pack Processing
Other ware Seed
8
Registered planted
area (000ha)
Number of
registered growers
0
10,000
20,000
30,000
40,000
50,000
60,000
70,000
80,000
90,000
0
50
100
150
200
250
300
1960
1965
1970
1975
1980
1985
1990
1995
2000
2005
2010
Planted area
Number of growers
The GB potato industry
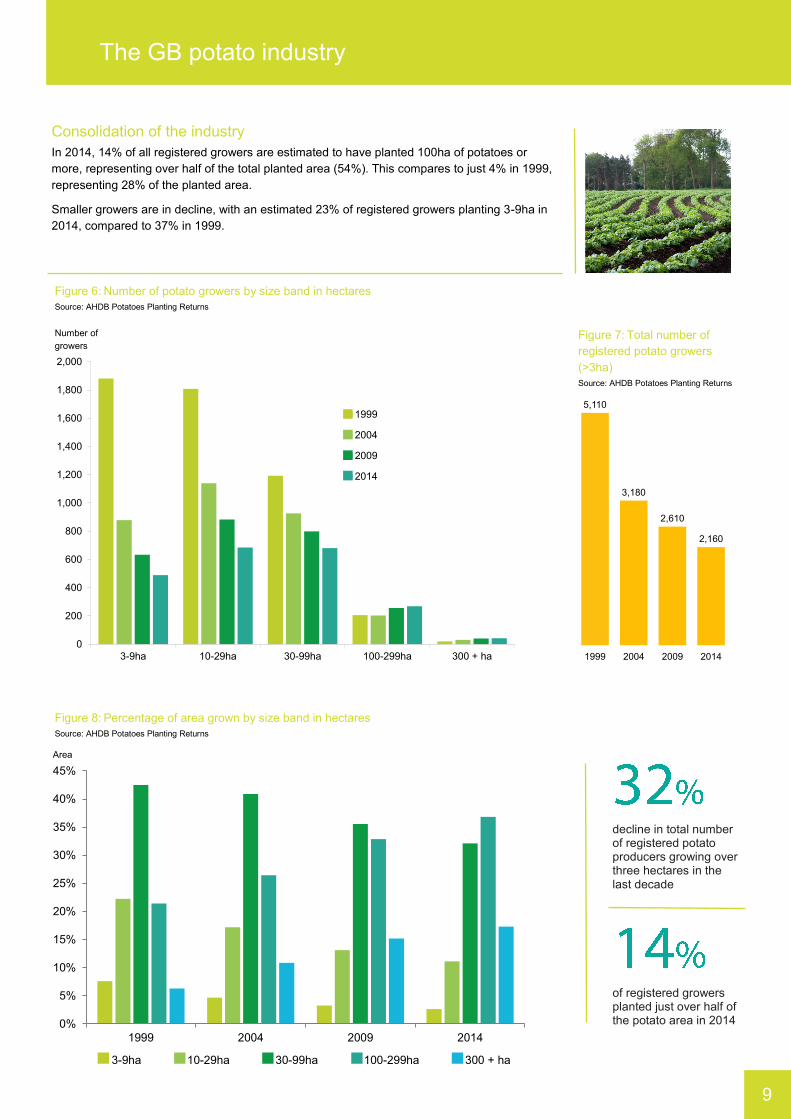
Consolidation of the industry
In 2014, 14% of all registered growers are estimated to have planted 100ha of potatoes or
more, representing over half of the total planted area (54%). This compares to just 4% in 1999,
representing 28% of the planted area.
Smaller growers are in decline, with an estimated 23% of registered growers planting 3-9ha in
2014, compared to 37% in 1999.
decline in total number of registered potato producers growing over three hectares in the last decade
of registered growers planted just over half of the potato area in 2014
Figure 6: Number of potato growers by size band in hectares
Source: AHDB Potatoes Planting Returns
Figure 7: Total number of
registered potato growers
(>3ha)
Source: AHDB Potatoes Planting Returns
0
200
400
600
800
1,000
1,200
1,400
1,600
1,800
2,000
3-9ha 10-29ha 30-99ha 100-299ha 300 + ha
1999
2004
2009
2014
Number of
growers
5,110
3,180
2,610
2,160
1999 2004 2009 2014
9
Figure 8: Percentage of area grown by size band in hectares
Source: AHDB Potatoes Planting Returns
Area
0%
5%
10%
15%
20%
25%
30%
35%
40%
45%
1999 2004 2009 2014
3-9ha 10-29ha 30-99ha 100-299ha 300 + ha
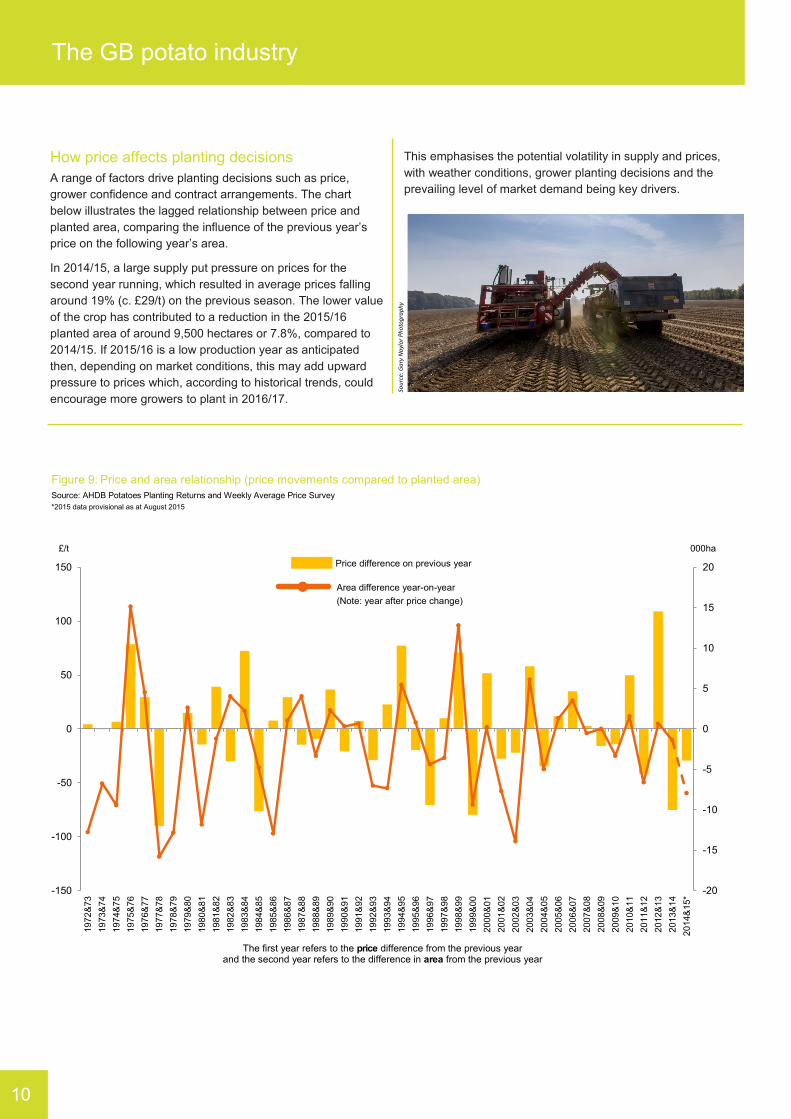
How price affects planting decisions
A range of factors drive planting decisions such as price,
grower confidence and contract arrangements. The chart
below illustrates the lagged relationship between price and
planted area, comparing the influence of the previous year’s
price on the following year’s area.
In 2014/15, a large supply put pressure on prices for the
second year running, which resulted in average prices falling
around 19% (c. £29/t) on the previous season. The lower value
of the crop has contributed to a reduction in the 2015/16
planted area of around 9,500 hectares or 7.8%, compared to
2014/15. If 2015/16 is a low production year as anticipated
then, depending on market conditions, this may add upward
pressure to prices which, according to historical trends, could
encourage more growers to plant in 2016/17.
This emphasises the potential volatility in supply and prices,
with weather conditions, grower planting decisions and the
prevailing level of market demand being key drivers.
Figure 9: Price and area relationship (price movements compared to planted area)
Source: AHDB Potatoes Planting Returns and Weekly Average Price Survey
*2015 data provisional as at August 2015
The GB potato industry
10
Sou
rce:
Ga
ry N
ayl
or
Pho
tog
rap
hy
The first year refers to the price difference from the previous year and the second year refers to the difference in area from the previous year
-20
-15
-10
-5
0
5
10
15
20
-150
-100
-50
0
50
100
150
1972&
73
1973&
74
1974&
75
1975&
76
1976&
77
1977&
78
1978&
79
1979&
80
1980&
81
1981&
82
1982&
83
1983&
84
1984&
85
1985&
86
1986&
87
1987&
88
1988&
89
1989&
90
1990&
91
1991&
92
1992&
93
1993&
94
1994&
95
1995&
96
1996&
97
1997&
98
1998&
99
1999&
00
2000&
01
2001&
02
2002&
03
2003&
04
2004&
05
2005&
06
2006&
07
2007&
08
2008&
09
2009&
10
2010&
11
2011&
12
2012&
13
2013&
14
2014&
15*
-20
-15
-10
-5
0
5
10
15
20
-150
-100
-50
0
50
100
150
1972&
73
1973&
74
1974&
75
1975&
76
1976&
77
1977&
78
1978&
79
1979&
80
1980&
81
1981&
82
1982&
83
1983&
84
1984&
85
1985&
86
1986&
87
1987&
88
1988&
89
1989&
90
1990&
91
1991&
92
1992&
93
1993&
94
1994&
95
1995&
96
1996&
77
1997&
98
1998&
99
1999&
00
2000&
01
2001&
02
2002&
03
2003&
04
2004&
05
2005&
06
2006&
07
2007&
08
2008&
09
2009&
10
2010&
11
2011&
12
2012&
13
2013&
14
2014&
15*
Area (hectares)Price (£)Price difference on previous year (£/t)
Area difference year-on-year (Note: yearafter price change)
Price difference on previous year
000ha £/t
Area difference year-on-year
(Note: year after price change)
of the total GB potato planted area is in Scotland, with 45% of this area seed potatoes
of plantings are in the West Midlands
of plantings are in the East of England and Yorkshire and Humber
of plantings are in the remainder of England and Wales
Figure 10: Main production areas
Source: AHDB Potatoes Planting Returns
Please note: The maps are based on the proportions of
planting in each country/unitary authority and show the spread
in planted area rather than illustrating precise locations.
Table 2: Planted area by region in hectares
Source: AHDB Potatoes Planting Returns
*2015 data provisional as at August 2015
† Totals may not tally exactly due to rounding
Figure 11: Proportion of planted area
by region 2015*
Source: AHDB Potatoes Planting Returns
*2015 data provisional as at August 2015
GB region 2011 2012 2013 2014 2015*
North East 1,120 970 920 1,020 830
North West 5,090 5,250 5,830 5,820 4,660
York and Humber 14,520 13,810 13,940 14,360 14,440
East Midlands 17,590 16,570 16,480 16,820 16,880
West Midlands 16,030 14,620 14,720 13,870 11,800
Eastern Counties 33,870 32,790 32,800 32,280 31,970
South East 3,280 3,110 3,190 2,970 2,140
South West 6,650 5,850 6,040 5,830 3,960
Scotland 28,880 27,470 26,910 26,370 23,310
Wales 1,400 1,400 1,600 1,740 1,590
Total † 128,430 121,820 122,440 121,070 111,600
Ware potatoes Seed potatoes
PROPORTION OF AREA GROWN
No plantings 50-69%
1-9% 70-89%
10-29% 90+%
30-49%
11
The GB potato industry
1%
4%
13%
15%
11%29%
2%
3%
21%
1%
North East North West
Yorks and Humber East Midlands
West Midlands Eastern Counties
South East South West
Scotland Wales
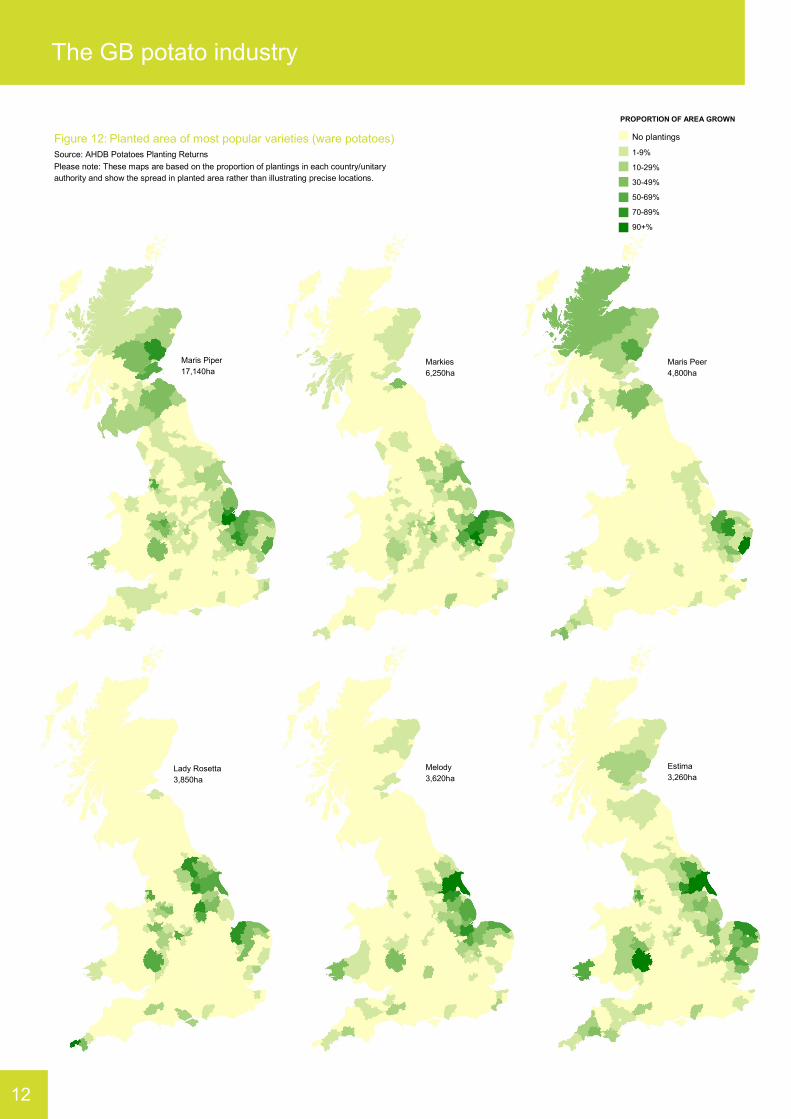
Figure 12: Planted area of most popular varieties (ware potatoes)
Source: AHDB Potatoes Planting Returns
Please note: These maps are based on the proportion of plantings in each country/unitary
authority and show the spread in planted area rather than illustrating precise locations.
PROPORTION OF AREA GROWN
No plantings
1-9%
10-29%
30-49%
50-69%
70-89%
90+%
Maris Piper
17,140ha
Markies
6,250ha
Maris Peer
4,800ha
Lady Rosetta
3,850ha
Melody
3,620ha
Estima
3,260ha
The GB potato industry
12

Further details of the top 50 varieties can be found at
www.potato.org.uk/publications/updated-2015-crop-estimate-total-potato-plantings-gb-and-variety-breakdown
of the planted area comes from top ten varieties
of the planted area is Maris Piper
Most popular varieties by planted area
A combination of factors influence the choice of
varieties grown. These could include disease
resistance, potential yields, soil type, irrigation
availability, storage or farm set-up or end-market
requirements.
Maris Piper remains the most popular variety in
terms of planted area, accounting for around
15% in 2015, shown in Table 3.
Markies has become more popular in recent
years for crisping and chip shops, accounting
for around 6% of the planted area. The variety
maintains frying qualities longer in store than
other varieties and generally produces strong
yields.
As shown in Figure 13, Estima’s popularity has
fallen, with a sharp decline in planted area over
the past five years. Instead, varieties such as
Melody for packing and Pentland Dell for
processing have increased in popularity.
Table 3: Top ten varieties by planted area in 2015*
Source: AHDB Potatoes Planting Returns
*2015 estimates are provisional as at August 2015
Rank Variety 2015 ha Proportion of
GB area (%)
Principal use Final 2014 v provisional 2015
change in rank
1 Maris Piper 17,140 0 15 Maincrop multipurpose (mainly chipping but also
popular packing and bags)
2 Markies 6,430 0 6 Maincrop chipping
3 Maris Peer 4,800 +1 4 Second early pre-pack (mainly salad or new potato)
4 Lady Rosetta 3,850 -1 3 Maincrop crisping
5 Melody 3,620 +1 3 Maincrop pre-pack
6 Estima 3,260 -1 3 Second early pre-pack
7 Hermes 2,900 +1 3 Maincrop crisping
8 Pentland Dell 2,720 +2 2 Maincrop chipping
9 Marfona 2,380 0 2 Second early pre-pack
10 Harmony 2,310 -3 2 Maincrop pre-pack (often bakers)
The GB potato industry
13
Figure 13: Planted area of top ten varieties - five year trend
Source: AHDB Potatoes Planting Returns
*2015 estimates are provisional as at August 2015
0
5,000
10,000
15,000
20,000
25,000
Maris Piper Markies Maris Peer Lady Rosetta Melody Estima Hermes Pentland Dell Marfona Harmony
2011 2012 2013 2014 2015*
Hectares
Farmgate potato prices
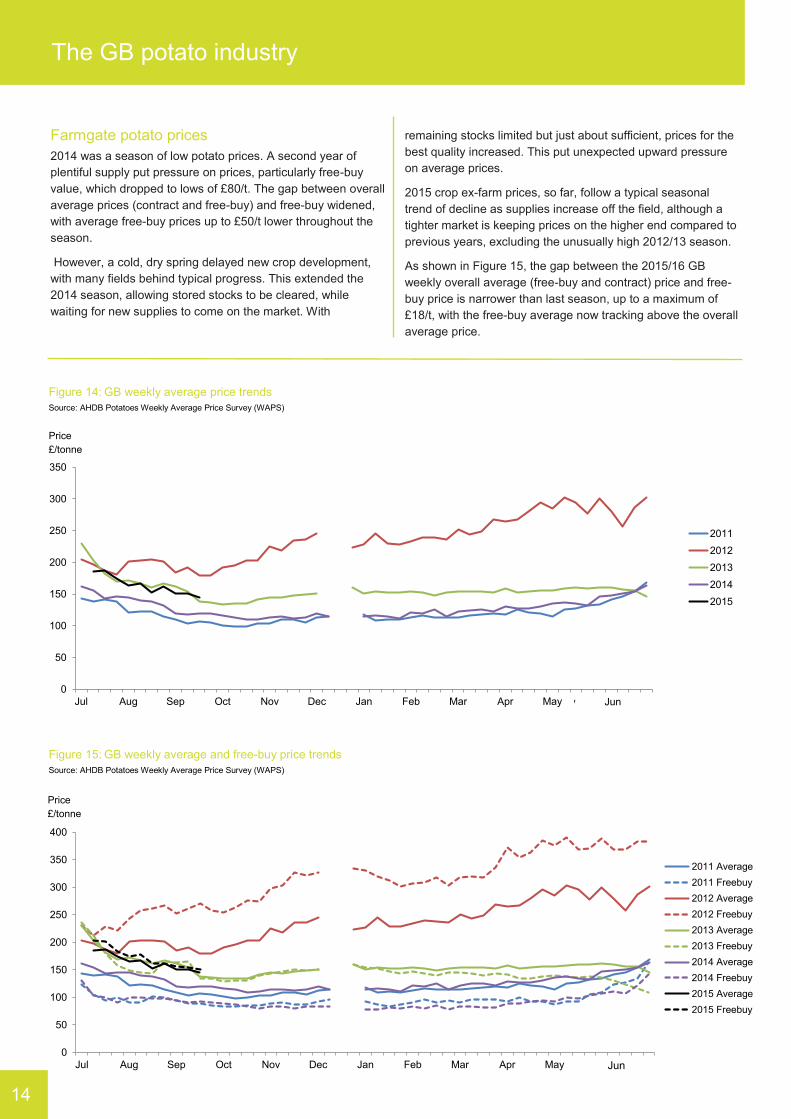
2014 was a season of low potato prices. A second year of
plentiful supply put pressure on prices, particularly free-buy
value, which dropped to lows of £80/t. The gap between overall
average prices (contract and free-buy) and free-buy widened,
with average free-buy prices up to £50/t lower throughout the
season.
However, a cold, dry spring delayed new crop development,
with many fields behind typical progress. This extended the
2014 season, allowing stored stocks to be cleared, while
waiting for new supplies to come on the market. With
remaining stocks limited but just about sufficient, prices for the
best quality increased. This put unexpected upward pressure
on average prices.
2015 crop ex-farm prices, so far, follow a typical seasonal
trend of decline as supplies increase off the field, although a
tighter market is keeping prices on the higher end compared to
previous years, excluding the unusually high 2012/13 season.
As shown in Figure 15, the gap between the 2015/16 GB
weekly overall average (free-buy and contract) price and free-
buy price is narrower than last season, up to a maximum of
£18/t, with the free-buy average now tracking above the overall
average price.
Figure 14: GB weekly average price trends
Source: AHDB Potatoes Weekly Average Price Survey (WAPS)
Figure 15: GB weekly average and free-buy price trends
Source: AHDB Potatoes Weekly Average Price Survey (WAPS)
0
50
100
150
200
250
300
350
Jul Aug Sep Oct Nov Dec Jan Feb Mar Apr May May Jun
2011
2012
2013
2014
2015
Price
£/tonne
0
50
100
150
200
250
300
350
400
Jul Aug Sep Oct Nov Dec Jan Feb Mar Apr May May Jun
2011 Average
2011 Freebuy
2012 Average
2012 Freebuy
2013 Average
2013 Freebuy
2014 Average
2014 Freebuy
2015 Average
2015 Freebuy
Price
£/tonne
The GB potato industry
14
0
50
100
150
200
250
300
350
Jul Aug Sep Oct Nov Dec Jan Feb Mar Apr May May Jun
2011
2012
2013
2014
2015
0
50
100
150
200
250
300
350
Jul Aug Sep Oct Nov Dec Jan Feb Mar Apr May May Jun
2011
2012
2013
2014
2015
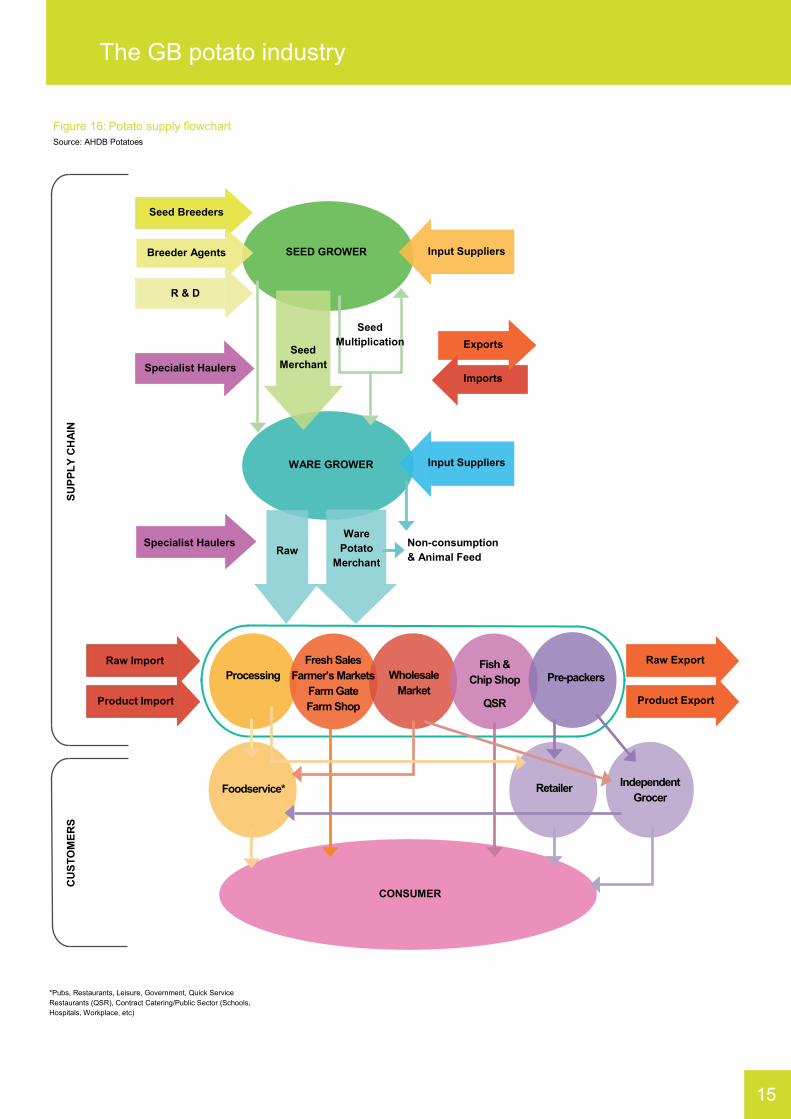
Figure 16: Potato supply flowchart
Source: AHDB Potatoes
*Pubs, Restaurants, Leisure, Government, Quick Service
Restaurants (QSR), Contract Catering/Public Sector (Schools,
Hospitals, Workplace, etc)
Seed Breeders
Breeder Agents
R & D
Input Suppliers
Exports
Imports Specialist Haulers
Specialist Haulers
Raw Import
Product Import
Input Suppliers
Raw Export
Product Export
Raw
WARE GROWER
Ware
Potato
Merchant
Non-consumption
& Animal Feed
Seed
Merchant
Seed
Multiplication
SEED GROWER
Processing
Fresh Sales
Farmer’s Markets
Farm Gate
Farm Shop
Wholesale
Market
Fish &
Chip Shop
QSR
Pre-packers
Independent
Grocer Retailer Foodservice*
CONSUMER
CU
ST
OM
ER
S
SU
PP
LY
CH
AIN
15
The GB potato industry
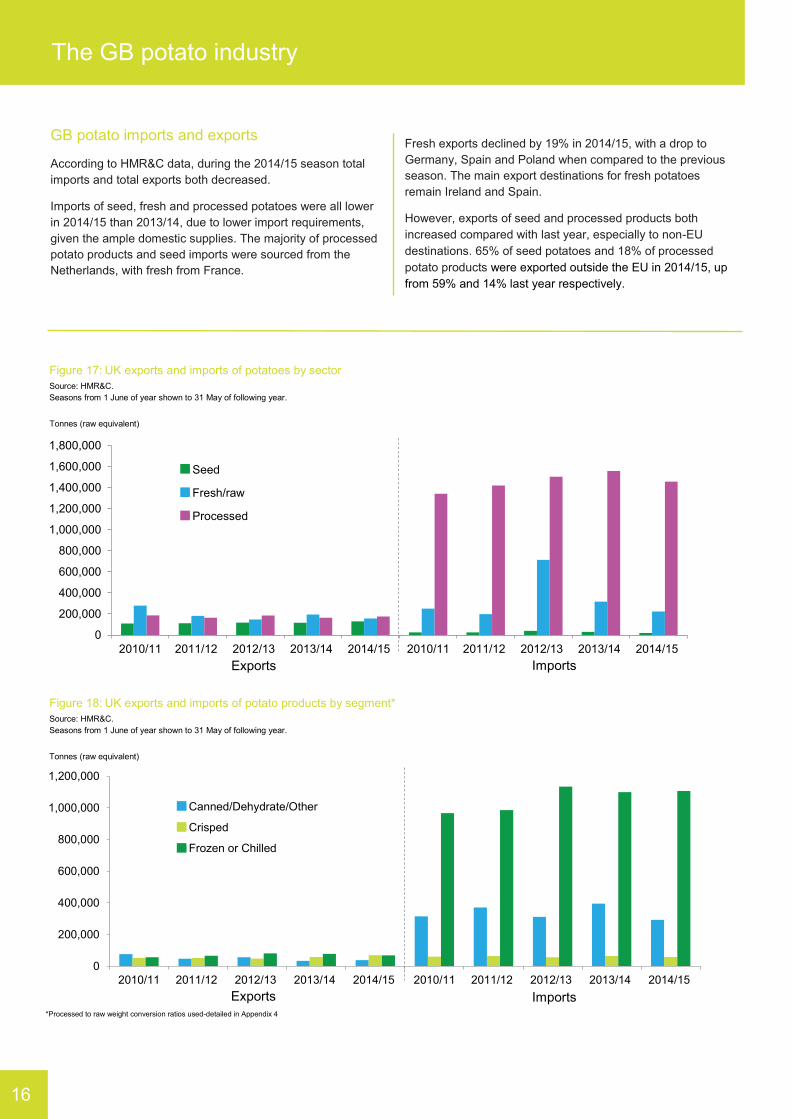
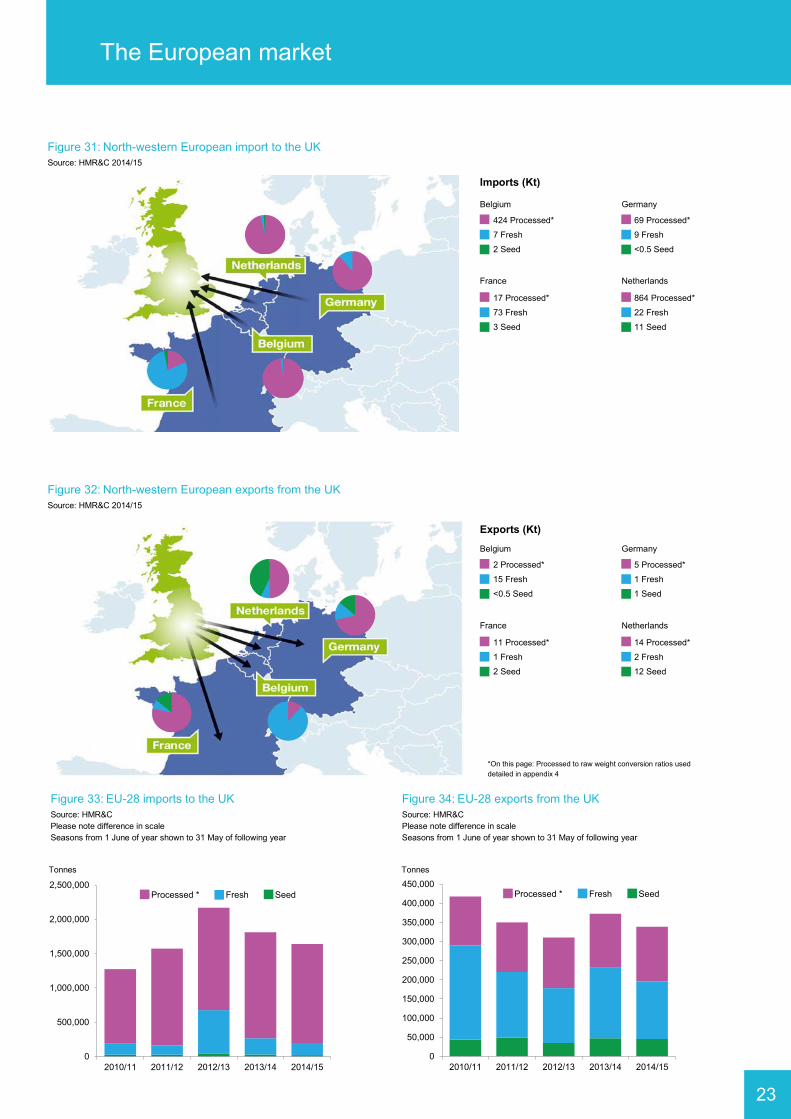
GB potato imports and exports
According to HMR&C data, during the 2014/15 season total
imports and total exports both decreased.
Imports of seed, fresh and processed potatoes were all lower
in 2014/15 than 2013/14, due to lower import requirements,
given the ample domestic supplies. The majority of processed
potato products and seed imports were sourced from the
Netherlands, with fresh from France.
Fresh exports declined by 19% in 2014/15, with a drop to
Germany, Spain and Poland when compared to the previous
season. The main export destinations for fresh potatoes
remain Ireland and Spain.
However, exports of seed and processed products both
increased compared with last year, especially to non-EU
destinations. 65% of seed potatoes and 18% of processed
potato products were exported outside the EU in 2014/15, up
from 59% and 14% last year respectively.
Figure 17: UK exports and imports of potatoes by sector
Source: HMR&C.
Seasons from 1 June of year shown to 31 May of following year.
Figure 18: UK exports and imports of potato products by segment*
Source: HMR&C.
Seasons from 1 June of year shown to 31 May of following year.
The GB potato industry
16
0
200,000
400,000
600,000
800,000
1,000,000
1,200,000
1,400,000
1,600,000
1,800,000
2010/11EXPORTS
2011/12 2012/13 2013/14 2014/15 2010/11IMPORTS
2011/12 2012/13 2013/14 2014/15
Seed
Fresh/raw
Processed
Tonnes (raw equivalent)
Exports Imports
*Processed to raw weight conversion ratios used-detailed in Appendix 4
0
200,000
400,000
600,000
800,000
1,000,000
1,200,000
2010/11EXPORTS
2011/12 2012/13 2013/14 2014/15 2010/11IMPORTS
2011/12 2012/13 2013/14 2014/15
Canned/Dehydrate/Other
Crisped
Frozen or Chilled
Tonnes (raw equivalent)
Exports Imports
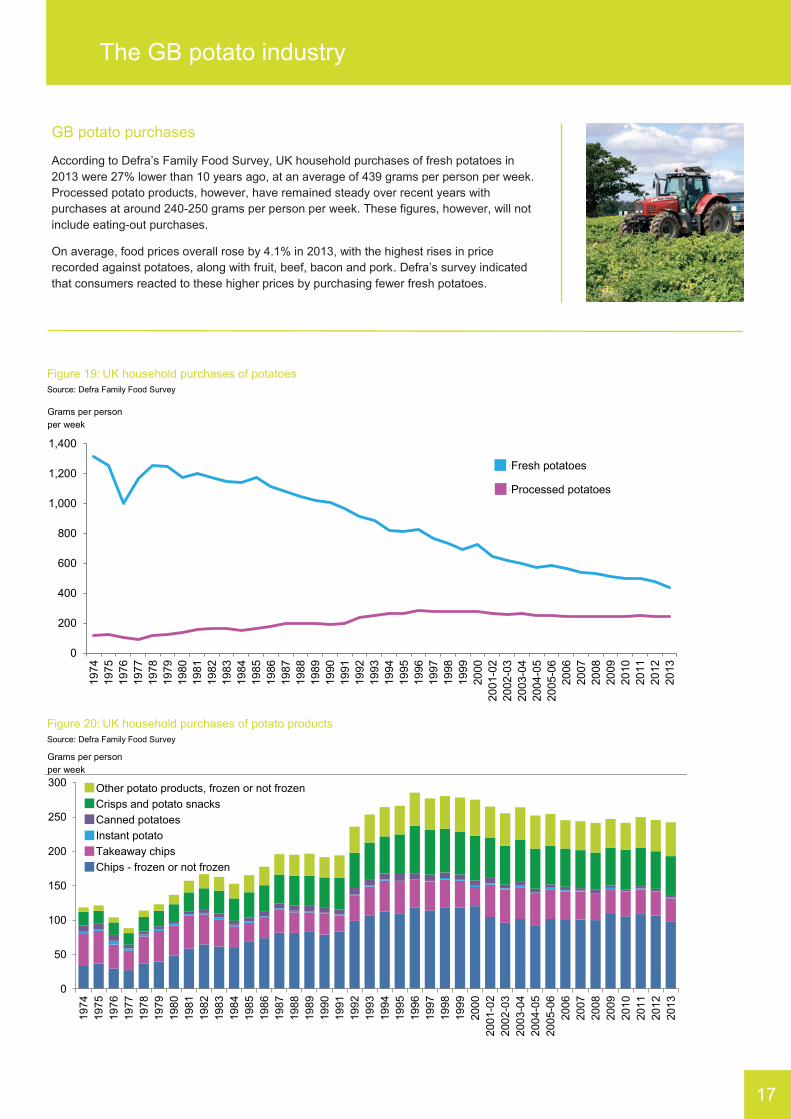
GB potato purchases
According to Defra’s Family Food Survey, UK household purchases of fresh potatoes in
2013 were 27% lower than 10 years ago, at an average of 439 grams per person per week.
Processed potato products, however, have remained steady over recent years with
purchases at around 240-250 grams per person per week. These figures, however, will not
include eating-out purchases.
On average, food prices overall rose by 4.1% in 2013, with the highest rises in price
recorded against potatoes, along with fruit, beef, bacon and pork. Defra’s survey indicated
that consumers reacted to these higher prices by purchasing fewer fresh potatoes.
Figure 19: UK household purchases of potatoes
Source: Defra Family Food Survey
Figure 20: UK household purchases of potato products
Source: Defra Family Food Survey
The GB potato industry
17
Grams per person
per week
0
200
400
600
800
1,000
1,200
1,400
19
74
19
75
19
76
19
77
19
78
19
79
19
80
19
81
19
82
19
83
19
84
19
85
19
86
19
87
19
88
19
89
19
90
19
91
19
92
19
93
19
94
19
95
19
96
19
97
19
98
19
99
20
00
20
01
-02
20
02
-03
20
03
-04
20
04
-05
20
05
-06
20
06
20
07
20
08
20
09
20
10
20
11
20
12
20
13
Fresh potatoes
Processed potatoes
0
50
100
150
200
250
300
1974
1975
1976
1977
1978
1979
1980
1981
1982
1983
1984
1985
1986
1987
1988
1989
1990
1991
1992
1993
1994
1995
1996
1997
1998
1999
2000
200
1-0
2
200
2-0
3
200
3-0
4
200
4-0
5
200
5-0
6
2006
2007
2008
2009
2010
2011
2012
2013
Other potato products, frozen or not frozen
Crisps and potato snacks
Canned potatoes
Instant potato
Takeaway chips
Chips - frozen or not frozen
Grams per person
per week
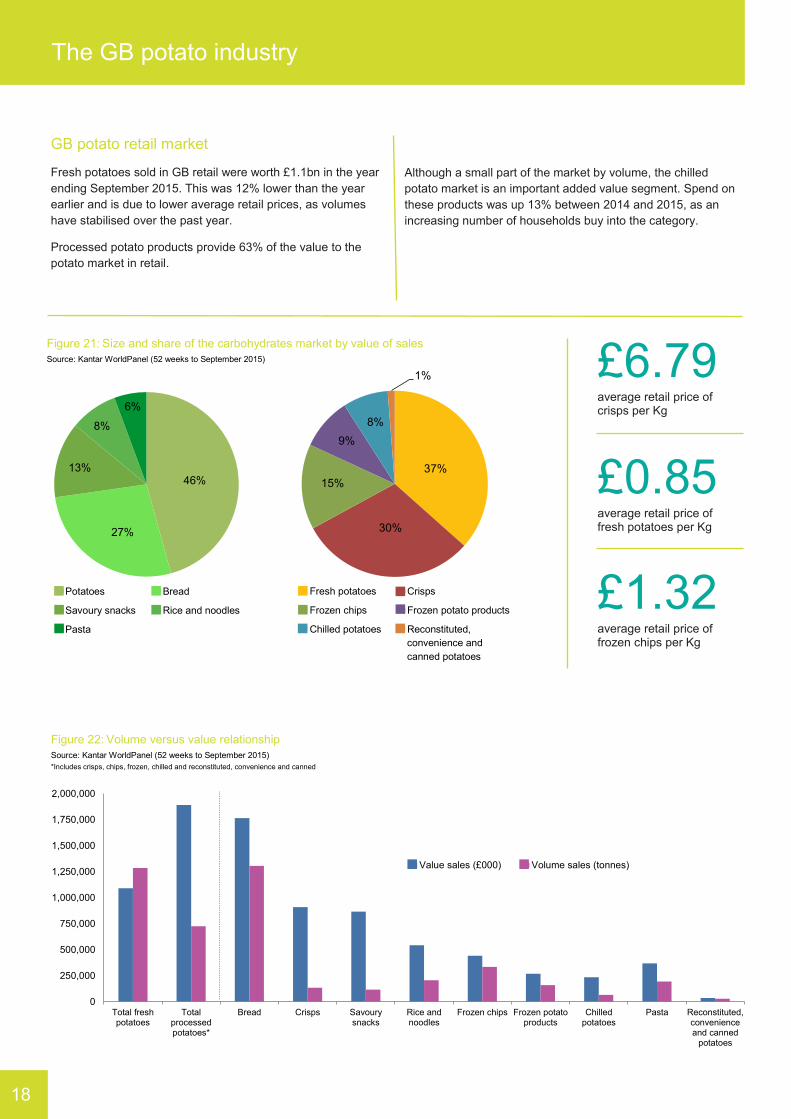
GB potato retail market
Fresh potatoes sold in GB retail were worth £1.1bn in the year
ending September 2015. This was 12% lower than the year
earlier and is due to lower average retail prices, as volumes
have stabilised over the past year.
Processed potato products provide 63% of the value to the
potato market in retail.
Although a small part of the market by volume, the chilled
potato market is an important added value segment. Spend on
these products was up 13% between 2014 and 2015, as an
increasing number of households buy into the category.
£6.79 average retail price of crisps per Kg
£0.85 average retail price of fresh potatoes per Kg
£1.32 average retail price of frozen chips per Kg
Figure 22: Volume versus value relationship
Source: Kantar WorldPanel (52 weeks to September 2015)
*Includes crisps, chips, frozen, chilled and reconstituted, convenience and canned
Figure 21: Size and share of the carbohydrates market by value of sales
Source: Kantar WorldPanel (52 weeks to September 2015)
The GB potato industry
18
Potatoes Bread
Savoury snacks Rice and noodles
Pasta
46%
27%
13%
8%
6%
Potatoes Bread
Savoury snacks Rice and noodles
Pasta
Fresh potatoes Crisps
Frozen chips Frozen potato products
Chilled potatoes Reconstituted,
convenience and
canned potatoes
37%
30%
15%
9%
8%
1%
Fresh potatoesCrispsFrozen chipsFrozen potato productsChilled potatoesReconstituted, convenience and canned potatoes
0
250,000
500,000
750,000
1,000,000
1,250,000
1,500,000
1,750,000
2,000,000
Total freshpotatoes
Totalprocessedpotatoes*
Bread Crisps Savourysnacks
Rice andnoodles
Frozen chips Frozen potatoproducts
Chilledpotatoes
Pasta Reconstituted,convenienceand canned
potatoes
Value sales (£000) Volume sales (tonnes)
GB potato retail sales
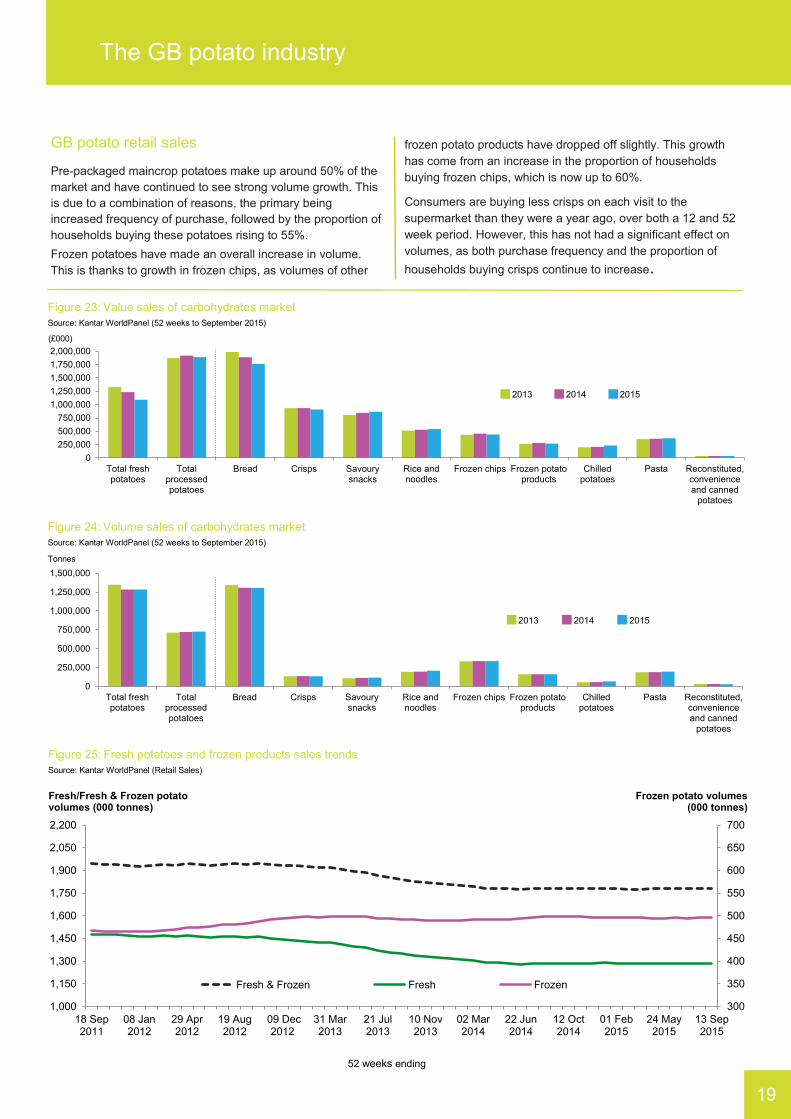
Pre-packaged maincrop potatoes make up around 50% of the
market and have continued to see strong volume growth. This
is due to a combination of reasons, the primary being
increased frequency of purchase, followed by the proportion of
households buying these potatoes rising to 55%.
Frozen potatoes have made an overall increase in volume.
This is thanks to growth in frozen chips, as volumes of other
frozen potato products have dropped off slightly. This growth
has come from an increase in the proportion of households
buying frozen chips, which is now up to 60%.
Consumers are buying less crisps on each visit to the
supermarket than they were a year ago, over both a 12 and 52
week period. However, this has not had a significant effect on
volumes, as both purchase frequency and the proportion of
households buying crisps continue to increase.
Figure 25: Fresh potatoes and frozen products sales trends
Source: Kantar WorldPanel (Retail Sales)
52 weeks ending
300
350
400
450
500
550
600
650
700
1,000
1,150
1,300
1,450
1,600
1,750
1,900
2,050
2,200
18 Sep2011
08 Jan2012
29 Apr2012
19 Aug2012
09 Dec2012
31 Mar2013
21 Jul2013
10 Nov2013
02 Mar2014
22 Jun2014
12 Oct2014
01 Feb2015
24 May2015
13 Sep2015
Fresh & Frozen Fresh Frozen
Fresh/Fresh & Frozen potato volumes (000 tonnes)
Frozen potato volumes (000 tonnes)
The GB potato industry
19
Figure 23: Value sales of carbohydrates market
Source: Kantar WorldPanel (52 weeks to September 2015)
0
250,000
500,000
750,000
1,000,000
1,250,000
1,500,000
1,750,000
2,000,000
Total freshpotatoes
Totalprocessedpotatoes
Bread Crisps Savourysnacks
Rice andnoodles
Frozen chips Frozen potatoproducts
Chilledpotatoes
Pasta Reconstituted,convenienceand canned
potatoes
2013 2014 2015
(£000)
Figure 24: Volume sales of carbohydrates market
Source: Kantar WorldPanel (52 weeks to September 2015)
0
250,000
500,000
750,000
1,000,000
1,250,000
1,500,000
Total freshpotatoes
Totalprocessedpotatoes
Bread Crisps Savourysnacks
Rice andnoodles
Frozen chips Frozen potatoproducts
Chilledpotatoes
Pasta Reconstituted,convenienceand canned
potatoes
2013 2014 2015
Tonnes
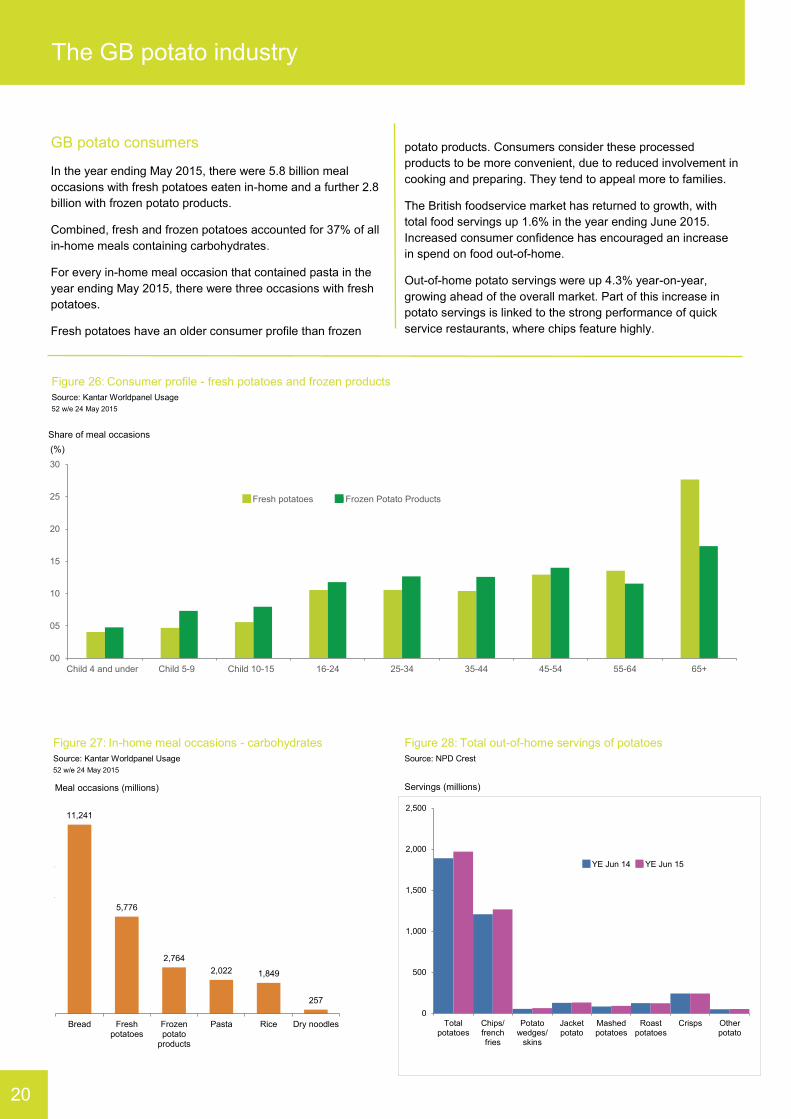
GB potato consumers
In the year ending May 2015, there were 5.8 billion meal
occasions with fresh potatoes eaten in-home and a further 2.8
billion with frozen potato products.
Combined, fresh and frozen potatoes accounted for 37% of all
in-home meals containing carbohydrates.
For every in-home meal occasion that contained pasta in the
year ending May 2015, there were three occasions with fresh
potatoes.
Fresh potatoes have an older consumer profile than frozen
potato products. Consumers consider these processed
products to be more convenient, due to reduced involvement in
cooking and preparing. They tend to appeal more to families.
The British foodservice market has returned to growth, with
total food servings up 1.6% in the year ending June 2015.
Increased consumer confidence has encouraged an increase
in spend on food out-of-home.
Out-of-home potato servings were up 4.3% year-on-year,
growing ahead of the overall market. Part of this increase in
potato servings is linked to the strong performance of quick
service restaurants, where chips feature highly.
Figure 26: Consumer profile - fresh potatoes and frozen products
Source: Kantar Worldpanel Usage
52 w/e 24 May 2015
The GB potato industry
20
Figure 27: In-home meal occasions - carbohydrates
Source: Kantar Worldpanel Usage
52 w/e 24 May 2015
Figure 28: Total out-of-home servings of potatoes
Source: NPD Crest
0
500
1,000
1,500
2,000
2,500
Totalpotatoes
Chips/frenchfries
Potatowedges/
skins
Jacketpotato
Mashedpotatoes
Roastpotatoes
Crisps Otherpotato
YE Jun 14 YE Jun 15
Servings (millions)
11,241
5,776
2,764
2,022 1,849
257
Bread Freshpotatoes
Frozenpotato
products
Pasta Rice Dry noodles
Meal occasio
ns (
mill
ions)
Meal occasions (millions)
Share of meal occasions
0.00
0.05
0.10
0.15
0.20
0.25
0.30
Child 4 and under Child 5-9 Child 10-15 16-24 25-34 35-44 45-54 55-64 65+
Fresh potatoes Frozen Potato Products
(%)
The European market
Section 2
The GB market is increasingly influenced by the European
potato market. Volatility in potato supply and prices, due to
issues such as weather, means that imported European
product plays a part in the GB market. Price, quality and
variety of homegrown supply, as well as currency
fluctuations, influence the level of imports in a particular
season.
The North-Western European Potato Growers
(NEPG)
Established in 1997, and representing
the five leading potato growing countries,
NEPG aims to facilitate the communication of up-to-date
and accurate business information for the benefit of the
industry.
The network also aims to improve the stability of the EU
processing supply chain through information provision and
exchange.
AHDB Potatoes is a member of NEPG and, as such, gains
insight into the dynamics of the North-west European
potato market.
Privileged access is also given to information on
production as well as technical and marketing aspects of
NEPG countries.
More information is available at www.nepg.info.
The Belgian potato market
(Source: Fiwap)
The processing industry has expanded tremendously
during the last 20 years, from 800,000t in 1994 to more
than 3.8Mt in 2014, remaining the focus of Belgian’s
potato industry.
To fulfil industry requirements, the potato area has
increased from 52,000ha in 1994 to 80,400ha in 2014.
However, since 2006/07 around 0.5-0.8Kt is imported
each year from neighbouring countries (mainly the
Netherlands and France but, increasingly, also Germany)
to fulfil their strong processing demand.
One variety, Bintje, represents around 45-50% of the planted
potato area in Belgium, although this has declined in recent
years. Bintje used to be sold for the fresh potato market, chip
shops and export, as well as for the processing industry.
However, sales of Bintje for the fresh market and for export are
now generally in decline.
The fresh market plays a much smaller part of the overall
Belgian potato market. The sector is heavily dependent on
imports from France as well as the Netherlands. For the last
decade, the Belgian potato sector has used new varieties,
irrigation, packaging and marketing, to increase the amount of
Belgian fresh consumption potatoes sold in supermarkets.
The French potato market
(Source: UNPT)
The total French planted area of 155,000ha (consumption,
seed and starch) is grown by 16,495 potato growers. Twenty-
two per cent of potato growers (about 3,600) plant 80% of the
French potato area and the industry still continues to
consolidate and specialise.
About 1.1Mt of potatoes, or a quarter of French potatoes, are
processed in factories every year. 70% of these are contracted,
between 10-15% are free-buy purchased and around 15-20%
imported.
Unlike Belgium and the Netherlands, the processing industry
development is steady with little new capacity introduced over
the past few years.
About 1Mt of fresh potatoes for the French market are
produced each year. Similar to GB, consumption of fresh
potatoes has seen decline in recent years.
There has been major development of fresh exports over the
past 15-20 years, but trade is steady now at c.17-18 Mt. The
main importers are Spain, Italy and Portugal. One third of
potatoes exported from France go to Belgium and the
Netherlands to be processed and then are imported back to
France as French Fries, flakes or crisps.
21
The European market
The German potato market (Source: REKA)
Germany remains the largest North-western European potato
producer, producing around 7.5Mt of potatoes each year,
excluding seed and starch.
The total planted area is 245,000ha this season. Of this, about
142,000ha are processing potatoes, including starch. The area
for starch and fresh consumption potatoes is decreasing as
fresh consumption decreases, while French fry raw material is
increasing slightly.
Similar to the whole of NEPG, the German industry is
consolidating with the number of potato producing farms
decreasing every year. Farms are getting more specialised and
increasing in size. Over 30% of German potato producing
farms now grow more than 20ha of potatoes annually.
Germany usually exports between 1.3-1.4Mt of potatoes per
year.
The Netherlands potato market (Source: VTA/Phaff Export Marketing)
The Netherlands grows about 7Mt of potatoes from a planted
area of around 160,000ha. These include around 2Mt of starch
potatoes and 5Mt of seed, fresh for retail and the processing
industry. Bintje, once the most popular variety grown, has been
overtaken by processing varieties such as Fontane, Markies
and Agria.
There is a trend towards larger farms to achieve economies of
scale, however, compared with GB and Northern France the
growers are still relatively small.
Land for growing potatoes is more expensive than in other
north-western potato growing countries so high yields,
economies of scale and a good strategy are key for Dutch
growers.
The majority of Dutch potatoes are used for processing, with
around 3.5Mt of potatoes processed each year. The Dutch
processing industry has grown enormously over the last 15
years. The current Dutch harvest is not enough to fulfil
processing demand and so supplies are imported from
Belgium, northern France and Germany to fulfil requirements.
The fresh retail potato market is estimated at a maximum of
350,000t a year. A quarter of all Dutch consumers never buy
fresh, raw potatoes, while consumption of fresh, chilled potato
convenience products shows an upwards trend. Unlike GB, the
foodservice market, such as restaurants, rarely use fresh
potatoes, only finished products.
The Netherlands is by far the largest seed potato exporter in
the world, with 798,000t exported last season. The main seed
variety grown is the early Spunta.
Thank you to our colleagues at Fiwap, UNPT, REKA, VTA and
Phaff Export Marketing for providing information for this
section.
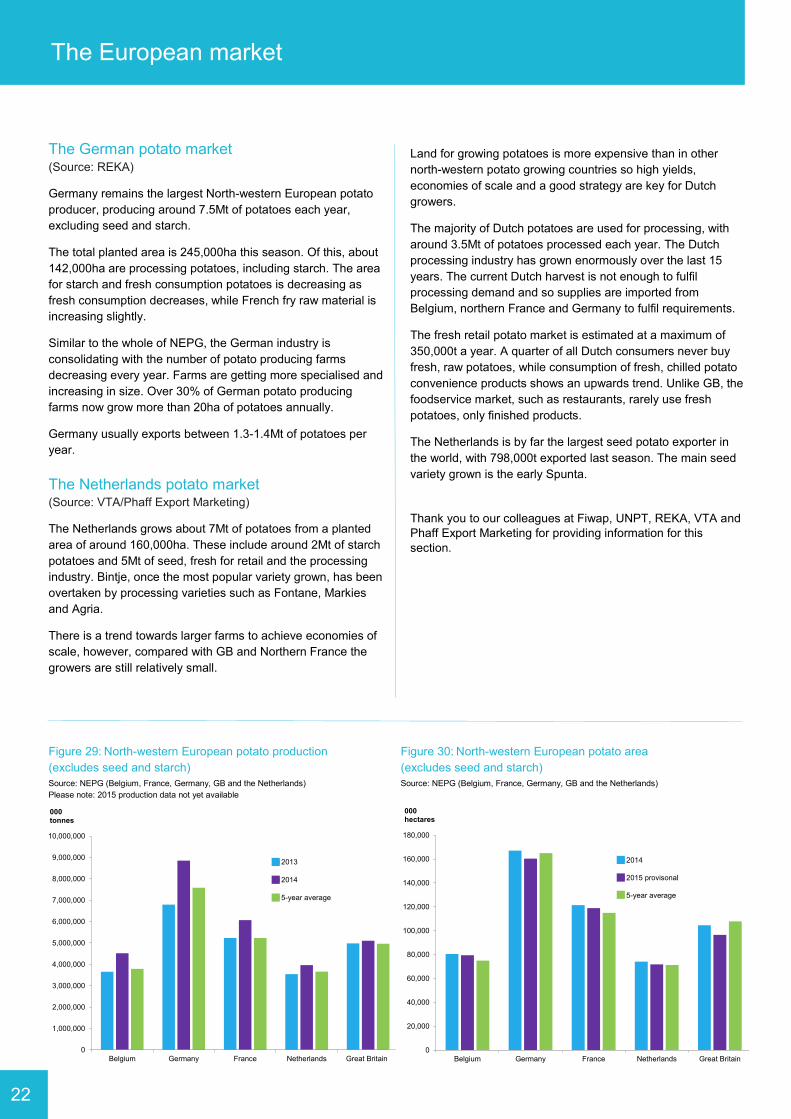
Figure 29: North-western European potato production
(excludes seed and starch)
Source: NEPG (Belgium, France, Germany, GB and the Netherlands)
Please note: 2015 production data not yet available
Figure 30: North-western European potato area
(excludes seed and starch)
Source: NEPG (Belgium, France, Germany, GB and the Netherlands)
22
0
20,000
40,000
60,000
80,000
100,000
120,000
140,000
160,000
180,000
Belgium Germany France Netherlands Great Britain
000 hectares
2014
2015 provisonal
5-year average
0
1,000,000
2,000,000
3,000,000
4,000,000
5,000,000
6,000,000
7,000,000
8,000,000
9,000,000
10,000,000
Belgium Germany France Netherlands Great Britain*
000 tonnes
2013
2014
5-year average
The European market
Figure 31: North-western European import to the UK
Source: HMR&C 2014/15
Figure 32: North-western European exports from the UK
Source: HMR&C 2014/15
*On this page: Processed to raw weight conversion ratios used
detailed in appendix 4
Imports (Kt)
Exports (Kt)
Belgium Germany
France Netherlands
424 Processed*
7 Fresh
2 Seed
69 Processed*
9 Fresh
<0.5 Seed
17 Processed*
73 Fresh
3 Seed
864 Processed*
22 Fresh
11 Seed
Belgium
424 Processed*
7 Fresh
2 Seed
Germany
1 2 3
Chart Title
1 2 3
Chart Title
1 2 3
Belgium
1 2 3
Germany
1 2 3
France
1 2 3
Netherlands
1 2 3
Belgium Germany
France Netherlands
2 Processed*
15 Fresh
<0.5 Seed
5 Processed*
1 Fresh
1 Seed
11 Processed*
1 Fresh
2 Seed
14 Processed*
2 Fresh
12 Seed
Figure 33: EU-28 imports to the UK
Source: HMR&C
Please note difference in scale
Seasons from 1 June of year shown to 31 May of following year
0
500,000
1,000,000
1,500,000
2,000,000
2,500,000
2010/11 2011/12 2012/13 2013/14 2014/15
Processed * Fresh Seed
Tonnes
Figure 34: EU-28 exports from the UK
Source: HMR&C
Please note difference in scale
Seasons from 1 June of year shown to 31 May of following year
0
50,000
100,000
150,000
200,000
250,000
300,000
350,000
400,000
450,000
2010/11 2011/12 2012/13 2013/14 2014/15
Processed * Fresh Seed
Tonnes
23
World overview
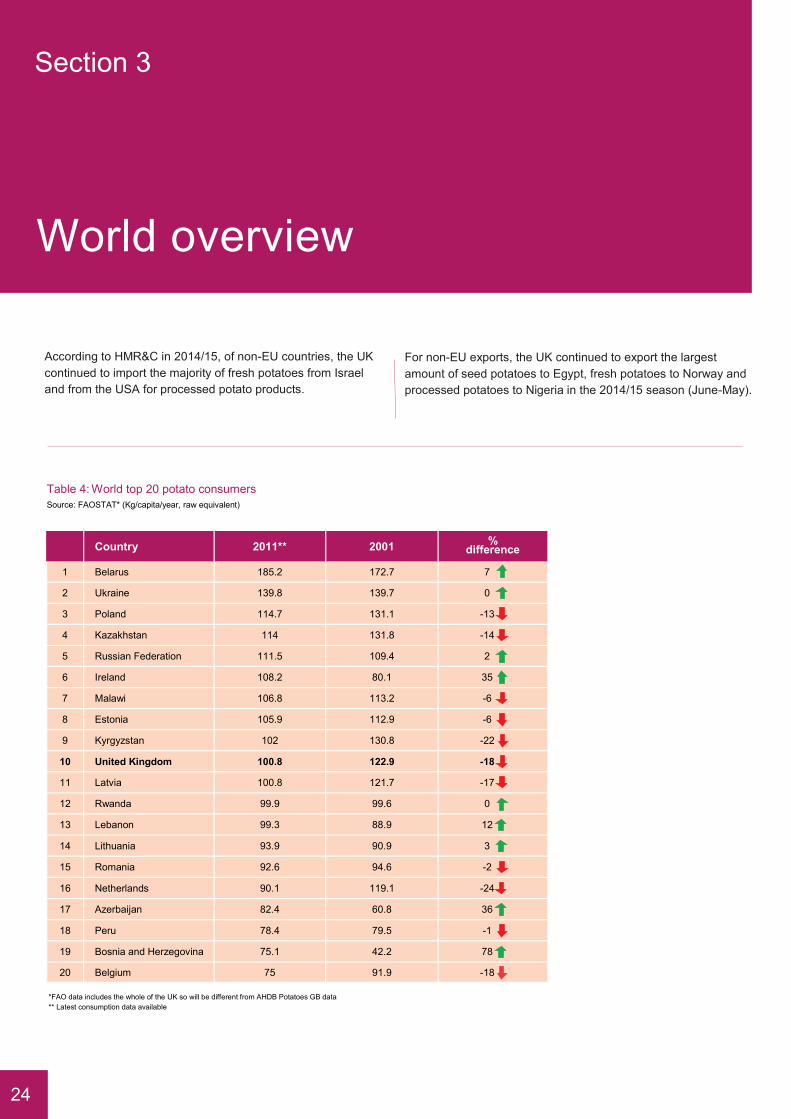
According to HMR&C in 2014/15, of non-EU countries, the UK
continued to import the majority of fresh potatoes from Israel
and from the USA for processed potato products.
For non-EU exports, the UK continued to export the largest
amount of seed potatoes to Egypt, fresh potatoes to Norway and
processed potatoes to Nigeria in the 2014/15 season (June-May).
Table 4: World top 20 potato consumers
Source: FAOSTAT* (Kg/capita/year, raw equivalent)
*FAO data includes the whole of the UK so will be different from AHDB Potatoes GB data
** Latest consumption data available
Country 2011** 2001 %
difference
1 Belarus 185.2 172.7 7
2 Ukraine 139.8 139.7 0
3 Poland 114.7 131.1 -13
4 Kazakhstan 114 131.8 -14
5 Russian Federation 111.5 109.4 2
6 Ireland 108.2 80.1 35
7 Malawi 106.8 113.2 -6
8 Estonia 105.9 112.9 -6
9 Kyrgyzstan 102 130.8 -22
10 United Kingdom 100.8 122.9 -18
11 Latvia 100.8 121.7 -17
12 Rwanda 99.9 99.6 0
13 Lebanon 99.3 88.9 12
14 Lithuania 93.9 90.9 3
15 Romania 92.6 94.6 -2
16 Netherlands 90.1 119.1 -24
17 Azerbaijan 82.4 60.8 36
18 Peru 78.4 79.5 -1
19 Bosnia and Herzegovina 75.1 42.2 78
20 Belgium 75 91.9 -18
24
Section 3
World overview
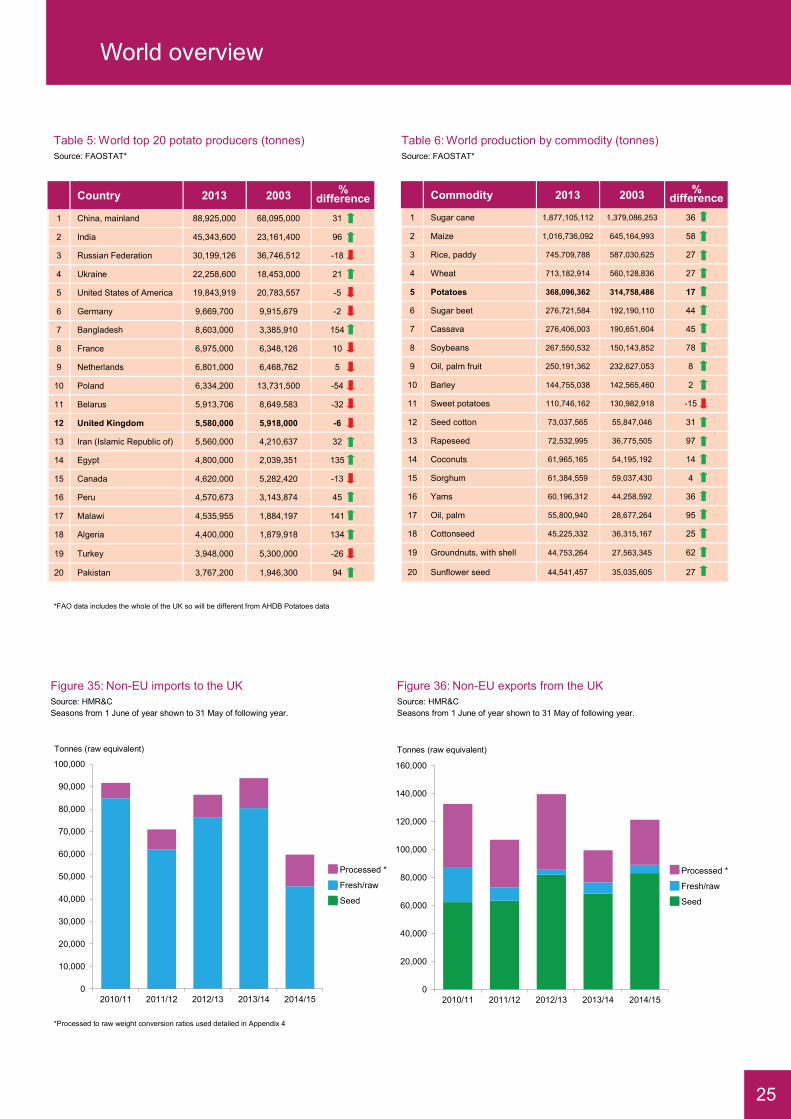
Table 5: World top 20 potato producers (tonnes)
Source: FAOSTAT*
Table 6: World production by commodity (tonnes)
Source: FAOSTAT*
Figure 35: Non-EU imports to the UK
Source: HMR&C
Seasons from 1 June of year shown to 31 May of following year.
Figure 36: Non-EU exports from the UK
Source: HMR&C
Seasons from 1 June of year shown to 31 May of following year.
*FAO data includes the whole of the UK so will be different from AHDB Potatoes data
Country 2013 2003 %
difference
1 China, mainland 88,925,000 68,095,000 31
2 India 45,343,600 23,161,400 96
3 Russian Federation 30,199,126 36,746,512 -18
4 Ukraine 22,258,600 18,453,000 21
5 United States of America 19,843,919 20,783,557 -5
6 Germany 9,669,700 9,915,679 -2
7 Bangladesh 8,603,000 3,385,910 154
8 France 6,975,000 6,348,126 10
9 Netherlands 6,801,000 6,468,762 5
10 Poland 6,334,200 13,731,500 -54
11 Belarus 5,913,706 8,649,583 -32
12 United Kingdom 5,580,000 5,918,000 -6
13 Iran (Islamic Republic of) 5,560,000 4,210,637 32
14 Egypt 4,800,000 2,039,351 135
15 Canada 4,620,000 5,282,420 -13
16 Peru 4,570,673 3,143,874 45
17 Malawi 4,535,955 1,884,197 141
18 Algeria 4,400,000 1,879,918 134
19 Turkey 3,948,000 5,300,000 -26
20 Pakistan 3,767,200 1,946,300 94
Commodity 2013 2003 %
difference
1 Sugar cane 1,877,105,112 1,379,086,253 36
2 Maize 1,016,736,092 645,164,993 58
3 Rice, paddy 745,709,788 587,030,625 27
4 Wheat 713,182,914 560,128,836 27
5 Potatoes 368,096,362 314,758,486 17
6 Sugar beet 276,721,584 192,190,110 44
7 Cassava 276,406,003 190,651,604 45
8 Soybeans 267,550,532 150,143,852 78
9 Oil, palm fruit 250,191,362 232,627,053 8
10 Barley 144,755,038 142,565,460 2
11 Sweet potatoes 110,746,162 130,982,918 -15
12 Seed cotton 73,037,565 55,847,046 31
13 Rapeseed 72,532,995 36,775,505 97
14 Coconuts 61,965,165 54,195,192 14
15 Sorghum 61,384,559 59,037,430 4
16 Yams 60,196,312 44,258,592 36
17 Oil, palm 55,800,940 28,677,264 95
18 Cottonseed 45,225,332 36,315,167 25
19 Groundnuts, with shell 44,753,264 27,563,345 62
20 Sunflower seed 44,541,457 35,035,605 27
25
0
20,000
40,000
60,000
80,000
100,000
120,000
140,000
160,000
2010/11 2011/12 2012/13 2013/14 2014/15
Processed *
Fresh/raw
Seed
Tonnes (raw equivalent)
0
10,000
20,000
30,000
40,000
50,000
60,000
70,000
80,000
90,000
100,000
2010/11 2011/12 2012/13 2013/14 2014/15
Processed *
Fresh/raw
Seed
*Processed to raw weight conversion ratios used detailed in Appendix 4
Tonnes (raw equivalent)
Appendices
Appendix 1: AHDB Potatoes Market Information Committee
AHDB Potatoes Market Information Committee’s (MIC) role
is to peer review Market Intelligence (MI) data and deliveries
in order to ensure that the information provided continues to
meet industry needs.
The Committee is made up of around 20 members including
potato growers, packers, processors, industry bodies, seed
suppliers and AHDB Potatoes colleagues. Committee members
are appointed for three years. Members are appointed in their
own right, to represent the potato industry, not particular sectors
or companies.
If you are interested in becoming a member of the Committee,
please contact Sara Maslowski, Senior Analyst at
[email protected] or telephone 024 7647 8953.
Further information, including a list of current members, is
available at: http://potatoes.ahdb.org.uk/about-us/governance/
committees/market-information-committee
More specifically, the functions of the MIC are:
To help identify industry needs and benefits
To help develop AHDB Potatoes strategies for
disseminating statistics and market information, and
for improving market knowledge and ensuring that
the most appropriate collection methods are used to
ensure statistical validity and relevance
To secure effective integration with the industry
To stimulate trade through objective and independent
information
To work with the AHDB MI team to ensure that sector
requirements are delivered in full and benefit from best
practice arising from the centralised function.
26

Appendices
Appendix 2: Data sources
Levy collection data (Planting and Merchant Return)
The Agriculture and Horticulture Development Board Order
2008 requires AHDB to raise levies relating to each sector.
Details can be found at the following web address:
www.ahdb.org.uk/about/LevyRates.aspx
The information provided in the Planting Return for grower
levy collection and the Merchant Return form for potato buyer
purchases for human consumption is not only used to
calculate area levies, but is also a very important source of
market intelligence. Using the return data avoids the need for
separate forms and helps save levy funds. The market sector
information gives us useful knowledge about the GB potato
market; it helps us develop our communication strategy and
enables us to provide information and feedback to growers in
a more targeted and cost-efficient manner.
Weekly Average Price Survey (WAPS)
The Weekly Average Price Survey provides top-line
economic indicators of the GB potato industry. The survey
consists of WAPS forms (purchaser data) and a field
telephone survey of growers and merchants. The WAPS
survey is open to all purchasers buying potatoes direct from
growers. A sample of purchasers complete a form each week
summarising total tonnage and value of purchases,
categorised by bags/bulk and contract/free-buy. For the field
telephone survey, the AHDB Market Intelligence price
collection contractor team collects weekly data of actual,
confirmed, free-buy sales from growers and merchants not
participating in the completion of WAPS purchaser forms.
Similar to the WAPS forms, details of total volume and value,
ex-farm, are collected. Both the WAPS forms and the field
survey are combined by the Market Intelligence team to
calculate the WAPS average price and free-buy average
price. This ensures that the WAPS index is as fair, robust
and representative as possible. This data is subject to
regular auditing to ensure accuracy.
Further information on joining the WAPS survey, is available
from the AHDB Market Intelligence department on 024 7647
8953.
The AHDB Potatoes Pricing Panel
The Panel is open to growers who wish to contribute price
information, to ensure wide and accurate coverage of the
pricing situation from week to week. A total of 200 regular
contacts – a combination of growers and purchasers – are
called on a weekly basis. These contacts represent the key
supply areas for the different markets of the potato supply
chain and varieties grown across different regions of GB.
AHDB Potatoes Grower Panel Survey
What is Grower Panel?
The AHDB Potatoes Grower Panel is a group of growers who
give information on seed use, yields and sale pathways from
selected fields under their management. The data is used to
provide national crop statistics on potato production.
What does the Grower Panel survey involve?
The survey involves completing a single form for each sample
crop. It covers seed and planting details, yields sold and
stored, sold price if known, wastage and intended markets and
sale dates. The form is sent out in the autumn for completion
and returned once the crop has been harvested. There is also
a storage stocks survey, involving completion of a single form
four times a year.
These forms can either be completed on paper or online via
the Grower Panel website at www.potato.org.uk/growerpanel
Survey members also participate in telephone surveys relative
to their potato crop and storage.
What are the benefits?
The information collected is used to provide key market
information about the potato industry and in doing so, supports
our levy payers in making informed business decisions.
How to get involved? Contact a member of the AHDB Market Intelligence Market Specialists team on 024 7647 8953.
Figure 37: Grower Panel crop
Source: AHDB Potatoes Grower Panel
27
Appendices
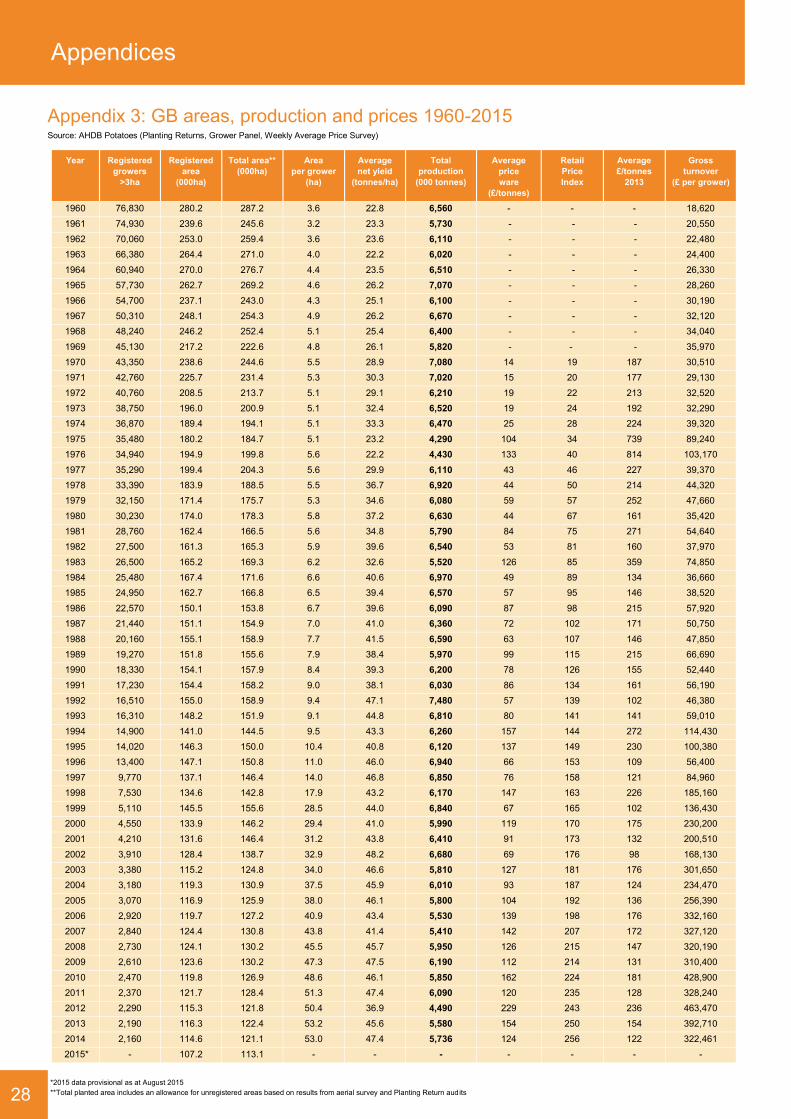
Appendix 3: GB areas, production and prices 1960-2015 Source: AHDB Potatoes (Planting Returns, Grower Panel, Weekly Average Price Survey)
*2015 data provisional as at August 2015
**Total planted area includes an allowance for unregistered areas based on results from aerial survey and Planting Return audits
Year Registered
growers
>3ha
Registered
area
(000ha)
Total area**
(000ha)
Area
per grower
(ha)
Average
net yield
(tonnes/ha)
Total
production
(000 tonnes)
Average
price
ware
(£/tonnes)
Retail
Price
Index
Average
£/tonnes
2013
Gross
turnover
(£ per grower)
1960 76,830 280.2 287.2 3.6 22.8 6,560 - - - 18,620
1961 74,930 239.6 245.6 3.2 23.3 5,730 - - - 20,550
1962 70,060 253.0 259.4 3.6 23.6 6,110 - - - 22,480
1963 66,380 264.4 271.0 4.0 22.2 6,020 - - - 24,400
1964 60,940 270.0 276.7 4.4 23.5 6,510 - - - 26,330
1965 57,730 262.7 269.2 4.6 26.2 7,070 - - - 28,260
1966 54,700 237.1 243.0 4.3 25.1 6,100 - - - 30,190
1967 50,310 248.1 254.3 4.9 26.2 6,670 - - - 32,120
1968 48,240 246.2 252.4 5.1 25.4 6,400 - - - 34,040
1969 45,130 217.2 222.6 4.8 26.1 5,820 - - - 35,970
1970 43,350 238.6 244.6 5.5 28.9 7,080 14 19 187 30,510
1971 42,760 225.7 231.4 5.3 30.3 7,020 15 20 177 29,130
1972 40,760 208.5 213.7 5.1 29.1 6,210 19 22 213 32,520
1973 38,750 196.0 200.9 5.1 32.4 6,520 19 24 192 32,290
1974 36,870 189.4 194.1 5.1 33.3 6,470 25 28 224 39,320
1975 35,480 180.2 184.7 5.1 23.2 4,290 104 34 739 89,240
1976 34,940 194.9 199.8 5.6 22.2 4,430 133 40 814 103,170
1977 35,290 199.4 204.3 5.6 29.9 6,110 43 46 227 39,370
1978 33,390 183.9 188.5 5.5 36.7 6,920 44 50 214 44,320
1979 32,150 171.4 175.7 5.3 34.6 6,080 59 57 252 47,660
1980 30,230 174.0 178.3 5.8 37.2 6,630 44 67 161 35,420
1981 28,760 162.4 166.5 5.6 34.8 5,790 84 75 271 54,640
1982 27,500 161.3 165.3 5.9 39.6 6,540 53 81 160 37,970
1983 26,500 165.2 169.3 6.2 32.6 5,520 126 85 359 74,850
1984 25,480 167.4 171.6 6.6 40.6 6,970 49 89 134 36,660
1985 24,950 162.7 166.8 6.5 39.4 6,570 57 95 146 38,520
1986 22,570 150.1 153.8 6.7 39.6 6,090 87 98 215 57,920
1987 21,440 151.1 154.9 7.0 41.0 6,360 72 102 171 50,750
1988 20,160 155.1 158.9 7.7 41.5 6,590 63 107 146 47,850
1989 19,270 151.8 155.6 7.9 38.4 5,970 99 115 215 66,690
1990 18,330 154.1 157.9 8.4 39.3 6,200 78 126 155 52,440
1991 17,230 154.4 158.2 9.0 38.1 6,030 86 134 161 56,190
1992 16,510 155.0 158.9 9.4 47.1 7,480 57 139 102 46,380
1993 16,310 148.2 151.9 9.1 44.8 6,810 80 141 141 59,010
1994 14,900 141.0 144.5 9.5 43.3 6,260 157 144 272 114,430
1995 14,020 146.3 150.0 10.4 40.8 6,120 137 149 230 100,380
1996 13,400 147.1 150.8 11.0 46.0 6,940 66 153 109 56,400
1997 9,770 137.1 146.4 14.0 46.8 6,850 76 158 121 84,960
1998 7,530 134.6 142.8 17.9 43.2 6,170 147 163 226 185,160
1999 5,110 145.5 155.6 28.5 44.0 6,840 67 165 102 136,430
2000 4,550 133.9 146.2 29.4 41.0 5,990 119 170 175 230,200
2001 4,210 131.6 146.4 31.2 43.8 6,410 91 173 132 200,510
2002 3,910 128.4 138.7 32.9 48.2 6,680 69 176 98 168,130
2003 3,380 115.2 124.8 34.0 46.6 5,810 127 181 176 301,650
2004 3,180 119.3 130.9 37.5 45.9 6,010 93 187 124 234,470
2005 3,070 116.9 125.9 38.0 46.1 5,800 104 192 136 256,390
2006 2,920 119.7 127.2 40.9 43.4 5,530 139 198 176 332,160
2007 2,840 124.4 130.8 43.8 41.4 5,410 142 207 172 327,120
2008 2,730 124.1 130.2 45.5 45.7 5,950 126 215 147 320,190
2009 2,610 123.6 130.2 47.3 47.5 6,190 112 214 131 310,400
2010 2,470 119.8 126.9 48.6 46.1 5,850 162 224 181 428,900
2011 2,370 121.7 128.4 51.3 47.4 6,090 120 235 128 328,240
2012 2,290 115.3 121.8 50.4 36.9 4,490 229 243 236 463,470
2013 2,190 116.3 122.4 53.2 45.6 5,580 154 250 154 392,710
2014 2,160 114.6 121.1 53.0 47.4 5,736 124 256 122 322,461
2015* - 107.2 113.1 - - - - - - -
28
Appendices
Appendix 4: Glossary
Conversion rates
The following ratios have been used to convert processed
potato product weight to raw equivalent tonnage:
2014-2015 – Canned 1:1, Crisped 3.5:1, Dehydrated 6:1,
Frozen/Chilled 1.8:1.
Earlies
Refers to all potatoes harvested on or before 31 July each
year.
Fresh
Raw consumption potatoes.
Maincrop
Potatoes are considered as maincrop if harvested after the
end of July each year.
Meal occasions
Numbers of times that a particular food is eaten as part of a
meal.
Plantings
All references to plantings refer to the measurement of
planted area. Refers either to Registered Area from
registered producers or Total Area, which includes an
allowance for undeclared/unregistered area.
Pre-pack
Washed potatoes in bags.
Prices
All prices are ex-farm.
Processed
Unless stated, references to processed products have been
converted to their raw equivalent tonnages.
Trend
In this context, the word trend is used to highlight the line or
curve of best fit.
Years
All crop years are June/May, unless otherwise stated.
Yields
All potato yields quoted in this publication relate to harvested
tonnage and are expressed in terms of tonnes per hectare.
29
Appendices
Contacts
We are always keen for feedback on the outputs and information that we provide in order to ensure that we continue to meet industry needs. To give us your feedback on the report or for further information about our Market Intelligence services, please contact:
Sara Maslowski Senior Analyst, Market Specialists T: 024 7647 8953 E: [email protected]
Arthur Marshall Analyst, Market Specialists T: 024 7647 8956 E: [email protected]
Rebecca Hughes Analyst, Consumer Insight T: 024 7647 8700 E: [email protected]
www.ahdb.org.uk ahdb.potatoes.org.uk
30

AHDB Potatoes, Agriculture and
Horticulture Development Board
Stoneleigh Park, Kenilworth
Warwickshire CV8 2TL
Tel: 024 7669 2051
Web: potatoes.ahdb.org.uk
Twitter: @AHDBPotatoes
© Agriculture and Horticulture
Development Board 2015.
All rights reserved.
AHDB Potatoes is a division of
the Agriculture and Horticulture
Development Board.
Compiled by the AHDB Potato Market Intelligence
team. The aim of this annual potato publication is
to provide trusted, key information about the GB
potato market, in order to inform decision-making
and provide answers for common questions about
the industry.
potatoes.ahdb.org.uk
While the Agriculture and Horticulture Development Board seeks to ensure that the information contained within this document is accurate at the time of
publishing, no warranty is given in respect thereof and, to the maximum extent permitted by law, the Agriculture and Horticulture Development Board accepts
no liability for loss, damage or injury howsoever caused (including that caused by negligence) or suffered directly or indirectly in relation to information and
opinions contained in or omitted from this document.