CropManage: Online and Management Tool
31
CropManage: Online Irrigation and Nutrient Management Tool Management Tool Web‐Based Software for Lettuce Production Michael Cahn Irrigation and Water Resources Advisor University of California, Cooperative, Monterey Co
Transcript of CropManage: Online and Management Tool

CropManage: Online Irrigation and Nutrient Management ToolManagement Tool
Web‐Based Software for Lettuce Production
Michael CahnIrrigation and Water Resources AdvisorUniversity of California, Cooperative, Monterey Co

Acknowledgements
Tim Hartz Richard SmithTim Hartz, Richard SmithCalifornia Department of Food and Agriculture, Fertilizer Research and Education ProgramFertilizer Research and Education ProgramUC ANR Communication Services, Bryon NoelGrower participantsGrower participantsChiquita FreshExpressTanimura and AntleTanimura and Antle

Lower Salinas Nutrient TMDLSalinas Valley Basin Plan
Ag OrderSWRCB SBX2 1

Tools for Managing Water and Nitrogen F ili i LFertilizer in Lettuce
soil nitrate quick test (20 NO N 70 80 lb f N/ /f )(20 ppm NO3‐N = 70 to 80 lbs of N/acre/ft)
Weather‐based irrigation scheduling

Commercial Lettuce Nitrogen Fertilizer Trials
2 0
300 Standard BMP
d lb /200
250
/A
Std: 212 lbs N/AcreBMP: 146 lbs N/Acre
100
150
lbs
N
Difference 66 lbs/A
0
50 30% reduction in N fertilizer
0
1 2 3 4 5 6 AveField

Applied Water as Percentage of Crop ET (Lettuce)
) 300
350Crop ET (Lettuce)
Cro
p ET
)
250
300 Avg Applied Water = 176% of Crop ET
ater
(% C
150
200
pplie
d W
a
100
150
Ap
0
50
Field Number
1 3 5 7 9 11 13 15 17 19

Weather‐based Irrigation Scheduling
Converting Reference ET to Crop ET:
ETcrop = ETref × Kcrop
Kc can vary from 0.1 to 1.2
CIMIS weather networkCIMIS weather network

29 DAP 41 DAP
1.0sprinkler irrigation events
Estimated Kc of Lettuceie
nt (K
c)
0 6
0.8
47 DAP 65 DAP
op C
oeffi
c
0.4
0.6
SprinklerDrip
Cro
0.0
0.2 Average Kc = 0.33 during germination with sprinklers
Days after Planting
0 20 40 60 80

Other information needs to be consideredIrrigation System UniformityIrrigation System Uniformity
and Application RateRooting Depth
Salinity of Water SourceSoil Type

How can water and N management tools be useful for large vegetable growing operations?useful for large vegetable growing operations?
Large growing operations have multiple decision makersmakers One farm manager may be responsible for >200 fields during a seasonfields during a seasonOther responsibilities besides water and fertilizer N managementN management

Web‐based Irrigation and N management software for lettuce
https://ucanr.edu/cropmanage

CropManage Web‐based Tool:Assist growers in making decisions on irrigation and nitrogen fertilizer management
Intuitive, simple, quick to use.Accessible from smart phone, tablet computer,Accessible from smart phone, tablet computer,
desktop computerGuide irrigation schedules using CIMIS weatherGuide irrigation schedules using CIMIS weather
data. Guide nitrogen fertilization decisions using quickGuide nitrogen fertilization decisions using quick
nitrate test data.Maintain and share irrigation, fertilizer, and soilMaintain and share irrigation, fertilizer, and soil
test records for multiple fields and farms.

Integrate information from multiple sources
Crop ET modelWatering Recommendation
Soil and Ranch
Database driven web N fertilizer
Recommendationapplication
Crop N model
RecommendationCIMIS ETo
Record display and data export
Field sensorsSoil nitrate test
p
Decision support using crop models

How is N fertilizer rate determinedHow is N fertilizer rate determined from the quick nitrate test?
Future Crop N uptakeFertilizer N =
– (Quick Test N ‐ threshold NO3‐N)
– Soil mineralization N
– Plant residue N
80
100
80
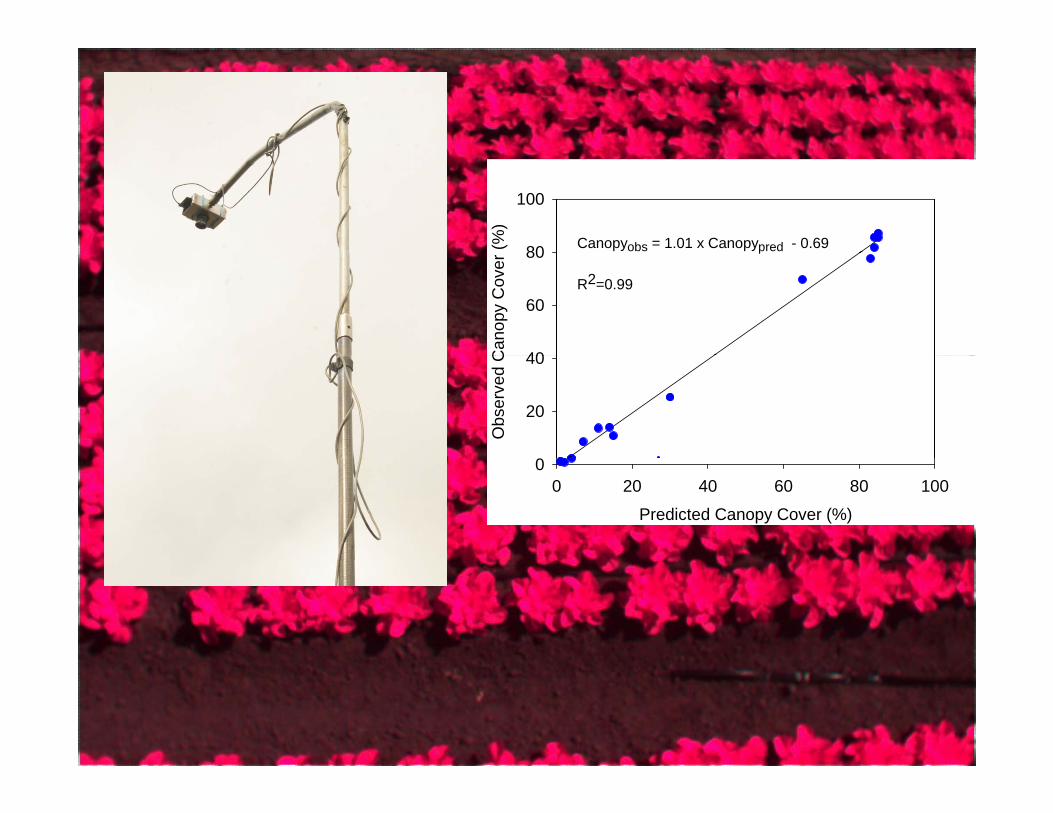
100Iceberg lettuce canopy cover
(%)
80
100
Canopyobs = 1.01 x Canopypred - 0.69(%)
80
100
Canopyobs = 1.01 x Canopypred - 0.69
py C
over
(%)
40
60
80
py C
over
(%)
40
60
80
Can
opy
Cov
er
40
60
80 p
R2=0.99
Can
opy
Cov
er
40
60
80 p
R2=0.99
Can
op
0
20
40
Can
op
0
20
40
Obs
erve
d C
0
20
40
Obs
erve
d C
0
20
40
Days after Planting
0 10 20 30 40 50 60 700
Days after Planting
0 10 20 30 40 50 60 700
Predicted Canopy Cover (%)
0 20 40 60 80 1000
Predicted Canopy Cover (%)
0 20 40 60 80 1000

Spatial CIMIS ETo Reporting

Interface with UCD SoilWeb Tool

How much water was applied?

Evaluate and Document Water Management
s) 12s) 16
er (i
nche
s
10
12
CropManage RecommendationGrower Application
er (i
nche
s
12
14
16
CropManage RecommendationGrower Application
ied
Wat
e
6
8
ied
Wat
e
8
10
12
tive
Appl
i
4
tive
App
l
4
6
Cum
ulat
0
2
Cum
ulat
0
2
Days after Planting
0 10 20 30 40 50 60Days after Planting
0 10 20 30 40 50 60

Steps to Using CropManageSteps to Using CropManage
1. Establish User Login2. Assign to Ranch or start New
Ranch3. View Planting within Ranch or
Add New Planting4. View or enter soil tests, fertilizer,
or irrigation events

UC Security and Privacy Policy
1. CropManage is designed to protect the privacy of grower data.
2. Current industry security standards are used (backed up to 2 other servers, encryption, secure security socket layer).
3. UC does not give out/sell grower data and is not obligated to give out data.
4. UC will not analyze grower data without first asking for permission.


Ranch Summary

Soil Summary
Fertilizer Summary

Water Summary Table

Field Validation of CropManage
Treatment sprinkler drip1Applied water Commercial
YieldTreatment sprinkler driplbs/acre
Grower Standard 4.1 4.9 17935inches
Yield
CropManage 4.1 3.8 183891 comparison was on last 7 irrigations
TreatmentApplied N Fertilizer
Commercial Yield
------- lbs per acre --------Grower Standard 211 19114CropManage 149 18760

The road ahead…

Soil moisture monitoring
)
0
sion
(cba
rs10
istu
re te
ns
20
soil
mo 30 8 inches
18 inches
Date
9-16 9-18 9-20 9-22 9-24 9-26 9-28 9-30 40

User Support: CropManage Blog


Final Thoughts
Web applications can repackage complex data sets andWeb applications can repackage complex data sets and mathematical models into simple to use decision support tools
CropManage is not just for growers. It is a potential tool f lfor crop consultants and advisers to use in assisting growers with water and N management decisions.
We will offer 2 hour training workshops on CropManage on March 13 and April 2, 2013.p ,