Final Report ICP2 Online Tool User Guidelaportal.wrap.org.uk/Documents/ICP online tool user...
19
Final Report ICP2 – Online Tool User Guide This report explains how to use the ICP2 online tool Date: May 2015
Transcript of Final Report ICP2 Online Tool User Guidelaportal.wrap.org.uk/Documents/ICP online tool user...
Final Report
ICP2 – Online Tool User Guide
This report explains how to use the ICP2 online tool
Date: May 2015
WRAP’s vision is a world in which resources are used sustainably. Our mission is to accelerate the move to a sustainable resource-efficient economy through re-inventing how we design, produce and sell products; re-thinking how we use and consume products; and re-defining what is possible through re-use and recycling.
Find out more at www.wrap.org.uk
Document reference (please use this reference when citing WRAP’s work):
[WRAP, 2015, Banbury, ICP2 – Online Tool User Guide, Prepared by WRAP]
Document reference: [e.g. WRAP, 2006, Report Name (WRAP Project TYR009-19. Report prepared by…..Banbury, WRAP]
Written by: WRAP
Front cover photography: Images from ICP2 Online Tool
While we have tried to make sure this report is accurate, we cannot accept responsibility or be held legally responsible for any loss or damage arising out of or in
connection with this information being inaccurate, incomplete or misleading. This material is copyrighted. You can copy it free of charge as long as the material is
accurate and not used in a misleading context. You must identify the source of the material and acknowledge our copyright. You must not use material to endorse or
suggest we have endorsed a commercial product or service. For more details please see our terms and conditions on our website at www.wrap.org.uk
ICP2 – Online Tool User Guide 3
Contents
1.0 About ICP2 ................................................................................................... 4 2.0 Tool structure ............................................................................................... 4 3.0 Scenarios modelled ...................................................................................... 6 4.0 How to use the ICP2 online tool ................................................................. 10 5.0 Interpretting results ................................................................................... 13
5.1 Results Table ........................................................................................... 14 5.2 Graph ..................................................................................................... 16
ICP2 – Online Tool User Guide 4
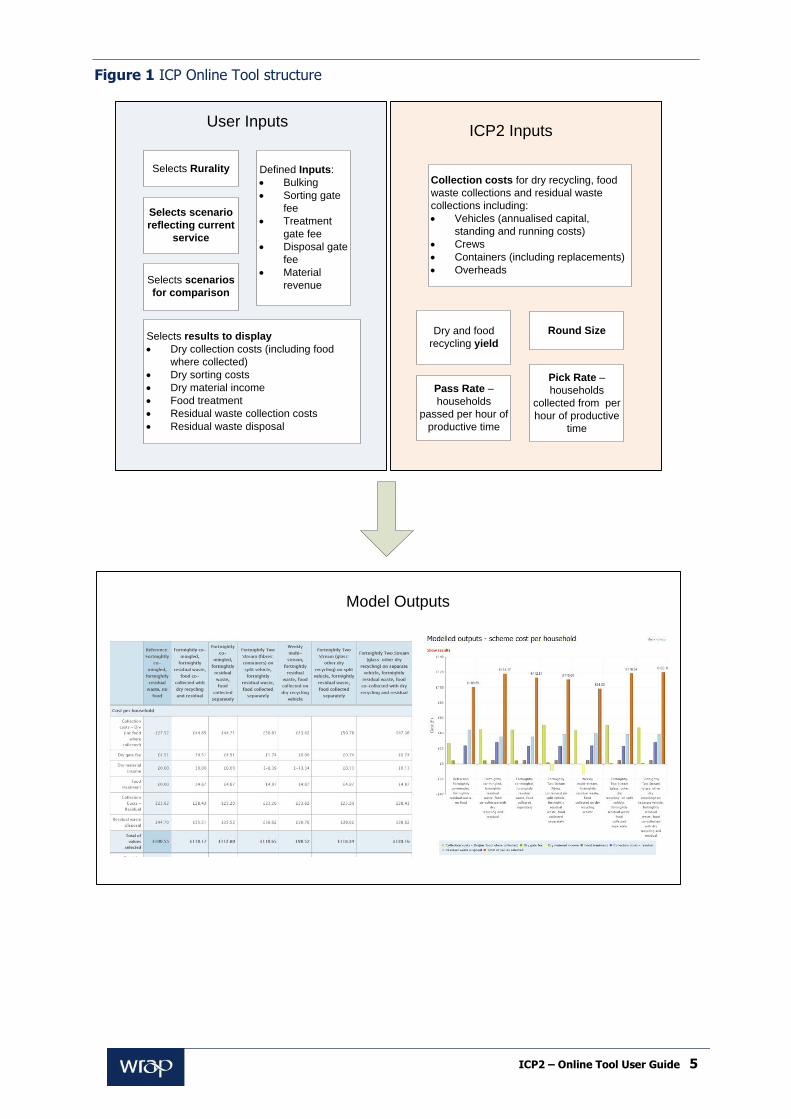
1.0 About ICP2 In 2008, WRAP published Kerbside Recycling: Indicative Costs and Performance (ICP) which provided a systematic appraisal of the characteristics of the principal kerbside recycling collection systems looking at both their cost and effectiveness. The outputs from that project have been widely used. The continued use of those outputs by Local Authorities, the development of new types of recycling services, combined with improved knowledge around scheme performance and costs, resulted in a need to update the project (ICP2). Both ICP and ICP2 were Defra funded and therefore covers English authorities only. The aim of the update is to produce a series of benchmark costs and standard operational data, through service modelling, that local authorities can use when evaluating their current recycling service and considering service changes. The resultant benchmarks are based on the performance (yields of food and dry recycling) and cost of a modelled good practice system operated across a range of geographical areas. The online tool takes the operational outputs and collection costs from the ICP2 modelling and allows users to localise the outputs by applying their own gate fees, bulking costs, disposal costs and material revenues to produce an overall scenario cost.. The localised scenarios are displayed in a table and a graph. This document provides a user guide to the online tool. Detailed information around assumptions used in the ICP2 modelling is provided in ICP2 – Online Tool Modelling Assumptions Technical Annex. 2.0 Tool structure The online tool combines inputs and selections from the user, with modelling outputs from ICP to produce cost and operational data outputs. The overall structure of the approach is shown below. Section 4.0 gives a step-by-step guide on using the model.
ICP2 – Online Tool User Guide 5
Figure 1 ICP Online Tool structure
Selects Rurality
Selects scenario
reflecting current
service
Selects scenarios
for comparison
Defined Inputs:
· Bulking
· Sorting gate
fee
· Treatment
gate fee
· Disposal gate
fee
· Material
revenue
Selects results to display
· Dry collection costs (including food
where collected)
· Dry sorting costs
· Dry material income
· Food treatment
· Residual waste collection costs
· Residual waste disposal
User InputsICP2 Inputs
Collection costs for dry recycling, food
waste collections and residual waste
collections including:
· Vehicles (annualised capital,
standing and running costs)
· Crews
· Containers (including replacements)
· Overheads
Dry and food
recycling yield
Round Size
Pass Rate –
households
passed per hour of
productive time
Pick Rate –
households
collected from per
hour of productive
time
Model Outputs
ICP2 – Online Tool User Guide 6
3.0 Scenarios modelled Dry recycling schemes fall into 3 main scheme types:
Single Stream Co-mingled (SS)
All materials are collected together in one compartment on the same vehicle and require sorting at a MRF (Materials Recovery Facility).
Two-stream (TS)
Materials are collected as two material streams, typically either fibres and containers, or glass separate to other mixed material. At least one of the streams requires sorting at a MRF.
Multi-stream (MS)
Materials are separated by the householder or, on collection at the kerbside, into multiple
material streams. The material streams may include a selected mix of some materials,
typically cans and plastics, which are commonly separated using basic sorting facilities at the
operating depot or sold to reprocessors as a mixed commodity.
18 scenarios are included in ICP2. The scenarios are split into 3 groups based on residual frequency and food waste collections and are detailed in the 3 tables below:
ICP2 – Online Tool User Guide 7
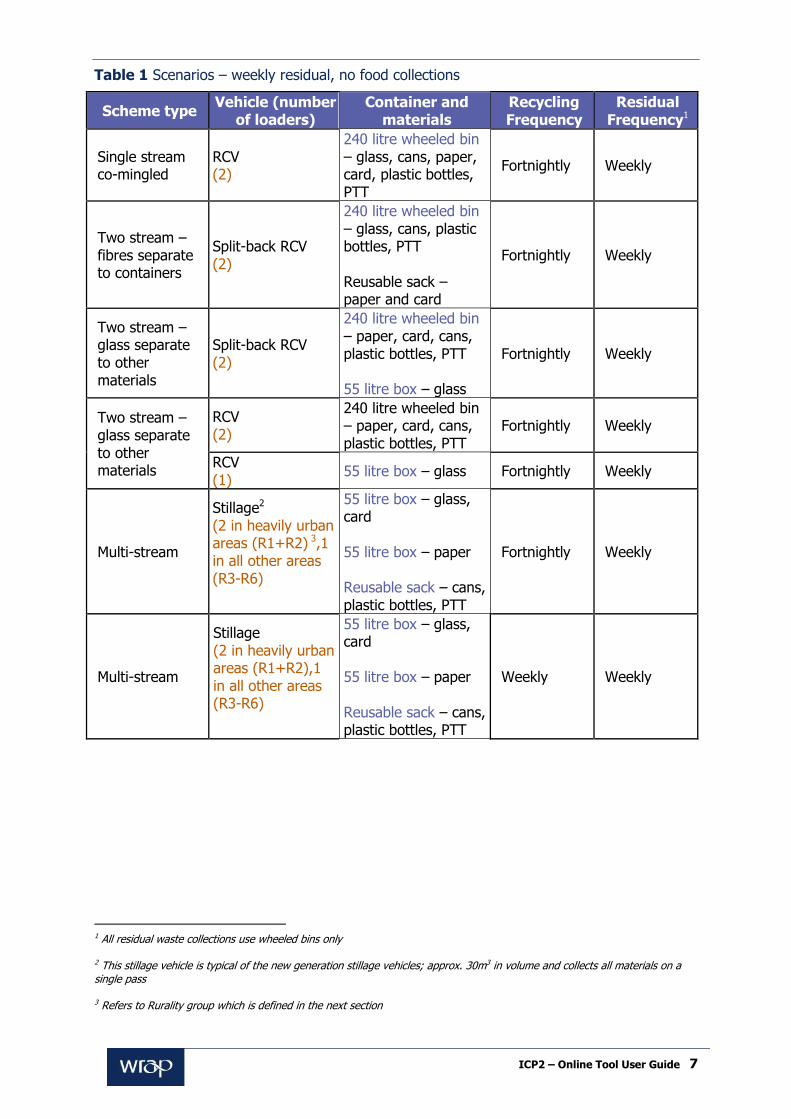
Table 1 Scenarios – weekly residual, no food collections
Scheme type Vehicle (number
of loaders) Container and
materials Recycling Frequency
Residual Frequency1
Single stream co-mingled
RCV (2)
240 litre wheeled bin – glass, cans, paper, card, plastic bottles, PTT
Fortnightly Weekly
Two stream – fibres separate to containers
Split-back RCV (2)
240 litre wheeled bin – glass, cans, plastic bottles, PTT Reusable sack – paper and card
Fortnightly Weekly
Two stream – glass separate to other materials
Split-back RCV (2)
240 litre wheeled bin – paper, card, cans, plastic bottles, PTT 55 litre box – glass
Fortnightly Weekly
Two stream – glass separate to other materials
RCV (2)
240 litre wheeled bin – paper, card, cans, plastic bottles, PTT
Fortnightly Weekly
RCV (1)
55 litre box – glass Fortnightly Weekly
Multi-stream
Stillage2 (2 in heavily urban areas (R1+R2) 3,1 in all other areas (R3-R6)
55 litre box – glass, card 55 litre box – paper Reusable sack – cans, plastic bottles, PTT
Fortnightly Weekly
Multi-stream
Stillage (2 in heavily urban areas (R1+R2),1 in all other areas (R3-R6)
55 litre box – glass, card 55 litre box – paper Reusable sack – cans, plastic bottles, PTT
Weekly Weekly
1 All residual waste collections use wheeled bins only
2 This stillage vehicle is typical of the new generation stillage vehicles; approx. 30m3 in volume and collects all materials on a single pass
3 Refers to Rurality group which is defined in the next section
ICP2 – Online Tool User Guide 8
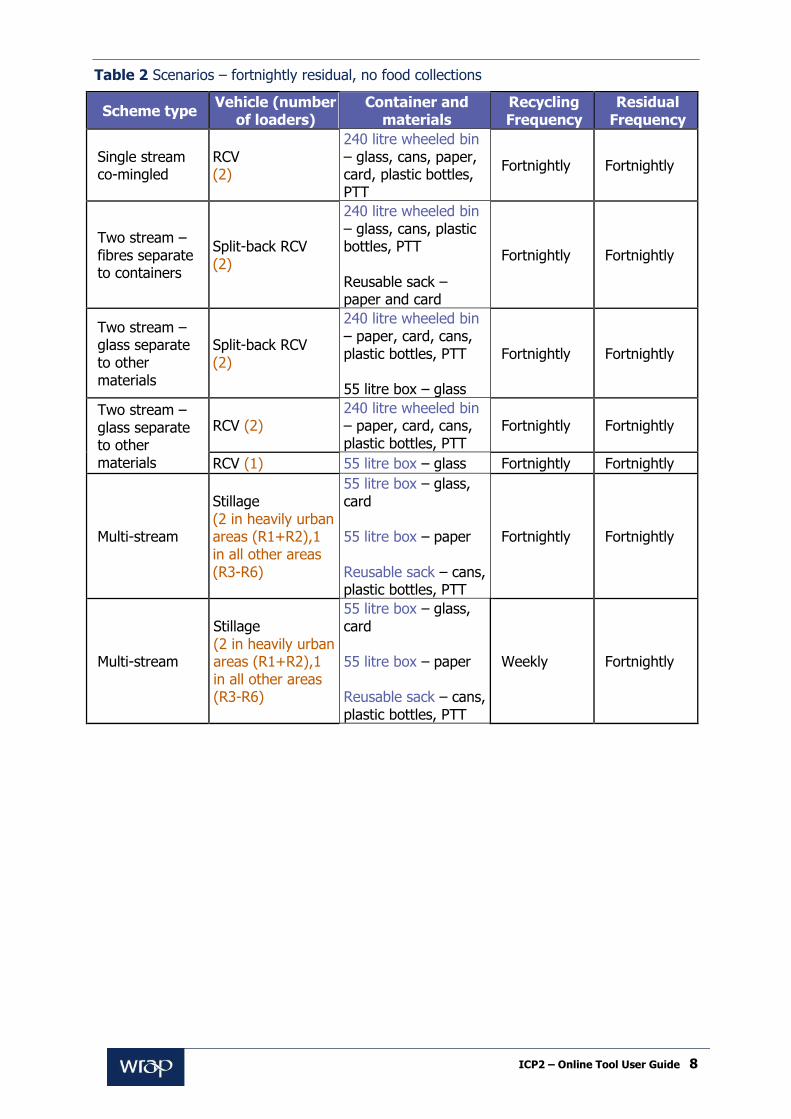
Table 2 Scenarios – fortnightly residual, no food collections
Scheme type Vehicle (number
of loaders) Container and
materials Recycling Frequency
Residual Frequency
Single stream co-mingled
RCV (2)
240 litre wheeled bin – glass, cans, paper, card, plastic bottles, PTT
Fortnightly Fortnightly
Two stream – fibres separate to containers
Split-back RCV (2)
240 litre wheeled bin – glass, cans, plastic bottles, PTT Reusable sack – paper and card
Fortnightly Fortnightly
Two stream – glass separate to other materials
Split-back RCV (2)
240 litre wheeled bin – paper, card, cans, plastic bottles, PTT 55 litre box – glass
Fortnightly Fortnightly
Two stream – glass separate to other materials
RCV (2) 240 litre wheeled bin – paper, card, cans, plastic bottles, PTT
Fortnightly Fortnightly
RCV (1) 55 litre box – glass Fortnightly Fortnightly
Multi-stream
Stillage (2 in heavily urban areas (R1+R2),1 in all other areas (R3-R6)
55 litre box – glass, card 55 litre box – paper Reusable sack – cans, plastic bottles, PTT
Fortnightly Fortnightly
Multi-stream
Stillage (2 in heavily urban areas (R1+R2),1 in all other areas (R3-R6)
55 litre box – glass, card 55 litre box – paper Reusable sack – cans, plastic bottles, PTT
Weekly Fortnightly
ICP2 – Online Tool User Guide 9
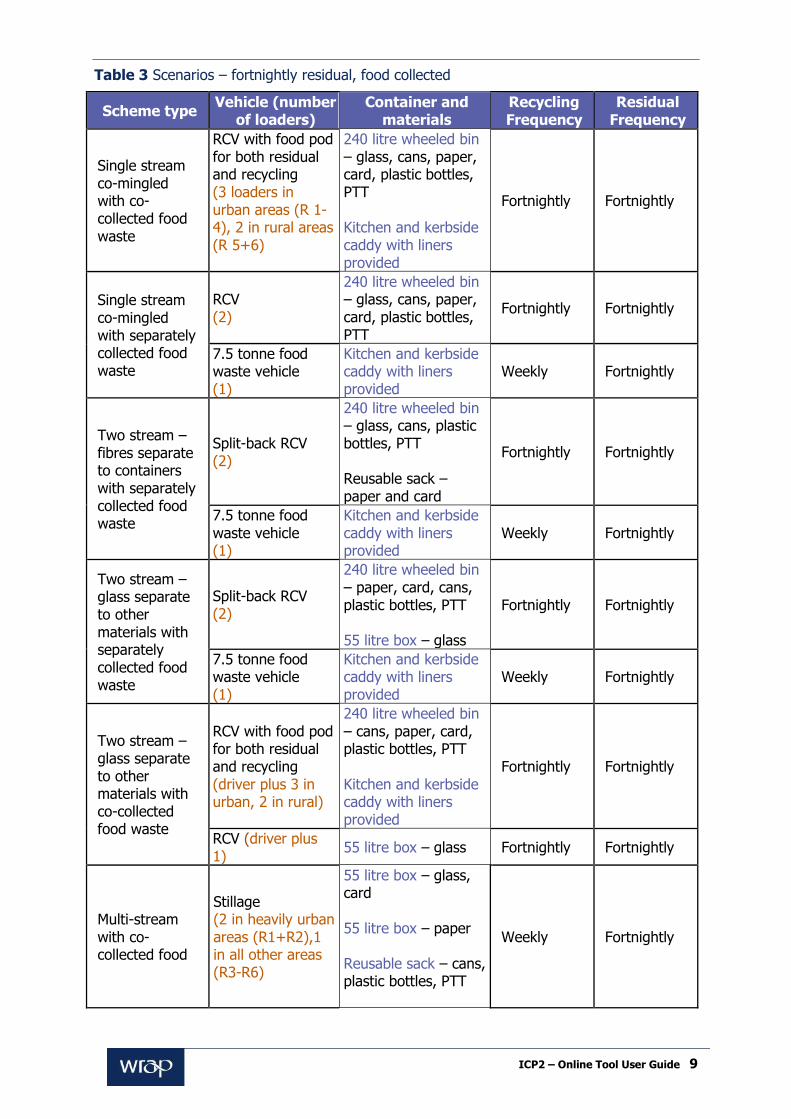
Table 3 Scenarios – fortnightly residual, food collected
Scheme type Vehicle (number
of loaders) Container and
materials Recycling Frequency
Residual Frequency
Single stream co-mingled with co-collected food waste
RCV with food pod for both residual and recycling (3 loaders in urban areas (R 1-4), 2 in rural areas (R 5+6)
240 litre wheeled bin – glass, cans, paper, card, plastic bottles, PTT Kitchen and kerbside caddy with liners provided
Fortnightly Fortnightly
Single stream co-mingled with separately collected food waste
RCV (2)
240 litre wheeled bin – glass, cans, paper, card, plastic bottles, PTT
Fortnightly Fortnightly
7.5 tonne food waste vehicle (1)
Kitchen and kerbside caddy with liners provided
Weekly Fortnightly
Two stream – fibres separate to containers with separately collected food waste
Split-back RCV (2)
240 litre wheeled bin – glass, cans, plastic bottles, PTT Reusable sack – paper and card
Fortnightly Fortnightly
7.5 tonne food waste vehicle (1)
Kitchen and kerbside caddy with liners provided
Weekly Fortnightly
Two stream – glass separate to other materials with separately collected food waste
Split-back RCV (2)
240 litre wheeled bin – paper, card, cans, plastic bottles, PTT 55 litre box – glass
Fortnightly Fortnightly
7.5 tonne food waste vehicle (1)
Kitchen and kerbside caddy with liners provided
Weekly Fortnightly
Two stream – glass separate to other materials with co-collected food waste
RCV with food pod for both residual and recycling (driver plus 3 in urban, 2 in rural)
240 litre wheeled bin – cans, paper, card, plastic bottles, PTT Kitchen and kerbside caddy with liners provided
Fortnightly Fortnightly
RCV (driver plus 1)
55 litre box – glass Fortnightly Fortnightly
Multi-stream with co-collected food
Stillage (2 in heavily urban areas (R1+R2),1 in all other areas (R3-R6)
55 litre box – glass, card 55 litre box – paper Reusable sack – cans, plastic bottles, PTT
Weekly Fortnightly
ICP2 – Online Tool User Guide 10
Kitchen and kerbside caddy with liners provided
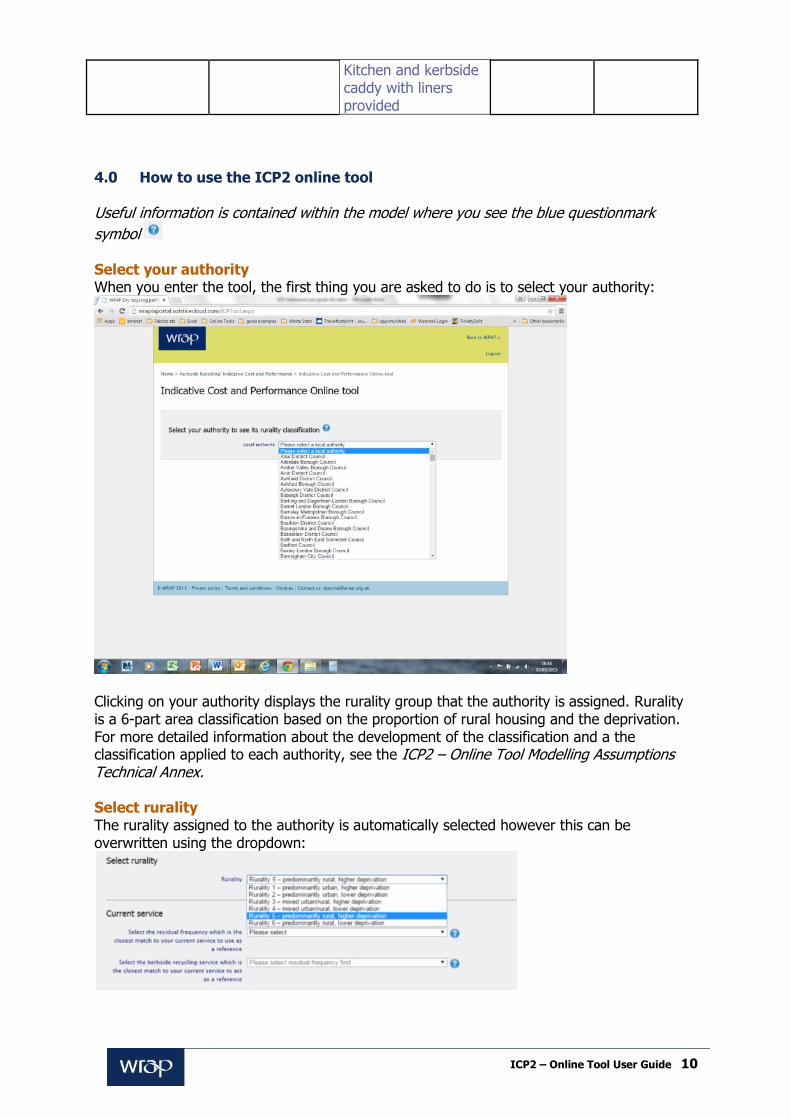
4.0 How to use the ICP2 online tool Useful information is contained within the model where you see the blue questionmark
symbol Select your authority When you enter the tool, the first thing you are asked to do is to select your authority:
Clicking on your authority displays the rurality group that the authority is assigned. Rurality is a 6-part area classification based on the proportion of rural housing and the deprivation. For more detailed information about the development of the classification and a the classification applied to each authority, see the ICP2 – Online Tool Modelling Assumptions Technical Annex. Select rurality The rurality assigned to the authority is automatically selected however this can be overwritten using the dropdown:
ICP2 – Online Tool User Guide 11
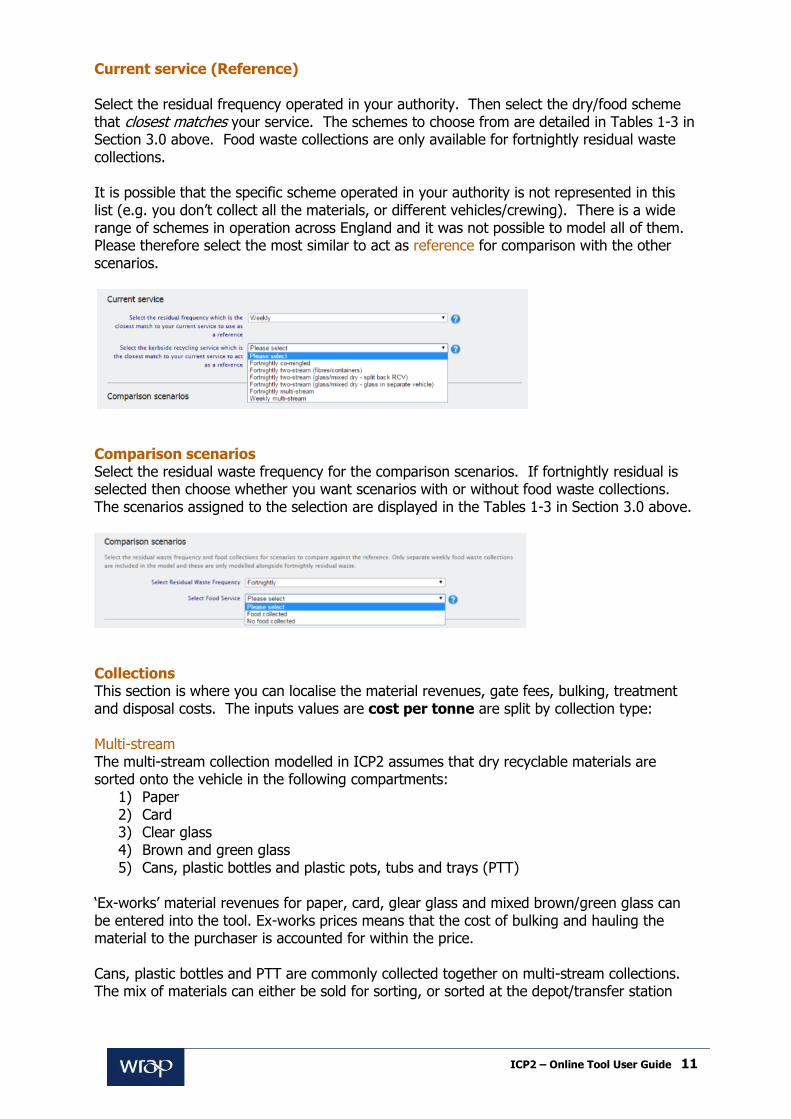
Current service (Reference) Select the residual frequency operated in your authority. Then select the dry/food scheme that closest matches your service. The schemes to choose from are detailed in Tables 1-3 in Section 3.0 above. Food waste collections are only available for fortnightly residual waste collections. It is possible that the specific scheme operated in your authority is not represented in this list (e.g. you don’t collect all the materials, or different vehicles/crewing). There is a wide range of schemes in operation across England and it was not possible to model all of them. Please therefore select the most similar to act as reference for comparison with the other scenarios.
Comparison scenarios Select the residual waste frequency for the comparison scenarios. If fortnightly residual is selected then choose whether you want scenarios with or without food waste collections. The scenarios assigned to the selection are displayed in the Tables 1-3 in Section 3.0 above.
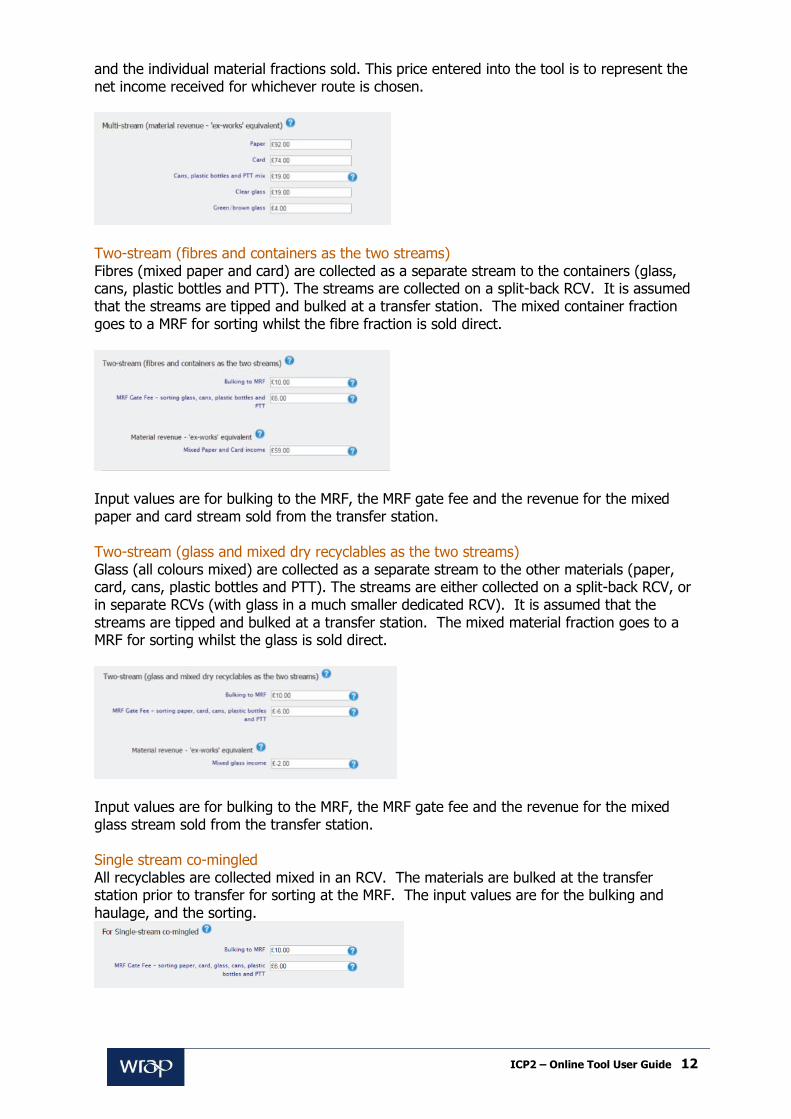
Collections This section is where you can localise the material revenues, gate fees, bulking, treatment and disposal costs. The inputs values are cost per tonne are split by collection type: Multi-stream The multi-stream collection modelled in ICP2 assumes that dry recyclable materials are sorted onto the vehicle in the following compartments:
1) Paper 2) Card 3) Clear glass 4) Brown and green glass 5) Cans, plastic bottles and plastic pots, tubs and trays (PTT)
‘Ex-works’ material revenues for paper, card, glear glass and mixed brown/green glass can be entered into the tool. Ex-works prices means that the cost of bulking and hauling the material to the purchaser is accounted for within the price. Cans, plastic bottles and PTT are commonly collected together on multi-stream collections. The mix of materials can either be sold for sorting, or sorted at the depot/transfer station
ICP2 – Online Tool User Guide 12
and the individual material fractions sold. This price entered into the tool is to represent the net income received for whichever route is chosen.
Two-stream (fibres and containers as the two streams) Fibres (mixed paper and card) are collected as a separate stream to the containers (glass, cans, plastic bottles and PTT). The streams are collected on a split-back RCV. It is assumed that the streams are tipped and bulked at a transfer station. The mixed container fraction goes to a MRF for sorting whilst the fibre fraction is sold direct.
Input values are for bulking to the MRF, the MRF gate fee and the revenue for the mixed paper and card stream sold from the transfer station. Two-stream (glass and mixed dry recyclables as the two streams) Glass (all colours mixed) are collected as a separate stream to the other materials (paper, card, cans, plastic bottles and PTT). The streams are either collected on a split-back RCV, or in separate RCVs (with glass in a much smaller dedicated RCV). It is assumed that the streams are tipped and bulked at a transfer station. The mixed material fraction goes to a MRF for sorting whilst the glass is sold direct.
Input values are for bulking to the MRF, the MRF gate fee and the revenue for the mixed glass stream sold from the transfer station. Single stream co-mingled All recyclables are collected mixed in an RCV. The materials are bulked at the transfer station prior to transfer for sorting at the MRF. The input values are for the bulking and haulage, and the sorting.
ICP2 – Online Tool User Guide 13
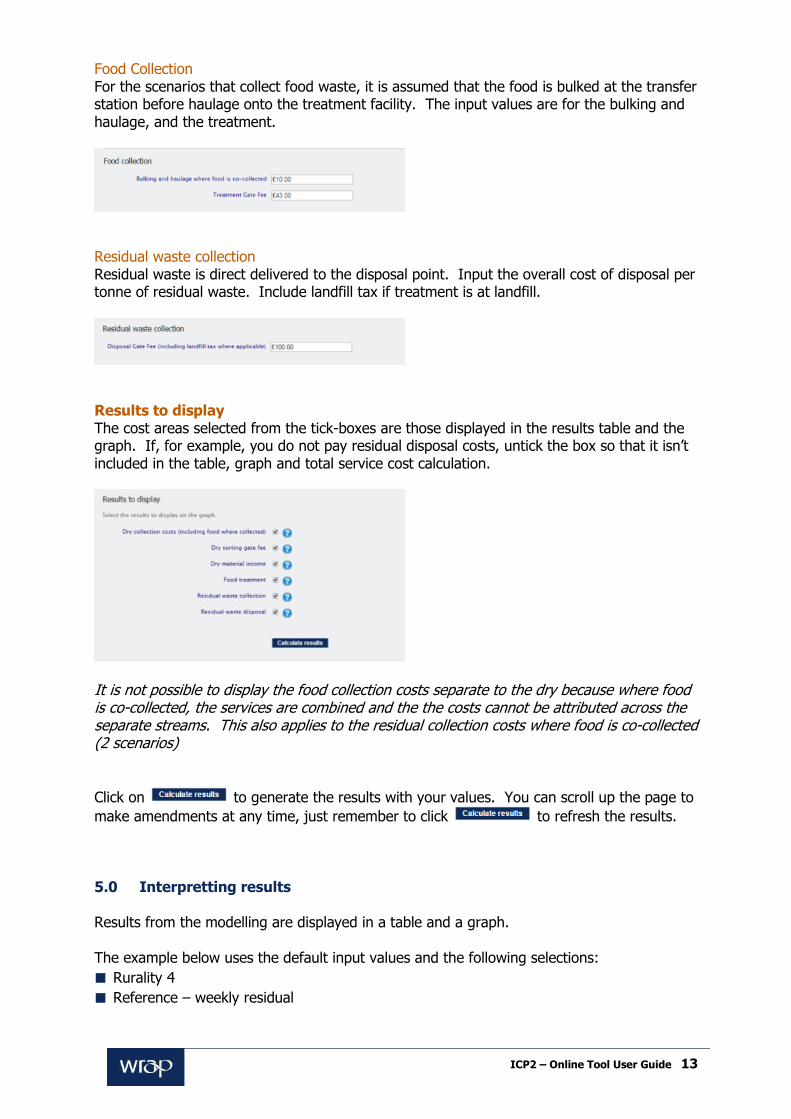
Food Collection For the scenarios that collect food waste, it is assumed that the food is bulked at the transfer station before haulage onto the treatment facility. The input values are for the bulking and haulage, and the treatment.
Residual waste collection Residual waste is direct delivered to the disposal point. Input the overall cost of disposal per tonne of residual waste. Include landfill tax if treatment is at landfill.
Results to display The cost areas selected from the tick-boxes are those displayed in the results table and the graph. If, for example, you do not pay residual disposal costs, untick the box so that it isn’t included in the table, graph and total service cost calculation.
It is not possible to display the food collection costs separate to the dry because where food is co-collected, the services are combined and the the costs cannot be attributed across the separate streams. This also applies to the residual collection costs where food is co-collected (2 scenarios)
Click on to generate the results with your values. You can scroll up the page to
make amendments at any time, just remember to click to refresh the results. 5.0 Interpretting results Results from the modelling are displayed in a table and a graph. The example below uses the default input values and the following selections:
Rurality 4
Reference – weekly residual
ICP2 – Online Tool User Guide 14
Reference – fortnightly co-mingled
Comparison – fortnightly residual
Comparison – food collected
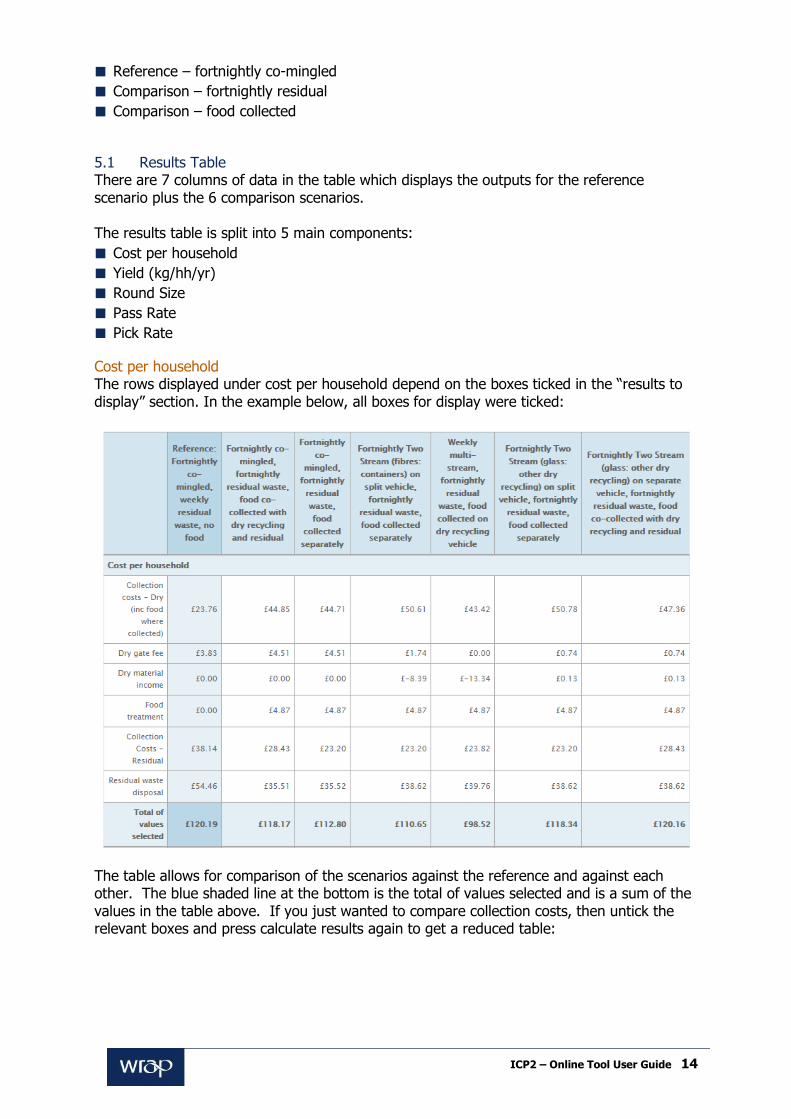
5.1 Results Table There are 7 columns of data in the table which displays the outputs for the reference scenario plus the 6 comparison scenarios. The results table is split into 5 main components:
Cost per household
Yield (kg/hh/yr)
Round Size
Pass Rate
Pick Rate
Cost per household The rows displayed under cost per household depend on the boxes ticked in the “results to display” section. In the example below, all boxes for display were ticked:
The table allows for comparison of the scenarios against the reference and against each other. The blue shaded line at the bottom is the total of values selected and is a sum of the values in the table above. If you just wanted to compare collection costs, then untick the relevant boxes and press calculate results again to get a reduced table:
ICP2 – Online Tool User Guide 15
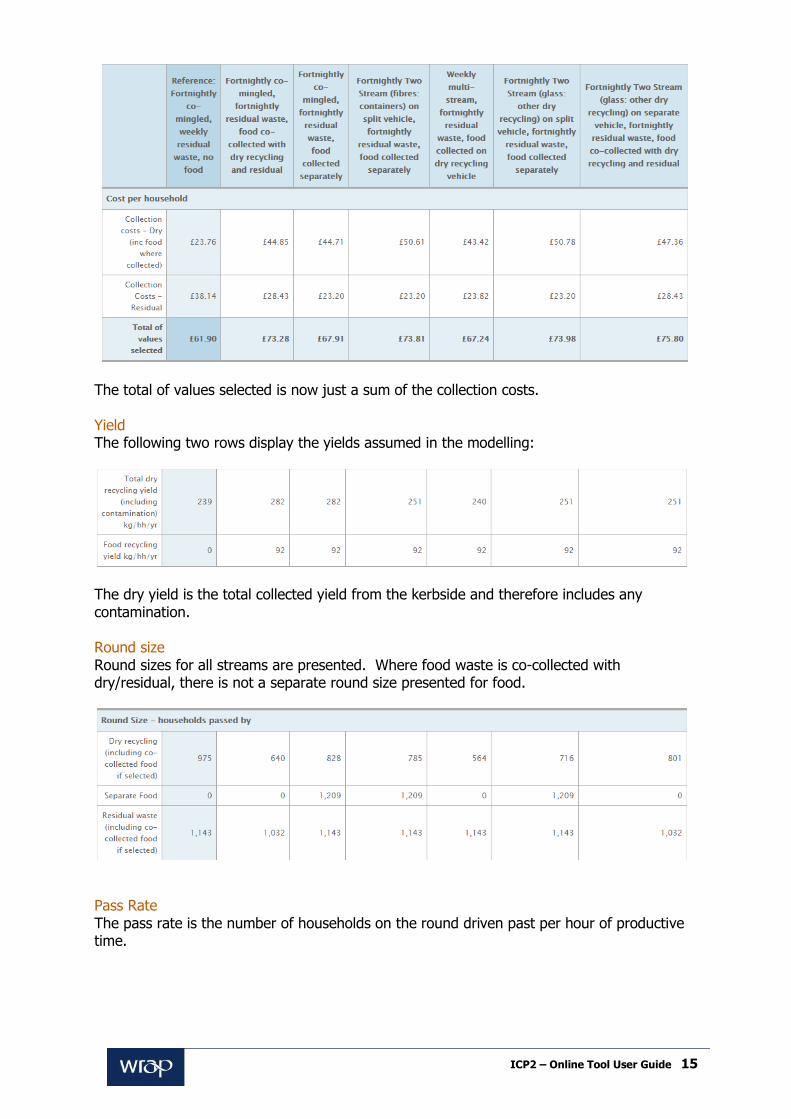
The total of values selected is now just a sum of the collection costs. Yield The following two rows display the yields assumed in the modelling:
The dry yield is the total collected yield from the kerbside and therefore includes any contamination. Round size Round sizes for all streams are presented. Where food waste is co-collected with dry/residual, there is not a separate round size presented for food.
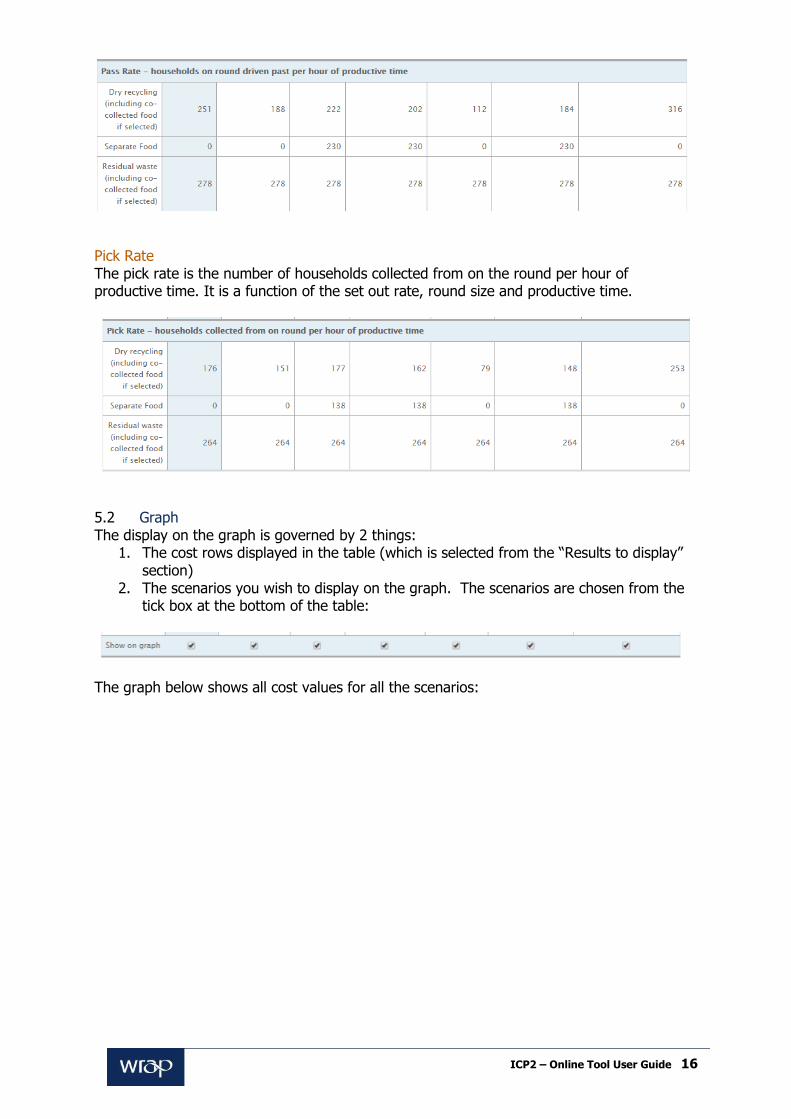
Pass Rate The pass rate is the number of households on the round driven past per hour of productive time.
ICP2 – Online Tool User Guide 16
Pick Rate The pick rate is the number of households collected from on the round per hour of productive time. It is a function of the set out rate, round size and productive time.
5.2 Graph The display on the graph is governed by 2 things:
1. The cost rows displayed in the table (which is selected from the “Results to display” section)
2. The scenarios you wish to display on the graph. The scenarios are chosen from the tick box at the bottom of the table:
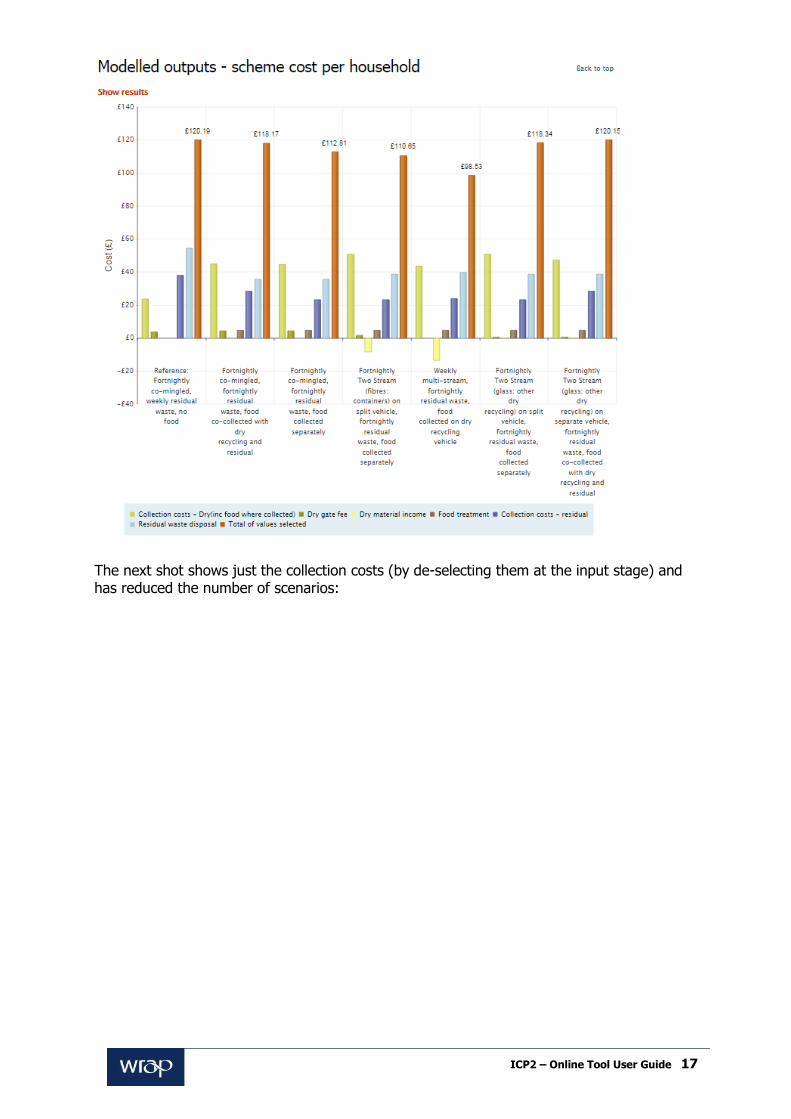
The graph below shows all cost values for all the scenarios:
ICP2 – Online Tool User Guide 17
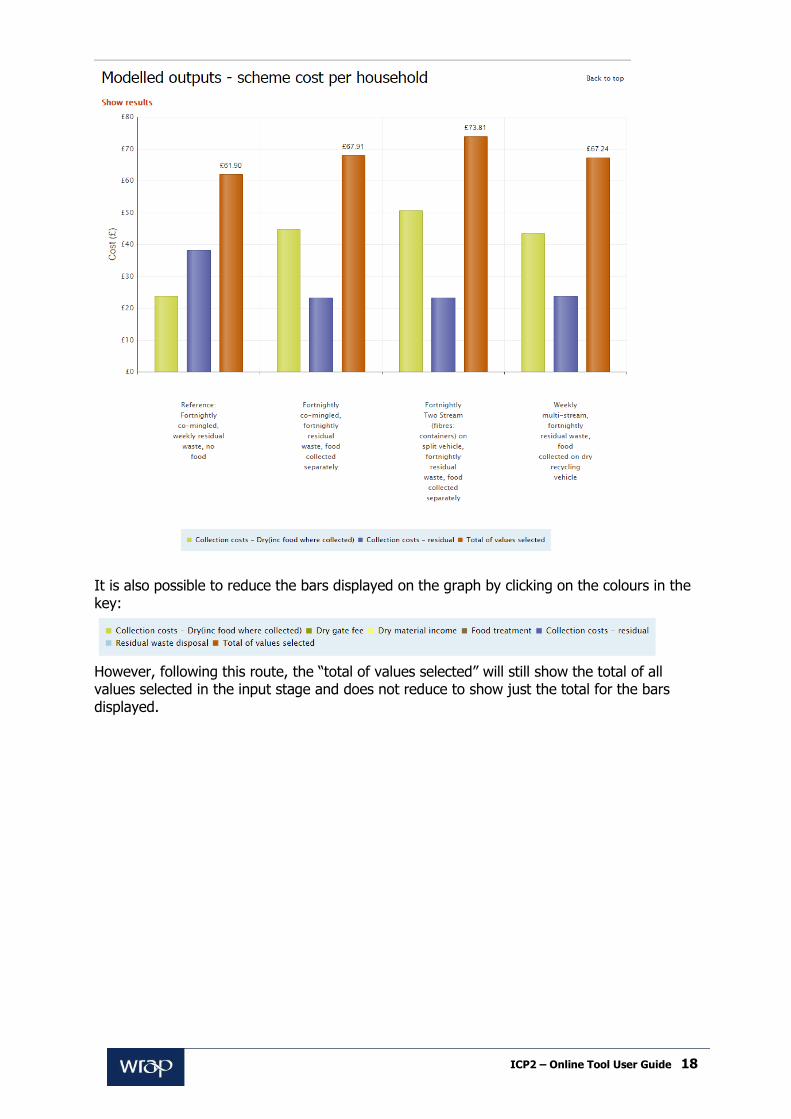
The next shot shows just the collection costs (by de-selecting them at the input stage) and has reduced the number of scenarios:
ICP2 – Online Tool User Guide 18
It is also possible to reduce the bars displayed on the graph by clicking on the colours in the key:
However, following this route, the “total of values selected” will still show the total of all values selected in the input stage and does not reduce to show just the total for the bars displayed.

http://www.wrap.org.uk/category/sector/local-authorities