Online Tool Use Survey
10
David White 16/03/07 Results of the ‘Online Tool Use Survey’ undertaken by the JISC funded SPIRE project Licence ............................................................................................................................................................... 1 General Levels of Usage .................................................................................................................................... 3 Types of Usage....................................... ............................................................................................................ 4 Overall engagemen t ........................................................................................................................................... 5 Institutional Trends ............................................................................................................................................. 6 Overall Engagement with Institutional Services.................................................................................................. 7 Lurking. ............................................................................................................................................................... 7 Tutors, Teachers and Students .......................................................................................................................... 8 Level of Educational Qualification....................................................................................................................... 9 Licence This document is released under the Creative Commons ‘Attribution-NonComme rcial-NoDeri vs 3.0’ licence. Please attribute text or charts from this report to ‘David White, JISC funded ‘SPIRE’ project 2007’. This document is located here: http://tallblog.con ted.ox.ac.uk/inde x.php/2007/03 /16/some-real-da ta-on-web-20 - use/ See http://creativecommons.org/li censes/by-nc-n d/3.0/ for more information on this licence.
-
Upload
filip-miloszewski -
Category
Documents
-
view
235 -
download
0
Transcript of Online Tool Use Survey
8/14/2019 Online Tool Use Survey
http://slidepdf.com/reader/full/online-tool-use-survey 1/10
David White 16/03/07
Results of the ‘Online Tool Use Survey’ undertaken by the JISC funded SPIREproject
Licence ............................................................................................................................................................... 1General Levels of Usage .................................................................................................................................... 3Types of Usage................................................................................................................................................... 4Overall engagement ........................................................................................................................................... 5Institutional Trends ............................................................................................................................................. 6Overall Engagement with Institutional Services.................................................................................................. 7Lurking................................................................................................................................................................ 7Tutors, Teachers and Students .......................................................................................................................... 8Level of Educational Qualification....................................................................................................................... 9
Licence
This document is released under the Creative Commons ‘Attribution-NonCommercial-NoDerivs 3.0’ licence.Please attribute text or charts from this report to ‘David White, JISC funded ‘SPIRE’ project 2007’. Thisdocument is located here: http://tallblog.conted.ox.ac.uk/index.php/2007/03/16/some-real-data-on-web-20-use/
See http://creativecommons.org/licenses/by-nc-nd/3.0/ for more information on this licence.
8/14/2019 Online Tool Use Survey
http://slidepdf.com/reader/full/online-tool-use-survey 2/10
The survey was designed in October – November 06 and opened on the 1st of December. The survey wasclosed on the 16th of February 2007. During this period the survey was completed by 1369 respondents.1 Itwas released to the students on the suite of online short courses provided by the University of Oxford andwas advertised on the University of Oxfords online short courses page2 which promotes all of the onlinedistance courses offered by the university. This page receives a lot of traffic and around 90% of respondentscame to the survey via this route.
The link from this webpage provided a wide range of respondents across a large demographic. It should betaken into account however that the majority of respondents probably had some interest in leaning online tohave initially discovered the page.
A second version of the survey was sent to all of the academics that teach on the weekly classesprogrammes at the department for containing education at the university of Oxford. This version of thesurvey asked a number of more focused questions about the discipline and level of teaching the respondentundertook. The weekly class tutors were chosen as a useful group of as they represent a range of institutionsand states of academic employment. They are not a homogeneous group other than the fact they teach at atertiary level. This version of the survey received 46 responses.
There are a number of weaknesses with the format of the survey. In hindsight it would have been useful to
have included grouping services such as Yahoo! and Google groups as there functionality is similar toLionShare but without the peer-to-peer aspect. It would also have been useful to have included a section onaggregation services and popular ‘mash-ups’. Some of the services are referred to using specific examplessuch as Flickr and Wikipedia, whereas other services were referred to as a general type such as blogs andwikis. This means that care should be taken when comparing the survey results for general levels ofpopularity.
This document deliberately contains very little analysis of the data as I’m interested to hear what otherinterpret from the charts.
The first two figures below show general levels and types of usage. They are best viewed in tandem.
1To view a summary version of the complete main survey results please see:
http://www.surveymonkey.com/DisplaySummary.asp?SID=2799289&U=279928923467 2 http://onlinecourses.conted.ox.ac.uk/
8/14/2019 Online Tool Use Survey
http://slidepdf.com/reader/full/online-tool-use-survey 3/10
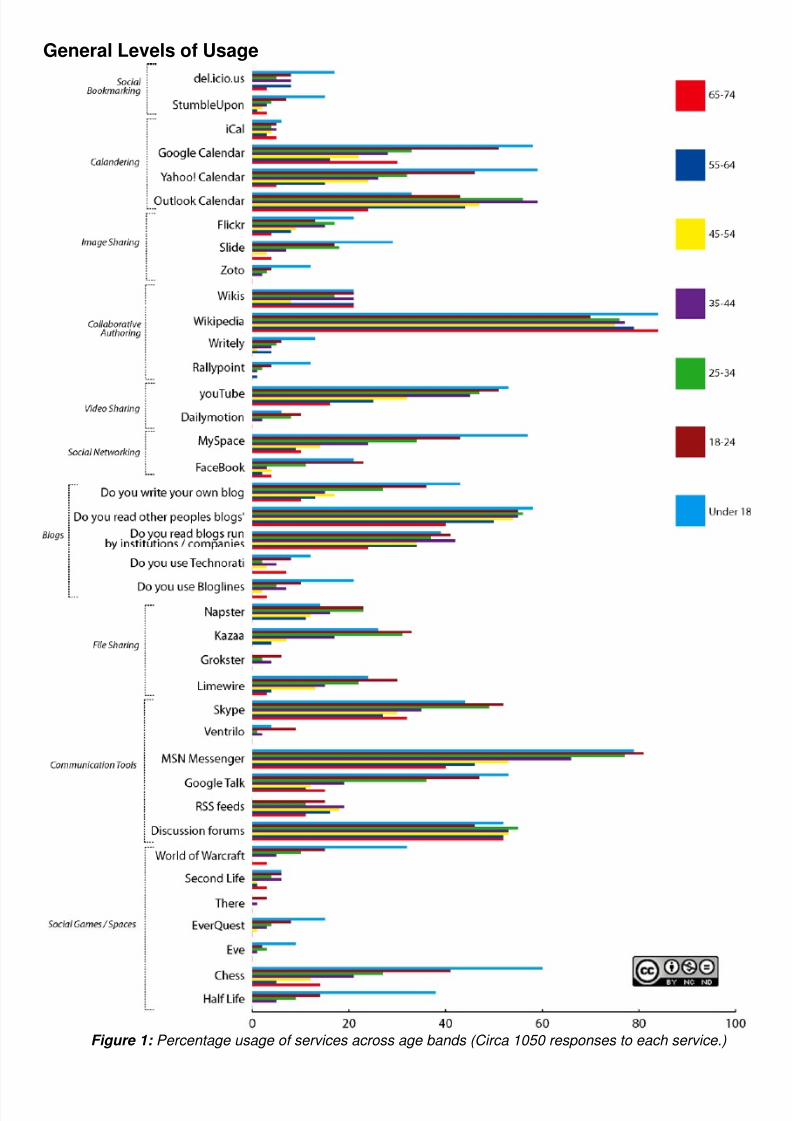
General Levels of Usage
Figure 1: Percentage usage of services across age bands (Circa 1050 responses to each service.)
8/14/2019 Online Tool Use Survey
http://slidepdf.com/reader/full/online-tool-use-survey 4/10
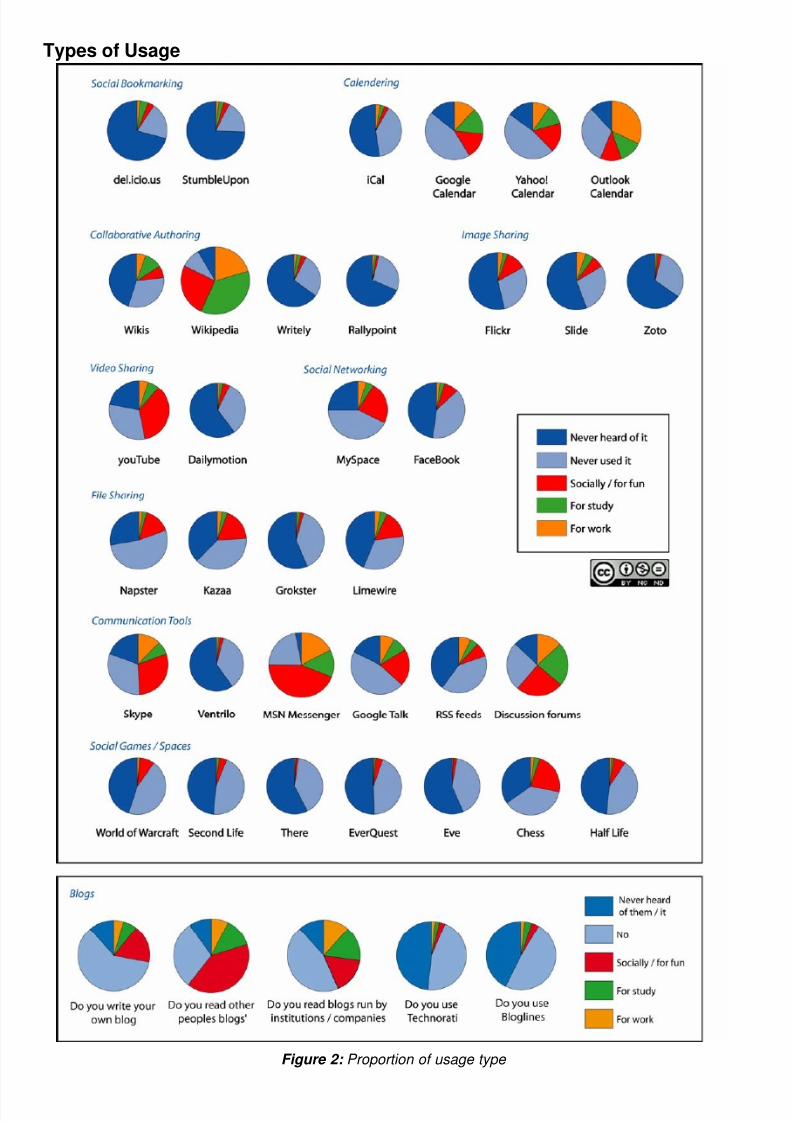
Types of Usage
Figure 2: Proportion of usage type
8/14/2019 Online Tool Use Survey
http://slidepdf.com/reader/full/online-tool-use-survey 5/10
Respondents were asked the following questions about each of the tools / services above:
‘Do you use this tool / service:’• For work• For study• Socially / For fun• Never used it• Never heard of it
Respondents could check more than one answer. Figure 1 was created by adding together responses to‘Never heard of it’ and ‘Never used it’ and subtracting this sum from the total respondents to that question.This was then turned into a usage percentage.
This method does contain some mathematical flaws3 but these are limited in there effect in a sample of circa1300. Figure1should be used as evidence for general trends and cannot be relied on for accurate crossservice comparison. For example the survey did not ask if respondents used the service regularly. It ispossible that the apparent high engagement of the under 18 bracket is because they are more likely to ‘brushpast’ a service when surfing but not necessary use that service more than a couple of times. Nevertheless itis clear that the under 18 group do generally use these types of services the most.
Figure 2 is a simple representation of the proportion of usage type. It is worth remembering that manyrespondents will have checked more than one usage type for any single service.
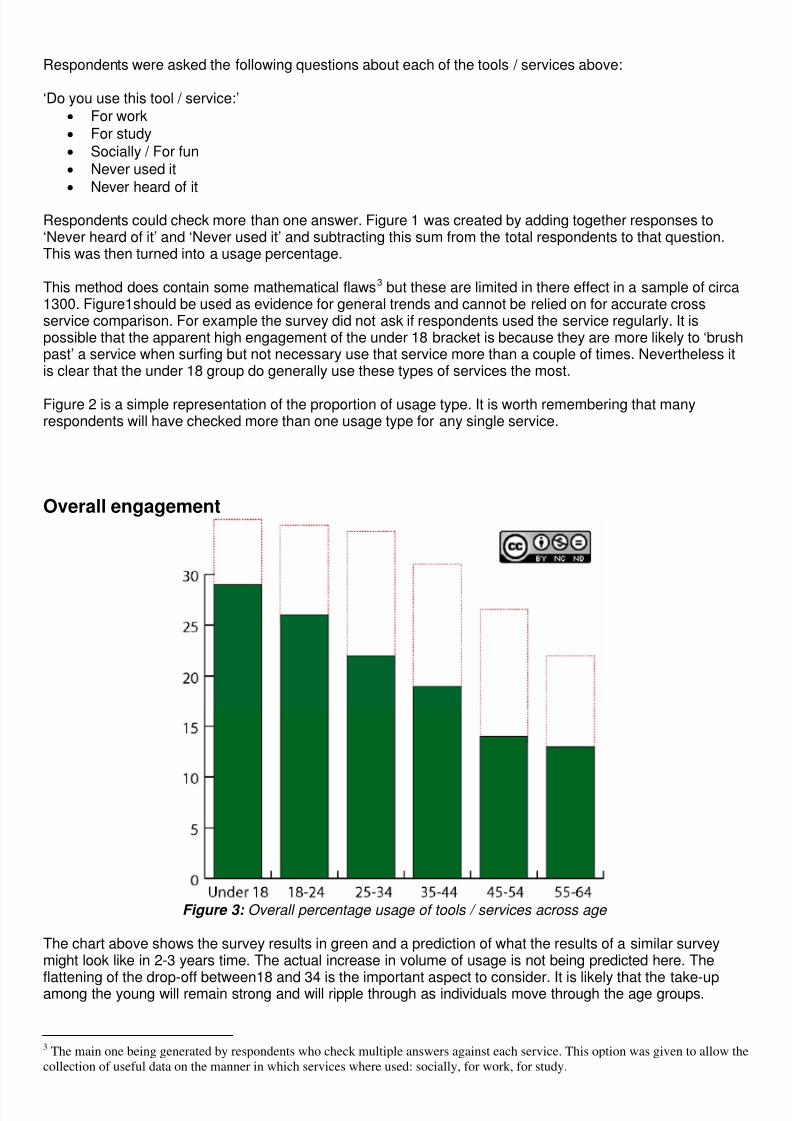
Overall engagement
Figure 3: Overall percentage usage of tools / services across age
The chart above shows the survey results in green and a prediction of what the results of a similar surveymight look like in 2-3 years time. The actual increase in volume of usage is not being predicted here. The
flattening of the drop-off between18 and 34 is the important aspect to consider. It is likely that the take-upamong the young will remain strong and will ripple through as individuals move through the age groups.
3 The main one being generated by respondents who check multiple answers against each service. This option was given to allow the
collection of useful data on the manner in which services where used: socially, for work, for study.
8/14/2019 Online Tool Use Survey
http://slidepdf.com/reader/full/online-tool-use-survey 6/10
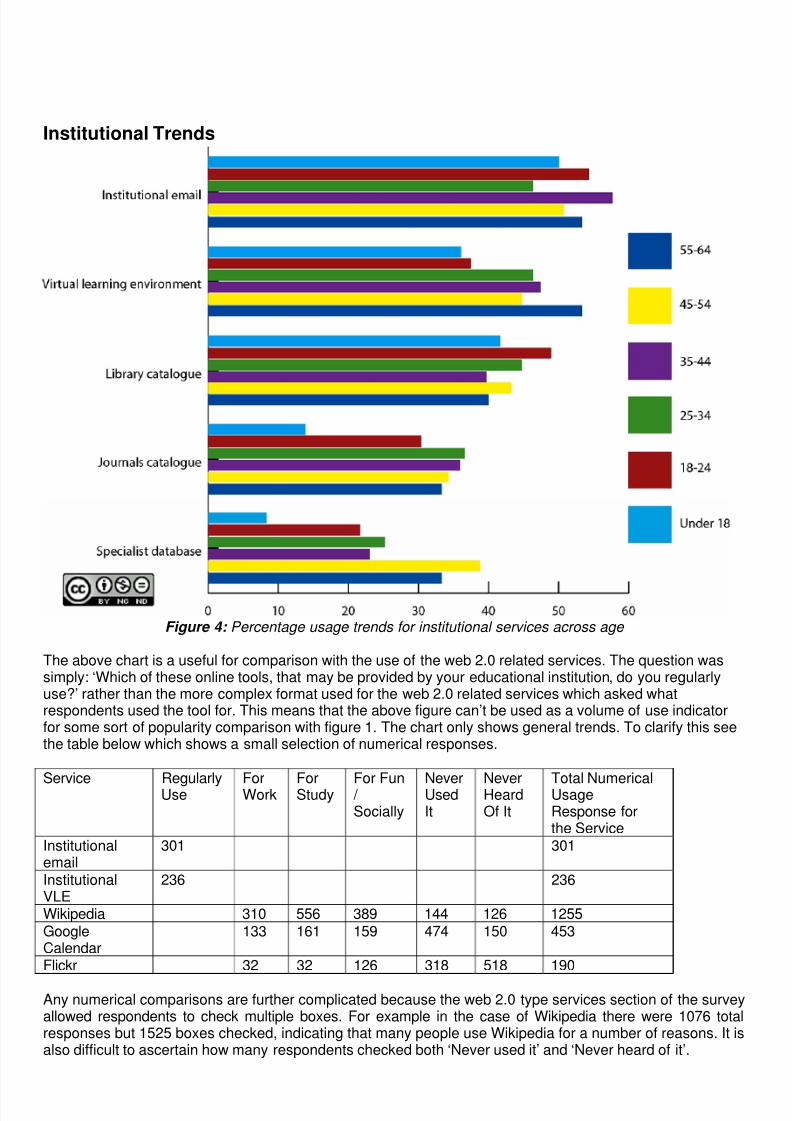
Institutional Trends
Figure 4: Percentage usage trends for institutional services across age
The above chart is a useful for comparison with the use of the web 2.0 related services. The question wassimply: ‘Which of these online tools, that may be provided by your educational institution, do you regularlyuse?’ rather than the more complex format used for the web 2.0 related services which asked whatrespondents used the tool for. This means that the above figure can’t be used as a volume of use indicatorfor some sort of popularity comparison with figure 1. The chart only shows general trends. To clarify this seethe table below which shows a small selection of numerical responses.
Service RegularlyUse ForWork ForStudy For Fun / Socially
NeverUsedIt
NeverHeardOf It
Total NumericalUsageResponse forthe Service
Institutionalemail
301 301
InstitutionalVLE
236 236
Wikipedia 310 556 389 144 126 1255GoogleCalendar
133 161 159 474 150 453
Flickr 32 32 126 318 518 190
Any numerical comparisons are further complicated because the web 2.0 type services section of the surveyallowed respondents to check multiple boxes. For example in the case of Wikipedia there were 1076 totalresponses but 1525 boxes checked, indicating that many people use Wikipedia for a number of reasons. It isalso difficult to ascertain how many respondents checked both ‘Never used it’ and ‘Never heard of it’.

8/14/2019 Online Tool Use Survey
http://slidepdf.com/reader/full/online-tool-use-survey 7/10
All the institutional services inherently have lower response rates because not all of the respondents to thesurvey will have been attached to an education institutional at the time.
Overall Engagement with Institutional Services
Figure 5: Overall percentage usage trends of institutional services across age
Lurking
Figure 6: Ratios of contribution to viewing for groups of services
Respondents were asked if they contributed to each group of tool or simply viewed the material offered. Thiswas an attempt to find out the ratio of contribution to ‘lurking’. The fact that this question was only asked aftergroups of services and not after individual services produced what seem to be unreliable results. Also, theconcept of contribution is subjective. Recent research in this area distinguishes between ‘comments’ and
‘content creation’.
“It's an emerging rule of thumb that suggests that if you get a group of 100 people online then onewill create content, 10 will "interact" with it (commenting or offering improvements) and the other89 will just view it. It's a meme that emerges strongly in statistics from YouTube, which in just 18months has gone from zero to 60% of all online video viewing.” Guardian Online July 20, 2006.
8/14/2019 Online Tool Use Survey
http://slidepdf.com/reader/full/online-tool-use-survey 8/10
The survey results show a much higher level of contribution than this, with 20% of those who use mySpaceand youTube contributing in some form. This could be indicative of a general increase in this area but isprobably an effect of this aspect of the survey being too simplistic. This area requires more researchespecially into what motivates individuals to comment or create. The follow up email interviews to the surveywere designed to gain an insight into this issue but are not very comprehensive.
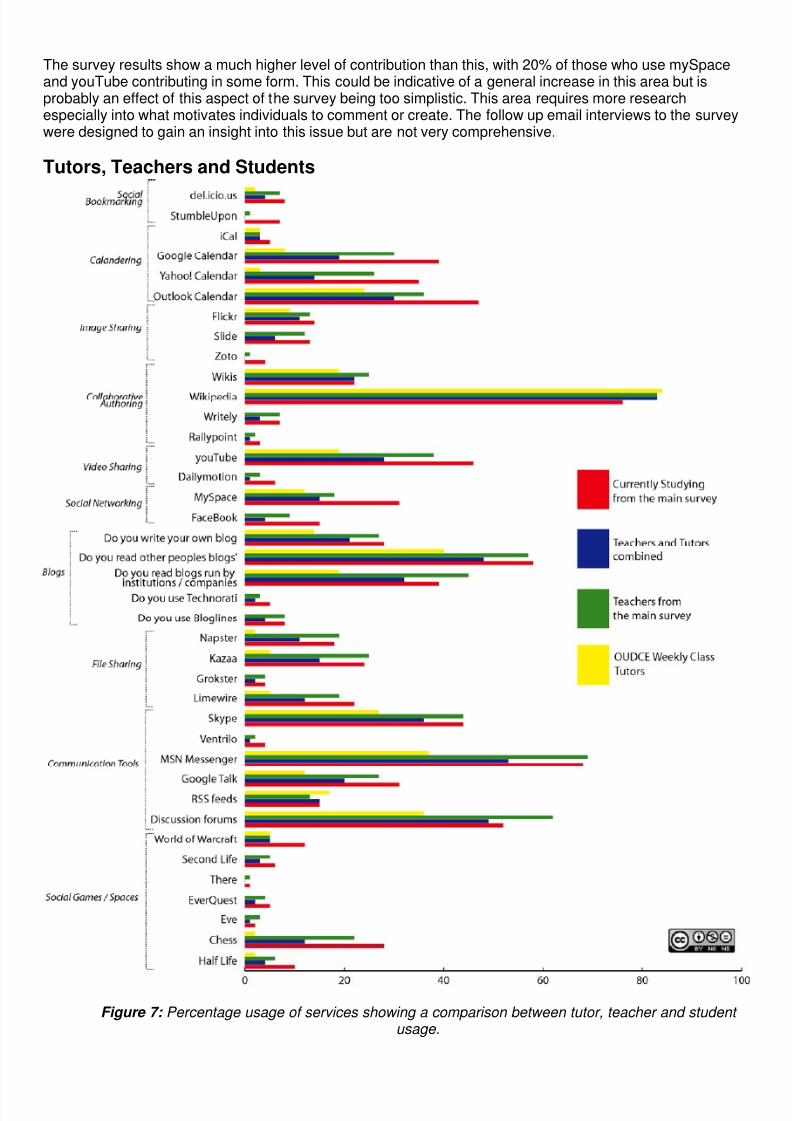
Tutors, Teachers and Students
Figure 7: Percentage usage of services showing a comparison between tutor, teacher and student usage.
8/14/2019 Online Tool Use Survey
http://slidepdf.com/reader/full/online-tool-use-survey 9/10
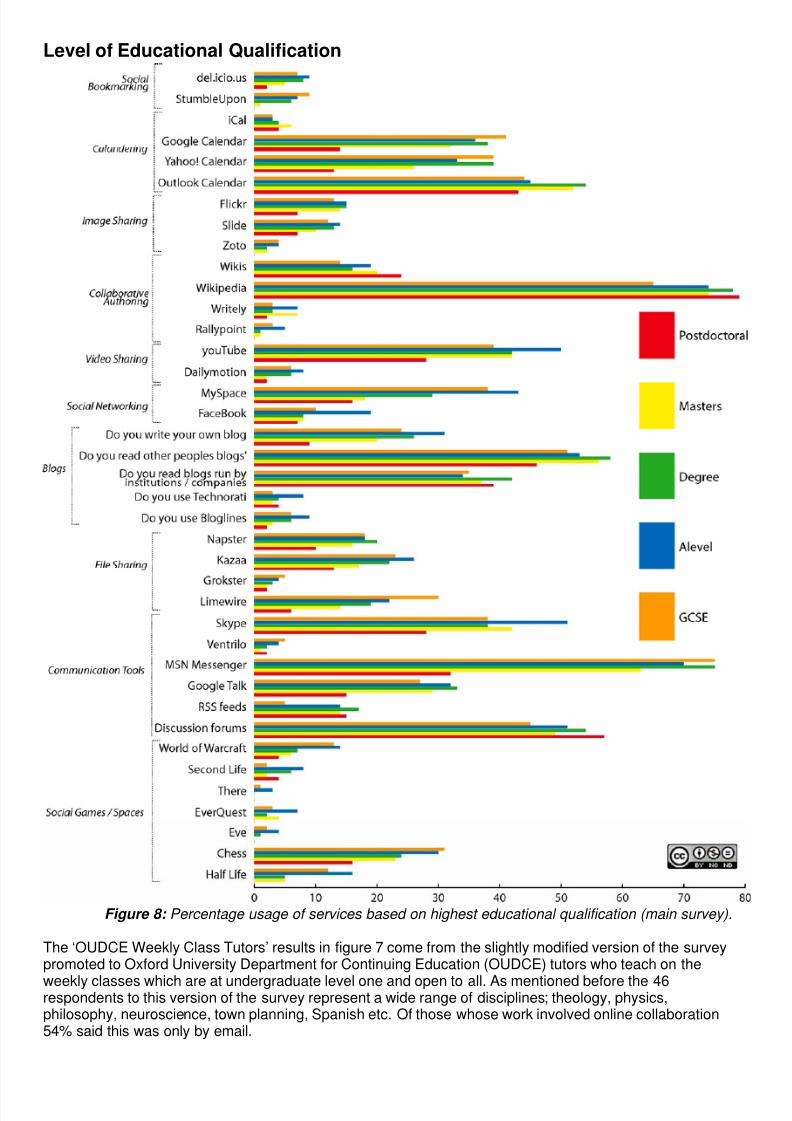
Level of Educational Qualification
Figure 8: Percentage usage of services based on highest educational qualification (main survey).
The ‘OUDCE Weekly Class Tutors’ results in figure 7 come from the slightly modified version of the surveypromoted to Oxford University Department for Continuing Education (OUDCE) tutors who teach on the
weekly classes which are at undergraduate level one and open to all. As mentioned before the 46respondents to this version of the survey represent a wide range of disciplines; theology, physics,philosophy, neuroscience, town planning, Spanish etc. Of those whose work involved online collaboration54% said this was only by email.

8/14/2019 Online Tool Use Survey
http://slidepdf.com/reader/full/online-tool-use-survey 10/10
The green bars in figure 7 are respondents from the main survey whose profession was marked as‘Teacher’. This category will represent a wide range of roles across the education spectrum in both level andstyle. It is included to act as a comparison with the HE level tutors of OUDCE.
It is of course possible to be represented in both the teaching a studying categories. The open nature of thissurvey means that no category has clearly defined edges.