CHAPTER 5 EXISTING SEWERAGE SYSTEM AND FUTURE PLANS
128
M5-1 Volume II Main Report, Part I Master Plan Chapter 5 Existing Sewerage System and Future Plans CHAPTER 5 EXISTING SEWERAGE SYSTEM AND FUTURE PLANS 5.1 GENERAL The present conditions of existing sewerage system in the Study Area is summarized in this chapter based on information available in reports of GTE and of INRH and related organizations. Description is also made on reconnaissance surveys on existing sewerage facilities and on filed surveys of cross connection carried out in this Study. Sewerage development plans for improving the water environment of Havana Bay are summarized in this chapter based on information available in GEF Project Reports and in reports of GTE. Plans to improve the present O/M problems encountered to the existing sewerage system are also described. 5.2 EXISTING SEWERAGE SYSTEM 5.2.1 PRESENT SEWER SERVICE AREA/DISTRICTS Sewer service area in the Study Area is shown in Figure 5.1. In the western part of the Study Area, a sewerage system has been developed. The sewer service area of about 4,500 hector is covered by the Central Sewerage System: sewer networks, pumping stations Colectors, a siphon and a main pumping station, a transmission tunnel and an outfall sewer. The sewerage system is maintained by an enterprise “Aguas de La Habana”. There are also small sewer service areas in the south eastern part of the Study Area. These small sewer service areas were developed to discharge the produced wastewater to nearby stream or river. The sewers are maintained by Water Supply & Sanitation Company of Havana East. 5.2.2 SEWERS (1) Sewer Networks The Central sewer networks were developed in 1905-1915, thus the sewers have been used more than 90 years. The other small sewer networks have been developed when the area was developed together with other infrastructures such as water supply and drainage facilities. The minimum diameter of sewers is 150mm. It is reported that cross connections are practiced in the sewer service area. A survey has been conducted in this Study to identify the current situation of cross connections and understand backgrounds of cross connection practice. (2) Colectors The Central sewerage system has the following 9 Colectors: Norte, Sur, Sur 1, Sur 2, Sur 3, Sur 4, Paralelo al Orengo, Cerro and Centro Habana. The location of each Colector is as shown in the figure 5.1. Table below summarizes the service area covered by each Colector and the dimensions of Colectors’ diameter installed:
Transcript of CHAPTER 5 EXISTING SEWERAGE SYSTEM AND FUTURE PLANS

M5-1
Volume II Main Report, Part I Master Plan Chapter 5 Existing Sewerage System and Future Plans
CHAPTER 5 EXISTING SEWERAGE SYSTEM AND FUTURE PLANS
5.1 GENERAL The present conditions of existing sewerage system in the Study Area is summarized in this chapter based on information available in reports of GTE and of INRH and related organizations. Description is also made on reconnaissance surveys on existing sewerage facilities and on filed surveys of cross connection carried out in this Study.
Sewerage development plans for improving the water environment of Havana Bay are summarized in this chapter based on information available in GEF Project Reports and in reports of GTE. Plans to improve the present O/M problems encountered to the existing sewerage system are also described.
5.2 EXISTING SEWERAGE SYSTEM
5.2.1 PRESENT SEWER SERVICE AREA/DISTRICTS
Sewer service area in the Study Area is shown in Figure 5.1. In the western part of the Study Area, a sewerage system has been developed. The sewer service area of about 4,500 hector is covered by the Central Sewerage System: sewer networks, pumping stations Colectors, a siphon and a main pumping station, a transmission tunnel and an outfall sewer. The sewerage system is maintained by an enterprise “Aguas de La Habana”. There are also small sewer service areas in the south eastern part of the Study Area. These small sewer service areas were developed to discharge the produced wastewater to nearby stream or river. The sewers are maintained by Water Supply & Sanitation Company of Havana East.
5.2.2 SEWERS
(1) Sewer Networks
The Central sewer networks were developed in 1905-1915, thus the sewers have been used more than 90 years. The other small sewer networks have been developed when the area was developed together with other infrastructures such as water supply and drainage facilities. The minimum diameter of sewers is 150mm.
It is reported that cross connections are practiced in the sewer service area. A survey has been conducted in this Study to identify the current situation of cross connections and understand backgrounds of cross connection practice.
(2) Colectors
The Central sewerage system has the following 9 Colectors: Norte, Sur, Sur 1, Sur 2, Sur 3, Sur 4, Paralelo al Orengo, Cerro and Centro Habana. The location of each Colector is as shown in the figure 5.1. Table below summarizes the service area covered by each Colector and the dimensions of Colectors’ diameter installed:

M5-2
Volume II Main Report, Part I Master Plan Chapter 5 Existing Sewerage System and Future Plans
THE DEVELOPMENT STUDY ON THE IMPROVEMENT OF SEWERAGE AND DRAINAGE SYSTEM FOR THE HAVANA BAY
JAPAN INTERNATIONAL COOPERATION AGENCY
Figure 5.1 Colectors in the Central Sewerage System

M5-3
Volume II Main Report, Part I Master Plan Chapter 5 Existing Sewerage System and Future Plans
Table 5.1 Colectors in the Central sewerage system Colector Service Area (ha) Diameter (mm)
Norte 959.6 φ450 – φ1500 Sur 253.8 φ1500 – φ2100
Sur1 601.5 φ900 Sur2 96.2 φ750 – φ900 Sur3 280.3 φ600 – φ750 Sur4 147.2 φ375 – φ750 Cerro 622.1 φ675 – φ1350
Centro Habana 228.9 φ450 – φ750 Paraleo al Orengo 1275.4 φ750 – φ900
Source: “Analisis Hidraulico del Sistema de Alcantarillado Principal de Ciudad de La Habana”
Among the Colectors, the Colector Sur 2 is not connected to the Central sewerage system: the Colector is intercepted at the crossing with Luyanó River due to the broken siphon. Also due to damage, Colector Sur 4 discharges the wastewater into Pastrona stream. Therefore, wastewater generated in San Miguel del Padron and Guanabacoa is discharged to the nearby rivers: Luyanó and Martin Peréz and finally into the Bay.
The engineering information of the Colectors is input in a soft ware, Sewer CAD, to estimate the present capacity of each Colector. The collected engineering information on the Colectors are as follows: nominal diameter, length, invert elevation and pipe materials. The existing capacity will be calculated by using Manning formula with roughness coefficient, n-value, of 0.016 considering the age of sewers. In the course of preparation of the sewerage master plan for the Havana Bay, the estimated capacity of the existing Colector will be confirmed to have an enough capacity to convey the future wastewater volume for each Colector.
Water quality survey for existing sewer was carried out at Caballeria in October and December 2002 by CENHICA/CIMAB under this Study. The results are summarized in Chapter 6 to compare the results of wastewater discharged through drainage channels.
(3) Siphon
Between the grit and screen facility and Casablanca PS, a siphon structure is installed. The siphon made of concrete pipes of 2.13 m in diameter and 345 m in total length, is installed below 12m below the bottom of the sea and the deepest bottom is reached to 30 m below the surface of sea water.
A pipe is installed from the deepest bottom of the siphon to clean the siphon, through this pipe the sediments accumulated are removed by a pump. The cleaning pump operates at least four to six hours a day to prevent the clogging the cleaning pipe the pipe.
Because the siphon structure has been used more than 90 years, leakage of wastewater or suction of sea water may be occurred at some part of the siphon. But any tests have not been conducted to identify these phenomena. A preliminary test will be necessary to identify the leakage of wastewater or suction of sea water.
(4) Transmission Tunnel
A transmission tunnel, 1,447m in length, was installed between Casablanca PS and ocean outfall

M5-4
Volume II Main Report, Part I Master Plan Chapter 5 Existing Sewerage System and Future Plans
sewer. The transmission tunnel is made of concrete and has horseshoe-shaped with 2.0m in height, 2.15m in width and 30 cm in thickness. The latest rehabilitation works were done in 1991 to repair the partially breakdown inner surface. A rehabilitation plan was prepared and its the feasibility study was also completed but the implementation has not been done yet.
(5) Outfall Sewer to the ocean
An outfall sewer, 1,500mm in diameter (5 feet) and 140m in length, is installed to disposed off the wastewater at 9m below the surface of sea water. Since this sewer also has been used more than 90 years, some part of the sewer is damaged, an inspection survey conducted by divers identified cracks at pipe joins and wastewater leakage from some of these joints.
A rehabilitation plan was prepared to install two new outfall sewers of about 300m in length with 140 m long diffuser and discharge the wastewater 26m below the surface of sea water. The rehabilitation plan has not been implemented yet.
5.2.3 CROSS CONNECTION SURVEY
(1) Background and Purpose
Large amount of wastewater is discharged through main drainage channels such as Agua Dulce and Arroyo Matadero. It is reported that the main reason is that cross connections are practiced in the sewer service area. The cross connections are called as “illegal connections” in the Study Area. The detailed technical information was limited to understand the situations. Therefore, a survey on the cross (illegal) connection has been conducted in this Study to identify the current situations of cross connections and to get engineering information.
(2) Methodology
Figure 5.2 shows 10 selected locations for the cross connection survey. The pilot areas to be survey are selected from the main drainage areas of Agua Dulce, Arroyo Matadero, and San Nicolás through discussions with Cuban counterparts, considering present land use.
The appropriate survey method is selected from simple tests such as smoked test and/or dye-colored water test, considering the wastewater flow condition in each drainage pipe surveyed, house connection design, and other local conditions. A preliminary field survey selected the dye-colored water test as the best method because of the following reasons:
• Large volume of wastewater flowing in drainage pipe disturbs to stop the flow by plugs, thus, the smoke test is very difficult to conduct. The dye-colored water test is easy to implement, but it requires careful observation of flows in the drainage pipes and the sanitary sewers.
• No house inlet structure are installed in the house connection system, the house drains connected directly to the street sewers or drainage pipes. The smoked test is difficult to detect the smoke injected because the smoke is only detected through the broken house drains only where no house inlets.
The procedure of dye-colored water test for house connection is shown schematically and explained in Figure 5.3.

M5-5
Volume II Main Report, Part I Master Plan Chapter 5 Existing Sewerage System and Future Plans
THE DEVELOPMENT STUDY ON THE IMPROVEMENT OF SEWERAGE AND DRAINAGE SYSTEM FOR THE HAVANA BAY
JAPAN INTERNATIONAL COOPERATION AGENCY
Figure 5.2 Selected 10 Locations for the Cross Connection Survey

M5-6
Volume II Main Report, Part I Master Plan Chapter 5 Existing Sewerage System and Future Plans
Survey Procedure: (1) To conduct a preliminary field survey to check the location of manholes, drainage
pipes, street sanitary sewers, and house connection system.
(2) To explain the purpose of the dye-colored water test to house owner/wife or manager of institutions where the test is carried out.
(3) To open the related manhole of drainage pipes.
(4) To prepare dye-colored water based and put into the house drains at kitchen and toilet and inform the start of the test to the observer at the manhole.
(5) To observe the dye-colored water flowing into the drainage pipe at the manhole.
(6) When the flowing dye-colored water is identified, then the test is positive; the drains are connected to the drainage pipe illegally.
(7) Go to the next house or institution to be surveyed and
(8) To repeat the above the test until finishing the survey for the location.
THE DEVELOPMENT STUDY ON THE IMPROVEMENT OF SEWERAGE AND DRAINAGE SYSTEM FOR THE HAVANA BAY
JAPAN INTERNATIONAL COOPERATION AGENCY
Figure 5.3 Procedure of Cross Connection Survey, Dye-colored Water Test Method

M5-7
Volume II Main Report, Part I Master Plan Chapter 5 Existing Sewerage System and Future Plans
(3) Survey Results
The survey results are presented in the table below:
Table 5.2 Results of Cross Connections Survey Drainage
area Location ID
No. in figure 5.2 House number
surveyed Cross connection number identified
I) San Nicolas 1 31 0 II) Arroyo Matadero 2 31 0 3 24 0 4 8 0 5 33 2 6 13 0 III) Agua Dulce 7 5 0 8 17 1 9 20 0 10 35 0
Total 217 3
The results show that cross connections are not identified; almost all of house connections are connected to the sanitary sewer correctly.
However it is the fact that large volume of wastewater is flowing in the drainage channels even in dry weather conditions and eventually discharged to the Havana Bay directly without treatment. Therefore, a further cross connection survey was conducted to find out the reasons. Cross connections of sanitary sewer mains to drainage pipe/channel are found and confirmed by use of dye-colored water. And it is also made clear that those cross connection structures were installed by the ex-authority of planning, constructing and maintaining the sewers to solve an urgent problem of discharging the increased wastewater due to population growth to nearby water courses. The problem must be solved by installation of new sewers to cover the insufficient capacity of the existing sewers. This bad and makeshift practices were done under financial constraints, and unfortunately the design documents and drawings of the cross connection structures are not available, including information of their locations.
The installation of cross connection structures causes the direct wastewater discharge to the Havana Bay through the drainage channels. To solve this serious problem, a comprehensive study is required to identify the locations of cross connection structures, to investigate the structures, to prepare alternative engineering plans and to selection the most appropriate plan. The further field surveys to identify the cross connections are urgently required.
5.2.4 WASTEWATER PUMPING STATION
One wastewater pumping station is operating in the Study Area. Casablanca Pumping Station (PS) was constructed in 1908-15 together with screen, siphon, tunnel transmission and outfall sewer.
(1) Grit and Screen Removals
Three gravity grit removal channels are installed with automatic operation screen equipment. Accumulated grits and sands at the channel bottoms are removed manually based on operators experience and practices.

M5-8
Volume II Main Report, Part I Master Plan Chapter 5 Existing Sewerage System and Future Plans
Three automatic type screen facilities are installed but without any house structure. Two facilities are not operated due to the malfunction of wires and winches. The automatic screen equipment is used once a day when the water level is reached to lower level during the Casablanca PS is operated. While the screens of the equipment breakdown are removed manually.
Coarse screens are also equipped at the end of grit removal channels to remove the remained screens.
A by-pass structure is installed to bypass the wastewater to the Bay in the following cases: power failure, malfunction, and emergency inspection at Casablanca PS. The by-pass structure is controlled by using steel stop log manually, no winch installed, thus a crane truck is necessary to install and remove the stop lag.
The structure and equipment are operated by three teams of operators; one team consists of three operators. Each team work the following shift: one day on duty and two days off.
The removed grits, sands and screens are kept provisionally and transferred to the solid wastes disposal sites by a truck for final disposal.
The following O/M problems are found:
• Not-efficient removal of grids and screens causes sediments at the bottom of siphon, and resulted in clogging of clean-up pipe when the pumps for clean-up stop the operation.
• Followings give public and tourists unpleasant feeling: exposure of the screen facilities without any house building of equipment and leave the grits and screens uncared for at the site.
Urgent rehabilitation of the mechanical screen equipment is recommended to minimum the accumulation of sediments at the bottom of siphon and to improve the wastewater pumps operation.
(2) Casablanca Pumping Station
The Casablanca Pumping Station (PS) was constructed in 1915. The pump equipment and accessories are replaced and rehabilitated at several times, the present pumps are installed in 1991.
The 1991 replacement works are as follows:
• replacement of three German pumps including one stand-by, capacity of 2.6 m3/sec, pump head of 8 m, output of 256 kW
• replacement of outlet pipe, with 1.2m in diameter, 12 mm in thickness of steel pipe
• installation of Finish automatic control equipment, Variable Voltage Variable Frequency (VVVF)
• installation of control panel
After the replacement, the following repair works have been done:
• Replacement of shaft broken, twice in 2000 and on April 2002
• Replacement of three impellers worn down
• Replacement of bearings
When the shafts were broken in 2002, it took one year to repair the shafts. Because the pumps

M5-9
Volume II Main Report, Part I Master Plan Chapter 5 Existing Sewerage System and Future Plans
are old and their spare parts were not available in commercial markets, the shafts had to be made by order based on their own specification. It took one year to supply the shafts.
Pumps are operated manually in the followings: operator reads the water level measured by the sensor installed at the wet well, and controls the lifting capacity with the VVVF automatic controller. The automatic control system of pumps was attempted to introduce, however, the automatic controller is not used, because only one pump is possible to be operated by the automatic system of VVVF, and the accuracy of water level sensor is not high enough to use. Two pumps including one standby are used for lifting wastewater and one pump is used for cleaning the siphon.
The power is supplied through a special line from the power supply company, thus power failure is very limited except when the power supply line is checked for maintenance. When the power is cut by the power supply company, the maximum power cut time is six hours, and the information is noticed previously. Two days power cut was once occurred in 2001 when the hurricane hit. The wastewater was by-passed through the grit and screen facilities and discharged to the Havana Bay directly. Three diesel-driven power generators were installed, but these are abandoned, the spare parts of the generators had been used for other purposes.
The pumping stations are operated in the following staff: one representative, seven operators including one standby, and one office maintenance. Three teams of operators, one team consists of two operators and each team work 24hours on duty and two-days off duty.
The following problems have been identified:
• the capacity of pump wells is small, thus the water level varies greatly and resulted in hard loads to the pumps and difficulties in pumps operation.
• one of three pumps is used for cleaning the siphon only, when the cleaning pump is damaged or inspected, the cleaning pipe can be easily clogged.
• any flow measurement device is not installed, the measurement of wastewater volume pumped is essential for appropriate O/M and for preparing future rehabilitation and extension plans.
5.2.5 REHABILITATION PLAN OF EXISTING WASTEWATER TRANSMISSION FACILITIES
The wastewater transmission facilities from the siphon to the outfall sewers have been used more than 90 years, rehabilitation works are required to maintain their proper functions. The following three alternative rehabilitation plans were prepared by the Aguas de La Havana based on a study conducted by CIMAB under the instruction of INRH. But no decisions have been made to select the best alternative and no actions have been taken to implement the plan. The alternatives are summarized in the table below.

M5-10
Volume II Main Report, Part I Master Plan Chapter 5 Existing Sewerage System and Future Plans
Table 5.3 Alternatives of Rehabilitation Plan for Existing Wastewater Transmission Facilities
Components Alternative 1 Alternative 2 Alternative 3
1) Siphon Installation of new siphon structure
Installation of new siphon structure
to be abandoned
2)Casablanca PS
Replacement of pumps, having the same specification: Q=2.6 m3/sec, Head=8m, 3 units including 1 standby
Replacement with new specification pumps, Q=1.4 m3/sec, Head=16m, 4 units including 1 standby
to be abandoned
3)Transmission Tunnel
Rehabilitation works for the worn-out parts of tunnel works
Rehabilitation works for the worn-out parts of tunnel works, including reinforcement work with steel plate
to be abandoned
4) New Pumping Station
New PS to be constructed, Q=2.6 m3/sec, Head=4m, 3 units including 1 standby. Construction site is available
Not required New PS to be constructed near the existing screen site.
5) Outfall Sewer
Two pipes, 300m in length, with diffusers of 140m long be installed. The wastewater be diffused at 26m below the sea surface.
Same as that of the alternative 1
New outfall sewer to the ocean discharge point be constructed through the bottom of canal.
Source: “Informe preliminar del Estudio de Factivilidad Económica del Emisario Playa del Chino”, Department de Proyecto del Aguas de La Habana
5.2.6 WASTEWATER TREATMENT PLANT
In the Study Area, there are no wastewater treatment plants (WWTP). However, to know the engineering practice and experiences near the Study Area, two WWTPs in the city of Havana and one in Varadero were surveyed. The followings describe briefly outline of the WWTPs and major findings.
Three WWTPs are Quibú, Maria del Carmen, and Varadero. The first two WWTPs have the same process and located in the city of Havana. But Maria de Carmane WWTP, commissioned in 1984, is stopped its operation by inflow of hazardous industrial wastewater. Base on a study report on operation problems and countermeasures against the problems prepared in May 2000, rehabilitation works are being conducted.
Table below summarizes the main features of Quibú and Varadero WWTPs.

M5-11
Volume II Main Report, Part I Master Plan Chapter 5 Existing Sewerage System and Future Plans
Table 5.4 Features of Two WWTPs surveyed WWTP
Item Quibú Varadero (Tahinos I)
1) Objectives and backgrounds
To improve water quality of the Quibú River, this WWTP was constructed. In 2000, the capacity was extended from 100 L/s to 300 L/sec.
To treat wastewater produced hotels in the resort area of Varadero, the WWTP was constructed by privately and commissioned in February 1992. Total wastewater treatment capacity is 1,500 m3/day.
2) O/M organization Mixed Company “Aguas de La Habana”
Public cooperation of water supply and sewerage “Aguas Varadero”
3) Receiving Water Body
Quibú river Cardenas Bay
4) Influent BOD5 conc. Design: 250-300mg/L Records (March 2000 to July 2002): Ave. 121mg/L (Min. 62 mg/L, Max.160 mg/L)
Design: 300 mg/L
5) Treated BOD5 conc. Records (March 2000 to July 2002): Ave. 30mg/L (Min. 15 mg/L, Max.55 mg/L)
Design: 20 mg/L
6) Wastewater Treatment Process
Trickling Filter Process (2 screens, 2 grit chambers, 2 oil separators, 2 primary sedimentation tanks, 2 biofilters, 2 secondary sedimentation tanks, and 3 wastewater pumps and 3 sludge pumps.)
Conventional Activated Sludge Process (grit chamber, oil separator, distribution chamber, 4 aeration tank, 4 final sedimentation tanks, chlorination tank)
7) Sludge Treatment and disposal method
Anaerobic digestion, sludge drying beds, and land disposal. Anaerobic digestion is simplified system: opened tank and without external heating.
Anaerobic digestion, sludge drying beds, and land disposal. Anaerobic digestion is simplified system: opened tank and without external heating.
8) O/M Staff Total 9 staff (1 representative, 1 water chemist, 3 team [1 operator + 1 assistant], 1 standby)
Two operators work 8-hr a day only. Automatic control is used for 24 hour operation.
9) O/M works Spanish pumps are installed. Major repair works of electric conductor and impeller of sludge pumps are carried out at the workshop of “Aguas de La Habana”
An extended aeration operation mode: 24 hour aeration and return sludge ratio of 85%, is applied. After its commissioning, malfunction of pumps and aerators, three times clogging of diffusers, and wear and broken of ball bearings have been experienced. The repairs of equipment have been done by the Aguas Varadero.
10) Other Wastewater is taken from a channel connected to the Quibú River. The data of DPRH indicated influent quality is lower than 50mg/L of BOD5.
Dual power supply lines are equipped. No generators installed. No serious power failure was experienced, but three days once when the hurricane damaged the power supply plant.
Through the surveys on the exiting WWTPs, the following points are highlighted as major considerations for preparation of the Sewerage Master Plan:

M5-12
Volume II Main Report, Part I Master Plan Chapter 5 Existing Sewerage System and Future Plans
• Influent BOD5 concentration
• Industrial Wastewater
• Mechanical Equipment
• O/M technology
Low influent BOD5 concentration is experienced in the Quibú and Maria del Carment WWTPs. The low concentration of BOD5 affects the treatment efficiency. The applied wastewater treatment process, trickling filter process (or extended its efficiency by using plastic filters, thus this process can be called “biofilter”), is a fixed film reactor. The fixed film reactor can handle the influent of low BOD5 concentration compared with suspended growth reactor, such as conventional activated sludge process. In the selection of appropriate wastewater treatment process, the influent BOD5 concentration will be considered based on the wastewater quality analysis conducted in the Study.
Industrial Wastewater, not comply with industrial effluent standards, is discharged to public sewerage system, the function of biological wastewater treatment process is damaged or inhibited due to hazardous components in the industrial wastewater. The level and contents of industrial wastewater discharged to the public sewer are important to select the appropriate wastewater treatment process and sludge treatment, reuse and disposal process.
Mechanical Equipment, imported from other countries, maintained well, and repaired by own workshop if spare parts are available. It is ideal to introduce a simplified mechanical equipment and its spare parts easily available.
O/M technology is essential to operate the sewerage systems to contribute the improvement of water environment of the Havana Bay. In the Study Area, there is no wastewater treatment process requiring higher technology to operate and maintain. O/M technology required for wastewater and sludge treatment is one of most important factors to select the appropriate treatment process. When a suspended growth biological process, such as activated sludge process and its modified systems, is applied as a wastewater treatment system, a series of training program will be needed. In addition, some WWTPs are planned to construct in the Study Area, therefore, it is recommended to prepare and implement O/M training programs of wastewater treatment and sludge treatment/disposal using actual equipment and facilities.
5.3 PRESENT SEWERAGE DEVELOPMENT PLANS
5.3.1 GEF / UNDP PROJECT
Under the GEF Pilot Phase Project (1995-1997), “Planning and Management of Heavily Contaminated Bays and Coastal Areas in the Wider Caribbean”, which included Havana Bay, several actions to rehabilitate the bay and to reduce pollution resulting from land based sources (LBS) to Caribbean Sea. Actions with respect wastewater treatment is described in the followings:
Seven wastewater treatment zones discharging directly to Havana Bay through rivers within the Havana Bay basin as shown in Figure 5.4 were identified in this Project together with existing system served by Principal Colector are selected for actions.

M5-13
Volume II Main Report, Part I Master Plan Chapter 5 Existing Sewerage System and Future Plans
THE DEVELOPMENT STUDY ON THE IMPROVEMENT OF SEWERAGE AND DRAINAGE SYSTEM FOR THE HAVANA BAY
JAPAN INTERNATIONAL COOPERATION AGENCY
Figure 5.4 Seven Wastewater Treatment Zones within Havana basin
M5-14
Volume II Main Report, Part I Master Plan Chapter 5 Existing Sewerage System and Future Plans
(1) Existing System
Principal Colector which collects wastewater from the western part of Havana Bay both within and outside the basin of the bay, which is overloaded and contributing to the pollution of Havana bay through overflows and interconnections to stormwater drains discharging to bay, is also considered for actions. Improvement in the form treating wastewater from Dren Agua Dulce is proposed at Zone 6 as described in the next paragraph.
(2) Zone 6
Wastewater treatment plant at Zone 6 is to treat wastewater pumped from Dren Agua Dulce in addition to wastewater from Zone 6. Wastewater treatment plant for Zone 6 is financed by Italian Government whereas Wastewater Pumping Station at Dren Agua Dulce is financed by the Belgian Government.
Following are the design capacity of the proposed pumping station and wastewater treatment plant.
Dren Agua Dulce Pumping Station Total pumping capacity : 750 L/s Number of pumps : four (4) in total where one (1) standby Capacity of each pump : 250 L/s Transmission main : 1 km total (ø800 mm x 300 m pumped main and ø1200 mm x
700 m gravity main) Zone 6 Wastewater Treatment Plant Treatment capacity : 1,000 L/s (750 L/s from Dren Agua Dulce and rest from Rio
Luyano) Treatment Process : Chemical-aided primary treatment The Project is being delayed by unexpectedly difficult ground conditions.
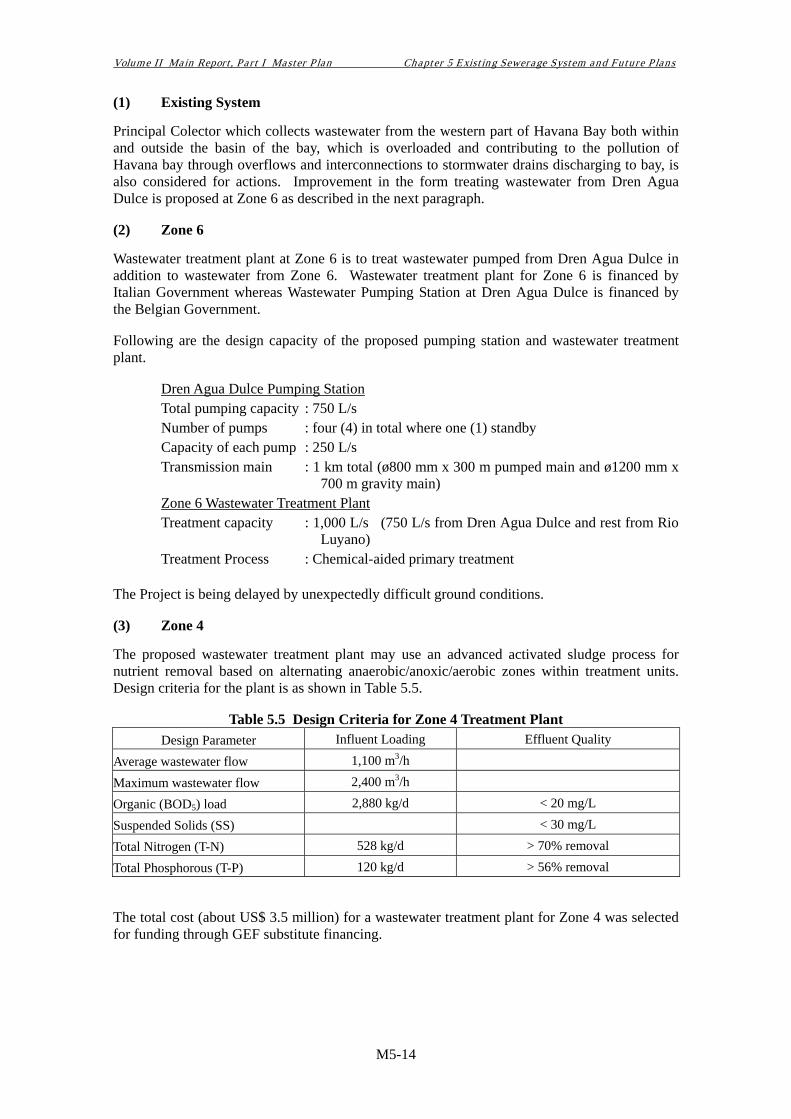
(3) Zone 4
The proposed wastewater treatment plant may use an advanced activated sludge process for nutrient removal based on alternating anaerobic/anoxic/aerobic zones within treatment units. Design criteria for the plant is as shown in Table 5.5.
Table 5.5 Design Criteria for Zone 4 Treatment Plant Design Parameter Influent Loading Effluent Quality
Average wastewater flow 1,100 m3/h
Maximum wastewater flow 2,400 m3/h
Organic (BOD5) load 2,880 kg/d < 20 mg/L
Suspended Solids (SS) < 30 mg/L
Total Nitrogen (T-N) 528 kg/d > 70% removal
Total Phosphorous (T-P) 120 kg/d > 56% removal
The total cost (about US$ 3.5 million) for a wastewater treatment plant for Zone 4 was selected for funding through GEF substitute financing.

M5-15
Volume II Main Report, Part I Master Plan Chapter 5 Existing Sewerage System and Future Plans
Table 5.6 Wastewater Treatment Zones and their Development Plans Wastewater
Treatment Zone Planning Conditions Receiving Water
Body Remarks
Zones on the Periphery of the Bay
Principal Zone (Colector Principal)
Service area : west of Havana Bay within (1,490 ha) and outside bay
basin. Served population : 900,000 (est.)
Marine outfall at Playa del Chivo
(Gulf of Mexico)
Stormwater drains: Dren San Nicolas, Dren Arroyo Matadero and
Dren Agua Dulce runs along with the Colector to which illegal connections,
interconnections and overflows are
Zone 6
Service area : 0.5 km2 Service population : 200,000
Wastewater : 86,400 m3/d (including wastewater from Dren
Agua Dulce)
Rio Luyano Mouth
Ongoing project for implementation of wastewater treatment plant with
Italian financing and Belgian financing for wastewater pumping
from Dren Agua Dulce
Zone 4 Service area : 5.4 km2
Service population : 40,630 Wastewater : 17,280 m3/d
Rio Luyano Ongoing project for wastewater
treatment plant construction with GEF/UNDP financing
Zone 5 Service area : 0.8 km2
Service population : 30,000 Wastewater : 25,930 m3/d
Rio Martin Perez
Zone 7 Service area : 2.0 km2 Service population : 74,000 Arroyo Tadeo
Zones on the Inland Area of Basin
Zone 1 Service area : 5.3 km2
Service population : 15,925 Wastewater : 6,650 m3/d
Rio Martin Perez
Zone 2 Service area : 2.3 km2
Service population : 19,685 Wastewater : 8,575 m3/d
Rio Luyano
Zone 3 Service area : 2.0 km2
Service population : 13,462 Wastewater : 6,000 m3/d
Rio Luyano

M6-1
Volume II Main Report, Part I Master Plan Chapter 6 Existing Drainage System
CHAPTER 6 EXISTING DRAINAGE SYSTEM
6.1 GENERAL The Study Area excluding the Havana Bay of about 68 km2 can be divided into the following drainage basins: three tributary rivers, direct discharge areas in the vicinity of the bay, and the existing storm-water drainage area as shown in Figure 6.1.
The features of the drainage basins, which are not covered by the existing storm-water drainage system, can be summarized in the following:
Luyano River basin, lying in the southern part of the Study Area: its southern boundary of divide is about 100 m high above the sea mean level, and the south eastern boundary is about 60 m high. The middle course of the basin is urbanized and the lower course is industrialized.
Martin Peréz River basin is located in the south eastern part of the Study Area, having the highest altitude area extended to the south eastern boundary of about 50 m high above the sea mean level. The middle course of the basin is urbanized but the upper course is mainly used as farm lands.
Tadeo River basin, located between the eastern part of the Study Area and the Martin Peréz River basin. The basin is urbanized but one-storied houses are developed mainly. The down reach of the river is covered by culvert structures.
North Eastern natural drainage area, forming a saddle of about 20 to 30 m high above the sea level, and the surface slopes gently down to the bay. Industries are developed in this area. Oil refinery factory is located in this area.
North natural drainage area, forming hills of about 50 m high above the sea level. The drainage area have the width of two to three hundred meters only . On the top of hill, the Casablanca Meteorological Observatory and the large Christ statue are located.
The following sections will describe general features and findings on the existing storm-water drainage system based on field reconnaissance surveys and preliminary analysis of data and information collected during Phase I of Basic Study.
6.2 EXISTING DRAINAGE SYSTEM
6.2.1 PRESENT DRAINAGE SERVICE AREA
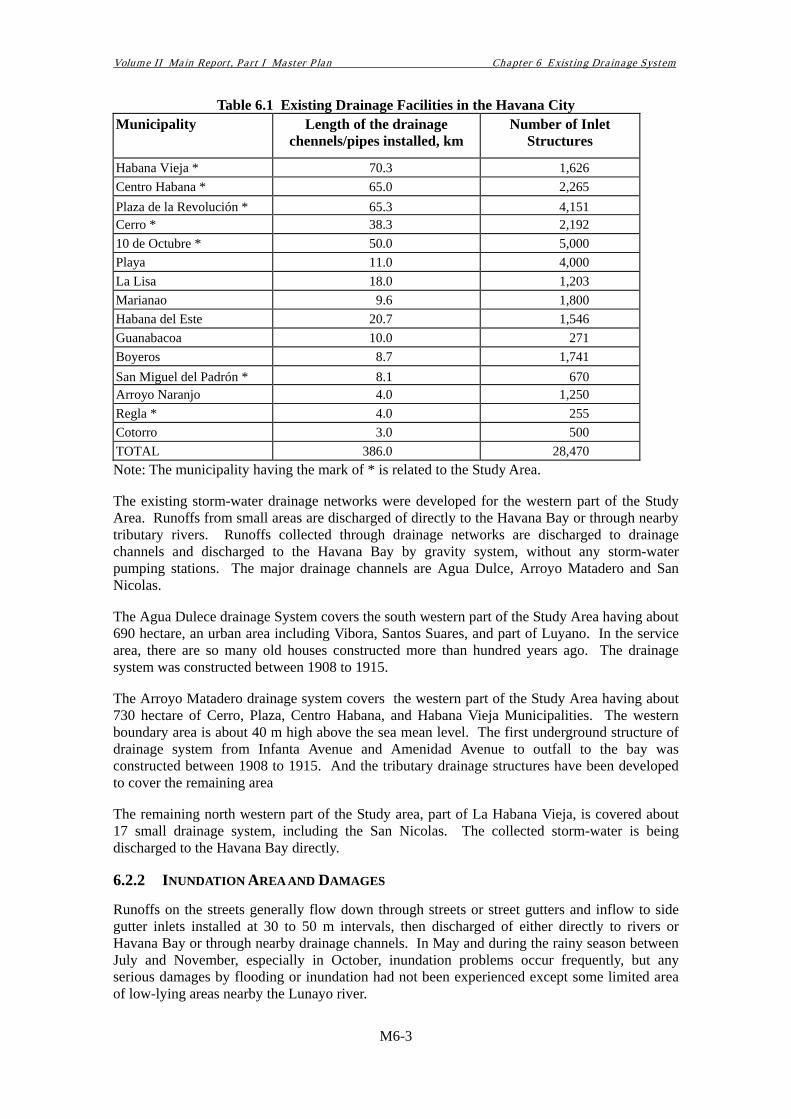
The drainage system in the Havana City have been developed since 1908. The culvert structures and pipes of 386km in total length, 28,470 nos. street drain inlets have been installed as shown in the table below. Among them, the structures of 146km in length were constructed during 1908 and 1915 to cover the urban area of 25 km2.

M6-2
Volume II Main Report, Part I Master Plan Chapter 6 Existing Drainage System
THE DEVELOPMENT STUDY ON THE IMPROVEMENT OF SEWERAGE AND DRAINAGE SYSTEM FOR THE HAVANA BAY
JAPAN INTERNATIONAL COOPERATION AGENCY
Figure 6.1 Overview of Drainage Area and Existing Drainage System
M6-3
Volume II Main Report, Part I Master Plan Chapter 6 Existing Drainage System
Table 6.1 Existing Drainage Facilities in the Havana City Municipality Length of the drainage
chennels/pipes installed, km Number of Inlet
Structures
Habana Vieja * 70.3 1,626 Centro Habana * 65.0 2,265 Plaza de la Revolución * 65.3 4,151 Cerro * 38.3 2,192 10 de Octubre * 50.0 5,000 Playa 11.0 4,000 La Lisa 18.0 1,203 Marianao 9.6 1,800 Habana del Este 20.7 1,546 Guanabacoa 10.0 271 Boyeros 8.7 1,741 San Miguel del Padrón * 8.1 670 Arroyo Naranjo 4.0 1,250 Regla * 4.0 255 Cotorro 3.0 500 TOTAL 386.0 28,470 Note: The municipality having the mark of * is related to the Study Area.
The existing storm-water drainage networks were developed for the western part of the Study Area. Runoffs from small areas are discharged of directly to the Havana Bay or through nearby tributary rivers. Runoffs collected through drainage networks are discharged to drainage channels and discharged to the Havana Bay by gravity system, without any storm-water pumping stations. The major drainage channels are Agua Dulce, Arroyo Matadero and San Nicolas.
The Agua Dulece drainage System covers the south western part of the Study Area having about 690 hectare, an urban area including Vibora, Santos Suares, and part of Luyano. In the service area, there are so many old houses constructed more than hundred years ago. The drainage system was constructed between 1908 to 1915.
The Arroyo Matadero drainage system covers the western part of the Study Area having about 730 hectare of Cerro, Plaza, Centro Habana, and Habana Vieja Municipalities. The western boundary area is about 40 m high above the sea mean level. The first underground structure of drainage system from Infanta Avenue and Amenidad Avenue to outfall to the bay was constructed between 1908 to 1915. And the tributary drainage structures have been developed to cover the remaining area
The remaining north western part of the Study area, part of La Habana Vieja, is covered about 17 small drainage system, including the San Nicolas. The collected storm-water is being discharged to the Havana Bay directly.
6.2.2 INUNDATION AREA AND DAMAGES
Runoffs on the streets generally flow down through streets or street gutters and inflow to side gutter inlets installed at 30 to 50 m intervals, then discharged of either directly to rivers or Havana Bay or through nearby drainage channels. In May and during the rainy season between July and November, especially in October, inundation problems occur frequently, but any serious damages by flooding or inundation had not been experienced except some limited area of low-lying areas nearby the Lunayo river.

M6-4
Volume II Main Report, Part I Master Plan Chapter 6 Existing Drainage System
Figure 6.1 also shows the areas where occasional inundations occur. Typical inundation areas can be classified into the followings:
low-lying area nearby the three tributary rivers,
low-lying and flat area in the urban center,
area where earth’s surface gradient change a lot, i.e. from hill to flat area,
area where major drainage pipes join.
In the low-lying area nearby the tributary rivers, inundation and flooding have been experienced. In the Luyano river, a flood was occurred in 1982 and caused damages to the residents and industries. Occasional inundations are experienced in the following area: Virgen del Camino, its triburary stream of Pastrana, the interception zone between Luyano Avenu and Calzada de Concha, and F street zone between 12 street and Linea de Ferrocarril.
In low-lying area and flat area in the urban center, the gradient of drainage pipes installed are generally small, thus the drainage capacity of the pipes tends to be inefficient. In the place where the general earth’s surface gradients change greatly, i.e. from a hilly area to bay flat area, the drainage capacity of the pipes and channels are reduced rapidly, because the water flow rate in the drainage system is high in hilly area and becomes low rapidly in flat area. In areas where major drainage pipes join, inundation occurs when the storm-water exceeds the downstream drainage system capacity
The operation and maintenance of the storm-water drainage system in the Study is conducted by the managerial system of National Institute of Water Resources (INRH), such as Mixed Company Aguas de La Habana and Water and Supply & Sanitation Company of Havana East in the Study Area. Weekly and monthly operation and maintenance (O/M) plans are regularly prepared, executed and finally reported as a routine work. However, those O/M plans and works are limited for the street drainage pipes having diameter smaller than 20” (500mm) due to no maintenance equipment for the larger drainage system.
Any serious damages due to inundation have not been experienced in those areas. The major nuisances are interruption of smooth traffic in the area.
In any city, uncontrolled disposal of garbage and other solid wastes into drainage networks and open drainage channels will accumulate solids wastes and cause water stagnations and resulting in water contamination and odor emanation troubles. Such inundations can be frequently occurred in high population density areas. However, in the Study Area, any serious problems related to the uncontrolled disposal of solid wastes are not occurred to the existing drainage system. The appropriate solid wastes management are expected to practice continuously.
6.2.3 PHYSICAL CONDITIONS OF DRAINAGE SYSTEM
National Institute of Water Resources (INRH) and its Provincial Delegation of Resources of the City of Havana (DPRH) are responsible for planning and implementation of the storm-water drainage system in the Study Area. And as mentioned above, Mixed Company Aguas de La Habana and Water and Supply & Sanitation Company of Havana East are responsible agencies for O/M of the system in the Study Area.
Since the existing drainage system have been used more than 90 years, the capacity of the system must be reduced from the original capacity. The design capacity of the existing drainage system cannot be evaluated easily because the original design documents, design calculation papers and profiles of drainage pipes installed are not available.
The available data and information on the existing drainage system is a facility plan described in
M6-5
Volume II Main Report, Part I Master Plan Chapter 6 Existing Drainage System
two sheets of map on a scale of 1 to 5,000, providing the location and dimensions of pipes and channels installed as shown in Figure 6.2.
In the following section, a preliminary methodology to evaluate the present capacity of the existing drainage system will be explained briefly.
6.2.4 HYDRAULIC CAPACITY OF DRAINAGE SYSTEM
As mentioned previous section, the existing drainage system cannot be examined its capacity due to limited data. Therefore, in the Study the drainage capacity of the existing drainage system will be examined and evaluated in the following manner and procedures:
Estimation of Storm-Water Runoffs
Estimation and evaluation of the drainage capacity of the existing major drainage facilities.
(1) Estimation of Storm-Water Runoffs
1) Basic Conditions
Storm-water runoffs will be estimated based the rational method. The rational method of hydrologic analysis consists of an empirical formula that attempts to relate rainfall and runoff through use of a single coefficient. The basic equation is:
Q = 1/360 CIA
Where, Q: the peak runoff rate, m3/sec C: the runoff coefficient reflecting characteristics of the drainage area and the collection system. I: the average rainfall intensity, mm/hr A: the drainage area, ha
In the formula, the runoff coefficient will be provided based on the Cuban design criteria for each drainage area to be examined, considering drainage area conditions of land use, soil characteristics, and general slopes of the topography.
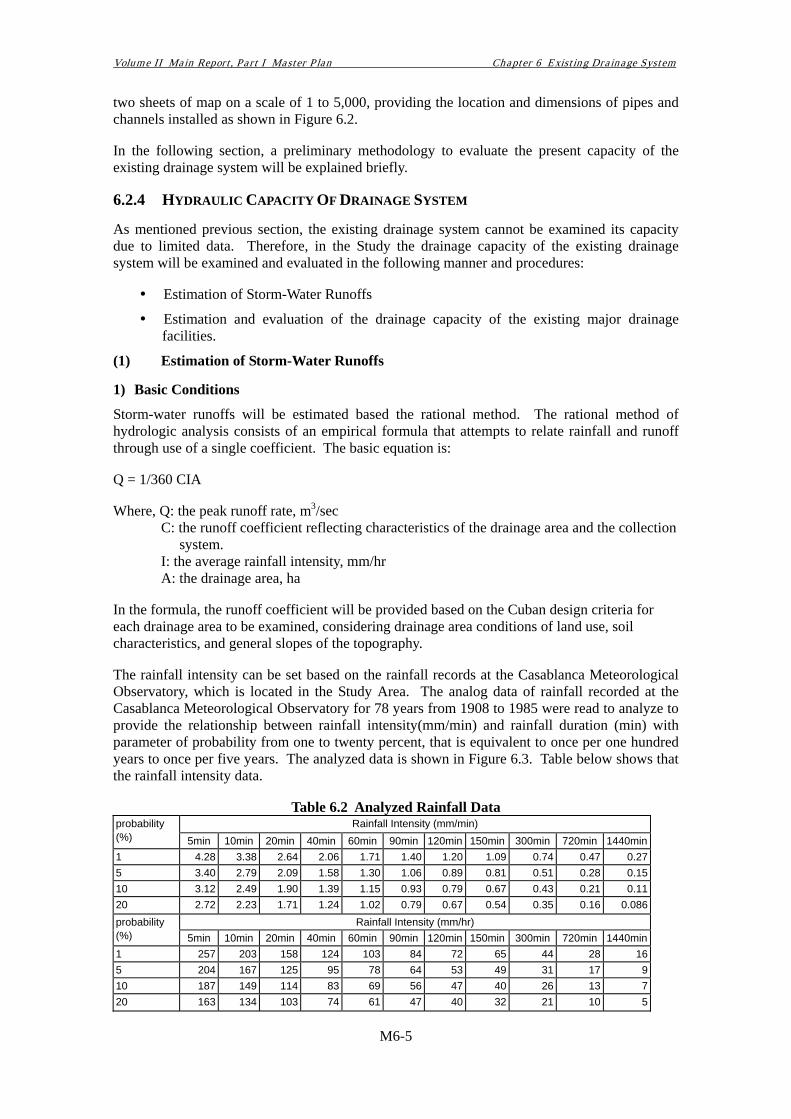
The rainfall intensity can be set based on the rainfall records at the Casablanca Meteorological Observatory, which is located in the Study Area. The analog data of rainfall recorded at the Casablanca Meteorological Observatory for 78 years from 1908 to 1985 were read to analyze to provide the relationship between rainfall intensity(mm/min) and rainfall duration (min) with parameter of probability from one to twenty percent, that is equivalent to once per one hundred years to once per five years. The analyzed data is shown in Figure 6.3. Table below shows that the rainfall intensity data.
Table 6.2 Analyzed Rainfall Data Rainfall Intensity (mm/min) probability
(%) 5min 10min 20min 40min 60min 90min 120min 150min 300min 720min 1440min 1 4.28 3.38 2.64 2.06 1.71 1.40 1.20 1.09 0.74 0.47 0.27 5 3.40 2.79 2.09 1.58 1.30 1.06 0.89 0.81 0.51 0.28 0.15 10 3.12 2.49 1.90 1.39 1.15 0.93 0.79 0.67 0.43 0.21 0.11 20 2.72 2.23 1.71 1.24 1.02 0.79 0.67 0.54 0.35 0.16 0.086
Rainfall Intensity (mm/hr) probability (%) 5min 10min 20min 40min 60min 90min 120min 150min 300min 720min 1440min 1 257 203 158 124 103 84 72 65 44 28 16 5 204 167 125 95 78 64 53 49 31 17 9 10 187 149 114 83 69 56 47 40 26 13 7 20 163 134 103 74 61 47 40 32 21 10 5

M6-6
Volume II Main Report, Part I Master Plan Chapter 6 Existing Drainage System
Source: INRH
THE DEVELOPMENT STUDY ON THE IMPROVEMENT OF SEWERAGE AND DRAINAGE SYSTEM FOR THE HAVANA BAY
JAPAN INTERNATIONAL COOPERATION AGENCY
Figure 6.2 Existing Major Drainage Facilities

M6-7
Volume II Main Report, Part I Master Plan Chapter 6 Existing Drainage System
Source: “ESTUDIO SOBRE LOS CICLOS DEL AGUA EN LA HABANA, TOMO I, Ciuda de
La Habana, Enero 1997”, financed by METROPOLIS-UNION EUROPA
THE DEVELOPMENT STUDY ON THE IMPROVEMENT OF SEWERAGE AND DRAINAGE SYSTEM FOR THE HAVANA BAY
JAPAN INTERNATIONAL COOPERATION AGENCY
Figure 6.3 Relationship between rainfall intensity and rainfall duration based on rainfall data at Casablanca Meteorological Observatory for 78 years between 1908 and 1985

M6-8
Volume II Main Report, Part I Master Plan Chapter 6 Existing Drainage System
For the reference, the data is analyzed by the “specific coefficient methods” and provided to express the rainfall intensity as the form of “Talbot”.
IN = RN β10N = RN a’/ (t + b)
β10N = I10
N / I60N , I60
N = RN
a’ = b + 60, b = (60-10β10N) / (β10
N - 1)
Where, β : Specific Coefficient R: 60 min. Rainfall (mm/hr) N: Probable Year in N years
Figure 6.4 shows the calculated Talbot-type rainfall intensity to compare the collected data.
In case of ten year return period, the Tablot-type rainfall intensity is as expressed as follows:
I = 6,400 / (T + 33)
2) Estimation of Storm-Water Runoffs in the existing drainage basins
The existing drainage area is divided into four sub-drainage basins to estimate the storm-water runoffs as shown in Figure 6.5: Dren Matadero Catchment, Dren Agua Dulce Catchment, Dren Pastrana Catchment, and Dren Lawton Catchment. These four sub-drainage basins are further divided into smaller area taken into consideration of the existing drainage pipe alignment, to estimate the storm-water runoff and to compare to the capacity of the respective existing drainage pipe.
The runoff coefficient C for the Rational method is set at 0.6 for Dren Matadero Catchment and 0.5 for other three sub-drainage basins. Time of flow, which is the required time for water to flow in a storm drain from the point of entrance to any given location beyond the inlet, is estimated as the combination of the time of concentration and the travel time in pipe as shown below:
Time of flow (System Time) = Time of Concentration + Travel Time in Pipe
= Time of Concentration + (Length of Drain/Velocity)/60
Where, the time of concentration is assumed as 5 min. and the velocity in pipe is set at 3 m/s in average.
(2) Estimation of Drainage Capacity of the major drainage system
The drainage capacity of the system will be estimated based on the dimensions of pipes and box culvert structures and earth’s surface gradients where the structures are installed. The capacity will be estimated under the effective depth of 90% by the Manning formula, using roughness coefficients, n=0.013.
The calculated drainage capacity for the respective existing drainage system is shown in Table 6.3 to Table 6.6 to compare to the respective estimated storm-water runoffs in order to evaluate the drainage capacity.
The evaluation of each drainage system is summarized below.
As an overall evaluation, almost all of the present drainage pipes do not have enough capacity. The about half capacity to the required capacity

M6-9
Volume II Main Report, Part I Master Plan Chapter 6 Existing Drainage System
6.2.5 OTHER FINDINGS
The separate sewer system has been developed to collect wastewater and to discharge storm-water separately. However, the results of illegal connection surveys on the existing sanitary sewer system as mentioned in the previous section 5.2, some sanitary sewer mains were connected to the drainage channels/pipes by connecting pipes and structures to mitigate the insufficient capacity of sewers instead of improving the capacity by installation additional sewers or new sewers having larger size . This makeshift practice of using drainage system make the drainage systems as one of major pollutant source to the Havana Bay.
6.3 FUTURE PLANS There is no integrated/comprehensive drainage future plan based on a study on the present drainage situation in the Study Area. However, to solve the inundation problems and to improve the drainage situation, the responsible institutions have planed and proposed several plans, but the implementation of the proposed plan is still very limited. O/M plans for the existing drainage system are prepared regularly; weekly and monthly, and the performance of the plans is also reported.

M6-10
Volume II Main Report, Part I Master Plan Chapter 6 Existing Drainage System
THE DEVELOPMENT STUDY ON THE IMPROVEMENT OF SEWERAGE AND DRAINAGE SYSTEM FOR THE HAVANA BAY
JAPAN INTERNATIONAL COOPERATION AGENCY
Figure 6.4 Rainfall Intensity Expressed by Talbot-type
5% (20 year return period)10% (10 year return period)20% ( 5 year return period)
0
50
100
150
200
0 10 20 30 40 50 60 70
Rainfall Duration (min)
Rai
nfal
l (mm)
5% (Talbot type)10%(Talbot type)20%(Talbot type)5% (78 yrs Analyzed Data)10%(78 yrs Analyzed Data20%(78 yrs Analyzed Data)

M6-11
Volume II Main Report, Part I Master Plan Chapter 6 Existing Drainage System
6.4 WASTEWATER DISCHARGE FROM EXISTING DRAINAGE CHANNELS
6.4.1 EXISTING DATA
Results reported by CIMAB for Matadero and Agua Dulce are summarized in Table 6.3.
No fixed trend is observed except that the concentrations of BOD and COD in Matadero and Agua Dulce are reduced sharply in 2002 comparing with 1985 to 1994. However, the existing water quality data of drainage channels are very limited (only one date in each year), it is difficult to evaluate the changes of water quality in these drainage channels.
In addition, concentrations of T-P are higher than that of T-N, and the reason may be that some detergent factories (such as Debon Suchel located in Matadero basin, Jaiper Suchel located in Agua Dulce basin) discharged wastewater containing higher concentration of phosphorus into drainage channels.
Table 6.3 Water Quality of Drainage Channels 1985-2002 Parameter Matadero Agua Dulce 1985 1990 1994 2002 1985 1990 1994 2002 Flow, m3/d 109,964 67,991 64,800 77,760 48,384 35,701 45,144 62,675 BOD5, mg/L 202 307 264 115 97 123 91 83 COD, mg/L 449 697 581 144 458 475 353 139 T-N, mg/L 5.3 - - 7.8 2.5 - - 14.6 T-P, mg/L - 43.4 - 13.5 16.6 23.9 6.9 30 SS, mg/L - - - 291 81 - - 85 Source: CIMAB 4)
6.4.2 WATER QUALITY SURVEY IN DRAINAGE CHANNELS AND SEWER
(1) General
Water quality survey of drainage channels and sewer was carried in October and December 2002 by CENHICA/CIMAB under the Study. Sampling locations are shown in Figure 6.5. Table 6.4 shows the details of sampling.
Table 6.4 Water Quality Survey in Drainage Channels and Sewer Water Sampling Locations and Date Drainage
Channels and Sewer Wet Season Dry Season
Matadero 1 location (S2) 10-11 October 2002 (9:00 to 6:00)
1 location (S2) 17-18 December 2002 (9:00 to 6:00)
Agua Dulce 1 location (S3) 12-13 October 2002 (9:00 to 6:00)
1 location (S3) 18-19 December 2002 (9:00 to 6:00)
Caballeria 1 location (S1) 9-10 October 2002 (9:00 to 6:00)
1 location (S1) 16-17 December 2002 (9:00 to 6:00)
Total 3 locations 3 locations Source: JICA Study Team
One composite sample was made at each location combining samples taken at hourly proportional to the river flow. Analytical parameters are as follows:
pH, Water Temperature, conductivity, COD, BOD5, DO, SS, SO42-, T-N, NH4
+-N, NO2--N, NO3
--N, T-P, PO4
3--P, SiO2, Petroleum Hydrocarbon, Fecal Coliform, Phenol, Arsenic (As), Cadmium (Cd), Cobalt (Co), Copper (Cu), Iron (Fe), Total Mercury (Hg), Manganese (Mn), Nickel (Ni), Lead (Pb), Vanadium (V), and Zinc (Zn)

M6-12
Volume II Main Report, Part I Master Plan Chapter 3 Environmental Conditions, Laws and Standards
THE DEVELOPMENT STUDY ON THE IMPROVEMENT OF SEWERAGE AND DRAINAGE SYSTEM FOR THE HAVANA BAY
JAPAN INTERNATIONAL COOPERATION AGENCY
Figure 6.5 Sampling Locations of Water Quality Survey for Drainage Channels and Sewer (S1, S2,S3)

M6-13
Volume II Main Report, Part I Master Plan Chapter 6 Existing Drainage System
(2) Survey Results
1) Flow rate
Results of flowrate measurement at the outlets of Matadero and Agua Dulce and at Caballeria are shown in Figure 6.6. No significant seasonal variations of flowrates are recognized in drainage channels of Matadero and Agua Dulce. The average flowrates, based on 24 hours measurement, are close to those of existing data as shown in Table 6.3.
2) Water Quality
The major water characteristics in the drainage channels of Matadero and Agua Dulce are summarized in Table 6.5.
Table 6.5 Water Quality in Drainage Channels and Sewer Matadero Agua Dulce Caballeria (Sewer)
Parameter Wet Season
Dry Season
Wet Season
Dry Season
Wet Season
Dry Season
Cuban Standard NC27 (C)
BOD, mg/l 32 30 22 29 30 15 60 COD, mg/l 62 98 44 106 73 33 120 SS, mg/l 89 58 61 86 71 66 - T-N, mg/l 10 8.4 7.5 9.2 6.5 8.5 20 T-P, mg/l 1.0 0.6 1.3 0.9 5.4 1.2 10 Fecal. Coliform, MPN/100ml 70×105 40×103 50×105 30×105 17×106 30×105 -
Source: JICA Study Team
It is not observed a significant difference in wastewater characteristics both in drainage channels and sewer. This indicates that the drainage channels collect and discharge wastewater having same characteristics of the wastewater in sewer.
The organic strength of wastewater in sewer both in wet and dry seasons is very weak compared to typical domestic wastewaters in ordinary separate sewer system: weak of 100 mg/L and medium strength of 200mg/L in term of BOD concentration. Existing data (Table 6.3) shows that those typical organic strength of wastewater has been experienced. Reasons why very weak strength wastewater are taken in sewer should be identified through a comprehensive surveys. One of the reasons is a dilution with runoff and infiltration/inflow of groundwater due to illegal connections as specified in previous section and may be a dilution with leaked drinking water.
High value of fecal coliform (observed at drainage channels of Matadero (0.4 to 30 x 105 MPN/100 mL)and Agua Dulce (30 to 50 x 105 MPN/100 mL) also indicates that wastewater in drainage channels contains raw sewage to a large extent.

M6-14
Volume II Main Report, Part I Master Plan Chapter 6 Existing Drainage System
THE DEVELOPMENT STUDY ON THE IMPROVEMENT OF SEWERAGE AND DRAINAGE SYSTEM FOR THE HAVANA BAY
JAPAN INTERNATIONAL COOPERATION AGENCY
Figure 6.6 Results of Flowrates Measurement at Drainage Channels and Sewer
Flow in Caballeria (Wet season, 9 Oct. 2002)
0
50
100
150
0:00 3:00 6:00 9:00 12:00 15:00 18:00 21:00
Time of day
Flow
Rat
e (1
0,00
0 m
3 /d)
Average Flow=6.6 m3/s
Flow in Agua Dulce (Wet season, 12 Oct. 2002)
0
4
8
12
16
20
0:00 3:00 6:00 9:00 12:00 15:00 18:00 21:00
Time of day
Flow
Rat
e (1
0,00
0 m
3 /d)
Average Flow=0.99 m3/s
Flow in Matadero (Wet season, 10 Oct. 2002)
0
4
8
12
16
0:00 3:00 6:00 9:00 12:00 15:00 18:00 21:00
Time of day
Flow
Rat
e (1
0,00
0 m
3 /d)
Average Flow=0.83 m3/s
Flow in Caballeria (Dry season, 16 Dec. 2002)
0
50
100
150
0:00 3:00 6:00 9:00 12:00 15:00 18:00 21:00
Time of day
Flow
Rat
e (1
0,00
0 m
3 /d)
Average Flow=4.17 m3/s
Flow in Agua Dulce (Dry season, 18 Dec. 2002)
0
4
8
12
16
20
0:00 3:00 6:00 9:00 12:00 15:00 18:00 21:00
Time of day
Flow
Rat
e (1
0,00
0 m
3 /d)
Average Flow=0.99 m3/s
Flow in Matadero (Dry season, 17 Dec. 2002)
0
4
8
12
16
0:00 3:00 6:00 9:00 12:00 15:00 18:00 21:00
Time of day
Flow
Rat
e (1
0,00
0 m
3 /d)
Average Flow=0.87 m3/s

Volume II Main Report, Part I Master Plan Chapter 7 Present Organization
M7-1
CHAPTER 7 PRESENT ORGANIZATION
7.1 GENERAL In general terms, it may be said that there are two leading agencies in charge of the water sector in Cuba.
The National Institute of Water Resources (INRH) is the governmental agency responsible for the Water Supply and Sanitation Sector. (The Ministry of Public Health also plays an important role in the control and monitoring of potable water supplies).
The Ministry of Science, Technology and Environment is the governmental agency responsible for the nation’s Environmental Management
In addition, the Local Bodies of the Popular Power in Cuba are formed by the Assemblies of Popular Power established within the political-administrative jurisdictions at national, provincial and municipal level. They are the superior organs of government and are invested with the highest authority of the state through local administrations to direct the economic activities, production and services of a local character.
Regarding the operation of the water supply and sanitation sector, in addition to the two leading agencies there are a number of extra-sectoral agencies that also contribute to the sector. The general organization chart is given in Figure 7.1, and the extra-sectoral agencies in Figure 7.2.
In the case of the City of Havana, the city itself is a province and the governing body is the Provincial People’s Administrative Council. For the implementation of the law and legal base on water resources and the environment, the governing body is the Provincial Delegation of Resources of the City of Havana of the National Institute for Hydraulic Resources (DPRH).
7.2 INSTITUTIONS RELATED TO HAVANA BAY WATER ENVIRONMENT
7.2.1 CENTRAL GOVERNMENT INSTITUTIONS
As stated previously, the Ministry of Science, Technology and Environment (CITMA) is the governmental agency responsible for the nation’s Environmental Management, and hence is the overall central government agency responsible for matters of environmental concern to Havana Bay. In addition, the following central government institutions play an important role:
(MINTRANS) Ministry of Transport
(MINSAP) Ministry of Health
(MIP) Ministry of Fisheries
(MINAG) Ministry of Agriculture
The functions of the Ministries in relation to Havana Bay are shown in Figure 3.10.

Volume II Main Report, Part I Master Plan Chapter 7 Present Organization
M7-2
THE DEVELOPMENT STUDY ON THE IMPROVEMENT OF SEWERAGE AND DRAINAGE SYSTEM FOR THE HAVANA BAY
JAPAN INTERNATIONAL COOPERATION AGENCY
Figure 7.1 Water and Sanitation Sector, -General Organization Chart for Operation
See Figure 7.2
National Assembly Council of State
Council of Ministers(Cabinet)
INRHNational Institute forHydraulic Resources
MINSAPMinistry of
Public Health
Other RelatedMinistries & Institutions
DPRHProvincial Delegation
of HydraulicResources
Provincial Hygiene &Epidermiology Center
Provincial People'sAdministrative Council
Municipal People'sAdministrative Council
Local Municipal Officesof the Enterprises
Municipal Hygiene &Epidermiology Center
Family DoctorWater Supply &
Sewerage Systems orAreas
Peoples Council
InterrelationshipRegulated by Legal
Provisions for Powers andRole
Control & Monitoring ofPotable Water Supplies,and sets standards forPotable Water and LiquidWaste
Regulatory Instituterepresenting the sector to
the state andinternational agencies
Attends to the PotableWater and Sanitation
Sector through theProvincial Enterprises
Water & SanitationEnterprises
Both Provincial andMunicipal Centers:1. Perform State Sanitary Inspections (SSI).2. Impart Education in Environmental and Occupational Health.3. Coordinate Protection of the Environment at their level
GEAAManagerial Group of
Aqueduct & Sanitation
Carry out Operation andMaintenance of the
Systems

Volume II Main Report, Part I Master Plan Chapter 7 Present Organization
M7-3
THE DEVELOPMENT STUDY ON THE IMPROVEMENT OF SEWERAGE AND DRAINAGE SYSTEM FOR THE HAVANA BAY
JAPAN INTERNATIONAL COOPERATION AGENCY
Figure 7.2 Extra-Sectoral Agencies to the Water and Sanitation Sector
From Figure 7.1
Other Related Ministies andInstitutions
Coordinated through theNational Information System
Interrelationships at NationalProvincial & Municipal Levels
Ministry ofEconomy and
Planning
Institute of Physical
Planning
Ministry of Finance and
Prices
Ministryof Construction
NationalInstitute of
WaterResources
Ministry ofHigher
Education:Ministry ofEducation
CITMAMinistry of
ScienceTechnology &Environment
Civil Defence
Directives forDevelopment of
the NationalEconomy
Master Plans forHuman andMunicipal
Settlements
Project activitiesand AppliedResearch
FinancialMechanisms and
Monitoring
Professional &Technical
Training linkedwith Ministry ofPublic Health
EnvironmentalManagement and
ScientificResearch
Supply ofTechnical
Material for WaterSupply &SewerageSystems
Prevention ofNatural
Disasters

Volume II Main Report, Part I Master Plan Chapter 7 Present Organization
M7-4
There is also a National Council for Hydraulic Basins comprising representatives of INRH and CITMA. These operate at provincial level, and for the City of Havana, CITMA provide the president, and IHRH the vice president.
7.2.2 OTHER INSTITUTIONS
Two of the most important institutions related to Havana bay are:
(CENHICA) The National Center for Hydrology and Water Quality, which conducts scientific investigations, promotes technology for basin protection and produces water quality standards.
(CIMAB) Cuba’s Center for Engineering and Environmental Management of Bays and Coastal Zones, which is an enterprise agency for environmental projects and plays a role in water quality and contamination of the Bay.
Central government agencies, together with other organizations are involved in the environmental protection of the bay, including the feeder-rivers that contribute to the pollution, these are:
Water Quality of the Bay CIMAB and GTE (under the Ministry of Transport)
Contamination of the Bay CIMAB, GTE, and CITMA (Provincial level, City of Havana)
Water Quality of Rivers “Enterprise of Hydraulic Usage” (EAH)
Contamination of Rivers “Enterprise of Hydraulic Usage” (EAH)
EAH levies charges for the use of raw water, as well as being responsible for terrestrial waters. In addition, there is a Technical Committee, which serves as a technical, administrative and scientific body for Havana Bay.
7.3 GTE
7.3.1 OBJECTIVES AND POLICIES
The State Working group for Cleaning up Conservation and Development for the Havana Bay (GTE) was approved on 15th June, 1998 by “Acuerdo” 3300 by the Executive Committee of the Council of Ministers of the Republic of Cuba.
GTE operates under the Ministry of Transport and its president has overall responsibility, together with the Provincial Administrative Council of the Popular Power for the City of Havana, and the vice presidents of CITMA.
GTE is involved with all development activities of the Bay, together with both national and international institutions and organizations.
GTE’s objectives are to elaborate, coordinate and project actions for solutions to keep control of the discharge of wastewater and to reduce the pollution load. To request from other organizations and enterprises that are direct or indirect sources of pollution of the bay, that they have short, medium, and long-term solutions to the problem. To control taxes approved by the ministry of Finance and Prices in relation to Havana Bay tourism and commerce.
From the actual situation in Havana Bay today, GTE look to the future scenario with procedures, identification of permanent solutions and alternatives in a continuous, progressive process of environmental management at local level, with the objective of:
Volume II Main Report, Part I Master Plan Chapter 7 Present Organization
M7-5
Rehabilitation (Working with the past)
Resolution (Working with the present)
Prevention (Working with the future)
7.3.2 ORGANIZATIONAL STRUCTURE
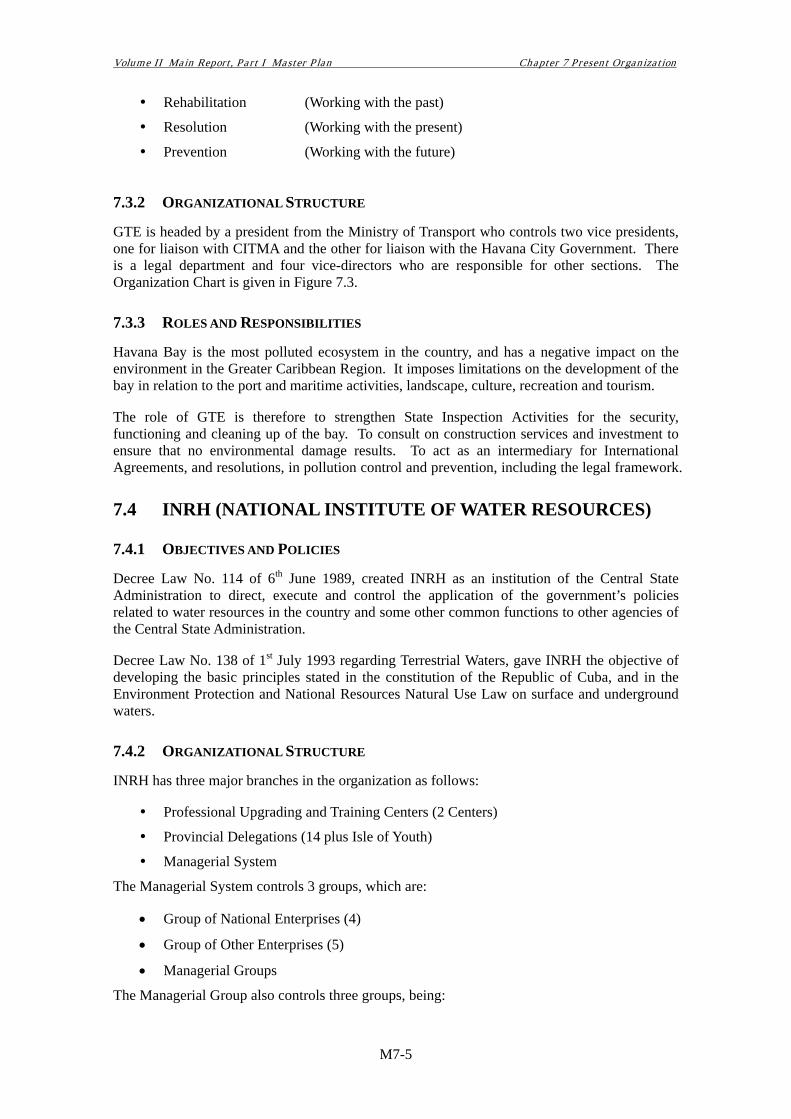
GTE is headed by a president from the Ministry of Transport who controls two vice presidents, one for liaison with CITMA and the other for liaison with the Havana City Government. There is a legal department and four vice-directors who are responsible for other sections. The Organization Chart is given in Figure 7.3.
7.3.3 ROLES AND RESPONSIBILITIES
Havana Bay is the most polluted ecosystem in the country, and has a negative impact on the environment in the Greater Caribbean Region. It imposes limitations on the development of the bay in relation to the port and maritime activities, landscape, culture, recreation and tourism.
The role of GTE is therefore to strengthen State Inspection Activities for the security, functioning and cleaning up of the bay. To consult on construction services and investment to ensure that no environmental damage results. To act as an intermediary for International Agreements, and resolutions, in pollution control and prevention, including the legal framework.
7.4 INRH (NATIONAL INSTITUTE OF WATER RESOURCES)
7.4.1 OBJECTIVES AND POLICIES
Decree Law No. 114 of 6th June 1989, created INRH as an institution of the Central State Administration to direct, execute and control the application of the government’s policies related to water resources in the country and some other common functions to other agencies of the Central State Administration.
Decree Law No. 138 of 1st July 1993 regarding Terrestrial Waters, gave INRH the objective of developing the basic principles stated in the constitution of the Republic of Cuba, and in the Environment Protection and National Resources Natural Use Law on surface and underground waters.
7.4.2 ORGANIZATIONAL STRUCTURE
INRH has three major branches in the organization as follows:
Professional Upgrading and Training Centers (2 Centers)
Provincial Delegations (14 plus Isle of Youth)
Managerial System
The Managerial System controls 3 groups, which are:
• Group of National Enterprises (4)
• Group of Other Enterprises (5)
• Managerial Groups
The Managerial Group also controls three groups, being:

Volume II Main Report, Part I Master Plan Chapter 7 Present Organization
M7-6
• Managerial Group of Hydraulic Use (14 Enterprises)
• Managerial Group of Aqueducts and Sanitation (21 Enterprises)
• Managerial Group of Research, Projects and Engineering (7 Groups). (NB: CENHICA; the National Center for Hydrology and Water Quality was recently added as an Investigative Center).
The Organization Chart, showing the structures and functions of the various sections, with those applicable to this study highlighted, is given in Figure 7.4.
7.4.3 ROLES AND RESPONSIBILITIES
INRH has the following roles and responsibilities:
• To organize and direct in coordination with other government organizations, the protection of terrestrial waters, basins, natural beds, hydraulic works and facilities against pollution and other problems of deterioration and degradation, as well as the systematic control of water quality
• To determine, together with other organizations, the regulations required to protect the economic and social objects, and the environment against noxious effects on territorial waters. Organize insurance, and actions for the control, safety and good functioning of all hydraulic facilities, protecting against floods, underground drainage and the yield capacity of natural and artificial beds.
• To determine and keep updated hydraulic the data for the hydraulic potential of the country, and provide hydrological data on surface and underground water, rain and evaporation
• To propose hydraulic development strategies and to regulate and control projects and investments for hydraulic works
• To plan, regulate and control hydraulic resources, and the operation, technical surveillance and maintenance of hydraulic works and facilities
• To determine and keep updated the studies and evaluations of hydropower potential etc.
• To regulate and control aqueduct, sewerage and pluvial drainage activities
• To organize and guarantee the operation of a National Registration of Terrestrial Waters. The register will contain details of concessions, assignments, and allowances related to the use of water and its preservation, in accordance with the law
Volume II Main Report, Part I Master Plan Chapter 7 Present Organization
M7-7
M7-7
JAP
AN
INTE
RN
ATIO
NA
L CO
OP
ER
ATIO
N A
GE
NC
Y
THE
DE
VE
LOP
ME
NT S
TUD
Y ON
THE
IMP
RO
VE
ME
NT O
F S
EW
ER
AG
E A
ND
DR
AIN
AG
E S
YS
TEM
FOR
THE
HAVA
NA B
AY
Figure 7.3 O
rganization Chart of G
TE
PRESIDENT
Vice-President(Popular Power)
Vice President(CITMA)
Driver
Vice-Director General
Vice-Directorate
EnvironmentalManagement
Vice-Directorate
Prevention &Cleaning Up
Vice-DirectoratePlanning
Information &Development
Vice-Directorate
Economics
3 Specialists
1 Specialist1 Boat Captain1 Boat Pilot
3 Specialists2 Translators1 Analyst2 Drivers
2 Specialists1 Financial
Attendant for AdministrativeActivities

Volume II Main Report, Part I Master Plan Chapter 7 Present Organization
M7-8
M7-8
JAP
AN
INTE
RN
ATIO
NA
L CO
OP
ER
ATIO
N A
GE
NC
Y
THE
DE
VE
LOP
ME
NT S
TUD
Y ON
THE
IMP
RO
VE
ME
NT O
F S
EW
ER
AG
E A
ND
DR
AIN
AG
E S
YS
TEM
FOR
THE
HAVA
NA B
AY
Figure 7.4 O
rganization Chart of IN
RH
National Instituteof Water Resources
INRH
ProvincialDelegations
ProfessionalUpgrading & Training
CentersManagerial group ofResearch, Projects &
Engineering
National Center forHydrology and Water
QualityCENHICA
OtherCompanies
NationalEnterprises
14 delegationsplus
Isle of youthsIncluding
Provincial Delegationof Resources of the
City of HavanaDPRH
5 companies
includingMixed Company
Aguas de La Habana
Managerial system
Implementing theLaw and LegalBase on water
Resources,Environment &Optimization ofSubstructureExploitation
Managerial group ofHydraulic Use
(14 enterprises)including
Managerial Groupof Aquaduct &
sanitation(21 enterprises)
Managerial Group ofResearch, Projects &
Engineering(8 Groups)
1. PUTC MaximoGomez Baez
2. PUTC FaustinoPerez Hernandez
Qualifying & raisingprofessional &Technical staff
levels
Conducts scientificinvestigations,
promotes technologyfor basin protection &
water quality
In charge of directing, executing &controlling implementation of state &government policy on national water
resources activities
Mixed capitalcompany, by means ofa Concession for the
operation andmaintenance of water
supply, sewerage,sanitation and drainage
in 8 municipalities
4 companies
Water Supply &Sanitation Company
of Havana East
Operation &Maintenance ofWater Supply,
sewerage system& Drainage
Engineering servicesincluding Water supply,
Sewerage systems,Drainage, Treatment
Plants & PumpingStations
Enterprise ofHydraulic Usage of
Havana CityEAH
Water Provisionservices, or the rightof use of raw water
sources, andwastewater disposal
rights
Volume II Main Report, Part I Master Plan Chapter 7 Present Organization
M7-9
7.5 CITMA (MINISTRY OF SCIENCE, TECHNOLOGY AND ENVIRONMENT)
7.5.1 OBJECTIVES AND POLICY
Law No. 81 of 1999 is the Law of the Environment and Article 11 states:
“The Ministry of Science, Technology and Environment (CITMA) is the governmental agency of the Central Administration of the State in charge of proposing environmental policy and guiding its execution through the coordination and control of the nation’s environmental management, promoting its coherent integration in order to contribute to sustainable development.”
The purpose of the law is to establish the legal principles to govern environmental policy and the basic legal requirements to regulate environmental management.
CITMA oversees national environmental policies to achieve the following goals:
Increase and strengthen environmental controls to assure compliance with legislation
Redefine procedures for assessing environmental impacts and applying resulting recommendations
Modernize and complete national environmental legislation
Achieve a major integration between environmental management and national science
As the institution responsible for environmental management, CITMA has a duty to uphold the objectives of the law, which are:
To create a legal context that favors the design and development of socio-economic activities in ways that are compatible with the protection of the environment
To establish principles to guide the actions of natural and legal persons in environmental matters, including the mechanisms for coordination among the various agencies and bodies for efficient management
To promote public participation in environmental protection and in sustainable development
To develop public awareness regarding environmental problems by integrating education, disclosure, and environmental information
To regulate the development of evaluation, control and surveillance activities regarding the environment
To foster the protection of human health, improvement of the quality of life and of the environment in general
7.5.2 ENVIRONMENTAL STRATEGY
The National Environmental Strategy is aimed at indicating the ideal ways to preserve and develop the environmental achievement of the Revolution. Cuba is serious on its drive to protect the environment as can be seen from the events starting over a quarter of a century ago.
In 1976, the environment was included in the constitution (Article 27), and a National Commission for the Protection of the Environment and Preservation of Natural Resources was created. Law No. 33 “Protection of the Environment and the Rational Use of Natural Resources” was passed in 1981, and Decree Law 118 “Structure, Organization, and function of the National System for the Protection of the Environment and its Ruling Body” was passed in

Volume II Main Report, Part I Master Plan Chapter 7 Present Organization
M7-10
1990. (These laws were subsequently modified by the issue of Law of the Environment No. 81).
Following Cuba’s participation in the Rio Earth Summit in 1992, Cuba adapted Agenda 21 into its National Program of Environment and Development, and created CITMA in 1994. The National Environmental Strategy was formulated in 1996, and is continuously updated.
CITMA oversees and coordinates the implementation of the Environmental Strategy, which is an integrated system with interrelated components, and very much a cross-cutting issue involving many other ministries and institutions. The instruments for the implementation of the strategy are:
National Program of Environment and Development
Environmental Planning
Environmental Legislation
Environmental Impact Assessment
Environmental Licensing Process
State Environmental Inspection
Scientific Research and Technological Innovation
Environmental Education and Dissemination
Instruments for Economic Regulation
Environmental Indicators for decision making
International Environmental Policy
These instruments are fully described in the National Environment Strategy Second Issue/May 2000.
7.6 WATER AND SEWERAGE CORPORATIONS 7.6.1 GENERAL
The Water and Sewerage Corporations of Ciudad de la Habana fall under the jurisdiction of INRH in the Managerial Groups section (see figure 7.4). INRH’s mission is to direct, supervise, control and evaluate the results of each entity.
Until 1998 the Water, Sewerage and Drainage for Cuidad de la Habana was under the jurisdiction of the IHRH Provincial Authority, DPRH. Now there are four Corporations which have as a fundamental managerial objective, the operation and maintenance of water supply services, sewerage systems, and pluvial drainage for the parts of the systems they control.
These four corporations cover a total population of about 2.188 million and an area of 727km2, with about 4,000km of water supply distribution network, 1,600km of sewers and 120,000 septic tanks. These are:
Aguas de la Habana
Acueducto del Este
Acueducto del Sur
Acueducto del Cotorro

Volume II Main Report, Part I Master Plan Chapter 7 Present Organization
M7-11
(1) Aguas de la Habana
This organization is the largest in the city and its service area covers most of central Havana and the western part of the city both inside and outside the Study Area. The supply area covers the municipalities of Centro Habana, Habana Vieja, Diez de Octubre, Cerro, Plaza (all forming part of the Study Area),and Marianao, Playa, and La Lisa. The population served is 1,221,130 (about 40% in the Study area), with a water supply network of about 1,792km, a sewer network of about 1,174km, and over 60,000 septic tanks. The workforce totals 2,865
Aguas de la Habana is a mixed capital company with a 45% shareholding by Barcelona Water (Grupo Aguas de Barcelona), 5% by an individual and 50% by INRH Barcelona Water are responsible for the management, and operation and maintenance of the water supply, sanitation and drainage facilities in the metropolitan area of the city. The concession commenced on 1st April 2000 and is for a period of 25 years (renewable). The former entity was the Water & sewerage Corporation del Oeste which came into being in 1998 serving only the municipalities of Marianao, Playa, and La Lisa.
(2) Acueducto del Este
Acueducto del este is a Cuban enterprise under the jurisdiction of INRH and is responsible for the operation and maintenance of the hydraulic resources and infrastructure in the eastern part of Ciudad de la Habana. The supply area covers the municipalities of Habana del Este, Guanabacoa, Regla, San Miguel del Padron (all forming part of the study area), part of the municipalities of Diez de Octubre and Cotorro, and Guanabo including the eastern beaches area. The population served is 487,839 (about 47% in the Study Area), with a water supply network of about 1,148km, a sewer network of about 562km, and about 33,500 septic tanks. The total workforce numbers 1,113
(3) Acueducto del Sur
This is a Cuban enterprise under the jurisdiction of INRH and is responsible for the operation and maintenance of the hydraulic resources and infrastructure in the southern part of Ciudad de la Habana. The supply area of 217km2 covers the municipalities of Arroyo Naranjo and Boyeros. In addition to the piped water supply and water borne sewerage there are about 27,000 septic tanks. The total workforce numbers 723, and the enterprise was formed in 1999.
Whereas Arroyo Naranjo is inside the Study Area the population only makes up about 4% of the total Study Area population, and sewers will not be extended in this municipality by this study.
(4) Acueducto del Cotorro
This is a Cuban enterprise under the jurisdiction of INRH and is responsible for the operation and maintenance of the hydraulic resources and infrastructure in the municipality of Cotorro which is outside the study area. The supply area is about 66km2 with a population served of 74,400. 48% of the population is connected to the sewers and there are about 4,000 septic tanks. The total workforce numbers 228, and the enterprise was formed in 1999.
(5) Major Enterprises in the Study Area
Aguas de la Habana and Acueducto del Este are the main subject of this chapter as they both have large populations within the Study area, and will be affected by any rehabilitation and extensions to the sewerage system which may result from this study.
Further detailed statistics of the operating information of these entities are given in the following Table 7.1

Volume II Main Report, Part I Master Plan Chapter 7 Present Organization
M7-12
Table 7.1 Statistics - Aguas de la Habana & Acueducto del Este Description Unit Aguas de la
Habana Acueducto del
Este Volume of Water Produced Hm3/year 323 154 Population Served by Piped Water Persons 1,221,130 487,839 Length of Water distribution Network km 1,792 1,148 Population served by Tanker Truck Persons 27,594 15,511 Ratio of Population served by Piped Water % 98% 96% Population connected to sewers Persons 854,723 30,414 Length of Sewer Network km 1,174 562 Population Served by Septic Tanks Persons 388,000 457,425 Ratio of Population Served by Sewers % 69% 6% No. of Septic Tanks Number 60,224 33,500 Cleaning of Septic Tanks Times/year 9,873 2,790 Volume of Wastewater to sewers Hm3/year 116 20 Volume of Wastewater Treated Hm3/year 20 N/A Cleaning of Sewers Times/year 20,408 N/A Cleaning of Storm Drainage hopper Times/year 98,142 N/A Source: Aguas de la Habana, Acueducto del Este
7.6.2 AGUAS DE LA HABANA
(1) General Structure
Under the direction of the General Manager and Deputy General Manager, this mixed enterprise company is comprised of eight departments as follows:
Technical (1567 Staff) Engineering and Construction (174 Staff) Commercial (97 Staff) Accounting and Logistics (151 Staff) Information Systems (71 Staff) Human Resources (39 Staff) General Secretariat and Legal (6 Staff) Client Care (97 Staff)
Further details of the organization are given in Figure 7.5.
(2) Technical Department
The technical Department is responsible for the operation and maintenance of the whole hydraulic system, the six major sections are:
Zoning & Unaccounted for Water
Production and Electrical & Mechanical
Operations
Construction
Water Pipe Maintenance
Sewerage and Drainage

Volume II Main Report, Part I Master Plan Chapter 7 Present Organization
M7-13
Out of a total workforce of 1,567, the Sewerage and Drainage division has 437 workers. This division is responsible for the sewerage technical section, treatment section, and the central and western sewerage and drainage bases. Further details of the organization are given in Figure 7.6.
(3) Operation & Maintenance for Sewerage & Drainage
This sub-department (2 staff) of the main Technical Department has two sections and two bases as described below:
Technical Section (8 staff)
The Technical Section is staffed by engineers and is mainly responsible for all technical engineering matters concerning the operation and maintenance of the sewerage system.
Treatment Section (57 staff)
This section deals mainly with the operation of the main Casablanca sewerage conveyance system and the small Quibu wastewater treatment plant and lagoons in the western area. The Casablanca system includes the screens, siphon, Casablanca pumping station, tunnel, and sea outfall. In addition, responsibility includes the operation of another nine sewerage pumping stations, and the emptying of the large septic tanks and disposal into various points in the collector system.
Central Sewerage and Drainage Base (169 staff)
Maintenance operations are carried out from this base in two areas which are:
No. 1 La Habana Vieja and Centro Habana
No. 2 Cerro and Diez du Octubre
Western Sewerage and Drainage Base (201 staff)
Maintenance operations are carried out from this base in two areas which are:
No. 3 Marianao and Plaza de la Revolucion
No. 4 La Lisa and Playa
The western base is also responsible for the emptying and disposal to collectors of the small domestic septic tanks and all drilling and well development for septic tanks.
(4) Engineering and Construction
This department has divisions for Investment, Planning Systems, Projects and Planning, Quality Control, Laboratory (potable water), and a Wastewater Laboratory. Further details of the organization are given in Figure 7.7.
(5) Commercial Management
The Sales Office (Commercial Department), has sections for Prime Customer Care and Collection (US$ payers), a billing section and a collection section. This office is being progressively trained to connect with branch offices in each municipality which are able to connect to the central computer system and provide customers with up to date information. In addition information regarding incidents of loss of water supply, bursts, emptying of septic tanks etc. can all be accessed.

Volume II Main Report, Part I Master Plan Chapter 7 Present Organization
M7-14
(6) Accounting and Logistics
This department has divisions for Financial, Accounting and Administrative Control, Billing and Collection, and an administrative section for Prime Customer collection.
(7) Information System
The main divisions and sections are Internal Control, Financial, Accounting and Administration Control, Purchasing and Storage and transport.
The system installed adopts all of the corporative applications of Aguas de Barcelona, to enable the whole enterprise to be administered in an integrated manner. This unique data base provides for efficient information management, and the advanced technology forms the basis of this relatively new organization.
(8) Human Resources Department
The human Resources department has three sections being, Management and Training, Safety/Health/Work environment, and Personnel.
In the first 2 years as a mixed capital enterprise many important tasks have been carried out. The first major task was the development of an organizational structure (No. of workers and Wages etc) taking into consideration the labor legislation, Society Statutes, and the main Institutions related to Aguas de la Habana, in close collaboration with the Trade Union representatives.
At central government level, Resolution No. 50-2001 of the Ministry of Labor and Social Security establishes regulations for direct contracts with mixed enterprises labor, for workers in water supply, sewerage, sanitation and pluvial drainage.
At present there are 700 professionals and technicians, one third of the payroll is female who make up 63% of the technicians. Special attention is paid to the workers, and training in 2000 and 2001 totaled over 25,000 and 32,000 hours respectively, representing 5% of the working hours. The program concentrates on security, health and the environment at the workplace.
(9) Other Services
These include a small Secretariat and Legal department, a large Customer Care department, a General Services section, a Security and Protection section, and a Mechanization division.
(10) Support Offices
Support offices include 8 workshops, 10 bases, and 15 commercial offices.

Volume II Main Report, Part I Master Plan Chapter 7 Present Organization
M7-15
THE DEVELOPMENT STUDY ON THE IMPROVEMENT OF SEWERAGE AND DRAINAGE SYSTEM FOR THE HAVANA BAY
JAPAN INTERNATIONAL COOPERATION AGENCY
Figure 7.5 Organization Chart of Aguas de la Habana
Source: Aguas de la Habana (No. of Employees at 1st September 2002)
General Manager (1)
Deputy General Manager (1)
General Secretariat & Legal Department (6)
Client Care & Assistance Department (397)
Technical Department
(1567)
Engineering &
Construction Dept (174)
Sales Dept.
(97)
Accounting & Logistics
Dept (151)
Information Systems
Dept. (71)
Human Resources
Dept (39)
Management & Training
Section (4)
Safety Health/Work Environment Section (6)
Personnel Division
(24)
Institutional Communic-
ation Section (7)
Development &
Maintenance Division (19)
Systems & Telecoms.
Division (16)
Storage & Transport Division
(76)
Internal Control Section
(4)
Financial Division
(10)
Prime Customer
Care (4)
Prime Customer Collection Admin(11)
CollectionDivision
(22)
Wastewater Laboratory
Section (11)
Investment Division
(37)
Planning System Division
(59)
Billing Division
(49)
Projects & Planning Division
(35)
Quality Control Division
(13)
Laboratory division
(20)
Zoning & Unaccounted
For Water Section (6)
Production & Elec/Mech
Division (270)
Operation Division
(189)
Sewerage & Drainage Division
(437)
Construction Division
(237)
Water Pipe Maintenance
Division (435)
Accounting & Admin. Control
Division (39)
Purchasing Division
(18)
Information Development
Division (18)

Volume II Main Report, Part I Master Plan Chapter 7 Present Organization
M7-16
THE DEVELOPMENT STUDY ON THE IMPROVEMENT OF SEWERAGE AND DRAINAGE SYSTEM FOR THE HAVANA BAY
JAPAN INTERNATIONAL COOPERATION AGENCY
Figure 7.6 Organization Chart for the Technical Department of Aguas de la Habana
Source: Aguas de la Habana (No. of Employees at 1st September 2002)
Technical Department (3)
Zoning & Unaccounted for Water Section (6)
Production & Electrical & Mechanical Division (3)
Operations Division
(1)
Sewerage & Drainage Division
(2)
Construction Division
(6)
Water Pipe Maintenance
Division (3)
Planning & Production
Control Section (11)
Western Production
Section (61)
Central Production
Section (101)
Electrical Machines Workshop
(19)
Machine Workshop
(36)
Electrical & Mechanical Workshop
(40)
Trouble-shooting Section
(35)
Operations Centre Section
(8)
Water distribution
Section (44)
Water Pipe & Intake
Section (101)
Sewerage Technical Section
(8)
Organic Treatment
Section (57)
Central Sewerage &
Drainage Base (169)
Western Sewerage &
Drainage Base (201)
Diving & Special Works
Section (8)
Technical Section
(3)
Large Conduit
Base (48)
Re-habilitation
Base (47)
Western Water Pipe
Base (175)
Central Water Pipe
Base (111)
Meter Reading
Base (146)
Civil Works & Technical Assurance Base (115)

Volume II Main Report, Part I Master Plan Chapter 7 Present Organization
M7-17
THE DEVELOPMENT STUDY ON THE IMPROVEMENT OF SEWERAGE AND DRAINAGE SYSTEM FOR THE HAVANA BAY
JAPAN INTERNATIONAL COOPERATION AGENCY
Figure 7.7 Organization Chart for the Engineering & Construction Department of Aguas de la Habana
Source: Aguas de la Habana (No. of Employees at 1st September 2002)
Engineering & Construction Department (3)
Wastewater Laboratory Section (11)
Investment Division
(8)
Planning Systems Division
(2)
Projects &Planning Division
(2)
Quality Control Division
(1)
Laboratory Division
(7)
Investment Control Section
(11)
Works Survey &
Wells Section (25)
GIS Section
(26)
Automation Section
(8)
Flow Measurement
& Model Section (23)
Projects Section
(23)
Planning Section
(10)
Quality Section
(3)
Normaliz—ation
Section (9)
Meter CalibrationWorkshop
Potable Water
Laboratory Section (13)
Volume II Main Report, Part I Master Plan Chapter 7 Present Organization
M7-18
7.6.3 WATER & SEWERAGE CORPORATION DEL ESTE
(1) General Structure
Under the direction of the General Manager and Deputy General Manager, this Cuban enterprise has three small sections dealing with legal, auditing and enterprise restructuring. At the next level there are four departments for the projection and control of the enterprise. These are:
Economy and Finance (7 Staff) Personnel (39 Staff) Engineering (13 Staff) Commercial (Sales) (5 Staff)
(2) Basic Enterprise Units
Below the four departments there are four Basic Enterprise Units which provide management and support, these are:
Logistics & Equipment Unit
The areas of responsibility of this unit include logistics, equipment, and internal services for the Enterprise.
Accounting Unit
The basic accounting for the enterprise has been simplified by the use of the computerized billing system at Aguas de la Habana. There is a charge for the provision of this service.
Water supply Unit
This unit has a staff of 539 and is responsible for water production, operation, and maintenance of the water distribution network. Testing of potable water is the responsibility of the Ministry of Health.
Sewerage and Drainage Unit
This unit has a staff of 124 and is responsible for maintenance of both the sewer and drainage networks, and for the cleaning of septic tanks. In addition, the unit is responsible for the operation and maintenance of one pumping station and the Wastewater treatment plant (oxidation ponds) in the Guanaboa area. Analysis of wastewater is the responsibility of this enterprise and testing is done by Aguas de la Habana for a fee.
(3) Other Services
The next level deals with billing and collection at the five commercial offices located in Habana del Este (3 brigades), Guanabacoa (4 brigades), San Miguel del Padron (4 brigades), Regla and Guanaboa (1 brigade each).
Further details of the organization are given in Figure 7.8.

Volume II Main Report, Part I Master Plan Chapter 7 Present Organization
7-19
THE DEVELOPMENT STUDY ON THE IMPROVEMENT OF SEWERAGE AND DRAINAGE SYSTEM FOR THE HAVANA BAY
JAPAN INTERNATIONAL COOPERATION AGENCY
Figure 7.8 Organization Chart of Acueducto del Este
Source: Acueducto del Este
General Manager (1)
Deputy General Manager (1)
Lawyer (1)
Enterprise Restructuring (1)
Audit Section (3)
Economy and Finance
Department (7)
Personnel Department
(8)
Engineering Department
(13)
Commercial Department
(5)
Logistics & Equipment Unit (106)
Accounting Service Unit
(7)
Water Supply Unit
(539)
Sewerage & Drainage Unit (124)
Habana del Este
Commercial Office (72)
Guanabacoa Commercial
Office (57)
Regla Commercial
Office (30)
Guanabo Commercial
Office (59)
SMP Commercial
Office (74)
M8-1
Volume II Main Report, Part I Master Plan Chapter 8 Current Financial Situation
CHAPTER 8 CURRENT FINANCIAL SITUATION
8.1 CENTRAL GOVERNMENT The central Government budgets from 1996 through 2001 (Table 8.1) have been relatively stable. Both the revenues and the expenditures have kept approximately the same ratios against GDPs. As the result, the fiscal deficit has remained under 3 percent since 1996 that can be viewed as a sound level. Increases in tax rates, together with new taxes, user charges and price increases on non-essential goods, were introduced to reduce in those years. Direct taxation is being reintroduced, and a new tax-collecting system is being developed. There is no information segregated into water and sanitation sector in the expenditure. The However the expenditures for public health that include this spending have increased. They have been about 1.6 billion pesos in 1999, 1.7 billion in 2000, and 1.8 billion in 2001, accounting for around 11 percent of the expenditure and 6 percent of GDP during those years. Other big items on the spending side are education, social security, and subsidy for state enterprises. Education spending has considerably increased. Social security payment had been reduced in constant peso terms. Subsidy for state enterprises that is mainly composed of subsidy for loss and subsidy for price difference has been steadily reduced.

M8-2
Volume II Main Report, Part I Master Plan Chapter 8 Current Financial Situation
Table 8.1 State Finance
8.2 LOCAL GOVERNMENT The study area is located in the City of Havana Province. Under this province there are 15 municipalities, out of which 10 municipalities are included in the Study Area. Those 10 municipalities are Plaza de la Revolución, Centro Habana, La Habana Vieja, Regla, La Habana
(Million pesos at current prices)1996 1997 1998 1999 2000 2001
REVENUE
Direct Taxes 1,892.7 2,745.8 3,137.5 3,554.6 3,976.9 4,353.6 Profits tax 468.5 849.6 1,131.8 1,333.3 1,534.5 1,717.5 Employment tax 248.9 562.3 706.1 817.1 970.0 1,102.2 Personal income tax 216.1 263.4 274.6 288.8 291.2 286.1 Social security contributions 959.2 1,070.5 1,025.0 1,115.4 1,181.2 1,247.8
Indirect Taxes 5,512.9 5,329.9 5,543.3 6,336.3 6,732.3 6,386.1 Sales tax 5,079.0 4,876.2 5,076.4 5,786.4 6,130.7 5,721.6 Service tax 433.9 453.7 466.9 549.9 601.6 664.5
Non-taxation income 4,837.2 4,127.9 3,821.2 3,528.3 4,206.0 4,293.8 Payments by state enterprises 2,685.0 2,014.7 1,907.5 1,514.8 1,553.5 1,661.2 Other non-tax income 2,152.2 2,113.2 1,913.7 2,013.5 2,652.5 2,632.6
TOTAL REVENUE 12,242.8 12,203.6 12,502.0 13,419.2 14,915.2 15,033.5
EXPENDITURE Current expenditure for budgeted activity 6,938.6 6,807.8 7,081.6 8,122.2 9,233.3 10,405.5 Education 1,421.3 1,453.9 1,509.7 1,829.6 2,094.6 2,368.6 Public health 1,190.3 1,265.2 1,344.9 1,553.1 1,683.8 1,796.6 Defense 496.7 637.5 537.1 752.3 879.6 1,273.8 Social Security 1,630.2 1,635.9 1,705.1 1,785.7 1,785.6 1,870.3 Administration 397.5 431.2 437.8 457.4 509.1 565.2 Housing and communal services 462.4 487.6 565.5 684.3 763.0 827.2 Productive area 154.6 155.5 159.0 156.7 172.7 163.5 Culture and arts 165.2 164.7 168.8 191.0 233.8 310.7 Science and technology 113.6 109.2 104.1 128.1 154.3 163.6 Sports 117.5 121.5 125.9 140.7 158.0 163.4 Social assistance 128.4 135.2 145.4 157.6 178.8 215.2 Other activities 473.3 475.2 484.6 517.8 620.0 687.4 Change in inventory, accounts payable and others 187.6 -264.8 -206.3 -232.1 - -
Current expenditure for enterprise activity 2,605.7 2,236.2 2,588.4 2,669.8 3,075.7 2,622.2 Subsidy for loss 1,624.4 1,350.0 1,139.4 770.3 586.1 393.4 Subsidy for price difference 867.3 757.9 1,352.0 1,781.2 2,218.9 1,900.2 Fund for production stabilization - - - - 100.0 - Other allocation 114.0 128.3 97.0 118.3 170.7 328.6 Economic assistance to agricultural cooperatives 600.6 718.1 384.8 199.5 98.9 63.8 Capital spending 2,043.4 1,839.0 1,580.8 2,063.0 1,749.3 1,989.7 Extraordinary spending 239.1 680.6 1,000.0 555.6 - - Fund for budget stabilization - - - - 1,000.0 140.0
Reserve Financial operation 386.1 380.9 426.1 420.8 430.2 549.8
TOTAL EXPENDITURE 12,813.5 12,662.6 13,061.7 14,030.9 15,587.4 15,771.0
Balance - 570.7 - 459.0 - 559.7 - 611.7 - 672.2 - 737.5 % of GDP -2.5% -2.0% -2.4% -2.3% -2.4% -2.5%Source: National Statistics Office, Annual Statistics of Cuba 2001

M8-3
Volume II Main Report, Part I Master Plan Chapter 8 Current Financial Situation
del Este, Guanabacoa, San Miguel del Padrón, Diez de Octubre, Cerro, and Arroyo Naranjo. Those province and municipalities has its own governments. The budgets and the production of those local governments are analyzed subsequently. 8.2.1 CITY OF HAVANA PROVINCIAL GOVERNMENT The budget of the City of Havana has not been made available to the study team. It is said that revenues of provincial governments include revenues from provincial companies, employment tax, sales tax, and vehicle ownership tax. The expenditures include education, public health, and social security. The production of major activities in the City of Havana is shown in Table 8.2.
Table 8.2 Production of the City of Havana
(Year 2002, Unit: Million peso)Manufacturing
Electric energy 20Fuel 262Mining and metal 40Mining and non-metal 6Construction machine 9Electric machines 33Metal products 27Chemical 91Paper 35Printing 45Wood processing 12Construction material 53Glass and ceramic 2Textile 6Garment 31Leather 14Food processing 257Fish processing 76Beverage and tobacco 112Other industrial activities 59
Total 1,189Construction 76Agriculture 33Transport
Goods transport 181Personal transport 153
Total 333Tourism 329Grand Total 1,627
Notes: - This breakdown of production includes only selected items in a "basket".- Total production of Havana City in 2002 was 5,821 million peso.- Both the 1,627 and the 5,821 million pesos include production outside Havana City. If a company is headquartered in Havana City and its operation is extended to outside Havana City, the production in other provinces are also included.Source: Havana City Territorial Office of Statistics

M8-4
Volume II Main Report, Part I Master Plan Chapter 8 Current Financial Situation
8.2.2 MUNICIPAL GOVERNMENT The budgets of the 10 municipalities (Plaza de la Revolución, Centro Habana, La Habana Vieja, Regla, La Habana del Este, Guanabacoa, San Miguel del Padrón, Diez de Octubre, Cerro, and Arroyo Naranjo) have not been made available to the study team. Productions of those municipalities are summarized in Table 8.3. The production data are rather erratic. One of the reasons is that state economic planning decides the level of production of a particular industry based on the economic situation. As a result, municipalities that include affected industries may be also affected. Erroneous production reports submitted by each enterprise to the authority might also contribute to data incorrectness.
Table 8.3 Production of Municipalities
(Unit: million pesos)Municipality 1999 2000 2001
Plaza de la Revolucion 296 172 161 Centro Habana 141 155 162 La Habana Vieja 417 281 196 Regla 324 499 562 La Habana del Este 98 93 106 Guanabacoa 98 134 119 San Miguel del Padron 104 107 93 Diez de Octubre 151 198 151 Cerro 264 259 272 Arroyo Naranjo 107 118 138
Total 2,002 2,013 1,959 Note: All data ara production within municipality.Source: Havana City Territorial Office of Statistics

M8-5
Volume II Main Report, Part I Master Plan Chapter 8 Current Financial Situation
(1) Plaza de la Revolución This municipality is politically important because of concentration of governmental functions. In terms of industrial activities, the production is medium among the 10 municipalities. Metallurgy industry and production of motor and turbine are noticeable (Table 8.4). Some industry has a positive production in 2000 and zero production in 2001, or vice versa. One of the reasons is that state economic planning decides the production of a particular industry based on the economic situation. Erroneous production reports may also explain this phenomenon.
Table 8.4 Production of Plaza de la Revolución
(Thousand peso)Industry Year 2000 Year 2001
Ferrous metallurgy 20,300Production of motor and turbine 14,030Production of machine for metal works 3,010Production of technology machine and equipment 3,776 2,608Production of construction machine and equipment 3,311Production of professional equipment 5,114Production of other non-electric equipment and machine 740Repair and maintenance of vehicle 8,297Production of motorcycle and bicycle 2,624 3,862Repair and maintenance of motorcycle and bicycle 475 378Production of ship 301 3,952Repair and maintenance of electronic equipment 588 329Production of technical means for computer 1,053Production of furniture and principal accessory 1,097 602Production of other metallic products 816 245Production of pharmaceutical product 2,470Production of plastic article 1,539Production of paper, cardboard and paper pulp 3,133Printing 2,253 11,955Production of wooden furniture 11,339 27Production of asphalt product 1,150Production of refractory product 7Production of garment 429Production of shoes 6,165Construction 56,020 113,460Others 31,380 13,522
Total 171,510 160,842Source: Havana City Territorial Office of Statistics

M8-6
Volume II Main Report, Part I Master Plan Chapter 8 Current Financial Situation
(2) Centro Habana The production size is medium among 10 municipalities. Fertilizer and pharmaceutical product occupy a considerable share of the production.
Table 8.5 Production of Centro Habana
(Thousand peso)Industry Year 2000 Year 2001
Electric energy 910Ferrous metallurgy 9,619Repair and maintenance of motor and turbine 1,300 1,163Production of technology machine and equipment 1,625 3,399Production of professional equipment 91Production of vehicle 132 99Repair and maintenance of vehicle 3,381Repair and maintenance of motorcycle and bicycle 235 149Repair and maintenance of ship 5,511Repair and maintenance of equipment and industrial accessory 2,420Repair and maintenance of industrial apparatus 184Production of furniture and principal accessory 686 989Production of fertilizer 13,858 13,875Production of painting, coloring and pigment 3,376Production of pharmaceutical product 15,100 14,979Production of plastic article 7,174Printing 2,340Production of wooden furniture 105 833Stone cutting 343Production of concrete and prefabricated concrete piece 2,057 937Production of refractory product 926Production of glass and glass product 1,787Production of garment 696 1,163Construction 68,371 105,819Others 22,853 8,295
Total 155,151 161,629Source: Havana City Territorial Office of Statistics

M8-7
Volume II Main Report, Part I Master Plan Chapter 8 Current Financial Situation
(3) La Habana Vieja The production from 1999 to 2001 is the second biggest among 10 municipalities. This municipality has the oldest history of development. Thus, the economic activities include various manufacturing industries and commerce. A soap factory is one of large producers.
Table 8.6 Production of La Habana Vieja
(Thousand peso)Industry Year 2000 Year 2001
Electric energy 1,681Gas manufacturing 8,861 7,208Ferrous metallurgy 2,672Motor and turbine 5,772 5,523Production of technology machine and equipment 6,099 5,043Production of vehicle 196Repair and maintenance of vehicle 67 18Repair and maintenance of motorcycle 262Production of machine and industrial apparatus 1,329Production of electronic equipment 141Production of furniture and principal accessory 693 491Production of metallic structure product 690Production of metallic structure product 66Production of soap and perfume 23,550Production of pharmaceutical product 10,246 5,698Printing 16,313 2,834Production of wooden container 4,945Production of wooden furniture 287 896Stone cutting 8Production of concrete and prefabricated concrete piece 7,820Production of glass and glass product 74Production of garment 4,210Tanning of hide 5,599Production of shoes 5,012 6,270Production of other leather goods 5,463Construction 72,412 132,986Others 107,592 17,860
Total 280,730 196,157Source: Havana City Territorial Office of Statistics

M8-8
Volume II Main Report, Part I Master Plan Chapter 8 Current Financial Situation
(4) Regla The industrial production is the biggest among the 10 municipalities. Oil refinery is the largest industry. Various heavy and light industries also exist.
Table 8.7 Production of Regla
(Thousand peso)Industry Year 2000 Year 2001
Oil refinery 354,517 419,310Oil and lubricant 6,352Ferrous metallurgy 14,695Production of ship 1,362Repair and maintenance of ship 18,381Production of metallic structure product 634Production of other metallic products 3,082 3,228Production of soap and perfume 2,004Production of plastic article 29,836Printing 2,095Production of wooden furniture 409Production of garment 967Production of leather shoes 1,034Construction 73,372 101,951Others 18,201 9,214
Total 498,844 561,798Source: Havana City Territorial Office of Statistics

M8-9
Volume II Main Report, Part I Master Plan Chapter 8 Current Financial Situation
(5) La Habana del Este The production size is relatively small among 10 municipalities. Metallic structure product and vehicle stand out in the production data. Tourism also accounts for considerable part of production.
Table 8.8 Production of La Habana del Este
(Thousand peso)Industry Year 2000 Year 2001
Ferrous metallurgy 2,672Production of technology machine and equipment 4,881Production of vehicle 9,468 9,604Production of technical means for computer 4,678Production of furniture and principal accessory 83 78Production of metallic structure product 1,022 11,566Production of soap and perfume 6,794Production of veterinary product 4,414 179Production of plastic article 4,793 4,986Production of paper, cardboard and paper pulp 118Printing 569Production of wooden furniture 4,922 1,288Stone cutting 1,053Production of concrete and prefabricated concrete piece 848 1,176Production of refractory product 2,002 411Production of lacework 620Production of garment 1,350Production of leather shoes 4,313 4,817Construction 16,728 46,675Others 34,740 11,325
Total 92,627 105,544Source: Havana City Territorial Office of Statistics

M8-10
Volume II Main Report, Part I Master Plan Chapter 8 Current Financial Situation
(6) Guanabacoa The production size is relatively small among 10 municipalities. Metallurgy and its related production characterize the industrial activity of this municipality.
Table 8.9 Production of Guanabacoa
(Thousand peso)Industry Year 2000 Year 2001
Ferrous metallurgy 30,455 3,653Non-ferrous metallurgy 11,535Production of machine for metal works 2,464 2,636Production of technology machine and equipment 2,354 6,054Production of other non-electric equipment and machine 3,064 657Production of vehicle 2,221 2,228Repair and maintenance of vehicle 2,262Production of ship 315Repair and maintenance of equipment and industrial accessory 4,371Production of general hardware 13,943Production of metallic structure product 5,903 16,307Production of other metallic products 717 1,346Basi inorganic chemical 2,319 8,960Production of technical means for computer 225Production of tire and tube 4,682 2,692Production of plastic article 1,040 1,155Production of wooden furniture 668 1,026Stone cutting 8,277 6,705Production of concrete and prefabricated concrete piece 4,068 2,665Production of yarn and textile 4,522 1,043Production of lacework 2,532Production of garment 1,236 2,095Production of leather shoes 3,684Construction 24,174 30,611Others 16,949 8,696
Total 133,596 118,913Source: Havana City Territorial Office of Statistics

M8-11
Volume II Main Report, Part I Master Plan Chapter 8 Current Financial Situation
(7) San Miguel del Padrón The production size in 2001 is the smallest among 10 municipalities. A major weight of production comes from relatively high-tech industries such as computer related ones.
Table 8.10 Production of San Miguel del Padrón
(Thousand peso)Industry Year 2000 Year 2001
Ferrous metallurgy 1,870Non-ferrous metallurgy 2,027Production of machine for metal works 3,859Production of technology machine and equipment 11,243 7,919Repair and maintenance of construction machine and equipment 1,512Production of other non-electric equipment and machine 634Production of vehicle 15,088Production of electronic equipment 4,870Production of technical means for computer 12,945Production of general hardware 3,481 3,590Production of furniture and principal accessory 694 1,821Production of metallic structure product 605Production of other metallic products 3,430 3,004Production of soap and perfume 8,645Production of tire and tube 1,368Production of plastic article 2,498Printing 8,954Production of wooden container 6,112 1,380Production of door and window 528 522Production of wooden furniture 1,185Production of concrete and prefabricated concrete piece 6,593Production of refractory product 39Production of garment 270Construction 16,172 25,611Others 26,666 14,255
Total 106,891 92,502Source: Havana City Territorial Office of Statistics

M8-12
Volume II Main Report, Part I Master Plan Chapter 8 Current Financial Situation
(8) Diez de Octubre The production size is medium among 10 municipalities. Machinery, tires, and printing stand out among industrial productions.
Table 8.11 Production of Diez de Octubre
(Thousand peso)Industry Year 2000 Year 2001
Electric energy 12Ferrous metallurgy 8,518Repair and maintenance of motor and turbine 4,626 1,113Production of technology machine and equipment 17,270 20,852Repair and maintenance of construction machine and 544Production of professional equipment 440Production of vehicle 1,378Production of motorcycle and bicycle 3,764 9,602Repair and maintenance of motorcycle 246 76Production of machine and industrial apparatus 1,299Production of furniture and principal accessory 721 360Production of metallic structure product 708 167Production of other metallic products 6,121 4,184Production of painting, coloring and pigment 1,247Production of soap and perfume 823Production of pharmaceutical product 880Production of veterinary product 5,563Production of tire and tube 27,530Production of plastic article 452 72Printing 25,233Production of wooden container 8,925 3,759Production of door and window 1,274 1,310Production of wooden furniture 1,330 1,141Stone cutting 2,214Production of concrete and prefabricated concrete piece 7,271 135Production of lacework 552 1,302Production of garment 998Construction 62,501 96,127Others 11,009 5,030
Total 197,543 151,136Source: Havana City Territorial Office of Statistics

M8-13
Volume II Main Report, Part I Master Plan Chapter 8 Current Financial Situation
(9) Cerro The production of 2001 is the second biggest among 10 municipalities. This municipality is one of the oldest among the 10 municipalities. The range of industrial products produced here is quite wide. Soap and perfume product, pharmaceutical product, and vehicle related product stand out.
Table 8.12 Production of Cerro
(Thousand peso)Industry Year 2000 Year 2001
Electric energy 3,795Ferrous metallurgy 7,774Production of motor and turbine 1,059Motor and turbine 2,750 2,297Production of technology machine and equipment 1,034 3,807Production of construction machine and equipment 3,516Repair and maintenance of construction machine and equipment 16,182Production of professional equipment 5,346 1,821Production of other non-electric equipment and machine 6,312 5,812Production of vehicle 12,414 8,150Repair and maintenance of vehicle 1,173 106Repair and maintenance of motorcycle 379 548Production of ship 234Repair and maintenance of equipment and industrial accessory 353Repair and maintenance of electronic equipment 922Production of technical means for computer 1,530Production of furniture and principal accessory 2,028 2,133Production of metallic structure product 3,214 1,869Production of other metallic products 8,270 6,100Production of painting, coloring and pigment 102Production of soap and perfume 43,006Production of pharmaceutical product 12,773 18,353Production of veterinary product 3,045Production of tire and tube 1,399 2,749Production of plastic article 192 721Other chemical production 70Production of paper, cardboard and paper pulp 2,946Printing 3,804 10,013Production of wooden container 2,458 2,380Production of door and window 1,651 2,047Production of wooden furniture 1,734 2,927Stone cutting 1,749 170Production of concrete and prefabricated concrete piece 3,208 7,407Production of refractory product 3,601Production of lacework 548Production of garment 2,190 3,209Production of shoes 173Construction 111,844 127,192Others 31,194 15,245
Total 258,840 272,182Source: Havana City Territorial Office of Statistics

M8-14
Volume II Main Report, Part I Master Plan Chapter 8 Current Financial Situation
(10) Arroyo Naranjo The production size is relatively small among 10 municipalities. Repair and maintenance of electronic equipment, production of metallic product, and production of asphalt product are the biggest industrial activities among others.
Table 8.13 Production of Arroyo Naranjo
8.3 INRH (NATIONAL INSTITUTE OF WATER RESOURCES) INRH is the Cuban organization responsible for nationwide water and wastewater management, which is also a key collaborator of this study. The financial data of INRH has not been made available to the Study Team.
8.4 WATER SUPPLY AND WASTEWATER CORPORATIONS There exist three water and wastewater companies in the study area, which are Aguas de La Habana (Havana Water), Acueducto del Este (East water), and Acueducto Sur (South water). The distribution of population in each service area is summarized in Table 8.14. The five out of 10 municipalities included in the study area are served by Aguas de La Habana. Population-wise, these five municipalities account for about two thirds of total population in the study area. Acueducto del Este covers four municipalities and 29 percent of the population. The coverage of Acueducto Sur is marginal, accounting for one municipality and only four percent of the total population in the study area. The financial situations of the companies are analyzed in subsequent subchapters.
(Thousand peso)Industry Year 2000 Year 2001
Ferrous metallurgy 5,878Production of vehicle 4,023Production of technology machine and equipment 1,592Repair and maintenance of vehicle 163Production of machine and industrial apparatus 834 1,165Repair and maintenance of equipment and industrial accessory 3,038Production of machine and industrial apparatus 3,035 2,408Repair and maintenance of electronic equipment 14,221Production of general hardware 8,253Production of furniture and principal accessory 17Production of metallic structure product 16,111Production of other metallic products 453 81Production of pharmaceutical product 3,739Production of tire and tube 7,793Production of plastic article 1,116Production of asphalt product 16,726Production of concrete and prefabricated concrete piece 2,009 6,940Production of refractory product 1,211 929Production of garment 289Construction 39,307 85,262Others 18,601 10,245
Total 117,609 137,830Source: Havana City Territorial Office of Statistics

M8-15
Volume II Main Report, Part I Master Plan Chapter 8 Current Financial Situation
Table 8.14 Population Distribution and Service Coverage of Water Companies
Municipality Population in Study Area % Water service provider
Plaza 18,702 2% Aguas de La Habana Centro Habana 69,860 9% Aguas de La Habana Habana Vieja 105,104 14% Aguas de La Habana 10 de Octubre 212,988 28% Aguas de La Habana Cerro 97,317 13% Aguas de La Habana Regla 41,748 5% Acueducto del Este Habana del Este 15,293 2% Acueducto del Este Guanabacao 24,328 3% Acueducto del Este San Miguel 145,690 19% Acueducto del Este Arroyo Naranjo 31,007 4% Acueducto Sur
Total 762,037 100% Source: Study Team
8.4.1 AGUAS DE LA HABANA (HAVANA WATER) Aguas de La Habana (Havana water) is a Cuban-Spanish joint venture company, which was created in January 2000 and started the operation in April the same year. Prior to 2001, another state company under INRH provided water and sewerage service to the service area of Aguas de La Habana. The financial data of the company is only available from 2000. The financial status of Aguas de La Habana is presented in balance sheets (Table 8.15), income statements (Table 8.16), and application of funds (Table 8.17).
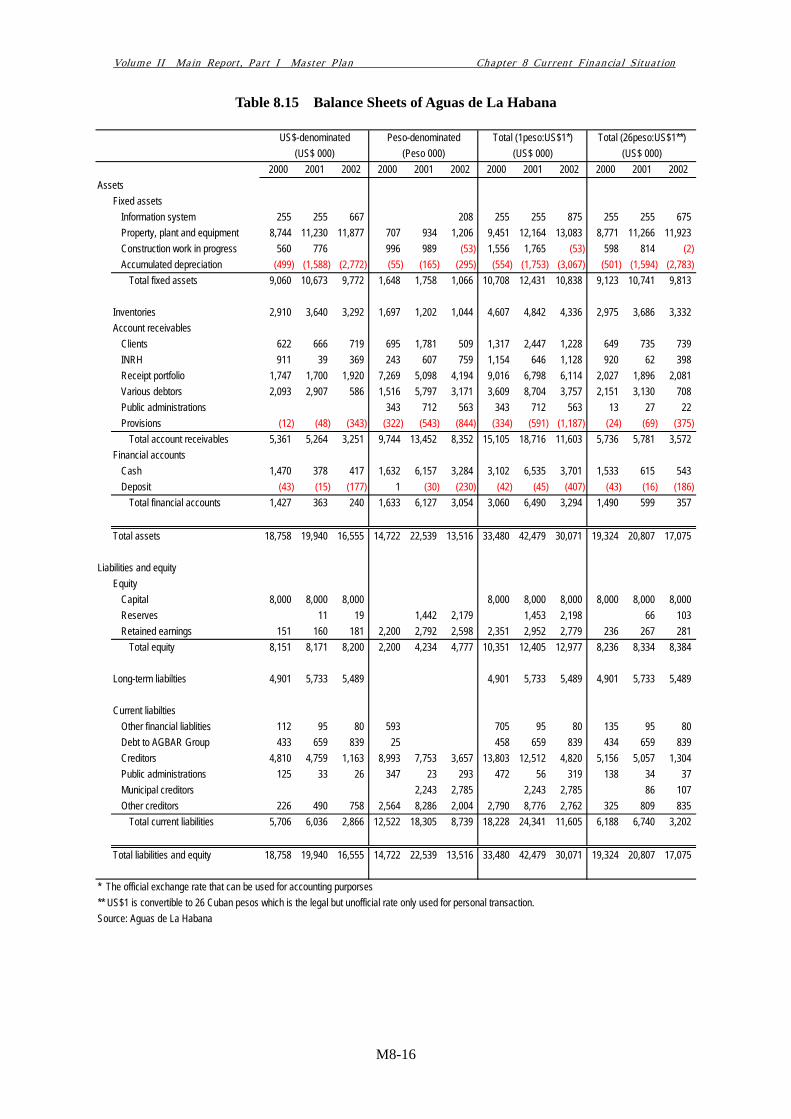
M8-16
Volume II Main Report, Part I Master Plan Chapter 8 Current Financial Situation
Table 8.15 Balance Sheets of Aguas de La Habana
2000 2001 2002 2000 2001 2002 2000 2001 2002 2000 2001 2002Assets
Fixed assetsInformation system 255 255 667 208 255 255 875 255 255 675Property, plant and equipment 8,744 11,230 11,877 707 934 1,206 9,451 12,164 13,083 8,771 11,266 11,923Construction work in progress 560 776 996 989 (53) 1,556 1,765 (53) 598 814 (2)Accumulated depreciation (499) (1,588) (2,772) (55) (165) (295) (554) (1,753) (3,067) (501) (1,594) (2,783)
Total fixed assets 9,060 10,673 9,772 1,648 1,758 1,066 10,708 12,431 10,838 9,123 10,741 9,813
Inventories 2,910 3,640 3,292 1,697 1,202 1,044 4,607 4,842 4,336 2,975 3,686 3,332Account receivables
Clients 622 666 719 695 1,781 509 1,317 2,447 1,228 649 735 739INRH 911 39 369 243 607 759 1,154 646 1,128 920 62 398Receipt portfolio 1,747 1,700 1,920 7,269 5,098 4,194 9,016 6,798 6,114 2,027 1,896 2,081Various debtors 2,093 2,907 586 1,516 5,797 3,171 3,609 8,704 3,757 2,151 3,130 708Public administrations 343 712 563 343 712 563 13 27 22Provisions (12) (48) (343) (322) (543) (844) (334) (591) (1,187) (24) (69) (375)
Total account receivables 5,361 5,264 3,251 9,744 13,452 8,352 15,105 18,716 11,603 5,736 5,781 3,572Financial accounts
Cash 1,470 378 417 1,632 6,157 3,284 3,102 6,535 3,701 1,533 615 543Deposit (43) (15) (177) 1 (30) (230) (42) (45) (407) (43) (16) (186)
Total financial accounts 1,427 363 240 1,633 6,127 3,054 3,060 6,490 3,294 1,490 599 357
Total assets 18,758 19,940 16,555 14,722 22,539 13,516 33,480 42,479 30,071 19,324 20,807 17,075
Liabilities and equityEquity
Capital 8,000 8,000 8,000 8,000 8,000 8,000 8,000 8,000 8,000Reserves 11 19 1,442 2,179 1,453 2,198 66 103Retained earnings 151 160 181 2,200 2,792 2,598 2,351 2,952 2,779 236 267 281
Total equity 8,151 8,171 8,200 2,200 4,234 4,777 10,351 12,405 12,977 8,236 8,334 8,384
Long-term liabilties 4,901 5,733 5,489 4,901 5,733 5,489 4,901 5,733 5,489
Current liabiltiesOther financial liablities 112 95 80 593 705 95 80 135 95 80Debt to AGBAR Group 433 659 839 25 458 659 839 434 659 839Creditors 4,810 4,759 1,163 8,993 7,753 3,657 13,803 12,512 4,820 5,156 5,057 1,304Public administrations 125 33 26 347 23 293 472 56 319 138 34 37Municipal creditors 2,243 2,785 2,243 2,785 86 107Other creditors 226 490 758 2,564 8,286 2,004 2,790 8,776 2,762 325 809 835
Total current liabilities 5,706 6,036 2,866 12,522 18,305 8,739 18,228 24,341 11,605 6,188 6,740 3,202
Total liabilities and equity 18,758 19,940 16,555 14,722 22,539 13,516 33,480 42,479 30,071 19,324 20,807 17,075
* The official exchange rate that can be used for accounting purporses** US$1 is convertible to 26 Cuban pesos which is the legal but unofficial rate only used for personal transaction.Source: Aguas de La Habana
US$-denominated Peso-denominated(US$ 000) (Peso 000) (US$ 000)
Total (1peso:US$1*) Total (26peso:US$1**)(US$ 000)

M8-17
Volume II Main Report, Part I Master Plan Chapter 8 Current Financial Situation
Table 8.16 Income Statements of Aguas de La Habana
2000 2001 2002 2000 2001 2002 2000 2001 2002 2000 2001 2002Water supply
Revenue from water supply 5,699 7,892 8,068 19,123 26,719 26,366 24,822 34,612 34,434 6,435 8,920 9,082Materials and subcontracting cost (717) (1,302) (983) (1,232) (1,599) (2,917) (1,949) (2,901) (3,900) (764) (1,363) (1,095)Direct personnel cost (2,711) (3,918) (4,357) (2,711) (3,918) (4,357) (104) (151) (168)Water purchase (430) (562) (749) (430) (562) (749) (17) (22) (29)Water pipe rent (1,760) (2,298) (2,121) (1,760) (2,298) (2,121) (68) (88) (82)Energy cost (5,457) (7,742) (7,734) (5,457) (7,742) (7,734) (210) (298) (297)
Income from water supply 4,982 6,591 7,085 7,533 10,601 8,488 12,515 17,192 15,573 5,272 6,998 7,412
SewerageRevenue from sewerage services 693 902 866 4,042 5,744 5,925 4,735 6,645 6,791 848 1,123 1,094Materials and subcontracting cost (131) (248) (238) (215) (744) (652) (346) (992) (890) (139) (276) (263)Direct personnel cost (719) (927) (996) (719) (927) (996) (28) (36) (38)sewer rent (440) (494) (477) (440) (494) (477) (17) (19) (18)Energy cost (168) (249) (304) (168) (249) (304) (6) (10) (12)
Income from sewerage 562 654 629 2,500 3,329 3,496 3,062 3,983 4,124 658 782 763
Infrastructure constructionRevenue 1,510 2,642 3,735 650 1,435 1,541 2,160 4,077 5,276 1,535 2,698 3,795Construction materials (1,255) (2,461) (3,522) (565) (1,320) (1,399) (1,820) (3,781) (4,922) (1,277) (2,512) (3,576)
Income from infrastructure construction 255 182 213 85 115 142 340 293 355 258 186 218
Other activitiesRevenue 832 1,088 829 1,506 2,604 1,804 2,338 3,692 2,633 890 1,188 899Expenses (1,200) (2,021) (1,494) (1,070) (1,642) (159) (2,270) (3,663) (1,652) (1,241) (2,084) (1,500)Provision from INRH 534 651 534 651 534 651
Income from other activities 166 (281) (664) 436 962 1,645 602 680 981 183 (244) (601)
Indirect activityVehicle costs (1,784) (2,096) (1,998) (469) (373) (589) (2,253) (2,469) (2,587) (1,802) (2,111) (2,021)Other indirect costs (1) (1,119) (1,661) (1,792) (1,120) (1,661) (1,792) (44) (64) (69)
Indirect activity costs (1,785) (2,096) (1,998) (1,588) (2,034) (2,381) (3,373) (4,130) (4,379) (1,846) (2,174) (2,090)0
Income from operation activities 4,181 5,049 5,264 8,966 12,972 11,390 13,147 18,021 16,654 4,526 5,548 5,702
Administrative overheadsAuxiliary revenues 15 70 22 72 0 37 142 0 16 72 0Administrative personnel cost (918) (874) (811) (5,073) (7,108) (7,320) (5,991) (7,982) (8,131) (1,113) (1,147) (1,092)General administration cost (1,563) (1,629) (1,436) (1,339) (2,036) (1,966) (2,902) (3,664) (3,402) (1,615) (1,707) (1,512)Information system cost (113) (69) (144) (24) (47) (26) (137) (116) (170) (114) (71) (145)
Total administrative costs (2,579) (2,501) (2,390) (6,414) (9,119) (9,312) (8,993) (11,621) (11,702) (2,826) (2,852) (2,749)
Depreciation and provision (511) (1,120) (1,544) (377) (331) (580) (888) (1,452) (2,124) (526) (1,133) (1,566)Financial costs (232) (548) (401) (21) (2) 0 (253) (550) (401) (233) (548) (401)Technical assistance and extraordinary costs (708) (719) (748) 46 (728) 1,100 (662) (1,447) 352 (706) (747) (705)
Net income 151 160 181 2,200 2,792 2,598 2,351 2,952 2,778 236 267 280
* The official exchange rate that can be used for accounting purporses** US$1 is convertible to 26 Cuban pesos which is the legal but unofficial rate only used for personal transaction.Source: Aguas de La Habana
US$-denominated Peso-denominated Total (1peso:US$1*) Total (26peso:US$1**)(US$ 000) (Peso 000) (US$ 000) (US$ 000)

M8-18
Volume II Main Report, Part I Master Plan Chapter 8 Current Financial Situation
Table 8.17 Sources and Application of Funds of Aguas de La Habana
Aguas de La Habana is registered as a joint venture that can generate the revenues in two types of currency, US dollars and Cuban pesos. Customers who have US dollar revenue are charged their water bills in US dollar. Customers who have no US dollar earnings are simply charged their water bills in peso. Customers who have both US dollar and peso earnings are supposed to be charged proportionately to US dollar and peso ratio. The assets, liabilities, and equity are also divided into US$ and Cuban peso. There is no market-driven exchange rate between US$ and Cuban peso, however there is the official exchange rate of US$1 to 1 peso. There also exists a legal but unofficial exchange rate of US$1 to 26 pesos, which is only used for personal transaction and cannot be used for accounting purposes. There were two important factors that adversely affected the revenue of the company. Firstly, the Ministry of Finances and Prices promulgated a ministerial instruction by which hard currency earning customers are allowed to pay a part of their bills in Cuban pesos. This instruction aimed to alleviate the shortage of hard currency that had been experienced by those hard currency earners. The effect of this instruction was stronger in the year 2001 and the number of hard currency earning customers who paid a part of water bills in pesos had increased. As Aguas de La Habana’s dollar revenues were derived from those hard currency earners, the company’s dollar revenue did not increase as much as planned. The second factor was that an increasing number of large users including hotel industry were taking water from their own wells instead of using the piped water of Aguas de La Habana. This tendency is continuing
2000 2001 2002 2000 2001 2002 2000 2001 2002 2000 2001 2002Sources of funds
Depreciation 499 1,089 1,184 55 110 130 554 1,199 1,314 501 1,093 1,189Operating profit 151 10 21 2,200 592 2,351 602 21 236 33 21Borrowing by loan 4,901 832 4,901 832 4,901 832Capitalization and reserve 8,000 11 8 1,442 737 8,000 1,453 745 8,000 66 36Decrease of construction work in progress 776 1,041 1,817 816
Total sources 13,551 1,942 1,989 2,255 2,144 1,908 15,806 4,086 3,897 13,638 2,024 2,062
Application of fundsIncrease of capital assets (9,304) (2,487) (647) (1,703) (227) (272) (11,007) (2,714) (919) (9,370) (2,496) (657)Increase of information system (255) (412) (208) (255) (620) (255) (420)Increase of construction work in progress (216) 6 (210) (216)Decrease of long-term loan (244) (244) (244)Decrease of retained earnings (194) (194) (7)
Total applications (9,559) (2,703) (1,303) (1,703) (221) (674) (11,262) (2,924) (1,977) (9,625) (2,712) (1,329)
Net sources/applications of funds 3,992 (761) 685 552 1,923 1,235 4,544 1,162 1,920 4,013 (687) 733
Increase (decrease) in working capitalIncrease in stocks (2,910) (730) (1,697) (4,607) (730) (2,975) (730)Increase in accounts receivable (5,373) (855) (603) (10,066) (6,100) (152) (15,439) (6,955) (755) (5,760) (1,090) (609)Increase in deposit (1,470) (28) (39) (1,633) (2,552) (3,103) (2,580) (39) (1,533) (126) (39)Increase in other assets (5) (5) (5)Decrease in accounts payable (159) (3,617) (2,182) (10,379) (2,341) (13,996) (243) (4,016)Decrease in cash 43 1,092 163 31 3,073 43 1,123 3,236 43 1,093 281Decrease in stocks 348 495 158 495 506 19 354Decrease in accounts receivable 957 2,611 419 5,252 1,376 7,863 973 2,813Increase in accounts payable 5,706 489 447 12,522 7,966 813 18,228 8,455 1,260 6,188 795 478Increase in insolvency provision 12 5 322 334 5 24 5
Change in working capital (3,992) 761 (685) (552) (1,923) (1,235) (4,544) (1,162) (1,920) (4,013) 687 (733)
*The official exchange rate that can be used for accounting purposes**US$1 is convertible to 26 Cuban pesos which is the legal but unofficial rate only used for personal transaction.Source: Aguas de La Habana
US$-denominated Peso-denominated Total (1peso:US$1*) Total (26peso:US$1**)(US$ 000) (Peso 000) (US$ 000) (US$ 000)

M8-19
Volume II Main Report, Part I Master Plan Chapter 8 Current Financial Situation
under the circumstances where the tourism industry is trying to save the operating expenses in response to the business downturn after the September 11 attacks. Financial ratio analysis was made to measure the soundness of Aguas de La Habana. The five ratios computed were the return on assets (ROA), current ratio, debt to equity ratio, operating ratio, and debt service coverage ratio. Because of the dual currency nature of the company, each ratio was computed for both US$ and peso portions. To conveniently grasp the overall company’s value, peso portions were converted to US$ portions by using the two different exchange rates. The five financial ratios were also computed for those combined figures. The results are summarized in Table 8.18.
Table 8.18 Key Financial Ratios of Aguas de La Habana
Indicator Year US$ Peso Total (Ps1=US$1)*1
Total (Ps26=US$1)*2
2001 0.2% 3.7% 1.9% 0.3% Return on assets *3 (Overall profitability) 2002 0.2% 3.6% 1.9% 0.4%
2001 0.9 1.1 1.0 0.9 Current ratio (Liquidity) 2002 1.2 1.3 1.3 1.2
2001 1.4 4.3 2.4 1.5 Debt-to-equity ratio (Debt management) 2002 1.0 1.8 1.3 1.0
2001 1.0 1.1 1.1 1.0 Operating ratio (Expenditure level) 2002 1.0 1.1 1.1 1.0
2001 2.6 n.a. 8.7 2.9 Debt service coverage ratio *4 (Cash flow) 2002 2.8 n.a. 7.6 3.0 Notes: *1: Conversion rate of US$1=1 peso is used. *2: Conversion rate of US$1=26 pesos is used. *3: Total assets are computed as simple average of beginning and ending balance of the year. *4: Financial costs are regarded as interest payments. Source: Calculated from data of Aguas de La Habana (1) Return on assets The return on assets (ROA) ratio shows how effectively the company is generating income given its asset base. ROA is defined as net income divided by total assets. This figure provides an indication of the ability to earn a reasonable return on all the assets. A higher ratio provides some indication of future growth prospects for water supply and sewerage operation. An ever-increasing ROA may not necessarily be a positive situation. And excessively high ROA ratio resulting from increasing net income may indicate that the company is charging its customers more than required to operate the system. If the ROA is higher because of decreasing total assets, it may indicate the company is not adequately investing in capital replacement from its net income. The required level of ROA varies depending on countries and times. Generally it should be between 2 to 10 percent. In the case of Aguas de La Habana, the ROAs are low in all currency bases. This is mainly due to the shortage of net income caused by the previously mentioned two factors (government price intervention and demand stagnation). Also it can be said that the water and sewerage rates are determined by INRH not to burden domestic customers, which means ROA cannot be so high because of the rate constraint. In a reverse side, the company received subsidies from INRH in 2000 and 2001 to compensate the lost revenue due to the government price instruction. Had it not been for

M8-20
Volume II Main Report, Part I Master Plan Chapter 8 Current Financial Situation
this subsidy, the company would have a net loss. This price subsidy discontinued in 2002. (2) Current ratio The current ratio (current assets divided by current liabilities) has a positive effect on the health of the water company, because it is a rough indication of a company’s ability to service its current obligations. The higher the current ratio, the greater the buffer between current obligations and a company’s ability to meet those obligations. If ratios are very high over a sustained period of time, it may suggest that the company is not exercising the best use of cash or that water rates are artificially high. It is said that a viable water company should have a current ratio of at least 1.6. Aguas de La Habana’s current ratio improved in 2002 but was still around 1.3 in all currencies, which means the company did not have enough cushion to meet current liabilities. (3) Debt-to-equity ratio The debt-to-equity ratio indicates the relative dependence of a company on debt and its ability to use additional credit without impairing its risk-bearing ability. The ratio of total debt to total equity has a negative effect on water system health. The higher the ratio, the larger the risk of financial difficulty. A company with a high debt-to-equity ratio often finds that creditors are reluctant to provide additional funds. A lower ratio indicates greater long-term financial safety. Debt-to-equity ratios should typically be between 2 and 3. Aguas de La Habana’s debt-to-equity ratios in 2001 were 1.4 in the US$ account and 4.3 in the peso account. The ratios improved in 2002, becoming 1.0 in US$ and 1.8 in peso. This might indicate that the company would have a flexibility to borrow a fund both in US$ and peso. (4) Operating ratio The operating ratio (gross revenue divided by operating and maintenance expenses) is most significant to represent the level of expenditures. The operating ratio measures the costs and revenues associated with providing water and sewerage services. O/M costs include those expenses that arise from the sale, supply, and distribution of water, including general and administrative expenses. Depreciations are usually included as well. The higher the operating ratio, the higher the revenue over expenses. An operating ratio should be above 1.0 for a company to be self-supporting. Aguas de La Habana’s operating ratios were above 1.0 by a narrow margin in all currencies, which can be viewed as the lowest level for a self-supporting company. (5) Debt service coverage ratio The debt service coverage ratio - i.e., cash flow (defined as net income plus depreciation) divided by principal repayment and interest expense – is an indicator of whether the company can cover its current debt obligations. To be financially sound, a water company must demonstrate the ability to generate sufficient revenue to cover current expenses plus the repayment of loans - i.e., the cash flow necessary to meet obligations and pay debt. By meeting its current and future capital needs, the system has the capacity to remain healthy and viable. If a debt service coverage ratio is less than one, the company does not generate sufficient cash to meet current principal and interest payments. Generally a debt service coverage ratio above 1.5 is adequate for water company health. Aguas de La Habana’s debt service coverage ratios were high in 2002, being 7.6 under the Ps1:US$1 computation and 3.0 under the Ps26:US$1 computation. Those high levels of debt-to-equity ratios were correlated with the low debt-to equity ratios, meaning that the company had a capacity to borrow more funds and serve the debt.

M8-21
Volume II Main Report, Part I Master Plan Chapter 8 Current Financial Situation
8.4.2 ACUEDUCTO DEL ESTE (EAST WATER) The main financial data of Acueducto del Este (East Water) is shown in Table 8.19. The company’s peso revenue in 2001 was 10.6 million pesos, or about 30 percent of that of Aguas de La Habana. The profit before tax of peso portion was 0.963 million pesos, which was about one third of that of Aguas de La Habana.
Table 8.19 Main Financial Data of Acueducto del Este
8.4.3 ACUEDUCTO SUR (SOUTH WATER) The main financial data of Acueducto Sur (South Water) is shown in Table 8.20. The company’s 8.252-million peso revenue in 2001 was about a quarter of that of Aguas de La Habana. The profit before tax of peso portion was 1.785 million peso that was about 60 percent of that of Aguas de La Habana.
Table 8.20 Main Financial Data of Acueducto Sur
(Peso 000)2000 2001
Tangible fixed assets 1,250 1,893Accumulated depreciation of tangible fixed assets 1,117 1,292Inventory 228 227Net sales 5,466 8,252Operation cost 4,648 6,626Profit before tax 816 1,785Income tax payable 271 640Material costs 328 659Salary and wages 1,470 2,573Other labor costs 544 1,001
Of which: Employment tax 367 643Depreciation and amortization 1,117 1,196Other monetary costs 583 2,328
Source: Computed from data of Havana City Territorial Office of Statistics
(Peso 000)2000 2001
Tangible fixed assets 1,523 3,596Accumulated depreciation of tangible fixed assets 939 1,136Inventory 625 292Net sales 7,022 10,579 *Operation cost 6,426 9,624Profit before tax 647 963Income tax payable 226 376Material costs 404 774Salary and wages 1,876 3,221Other labor costs 727 1,240
Of which: Employment tax 469 805Depreciation and amortization 962 72Other monetary costs 414 988
* Comprised of water (9682), sanitation (37), and other services (860)Source: Computed from data of Havana City Territorial Office of Statistics

M8-22
Volume II Main Report, Part I Master Plan Chapter 8 Current Financial Situation
8.5 USER CHARGES
8.5.1 WATER AND SEWERAGE TARIFF In Cuba, utility tariffs are determined under state controlled pricing system where utility prices tend to be set lower than actual production or service cost. This is because utility service partly has social welfare character. Water and wastewater service prices are not exceptional. All water companies use a uniform water and sewerage tariff without regard to locational difference. The tariff comprises two parts in terms of currency. The first part is peso-denominated tariff (Table 8.21) that is applied to Cuban locals and peso earners. Those who are applied include most of domestic and industrial users who are ordinary Cubans and have little access to hard currency. The other part is US dollar-denominated tariff (Table 8.22) and applied to hard currency earners, including resident aliens, foreign company’s branch in Cuba, and Cuban companies in tourism industry whose considerable part of revenues are hard currencies. The current tariff has been unchanged since its introduction in 1997 however, for Aguas de La Habana (Havana Water), a price tariff increase is scheduled to be approved in 2003. According to the plan, the increase rates will be approximately 20 percent. Both in the peso-denominated tariff and in the US dollar-denominated tariff, volumetric rates are predominant. Some users are applied uniform volume rate, whereas others are applied progressive rate or volumetric rate with increasing-block schedule. For example, hotels are billed according to the number of rooms registered and actual consumption volume. Domestic users are also charged on the basis of volumetric rate with increasing-block schedule. Unmetered domestic users however are charged flat rate of 1 peso per person per month for water. Sewerage charges are based on constant volumetric rate on water use. Thus, hotels that earn hard currency are charged 20 percent of water bill as sewerage bill, whereas most of other sewer users are charged 30 percent of water bill. Septic tank users are charged desludging fee according to track capacity and trip distance. If the exchange rate of 1 US dollar to 26 pesos is applied, the US dollar denominated tariff is 13 to 20 times as high as the peso-denominated tariff in case of rates for hotels. Connection fees also differ between local customers and hard-currency earners. State entities classified as local customers pay 1000 pesos plus installation cost for both water connection and sewer connection. In case of local domestic users, connection fees of both water and sewerage are less than 50 pesos. Hard currency earners pay US$1000 plus installation cost for both water and sewer connection.

M8-23
Volume II Main Report, Part I Master Plan Chapter 8 Current Financial Situation
Table 8.21 Water and Sewerage Tariff for Cuban Locals and Peso Earners
State Potable Hotel < 500 liter / room / day 1.00 Peso / m3sector water 500 - 750 liter / room / day 1.25 Peso / m3
751 - 1000 liter / room / day 1.50 Peso / m31001 - 1250 liter / room / day 1.75 Peso / m3> 1250 liter / room / day 2.00 Peso / m3
Commercial 1.20 Peso / m3Industry or other Within standard consumption volume 0.35 Peso / m3production processing Above standard consumption volume 0.60 Peso / m3Consumer in water supply restriction area Standard rate + 20% surchargeConsumer in agricultural area 0.30 Peso / m3Vessel Supply in less than 12 hours 3.00 Peso / m3
Supply in more than 12 hours 2.00 Peso / m3Connection fee to water supply system 1,000 Peso + installation costConsumer supplied Consumer's own truck 0.35 Peso / m3by water tank truck Water company's truck Consumer within 10 km 5.00 Peso / m3
Consumer within 10 - 20 km 10.00 Peso / m3Consumer outside 20 km 20.00 Peso / m3
Non-potable Consumer served by pipe Within standard consumption index 0.30 Peso / m3water Above standard consumption index 0.40 Peso / m3
Consumer supplied by his own water tank truck 0.30 Peso / m3Consumer in agricultural area 0.30 Peso / m3
Sewerage User served by sewer 30% of water billConnection fee to sewer system 1,000 Peso + installation costSeptic tank user Desludged by User within 10 km 15.00 Peso / trip
4.5 m3 truck User within 10 - 20 km 17.00 Peso / tripUser outside 20 km 20.00 Peso / trip
Desludged by User within 10 km 16.00 Peso / trip4.5 - 6.5 m3 truck User within 10 - 20 km 18.00 Peso / trip
User outside 20 km 21.00 Peso / tripDesludged by User within 10 km 22.00 Peso / tripover 6.5 m3 truck User within 10 - 20 km 24.00 Peso / trip
User outside 20 km 26.00 Peso / tripDomestic Potable Metered consumer < 3 m3 / person / month 0.25 Peso / m3sector water 3 - 4.5 m3 / person / month 0.50 Peso / m3
4.5 - 6 m3 / person / month 0.75 Peso / m36 - 7.5 m3 / person / month 1.00 Peso / m3> 7.5 m3 / person / month 1.50 Peso / m3
Unmetered consumer (for registered family members) 1.00 Peso / person / monthConsumer supplied Contingent service Freeby water tank truck Regular service 1.00 Peso / person / monthService pipe connection and meter installation fee 13 mm diameter 110.00 Peso
18 mm diameter 152.00 Peso25 mm diameter 220.00 Peso> 25 mm diameter Installation cost
Sewerage User served by sewer 0.30 Peso / person / monthSeptic tank user User within 10 km 12.00 Peso / trip
User within 10 - 20 km 14.00 Peso / tripUser outside 20 km 17.00 Peso / trip
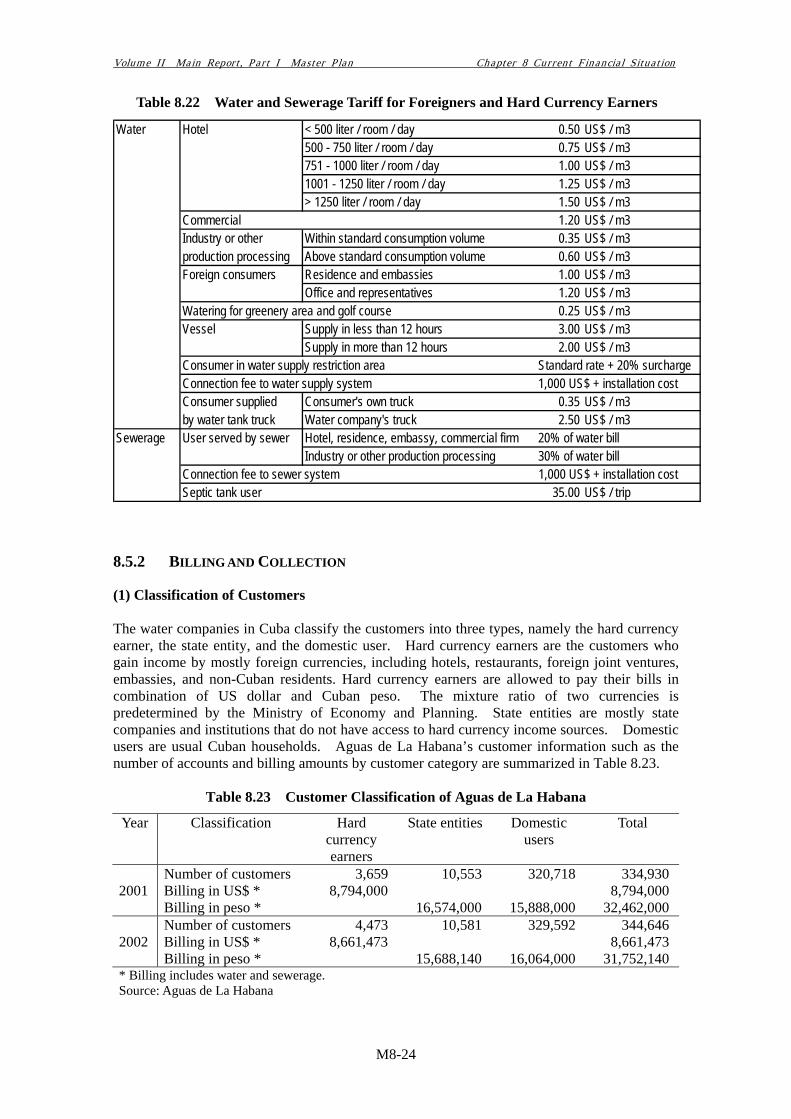
M8-24
Volume II Main Report, Part I Master Plan Chapter 8 Current Financial Situation
Table 8.22 Water and Sewerage Tariff for Foreigners and Hard Currency Earners
8.5.2 BILLING AND COLLECTION (1) Classification of Customers The water companies in Cuba classify the customers into three types, namely the hard currency earner, the state entity, and the domestic user. Hard currency earners are the customers who gain income by mostly foreign currencies, including hotels, restaurants, foreign joint ventures, embassies, and non-Cuban residents. Hard currency earners are allowed to pay their bills in combination of US dollar and Cuban peso. The mixture ratio of two currencies is predetermined by the Ministry of Economy and Planning. State entities are mostly state companies and institutions that do not have access to hard currency income sources. Domestic users are usual Cuban households. Aguas de La Habana’s customer information such as the number of accounts and billing amounts by customer category are summarized in Table 8.23.
Table 8.23 Customer Classification of Aguas de La Habana
Year Classification Hard currency earners
State entities Domestic users
Total
Number of customers 3,659 10,553 320,718 334,9302001 Billing in US$ * 8,794,000 8,794,000 Billing in peso * 16,574,000 15,888,000 32,462,000 Number of customers 4,473 10,581 329,592 344,6462002 Billing in US$ * 8,661,473 8,661,473 Billing in peso * 15,688,140 16,064,000 31,752,140* Billing includes water and sewerage. Source: Aguas de La Habana
Water Hotel < 500 liter / room / day 0.50 US$ / m3500 - 750 liter / room / day 0.75 US$ / m3751 - 1000 liter / room / day 1.00 US$ / m31001 - 1250 liter / room / day 1.25 US$ / m3> 1250 liter / room / day 1.50 US$ / m3
Commercial 1.20 US$ / m3Industry or other Within standard consumption volume 0.35 US$ / m3production processing Above standard consumption volume 0.60 US$ / m3Foreign consumers Residence and embassies 1.00 US$ / m3
Office and representatives 1.20 US$ / m3Watering for greenery area and golf course 0.25 US$ / m3Vessel Supply in less than 12 hours 3.00 US$ / m3
Supply in more than 12 hours 2.00 US$ / m3Consumer in water supply restriction area Standard rate + 20% surchargeConnection fee to water supply system 1,000 US$ + installation costConsumer supplied Consumer's own truck 0.35 US$ / m3by water tank truck Water company's truck 2.50 US$ / m3
Sewerage User served by sewer Hotel, residence, embassy, commercial firm 20% of water billIndustry or other production processing 30% of water bill
Connection fee to sewer system 1,000 US$ + installation costSeptic tank user 35.00 US$ / trip

M8-25
Volume II Main Report, Part I Master Plan Chapter 8 Current Financial Situation
(2) Meter Reading, Billing and Collection Process At Aguas de La Habana, meter reading is performed monthly by meter readers. Approximately 40 meter readers cover 50,000 meters installed. The meter readers visit customers by foot or motorcycle, depending on areas and customer types that are taken care of. In reading meters of some large consumers or primary consumers, handy computer terminal have been in use. The meter penetration rate is 100 percent for the hard currency earning customers. Their meters have been replaced for last three years and all are functional. The meter penetration rate for large state entity users is also high. Those meters installed at large state entity users are also functional, but some smaller users do not have functional meters, in which case meters are not read. Meters are installed at most of the domestic users, meters, however the performances of many meters are unreliable due to mechanical defectiveness or agedness. If the meter of a domestic user is not functional, the user is charged flat rate, which is merely 1 peso per registered family member. It is said that there exist a number of illegal water use drawn from the flat rate connections. Each meter reader carries a record book in which data read or illegibility of meter are manually recorded on customer meter site. Meter readers post the record of meter reading from the record book to customer slips. The customer slips are sent to the Billing Division of the Sales Department for data processing. After the data processing and data validation, bills are printed out. Printed bills are directly delivered by meter readers. Domestic customers can pay the bills either at commercial offices or directly to meter readers who deliver the bills. Direct payment from bank account is also available for prime customers such as hard currency earning customers and large users.

M9-1
Volume II Main Report, Part I Master Plan Chapter 9 Environmental Education Programs
CHAPTER 9 ENVIRONMENTAL EDUCATION PROGRAMS
9.1 GENERAL Cuba places great importance on Environmental Education in the knowledge that major environmental problems have been caused by lack of environmental awareness and education. Law No. 81, Law of the Environment, includes education in its basic concepts and defines the term “Environmental Education” as follows:
“a continuous and permanent process forming an integral part of the education of all citizens, oriented so that through the acquisition of knowledge, development of habits, skills, attitudes, and the formation of values, relations among and between humans, and the rest of society and nature are harmonized to guide the orientation of economic, cultural and social processes toward sustainable development”.
Through the Law, there is a National Environmental Information System, which among other objectives, guarantees all parties the information required to understand matters related to the environment.
CITMA has the responsibility to develop strategies of environmental education, and contribute to their implementation, promoting the execution of programs in all sectors of the economy and services, social groups and the public in general. For these purposes CITMA has established coordination with the Ministries of Education, Higher Education, and Culture, together with other state agencies and bodies and the media. This demonstrates the cross cutting nature of Environmental Education.
Instruments for the control and management of Environmental Management are:
National strategy of Environmental Education
Agreement with important sectors of the economy
Development of environmental education programs in the territories
Participation of the community in the solution to the problems
Information policy of the environmental agency
Perception studies
The objectives of the National Strategy for Environmental Education (1997) are:
Strengthening of the institutional capacity
Education and capacity building of human resources
Introduce the environmental dimension in formal education
Introduce the environmental dimension in the informal education process
Development and strengthening of the availability and access to information
Introduce the environmental dimension in the process of communication and publicity
It is the responsibility of all state agencies and bodies to promote and execute activities with their workers, social groups, and the population with which they interact to increase knowledge and awareness of environmental issues. Coordination with other Ministries, state agencies etc. is shown in Figure 9.1.

Volume II Main Report, Part I Master Plan Chapter 9 Environmental Education Programs
M9-2
JAP
AN
INTE
RN
ATIO
NA
L CO
OP
ER
ATIO
N A
GE
NC
Y
THE
DE
VE
LOP
ME
NT S
TUD
Y ON
THE
IMP
RO
VE
ME
NT O
F S
EW
ER
AG
E A
ND
DR
AIN
AG
E S
YS
TEM
FOR
THE
HAVA
NA B
AY
Figure 9.1 N
ational Environm
ental E
ducation system
Center for Information, Publicity and Environmental Education (CIGEA)
Coordinator, Promoter and Facilitator for Environmental Education
Ministryof
Education
Ministry of Science, Technology& Environment
(CITMA)
Center for Environmental EducationNational Environmental Information System
Directed and Controlled by CITMA and the Ministry of the Economy and Planning
Places the Environmental Perspective in the NationalEducation System
Establishes Off icial Education courses onEnvinonmental Matters
Ministryof Higher Education
Mass Organizationsand Organization of
Jounalists
TV, Radio and thePress presentEnvironmental
Education Information
Local Agenciesof
Popular Power
Promotes andsupports EducationalActivities among the
Population
All state Agenciesand
Bodies
Promote and Executeactivities related toKnow ledge of the
Environment

M9-3
Volume II Main Report, Part I Master Plan Chapter 9 Environmental Education Programs
9.2 CURRENT STATUS OF ENVIRONMENTAL EDUCATION IN CUBA
9.2.1 NATIONAL PROGRAMS
Cuba has a sophisticated framework of education in its National Environmental and Development Program, Environmental law, Environmental Strategy etc. Both the Center for Environmental Education and the Center for Information, Publicity and Environmental Education produce good quality information on environmental policy and Strategy.
The Ministry of Education has programs suitable for all levels of schools, and the mass media, particularly television, have been active in disseminating environmental education in special programs suitable for schools and the general public. Programs are regularly broadcast in the environmental section of the educational channel.
However, it is recognized that more needs to be done, and in the National Environmental Strategy, Second Issue, May 2000, the following requirements are recognized:
To redirect and enhance education towards sustainable development. Conduct activities in a harmonious, systematic and coherent way, and involve every government organization and institution, social organizations and the whole population.
To expand the development of environmental education activities entailing community involvement and to improve citizen’s awareness on sustainable development, using creatively the accumulated participative experience of the Cuban social project.
To upgrade the role of mass media in accomplishing an integrated environmental education for the whole population and community involvement in resolving environmental problems.
9.2.2 PROGRAMS SUPPORTED BY INTERNATIONAL ORGANIZATIONS AND DONOR COUNTRIES
Several International Organizations and Donor Countries have ongoing grant projects with GTE. The Global Environmental Facility (GEF) under UNDP were active in environmental education during 1996/7 whilst preparing their document on “Planning and Management of Heavily Contaminated Bays and Coastal Areas in the Wider Caribbean; Final Report May 1998”.
GEF/GTE involved school children in a project that traced the life of Havana Bay from The time of Christopher Columbus to the present day, and looked at the environmental problems. UNDP will once again be involved in another project in the near future.
The Carl Duisberg Institute of Germany has a large training program for managers and technicians, and the German government is cooperating with Spanish institutions on environmental education. Canada is involved with the Urban Institute in the design of a communications program and environmental education.
Belgium has a project for urban solid waste management, which includes environmental education, and they will also be involved in the construction of a wastewater treatment plant. They also plan to create an Environmental Education Information Center at the existing offices of GTE, and a diagnostic unit.
Italy is providing a grant for cleaning up the Luyano River, construction of an emergency plant to retain floating solids, and treatment of river water. The project includes an environment diagnostic unit for the health sector, and results are being evaluated.

M9-4
Volume II Main Report, Part I Master Plan Chapter 9 Environmental Education Programs
9.3 PROPOSED ENVIRONMENTAL EDUCATION PROGRAM
9.3.1 GENERAL
The subject of environmental education was first discussed with the GTE management and the study team counterparts to ensure no duplication of effort since other international and donor countries include some form of education in there programs.
GTE have some funds in their budget for environmental education and they have a small team of experts. It was acknowledged that the population in general does not have information on the problem of pollution of the Bay and on the importance of drainage and sewerage. They know little of the work being carried out by GTE, and have limited access to the Bay because of the industrial and commercial activities surrounding the Bay.
GET are not only involved in the clean up of the Bay, but also in the renovation, restoration and future planning of the shoreline, involving physical planning of the port, shipping activities in consideration of environmental issues. It is envisaged that zoning will take place for commercial, industrial, shipping and institutional use of the bay frontage, and that future plans will include better access for the public and tourists to the proposed shops and restaurants etc. that will form part of the waterfront.
Some environmental activities have been carried out by GTE, posters and an information leaflet have been produced, but there is no specific program to raise awareness of the problem of pollution to the bay.
It was agreed that this program should target children and youth, the general population and the agencies of INRH directly involved with Bay, the rivers, the drainage and the sewerage systems. It was further agreed that the CITMA National Environment Strategy (1997), the CITMA National Program for Environment and Development (1995), and in particular the CITMA National Strategy for Environmental Education (1997), produced in collaboration with UNESCO, would be followed. The Ministry of Education and the Mass Media (Television, radio and the Journalists Association) would be involved in the program.
9.3.2 PROPOSED ENVIRONMENTAL EDUCATION PROGRAM
(1) Study Approach
In addition to providing technical solutions, this program will promote Environmental Education as a tool to reduce pollution.
(2) Public Relations
Public Relations is an important activity to promote public awareness, hence this study includes an environmental education program to promote public awareness and concerns with the Havana Bay clean up activities.
(3) Objectives
The objectives of the program are:
To publicize the problem of pollution to Havana Bay and create awareness of the work being carried out by GTE to clean up Havana Bay
To educate people on the pollution caused to Havana Bay by the sewerage system, drainage, rivers, and industry
To promote participation by agencies, institutions, children and youth, and citizens in general in the campaign to clean up Havana Bay

M9-5
Volume II Main Report, Part I Master Plan Chapter 9 Environmental Education Programs
(4) Participants
The participants to the program will be:
GTE Havana Bay in cooperation with the JICA Study Team
INRH and CITMA
Ministry of Education
Directorate of Provincial Education
Directorate of Municipal Education
National Television and Radio, and the Journalists Association
NGO ProNatureleza
(5) Beneficiaries
Children and Youth
Citizens in General
INRH: (DPRH,EAH, Mixed Company Aguas de la Habana, Water supply and Sanitation Company of East Havana)
(6) Program for Children and Youth
The program for children and youth will be carried out under the Ministry of Education in cooperation with the directorates of Provincial and Municipal Education. Four schools have been chosen to participate, one primary and one secondary school in the municipalities of Havana Vieja and San Miguel del Padron.
Havana Vieja municipality was chosen because it borders on the bay where twenty of the industries are located, and San Miguel del Padron because this municipality is bordered by the rivers Luyano and Martin Perez.
The schools have been visited by representatives of GTE/JICA Study Team, together with Environmental Specialists from the Ministry of Education and the Directorate of Municipal Education. These schools are typical of schools in general in Cuba are well equipped with computers, television sets and video recorders.
Awareness of the importance of the environment is already very high in the schools since the environment is included in the curriculum and national television broadcasts environmental programs for schools on its education channel. All of the schools showed work that had been done on previous environmental projects and were briefed on the specific project to be carried out for Havana Bay.
All schools will have a special environmental group assigned to the project, and the program will commence with visits to the bay and feeder rivers, followed by the provision of educational material in the form of an information leaflet and poster. A specially produced video will be provided on the pollution problem of Havana Bay. The children and youth will produce paintings, drawings, essays and poems to depict the pollution problem, and will attempt to provide solutions.
The program will end with a festival near the bay, where the work done by the schools will be displayed for the benefit of other children and youth, and citizens in general. Special T-Shirts and caps will be provided bearing the logo of the project to promote the work being carried out by GTE in cooperation with the JICA Study Team.

M9-6
Volume II Main Report, Part I Master Plan Chapter 9 Environmental Education Programs
(7) Program for Citizens in general
The program for citizens in general will use the National Mass Media system, for broadcasting on radio and the screening of the special video on Havana Bay on the national education channel. GTE will hold a press conference with the group of scientific, technical and environmental journalists in the Journalists Association to give information on the program, and they will be updated as the program proceeds. The press will therefore be fully and continuously briefed on the project.
The information leaflet and poster will also be made available, and the general public will have the opportunity of visiting the festival of art by the children and youth, further raising the awareness of GTE and the clean up of Havana Bay.
(8) Program for INRH Agencies
GTE/JICA Study Team have already met with CIGEA and the Ministry of Education for a briefing on the requirements of the institutional program. CIGEA and the Ministry of Education described their roles in the production of environmental material and the dissemination of information. It was clear that both are experienced and equipped to assist with this program.
Specific information will be provided by GTE/JICA Study Team and it is anticipated that premises will be made available for workshops at the university in Arroyo Naranjo and at the Jose Verona University. Participants for the workshops will be selected from DPRH, EAH, Mixed Company Aguas de la Habana and the Water Supply and Sewerage Company of Havana East.
Participants will receive environmental education material and will be instructed on the problem of pollution to Havana Bay. On completion of the course, the participants will be expected to disseminate the information to their colleagues at the work place.
(9) Educational Material
The following education material will be produced
GTE/JICA Study Team will provide material specific to the pollution problem of Havana Bay, from information already available to GTE and from the Progress Report to be produced by the JICA Study Team at the end of Phase 1 of the Study.
An identifier (Logo), a leaflet for children, a leaflet for adults, and a poster have already been produced and are being put forward for comment and approval. The artwork was carried out by SAF Design Group from information provided by GTE/JICA Study Team.
A proposal for the production of a video on the problem of pollution to Havana Bay has been received from the NGO ProNaturaleza, based on information provided by GTE/JICA Study Team. ProNaturaleza may also produce a radio program.
The Ministry of Education can provide general environmental education material and CIGEA have environmental education material on the water and sewerage sector. They can produce specific material on Havana Bay on CD from information provided by GTE/JICA Study Team.
(10) Output
Environmental education is a continuous process and the output from this program will be educational material will be available for all children and youth in the City of Havana. The education authorities have the capacity and the schools have the equipment to continue this program throughout the city.
M9-7
Volume II Main Report, Part I Master Plan Chapter 9 Environmental Education Programs
The education material produced for the INRH agencies will be available for use with other government agencies and institutions, and may be used for education of the staff and workers in the Industrial Sector in the City of Havana.
9.3.3 IMPLEMENTATION PLAN OF THE ENVIRONMENTAL EDUCATION PROGRAM
The Implementation Plan is in three parts. The initial preparation of the program being from July to September 2002, followed by more detailed preparation by the JICA Study Team counterparts to the end of the year. Execution of the program will take place from January to March 2003.
Full details of the proposed implementation program are shown in Figure 9.2.

M9-8
Volume II Main Report, Part I Master Plan Chapter 9 Environmental Education Programs
M9-8
JAP
AN
INTE
RN
ATIO
NA
L CO
OP
ER
ATIO
N A
GE
NC
Y
THE
DE
VE
LOP
ME
NT S
TUD
Y ON
THE
IMP
RO
VE
ME
NT O
F S
EW
ER
AG
E A
ND
DR
AIN
AG
E S
YS
TEM
FOR
THE
HAVA
NA B
AY
Figure 9.2 Im
plementation P
lan - E
nvironmental
Education P
lan
2002 2003Jul Aug Sep Oct Nov Dec Jan Feb Mar
Study Program
Environmental Education ProgramAgree Program DetailsEvaluate & Approve ProgramProgram Presentation at WorkshopProduce Educational MaterialDesign Leaflets & PosterDesign Logo, T Shirts & CapsVideo ProgramRadio ProgramGTE/JICA Study TeamMinistry of EducationCIGEAPrinting & ManufactureLeaflets & PostersT Shirts & CapsChildren & Youth ProgramDistribute education Material Visits to Havana Bay & RiversPrepare essays,paintings, poemsFeastival & Display of School WorkCitizen's ProgramMeet with TV, Radio & JournalistsMass Media Broadcasts INRH ProgramEducation WorkshopsDissemination to agencies staffProduce Program DocumentsDocument for Schools Education Document for Adult Education
Phase I Basic Study Phase II Master Plan Study
Preparation Counterparts continue Preparation Execute Program

M9-9
Volume II Main Report, Part I Master Plan Chapter 9 Environmental Education Programs
9.4 EVALUATION OF EXECUTED ENVIRONMENTAL EDUCTATION PROGRAMS
9.4.1 EXECUTED ENVIRONMENTAL EDUCATION PROGRAMS
(1) General
The execution of the program generally followed the original proposal in terms of the three separate programs for Children and Youth, Citizens in general and the INRH Agencies directly involved with the Bay, the rivers, the drainage and the sewerage system. However, the involvement of CIGEA and the Ministry of Education at national, provincial and municipal level was only at the initial program planning meetings, and they did not take part in the activities as originally envisaged. In addition there was no contact with the Journalists Association pending completion of the video and radio programs.
(2) Overall Execution of the program
Due to staffing problems at GTE there was no counterpart available during the period October-December 2002. Hence, the video and radio programs were not progressed, and no further education material was produced. In addition the manufacture and printing of leaflets, posters and T shirts was not progressed in accordance with the Implementation Plan shown in Figure 9.2.
Preparation of the above mentioned items took place during January and the first half of February 2003, allowing implementation of the schools and INRH program to commence in the second half of February.
In order to assist with implementation, GTE suggested the appointment of a facilitator with the necessary communication skills to develop the methodology for implementation of the schools and INRH programs, and to report on the conclusions of the initial workshops. Due to the production time required for the video and radio programs for the citizens program these would only be available by early March. A detailed implementation program is shown in Figure 9.3.
(3) Objectives
The objectives of the program, as detailed in section 9.3.2 (3), being to publicize the problem of pollution, create awareness, educate people on the causes of pollution and to promote participation in the campaign to clean up Havana Bay have been partially met and more will be achieved as implementation progresses.
(4) Participants
Revised details of participants are as follows:

M9-10
Volume II Main Report, Part I Master Plan Chapter 9 Environmental Education Programs
GTE in cooperation with the JICA Study Team INRH (services of a counterpart for the INRH/DPRH program) CITMA (attendance at planning meeting & provision of education material) Ministry of Education (attendance at planning meetings) Provincial/Municipal Education (attendance at planning meetings) NGO ProNaturaleza (production of video & radio programs) SAF Designer Group (graphic design of Logo, Leaflets, posters, T shirts & caps) Facilitator (methodology, implementation & reporting on workshops) (5) Beneficiaries
The actual beneficiaries to date were:
Children & Youth (Primary and Secondary schools in the Study Area) INRH (DPRH, EAH, all Havana Water and Sewerage Enterprises) (6) Program for Children & Youth
The following schools had previously been selected for the initial program:
Havana Vieja Angela Landa Primary School and Jinete Chullima Secondary school
San Miguel del Padron Caridad Gonzalez Venegas Primary School and 12th de Septiembre Secondary School
The program commenced for the schools in the municipality of Havana Vieja on 18th and 19th February. Two groups were chosen at each school, one belonging to an existing environmental, cultural and historical group, the other with less experience. To test the level of awareness of both groups to the environmental problems of the bay, the facilitator questioned the pupils and asked then to produce a picture of their impression of the bay. Generally, the groups chose solid waste and oil leaking from ships as the major source of pollution, and a source of danger to the fish.
The leaflets and posters were then produced and circulated which immediately revised the opinions of the pupils to include sewage, drainage and industry in their list of pollutants. The pupils agreed that the leaflets and posters were very attractive and informative and proposed various ways for schools to assist with the prevention of pollution to the Bay. Pupils were then given T shirts and caps specially designed for the program as a further means of publicizing the pollution problem. The facilitator will prepare a full report on the proceedings.
The activities continued with further work at the schools on their impressions of the environmental problem of the Bay, followed by visits by the schools to Havana Bay and the sources of pollution on 28th February.
As a finale to the initial schools program, a Festival was held at the Centro Estudiantil, Jose de la Luz y Caballero in Habana Vieja on Saturday 1st March at which selected material prepared by the schools was displayed, and drawings were prepared by the pupils during the event.
The Festival commenced at 10.00am with welcoming speeches from the President of GTE, the
M9-11
Volume II Main Report, Part I Master Plan Chapter 9 Environmental Education Programs
JICA representative in Cuba and the principal of Jose de la Luz y Caballero in Habana Vieja. The drawing competition then commenced for the school children.
In addition to the 100 children from the four participating schools in Habana Vieja and San Miguel del Padron, six children from the municipalities of 10th de Octubre, Regla, Habana del Este, and Centro Habana, also participated since it is planned to extend the program to other schools in the Ciudad de la Habana. Various other children from JICA, and GTE also took part in the competition bringing the number of participants to over 150.
Whilst the judges selected the best poems, essays and artwork from work previously prepared, and from the drawings prepared during the festival, the participants and guests were entertained by a cultural group from the centre. Prizes for the best work were then presented by an environmental education specialist from the Ministry of Education, and this very successful Festival closed at 1.30pm.
(7) Program for Citizens in general
Implementation of this program has not yet commenced. The NGO ProNaturaleza, was engaged to produced both the radio programs and video in consultation with GTE/JICA Study Team for location selection, script development and approval.
Three CD’s for radio were to be produced with each CD containing two of a series of six environmental education programs and ten copies of each CD were ordered to allow the series to be broadcast on all the radio channels available to the Ciudad de Habana area. The series is scheduled to be broadcast commencing in March 2003 at 7.00 pm to attract a large family audience, by as many radio channels as possible. Each part will be broadcast once or twice a month and the whole series of programs will be completed in about a six month period.
Development of the 12 minute video commenced with meetings to agree primary information on the project and elaboration of the script for use on the National Television educational channel (and for use in schools which are equipped with VCR’s and TV’s). This was followed by approval of the script, and definitions of places and elements to use in the video. Shooting commenced on 31st January in close liaison with GTE/JICA Study Team and includes shots of the workshops for schools and INRH. After editing and post-production tasks were completed, the video was finalized in early March 2003.
(8) Program for INRH agencies
This program commenced with the facilitator preparing the methodology required and the activities to be carried out during the workshop. The workshop took place on 20th February in the conference room at EAH, the participants selected were a mixed group of engineers, technicians, and staff from the departments of personnel, public relations, commercial, information, and communications from the following organizations:
Aguas de la Habana (2) Acueducto del Este (7) Acueducto del Cotorro (1) Acueducto del Sur (2) DPRH (2) EAH (8)
M9-12
Volume II Main Report, Part I Master Plan Chapter 9 Environmental Education Programs
The participants were divided into two groups and two separate workshops were held, each of approximately one hour. The methodology adopted by the facilitator was first to split the group into two and ask one team to prepare a letter which Christopher Columbus would have written to the Queen of Spain when he first saw Havana Bay, and the other team if he saw it as it is today. The letters for the original sighting of the Bay generally described the beauty of the Bay and the abundance of birds and fishes, and the mythical sighting for today described the seriously contaminated environment.
The leaflet for adults was then handed out and the poster displayed. Discussions were then held regarding the problems and solutions to the pollution of the Bay. Some of the major issues raised were:
Direct discharge into the Bay by industry, and no action taken to enforce the law Lack of attention by the authorities on solid waste removal Lack of an adequate sewerage and drainage system Government should take action against all polluters, both enterprises and individuals Suitable tariffs should be charged for the various discharges of wastewater Technical solutions take a great deal of time and money and must be accompanied by environmental education to ensure the success of such projects Industry, ships and people lack awareness of the pollution problem they are creating Lack of environmental education Create awareness by publicity. Use television and radio, work with children Environmental education material does exist, but it must be refined and circulated
The participants agreed that the leaflet provided good information on the responsibilities of GTE, and the poster provide good information on the pollution problem and the proposed solutions which are brief but to the point, and easy to read as the details are separated by attractive and informative graphics and pictures.
On conclusion of the workshop, in addition to the leaflets and posters, the participants were given T shirts and caps to further assist with the publicity of the program, and a document prepared by the JICA Study team on the general aspects of pollution to Havana Bay.
It was clear that the awareness of the participants had been raised and that the information provided would further enhance their understanding of the problem and serve as a tool to educate their fellow workers.
(9) Educational and Publicity Material
The material produced for this program was as follows:
M9-13
Volume II Main Report, Part I Master Plan Chapter 9 Environmental Education Programs
Leaflets for children and youth (5,000 copies) Leaflets for adults (5,000 copies) Posters for general use (5,000 copies) T shirts for children and youth (400 No.) T shirts for Adults (400No.) Caps for children and youth (200 No.) Caps for adults (200 No.) Identifier (Logo) for use with the above (Item) A video for national TV and schools (2 No. Originals + 30 copies) A six part radio program (3 No. CD’s+ 10 copies each) General information (JICA Study Team) (25 copies) General Information (CIGEA) (1 Diskette) Due to time constraints the only educational material used in the program to date has been the leaflets and poster. JICA study Team produced course material for the INRH (DPRH) adult program however this document was not discussed, but handed out to the participants at the end of the Workshop.
The document describes the general problem of pollution to Havana Bay, the institutions responsible for the water sector and environmental matters, the legal instruments available to protect the environment and details of other national and donor financed environmental educational programs.
9.4.2 OVERALL EVALUATION OF THE EXECUTED PROGRAMS
(1) General
A major constraint which had to be overcome was the relatively short time period over which the program was to be implemented, due to the preparation time lost between Phase I and Phase II of this study. In addition, the timing for implementation, which requires completion at Interim Report stage, did not make it possible to include the technical findings of the Master Plan in the education program.
Since the program is incomplete, it is not possible to give a full evaluation at this point in time. However, the objects of publicizing the problem of pollution to Havana Bay and creating awareness of the GTE clean up program on the pollution caused by the sewerage and drainage system, the rivers and industry were partially met by the brief schools and INRH programs
This program may be considered as the beginning of much longer program to be continued by GTE. It has put to the test the cooperation and coordination between the various entities as required by the Environmental Law (No. 81), and set out in the Environmental Strategy Document.
Actual implementation took place over a period of only two weeks. However, on the progress to date, the program is considered to be successful in terms of producing education material. The GTE/JICA Study Team, together with a graphical designer, producing high quality environmental education and publicity material specific to Havana Bay, in the form of leaflets, posters, T shirts and caps. The video and radio programs were produced for the citizens program but only became available at the end of the Master Plan study.

M9-14
Volume II Main Report, Part I Master Plan Chapter 9 Environmental Education Programs
(2) Program for Children and Youth
The methodology adopted by the facilitator for the schools program proved to be very successful in establishing the awareness of two different groups (one experienced and the other not so experienced) and developing a high level of interest with the discussions and the leaflet and poster which were much admired by the pupils.
At the end of the hour long sessions, the pupils had learned much on several other reasons for pollution to the bay they had not thought about and were aware of the GTE program for cleaning up the bay.
The pupils already have many ideas on how to create awareness both inside and outside of the school and the leaflets and posters will reach their family and doubtless many more people in the their neighborhood. The Festival was very successful in bringing together pupils from all over the city to share their knowledge in a friendly competition.
(3) Program for Citizens in general
This program will be evaluated later during Phase III of this Study as the programs are expected to be ready by early March this year.
(4) Program for INRH Agencies
The methodology adopted for the workshops provoked lively debate and raised many issues regarding the main causes of pollution to the Bay, the possible solutions, the role and responsibilities of INRH, and the availability of information to create awareness and explain the pollution problems.
The responses gave clear indications of the concern over pollution by industry, shipping, rivers, sewers, drains and some sections of the public, indicating a possible lack of proper systems, no enforcement of the law, no punishment and no charges for polluters.
In addition, the workshop highlighted the fact that whereas some information did exist on the pollution of the bay it was not readily available for dissemination by the majority against a background of an urgent need to provide environmental education to the widest possible audience.
The point made at the workshop, that any technical solution must be accompanied by a strong environmental educational program must be noted and acted upon, and it was pleasing to observe that the leaflet and poster provided good basic information for what must be considered as the beginning of a sustainable adult education program.
9.4.3 RECOMMENDATIONS FOR FUTURE PROGRAMS
(1) General
Future programs would benefit from a much longer period both for preparation and implementation. Ideally, more time is needed for discussions, the logistics of getting the various parties together, obtaining the necessary approvals required for such items as the content of leaflets and posters, scripts for radio programs and video films, purchase and printing of education and publicity material etc. It should also be borne in mind that government officials and counterpart staff have other duties to perform and are not available on a full time basis as is the case for the study team.

M9-15
Volume II Main Report, Part I Master Plan Chapter 9 Environmental Education Programs
Also, due to the timing of the program which was required to be complete at the same time as the Interim Report of the Master Plan Study, it was not possible to include the final technical information and solutions of the Master Plan to the problem of pollution to Havana Bay, in the environmental education material.
It may be better in future programs to plan and agree the education program during Phase I (Basic study), prepare the educational and publicity material and commence implementation during Phase II (Master Plan Study), allowing time during Phase III (Feasibility study) to complete the educational material from the Master Plan Report, and continue and complete the implementation program.
Environmental Education is considered by all to be a continuous process to sustain the raised level of awareness of the target groups to protect and improve the environment they live in.
This program was carefully planned to provide education and publicity material beyond the initial phase to enable GTE to continue all of the program. If finance is available, future programs could allow for some further funding to ensure the success of the continuation of the program over a one to two year period.
(2) Program for Children and Youth
It is recommended that the schools program continues as it is, under the general direction of GTE, but with the local education authorities and teachers replacing the facilitator.
This schools program can easily be extended to many more schools in Ciudad de la Habana using the same methodology. There are sufficient leaflets and posters for at least another 200 schools, and the report to be produce by the facilitator should be sufficient for the local education authorities and teachers to continue the program with minimal input from GTE.
(3) Program for Citizens in general
It is recommended that CIGEA be involved to ensure that the television and radio programs are properly coordinated through the Mass Organizations and Organization of Journalists (see Figure 8.1, National Environmental Educational System).
(4) Program for INRH Agencies
The workshops should be continued in basically the same format for more of the staff of DPRH, EAH and the four water and sewerage corporations of Havana. These workshops should also be extended to cover CITMA, CIMAB, CENHICA and all other ministries and enterprises associated with Havana Bay, as an introduction to the problem. It is also recommended that the workshops be extended to include personnel from the Factories around the bay.
It is further recommended that more environmental educational course material be developed and introduced at seminars to be held in addition to the introductory workshops. The initial course material handed out at the workshop only gives general information on the problem, the institutions involved and the laws on the environment.
It is suggested that the technical elements of the Master Plan are summarized to form a document which will detail among other things, the pollution load, the strategy of water pollution control and the sewerage system master plan to 2020. This can be done by GTE (in cooperation with the JICA study team if possible).
M9-16
Volume II Main Report, Part I Master Plan Chapter 9 Environmental Education Programs
Participants at seminars should be carefully grouped in accordance with their profession and academic level; for example, executives, professional engineers, water quality experts, technicians, and workers from other disciplines. The requirements and depth of presentations at each seminar will need to be varied to suit each particular group.
CIGEA should be involved in the program to ensure that the National Environmental Strategy is followed in terms of Environmental Education and Dissemination.

M9-17
Volume II Main Report, Part I Master Plan Chapter 9 Environmental Education Programs
M9-17
JAPA
N IN
TER
NATIO
NAL C
OO
PER
ATION
AGE
NC
Y
THE D
EVELO
PM
EN
T STU
DY O
N TH
E IM
PR
OV
EM
ENT O
F SE
WER
AGE AN
D D
RAIN
AGE SY
STEM FO
R TH
E HAVAN
A BAY
Figure 9.3 E
xecuted Environm
ental E
ducation Program
s
Week Commencing 13-Jan-03 20-Jan-03 27-Jan-03 3-Feb-03 10-Feb-03 17-Feb-03 24-Feb-03 3-Mar-03Activity
Video Program1&2 Partial ElaborationApprove Places 3. Shooting & Script Approval 4. Editing & Post -productionPrepare Radio Program Produce Education/Publicity MaterialPrinting Leaflets & Posters, Children & AdultsPurchase and Printing of Tshirts & CapsInformation Document for INRH ProgramChildren & Youth ProgramDistribute Leaflets/Posters Distribute T Shirts & CapsPreparation Work by FacilitatorSchools Workshops, Havana ViejaSchools Workshops, San Miguel del PadronSchools Visits to Havana Bay & Rivers etc Prepare Essays, painting & poems etcPrepare Festival Festival & Display of School WorkINRH (DPRH) ProgramPreparation Work by FacilitatorWorkshop DPRH, EAH, Havana W & S Cos.Citizens Program (will commence later)Mass Media Broadcasts (TV & Radio)Produce Document for later use Workshops at other Schools Workshops for other Agencies & Industry
M10-1
Volume II Main Report, Part I Master Plan Chapter 10 Strategy of Water Pollution Control in Havana Bay
CHAPTER 10 STRATEGY FOR WATER POLLUTION CONTROL
IN HAVANA BAY 10.1 GENERAL
10.1.1 EXISTING USES OF HAVANA BAY
Havana Bay, with its world heritage sites and important historical monuments located at its entrance, is an essential part of many important tourist attractions in the City of Havana. The bay forms part of the elegant view of El Morro and La Cabaña sited on the eastern and western sides of the bay’s entrance channel.
The promenade along the entrance channel to Havana Bay and its continuation along Malecon is of indispensable value to citizens of Havana City (Habaneros) for its use as recreational area and also as an area for recreational fishing. It influences hearts and minds of every Habanero. The promenade along the entrance channel is also a dropping off and collection point for the hundreds of thousands of tourists who visit Havana City every year.
Aesthetic aspect of the entrance channel of Havana Bay has significant impact to the Habaneros and to the tourists.
Further, Havana Bay is one of the major industrial and commercial port of Cuba and also attracts luxury cruise liners sailing the Caribbean Sea with over a thousand ships arriving every year. Its contribution to the national economy is significant. Port of Havana Bay is also an important port in the wider Carribean sea.
In addition to serving as the shipping port for raw material and products for major industries along the coast of the bay, it also serves as a source of cooling water and finally as a receptor for their effluents. There are also many workshops along the coast of the bay for repair to ships etc.
The bay also serves as a transportation link between eastern and western parts of the Havana City. Commuters travel by passenger ship across the bay between two points on eastern side of the bay, namely Casa Blanca and Regla and one on western side of the bay namely Muelle de Luz.
Bay as part of the tourist attractions and as a major port has substantial role to the economy of Cuba. From the above, the need to protect the bay’s environment to fulfill its role to the national economy cannot be overemphasized.
10.1.2 PERCEPTION OF EXISTING WATER ENVIRONMENT
To understand the ‘public’ perception of the water environment problems and their priority, a workshop was carried out in which the participants including the counterparts staff were from most of the stakeholder institutions of Havana Bay. An introduction of the bay’s environment problems and its uses and on the participatory method for identifying and prioritizing the problems were provided prior to activities by the participants in two groups (a total of 24 participants and seven observers). From the results of the activity of the participants, the following can be concluded:
Major water environmental problems are:
- oil and grease (hydrocarbons)
- organic pollution

M10-2
Volume II Main Report, Part I Master Plan Chapter 10 Strategy of Water Pollution Control in Havana Bay
- eutrophication
- heavy metals
- bacterial pollution
And the main limitations identified are financing, inadequate laws and regulations and inadequate sewerage and drainage infrastructure.
10.1.3 FUTURE USES
When considering the future uses, existing uses described in the previous section still remain. A study by HINES-MITRANS envisaged to remodel the western coast of the bay from Sierra Maestra de San Francisco to Atares to construct several facilities such as hotels, convention centers, amphitheatre, port facilities for yachts etc. These uses will require improvement of water quality which remains deteriorated around Atares due to untreated wastewater discharges.
10.2 WATER ENVIRONMENT GOALS
10.2.1 FUTURE WATER ENVIRONMENT
Considering the enormous investment and time horizon required to implement the improvement of the sewerage and drainage infrastructure and in the absence of implementation plans for any additional uses of bay in the near future, it is prudent to limit the future water environment goals to protect against pollution which will impair the existing uses. The first step in the improvement of water environment of the bay is to prevent the progress of water pollution which will adversely affect the existing uses. Floating oil/grease in all parts of the bay and progressive pollution in the coves of Atares, Guasabacoa and Marimelena as evidenced by very low levels of dissolved oxygen, dark color of water (due to septicity) and accumulation of sediments will destroy the aesthetic quality and will hinder the port functions of the bay. For example, accumulation of sediment and garbage around the mouth of Arroyo Tadeo on the western coast of the bay hinder the ship movement to the workshops and industries located there.
10.2.2 WATER QUALITY GOALS
(1) Draft Coastal and Bay Water Quality Standards
A standard for water quality for bays and coastal areas is in the preparatory stage, namely “Vertimiento De Aguas Residuales a Las Costas y Aguas Marinas - Especificaciones”, which classifies uses into six categories. Categories are as follows:
Class A - Coral reef areas, areas for ecological conservation or protected areas
Class B - Marine areas reserved for bathing and recreational activity where persons contact with water
Class C - Marine areas for fishery development
Class D - Marine areas where sea water is used as cooling water for power generation
Class E - Bay areas developed for port activity
Class F - Marine areas without specific use
Table 10.1 shows the environmental quality standards for the water bodies suitable for their functions in terms of dissolved oxygen and total coliform concentration. Port use of Havana Bay fits into the Class E water body.

M10-3
Volume II Main Report, Part I Master Plan Chapter 10 Strategy of Water Pollution Control in Havana Bay
Table 10.1 Draft Coastal and Bay Water Quality Standards Type Water Body
Parameter Unit Class A Class C Class D Class E Class F
Dissolved oxygen (DO) mg/L 5.0 5.0 4.0 3.0 2.0 Total coliforms MPN/100 mL 100 250 250 1000 5000
Note: Standards for Class B are not available.
Figure 10.1 shows the existing DO levels in comparison with the classification of water bodies in the proposed standards.
Existing conditions as measured in this Study in year 2002 at coves of the bay, namely Atares, Guasabacoa and Marimelena, do not satisfy Class E water body. DO levels at Atares was below Class F and at Guasabacoa was Class F. At Marimelena, it varied between that of Class D and F. At Centro, it was between Class C and F and that at the Entrance Channel was between Class C and E.
There are no standards for oil/grease (or hydrocarbons) in a water body, except for effluent standard being specified for discharges to the water body. Draft effluent quality standards for oil/grease to Class E water body being 5 mg/L while that for a Class F water body being 50 mg/L. For reference the hydrocarbon concentration of refinery effluent was 42 mg/L in this Study and was 240 mg/L in year 1997 which are much higher than the draft standards for Class E water body.
Achievement of the water quality for Class E water body still falls short in terms of oil/grease (hydrocarbon) pollution which affect the aesthetic quality of bay.
(2) Water Quality Goals
Water quality goals necessary for maintaining existing uses:
Goal 1 : To achieve the draft standards for Class E water body in terms of dissolved oxygen levels (3 mg/L)
Goal 2 : To achieve the draft effluent standards for discharge to Class E water body in terms of oil/grease (below 5 mg/L)

M10-4
Volume II Main Report, Part I Master Plan Chapter 10 Strategy of Water Pollution Control in Havana Bay
Note: Comparison is to the DO levels measured in this Study.
Draft Coastal and Bay Water Quality Standards Type Water Body
Parameter Unit Class A Class C Class D Class E Class F
Dissolved oxygen (DO) mg/L 5.0 5.0 4.0 3.0 2.0 Total coliforms MPN/100 mL 100 250 250 1000 5000
Note: Standards for Class B are not available. Class A - Coral reef areas, areas for ecological conservation or protected areas Class B - Marine areas reserved for bathing and recreational activity where persons in direct
contact with water Class C - Marine areas for fishery development Class D - Marine areas where sea water is used as cooling water for power generation Class E - Bay areas developed for port activity Class F - Marine areas without specific use
THE DEVELOPMENT STUDY ON THE IMPROVEMENT OF SEWERAGE AND DRAINAGE SYSTEM FOR THE HAVANA
BAY
JAPAN INTERNATIONAL COOPERATION AGENCY
Figure 10.1 Comparison of DO Levels in Havana Bay (Year 2002) to Draft Standards
Atares
below Class FGuasabacoaClass F
Marimelena
betw een Class D and F
Cen trobetw een Class C and F
Entrance Channelbetween Class C and E

M10-5
Volume II Main Report, Part I Master Plan Chapter 10 Strategy of Water Pollution Control in Havana Bay
10.3 SCENARIO OF POLLUTION CONTROL
10.3.1 ROLE OF STAKEHOLDERS OR POLLUTERS
Table 10.2 shows the goals and key sectors in which action is required. An increase of dissolved oxygen levels will require that the organic pollution load to the bay be reduced and action is required to control sewerage, drainage and industrial wastewater. Industries and workshops along the coast of the bay and in the basin are required to take action to reduce oil/grease discharge to the bay.
Table 10.2 Goals and Responsibilities of Sector Key Sector in which action required
Goal Sewerage Drainage Industry
Increase dissolved oxygen level O O O Reduce floating oil, grease etc. O
In addition, environmental education is required to increase the environmental awareness of the population and environmental monitoring to evaluate the progress and effectiveness of pollution control measures. The role of environmental monitoring is specifically important because of the deficiency of data on the pollution mechanism of the bay. It is obvious that achievement of the goals by the implementation of a sewerage/drainage system improvement alone is not feasible and concerted action of sewerage/drainage system and that of industry will be necessary to achieve tangible results. For example, the presence of an oil/grease film on the surface of the bay water will be detrimental to the transfer of atmospheric oxygen.
10.3.2 WASTEWATERS MANAGED BY SEWERAGE SCHEME
Wastewater treatment managed by sewerage schemess mainly remove organic matter and nutrients to some extent. Removal of oil/grease and other toxic materials such as heavy metals will not be possible and will hinder the functioning of wastewater treatment.
Wastewaters managed by sewerage scheme will be limited to domestic, commercial, and institutional wastewater together with industrial wastewater which complies with discharge standards to the public sewers. Large industrial wastewater, with special characteristics such as that of the refinery which will hinder the treatment together with other wastewater, needs to be treated separately. Further, industrial wastewater which does not comply with the discharge standards to public sewers should be treated by the industry itself prior to discharge to public sewers.
Wastewater treatment technology available to reduce organic pollution load is in two steps namely primary treatment and secondary treatment. The level of secondary treatment indicates the maximum amount of removal possible with the sewerage system.
10.3.3 INDUSTRIAL WASTEWATER
As discussed in the previous section, industrial wastewater treatment shall be the responsibility of industries and its acceptance to the sewerage scheme is on the precondition that they comply with the discharge standards to public sewers.
Further, in terms of the organic pollution load discharged to the bay, the industrial load remains equally as high as that discharged by sewerage/drainage and almost all of the discharged load is by the refinery. The effect of sewerage and drainage improvement to the Marimelena area is very small compared to the load of the refinery and the improvement of dissolved oxygen levels in Marimelena requires that the organic load from the refinery be reduced as well.

M10-6
Volume II Main Report, Part I Master Plan Chapter 10 Strategy of Water Pollution Control in Havana Bay
10.4 WATER QUALITY MONITORING SYSTEM 10.4.1 EXISTING WATER QUALITY MONITORING SYSTEM
According to available information, water quality monitoring on Havana Bay, industrial wastewater, tributary rivers (Luyano River, Martin Perez River and Tadeo River) and drainage channels (Agua Dulce, Matadero and San Nicolas) is implemented by several organizations such as CIMAB, CENHICA, universities and the laboratory of Quibu Wastewater Treatment Plant (WWTP). The monitoring location, sampling frequency and measurement/analysis item are summarized in Table 10.3.
CIMAB started the water quality monitoring on Havana Bay from 1980. Now, as shown in Table 10.3, CIMAB is in charge of the monitoring on water quality of the Bay, the factories discharging wastewater into Havana Bay directly, as well as the sediments of Havana Bay. Besides the periodical monitoring mentioned above, CIMAB also carries out the water quality monitoring on tributary rivers (only at the river mouth) and drainage channels in some projects financed by GTE or other organizations (such as Italian consultant and GEF).
CENHICA is generally in charge of the water quality monitoring on tributary rivers of the Bay and the factories discharging wastewater into the tributary rivers, while the laboratory of Quibu WWTP mainly conducts water quality monitoring on the sewers and treated wastewater of WWTP. In some cases, local universities (such as CUJAE University) are also hired to carry out water quality monitoring on tributary rivers.
The Enterprise of Hydraulic Usage (EAH) set up a water quality monitoring system for 3 tributary rivers, Quibu WWTP and lagoons, Dams etc. in April 2000.
Table 10.4 shows the number of staff, major analysis instruments, analysis items and the capacity of analysis in the laboratories of these monitoring organizations. The major problems of existing water quality monitoring system are also summarized and analyzed as shown in Table 10.5 based on observations, and discussion with and visits to these organizations.
10.4.2 RECOMMENDATION FOR FUTURE WATER QUALITY MONITORING SYSTEM
Based on the results of reviewing the existing water quality monitoring system in the basin of Havana Bay and discussions with related organizations, some recommendations on future water quality monitoring system are given as follows:
To establish a unified and periodic water quality monitoring system (including unitary monitoring locations and analysis items) to monitor seawater quality inside and outside (baseline) of the Bay, water quality and flowrates of 3 tributary rivers, drainage channels, and industrial wastewater quality of factories, including sediment quality.
GTE will take responsibility for the financing of this monitoring system and for integrating the water quality database and for sharing all of the information with related organizations.
GTE will possess its own small boat to ensure that the monitoring of water quality can be conducted at any time if necessary.
The recommended monitoring system (sampling points and frequency, analysis and measurement items etc.) is summarized and shown in Table 10.6. Furthermore the approximate cost (only direct cost, i.e. personnel and transportation costs for sampling and analysis costs) for the recommended monitoring system is estimated to be about US$ 50,300 in each year.

M10-7
Volume II Main Report, Part I Master Plan Chapter 10 Strategy of Water Pollution Control in Havana Bay
Table 10.3 Existing Water Quality Monitoring System Analysis
Organization
Monitoring Location Frequency Analysis and Measurement Parameters Standard Monitoring
Agency
Other
Financial
Source CIMAB Inside of the Bay 5 points (Atares, Guasabacoa,
Marimelena Centro, Canal) 3 layers (0, 5 and 10 m)
2 times/year (wet season and dry season)
pH, DO, EC, Water Temp., Salinity, TSS, NH4-N, NO2-N, NO3-N, PO4-P, T-P, SiO3, HC, Chlorophyll-a, Plankton, Coliform, Co, Cu, Fe, Mn, Ni, Pb, Zn, Mo etc. 24 items
Water Environmental Standard for Fishing Purposes
GTE GEF
Outside of the Bay 2 points (Chivo, San Lazaro)×3 layers
-ditto- -ditto- -ditto- GTE
Industrial Wastewater
12 to 15 factories discharging wastewater into the Bay directly
1 time/year pH, Water Temp., TS, TSS, BOD, CODCr, T-N, T-P, HC and Flowrate
Discharge Standards
GTE GEF
Sediment in the Bay
5 points (Atares, Guasabacoa, Marimelena Centro, Canal) Superficial sediment
1 time/2 years Water content, HC, T-N, Clostridium Perfringens, Co, Cr, Cu, Fe, Mn, Ni, Pb, Zn, Mo etc.
No GTE
Tributary Rivers 2 points (Luyano Via Blanca, Martin Perez Via Blanca)
Temporary pH, DO, EC, Water Temp., Cl, Salinity, TS, TSS, BOD, CODCr, NH4-N, Org-N, T-N, PO4-P, T-P, SO4, HC, Coliform, Cd, Cr, Cu, Hg, Ni, Pb, Zn, etc.
NC27, Class C GTE Italian consultant
Drainage Channels 2 points (Agua Dulce, Matadero) Temporary Flowrate, pH, EC, COD, BOD, Cl, Salinity, TSS etc.
NC27, Class C Italian consultant
CENHICA Tributary Rivers Upstream, middle stream and downstream of 3 tributary rivers (Luyano River, Martin Perez River and Tadeo River)
2 times/year
pH, DO, EC, Water Temp., Cl, Salinity, SS, BOD, CODCr, NH4-N, NO2-N, NO3-N, T-N, PO4-P, T-P, Coliform, Cd, Cr, Cu, Hg, Ni, Pb, Zn and flow rate etc.
NC27, Class C GTE, Enterprise of Hydraulic Usage (EAH)
Industrial Wastewater
Factory discharging wastewater into the tributary rivers of the Bay
2 times/year
pH, Water Temp., TS, TSS, BOD, CODCr, T-N, T-P, HC and Flowrate
Discharge Standards
GTE
Sewers None - - - - Drainage Channels None - - - - Sediment of River None - - - - Laboratory of Quibu WWTP
Sewers 2 points (Caballeria and Casablanca)
1 time/month pH, DO, Water Temp., EC, DO, SS, BOD, COD, Cl- etc.
NC27 Agua de La Habana
CUJAE University
Tributary Rivers Upstream, middle stream and downstream of 3 tributary rivers
2 times/year
pH, EC, BOD, CODCr, Coliform NC27, Class C Enterprise of Hydraulic Usage (EAH)
Since 2000

M10-8
Volume II Main Report, Part I Master Plan Chapter 10 Strategy of Water Pollution Control in Havana Bay
Table 10.4 Current State of Water Quality Analysis Organization Analysis
Organization No. of Staff
Major Analysis Instruments
Analysis Parameters Technical Level and Capacity of Analysis
Laboratory of CIMAB
13 General instruments for manual analysis, GC, LC, ICP, UV/VIS, IF and other precision analysis instruments
Water Temp., pH, DO, EC, Salinity, SS, COD, BOD, T-N, NH3, NO2
-, NO3-, T-P, PO4
3-, SO4
2-, SiO3, HC, Chl-a, Plankton, Coliform, Phenol, As, Cd, Co, Cr, Cu, Fe, Hg, Mn, Ni, Pb, V, Zn etc.
High technical level, Manual analysis: 30 samples/d Instrumental analysis: 40 samples/d
Laboratory of CENHICA
16 General instruments for manual analysis, GC, AS, ICP and other precision analysis instruments
Water Temp., pH, DO, EC, Salinity, SS, COD, BOD, T-N, NH3, NO2
-, NO3-, T-P, PO4
3-, SO4
2-, SiO3, Chl-a, Plankton, Coliform, Phenol, As, Cd, Co, Cr, Cu, Fe, Hg, Mn, Ni, Pb, V, Zn etc.
High technical level, Manual analysis: 20-30 samples/d Instrumental analysis: 20 samples/d
Laboratory of Quibu WWTP
6 General instruments for manual analysis
Water Temp., pH, DO, EC, SS, COD, BOD, Cl- etc.
Normal technical level,Manual analysis: 6-18 samples/d
Laboratory of CUJAE University
8 General instruments for manual analysis, GC, GC-MS, and AS
Water Temp., pH, DO, EC, SS, COD, BOD, T-N, NH3, NO2
-, NO3
-, T-P, PO43-, SO4
2-, Cl-, Coliform etc.
High technical level, Manual/instrument analysis: 20 samples/d
AS: Atomic Absorption Spectrometer GC: Gas Chromatograph GC-MS: Gas Chromatograph-mass Spectrometer ICP: Inductively Coupled Plasma Emission Spectroscopy IF: Infrared Spectrophotometer LC: Liquid Chromatograph UV/VIS: Ultraviolet/Visible Spectrophotometer
Table 10.5 Major Problems of Existing Water Quality Monitoring System Items Content Organization Up to now, multiple organizations (such as GTE, Enterprise of Hydraulic Usage
(EAH), GEF and others) take the responsibility for monitoring of the Bay, tributary rivers, factories, sewers and drainage channels, which results in the difference in sampling location, sampling frequency and analysis parameters. 1) No unified water quality monitoring system 2) No comprehensive database on water and sediment quality 3) No system established yet to share the monitoring information
Budget GTE doesn’t have enough budget for monitoring the water quality of the Bay, tributary rivers, especially for factories and drainage channels.
Sampling 1) Both GTE and CIMAB don’t have a boat, therefore, the water quality monitoring on the Bay can’t be conducted to the schedule with tidal pattern.
2) The measurement of flowrates in tributary rivers is insufficient especially for Tadeo River.
3) Based on the available information, there is no monitoring on the sediments of tributary rivers, except that Havana University conducted a survey on the sediments of Martin Perez River from 1999 to 2000.
Analysis 1) Almost every laboratory is facing the problem of lack of chemical reagents and incomes for renewal of analysis instruments.
2) For some analysis items (such as heavy metals), different analysis methods are adopted in different analysis organizations, which results in poor comparability of the same item.
3) BOD, COD and T-N (total nitrogen) in the seawater of the Bay have not been analyzed, however these items are very important for evaluating eutrophication situation of the Bay.
Others There is no unified database of water quality of the Bay, tributary rivers, factories, sewers and drainage pipes. Moreover, sharing of the water quality data is insufficient.

M10-9
Interim Report Chapter 10 Strategy for Water Pollution Control in Havana Bay
Table 10.6 Recommended Future Water Quality Monitoring System Item Water in Havana Bay Water in Tributary Rivers Industrial Wastewater Drainage Channels Sediment in the Bay
Point & Frequency Items Point & Frequency Items Point &
Frequency Items Point & Frequency Items Point &
Frequency Items
A (Basic Items)
Inside of the Bay: 5 points×3 layers Frequency: 1time/month Outside of the Bay: 2 points×3 layers Frequency: 2 times/year Location: see Fig. 3.2
pH, EC (or Salinity), Transparency; DO and Water Temp. (1 m interval in vertical direction)
3 tributary rivers×3 points/river (Up, middle and down streams of Luyano, Martin Perez and Tadeo)Frequency: 1time/month
pH, Transparency, DO, Water Temp., EC
Outlets of 10 factories discharging high pollution load Frequency: 1time/year
pH, Water Temp., EC
2 drainage channels (Agua Dulce and Matadero): Frequency: 1time/month
pH, Water Temp., EC
Sediments inside of the Bay: Frequency: 5 points ×1 time/year;
Water content, TVS
B (Organic Items etc.)
Inside of the Bay: 5 points×3 layers Frequency: 4 times/year Outside of the Bay: 2 points×3 layers Frequency: 2 times/year
CODMn BOD, SS T-N, NH4-N NO2-N, NO3-NT-P, PO4-P
3 tributary rivers×3 points/river Frequency: 1time/month
CODCr , CODMn BOD, SS T-N, NH4-N NO2-N, NO3-NT-P, PO4-P
-ditto- CODCr BOD SS T-N T-P
2 drainage channels: Frequency: 4 times/year
CODCr BOD SS T-N T-P
Sediments inside of the Bay: Frequency: 5 points ×1 time/year
TOC, T-N, T-P
C (Biological Items)
Inside of the Bay: 5 points×3 layers Frequency: 4 times/year
Chlorophyll-a Plankton Coliform
-ditto- Coliform - - -ditto- Coliform - -
D (Heavy Metals and Others)
Inside of the Bay: 5 points×1 layer (surface) Frequency: 1 times/year
As, Cd, Cr, Cu, Hg, Ni, Pb, Zn, and HC
3 tributary rivers×3 points/river Frequency: 1time/year
As, Cd, Cr, Cu, Hg, Ni, Pb, Zn, and HC
-ditto- As, Cd, Cr, Cu, Hg, Ni, Pb, Zn, HC and others.
2 drainage channels: Frequency: 1 times/year
As, Cd, Cr, Cu, Hg, Ni, Pb, Zn, HC and others.
-ditto- As, Cd, Cr, Cu, Hg, Ni, Pb, Zn, HC
Flowrate - Point: mouths of 3 tributary rivers, Frequency: 2 times/year (24 hours survey)
Point: outlet of each factory,Frequency: occasional (24 hours survey)
Outlet of each WWTP: 1time/day; Agua Dulce and Matadero: 2 times/year (24 hours)
-
Cost,US$/year 20,400 23,800 3,400 1,800 900 *: Composite sample (for sea water, sediment of the Bay: 2-3 times; for water quality of tributary rivers, factories and drainage channels: 4-6 times) is recommended.

M11-1
Volume II Main Report, Part I Master Plan Chapter 11 Planning and Design Bases of Sewerage System
CHAPTER 11 PLANNING AND DESIGN BASES OF
SEWERAGE SYSTEM
11.1 TARGET YEAR FOR PLANNING To carry out the master planning for the improvement of an economically viable sewerage system, the elements of work necessary are forecast and generally defined in successive stages to meet the present and future needs of the Study Area up to the year 2020.
The Master Plan should, therefore, be compatible with sound projections of population increase, development programs, water consumption, income growth, and other national and local socio-economic factors affecting the future of the Study Area. The base year for future projections of planning framework is set in the year 2001, because almost all data available during the master plan study phase is that of the year 2001 with some exceptional cases.
11.2 SEWERAGE PLANNING AREA Table 11.1 summarizes the sewerage planning area covers a total of about 6,500 ha comprising 5,700 ha within Havana Bay basin and 800 ha out the basin as illustrated in Figures 11.1. The area of 100 ha covered by other sewerage scheme and the area covered by on-site sanitation or factories are excluded in the Study. The sewer planning area was selected to encompass all feasible wastewater collection areas consistent with topography, probable future population concentrations and distributions, and future housing development districts.
Table 11.1 Sewerage Planning Area (Year: 2020) Item Area Remarks 1. Sewerage Planning Area in this Study 6,432.2 ha
within Havana Bay Basin 5,665.3 ha out of Havana Bay Basin 766.9 ha Total 6,432.2 ha
2. Sewerage Planning Area by other scheme 97.1 ha 5. On-site Treatment 1,086.6 ha
Sanitation 851.0 ha Factory 235.6 ha Total 1,086.6 ha
Source: JICA Study Team
11.3 POPULATION
11.3.1 POPULATION IN THE STUDY AREA
The future population in Havana City (La Ciudad Habana) is projected to decrease slightly is as shown in the following table.
Table 11.2 Population in Havana City Year 1996 2000 2005 2010 2015 2020 Population *2204,333 2,185,076 2,168,404 2,151,562 2,135,747 2,110,256Note: * Census Data
Source: “PROJECCION DE LA POBLACION NIVEL NACIONAL Y PROVINCIAL, Período 2000-2025”, OFICINA NACIONAL DE ESTADITICAS CENTRO DE ESTUDIOS DE POBLACION Y DESARROLLO”

M11-2
Volume II Main Report, Part I Master Plan Chapter 11 Planning and Design Bases of Sewerage System
Since any projection of future population for municipalities in Havana City are not available, the future population related to the Havana Bay basin is projected, taking into account recent population trend, present and future land use, and future trend of economics. Table 11.3 shows the projected population: the total population of ten municipalities will be increased and those will be increased in peri-urban area, but those in urban center will be decreased or stabled at present level.
Table 11.3 Population of ten municipalities related to Havana Bay basin
Source: JICA Study Team
The total population within the basin is set at 800,000 in 2020 as the same level of 1996. The population of each municipality within the Havana Bay basin was estimated based on the census data and other detailed data and information in 1996. The ratio of the population within the basin against the total population is used to estimate the future population of each municipality within the basin in 2020. Table 11.4 summarize the population distribution within the basin. These population figures will be used for sewerage planning bases.
Table 11.4 Population Projection within Havana Bay basin
Source : JICA Study Team
11.3.2 SEWER SERVICE POPULATION
Table 11.5 summarize sewer service population; a target population to be served by public
Municipality relatedHavana Bay basin * 1996 2001 2005 2010 2015 2020
Plaza de la revolucion 172,064 172,045 172,500 173,000 173,500 174,000Centro habana 165,058 150,877 149,200 147,100 145,100 143,000Habana vieja 102,831 94,966 94,300 93,600 92,800 92,000Regla 42,032 42,390 43,400 44,600 45,800 47,000La habana del este 180,308 185,468 197,600 212,700 227,900 243,000Guanabacoa 106,015 106,374 110,700 116,100 121,600 127,000San miguel del padron 155,436 154,323 159,500 166,000 172,500 179,000Diez de octubre 240,713 229,626 228,900 227,900 227,000 226,000Cerro 138,506 135,261 136,300 137,500 138,800 140,000Arroyo naranjo 195,954 199,720 204,800 211,200 217,600 224,000Total 1,498,917 1,471,050 1,497,200 1,529,700 1,562,600 1,595,000
Municipality relatedHavana Basin * 1996 2001 2005 2010 2015 2020
Plaza de la revolucion 9,395 9,400 9,400 9,400 9,500 9,500Centro habana 86,106 78,700 77,800 76,800 75,700 74,600Habana vieja 105,178 95,000 94,400 93,600 92,800 92,000Regla 41,798 42,200 43,100 44,300 45,500 46,700La habana del este 15,025 15,500 16,500 17,700 19,000 20,200Guanabacoa 24,354 24,400 25,400 26,700 27,900 29,200San miguel del padron 145,880 144,800 149,700 155,900 162,000 168,200Diez de octubre 239,768 228,700 228,000 227,100 226,200 225,300Cerro 97,507 95,200 96,000 96,900 97,900 98,800Arroyo naranjo 31,087 31,700 32,500 33,500 34,500 35,500Total 796,098 765,600 772,800 781,900 791,000 800,000*:Estudio de Diagnostico sobre Asentamiento Humano en la Cuenca Bahia dela Habana

M11-3
Volume II Main Report, Part I Master Plan Chapter 11 Planning and Design Bases of Sewerage System
sewerage system.
Table 11.5 Sewer Service Population (Year: 2020) Item Population Remarks 1. Population in Ciudad Habana 2,110,256 2. Population within Study Area (Havana Bay
Basin) 800,000
3. Sewer Service Population in this Study 884,700 within Havana Bay Basin 725,600 out of Havana Bay Basin 159,100 Total 884,700
4. Population in other sewerage scheme 19,900 5. Population served by on-site Treatment 54,500
Sanitation 54,500 Factory 0 Total 54,500
Source: JICA Study Team
11.4 WASTEWATER GENERATION
11.4.1 GENERAL
Wastewater is classified into following four categories based on water supply conditions and each categorized wastewater generation is estimated as follows:
1) Domestic Wastewater = Per Capita Water Consumption Rate X Wastewater Generation Rate X Population
2) Small pollution source of commercial, institutional and industrial wastewater = Per Capita Water Consumption Rate X Wastewater Generation Rate X Population
3) Large pollution source of commercial, and institutional wastewater = Water consumption data X Wastewater Generation Rate
4) Large pollution source of industrial wastewater = Water consumption data X Wastewater Generation Rate
In the following section, the wastewaters generation is estimated at present (year 2001) and for the target year of 2020.
The present wastewater generation is estimated based on the water consumption and wastewater generation estimation of 1996 survey results Base on the water supply and sewerage study, “Estudio Sobre Los Ciclos del Agua en la Habana, Tomo II, Primera Parte, 1997“, and adjusted with economic growth between 1995 and 2001.
The future wastewater generation in 2020 is estimated based on the Cuban Norm of water supply and actual water supply data for large water consumer together with a future economic growth up to 2020.
More detail of description of how to estimate the wastewater generation will be presented in the followings.

M11-4
Volume II Main Report, Part I Master Plan Chapter 11 Planning and Design Bases of Sewerage System
11.4.2 PER CAPITA WATER CONSUMPTION
(1) Present Water Consumption
1) Domestic Water
Based on the water supply and sewerage study, “Estudio Sobre Los Ciclos del Agua en la Habana, Tomo II, Primera Parte, 1997“, the 1996 average domestic water consumption per capita in the municipalities related Havana Bay is estimated around 178 lpcd, (metered consumer: 160 lpcd and non-meter consumer: 190 lpcd).
2) Commercial, Institutional and Industrial Water for Small Consumers
The survey report also estimated that the average per capita water consumption of small scale consumers (less than 50m3/day) was 50 lpcd in 1996.
3) Commercial, Institutional and Industrial Water for Large Consumers
The average per capita water consumption of large scale consumers (more than 50m3/day) was 49 lpcd.
(2) Future Water Consumption
Based on Cuban Standards (Norm 53-91, 1983) for planning and design of Water Supply System, the water consumption in the target year is set to estimate the future wastewater generation rate. Table 11.6 shows the water demand in the Cuban Norm.
Table 11.6 Water Demand by Category Water Demand (lpcd)
Population Size Domestic Commercial Public Industry(small) Total
Less than 2,000 145 87 44 15 291 2,000 to 10,000 160 96 48 16 320
10,000 to 25,000 175 105 51 18 349 25,000 to 50,000 190 112 57 19 378 50,000 to 100,000 200 116 59 20 395
100,000 to 250,000 215 125 62 22 424 250,000 to 500,000 220 132 66 23 441
More than 500,000 225 135 68 23 451 Note: All figures above included water loss of 15 to 20% in water distribution system.
11.4.3 PER CAPITA WASTEWATER GENERATION
(1) Present Per Capita Wastewater Generation
Based on the present water consumption data of 1995 survey, the per capita wastewater generation rate at present (2001) is set as shown in Table 11.7.

M11-5
Volume II Main Report, Part I Master Plan Chapter 11 Planning and Design Bases of Sewerage System
Table 11.7 Present Per Capita Wastewater Generation
Item Unit 1995 data
Present (2001)
Remarks INRH study*
1. Per capita domestic water consumption, (Net value) lpcd 178 (187) 178 lpcd
2. Non-domestic water consumption by small water consumer (Net value)) lpcd 50 (120) 50 lpcd
3. Per capita domestic wastewater generation lpcd 160 168 ---
4. Non-domestic wastewater generation by small water consumer lpcd 50 110 ---
5. Per capita wastewater generation in 1996, except large user (3+4) lpcd 210 --- ---
6. Overall per capita wastewater generation, including large water consumer in 1996 level
lpcd --- --- 288 lpcd
(270 lpcd, without I/I)
Note: * source: “Analisis Hidraulico del Sistema de Alcantarillado Principal de Ciudad de La Habana, 1996”
1) Domestic Wastewater
Per capita domestic wastewater generation rate can be estimated based on the per capita water consumption rate. The domestic wastewater generation rate is generally within 0.7 to 1.0, because some portion of water supplied is used for gardening, car wash, etc.,
When the generation rate is assumed at 0.8 to 0.9, the domestic per capita wastewater generation rate is estimated by multiply the present per capita water consumption of 187 lpcd (see Table 11.8) with the ratio:187 lpcd x (0.8 to 0.9) = 150 to 168 lpcd.
2) Non-domestic Wastewater
Based on latest water consumption data, the average water per capita water consumption, the non-domestic wastewater generation rate for small consumers is estimated: 100 to 120 lpcd. With assuming that almost all water used will be discharged to sewer , i.e. wastewater generation rate of 0.9 to 1.0, the present per capita non-domestic small user is about 110 lpcd (=(100 to 120) x (0.9 to 1.0)= 90 to 110 lpcd.
Wastewater generation from the large water consumers is estimated based on the water consumption records of 1995, 2000 and 2002 for each consumer.
(2) Future Per Capita Wastewater Generation
Table 11.8 summarizes the future per capita wastewater generation rates are set by category for planning purposes, base on the Cuban Norm of Water Demand with assuming wastewater generation rate of 0.9.

M11-6
Volume II Main Report, Part I Master Plan Chapter 11 Planning and Design Bases of Sewerage System
Table 11.8 Future Per Capita Wastewater Generation Item Unit Domestic Commercial Public Small
IndustryPer capita water consumption (Norma Cubana)
lpcd 220 132 66 23
Water use not discharged to sewer lpcd - - 20 - Loss accounted in the norm % 15
112 39 20 Net per capita water consumption lpcd 187
171 Wastewater generation rate % 90 Net wastewater generation rate lpcd 168.3
=> 168 153.9 =>154
Source: JICA Study Team
11.4.4 WASTEWATER GENERATION
Table 11.9 summarizes the wastewater generation.

M11-7
Volume II Main Report, Part I Master Plan Chapter 11 Planning and Design Bases of Sewerage System
Table 11.9 Summary of Wastewater Generation
Population Wastewater
Generation (m3/d) Item 2001 2020 2001 2020
1. Within Study Area (Havana Bay Basin)
765,800 800,000 240,300 256,900
2. Total in the Study 862,600 884,700 268,600 315,900 2.1 Domestic wastewater generation - - 145,000 148,600 2.2 Non-domestic wastewater
generation by small user - - 94,900 136,300
2.3 Non-domestic wastewater generation by large user
- - 28,800 31,000
3. Sewerage total within Havana Bay basin
703,500 725,600 216,500 256,800
3.1 Domestic wastewater generation - - 118,200 121,900 3.2 Non-domestic wastewater
generation by small user - - 77,400 111,700
3.3 Non-domestic wastewater generation by large user
- - 20,900 23,200
4. Sewerage total out of Havana Bay basin
159,100 159,100 52,100 59,100
4.1 Domestic wastewater generation - - 26,700 26,700 4.2 Non-domestic wastewater
generation by small user - - 17,500 24,500
4.3 Non-domestic wastewater generation by large user
- - 7,900 7,900
5. Other sewerage scheme 14,900 19,900 4,200 6,400 6. On-site Treatment 47,400 54,500 13,200 24,000
Sanitation 47,400 54,500 13,200 17,600 Factory 0 0 6,400 6,400
Source: JICA Study Team
11.4.5 DESIGN POLLUTION LOAD
(1) Domestic Wastewater
For sewerage planning purpose, the following per capita pollutants loads are used to estimate domestic origin pollutants. The unit load of BOD are set based on the data of Cuba as discussed in Chapter 4 and those of SS, T-N and T-P are set based on typical domestic wastewater concentrations in literature.
Table 11.10 Per Capita Pollutant Load Per capita pollutant load - 40 g BOD5 /capita/d - 40 g SS* /capita/d - 7.4 g T-N/capita/d - 1.9 g T-P/capita/d
Source: JICA Study Team
(2) Non-domestic Wastewater by small water users
Per capita pollutant load of non-domestic wastewater discharged by small water users are set
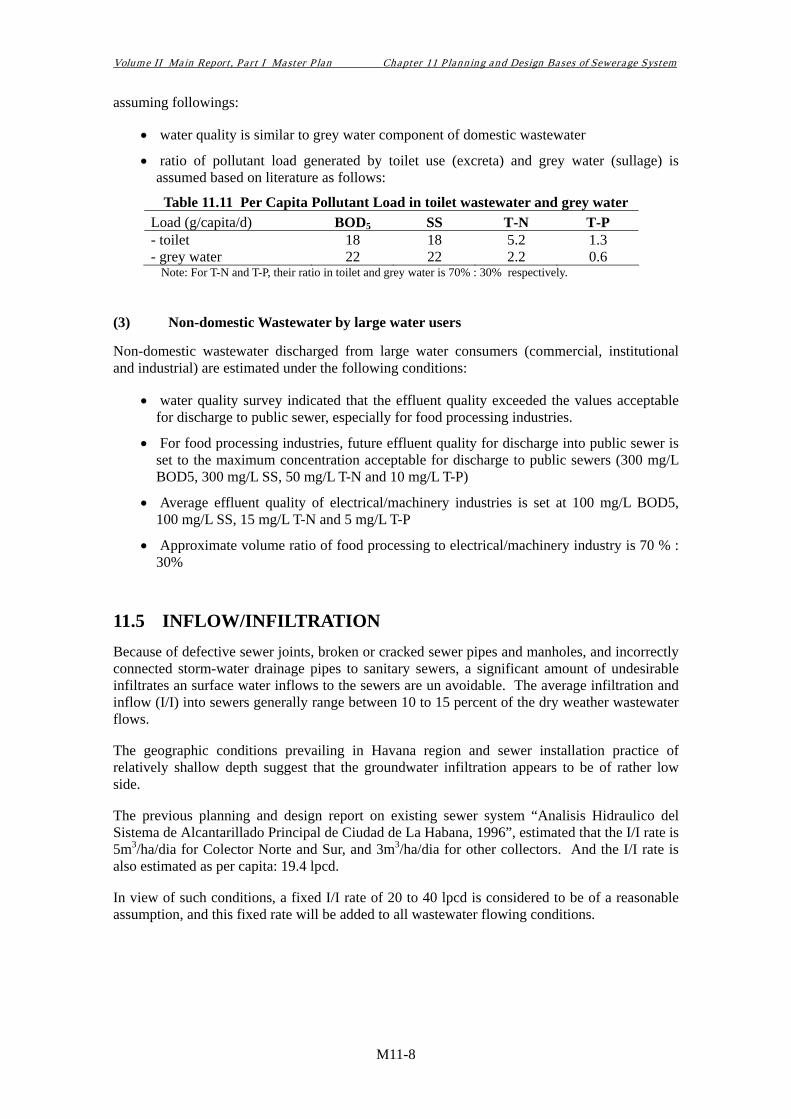
M11-8
Volume II Main Report, Part I Master Plan Chapter 11 Planning and Design Bases of Sewerage System
assuming followings:
• water quality is similar to grey water component of domestic wastewater
• ratio of pollutant load generated by toilet use (excreta) and grey water (sullage) is assumed based on literature as follows:
Table 11.11 Per Capita Pollutant Load in toilet wastewater and grey water Load (g/capita/d) BOD5 SS T-N T-P - toilet 18 18 5.2 1.3 - grey water 22 22 2.2 0.6
Note: For T-N and T-P, their ratio in toilet and grey water is 70% : 30% respectively.
(3) Non-domestic Wastewater by large water users
Non-domestic wastewater discharged from large water consumers (commercial, institutional and industrial) are estimated under the following conditions:
• water quality survey indicated that the effluent quality exceeded the values acceptable for discharge to public sewer, especially for food processing industries.
• For food processing industries, future effluent quality for discharge into public sewer is set to the maximum concentration acceptable for discharge to public sewers (300 mg/L BOD5, 300 mg/L SS, 50 mg/L T-N and 10 mg/L T-P)
• Average effluent quality of electrical/machinery industries is set at 100 mg/L BOD5, 100 mg/L SS, 15 mg/L T-N and 5 mg/L T-P
• Approximate volume ratio of food processing to electrical/machinery industry is 70 % : 30%
11.5 INFLOW/INFILTRATION Because of defective sewer joints, broken or cracked sewer pipes and manholes, and incorrectly connected storm-water drainage pipes to sanitary sewers, a significant amount of undesirable infiltrates an surface water inflows to the sewers are un avoidable. The average infiltration and inflow (I/I) into sewers generally range between 10 to 15 percent of the dry weather wastewater flows.
The geographic conditions prevailing in Havana region and sewer installation practice of relatively shallow depth suggest that the groundwater infiltration appears to be of rather low side.
The previous planning and design report on existing sewer system “Analisis Hidraulico del Sistema de Alcantarillado Principal de Ciudad de La Habana, 1996”, estimated that the I/I rate is 5m3/ha/dia for Colector Norte and Sur, and 3m3/ha/dia for other collectors. And the I/I rate is also estimated as per capita: 19.4 lpcd.
In view of such conditions, a fixed I/I rate of 20 to 40 lpcd is considered to be of a reasonable assumption, and this fixed rate will be added to all wastewater flowing conditions.

M11-9
Volume II Main Report, Part I Master Plan Chapter 11 Planning and Design Bases of Sewerage System
11.6 REQUIRED LEVEL OF WASTEWATER TREATMENT
11.6.1 INTRODUCTION
In the planning of sewerage system, level of wastewater treatment is determined based on the water quality objectives of receiving water bodies. Water quality objectives of the water bodies depends on the intended use of water bodies for example navigation, source of cooling water for industries, fishing etc. To achieve and maintain the water quality objectives, either water quality standards for the water bodies or discharge standards to the water bodies are set. In some cases, both standards are also set.
In case of new sewerage system in the Havana Bay Basin, wastewater effluent can be discharged either within the bay basin to Havana Bay through rivers or directly to sea through a sea-outfall.
For discharge within the bay basin, receiving water bodies are the rivers and the bay. For rivers, discharge standards are set by NC-27 (1999) “Discharge Standards to Inland Surface Waters”. Rio Luyano and Rio Martin Perez are in the category of Type B rivers for agriculture use. For Havana Bay, as discussed in Chapter 10, one of the water quality goal is set to a minimum of 3 mg/L of DO corresponding to Class E water body. By carrying-out water quality simulation for different scenarios of sewerage system development, required level of treatment is determined to achieve the water quality goal. Level of treatment to be adopted shall satisfy discharge standards to rivers as well as the water quality goal of the bay.
For discharge to sea, effluent standards set under the Land Based Sources Protocol (LBS Protocol) which followed the Cartagena Convention to protect the environment of Greater Caribbean need to be satisfied.
11.6.2 LEVEL OF WASTEWATER TREATMENT REQUIRED FOR DISCHARGE TO BAY
To determine the level of wastewater treatment, water quality simulation for several scenarios of pollution reduction was carried out. Scenarios include primary treatment, secondary treatment and advanced treatment of pollution load generated within area covered by the sewerage system and other measures such as pollution reduction of refinery wastewater effluent, reduction of internal sediment load etc. Basic conditions used to calculate the pollution load for different scenarios, results of water quality simulation and the conclusions are described in Appendix 7 Development of Havana Bay Water Quality Simulation Model. Description pertaining to the determination of wastewater treatment level is in the followings.
(1) Basic Conditions of Water Quality Projection
Out of the several scenarios studied, following scenarios are pertinent for discharge within the bay. They are:

M11-10
Volume II Main Report, Part I Master Plan Chapter 11 Planning and Design Bases of Sewerage System
Case 2 - Future (2020) with implementation of only GEF/UNDP Projects (Zone 4 and Zone 6)
Case 4 - Secondary treatment in new sewerage system and elimination of cross-connections in existing sewerage system
Case 5 - Primary treatment in new sewerage system and elimination of cross-connections in existing sewerage system
Case 6 - Advanced treatment in new sewerage system and elimination of cross-connections in existing sewerage system
Case 2 represents future condition in year 2020 with on-going GEF/UNDP projects for Zone 4 and Zone 6 are completed and without implementation of any other projects. In this case, pollutant load reduction will be for Dren Agua Dulce which will be diverted and treated together with industrial wastewater near the mouth of Rio Luyano and for part of the areas in Luyano-Abajo (Zone 6).
In Case 4, provision of secondary wastewater treatment in all of the sewer districts in Rio Luyano, Rio Martin Perez and in Arroyo Tadeo and elimination of pollution load discharged through stormwater drains generated in the existing sewerage system through improvement of cross-connections is considered. Case 4 signifies what could be achieved by new wastewater treatment system proposed in terms of organic pollution load reduction.
In Case 5, wastewater treatment level in the new sewerage system if primary treatment is provided in the new sewerage system instead of secondary treatment as in Case 4. Therefore, organic pollution load reduction will be less than that can be achieved in Case 4.
Case 6 in which effect of enhanced removal of nutrients through advanced treatment to the wastewater generated in the new sewerage system is considered.
(2) Estimated Pollution Load Discharge to the Bay
Based on the conditions described in the previous section, estimates of pollutant load discharge for the scenarios were made. Several assumptions are necessary for this estimation. They are as follows:
1. Industrial and domestic wastewater constitute approximately 25% of river flow in Rio Luyano and Rio Martin Perez presently based on an analysis by CIMAB and DPAA (1998). For Arroyo Tadeo which is an urban stream, the ratio is assumed to be 90% due to extremely small catchment (2.6 km2) and its urban nature. Based on these river flow, which results from natural processes was separated from the contribution of industrial and domestic wastewaters. Water quality of river due to natural processes is assumed to be the

M11-11
Volume II Main Report, Part I Master Plan Chapter 11 Planning and Design Bases of Sewerage System
values measured at the most upstream water sampling points in this Study. River flow and its quality or load were estimated by considering the natural portion of river flow and that contributed by wastewater. Table 11.12 shows the assumed river quality.
Table 11.12 Upstream River Quality Parameter Rio Luyano Rio Martin Perez Arroyo Tadeo
River flow (excluding wastewater), m3/d 86,120 46,590 800 BOD, mg/L 6 3 13 T-N, mg/L 0.6 3.5 7.8 T-P, mg/L 0.09 0.2 1.2 SS, mg/L 18 62 58 DO, mg/L 7 7 1
Source: Study Team
2. For the cases without implementation of any project other than GEF/UNDP, wastewater
load generated is expected to undergo degradation prior to reaching the bay. To account of this degradation, load generated is multiplied by a factor defined as run-off ratio which is the ratio between load discharged to the load generated. Run-off ratio in each sewer district is assumed at 90%.
3. Wastewater treatment efficiency for various level of wastewater treatment is assumed as follows:
Table 11.13 Wastewater Treatment Efficiency (Assumed) Parameter Primary Treatment Secondary Treatment* Advanced Treatment
BOD5 40 % 90 % 95% SS 50 % 90 % 95% T-N 15 % 15 % 65% T-P 15 % 15 % 75%
* - conventional activated sludge process
4. Wastewater treatment efficiency for treatment plants at Zone 4 and Zone 6 area are based on treatment plant design data. Average influent and effluent concentrations are as follows:
Table 11.14 Influent and Effluent Quality for Zone 6 WWTP (UNDP)
Parameter Influent Effluent
BOD5, mg/L 90 30 T-N*, mg/L 26 5 T-P, mg/L 10 5
* Kjeldahl Nitrogen

M11-12
Volume II Main Report, Part I Master Plan Chapter 11 Planning and Design Bases of Sewerage System
Table 11.15 Influent and Effluent Quality for Zone 4 WWTP (Italian)
Parameter Influent Effluent
BOD5, mg/L 109 20 T-N*, mg/L 20** 14** T-P, mg/L 5** 2.5**
* Kjeldahl Nitrogen
** calculated based on design data available for influent loads and % removals
5. Degradation of treated wastewater effluent between the point of WWTP discharge and the point of entry to bay is assumed to be negligible due to very short travel time (within a few hours) and lower concentration of organic matter remaining in secondary treated wastewater effluent for further biodegradation.
Tables 11.16 to 11.19 show the results of estimate for wastewater discharge to the Bay for Case 2, Case 4, Case 5 and Case 6.
Table 11.16 Case 2 - Future (2020) with GEF Projects Only Flow BOD5 T-N T-P SS
Sewer District Source
(River System) m3/d kg/d kg/d kg/d kg/d Luyanó-abajo 196,837 13,979 2,102 996 24,429Luyanó-arriba
Luyanó
Martin Pérez-abajo 84,328 7,035 1,344 307 9,784Martin Pérez-arriba
Martin Pérez
Tadeo Tadeo 10,635 1,729 307 76 1,754Existing (Central)
San Nicholas San Nicholas 8,554 1,320 145 79 352Matadero Matadero 77,760 8,942 610 1,053 22,728
Agua Dulce Agua Dulce - - - - -Refinery 6,406 21,723 54 1 Total 384,519 54,728 4,562 2,512 32,226

M11-13
Volume II Main Report, Part I Master Plan Chapter 11 Planning and Design Bases of Sewerage System
Table 11.17 Case 4 : Secondary Treatment Flow BOD5 T-N T-P SS
Sewer District Source
(River System) m3/d kg/d kg/d kg/d kg/d Luyanó-abajo 153,637 1,838 1,755 449 2,872Luyanó-arriba
Luyanó
Martin Pérez-abajo 84,328 906 1,167 263 3,655Martin Pérez-arriba
Martin Pérez
Tadeo Tadeo 10,635 208 262 65 220Existing (Central)
San Nicholas San Nicholas
Matadero Matadero
Agua Dulce Agua Dulce
Refinery 6,406 21,723 54 1 Total 255,005 24,676 3,238 778 6,746
Table 11.18 Case 5 : Primary Treatment Flow BOD5 T-N T-P SS
Sewer District Source
(River System) m3/d kg/d kg/d kg/d kg/d Luyanó-abajo 153,637 8,446 1,755 449 8,158Luyanó-arriba
Luyanó
Martin Pérez-abajo 84,328 4,736 1,167 263 6,719Martin Pérez-arriba
Martin Pérez
Tadeo Tadeo 10,635 1,167 262 65 987Existing (Central)
San Nicholas San Nicholas
Matadero Matadero
Agua Dulce Agua Dulce
Refinery 6,406 21,723 54 1 Total 255,005 36,073 3,238 778 15,864
Table 11.19 Case 6 : Advanced Treatment Flow BOD5 T-N T-P SS
Sewer District Source
(River System) m3/d kg/d kg/d kg/d kg/d Luyanó-abajo 153,637 1,178 753 138 2,211Luyanó-arriba
Luyanó
Martin Pérez-abajo 84,328 523 576 84 3,272Martin Pérez-arriba
Martin Pérez
Tadeo Tadeo 10,635 113 114 20 124Existing (Central)
San Nicholas San Nicholas Matadero Matadero
Agua Dulce Agua Dulce Refinery 6,406 21,723 54 1 Total 255,005 23,536 1,497 243 5,607

M11-14
Volume II Main Report, Part I Master Plan Chapter 11 Planning and Design Bases of Sewerage System
(3) Results of Water Quality Projection
Figures 11.1 to 11.5 shows the comparison of simulated water quality distribution in the bay in terms of DO, BODd, NH4-N, PO4-P and Chl-a for Case 2, Case 4, Case 5 and Case 6.
1) DO
Significant improvement in DO can be observed between Case 2 and Case 4. DO levels reach 3 mg/L in Atares which is the most polluted part of the bay in terms of organic pollution. With Case 5 i. e. primary treatment DO levels in Atares fall below 3 mg/L and therefore not sufficient to achieve water quality goals. Improvement of DO levels in Atares in Case 4 is due to improvement of DO levels resulting in Guasabacoa with secondary treatment as there will be no change in the pollution input to Atares which receives wastewater through drains.
2) BODd
Difference in BODd concentration (dissolved bio-degradable organic matter) in Guasabacoa between Case 4 (secondary treatment) and Case 5 (primary treatment) is due to level of treatment whereas no significant improvement between Case 4 (secondary treatment) and Case6 (advanced treatment) can be observed.
3) NH4-N and PO4-P
In case of nutrients, significant improvement in Gusabacoa can be observed in Case 6 (advanced treatment) due to removal of nutrients.
4) Chl-a
Simulated Chl-a concentration in Case 4 (secondary treatment) is approximately 6 µg/L which is similar to the levels observed outside the bay. With Case 6 (advanced treatment) overall reduction of Chl-a concentration in all parts of the bay is observed.

M11-15
Volume II Main Report, Part I Master Plan Chapter 11 Planning and Design Bases of Sewerage System
Case 2 DO Case 4 DO
Case 5 DO Case 6 DO
THE DEVELOPMENT STUDY ON THE IMPROVEMENT OF SEWERAGE AND DRAINAGE SYSTEM FOR THE HAVANA
BAY
JAPAN INTERNATIONAL COOPERATION AGENCY
Figure 11.1 Results of DO Levels for Different Levels of Wastewater Treatment

M11-16
Volume II Main Report, Part I Master Plan Chapter 11 Planning and Design Bases of Sewerage System
Case 2 BODd Case 4 BODd
Case 5 BODd Case 6 BODd
THE DEVELOPMENT STUDY ON THE IMPROVEMENT OF SEWERAGE AND DRAINAGE SYSTEM FOR THE HAVANA
BAY
Figure 11.2 Results of BODd Levels for Different Levels of Wastewater Treatment

M11-17
Volume II Main Report, Part I Master Plan Chapter 11 Planning and Design Bases of Sewerage System
Case 2 NH4-N Case 4 NH4-N
Case 5 NH4-N Case 6 NH4-N
THE DEVELOPMENT STUDY ON THE IMPROVEMENT OF SEWERAGE AND DRAINAGE SYSTEM FOR THE HAVANA
BAY
Figure 11.3 Results of NH4-N Levels for Different Levels of Wastewater Treatment
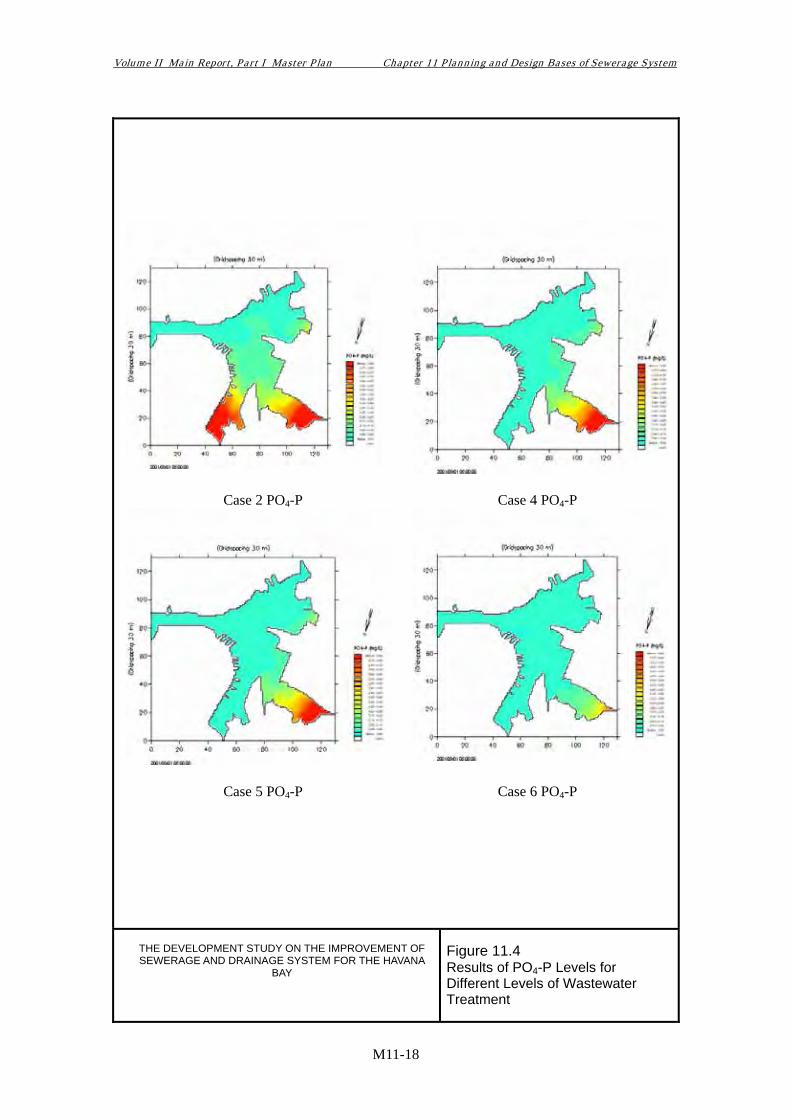
M11-18
Volume II Main Report, Part I Master Plan Chapter 11 Planning and Design Bases of Sewerage System
Case 2 PO4-P Case 4 PO4-P
Case 5 PO4-P Case 6 PO4-P
THE DEVELOPMENT STUDY ON THE IMPROVEMENT OF SEWERAGE AND DRAINAGE SYSTEM FOR THE HAVANA
BAY
Figure 11.4 Results of PO4-P Levels for Different Levels of Wastewater Treatment

M11-19
Volume II Main Report, Part I Master Plan Chapter 11 Planning and Design Bases of Sewerage System
Case 2 Chl-a Case 4 Chl-a
Case 5 Chl-a Case 6 Chl-a
THE DEVELOPMENT STUDY ON THE IMPROVEMENT OF SEWERAGE AND DRAINAGE SYSTEM FOR THE HAVANA
BAY
Figure 11.5 Results of Chl-a Levels for Different Levels of Wastewater Treatment

M11-20
Volume II Main Report, Part I Master Plan Chapter 11 Planning and Design Bases of Sewerage System
(4) Level of Wastewater Treatment
Based on the comparison of simulation results and the required water quality goal of minimum DO level of 3 mg/L in the bay the followings can be said.
To achieve minimum DO level of 3 mg/L in Atares where DO level is the lowest, it is necessary to provide secondary treatment to all the wastewater generated in the new sewerage system.
With secondary wastewater treatment for wastewater generated in the new sewerage system, simulation results do not show tendency of eutrophication. With the limitation in the number of data sets available and its extreme scatter especially in the data of total nitrogen and total phosphorous load to the bay and Chl-a which is the index of eutrophication, need for the provision of advanced wastewater treatment could not be justified at this stage.
It is therefore concluded that development of new sewerage system shall be with secondary wastewater treatment to reduce the organic pollution load which severely affects coves of Atares and Guasabacoa.
It should be noted, the secondary treatment level required to achieve water quality goal of 3 mg/L is more stringent than that required to satisfy the discharge standards for Inland Surface Waters (BOD5 of 40 mg/L) considering the raw sewage quality of 200 mg/L.
11.6.3 LEVEL OF WASTEWATER TREATMENT REQUIRED FOR DISCHARGE TO SEA
Effluent discharge standards under the LBS Protocol pertaining to sewerage system serving population of Havana Bay basin is as shown in Table 11.20.
Table 11.20 Effluent Standards to Sea Outfall Parameter Concentration
Total Suspended Solids 150 mg/L BOD5 150 mg/L pH 5 ~ 10 Fats, oil, and grease 50 mg/L Floatables Not visible
Considering the raw wastewater quality of 200 mg/L with improvement of cross-connections, primary treatment will be sufficient to satisfy the above standards.
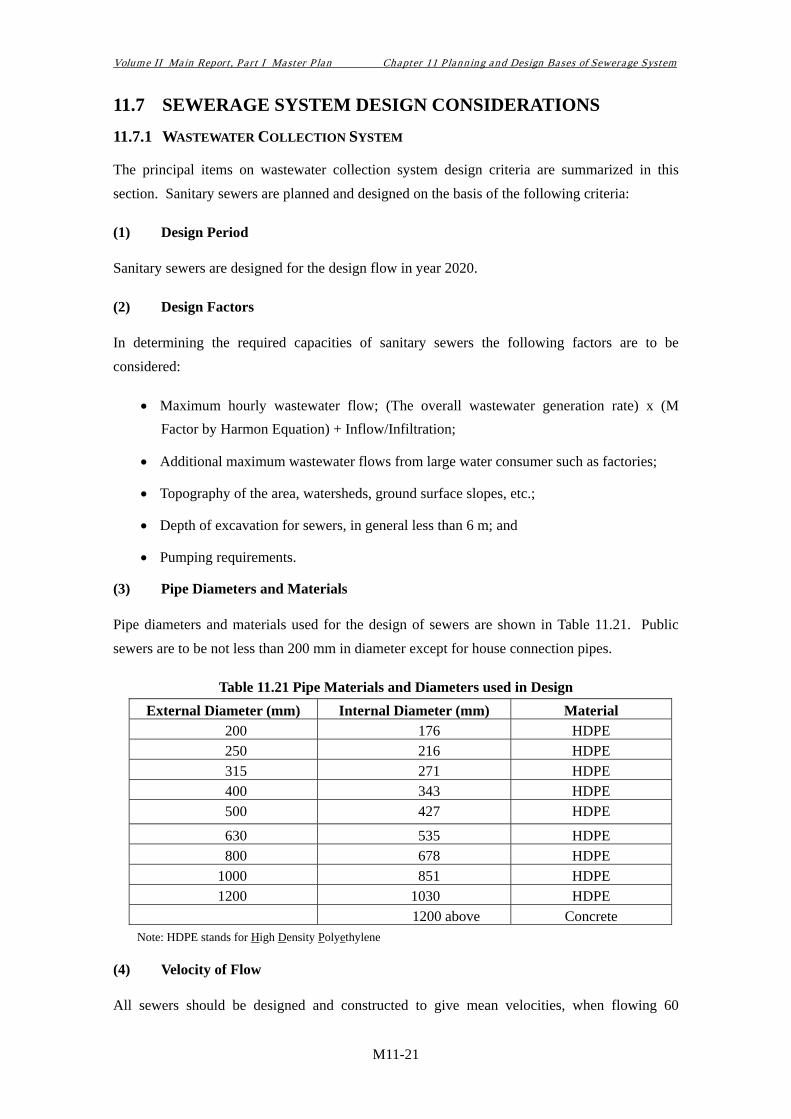
M11-21
Volume II Main Report, Part I Master Plan Chapter 11 Planning and Design Bases of Sewerage System
11.7 SEWERAGE SYSTEM DESIGN CONSIDERATIONS
11.7.1 WASTEWATER COLLECTION SYSTEM
The principal items on wastewater collection system design criteria are summarized in this section. Sanitary sewers are planned and designed on the basis of the following criteria:
(1) Design Period
Sanitary sewers are designed for the design flow in year 2020.
(2) Design Factors
In determining the required capacities of sanitary sewers the following factors are to be considered:
• Maximum hourly wastewater flow; (The overall wastewater generation rate) x (M Factor by Harmon Equation) + Inflow/Infiltration;
• Additional maximum wastewater flows from large water consumer such as factories;
• Topography of the area, watersheds, ground surface slopes, etc.;
• Depth of excavation for sewers, in general less than 6 m; and
• Pumping requirements.
(3) Pipe Diameters and Materials
Pipe diameters and materials used for the design of sewers are shown in Table 11.21. Public sewers are to be not less than 200 mm in diameter except for house connection pipes.
Table 11.21 Pipe Materials and Diameters used in Design External Diameter (mm) Internal Diameter (mm) Material
200 176 HDPE 250 216 HDPE 315 271 HDPE 400 343 HDPE 500 427 HDPE
630 535 HDPE 800 678 HDPE
1000 851 HDPE 1200 1030 HDPE
1200 above Concrete Note: HDPE stands for High Density Polyethylene
(4) Velocity of Flow
All sewers should be designed and constructed to give mean velocities, when flowing 60

M11-22
Volume II Main Report, Part I Master Plan Chapter 11 Planning and Design Bases of Sewerage System
percent depth, of not less than 0.6 m/sec, based on the Manning’s formula. The velocity shall not exceed 3 m/second in any type of sewers to protect sewer erosion. The sewer slopes shall be such that flow the wastewater with mean velocities of more than 0.6 m/sec when flowing full.
(5) Design Capacity Allowance
Design capacity allowance for the rehabilitated existing Colector and for the proposed new Colector is set as shown in the table below.
Table 11.22 Design Capacity Allowance for Colectors Capacity Allowance Hydraulic Specific Curbs
Diameter (mm)
allowance against to the capacity
Total capacity against to the design maximum hourly flow
Water depth in sewer
Water depth ratio against to the Full depth
200 to 600 100% 2 times H=Hfull x 0.5 700 to 1500 50% to 100% 1.5 to 2 times H=Hfull x (0.5 to 0.59)
1650 to 3000 25% to 50% 1.25 to 1.5 times H=Hfull x (0.59 to 0.64) Source: JICA Study Team
(6) Design Formulas
The Manning’s formula shall be used in principle for gravity sewers. The roughness coefficients, n-values, are assumed as follows: 0.016 for the evaluation of the present capacity of the existing sewers; 0.013 for new concrete pipes; 0.010 for plastic pipes or for plastic materials coating the inner wall as rehabilitation work.
While for the pumped main or pressured main, the Hazen-Williams formula is used and the roughness coefficient, C-value of 110 set for a ductile iron pipe with inner cement mortar lining.
(7) Pipe Connections
When a smaller sewer joins a larger one, the invert of the larger sewer should be lowered sufficiently to maintain the same energy gradient. An approximate method for securing these results is to place the sewer crown of both sewers at the same elevation.
11.7.2 PUMPING STATIONS
Although sewers are designed in principle to flow the wastewater by gravity, there may be some locations where aid of lift pumping stations can be economically justifiable. In such cases, the wastewater pumping stations may be designed. All pumping equipment, piping and conduits shall be designed to carry the expected peak flow rates.
For a large pumping station to lift the wastewater sub-main or main sewers should generally be of a dry well type. Provision shall be made to facilities removing pumps and motors. Suitable

M11-23
Volume II Main Report, Part I Master Plan Chapter 11 Planning and Design Bases of Sewerage System
and safe means of access shall be provided to dry wells of pumping stations and shall be provided to wet wells containing either bar screens or mechanical equipment requiring inspection or maintenance.
For intermediate wastewater pumping stations require for lifting the wastewater of branch and/or sub-main sewers should be of submersible type provided in a manhole or similar structures. Submersible pumps shall be readily removable and replaceable without dewatering the wet wells and with continuity of operation of the other unit or units.
11.7.3 WASTEWATER TREATMENT PLANT
(1) Wastewater Treatment Process
As an appropriate method as the biological secondary wastewater treatment, the following five methods are selected to compare the treatment principle, performance and applicability to the local conditions of the Study Area. The treatment principle and the results of comparison are shown in the Table 11.23 and Table 11.24, respectively.
• Conventional Activated Sludge Process (CAS)
• Oxidation Ditch Process (OD)
• Aerated Lagoon (AL)
• Lagoon (LG)
• Conventional Trickling Filter Process (TF)
Among the five wastewater treatment methods, the LG and the AL are easier and cheaper to operate and maintain but require large land area to construct the facilities. Difficulties in obtaining a large area required are obstacles to apply these methods to the Havana Bay basin.
Under a severe condition of land area available in the Havana Bay basin, the CAS process is the most applicable treatment method but requires high technology and experience as well as high expenses to construct, operate and maintain.

M11-24
Volume II Main Report, Part I Master Plan Chapter 11 Planning and Design Bases of Sewerage System
Table 11.23 Wastewater Treatment Principle of Selected Methods
Methods Process Component Process Principle
ConventionalActivated Sludge
(CAS) Process
Wastewater Influent is mixed with thereturned sludge from the finalsedimentation tank. The oganicmatters are oxidized and assimilatedby the aerbic bacterias (aerobicheterotrops) grown up in the sludge.
Oxidation Ditch (OD)Process
Wastewater influent is mixed with theactivated sludge in the Ditch. Theorganic matters are oxidized andassimilated by the activated sludge.The hydraulic retention time is longerthan the conventional activated sludgeprocess.
Aerated Lagoon (AL)
Organic matters in the wastewaterinfluent is oxidized and assimilatedby the aerobic bacterias grownup inthe lagoon. The aerobic conditionscan be kept by mechanical surface
Lagoon (LG)
Organic matters are degraded andassimilated by the bacterias under theboth aerobic and anaerobicconditions. The aerobic conditionsare generated by photosynthesis ofalgae.
ConventionalTrickling Filter (TF)
Process
While the wastewater influent flowsthrough the suface of filter media, theorganic matter is absorbed, oxidizedand assimilated by the bio-film orbio-slime attached and grown on thefilter media. When the bilofilmbecomes too thick, the biofilm will bedetached from the filter media. Thedetached biofilm is settled in the finalsedimentation tank to treat at excesssludge treatment facility.
PrimarySedimentation Tank
Aeration Tank FinalSedimentation Tank
Excess Sludge Treatment
Oxidation DitchFinal
Sedimentation Tank
Excess Sludge Treatment
Aerated LagoonFinal
Sedimentation Tank
Aerobic Lagoon
Primary Sedimentation Tank
Trickling Filter FinalSedimentation Tank
Excess Sludge Treatment
Maturation LagoonAnaerobic Lagoon

M11-25
Volume II Main Report, Part I Master Plan Chapter 11 Planning and Design Bases of Sewerage System
Table 11.24 Comparison of Five Wastewater Treatment Methods
Evaluation Item Conventional Activated Sludge Process (CAS)
Oxidation Ditch Process (OD)
Aerated Lagoon (AL)
Lagoon (LG)
Conventional Trickling Filter Process (TF) Remarks
Pollutant Removal Rate
BOD(%) SS(%)
90(85-95) 90(85-95)
90(85-95) 90(85-95)
85(80―95)
85(80―95)
85(80-90) 85(80-90)
Construction Very high Expensive than TF Cheaper than TF Cheap High Cost comparison O/M Very high Expensive than TF Cheaper than TF Cheap High
Land area requirements for comparison 1 2 5 13.3 1.7 Against Flow variations When the flow varies highly,
flow adjustment tanks are required to install.
Reaction tank volume, hydraulic retention time of about one day, is large enough to adjust the flow variations, but the loads to the final sedimentation tanks will be increased.
Since lagoon volume is large enough, or hydraulic retention time of about two to six days is long enough, this process is strong against the flow variation.
Since the lagoon volume is very large, or hydraulic retention time of several weeks, this process is very strong against the flow variation.
Flexibility against the flow variation is depended on the fixed film growth conditions. When the fixed film is removed due to flow variations, special operation such as increasing number of filters operating will be required.
Against Pollution Loads The same as the above. Due to the same reason above, this process is stronger than the AS process.
Due to the above reason, this process is strong against the loads variation.
Due to the above reason, this process is strong against the loads variation.
Due to varieties of bacteria slime formed, this process is strong against the loads variation.
Main Treatment Characteristics
A bulking phenomenon can be occurred. Proper operation can protect the occurrence of bulking phenomenon. An installation of anaerobic tank prior to the aeration tank is also an appropriate protection measure.
Since mixed liquor is aerated long hours and the sludge settleability becomes lower, the supernatant discharge easily from the final sedimentation tank. Therefore, the surface loadings to the sedimentation tanks shall be set at lower value than those of AS.
Treatment performance depends on the oxygen supply capacity of aerators、proper operation and maintenance of the aerator is the key of the performance.
Weather conditions and dominant biological species in the lagoons are keys for the wastewater treatment performance.
Easy algae grown-up on the surface of filter media disturbs the uniform wastewater feeding and causes lower treatment performance. Removal of algae from the filter media is essential to maintain the performance.
Treatment performance
The case when the treated wastewater quality becomes worse
When the settleability of activated sludge becomes worse, treatment performance becomes worse. In case a bulking phenomenon is occurred, the performance becomes the worst.
When the settleability of activated sludge becomes worse, treatment performance becomes worse.
When the oxygen supply capacity of surface aerator becomes lower.
In case of inconvenient weather conditions, such as rainy and low temperature.
When the biofilm or bio-slime formed on the surface of filter media is detached.

M11-26
Volume II Main Report, Part I Master Plan Chapter 11 Planning and Design Bases of Sewerage System
Table 11.24 (Continued) Comparison of Five Wastewater Treatment Methods
Evaluation Item Conventional Activated Sludge Process (CAS)
Oxidation Ditch Process (OD)
Aerated Lagoon (AL)
Lagoon (LG)
Conventional Trickling Filter Process (TF) Remarks
Major Mechanical Equipment
Sludge collector at the primary sedimentation tank, Blower, Diffuser, Sludge pumps, Sludge collector at the final sedimentation tank. Various kinds of equipment are required.
Aerator, Sludge pumps, Sludge collector at the final sedimentation tank. Smaller kinds and numbers required compared to those of AS.
Surface aerator No mechanical equipment is required to treat the wastewater.
Sludge collector at the primary sedimentation tank, Feeder pump, Distributor, and Sludge collector at the final sedimentation tank. Various kinds of equipment are required but more simple than those of AS.
Operation and Maintenance of the facility
Many facilities and equipment are required to operate and maintained regularly. Proper operation of returned sludge is very important for the good performance. This process requires many skilled operators and regular inspection.
Since the number of facilities and equipment requiring regular inspection is small, daily regular inspection is applicable. Proper operation of returned sludge is also required.
Regular inspection and Periodical Maintenance of surface aerators are required as well as the maintenance of lagoon.
Operation and Maintenance of the lagoon is very simple and does not require high technology. Equipment required regular inspection is very limited.
Number of facilities and equipment requiring regular inspection is small. This process does not require high technology.
Number of Staff for operation and maintenance
Large number of staff is required.
Small number of staff is required.
Medium number of staff is required between the case of lagoon and conventional trickling filter process.
Smallest number of staff is required.
Small number of staff is required.
Power Requirements Large Large Large No requirement Small Availability of the equipment
Since many kinds and large number of equipment are required, the availability is difficult.
Since the varieties of equipment are smaller than AS, the availability will be increased.
Since the surface aerator is major equipment, the availability is easy.
No mechanical equipment is required for treatment.
Many kinds but simple structured equipment is required, the availability may be increased to that of AS.
Sludge generation Sludge volume produced is large. The sludge treatment and disposal is required.
Sludge volume produced is smaller than the AS process. The sludge treatment and disposal is required.
Sludge volume produced is between OD process and lagoon.
Sludge generation is quite small. Sludge accumulated in the lagoon is removed once a few years. Sludge treatment is not required.
Sludge volume produced is smaller than the AS process. The sludge treatment and disposal is required.
Operation and Maintenance
Sludge Quality Under the proper operation, the sludge settleability is good. When the bulking phenomena occurred, the settleabiligy becomes bad.
The sludge settleability is worse than that of AS due to the longer aeration. Sluge dewaterability is lower to a mechanical method.
Due to longer aeration, the sludge settleability is worse than that of AS. But the sludge is stabled for treatment and disposal.
The sludge is settled and stabled in the lagoon. Sludge disposal from the lagoon is easy.
Since the sludge is mainly formed of the detached biofilm from the filter media, the setteability of sludge is good and sludge separation at the final sedimentation tank is easy.

M11-27
Volume II Main Report, Part I Master Plan Chapter 11 Planning and Design Bases of Sewerage System
Table 11.24 (Continued) Comparison of Five Wastewater Treatment Methods
Evaluation Item Conventional Activated Sludge Process (CAS)
Oxidation Ditch Process (OD)
Aerated Lagoon (AL)
Lagoon (LG)
Conventional Trickling Filter Process (TF) Remarks
Adverse impacts to the Havana Bay
The wastewater influent will be discharged without any treatment.
The same as AS. The same as AS. Once the wastewater influent is flowed into lagoons, the wastewater can be treated.
The same as AS. In case of power failure, adverse impacts and counter measures to be taken
Minimum capacity requirement of self power generator to maintain the process functions
Large (mainly for blowers and sludge pumps)
Large (mainly for aerators and sludge pumps)
Medium (mainly for surface aerators)
No requirement
Small (mainly for circulating pumps)
Wastewater Treatment Plants (WWTP) uses the process in Cuba
WWTP at Varadero WWTP at Trinidad Not yet identified WWTP at Varadero WWTPs at Quibu and Maria de Carmen
Adverse Environmental Impacts (Offensive odor, Noise, Vibration, etc.,)
Offensive odor produced from sludge treatment facilities will give adverse impacts to the surrounding areas, mitigation measures such as establishing buffer zone shall be taken. Prevention measures against noise and vibration generated by blowers shall be also taken, if necessary.
Offensive odor produced from sludge treatment facilities will give adverse impacts to the surrounding areas, mitigation measures against offensive odor shall be taken if necessary.
Mitigation measures against offensive odor shall be taken. Large area required for construction will give impacts to the habitats and ecology of the area.
The same as those of aerated lagoon.
Filter fly will be generated. Offensive odor will be produced from the primary sedimentation tank and sludge treatment facilities.
Applicability of Staged construction based on wastewater influent flow and quality
Possible Possible Possible but separated development of lagoon will require higher cost.
The same as the aerated lagoon.
Possible. Applicability of staged construction of treatment facilities
Performance when the wastewater influent quality is much lower than the design quality.
When the influent BOD concentration is lower than 100mg/L, difficulty in keeping proper MLSS concentration in the aeration tank may cause poor performance.
The same as that of AS. No problems in the performance.
No problems in the performance.
No problems in the performance, due to an appropriate bio-film or bio-slime will be formulated.
Applicability of the process to the new wastewater treatment plants in the Study Area (Havana Bay).
This process is applicable. In case of limited land area available but required to treat large volume of wastewater, mostly occurred in urban areas, this process is mostly applicable. However, this process requires higher construction and O/M costs and skilled operators to operate properly. It is essential to prepare comprehensive training programs of the operators.
The O/M of this process is easier than that of AS, however, this process may be difficult to apply for the Study Area because enough land area cannot be available.
This process is easy to operate and requires less land areas than those of lagoons. However, it is difficult to obtain the proper land area to construct the process.
This process is cheapest to construct and O/M among the process and is easy to operate. However, it is very difficult to obtain the proper land area to construct the process.
This process is easier to operate and cheaper in construction and O/M costs than those of AS. Land area requirement is larger than that of AS but smaller than those of other processes. The applicability of this process will be examined to the available land area.

M11-28
Volume II Main Report, Part I Master Plan Chapter 11 Planning and Design Bases of Sewerage System
(2) Sludge Treatment Methods
Sludge treatment process consists basically following unit processes such as sludge thickening, anaerobic digestion without heating and sludge drying bed or mechanical sludge dewatering. This sludge treatment process is already practiced in Quibu and Maria del Carmen Wastewater Treatment Plants in the Havana city except the mechanical sludge dewatering.
Sludge thickening is aimed to reduce the sludge volume. A gravity thickening tank is applied basically for this purpose. Anaerobic digestion is aimed to facilitate degradation, volume reduction and stabilization of the sludge. An opened to the air type digester without any heating system is applied for this purpose.
Sludge dewatering and drying is aimed to reduce sludge volume and easy to handle for disposal. Sludge drying beds and mechanical sludge dewatering are compared as shown in the table below. The sludge drying bed is easy to operate and cheaper in construction and O/M costs and better for sludge re-use such as agricultural or greeneries. However, it requires large land area to construct and more space in urban areas when any mitigation measures are needed to the offensive odor generated. As a conclusion, sludge drying beds are planned basically when the land area will be available enough, and mechanical sludge dewatering units are introduced to cover the remaining sludge to be treated. In case when the land area is very limited, the combination of sludge thickening and mechanical dewatering will be also planned.
Dewatered and dried sludge will be disposed off at sanitary land disposal site in principle.

M11-29
Volume II Main Report, Part I Master Plan Chapter 11 Planning and Design Bases of Sewerage System
Table 11.25 Comparison of Sludge Dewatering Process Parameters Sludge Drying Bed Mechanical Dewatering
Water Content Possibly reduced up to 60%. Possibly reduced up to 80%. Land area requirements
Large area is required to construct. The applicability will be examined based on the drying period of 11 days: design value applied to the Quibu WWTP
Very limited area is enough to install the mechanical equipment: Belt-press dewatering equipment.
Easiness to O/M and required technology level
Visual inspection of sludge drying conditions and removal of dried sludge are required. Any high skills are not required
It is required the daily inspection and regular maintenance for the equipment, and regular preparation and adjustment of coagulant aid. Technology and skills are needed to operate and O/M of the equipment.
◎ △ Availability of the equipment and spare parts
Valves and piping works are major facilities, thus the spare parts are easily available.
Mechanical equipment and coagulant aids are necessary to import from other countries, thus the spare parts are also not easily available.
◎ △ Adverse environmental impacts to the surrounding area
Offensive odor will be generated from the sludge drying bed. Near residential areas some mitigation measures require more land area of buffer zone to reduce the odor.
Offensive odor will be generated. Expensive mitigation measures can be taken at the house building: closing building or introducing deodorization equipment.
△ △ Construction Cost
Low ◎
High △
O/M Cost Low ◎
High △
Reuse of Sludge Agricultural usage is promising because urban agriculture is popular using organic fertilizer.
Water content is higher and direct reuse of sludge may be difficult.
◎ △ Experience in Cuba
Experienced or practiced in Quibu, Maria del Carmen, others WWTPs
Limited experience and planned at WWTP to be constructed partially financed by Italy government.
◎ △ Note: Figures in above tables show a three ranked evaluation: ◎ good, ○ fair, △ not good