APPENDIX C: East Midlands - Existing adopted Local Plans ...
92
Appendix C - SEA of Revocation of East Midlands Regional Strategy October 2012 1 APPENDIX C: East Midlands - Existing adopted Local Plans and saved policies Introduction In the East Midlands there are 41 local authorities with adopted Local Plans. Development plan documents which were adopted shortly before the date of publication of the Regional Spatial Strategy in March 2009 will have been prepared in parallel with preparation of the Regional Strategy, and so are likely to have anticipated and may have reflected its policies. For the purposes of preparing this Environmental Report it has been assumed that only development plan documents adopted during 2009 or afterwards are in general conformity. On this basis 13 local authorities have core strategies in place which are in general conformity with both the requirements of the 2004 Planning and Compulsory Purchase Act and the policies set out within the East Midlands Plan. Twenty eight authorities in the region have Local Plans at different stages of development, with adopted plans put in place before the East Midlands Plan was adopted in May 2008 and therefore not necessarily in general conformity with the regional policies There are 10 mineral and waste authorities. Some are working together to prepare minerals and waste policies under a single plan or core strategy, others are working individually and have separate minerals and waste policies, and one authority includes minerals and waste policies form part of its wider Core Strategy. Of the 12 (in total) plans covering minerals and waste policies, 6 are in general conformity with the policies set out within the East Midlands Plan since they were adopted after March 2009 or shortly beforehand and 6 which were adopted well before March 2009 and therefore not necessarily in general conformity with the regional plan. These Plans would form part of the Development Plan in the absence of the Revoked Regional Strategy. Table 1 shows a summary of the housing, gypsy & traveller sites, renewables, and employment policies/targets within the East Midlands Plan and those in local authority plans adopted before the East Midlands Plan was adopted. Table 2 presents a summary of the Mineral and Waste policies/targets within the East Midlands Plan and those in mineral and waste plans adopted before the East Midlands Plan was adopted.
Transcript of APPENDIX C: East Midlands - Existing adopted Local Plans ...

Appendix C - SEA of Revocation of East Midlands Regional Strategy
October 2012 1
APPENDIX C: East Midlands - Existing adopted Local Plans and saved policies Introduction In the East Midlands there are 41 local authorities with adopted Local Plans. Development plan documents which were adopted shortly before the date of publication of the Regional Spatial Strategy in March 2009 will have been prepared in parallel with preparation of the Regional Strategy, and so are likely to have anticipated and may have reflected its policies. For the purposes of preparing this Environmental Report it has been assumed that only development plan documents adopted during 2009 or afterwards are in general conformity. On this basis 13 local authorities have core strategies in place which are in general conformity with both the requirements of the 2004 Planning and Compulsory Purchase Act and the policies set out within the East Midlands Plan. Twenty eight authorities in the region have Local Plans at different stages of development, with adopted plans put in place before the East Midlands Plan was adopted in May 2008 and therefore not necessarily in general conformity with the regional policies There are 10 mineral and waste authorities. Some are working together to prepare minerals and waste policies under a single plan or core strategy, others are working individually and have separate minerals and waste policies, and one authority includes minerals and waste policies form part of its wider Core Strategy. Of the 12 (in total) plans covering minerals and waste policies, 6 are in general conformity with the policies set out within the East Midlands Plan since they were adopted after March 2009 or shortly beforehand and 6 which were adopted well before March 2009 and therefore not necessarily in general conformity with the regional plan. These Plans would form part of the Development Plan in the absence of the Revoked Regional Strategy. Table 1 shows a summary of the housing, gypsy & traveller sites, renewables, and employment policies/targets within the East Midlands Plan and those in local authority plans adopted before the East Midlands Plan was adopted. Table 2 presents a summary of the Mineral and Waste policies/targets within the East Midlands Plan and those in mineral and waste plans adopted before the East Midlands Plan was adopted.

Appendix C - SEA of Revocation of East Midlands Regional Strategy
October 2012 2

Appendix C - SEA of Revocation of East Midlands Regional Strategy
October 2012 3
Table 1
Planning Authority
Current status1
Other relevant policies2
East Midlands Plan Provision/Targets 3 Local authority adopted Plan Provision/Targets
HOUSING PROVISION
1
Policy 13a Annual apportionment from 2006 = 510 Total Housing Provision 2006-2026 = 10,200
No current Local Plan provision for new housing. No annual breakdown of housing targets
GYPSY & TRAVELLER PITCHES
Minimal additional pitch requirements 2007-2012 taking account of the need arising from future growth beyond 2012 Additional requirement = 1
No current Local Plan provision for G+T pitches
RENEWABLES
Amber Valley District Council
Amber Valley Local Plan (2006) Saved policies.
Policy 40 requires LPAs to develop policies and proposals to achieve indicative targets for renewable energy set out in Appendix 5. These targets are: 2010 GWh/y = 1400 2010 MWe = 324 2020 GWh/y = 5138 2020 MWe = 3671 2026 GWh/y = 5214 2026 MWe = 3683 There is no target set for individual Local Planning authorities.
No reference to regional renewable targets
1 Including where saved policies from earlier Local Plans remain in place, pending approval of the core strategy 2 Includes other near complete development plan documents 3 Housing Provision - Minimum dwelling provision 2001 to 2021 (less already built to Mar 06) = still to be built

Appendix C - SEA of Revocation of East Midlands Regional Strategy
October 2012 4
Planning Authority
Current status1
Other relevant policies2
East Midlands Plan Provision/Targets 3 Local authority adopted Plan Provision/Targets
EMPLOYMENT LAND
No target set for individual local authorities: Local Authorities, the East Midlands Development Agency and sub-regional strategic partnerships should work together in housing market area groupings to undertake and keep up to date employment land reviews to inform the allocation of a range of sites at sustainable locations.
Specific employment sites are covered in Local Plan, no direct link with the number of jobs this will provide.
HOUSING PROVISION Policy 13a Annual apportionment from 2006 = 560 Total Housing Provision 2006-2026 =11,200
No specific housing target in saved policies, but potential sites identified. No annual breakdown of housing targets.
GYPSY & TRAVELLER PITCHES Minimal additional pitch requirements 2007-2012 Local Plans will need to take account of the need arising from future growth beyond 2012 Additional requirement = 8
No current Local Plan provision for G+T pitches
RENEWABLES
2 Ashfield District Council
Ashfield Local Plan (2002) Saved policies.
See policy requirement for Amber Valley (above) Under environmental objectives in Local Plan - To consider the role of renewable energy schemes and to encourage more energy efficient forms of development. Policy EV18 - development of renewable energy sources will be permitted where there would be no adverse effect individually or cumulatively on: a) the character or appearance of the area; or, b) areas of natural, cultural, historic or

Appendix C - SEA of Revocation of East Midlands Regional Strategy
October 2012 5
Planning Authority
Current status1
Other relevant policies2
East Midlands Plan Provision/Targets 3 Local authority adopted Plan Provision/Targets
archaeological interest c) the amenities of nearby residents or the operation of other established uses in the vicinity No renewable energy targets in the Local Plan.
EMPLOYMENT LAND See policy requirement for Amber Valley above No direct link with the number of jobs this will
provide is available. Plan requires 199.8ha of new land required Dec 2000 to 2011
HOUSING PROVISION Policy 13a Annual apportionment from 2006 = 350 Total Housing Provision 2006-2026 = 7,000
Policies CS1-CS9 of the Core Strategy (covering the plan period 2010 to 2028) identifies and sets targets for 8 settlement areas to meet the RSS housing target, plus an additional amount to reflect the longer plan period. No annual breakdown of housing targets.
GYPSY & TRAVELLER PITCHES Minimal additional pitch requirements 2007-2012 Local Plans will need to take account of the need arising from future growth beyond 2012 Additional requirement = 25 (plus 18 transit pitches)
Policy DM6, Gypsies, Travellers and Travelling Showpeople states Land to accommodate the District’s residual pitch requirement will be allocated in the Site Allocations DPD. Monitoring indicators - target in CS states an additional 15 permanent sites and 23 additional transit pitches delivered by 2026.
RENEWABLES
3 Bassetlaw District Council
Core Strategy adopted Dec 2011
Bassetlaw Local Plan (2001) Saved policies.
See policy requirement for Amber Valley above Policy DM10 - The Council will be supportive of proposals that seek to utilise renewable and low carbon energy to minimise CO2 emissions. NO

Appendix C - SEA of Revocation of East Midlands Regional Strategy
October 2012 6
Planning Authority
Current status1
Other relevant policies2
East Midlands Plan Provision/Targets 3 Local authority adopted Plan Provision/Targets
targets for renewable energy EMPLOYMENT LAND See policy requirement for Amber Valley above No direct link with the number of jobs this will
provide is available. Policies CS1-CS9 identify 8 settlement areas identified in CS and target set for each settlement.. ..
HOUSING PROVISION Policy 13a Annual apportionment from 2006 = 380 Total Housing Provision 2006-2026 = 7,600
No current Local Plan provision for new housing. No annual breakdown of housing targets.
GYPSY & TRAVELLER PITCHES Minimal additional pitch requirements 2007-2012 taking account of the need arising from future growth beyond 2012 Additional requirement = 13 (plus 5 transit pitches and 1 plot for showpeople)
No specific target for permanent and transit gypsy caravan sites.
RENEWABLES See policy requirement for Amber Valley (above) No policy EMPLOYMENT
4 Blaby District Council
Blaby Local Plan (1999) Saved policies.
Core Strategy published Jan 2012
See policy requirement for Amber Valley (above) Primary employment areas identified on proposal map, will be protected. No direct link with the number of jobs this will provide is available.
HOUSING PROVISION Annual apportionment from 2006 = 400 Total Housing Provision 2006-2026 = 8,000
No specific housing target in saved policies although plan still allocates sites. No annual breakdown of housing targets.
GYPSY & TRAVELLER PITCHES
5
Bolsover District Council
Bolsover Local Plan (2000) Saved policies.
Minimal additional pitch requirements 2007-2012 taking account of the need arising from future
HOU 15 SITES FOR GYPSIES AND TRAVELLERS - planning permission will be granted

Appendix C - SEA of Revocation of East Midlands Regional Strategy
October 2012 7
Planning Authority
Current status1
Other relevant policies2
East Midlands Plan Provision/Targets 3 Local authority adopted Plan Provision/Targets
growth beyond 2012 Additional requirement = 1
for new gypsy and traveller caravan sites if there is an identified need. No figures/targets provided.
RENEWABLES See policy requirement for Amber Valley (above) No reference to renewable targets EMPLOYMENT See policy requirement for Amber Valley (above) The Local Plan provides for over 115 hectares of
employment land, and policies EMP1-3 set out the key sites. No direct link to number of jobs this will provide is available.
HOUSING PROVISION Policy 13a Annual apportionment from 2006 = 270 Total Housing Provision 2006-2026 = 2,700
No specific housing target in saved policies, but these policies allocate specific sites for development.. No annual breakdown of housing targets.
GYPSY & TRAVELLER PITCHES Minimal additional pitch requirements 2007-2012 taking account of the need arising from future growth beyond 2012 Additional requirement = 6
No current Local Plan provision for Gypsy and Traveller pitches
RENEWABLES See policy requirement for Amber Valley (above) Policies ED11 states that planning permission grant
for development that will provide a renewable energy source, provided criteria met. No specific renewable energy target
EMPLOYMENT
6
Boston Borough Council
Boston Borough Local Plan (1999) Saved policies
See policy requirement for Amber Valley (above) Policies ED1-5 and ED7-8 refer to sites on the proposals map which might or might not be acceptable for new industrial or commercial

Appendix C - SEA of Revocation of East Midlands Regional Strategy
October 2012 8
Planning Authority
Current status1
Other relevant policies2
East Midlands Plan Provision/Targets 3 Local authority adopted Plan Provision/Targets
Development, or extensions to existing Buildings, subject to meeting certain criteria. No direct link with the number of jobs this will provide is available.
HOUSING PROVISION Policy 13a Annual apportionment from 2006 = 340 Total Housing Provision 2006-2026 = 6,800
No specific housing target in saved policies but policies H1 and H2 allocate housing sites and phasing criteria. No annual breakdown of housing targets.
GYPSY & TRAVELLER PITCHES Minimal additional pitch requirements 2007-2012 taking account of the need arising from future growth beyond 2012 Additional requirement = 2
Policy H13 provides criteria on the suitability of proposed Gypsy and Travellers sites. No figures provided.
RENEWABLES See policy requirement for Amber Valley (above) Policy E25 - Planning permission will be granted
for developments which incorporate renewable energy techniques, subject o meeting certain criteria. No specific renewables target set.
EMPLOYMENT
7
Broxtowe Borough Council
Broxtowe Local Plan (2004) Saved policies.
Broxtowe Core Strategy published Jun 2012
See policy requirement for Amber Valley (above) No direct link with the number of jobs this will provide is available. Polices EM1-3 identify sites and set criteria for development of new and existing sites for employment uses. The Local Plan identifies 44.8 hectares of new land.
HOUSING PROVISION 8 Charnwood Borough Council
Charnwood Local Plan (2004) Saved
Policy 13a Annual apportionment from 2006 = 790
No specific housing target but saved Policies H/1 and H/2 sets out sites for new housing allocations.

Appendix C - SEA of Revocation of East Midlands Regional Strategy
October 2012 9
Planning Authority
Current status1
Other relevant policies2
East Midlands Plan Provision/Targets 3 Local authority adopted Plan Provision/Targets
Total Housing Provision 2006-2026 = 15,800 No annual breakdown of housing targets.
GYPSY & TRAVELLER PITCHES Minimal additional pitch requirements 2007-2012 taking account of the need arising from future growth beyond 2012 Additional requirement = 9 (plus 5 transit pitches and 4 plots for showpeople)
Policy H/9 and H/10 refer to determination of planning applications for gypsy sites and for travelling showpeople sites. No specific target.
RENEWABLES See policy requirement for Amber Valley (above) Policy EV/41 Planning permission will be granted for
development for renewable energy schemes provided criteria met. No specific renewable energy targets.
EMPLOYMENT
policies
See policy requirement for Amber Valley (above)
No direct link with the number of jobs this will provide is available. Policy E5 identifies 50ha of new sites to meet the overall Local Plan need for employment land.
HOUSING PROVISION Policy 13a Annual apportionment from 2006 = 380 Total Housing Provision 2006-2026 = 7,600
Policy HSN 1 identifies sites to help meet the anticipated housing need of 7,115 dwellings for the period 1991-2016. No annual breakdown of housing targets.
GYPSY & TRAVELLER PITCHES
9 Chesterfield Borough Council
Replacement Chesterfield Local Plan (June 2006)
Core Strategy published Feb 2012
Minimal additional pitch requirements 2007-2012 taking account of the need arising from future growth beyond 2012
Policy hsn8 contains no specific targets but allows development subject to meeting certain criteria.

Appendix C - SEA of Revocation of East Midlands Regional Strategy
October 2012 10
Planning Authority
Current status1
Other relevant policies2
East Midlands Plan Provision/Targets 3 Local authority adopted Plan Provision/Targets
Additional requirement = 0 RENEWABLES See policy requirement for Amber Valley (above) Policy EVR22 contains no specific reference to
renewable energy targets.
EMPLOYMENT See policy requirement for Amber Valley (above)
Policies EMP1-4 identifies sites to meet the former Structure Plan target of 137.5 hectares of land for the period 1991-2016. No direct link with the number of jobs this will provide is available.
HOUSING PROVISION Annual apportionment from 2006 = 965 Total Housing Provision 2006-2026 = 19,300
Policy 7: Delivering Housing of the Core Strategy requires Development Plan Documents to make provision of 16,800 dwellings for the period 2001-2021. No annual breakdown of housing targets.
GYPSY & TRAVELLER PITCHES Minimal additional pitch requirements 2007-2012 taking account of the need arising from future growth beyond 2012 Additional requirement = 1 (plus 3 transit pitches)
Policy 17: Gypsies and Travellers –Where a need is identified for additional accommodation for gypsies, travellers or travelling show people, planning permission may be granted, or site allocations proposed, when specified criteria are met. No specific target.
RENEWABLES
10 Corby Borough Council
North Northamptonshire Core Strategy adopted Jun 2008
Corby Local Plan (1997) Saved policies.
See policy requirement for Amber Valley (above) Policy 14: Energy Efficiency and Sustainable Construction requires development should meet the highest viable standards of resource and energy efficiency and reduction in carbon emissions. For

Appendix C - SEA of Revocation of East Midlands Regional Strategy
October 2012 11
Planning Authority
Current status1
Other relevant policies2
East Midlands Plan Provision/Targets 3 Local authority adopted Plan Provision/Targets
developments of over 200 dwellings it includes a target of at least 30% of the demand for energy will be met on site (the actual figure to depend upon technical and economic viability), and renewably and/or from a decentralised renewable or low- carbon energy supply.
EMPLOYMENT See policy requirement for Amber Valley (above). Level of employment development monitored against an increase in employment of 43,800 jobs in North Northamptonshire.
Policy 11: Distribution of Jobs - The quantity and quality of existing employment sites and allocations will be reviewed against the job creation target of 13,580.
HOUSING PROVISION Annual apportionment from 2006 = 540 Total Housing Provision 2006-2026 = 10,800
No specific housing target in saved policies.
GYPSY & TRAVELLER PITCHES Minimal additional pitch requirements 2007-2012 taking account of the need arising from future growth beyond 2012 Additional requirement = 6 (plus 3 transit pitches)
No reference to gypsy and traveller provision.
RENEWABLES See policy requirement for Amber Valley (above) No reference to renewable targets EMPLOYMENT
11 Daventry District Council
Daventry Local Plan (1997) Saved policies.
Core Strategy published Feb 2011
See policy requirement for Amber Valley (above)
No specific target in Local Plan. No direct link with the number of jobs this will provide is available.

Appendix C - SEA of Revocation of East Midlands Regional Strategy
October 2012 12
Planning Authority
Current status1
Other relevant policies2
East Midlands Plan Provision/Targets 3 Local authority adopted Plan Provision/Targets
HOUSING PROVISION Policy 13a Annual apportionment from 2006 = 720 Total Housing Provision 2006-2026 = 14,400
Policies H1-H4 and H9 identify sites and expected housing provision to help meet anticipated housing need of 15,500 dwellings between 1991 and 2011. No annual breakdown of housing targets.
GYPSY & TRAVELLER PITCHES Minimal additional pitch requirements 2007-2012 taking account of the need arising from future growth beyond 2012 Additional requirement = 16
Policy H15 Sites for Gypsies and Travellers contains no specific targets
RENEWABLES See policy requirement for Amber Valley (above) Policy E10 Renewable Energy – development
proposals will have regard to the need to reduce the net use of energy. No specific renewable energy targets
EMPLOYMENT
12 Derby City Council
Derby Local Plan Review (2006) Saved policies.
See policy requirement for Amber Valley (above) Policies identify around 338.8 hectares of available land for employment purposes. No direct link with the number of jobs this will provide is available
HOUSING PROVISION Policy 13a Annual apportionment from 2006 = 200 Total Housing Provision 2006-2026 = 4,000
No specific housing target in saved policies. No annual breakdown of housing targets.
GYPSY & TRAVELLER PITCHES
13 Derbyshire Dales District Council
Derbyshire Dales Local Plan (2005) Saved policies.
Minimal additional pitch requirements 2007-2012 taking account of the need arising from future growth beyond 2012
No specific targets in the Local Plan

Appendix C - SEA of Revocation of East Midlands Regional Strategy
October 2012 13
Planning Authority
Current status1
Other relevant policies2
East Midlands Plan Provision/Targets 3 Local authority adopted Plan Provision/Targets
Additional requirement = 2 RENEWABLES See policy requirement for Amber Valley (above) Policy CS5 – Renewable Energy installations and
Policy CS6 Wind Turbine generator Development Development will be allowed where it can be demonstrated that the benefits of renewable energy production outweigh any adverse impact. No specific renewable energy targets.
EMPLOYMENT See policy requirement for Amber Valley (above)
Policy EDT1 identifies sites to meet target of 35 hectares. No direct link with the number of jobs this will provide is available.
HOUSING PROVISION
Policy 13a Annual apportionment from 2006 = 600 Total Housing Provision 2006-2026 = 6,000
No specific housing target in saved policies. No annual breakdown of housing targets.
GYPSY & TRAVELLER PITCHES Minimal additional pitch requirements 2007-2012 taking account of the need arising from future growth beyond 2012. Additional requirement = 7
No specific targets set in Local Plan.
RENEWABLES See policy requirement for Amber Valley (above) No saved policy on renewable energy. EMPLOYMENT
14 East Lindsey District Council
East Lindsey Local Plan (1995) Saved policies
See policy requirement for Amber Valley (above)
Employment land allocated on proposals map but not quantifiable. No direct link with the number of jobs this will provide is available.

Appendix C - SEA of Revocation of East Midlands Regional Strategy
October 2012 14
Planning Authority
Current status1
Other relevant policies2
East Midlands Plan Provision/Targets 3 Local authority adopted Plan Provision/Targets
HOUSING PROVISION Annual apportionment from 2006 = 445 Total Housing Provision 2006-2026 = 8,900
Policy 7 requires Development Plan Documents will make provision for 9,400 dwellings for the period 2001-2021. No annual breakdown of housing targets.
GYPSY & TRAVELLER PITCHES Minimal additional pitch requirements 2007-2012 taking account of the need arising from future growth beyond 2012 Additional requirement = 4 (plus 2 transit pitches)
Policy 17: Gypsies and Travellers. Travellers –Where a need is identified for additional accommodation for gypsies, travellers or travelling show people, planning permission may be granted, or site allocations proposed, when specified criteria are met. No specific target.
RENEWABLES See policy requirement for Amber Valley (above) Policy 14: Energy Efficiency and Sustainable
Construction requires development should meet the highest viable standards of resource and energy efficiency and reduction in carbon emissions. For developments of over 200 dwellings it includes a target of at least 30% of the demand for energy will be met on site (the actual figure to depend upon technical and economic viability), and renewably and/or from a decentralised renewable or low- carbon energy supply.
EMPLOYMENT
15 East Northamptonshire Council
North Northamptonshire Core Strategy adopted June 2008. The Rural North Oundle & Thrapston Plan (Jul 2011)
East Northamptonshire Local Plan (1996) Saved policies
See policy requirement for Amber Valley (above). Level of employment development to be monitored against an increase in employment of 43,800 jobs in North Northamptonshire.
Policy 11: Distribution of Jobs - The quantity and quality of existing employment sites and allocations will be reviewed against the job creation target of 5,220
16 Erewash Erewash HOUSING PROVISION

Appendix C - SEA of Revocation of East Midlands Regional Strategy
October 2012 15
Planning Authority
Current status1
Other relevant policies2
East Midlands Plan Provision/Targets 3 Local authority adopted Plan Provision/Targets
Policy 13a Annual apportionment from 2006 = 360 Total Housing Provision 2006-2026 = 7,200
No specific housing target in saved policies but policies identify sites to meet local housing need. No annual breakdown of housing targets.
GYPSY & TRAVELLER PITCHES Minimal additional pitch requirements 2007-2012 taking account of the need arising from future growth beyond 2012 Additional requirement = 0
No specific provision for G&T pitches in the Local Plan
RENEWABLES See policy requirement for Amber Valley (above) No reference to renewable energy targets EMPLOYMENT
Borough Council
Local Plan (2005) Saved policies.
See policy requirement for Amber Valley (above). Policies E1 and E4 identify specific sites totalling over 100ha.
HOUSING PROVISION Policy 13a Annual apportionment from 2006 = 400 Total Housing Provision 2006-2026 = 8,000
No current housing targets.
GYPSY & TRAVELLER PITCHES Minimal additional pitch requirements 2007-2012 taking account of the need arising from future growth beyond 2012 Additional requirement = 4
No policy for Gypsy and Traveller pitches. No Targets
RENEWABLES See policy requirement for Amber Valley (above) Policy ENV 5 Renewable Energy. General policy in
support of renewable energy but no specific renewable energy targets.
EMPLOYMENT
17 Gedling Borough Council
Gedling Local Plan (2005) Saved policies.
Gedling Core Strategy published Jun 2012
See policy requirement for Amber Valley (above) Local Plan allocates 49.5Ha Local Plan for development. No direct link with the number of jobs

Appendix C - SEA of Revocation of East Midlands Regional Strategy
October 2012 16
Planning Authority
Current status1
Other relevant policies2
East Midlands Plan Provision/Targets 3 Local authority adopted Plan Provision/Targets
this will provide is available HOUSING PROVISION Policy 13a Annual apportionment from 2006 = 350 Total Housing Provision 2006-2026 = 7,000
Overall Housing Provision of 7,700 dwellings for the period 2006 -2028, with figures given for each of 5 areas in the District. No annual breakdown of housing targets.
GYPSY & TRAVELLER PITCHES Minimal additional pitch requirements 2007-2012 taking account of the need arising from future growth beyond 2012 Additional requirement = 19 (plus 5 transit pitches and 24 plots for show people
To ensure that Gypsy, Traveller and Travelling Showpeople groups have access to suitable accommodation; the following minimum provision will be made between 2006 and 2016 through a combination of the development control process and the Allocations DPD: - 30 Gypsy and Traveller permanent residential pitches; - Capacity for up to 10 transit Gypsy and Traveller caravans; and - 29 Plots for Travelling Showpeople families.
RENEWABLES See policy requirement for Amber Valley (above) Policy CS9 - Addressing climate Change states The
use of renewable and low carbon energy sources are promoted, along with decentralised energy networks. Stand alone renewable energy generation will be supported within the District. No renewable energy targets are provided.
EMPLOYMENT LAND
18 Harborough District Council
Core Strategy adopted Nov 2011
Harborough Local Plan (2001) Saved policies
See policy requirement for Amber Valley (above) Policy CS7 Enabling Employment and Business Development provides detail on protecting employment sites, designating key employment areas, rural employment and strategic distribution sites. No direct link with the number of jobs this will

Appendix C - SEA of Revocation of East Midlands Regional Strategy
October 2012 17
Planning Authority
Current status1
Other relevant policies2
East Midlands Plan Provision/Targets 3 Local authority adopted Plan Provision/Targets
provide is available HOUSING PROVISION Policy 13a Annual apportionment from 2006 = 300 Total Housing Provision 2006-2026 = 6,000
Policy H1 sets out the general principles for housing locations and managing housing need, whilst other policies identify specific locations. The Interim policy statement refines the interpretation of policy H1 in the light of the regional strategy allocations. No annual breakdown of housing targets.
GYPSY & TRAVELLER PITCHES Minimal additional pitch requirements 2007-2012 taking account of the need arising from future growth beyond 2012 Additional requirement = 0
Policy H17 sets criteria for assessing applications, but no target provision set
RENEWABLES See policy requirement for Amber Valley (above) Policy CF10: Renewable Energy
Planning Permission will be granted for renewable energy development, provided that the benefits of the renewable development outweigh any adverse impacts. No specific renewable energy targets.
EMPLOYMENT
19 High Peak Borough Council
High Peak Local Plan (2005) Saved policies
High Peak Interim Housing Policy Statement (2009)
See policy requirement for Amber Valley (above) Sites allocated for employment land but no direct link with the number of jobs this will provide is available
HOUSING PROVISION Policy 13a Annual apportionment from 2006 = 450 Total Housing Provision 2006-2026 = 9,000
Overall Housing Provision by between 2006 -2028 is 7700, split into 5 areas and figures given for each area. No annual breakdown of housing targets.
GYPSY & TRAVELLER PITCHES
20 Hinckley and Bosworth Borough Council
Core Strategy adopted Dec 2009
Hinckley & Bosworth Local Plan (2001) Saved Policies, Hinckley Town Centre Area Action Plan Minimal additional pitch requirements 2007-2012 Policy 18 - The council will allocate land for 42

Appendix C - SEA of Revocation of East Midlands Regional Strategy
October 2012 18
Planning Authority
Current status1
Other relevant policies2
East Midlands Plan Provision/Targets 3 Local authority adopted Plan Provision/Targets
taking account of the need arising from future growth beyond 2012 Additional requirement = 26 (plus 5 transit pitches and 24 plots for show people
residential pitches (26 up to 2012, 16 from 2012 - 2017), capacity for up to 10 transit caravans that equates to 5 transit pitches (to 2012), and up to 3showpeople family pitches (2 up to 2012, 1 from 2012 - 2017). Beyond 2017 to the end of the plan period there is an assumed on-going increase of 3% compound growth per annum for household formation for gypsies and travellers. For travelling showpeople a growth rate of 1.5% is assumed for the period 2017 - 2026. A Gypsy & Traveller Accommodation Needs Assessment will be undertaken to confirm the need beyond 2017. Of these new pitches 6 should be socially rented, to be provided on one site and managed by an RSL.
RENEWABLES See policy requirement for Amber Valley (above) General policies in support but no specific
renewable energy target. However, in terms of monitoring progress against delivering the policy, the local authority will seek to increase the amount of renewable energy generation by installed capacity and type 4% per annum CO2 reduction against base line from Local Authority operations by 2010/11
EMPLOYMENT
(2011)
See policy requirement for Amber Valley (above) No direct link with the number of jobs this will provide is available: Spatial Objective 1: Strong and Diverse Economy To strengthen and diversify the economy by providing sufficient, sustainably located, good quality land and premises. District split into 4 areas - focus for new employment will be Hinckley. Range

Appendix C - SEA of Revocation of East Midlands Regional Strategy
October 2012 19
Planning Authority
Current status1
Other relevant policies2
East Midlands Plan Provision/Targets 3 Local authority adopted Plan Provision/Targets
of employment opportunities is given for each area, occasionally reference made to allocation of certain hectares of land but no overall figures for the district. Monitoring report gives specific employment sites to be developed in the 4 areas.
HOUSING PROVISION Annual apportionment from 2006 = 675 Total Housing Provision 2006-2026 = 13,500
Policy 7 requires Development Plan Documents will make provision for 13,410 dwellings for the period 2001-2021. No annual breakdown of housing targets.
GYPSY & TRAVELLER PITCHES Minimal additional pitch requirements 2007-2012 taking account of the need arising from future growth beyond 2012 Additional requirement = 2 (plus 3 transit pitches)
Policy 17: Gypsies and Travellers. Travellers –Where a need is identified for additional accommodation for gypsies, travellers or travelling show people, planning permission may be granted, or site allocations proposed, when specified criteria are met. No specific target.
RENEWABLES
21 Kettering Borough Council
Core Strategy adopted Jun 2008
Kettering Local Plan (1995) Saved policies, Kettering Town Centre Area Action Plan (2011)
See policy requirement for Amber Valley (above) Policy 14: Energy Efficiency and Sustainable Construction requires development should meet the highest viable standards of resource and energy efficiency and reduction in carbon emissions. For developments of over 200 dwellings it includes a target of at least 30% of the demand for energy will be met on site (the actual figure to depend upon technical and economic viability), and renewably and/or from a decentralised renewable or low-

Appendix C - SEA of Revocation of East Midlands Regional Strategy
October 2012 20
Planning Authority
Current status1
Other relevant policies2
East Midlands Plan Provision/Targets 3 Local authority adopted Plan Provision/Targets
carbon energy supply.
EMPLOYMENT See policy requirement for Amber Valley (above) Policy 11: Distribution of Jobs - The quantity and
quality of existing employment sites and allocations will be reviewed against the job creation target of 16,200
HOUSING PROVISION
Policy 13a Annual apportionment from 2006 = 1,280 Total Housing Provision 2006-2026 =25,600
Core Strategy Policy 6 indicates that, to meet the RSS targets, housing development should be directed to locations in Core Strategy policy 1 and to the site allocations DPD. No annual breakdown of housing targets.
GYPSY & TRAVELLER PITCHES
22 Leicester City Council
Core Strategy adopted Nov 2010
Leicester Local Plan (2006) Saved policies
Minimal additional pitch requirements 2007-2012 taking account of the need arising from future growth beyond 2012 Additional requirement = 24 (plus 10 transit pitches and 3 plots for showpeople)
CS POLICY 9. GYPSY AND TRAVELLER AND SHOWPEOPLE ACCOMMODATION Sites for transit and residential pitches will be identified in the Site Allocations and Development Management Policies DPD2 to meet need as set out in the following table: Date Residential Transit Travelling Showpeople 2007-2012 24 0 3 2016 27 11 2021 31 13

Appendix C - SEA of Revocation of East Midlands Regional Strategy
October 2012 21
Planning Authority
Current status1
Other relevant policies2
East Midlands Plan Provision/Targets 3 Local authority adopted Plan Provision/Targets
RENEWABLES See policy requirement for Amber Valley (above) General policy support but no specific renewable
energy targets.
EMPLOYMENT See policy requirement for Amber Valley (above) No specific target provision in the Core Strategy,
although policy CS10 identifies sites and general criteria to be applied. No direct link with the number of jobs this will provide is available.
HOUSING PROVISION Policy 13a Annual apportionment from 2006 = 990 Total Housing Provision 2006-2026 = 19,800
No extant housing target but saved policy 56A identifies sites. No annual breakdown of housing targets.
GYPSY & TRAVELLER PITCHES Minimal additional pitch requirements 2007-2012 taking account of the need arising from future growth beyond 2012 Additional requirement = 8
Policy 61B sets criteria but sets not explicit target or makes specific provision for new sites Local Plan beyond those already provided.
RENEWABLES See policy requirement for Amber Valley (above) Policy 71: Renewable Energy provides support for
renewable energy but no specific renewable energy targets set.
EMPLOYMENT
23 Lincoln City Council
Lincoln City Local Plan (1998) Saved policies.
See policy requirement for Amber Valley (above) Policy 11: Distribution of Jobs - The quantity and quality of existing employment sites and allocations will be reviewed against the job creation target of 5,220.
Policies 66 and 67 identify land to meet anticipated land requirement for new jobs of 46-66Ha between 1995 and 2011. No direct link with the number of jobs this will provide is available.
HOUSING PROVISION 24 Mansfield District
Mansfield Local Plan
Policy 13a

Appendix C - SEA of Revocation of East Midlands Regional Strategy
October 2012 22
Planning Authority
Current status1
Other relevant policies2
East Midlands Plan Provision/Targets 3 Local authority adopted Plan Provision/Targets
Annual apportionment from 2006 = 530 Total Housing Provision 2006-2026 = 10,600
No specific target in Local Plan and no annual breakdown of housing targets.
GYPSY & TRAVELLER PITCHES Minimal additional pitch requirements 2007-2012 taking account of the need arising from future growth beyond 2012 Additional requirement = 5
No specific provision or specific target in Local Plan. Local Plan
RENEWABLES See policy requirement for Amber Valley (above) Policy U1: Permission will be granted for
developments utilising renewable energy provided they meet criteria. No specific renewable energy targets.
EMPLOYMENT
Council (1998) Saved policies.
See policy requirement for Amber Valley (above) No saved policy setting out specific employment land targets in the Local Plan. No direct link with the number of jobs this will provide is available.
HOUSING PROVISION Policy 13a Annual apportionment from 2006 = 170 Total Housing Provision 2006-2026 = 3,400
No extant policy target. No annual breakdown of housing targets.
GYPSY & TRAVELLER PITCHES Minimal additional pitch requirements 2007-2012 taking account of the need arising from future growth beyond 2012 Additional requirement = 6 (plus 5 transit pitches)
No specific target or provision in the Local Plan. Permission will be granted subject to criteria being met.
RENEWABLES See policy requirement for Amber Valley (above) No renewable energy policy or target.
25 Melton Borough Council
Melton Local Plan (1999) Saved policies.
Core Strategy published Mar 2012
EMPLOYMENT
Appendix C - SEA of Revocation of East Midlands Regional Strategy
October 2012 23
Planning Authority
Current status1
Other relevant policies2
East Midlands Plan Provision/Targets 3 Local authority adopted Plan Provision/Targets
See policy requirement for Amber Valley (above) No employment land target in the Local Plan. No direct link with the number of jobs this will provide is available.
HOUSING PROVISION Policy 13a Annual apportionment from 2006 = 740 Total Housing Provision 2006-2026 = 14,800
Authority divided into 5 areas and each area has a policy that sets out housing numbers. Seeks to deliver the RSS targets for the period 2006-2026
GYPSY & TRAVELLER PITCHES Minimal additional pitch requirements 2007-2012 taking account of the need arising from future growth beyond 2012 Additional requirement = 84
Core Policy 4 - Gypsies & Travellers and Travelling Showpeople - The Council will identify and, where necessary, allocate 84 pitches to meet identified need through the Allocations & Development Management DPD, will keep under review the levels of need beyond 2012 as required in the Regional Plan.
RENEWABLES See policy requirement for Amber Valley (above) Core Policy 10 Climate Change Encourage the
provision of renewable and low-carbon energy generation within new development. No specific figures for renewable energy.
EMPLOYMENT
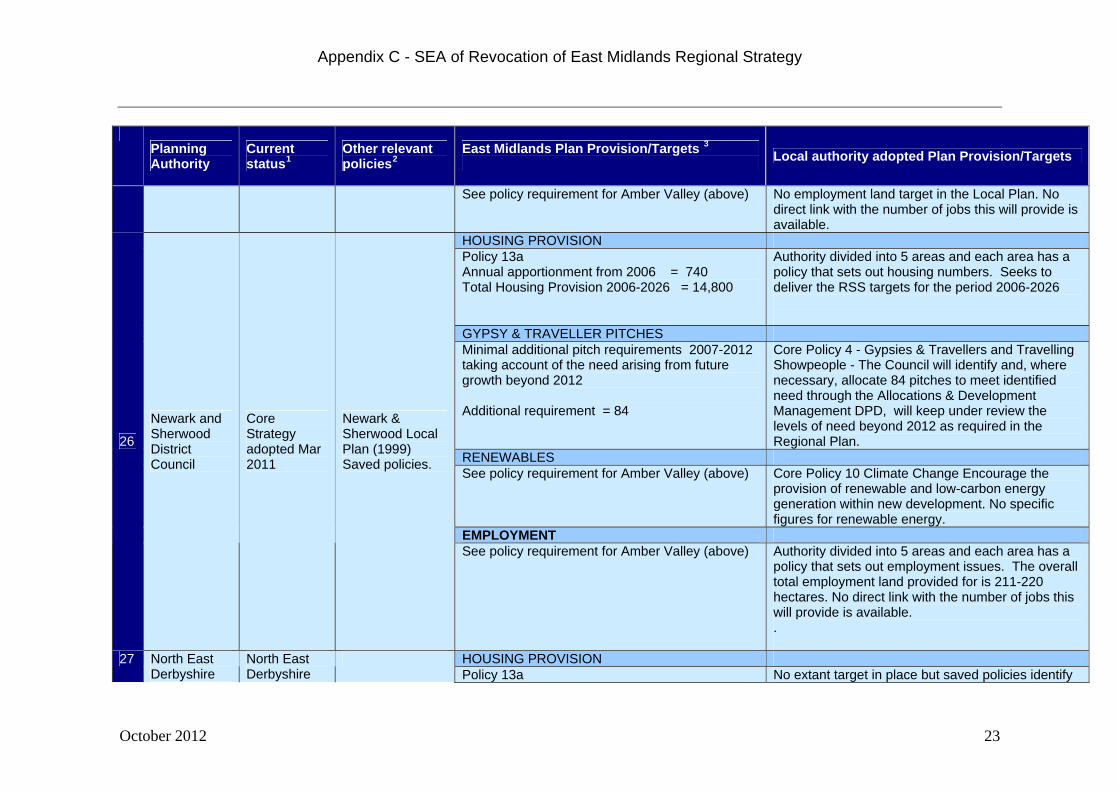
26
Newark and Sherwood District Council
Core Strategy adopted Mar 2011
Newark & Sherwood Local Plan (1999) Saved policies.
See policy requirement for Amber Valley (above) Authority divided into 5 areas and each area has a policy that sets out employment issues. The overall total employment land provided for is 211-220 hectares. No direct link with the number of jobs this will provide is available. .
HOUSING PROVISION 27 North East Derbyshire
North East Derbyshire
Policy 13a No extant target in place but saved policies identify

Appendix C - SEA of Revocation of East Midlands Regional Strategy
October 2012 24
Planning Authority
Current status1
Other relevant policies2
East Midlands Plan Provision/Targets 3 Local authority adopted Plan Provision/Targets
Annual apportionment from 2006 = 380 Total Housing Provision 2006-2026 = 7,600
sites. No annual breakdown of targets.
GYPSY & TRAVELLER PITCHES Minimal additional pitch requirements 2007-2012 taking account of the need arising from future growth beyond 2012 Additional requirement = 19
Policy H11: Sites for Gypsies and Travellers – Permission will be granted where there is identified need and criteria are met. No targets or specific provision in the Local Plan.
RENEWABLES See policy requirement for Amber Valley (above) Saved Policy CSU7: Permission for renewable
energy installations will be allowed subject to criteria being met. No specific renewable energy target.
EMPLOYMENT
District Council
Local Plan (Nov 2005) Saved policies.
See policy requirement for Amber Valley (above) Saved Policy E1 requires provision for 125 Hectares of land for general industrial, business use & distribution development in 1991 – 2011 period at annual completion rate of 6.25 hectares. No direct link with the number of jobs this will provide is available.
HOUSING PROVISION Policy 13a Annual apportionment from 2006 = 560 Total Housing Provision 2006-2026 = 11,200
Policy H1 Local Plan provides for the development of 8000 dwellings in the period 2001-2021, distributed in the following way:- Lincoln Policy Area – 5300 dwellings Sleaford – 1700 dwellings Rest of District – 1000 dwellings No annual breakdown of targets
GYPSY & TRAVELLER PITCHES
28 North Kesteven District Council
North Kesteven Local Plan (Sept 2007) Saved policies.
Minimal additional pitch requirements 2007-2012 taking account of the need arising from future growth beyond 2012
Policy H9 – Gypsy Sites. No specific target. Permission will be granted subject to criteria being met.

Appendix C - SEA of Revocation of East Midlands Regional Strategy
October 2012 25
Planning Authority
Current status1
Other relevant policies2
East Midlands Plan Provision/Targets 3 Local authority adopted Plan Provision/Targets
Additional requirement = 7 RENEWABLES See policy requirement for Amber Valley (above) Policy C17: Renewable Energy – Permission will be
allowed subject to criteria being met. No renewable energy targets.
EMPLOYMENT See policy requirement for Amber Valley (above) A total of 144.68 ha (Sites Residual Capacity Area)
has been designated specifically for employment development in the Local Plan for the period 2001-2021. . No direct link with the number of jobs this will provide is available:
HOUSING PROVISION Policy 13a Annual apportionment from 2006 = 510 Total Housing Provision 2006-2026 = 10,200
No saved policy in the Local Plan.
GYPSY & TRAVELLER PITCHES Minimal additional pitch requirements 2007-2012 taking account of the need arising from future growth beyond 2012 Additional requirement = 32 (Plus 10 transit pitches and 8 plots for showpeople)
General policy support for gypsy and traveller sites, but no specific provision or target in the Local Plan.
RENEWABLES See policy requirement for Amber Valley (above) General policy support but no specific renewable
energy targets. EMPLOYMENT
29
North West Leicestershire District Council
North West Leicestershire Local Plan (2003) Saved policies.
Core Strategy published May 2012
See policy requirement for Amber Valley (above) Policies in place identifying specific sites for development to help meet employment needs. No direct link with the number of jobs this will provide is available:

Appendix C - SEA of Revocation of East Midlands Regional Strategy
October 2012 26
Planning Authority
Current status1
Other relevant policies2
East Midlands Plan Provision/Targets 3 Local authority adopted Plan Provision/Targets
HOUSING PROVISION *Housing provision is given as a total figure for West Northamptonshire (Daventry, Northampton, South Northamptonshire) Total Housing Provision 2006-2026 = 62,125
Saved policies identify sites to meet anticipated housing need. No annual breakdown of targets.
GYPSY & TRAVELLER PITCHES Minimal additional pitch requirements 2007-2012 taking account of the need arising from future growth beyond 2012 Additional requirement = 26 (Plus 5 transit pitches)
No specific provision or target in Local Plan.
RENEWABLES See policy requirement for Amber Valley (above) No renewable targets EMPLOYMENT
30 Northampton Borough Council
Northampton Local Plan (1997) Saved policies.
Core Strategy published Feb 2011
See policy requirement for Amber Valley (above) Policy B1 sets a target of 357.5 hectares for the period 1993-2006. No direct link with the number of jobs this will provide is available.
HOUSING PROVISION Policy 13a Annual apportionment from 2006 = 1,000 Total Housing Provision 2006-2026 = 20,000
Policies identify sites and set criteria to meet housing capacity of 16,000 dwellings for the period 1991-2011.
GYPSY & TRAVELLER PITCHES Minimal additional pitch requirements 2007-2012 taking account of the need arising from future growth beyond 2012 Additional requirement = 10
– Gypsy and traveller sites will be allowed subject to criteria being met. No specific provision or target in the Local Plan.
31 Nottingham City Council
Nottingham Local Plan (2005) Saved policies.
Nottingham Core Strategy published Jun 2012
RENEWABLES

Appendix C - SEA of Revocation of East Midlands Regional Strategy
October 2012 27
Planning Authority
Current status1
Other relevant policies2
East Midlands Plan Provision/Targets 3 Local authority adopted Plan Provision/Targets
See policy requirement for Amber Valley (above) General policy support but no specific renewable energy targets set.
EMPLOYMENT See policy requirement for Amber Valley (above) Plan policies identify sites to meet employment
need of 160 Hectares of employment Land between 1991 and 2011. No direct link with the number of jobs this will provide is available.
HOUSING PROVISION Policy 13a Annual apportionment from 2006 = 90 Total Housing Provision 2006-2026 = 1,800
States that LA will locate land for the development of a minimum of 1,800 new dwellings (90 dwellings per annum) between 2006 and 2026 and details where development likely to happen. No annual breakdown of housing targets.
GYPSY & TRAVELLER PITCHES Minimal additional pitch requirements 2007-2012 taking account of the need arising from future growth beyond 2012 Additional requirement = 1
No reference in document – monitoring report indicates allocation of at least 1 residential site.
RENEWABLES See policy requirement for Amber Valley (above) Policies to encourage renewable energy but no
renewable energy target set.
EMPLOYMENT
32
Oadby and Wigston Borough Council
Core Strategy adopted Sept 2010
Oadby & Wigston Local Plan (1999) Saved policies.
See policy requirement for Amber Valley (above) General policy support and identified sites but no specific target set. No direct link with the number of jobs this will provide is available.
33 Peak Core Peak District HOUSING PROVISION

Appendix C - SEA of Revocation of East Midlands Regional Strategy
October 2012 28
Planning Authority
Current status1
Other relevant policies2
East Midlands Plan Provision/Targets 3 Local authority adopted Plan Provision/Targets
Policy 13a Annual apportionment from 2006 = 0 Total Housing Provision 2006-2026 = 0
Provision will not be made for housing solely to meet open market demand. Housing land will not be allocated in the development plan.
GYPSY & TRAVELLER PITCHES Minimal additional pitch requirements 2007-2012 taking account of the need arising from future growth beyond 2012 Additional requirement = 0
Gypsy, traveller or travelling showpeople’s caravan or mobile home sites may be permitted only where there are exceptional circumstances of proven need for a small site that can be met without compromising national park purposes. No specific target or provision in the Local Plan.
RENEWABLES See policy requirement for Amber Valley (above) Generally supportive policy but no renewable
energy targets. EMPLOYMENT
National Park Strategy adopted Oct 2011
National Park Local Plan (2001) Saved policies.
. See policy requirement for Amber Valley (above)
No specific target and no direct link with the number of jobs this will provide is available.
HOUSING PROVISION Policy 13a Annual apportionment from 2006 = 750 Total Housing Provision 2006-2026 = 15,000
Saved Local Plan Policy H1 identifies sites for housing. No extant target and no annual breakdown of targets.
GYPSY & TRAVELLER PITCHES Minimal additional pitch requirements 2007-2012 taking account of the need arising from future growth beyond 2012 Additional requirement = 9
No provision or allocation of Gypsy and traveller sites.
RENEWABLES
34 Rushcliffe Borough Council
Rushcliffe Local Plan (1996) Saved policies.
Non Statutory Replacement Local Plan (adopted Dec 2006) Core Strategy published Mar 2012
See policy requirement for Amber Valley (above) No saved plan policy on renewable energy.

Appendix C - SEA of Revocation of East Midlands Regional Strategy
October 2012 29
Planning Authority
Current status1
Other relevant policies2
East Midlands Plan Provision/Targets 3 Local authority adopted Plan Provision/Targets
EMPLOYMENT See policy requirement for Amber Valley (above) No direct link with the number of jobs this will
provide is available: Saved Local Plan Policy E1 identifies employment land to meet requirement of 75 Hectares up to 2001.
HOUSING PROVISION Policy 13a Annual apportionment from 2006 = 150 Total Housing Provision 2006-2026 = 3,000
Policy CS9 – Provision and distribution of new housing. Provision will be made for 3,000 new dwellings over the period 2006-2026.. The target is for about 25% of dwellings to be built on previously developed land.
GYPSY & TRAVELLER PITCHES Minimal additional pitch requirements 2007-2012 taking account of the need arising from future growth beyond 2012 Additional requirement = 2 (plus 5 transit pitches and 3 plots for showpeople)
Policy CS12 – Gypsies and travellers Sites for gypsies and travellers and show people will be identified through the Site Allocations and Policies DPD and/or the planning application process. The future need for sites for gypsies and travellers and show people beyond 2012 will be assessed in a review of the Leicestershire and Rutland Gypsy and Traveller Needs Assessment to be carried out in 2012.
RENEWABLES See policy requirement for Amber Valley (above) Policy support for renewable energy but no specific
renewable energy target. EMPLOYMENT
35 Rutland Council
Core Strategy adopted Jul 2011
Rutland Local Plan (2001) Saved policies.
No target set for individual local authorities. See policy requirement for Amber Valley (above)
Policy support for employment and economic development, including provision for industrial and office development. No direct link with the number of jobs this will provide is available.
Appendix C - SEA of Revocation of East Midlands Regional Strategy
October 2012 30
Planning Authority
Current status1
Other relevant policies2
East Midlands Plan Provision/Targets 3 Local authority adopted Plan Provision/Targets
HOUSING PROVISION Policy 13a Annual apportionment from 2006 = 600 Total Housing Provision 2006-2026 = 12,000
Saved plan policies identify sites for development but no extant target. No annual breakdown of targets.
GYPSY & TRAVELLER PITCHES Minimal additional pitch requirements 2007-2012 taking account of the need arising from future growth beyond 2012 Additional requirement = 19
Policy support but no specific targets in the Local Plan
RENEWABLES See policy requirement for Amber Valley (above) No reference to renewable targets EMPLOYMENT
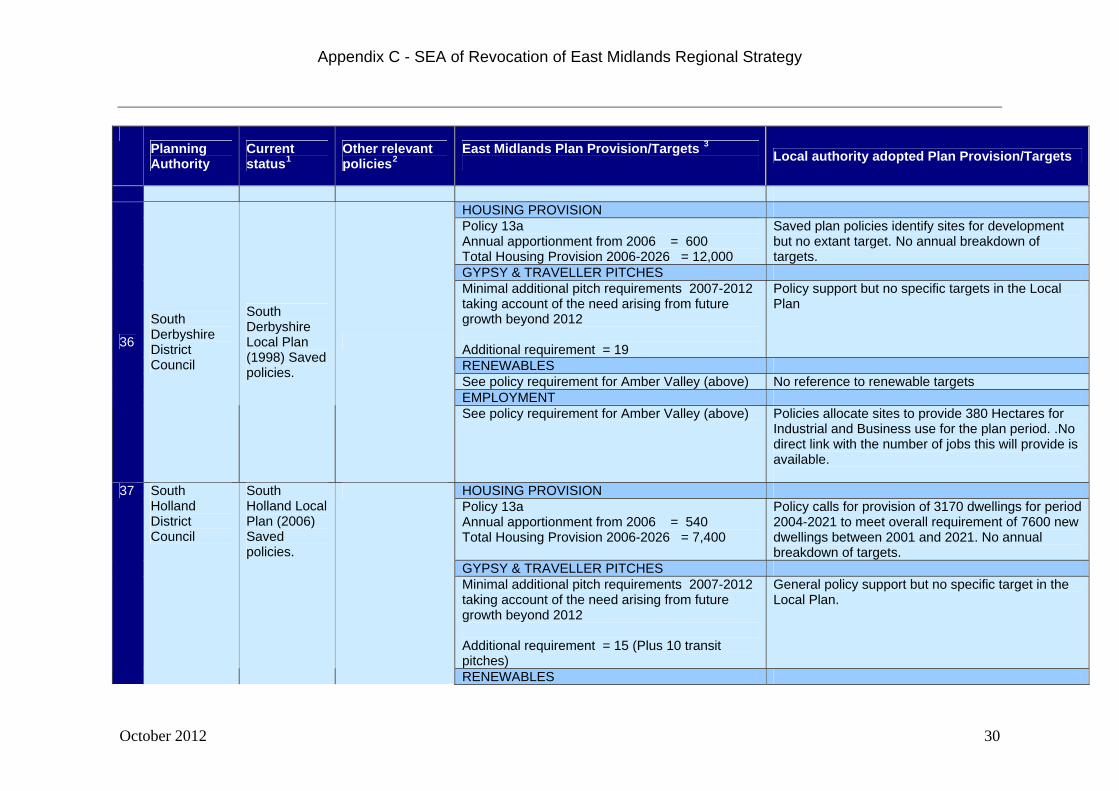
36
South Derbyshire District Council
South Derbyshire Local Plan (1998) Saved policies.
See policy requirement for Amber Valley (above) Policies allocate sites to provide 380 Hectares for Industrial and Business use for the plan period. .No direct link with the number of jobs this will provide is available.
HOUSING PROVISION Policy 13a Annual apportionment from 2006 = 540 Total Housing Provision 2006-2026 = 7,400
Policy calls for provision of 3170 dwellings for period 2004-2021 to meet overall requirement of 7600 new dwellings between 2001 and 2021. No annual breakdown of targets.
GYPSY & TRAVELLER PITCHES Minimal additional pitch requirements 2007-2012 taking account of the need arising from future growth beyond 2012 Additional requirement = 15 (Plus 10 transit pitches)
General policy support but no specific target in the Local Plan.
37 South Holland District Council
South Holland Local Plan (2006) Saved policies.
RENEWABLES

Appendix C - SEA of Revocation of East Midlands Regional Strategy
October 2012 31
Planning Authority
Current status1
Other relevant policies2
East Midlands Plan Provision/Targets 3 Local authority adopted Plan Provision/Targets
See policy requirement for Amber Valley (above) Policy support but no reference to renewable targets.
EMPLOYMENT See policy requirement for Amber Valley (above) Areas for employment use development identified
but no target for allocation of employment uses No direct link with the number of jobs this will provide is available. .
HOUSING PROVISION Policy 13a Annual apportionment from 2006 = 680 Total Housing Provision 2006-2026 = 13,600
H1 RESIDENTIAL DEVELOPMENT New housing development in South Kesteven during the period 2006 – 2026 should be planned and phased to deliver the minimum level of housing development required by the Regional Plan. (Table quotes RSS figure and gives breakdown of completions to 2008, residual to be found and annual build rate in remaining plan period) , To achieve the proper distribution of development across the District during the plan period development targets have been set for each town, the Local Service Centres and the rural areas
GYPSY & TRAVELLER PITCHES
38 South Kesteven District Council
Core Strategy adopted Jul 2010
South Kesteven Local Plan (1995) Saved policies.
Minimal additional pitch requirements 2007-2012 taking account of the need arising from future growth beyond 2012 Additional requirement = 21
H4 GYPSIES AND TRAVELLERS /H5 TRAVELLING SHOWPEOPLE Where evidence from the most up to date Gypsy and Traveller (H4) Accommodation Assessment identifies the need for additional accommodation and where proposals for sites for travelling showpeople (H5) is justified by a demonstration of need planning permission may be granted or sites allocated to meet this need when specific criteria is met.

Appendix C - SEA of Revocation of East Midlands Regional Strategy
October 2012 32
Planning Authority
Current status1
Other relevant policies2
East Midlands Plan Provision/Targets 3 Local authority adopted Plan Provision/Targets
Monitoring Report – minimum 11 permanent pitches by 2011
RENEWABLES See policy requirement for Amber Valley (above) EN3 RENEWABLE ENERGY GENERATION The
District Council will grant planning permission for proposals to generate energy from renewable sources. The proposal should make provision for: the mitigation of the real emissions/impacts arising from the installation of the renewable energy generation the removal of the facilities and reinstatement of the site, should the facilities cease to be operational.
EMPLOYMENT See policy requirement for Amber Valley (above) 200ha identified in CS . Specific sites will be
allocated for employment land use in the Site Specific Allocations and Policies DPD and Grantham Area Action Plan. No direct link with the number of jobs this will provide is available:
HOUSING PROVISION Annual apportionment from 2006 = 330 Total Housing Provision 2006-2026 = 6,600
Policies in place to identify sites. No overall target or annual breakdown of housing targets.
GYPSY & TRAVELLER PITCHES
39 South Northamptonshire Council
South Northamptonshire Local Plan (1997) Saved policies.
Core Strategy published Feb 2011
Minimal additional pitch requirements 2007-2012 taking account of the need arising from future growth beyond 2012 Additional requirement = 10 (plus 2 transit pitches)
No saved policy on Gypsies and Travellers

Appendix C - SEA of Revocation of East Midlands Regional Strategy
October 2012 33
Planning Authority
Current status1
Other relevant policies2
East Midlands Plan Provision/Targets 3 Local authority adopted Plan Provision/Targets
RENEWABLES See policy requirement for Amber Valley (above) No reference to renewable targets. EMPLOYMENT See policy requirement for Amber Valley (above) No targets in saved policies, but some sites
identified. No direct link with the number of jobs this will provide is available:
HOUSING PROVISION Annual apportionment from 2006 = 662 Total Housing Provision 2006-2026 = 13,250
Policy 7: Delivering Housing Development Plan Documents will make provision for the rates of housing development set out in Table 3. The supply of housing will be monitored and appropriate action taken to ensure that a deliverable five-year supply of sites for North Northamptonshire as a whole is maintained, including strategies to secure the development of suitable brownfield sites in accordance with policy 9. Local policies will ensure that the release of housing land is managed so that the supply is not exhausted early in the plan period. Average annual housing provisions 2001- 2006 = 304 2006- 2011 = 532 2011-2016 = 883 2016- 2021 = 841 Total = 12800
GYPSY & TRAVELLER PITCHES
40 Wellingborough Borough Council
Core Strategy adopted Jun 2008
Wellingborough Local Plan (1999) Saved policies, Wellingborough Town Centre Area Action Plan (2009)
Minimal additional pitch requirements 2007-2012 taking account of the need arising from future growth beyond 2012
Policy 17: Gypsies and Travellers. Travellers –Where a need is identified for additional accommodation for gypsies, travellers or travelling

Appendix C - SEA of Revocation of East Midlands Regional Strategy
October 2012 34
Planning Authority
Current status1
Other relevant policies2
East Midlands Plan Provision/Targets 3 Local authority adopted Plan Provision/Targets
Additional requirement = 14 (plus 2 transit pitches)
show people, planning permission may be granted, or site allocations proposed, when specified criteria are met. No specific target.
RENEWABLES See policy requirement for Amber Valley (above) Policy 14: Energy Efficiency and Sustainable
Construction requires development should meet the highest viable standards of resource and energy efficiency and reduction in carbon emissions. For developments of over 200 dwellings it includes a target of at least 30% of the demand for energy will be met on site (the actual figure to depend upon technical and economic viability), and renewably and/or from a decentralised renewable or low- carbon energy supply.
EMPLOYMENT See policy requirement for Amber Valley (above) Policy 11: Distribution of Jobs - The quantity and
quality of existing employment sites and allocations will be reviewed against the job creation target of 12,400
HOUSING PROVISION Policy 13a Annual apportionment from 2006 = 480 Total Housing Provision 2006-2026 = 9,600
Policies identify sites and criteria to meet 5,250 dwellings for the period 2001 – 2016.
GYPSY & TRAVELLER PITCHES
41 West Lindsey District Council
West Lindsey Local Plan (2006) Saved policies.
Minimal additional pitch requirements 2007-2012 taking account of the need arising from future growth beyond 2012
No specific target in the Local Plan. .

Appendix C - SEA of Revocation of East Midlands Regional Strategy
October 2012 35
Planning Authority
Current status1
Other relevant policies2
East Midlands Plan Provision/Targets 3 Local authority adopted Plan Provision/Targets
Additional requirement = 22 RENEWABLES See policy requirement for Amber Valley (above) No saved policy on renewable energy. EMPLOYMENT See policy requirement for Amber Valley (above) No direct link with the number of jobs this will
provide is available. No specific employment land target.
Appendix C - SEA of Revocation of East Midlands Regional Strategy
October 2012 36
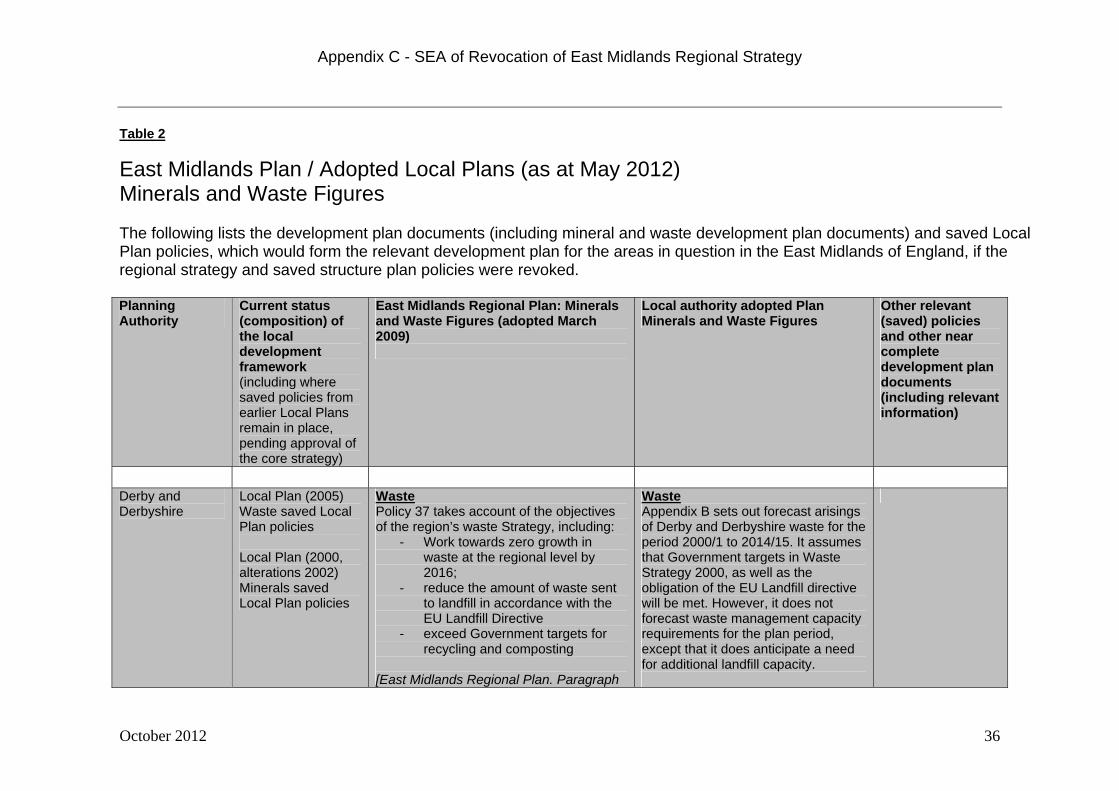
Table 2
East Midlands Plan / Adopted Local Plans (as at May 2012) Minerals and Waste Figures The following lists the development plan documents (including mineral and waste development plan documents) and saved Local Plan policies, which would form the relevant development plan for the areas in question in the East Midlands of England, if the regional strategy and saved structure plan policies were revoked. Planning Authority
Current status (composition) of the local development framework (including where saved policies from earlier Local Plans remain in place, pending approval of the core strategy)
East Midlands Regional Plan: Minerals and Waste Figures (adopted March 2009)
Local authority adopted Plan Minerals and Waste Figures
Other relevant (saved) policies and other near complete development plan documents (including relevant information)
Derby and Derbyshire
Local Plan (2005) Waste saved Local Plan policies Local Plan (2000, alterations 2002) Minerals saved Local Plan policies
Waste Policy 37 takes account of the objectives of the region’s waste Strategy, including:
- Work towards zero growth in waste at the regional level by 2016;
- reduce the amount of waste sent to landfill in accordance with the EU Landfill Directive
- exceed Government targets for recycling and composting
[East Midlands Regional Plan. Paragraph
Waste Appendix B sets out forecast arisings of Derby and Derbyshire waste for the period 2000/1 to 2014/15. It assumes that Government targets in Waste Strategy 2000, as well as the obligation of the EU Landfill directive will be met. However, it does not forecast waste management capacity requirements for the plan period, except that it does anticipate a need for additional landfill capacity.

Appendix C - SEA of Revocation of East Midlands Regional Strategy
October 2012 37
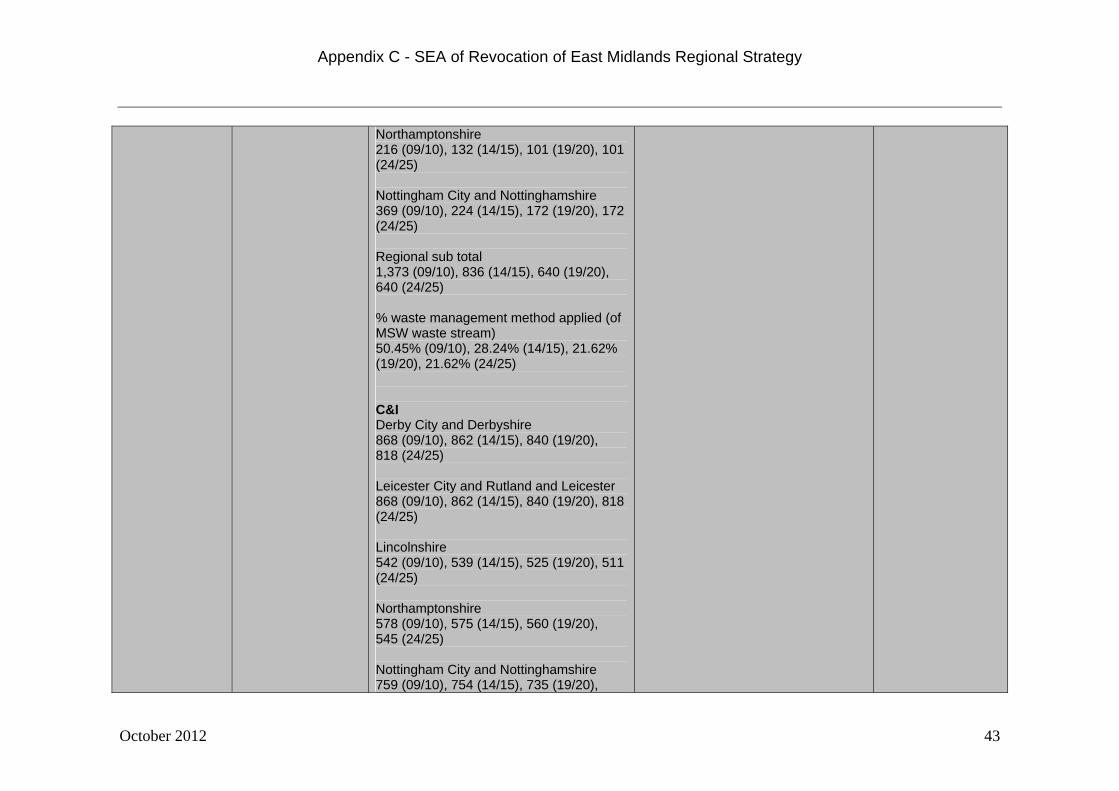
3.3.57] East Midlands produced around 20.6 million tonnes in 2003. Of this, 48% was Construction and Demolition Waste, 28% Industrial Waste, 12% Municipal Solid Waste, 11% Commercial Waste, and 1% Hazardous Waste. It is projected that by 2020 East Midlands will produce 22.2 million tonnes of controlled waste a year. [East Midlands Regional Plan. Paragraph 3.3.58 & 3.3.59. Pgs 81&82] All Waste Collection Authorities and Waste Disposal Authorities should achieve a minimum target for the recycling and composting of MSW of 30% by 2010 and 50% by 2015. [East Midlands Regional Plan. Policy 38 Pg 86] Policy 38 confirms that waste planning authorities should plan on the basis of waste management forecast and capacity for the period from 2009-2025. The apportionments, set out in Annex D to the Plan, are as follows Recycling/Composting MSW Derby City and Derbyshire 180 (09/10), 326 (14/15), 326 (19/20), 326
[Derby and Derbyshire Waste Local Plan. Pgs 95-99] Minerals Policy MP20 makes provision for 36 million tonnes of sand and gravel, in the period 1992-2006, in line with national and regional guidelines. Land should be allocated to provide for 12 million tonnes of sand and gravel production, in addition to permitted reserves. The 2001-2016 national and regional guidelines, as advised by the Aggregate Working Party, sets out an apportionment of 137 million tonnes over the 15 year period to 2006. However, given the size of permitted reserves, Policy MP23 makes no additional provision new site for crushed rock except in limited circumstances.

Appendix C - SEA of Revocation of East Midlands Regional Strategy
October 2012 38
(24/25) Leicester City and Rutland and Leicester 184 (09/10), 333 (14/15), 333 (19/20), 333 (24/25) Lincolnshire 118 (09/10), 213 (14/15), 213 (19/20), 213 (24/25) Northamptonshire 122 (09/10), 222 (14/15), 222 (19/20), 222 (24/25) Nottingham City and Nottinghamshire 213 (09/10), 386 (14/15), 386 (19/20), 386 (24/25) Regional sub total 816 (09/10), 1,480 (14/15), 1,480 (19/20), 1,480 (24/25) % waste management method applied (of MSW waste stream) 30% (09/10), 50% (14/15), 50% (19/20), 50% (24/25) C&I Derby City and Derbyshire 628 (09/10), 624 (14/15), 608 (19/20), 592 (24/25) Leicester City and Rutland and Leicester 628 (09/10), 624(14/15), 608 (19/20), 592 (24/25)

Appendix C - SEA of Revocation of East Midlands Regional Strategy
October 2012 39
Lincolnshire 393 (09/10), 390 (14/15), 380 (19/20), 370 (24/25) Northamptonshire 419 (09/10), 416 (14/15), 405 (19/20), 394 (24/25) Nottingham City and Nottinghamshire 550 (09/10), 546 (14/15), 532 (19/20), 518 (24/25) Regional sub total 2,617 (09/10), 2,601 (14/15), 2,534 (19/20), 2,466 (24/25) % waste management method applied (of C&I waste stream) 42% (09/10), 42% (14/15), 42% (19/20), 42% (24/25) C&D Derby City and Derbyshire 1,227 (09/10), 1,290 (14/15), 1,290 (19/20), 1,290 (24/25) Leicester City and Rutland and Leicester 1,227 (09/10), 1,290 (14/15), 1,290 (19/20), 1,290 (24/25) Lincolnshire 800 (09/10), 841 (14/15), 841 (19/20), 841 (24/25) Northamptonshire 800 (09/10), 841 (14/15), 841 (19/20), 841

Appendix C - SEA of Revocation of East Midlands Regional Strategy
October 2012 40
(24/25) Nottingham City and Nottinghamshire 1,280 (09/10), 1,346 (14/15), 1,346 (19/20), 1,346 (24/25) Regional sub total 5,335 (09/10), 5,607 (14/15), 5,607 (19/20), 5,607 (24/25) % waste management method applied (of C&D waste stream) 49% (09/10), 49% (14/15), 49% (19/20), 49% (24/25) Regional total recycling/composting (MSW, C&I and C&D) 8,769 (09/10), 9,688 (14/15), 9,621 (19/20), 9553 (20/25) Landfill Diversion (MSW) Derby City and Derbyshire 122 (09/10), 145 (14/15), 187 (19/20), 187 (24/25) Leicester City and Rutland and Leicester 131 (09/10), 152 (14/15), 195 (19/20), 195 (24/25) Lincolnshire 81 (09/10), 95 (14/15), 123 (19/20), 123 (24/25) Northamptonshire

Appendix C - SEA of Revocation of East Midlands Regional Strategy
October 2012 41
70 (09/10), 90 (14/15), 121 (19/20), 121 (24/25) Nottingham City and Nottinghamshire 128 (09/10), 162 (14/15), 214 (19/20), 214 (24/25) Regional sub total 532 (09/10), 644 (14/15), 840 (19/20), 840 (24/25) % waste management method applied (of MSW waste stream) 19.55% (09/10), 21.76% (14/15), 28.39% (19/20), 28.39% (24/25) Regional total landfill diversion (MSW) 532 (09/10), 644 (14/15), 840 (19/20), 840 (20/25) Re-Use (C&D) Derby City and Derbyshire 950 (09/10), 999 (14/15), 999 (19/20), 999 (24/25) Leicester City and Rutland and Leicester 950 (09/10), 999 (14/15), 999 (19/20), 999 (24/25) Lincolnshire 620 (09/10), 651 (14/15), 651 (19/20), 651 (24/25)

Appendix C - SEA of Revocation of East Midlands Regional Strategy
October 2012 42
Northamptonshire 620 (09/10), 651 (14/15), 651 (19/20), 651 (24/25) Nottingham City and Nottinghamshire 992 (09/10), 1,042 (14/15), 1,042 (19/20), 1,042 (24/25) Regional sub total 4,132 (09/10), 4,343 (14/15), 4,343 (19/20), 4,343 (24/25) % waste management method applied (of C&D waste stream) 38.25% (09/10), 38.25% (14/15), 38.25% (19/20), 38.25% (24/25) Regional total re-use (C&D) 4,132 (09/10), 4,343 (14/15), 4,343 (19/20), 4,343 (20/25) Disposal MSW Derby City and Derbyshire 297 (09/10), 181 (14/15), 138 (19/20), 138 (24/25) Leicester City and Rutland and Leicester 298 (09/10), 181 (14/15), 139 (19/20), 139 (24/25) Lincolnshire 193 (09/10), 118 (14/15), 90 (19/20), 90 (24/25)
Appendix C - SEA of Revocation of East Midlands Regional Strategy
October 2012 43
Northamptonshire 216 (09/10), 132 (14/15), 101 (19/20), 101 (24/25) Nottingham City and Nottinghamshire 369 (09/10), 224 (14/15), 172 (19/20), 172 (24/25) Regional sub total 1,373 (09/10), 836 (14/15), 640 (19/20), 640 (24/25) % waste management method applied (of MSW waste stream) 50.45% (09/10), 28.24% (14/15), 21.62% (19/20), 21.62% (24/25) C&I Derby City and Derbyshire 868 (09/10), 862 (14/15), 840 (19/20), 818 (24/25) Leicester City and Rutland and Leicester 868 (09/10), 862 (14/15), 840 (19/20), 818 (24/25) Lincolnshire 542 (09/10), 539 (14/15), 525 (19/20), 511 (24/25) Northamptonshire 578 (09/10), 575 (14/15), 560 (19/20), 545 (24/25) Nottingham City and Nottinghamshire 759 (09/10), 754 (14/15), 735 (19/20),

Appendix C - SEA of Revocation of East Midlands Regional Strategy
October 2012 44
716 (24/25) Regional sub total 3,615 (09/10), 3,591 (14/15), 3,499 (19/20), 3,408 (24/25) % waste management method applied (of C&I waste stream) 58% (09/10), 58% (14/15), 58% (19/20), 58% (24/25) C&D Derby City and Derbyshire 307 (09/10), 323 (14/15), 323 (19/20), 323 (24/25) Leicester City and Rutland and Leicester 307 (09/10), 323 (14/15), 323 (19/20), 323 (24/25) Lincolnshire 200 (09/10), 211 (14/15), 211 (19/20), 211 (24/25) Northamptonshire 200 (09/10), 211 (14/15), 211 (19/20), 211 (24/25) Nottingham City and Nottinghamshire 320 (09/10), 337 (14/15), 337 (19/20), 337 (24/25) Regional sub total 1,335 (09/10), 1,403 (14/15), 1,403 (19/20), 1,403 (24/25)

Appendix C - SEA of Revocation of East Midlands Regional Strategy
October 2012 45
% waste management method applied (of C&D waste stream) 12.36% (09/10), 12.36% (14/15), 12.36% (19/20), 12.36% (24/25) Regional total disposal (MSW, C&I and C&D) 6,323 (09/10), 5,831 (14/15), 5,542 (19/20), 5,451 (20/25) Total (all treatment routes) MSW Derby City and Derbyshire 598 (09/10), 651 (14/15), 651 (19/20), 651 (24/25) Leicester City and Rutland and Leicester 613 (09/10), 667 (14/15), 667 (19/20), 667 (24/25) Lincolnshire 392 (09/10), 426 (14/15), 426 (19/20), 426 (24/25) Northamptonshire 408 (09/10), 444 (14/15), 444 (19/20), 444 (24/25) Nottingham City and Nottinghamshire 710 (09/10), 772 (14/15), 772 (19/20), 772 (24/25)

Appendix C - SEA of Revocation of East Midlands Regional Strategy
October 2012 46
Regional sub total 2,721 (09/10), 2,960 (14/15), 2,960 (19/20), 2,960 (24/25) C&I Derby City and Derbyshire 1,496 (09/10), 1,486 (14/15), 1,448 (19/20), 1,410 (24/25) Leicester City and Rutland and Leicester 1,496 (09/10), 1,486 (14/15), 1,448 (19/20), 1,410 (24/25) Lincolnshire 935 (09/10), 929 (14/15), 905 (19/20), 881 (24/25) Northamptonshire 997 (09/10), 991 (14/15), 965 (19/20), 939 (24/25) Nottingham City and Nottinghamshire 1,309 (09/10), 1,300 (14/15), 1,267 (19/20), 1,234 (24/25) Regional sub total 6,232 (09/10), 6,192 (14/15), 6,032 (19/20), 5,874 (24/25) C&D Derby City and Derbyshire 2,485 (09/10), 2,611 (14/15), 2,611 (19/20), 2,611 (24/25) Leicester City and Rutland and Leicester 2,485 (09/10), 2,611 (14/15), 2,611

Appendix C - SEA of Revocation of East Midlands Regional Strategy
October 2012 47
(19/20), 2,611 (24/25) Lincolnshire 1,620 (09/10), 1,703 (14/15), 1,703 (19/20), 1,703 (24/25) Northamptonshire 1,620 (09/10), 1,703 (14/15), 1,703 (19/20), 1,703 (24/25) Nottingham City and Nottinghamshire 2,593 (09/10), 2,725 (14/15), 2,725 (19/20), 2,725 (24/25) Regional sub total 10,802 (09/10), 11,353 (14/15), 11,353 (19/20), 11,353 (24/25) Regional overall total (MSW, C&I and C&D) 21,757 (09/10), 22,409 (14/15), 22,156 (19/20), 20,187 (20/25) [East Midlands Regional Plan. Paragraph 3.3.60 & Appendix 4. Pgs 82&172-178] Estimated MSW capacity shortfall by waste planning authority (000s tonnes) Derbyshire, Derby City – 241 (Recycling/composting), 187 (landfill diversion), 0 (reuse), -295 (disposal), 133 (total)

Appendix C - SEA of Revocation of East Midlands Regional Strategy
October 2012 48
Leicestershire, Leicester, Rutland - 235 (Recycling/composting), 85 (landfill diversion), 0 (reuse), -259 (disposal), 61 (total) Lincolnshire - 31 (Recycling/composting), 123 (landfill diversion), 0 (reuse), -182 (disposal), -28 (total) Northamptonshire - 120 (Recycling/composting), 121 (landfill diversion), 0 (reuse), -173 (disposal), 68 (total) Nottinghamshire, Nottingham City - 258 (Recycling/composting), 64 (landfill diversion), 0 (reuse), -162 (disposal), 160 (total) Total - 885 (Recycling/composting), 580 (landfill diversion), 0 (reuse), -1070 (disposal), 395 (total) Waste planning authorities should seek to protect existing recycling and recovery sites, increasing capacity where possible. [East Midlands Regional Plan. Figure 5 & Paragraph 3.3.65. Pg 84] Minerals The East Midlands is a major producer and exporter of aggregates, with important implications for employment, landscapes and transport infrastructure. About 21% of the sand and gravel and 44% of the
Appendix C - SEA of Revocation of East Midlands Regional Strategy
October 2012 49
crushed rock production is exported from the Region. Regional Aggregates Apportionment figures 2001-2016 (million tonnes) Sand and Gravel Derbyshire – 26.5 Peak District NPA – 0 Leicestershire – 20.0 Lincolnshire – 49.0 Northamptonshire – 15.5 Nottinghamshire – 54.0 Total – 165.0 Crushed Rock Derbyshire – 155.9 Peak District NPA – 66.9 Leicestershire – 262.5 Lincolnshire – 27.2 Northamptonshire – 6.3 Nottinghamshire – 4.2

Appendix C - SEA of Revocation of East Midlands Regional Strategy
October 2012 50
Total – 523.0 Total Derbyshire – 182.4 Peak District NPA – 66.9 Leicestershire – 282.5 Lincolnshire – 76.2 Northamptonshire – 21.8 Nottinghamshire – 58.2 Total – 688.0 [East Midlands Regional Plan. Paragraph 3.3.50 and Figure 1. Pgs 78&79]
Leicestershire and Leicester
Waste Core Strategy (adopted Oct 2009) Minerals Core Strategy (adopted Oct 2009)
Waste Municipal waste targets for Leicester City will be consistent with waste Strategy 2007 targets. However, to achieve conformity with Leicestershire’s Municipal Waste Strategy, which sets targets above the national targets, the following higher targets will be used for municipal waste in Leicestershire County only:

Appendix C - SEA of Revocation of East Midlands Regional Strategy
October 2012 51
to recycle or compost at least 40% of municipal waste by 2007 (achieved); to recycle or compost at least 50% of municipal waste by 2010; to recycle or compost at least 58% of municipal waste by 2017. To follow the dates published in the RSS this equates to 50% by 2009/10, 53% by 2014/15 and 58% by 2019/20. [Waste Core Strategy. Paragraph 2.17 & 2.18. Pg 7] Policy WCS1 states that the strategy for waste management capacity is to provide sufficient waste management capacity to manage the equivalent of the waste arising in the framework area and as a minimum achieve the targets for recycling, composting, reuse and landfill diversion set in the RSS and the Leicestershire Municipal Waste Strategy. Indicative waste management capacity requirements for Leicestershire, Leicester and Rutland, which underpins this policy, are: (thousand tonnes) 2009/2010

Appendix C - SEA of Revocation of East Midlands Regional Strategy
October 2012 52
MSW (22% of regional total) Recycling/Composting – 184 Landfill diversion - 131 Re-use - 0 Disposal - 298 Total – 613 C&I (24% of regional total) Recycling/Composting – 628 Landfill diversion - 0 Re-use - 0 Disposal - 868 Total – 1,505 C&D (23% of regional total) Recycling/Composting – 1,227 Landfill diversion - 0 Re-use - 950 Disposal - 307 Total – 2,485 2014/2015 MSW (22% of regional total) Recycling/Composting – 333 Landfill diversion - 152 Re-use - 0 Disposal - 181 Total – 667 C&I (24% of regional total)

Appendix C - SEA of Revocation of East Midlands Regional Strategy
October 2012 53
Recycling/Composting – 624 Landfill diversion - 0 Re-use - 0 Disposal - 862 Total – 1,495 C&D (23% of regional total) Recycling/Composting – 1,290 Landfill diversion - 0 Re-use - 999 Disposal - 323 Total – 2,611 2019/2020 MSW (22% of regional total) Recycling/Composting – 333 Landfill diversion - 195 Re-use - 0 Disposal - 139 Total – 667 C&I (24% of regional total) Recycling/Composting – 608 Landfill diversion - 0 Re-use - 0 Disposal - 840 Total – 1,457 C&D (23% of regional total) Recycling/Composting – 1,290 Landfill diversion - 0 Re-use - 999
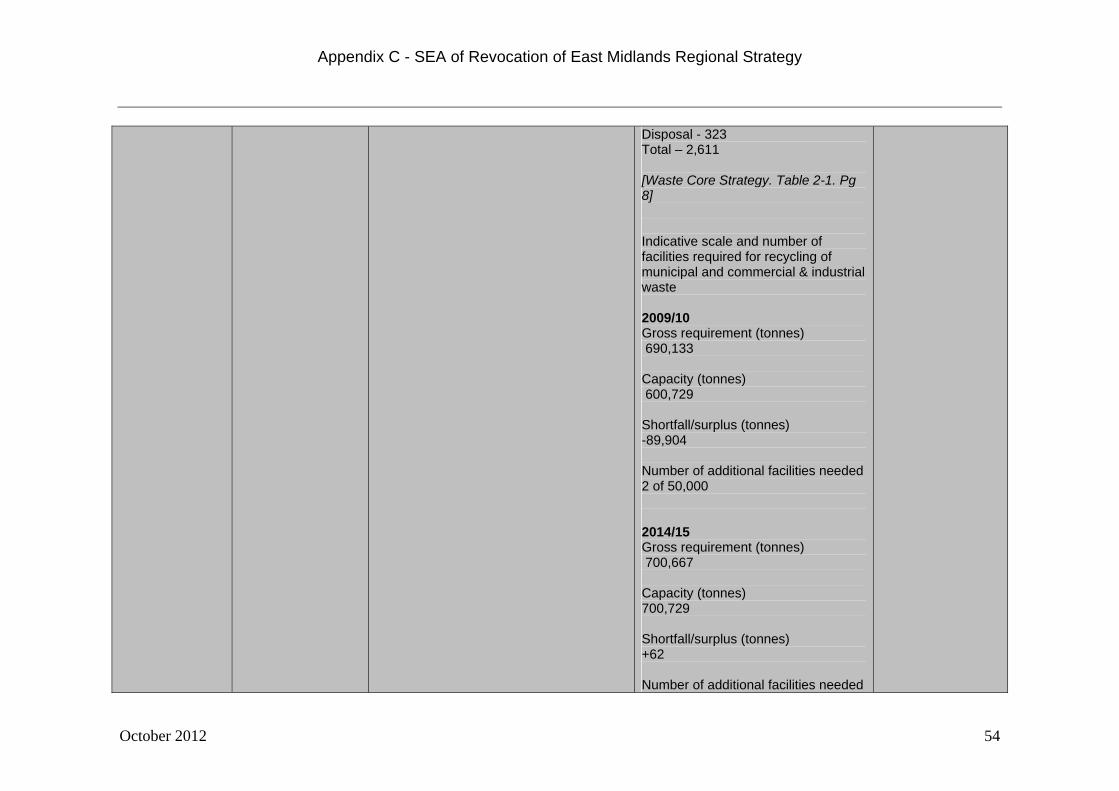
Appendix C - SEA of Revocation of East Midlands Regional Strategy
October 2012 54
Disposal - 323 Total – 2,611 [Waste Core Strategy. Table 2-1. Pg 8] Indicative scale and number of facilities required for recycling of municipal and commercial & industrial waste 2009/10 Gross requirement (tonnes) 690,133 Capacity (tonnes) 600,729 Shortfall/surplus (tonnes) -89,904 Number of additional facilities needed 2 of 50,000 2014/15 Gross requirement (tonnes) 700,667 Capacity (tonnes) 700,729 Shortfall/surplus (tonnes) +62 Number of additional facilities needed

Appendix C - SEA of Revocation of East Midlands Regional Strategy
October 2012 55
0 2019/20 Gross requirement (tonnes) 727,836 Capacity (tonnes) 700,729 Shortfall/surplus (tonnes) -107 Number of additional facilities needed 0 [Waste Core Strategy. Table 4.1. Pg 19] Indicative scale and number of facilities required for the composting of municipal waste 2009/10 Gross requirement (tonnes) 119,042 Capacity (tonnes) 97,427 Shortfall/surplus (tonnes) -21,615 Number of additional facilities needed 1 of 25,000

Appendix C - SEA of Revocation of East Midlands Regional Strategy
October 2012 56
2014/15 Gross requirement (tonnes) 137,285 Capacity (tonnes) 122,427 Shortfall/surplus (tonnes) -14,858 Number of additional facilities needed 1 of 25,000 2019/20 Gross requirement (tonnes) 118,043 Capacity (tonnes) 147,427 Shortfall/surplus (tonnes) +29,384 Number of additional facilities needed 0 [Waste Core Strategy. Table 4.2. Pg 19] Indicative scale and number of facilities required for the recovery of municipal waste 2009/10 Gross requirement (tonnes)

Appendix C - SEA of Revocation of East Midlands Regional Strategy
October 2012 57
299,153 Capacity (tonnes) 293,328 Shortfall/surplus (tonnes) -5,825 Number of additional facilities needed 0 2014/15 Gross requirement (tonnes) 461,234 Capacity (tonnes) 364,921 Shortfall/surplus (tonnes) -102,138 Number of additional facilities needed 2 of 50,000 2019/20 Gross requirement (tonnes) 502,104 Capacity (tonnes) 488,048 Shortfall/surplus (tonnes) -14,056 Number of additional facilities needed

Appendix C - SEA of Revocation of East Midlands Regional Strategy
October 2012 58
0 [Waste Core Strategy. Table 4.3. Pg 20] Indicative scale and number of facilities required for the landfilling of non-inert (municipal and C&I) waste 2009/10 Gross requirement (tonnes) 1,087,000 Capacity (tonnes) 700,000 Shortfall/surplus (tonnes) -387,000 Number of additional facilities needed 2 of 200,000 2014/15 Gross requirement (tonnes) 1,000,000 Capacity (tonnes) 860,000 Shortfall/surplus (tonnes) -140,000 Number of additional facilities needed 1 of 200,000

Appendix C - SEA of Revocation of East Midlands Regional Strategy
October 2012 59
2019/20 Gross requirement (tonnes) 938,000 Capacity (tonnes) 1,060,000 Shortfall/surplus (tonnes) +122,000 Number of additional facilities needed 0 [Waste Core Strategy. Table 4.4. Pg 21] Indicative scale and number of facilities required for the recovery of municipal waste 2009/10 Gross requirement (tonnes) 299,153 Capacity (tonnes) 293,328 Shortfall/surplus (tonnes) -5,825 Number of additional facilities needed 0
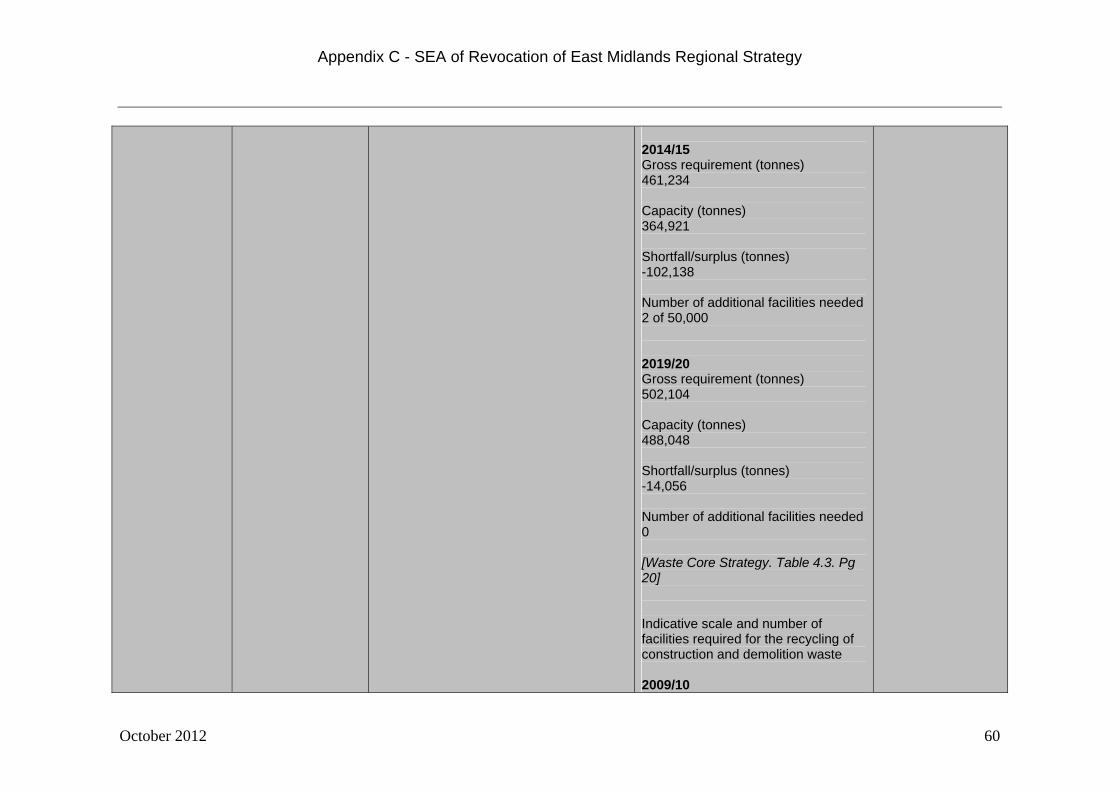
Appendix C - SEA of Revocation of East Midlands Regional Strategy
October 2012 60
2014/15 Gross requirement (tonnes) 461,234 Capacity (tonnes) 364,921 Shortfall/surplus (tonnes) -102,138 Number of additional facilities needed 2 of 50,000 2019/20 Gross requirement (tonnes) 502,104 Capacity (tonnes) 488,048 Shortfall/surplus (tonnes) -14,056 Number of additional facilities needed 0 [Waste Core Strategy. Table 4.3. Pg 20] Indicative scale and number of facilities required for the recycling of construction and demolition waste 2009/10

Appendix C - SEA of Revocation of East Midlands Regional Strategy
October 2012 61
Gross requirement (tonnes) 1,165,650 Capacity (tonnes) 592,800 Shortfall/surplus (tonnes) -572,850 Number of additional facilities needed 12 of 50,000 2014/15 Gross requirement (tonnes) 1,225,500 Capacity (tonnes) 592,800 Shortfall/surplus (tonnes) -572,850 Number of additional facilities needed 12 of 50,000 2019/20 Gross requirement (tonnes) 1,225,500 Capacity (tonnes) 1,242,800 Shortfall/surplus (tonnes) +17,300

Appendix C - SEA of Revocation of East Midlands Regional Strategy
October 2012 62
Number of additional facilities needed 0 [Waste Core Strategy. Table 4.5. Pg 21] Indicative scale and number of facilities required for the landfilling of inert (construction and demolition) waste 2009/10 Gross requirement (tonnes) 934,467 Capacity (tonnes) 558,989 Shortfall/surplus (tonnes) -375,478 Number of additional facilities needed 2 of 150,000 2014/15 Gross requirement (tonnes) 995,267 Capacity (tonnes) 655,000

Appendix C - SEA of Revocation of East Midlands Regional Strategy
October 2012 63
Shortfall/surplus (tonnes) -340,267 Number of additional facilities needed 2 of 150,000 2019/20 Gross requirement (tonnes) 995,267 Capacity (tonnes) 865,000 Shortfall/surplus (tonnes) -130,267 Number of additional facilities needed 1 of 150,000 [Waste Core Strategy. Table 4.6. Pg 22] Minerals Minerals Core Strategy Policy MCS2 states that The strategy for aggregate minerals is to: Make land available to meet the sub-regional apportionment of 26.25 million tonnes of sand and gravel over the 21 year period 2001-2021 and 337.75 million tonnes of crushed rock over the 21 year period 2001-2021

Appendix C - SEA of Revocation of East Midlands Regional Strategy
October 2012 64
Maintain landbanks for sand and gravel and crushed rock in line with national and regional policy, with the geographical area for considering landbank provision being the whole of the County area.
Rutland Core strategy
Development Plan Document (July 2011) Minerals Core Strategy and Development Control Policies Development Plan Document (Oct 2010)
Waste Policy CS25 indicates that waste development within the county will focus on the provision of preliminary and supporting facilities. Rutland is not considered an appropriate location for large scale advanced treatment facilities. The indicative waste management capacity requirements up to 2026 include: a) recycling capacity of 12,000 to
22,000 tonnes per annum (tpa), plus an additional 500 tpa for civic amenity facilities,
b) biological processing capacity of
6,000 to 12,000 tpa, c) inert recycling of 7,000 tpa, and d) advanced treatment of 16,000 to
19,000 tpa.
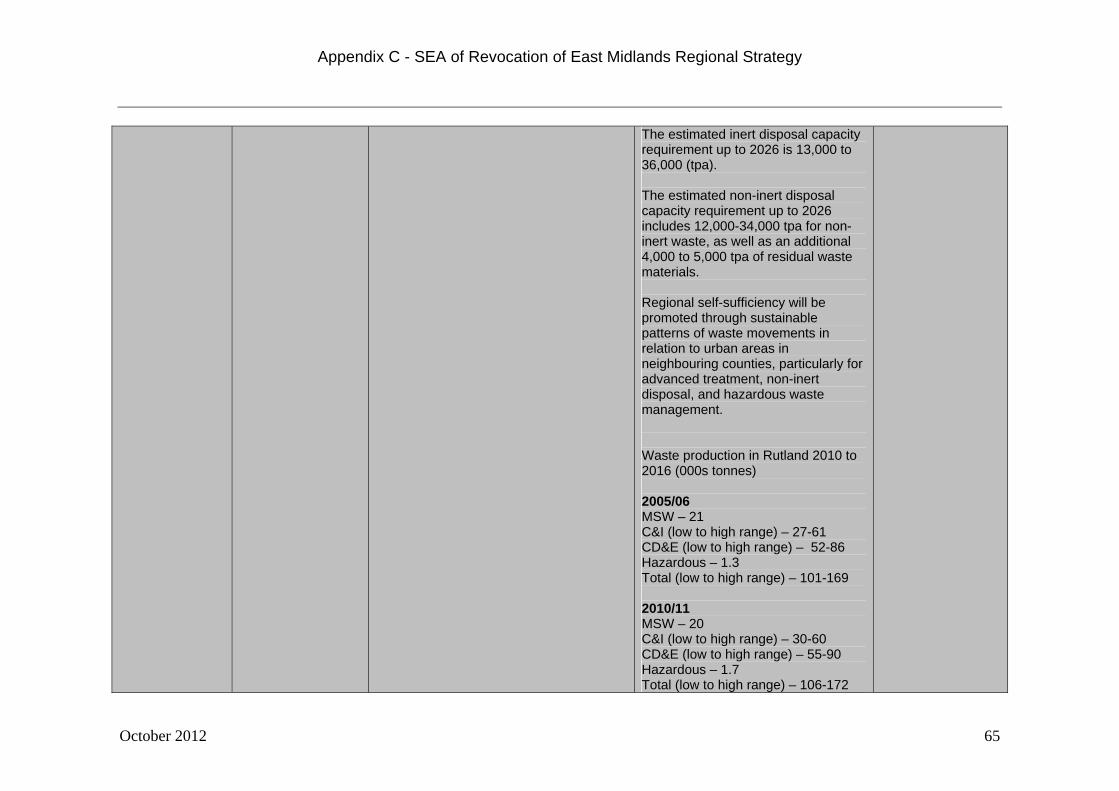
Appendix C - SEA of Revocation of East Midlands Regional Strategy
October 2012 65
The estimated inert disposal capacity requirement up to 2026 is 13,000 to 36,000 (tpa). The estimated non-inert disposal capacity requirement up to 2026 includes 12,000-34,000 tpa for non-inert waste, as well as an additional 4,000 to 5,000 tpa of residual waste materials. Regional self-sufficiency will be promoted through sustainable patterns of waste movements in relation to urban areas in neighbouring counties, particularly for advanced treatment, non-inert disposal, and hazardous waste management. Waste production in Rutland 2010 to 2016 (000s tonnes) 2005/06 MSW – 21 C&I (low to high range) – 27-61 CD&E (low to high range) – 52-86 Hazardous – 1.3 Total (low to high range) – 101-169 2010/11 MSW – 20 C&I (low to high range) – 30-60 CD&E (low to high range) – 55-90 Hazardous – 1.7 Total (low to high range) – 106-172

Appendix C - SEA of Revocation of East Midlands Regional Strategy
October 2012 66
2015/16 MSW – 21 C&I (low to high range) – 31-59 CD&E (low to high range) – 58-94 Hazardous – 1.7 Total (low to high range) – 112-176 2020/21 MSW – 21 C&I (low to high range) – 31-57 CD&E (low to high range) – 58-94 Hazardous – 1.7 Total (low to high range) – 112-174 2025/26 MSW – 21 C&I (low to high range) – 31-55 CD&E (low to high range) – 58-94 Hazardous – 1.7 Total (low to high range) – 112-172 [Core Strategy Development Plan Document. Table 3. Pg 81] Indicative waste management and disposal capacity requirements 2010 to 2026 – low to high range (000s tonnes) 2005/06 Processing of recyclables – 8-19 Biological processing – 6-13 Advanced treatment – 6-7 Inert recycling – 27-42

Appendix C - SEA of Revocation of East Midlands Regional Strategy
October 2012 67
Inert fill – 12-33 Disposal – 29-61 Residual waste material for disposal – 2-3 Total disposal - 31-63 2010/11 Processing of recyclables – 12-25 Biological processing – 9-17 Advanced treatment – 6-8 Inert recycling – 32-50 Inert fill – 12-35 Disposal – 20-42 Residual waste material for disposal – 2-3 Total disposal - 22-45 2015/16 Processing of recyclables – 13-25 Biological processing – 9-17 Advanced treatment – 16-19 Inert recycling – 34-52 Inert fill – 13-36 Disposal – 12-34 Residual waste material for disposal – 4-5 Total disposal - 16-39 2020/21 Processing of recyclables – 13-24 Biological processing – 9-16 Advanced treatment – 16-19 Inert recycling – 34-52 Inert fill – 13-36 Disposal – 12-34 Residual waste material for disposal – 4-5
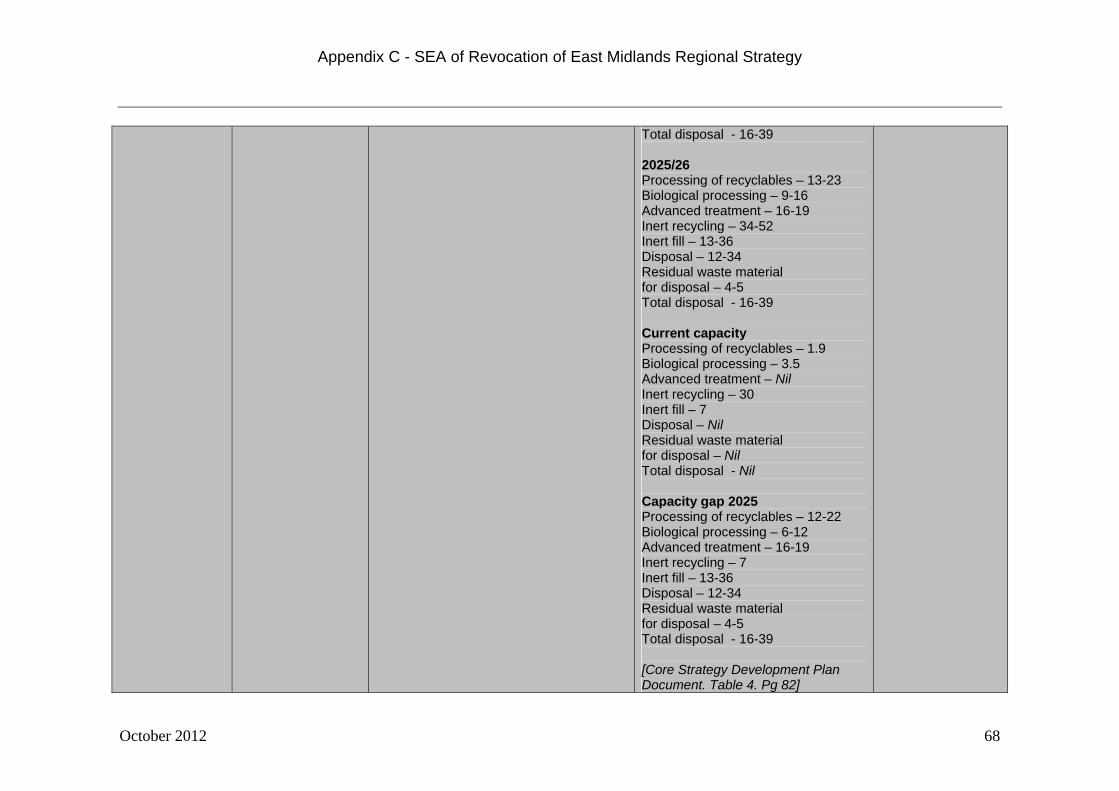
Appendix C - SEA of Revocation of East Midlands Regional Strategy
October 2012 68
Total disposal - 16-39 2025/26 Processing of recyclables – 13-23 Biological processing – 9-16 Advanced treatment – 16-19 Inert recycling – 34-52 Inert fill – 13-36 Disposal – 12-34 Residual waste material for disposal – 4-5 Total disposal - 16-39 Current capacity Processing of recyclables – 1.9 Biological processing – 3.5 Advanced treatment – Nil Inert recycling – 30 Inert fill – 7 Disposal – Nil Residual waste material for disposal – Nil Total disposal - Nil Capacity gap 2025 Processing of recyclables – 12-22 Biological processing – 6-12 Advanced treatment – 16-19 Inert recycling – 7 Inert fill – 13-36 Disposal – 12-34 Residual waste material for disposal – 4-5 Total disposal - 16-39 [Core Strategy Development Plan Document. Table 4. Pg 82]
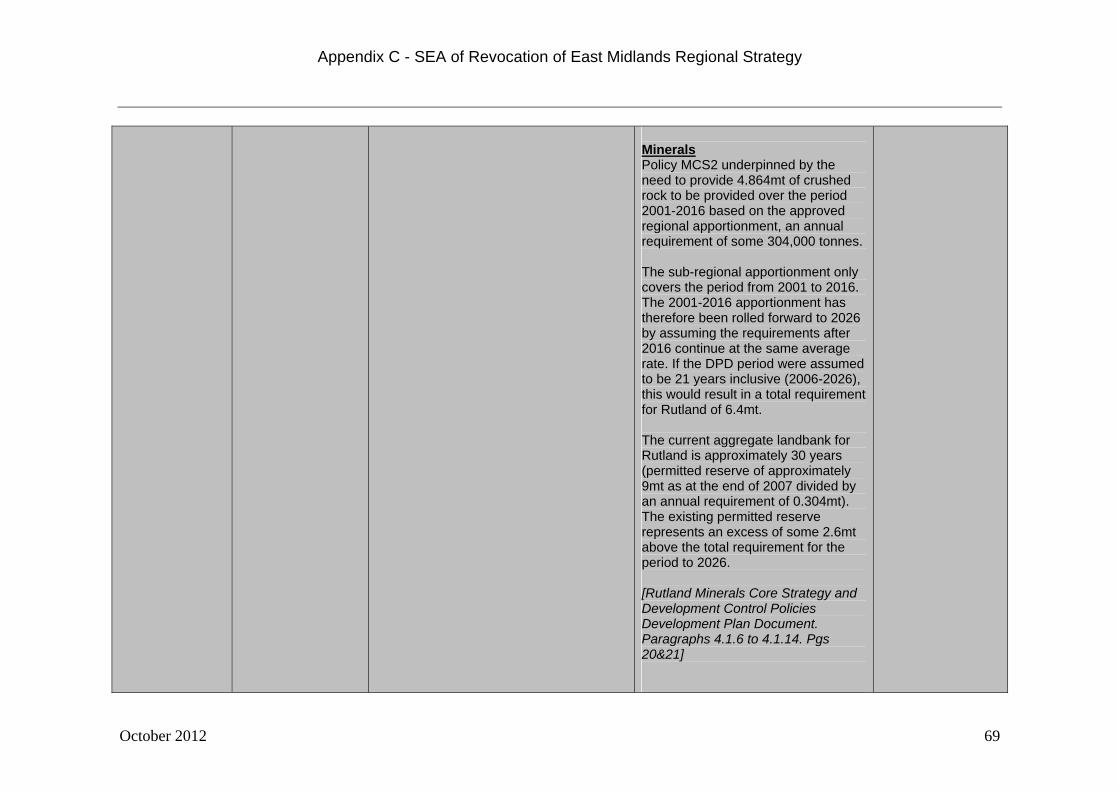
Appendix C - SEA of Revocation of East Midlands Regional Strategy
October 2012 69
Minerals Policy MCS2 underpinned by the need to provide 4.864mt of crushed rock to be provided over the period 2001-2016 based on the approved regional apportionment, an annual requirement of some 304,000 tonnes. The sub-regional apportionment only covers the period from 2001 to 2016. The 2001-2016 apportionment has therefore been rolled forward to 2026 by assuming the requirements after 2016 continue at the same average rate. If the DPD period were assumed to be 21 years inclusive (2006-2026), this would result in a total requirement for Rutland of 6.4mt. The current aggregate landbank for Rutland is approximately 30 years (permitted reserve of approximately 9mt as at the end of 2007 divided by an annual requirement of 0.304mt). The existing permitted reserve represents an excess of some 2.6mt above the total requirement for the period to 2026. [Rutland Minerals Core Strategy and Development Control Policies Development Plan Document. Paragraphs 4.1.6 to 4.1.14. Pgs 20&21]

Appendix C - SEA of Revocation of East Midlands Regional Strategy
October 2012 70
Lincolnshire Lincolnshire Waste
Local Plan (adopted May 2006) Minerals Local Plan (adopted 1991) saved Local Plan policies
Waste Waste objectives consistent with those in Waste Strategy 2000. Each Council has also been set individual targets to reflect local circumstances. In Lincolnshire the recycling target is 20% in 2003/4 and 30% in 2005/6. Projected Lincolnshire Waste Arising Levels (tonnes) 2015 MSW Tonnage – 426,000 Percentage – 13% C&I Tonnage – 1,071,000 Percentage – 34% C&D Tonnage – 1,703,000 Percentage – 53% [Lincolnshire Waste Local Plan. Table 6. Pg 29] Future predicted Lincolnshire MSW growth (in tonnes)

Appendix C - SEA of Revocation of East Midlands Regional Strategy
October 2012 71
2004/05 – 362,662 2005/06 – 367,669 2009/10 – 413,815 2012/13 – 452,186 2014/15 – 479,725 2019/20 – 556,133 Figures from 2009/10 onwards are estimated assuming 3% per annum growth from 2005/06 base. [Lincolnshire Waste Local Plan. Table 7. Pg 30] The role of the district councils as collection authorities is very important in achieving recycling targets. Kerbside recycling initiatives have resulted in 11% of MSW being recycled in 2003/04. Kerbside Recycling Collection in Lincolnshire (2003-2004) Approx tonnage collected Boston Borough Council – 3,634 East Lindsey DC – 2,000 Lincoln City – 2,000 North Kesteven DC – 7,096 South Holland DC – 3,226 South Kesteven DC – 2,238 West Lindsey DC – 573 Households served by kerbside recycling (%)

Appendix C - SEA of Revocation of East Midlands Regional Strategy
October 2012 72
Boston Borough Council – 77.1 East Lindsey DC – 84.3 Lincoln City – 99.3 North Kesteven DC – 100 South Holland DC – 86 South Kesteven DC – 35 West Lindsey DC – 50.6 Whilst the objective of the plan is to meet the targets for reduction and recycling of municipal waste set out in the Regional Spatial Strategy and Regional Waste Strategy, the continued increase in the growth rate of municipal waste makes achieving the recycling, recovery and landfill diversion rates set by Central Government a challenging prospect. [Lincolnshire Waste Local Plan. Paragraphs 4.6&4.7. Pgs 31&32] Minerals Provision for aggregates production in Lincolnshire will be based on the County contributing 10.94% towards the East Midlands forecast demand 1986-2005 (adjusted to 1986-2000) made up of: - for sand and gravel of 7.38%; and - for crushed rock of 3.56% Lincolnshire: Level of Provision for

Appendix C - SEA of Revocation of East Midlands Regional Strategy
October 2012 73
Aggregates 1986-2000 (million tonnes) Total output (1986-2000) Sand and gravel – 43.622 Crushed Rock – 21.042 Annual average output (1986-1995) Sand and gravel – 2.760 Crushed Rock – 1.331 Annual average output (1996-2000) Sand and gravel – 3.204 Crushed Rock – 1.564 [Minerals Local Plan. Paragraphs 3.19and table 4. Pgs 20&21]
Northamptonshire Minerals and Waste
Development Framework Core Strategy (May 2010) (site specific elements adopted March 2011)
Waste The Joint Municipal Waste Management Strategy sets the following targets for recycling and composting of household waste which exceed national targets: 44% by

Appendix C - SEA of Revocation of East Midlands Regional Strategy
October 2012 74
2009/10, 48% by 2012/13, 52% by 2015/16, and 56% by 2019/20. [Minerals and waste development framework core strategy. Paragraph 3.21. Pg 8] Summary of MSW arisings (tonnes per annum) 2005/06 Total MSW arisings – 369,000 Recycling – 67,000 Biological processing – 58,000 Advanced treatment – 0 Landfill disposal: post preliminary treatment (no advanced treatment) – 244,000 Landfill disposal: residual waste arisings (post-advanced treatment) – 5,000 2010/11 Total MSW arisings – 383,000 Recycling – 97,000 Biological processing – 84,000 Advanced treatment – 10,000 Landfill disposal: post preliminary treatment (no advanced treatment) – 191,000 Landfill disposal: residual waste

Appendix C - SEA of Revocation of East Midlands Regional Strategy
October 2012 75
arisings (post-advanced treatment) – 9,000 2015/16 Total MSW arisings – 414,000 Recycling – 111,000 Biological processing – 96,000 Advanced treatment – 207,000 Landfill disposal: post preliminary treatment (no advanced treatment) – 0 Landfill disposal: residual waste arisings (post-advanced treatment) – 49,000 2020/21 Total MSW arisings – 443,000 Recycling – 119,000 Biological processing – 102,000 Advanced treatment – 221,000 Landfill disposal: post preliminary treatment (no advanced treatment) – 0 Landfill disposal: residual waste arisings (post-advanced treatment) – 53,000 2025/26 Total MSW arisings – 472,000 Recycling – 127,000 Biological processing – 109,000 Advanced treatment – 236,000

Appendix C - SEA of Revocation of East Midlands Regional Strategy
October 2012 76
Landfill disposal: post preliminary treatment (no advanced treatment) – 0 Landfill disposal: residual waste arisings (post-advanced treatment) – 56,000 Indicative capacity requirement 2015/16 (tonnes) Recycling – 44,000 Biological processing – 38,000 Advanced treatment – 207,000 Disposal to landfill – 49,000 Indicative capacity requirement 2025/26 (tonnes) Recycling – 59,000 Biological processing – 51,000 Advanced treatment – 236,000 Disposal to landfill – 56,000 [Minerals and waste development framework core strategy. Table CS2(a). Pg 20] Summary of C&I arisings (tonnes per annum) 2005/06 Total C&I arisings – 1,016,000 Recycling – 219,000 Biological processing – 219,000 Advanced treatment – 122,000
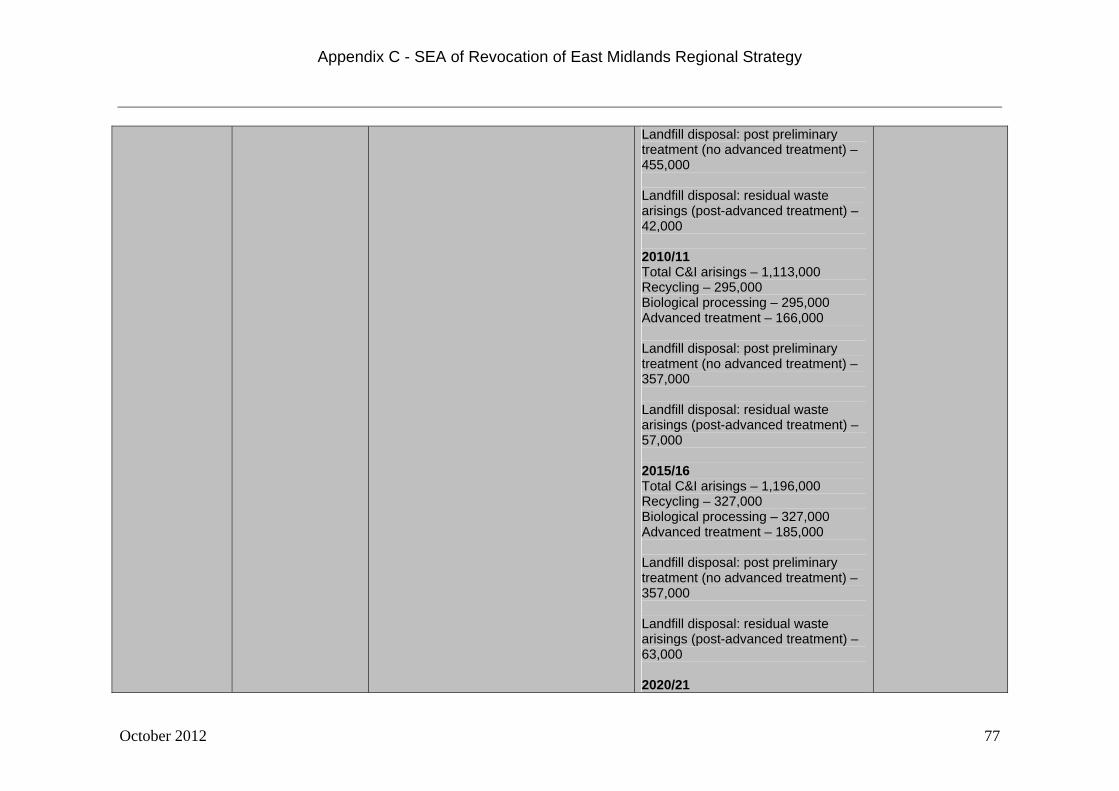
Appendix C - SEA of Revocation of East Midlands Regional Strategy
October 2012 77
Landfill disposal: post preliminary treatment (no advanced treatment) – 455,000 Landfill disposal: residual waste arisings (post-advanced treatment) – 42,000 2010/11 Total C&I arisings – 1,113,000 Recycling – 295,000 Biological processing – 295,000 Advanced treatment – 166,000 Landfill disposal: post preliminary treatment (no advanced treatment) – 357,000 Landfill disposal: residual waste arisings (post-advanced treatment) – 57,000 2015/16 Total C&I arisings – 1,196,000 Recycling – 327,000 Biological processing – 327,000 Advanced treatment – 185,000 Landfill disposal: post preliminary treatment (no advanced treatment) – 357,000 Landfill disposal: residual waste arisings (post-advanced treatment) – 63,000 2020/21

Appendix C - SEA of Revocation of East Midlands Regional Strategy
October 2012 78
Total C&I arisings – 1,277,000 Recycling – 359,000 Biological processing – 359,000 Advanced treatment – 203,000 Landfill disposal: post preliminary treatment (no advanced treatment) – 357,000 Landfill disposal: residual waste arisings (post-advanced treatment) – 69,000 2025/26 Total C&I arisings – 1,356,000 Recycling – 389,000 Biological processing – 389,000 Advanced treatment – 220,000 Landfill disposal: post preliminary treatment (no advanced treatment) – 357,000 Landfill disposal: residual waste arisings (post-advanced treatment) – 75,000 Indicative capacity requirement 2015/16 (tonnes) Recycling – 108,000 Biological processing – 108,000 Advanced treatment – 63,000 Disposal to landfill – 420,000 Indicative capacity requirement 2025/26 (tonnes) Recycling – 170,000

Appendix C - SEA of Revocation of East Midlands Regional Strategy
October 2012 79
Biological processing – 170,000 Advanced treatment – 98,000 Disposal to landfill – 432,000 [Minerals and waste development framework core strategy. Table CS2(b). Pg 20] Summary of C&D arisings (tonnes per annum) 2005/06 Total C&D arisings – 1,482,000 Inert Recycling – 732,000 Inert fill – 568,000 Disposal to landfill – 182,000 2010/11 Total C&D arisings – 1,653,000 Inert Recycling – 848,000 Inert fill – 633,000 Disposal to landfill – 172,000 2015/16 Total C&D arisings – 1,809,000 Inert Recycling – 928,000 Inert fill – 693,000 Disposal to landfill – 188,000 2020/21 Total C&D arisings – 1,969,000 Inert Recycling – 1,010,000 Inert fill – 754,000 Disposal to landfill – 205,000

Appendix C - SEA of Revocation of East Midlands Regional Strategy
October 2012 80
2025/26 Total C&D arisings – 2,123,000 Inert Recycling – 1,089,000 Inert fill – 813,000 Disposal to landfill – 221,000 Indicative capacity requirement 2015/16 (tonnes) Inert Recycling – 196,000 Inert fill – 693,000 Disposal to landfill – 188,000 Indicative capacity requirement 2025/26 (tonnes) Inert Recycling – 357,000 Inert fill – 813,000 Disposal to landfill – 221,000 [Minerals and waste development framework core strategy. Table CS2(c). Pg 21] Summary of waste arisings requiring treatment (tonnes per annum) 2005/06 Total arisings (MSW, C&I, C&D) – 2,867,000 Recycling (MSW, C&I) – 287,000 Biological Processing (MSW, C&I) – 278,000

Appendix C - SEA of Revocation of East Midlands Regional Strategy
October 2012 81
Advanced treatment (MSW, C&I) – 122,000 Inert recycling (C&D) – 732,000 2010/11 Total arisings (MSW, C&I, C&D) – 3,149,000 Recycling (MSW, C&I) – 392,000 Biological Processing (MSW, C&I) – 379,000 Advanced treatment (MSW, C&I) – 177,000 Inert recycling (C&D) – 848,000 2015/16 Total arisings (MSW, C&I, C&D) – 3,418,000 Recycling (MSW, C&I) – 439,000 Biological Processing (MSW, C&I) – 423,000 Advanced treatment (MSW, C&I) – 392,000 Inert recycling (C&D) – 928,000 2020/21

Appendix C - SEA of Revocation of East Midlands Regional Strategy
October 2012 82
Total arisings (MSW, C&I, C&D) – 3,689,000 Recycling (MSW, C&I) – 478,000 Biological Processing (MSW, C&I) – 461,000 Advanced treatment (MSW, C&I) – 424,000 Inert recycling (C&D) – 1,010,000 2025/26 Total arisings (MSW, C&I, C&D) – 3,951,000 Recycling (MSW, C&I) – 516,000 Biological Processing (MSW, C&I) – 498,000 Advanced treatment (MSW, C&I) – 456,000 Inert recycling (C&D) – 1,089,000 Indicative capacity requirement 2015/16 (tonnes) Recycling (MSW, C&I) – 152,000 Biological processing (MSW, C&I) – 145,000 Advanced Treatment (MSW, C&I) –
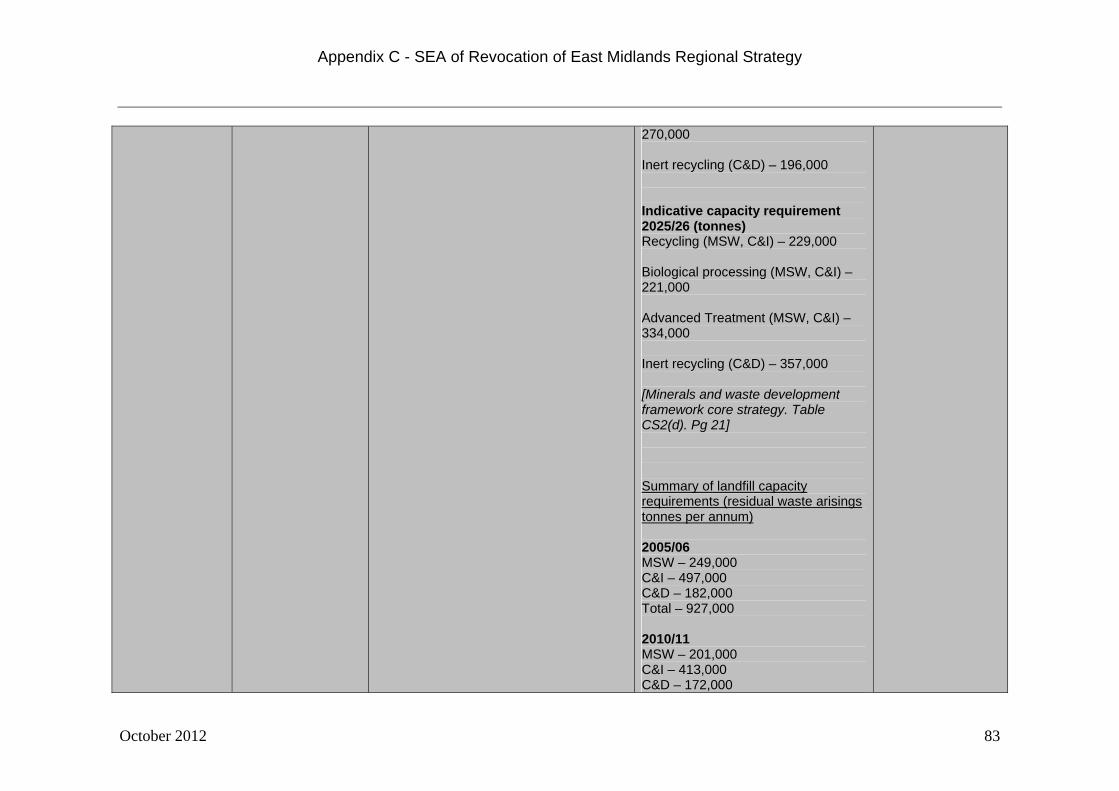
Appendix C - SEA of Revocation of East Midlands Regional Strategy
October 2012 83
270,000 Inert recycling (C&D) – 196,000 Indicative capacity requirement 2025/26 (tonnes) Recycling (MSW, C&I) – 229,000 Biological processing (MSW, C&I) – 221,000 Advanced Treatment (MSW, C&I) – 334,000 Inert recycling (C&D) – 357,000 [Minerals and waste development framework core strategy. Table CS2(d). Pg 21] Summary of landfill capacity requirements (residual waste arisings tonnes per annum) 2005/06 MSW – 249,000 C&I – 497,000 C&D – 182,000 Total – 927,000 2010/11 MSW – 201,000 C&I – 413,000 C&D – 172,000

Appendix C - SEA of Revocation of East Midlands Regional Strategy
October 2012 84
Total – 786,000 2015/16 MSW – 49,000 C&I – 420,000 C&D – 188,000 Total – 657,000 2020/21 MSW – 53,000 C&I – 426,000 C&D – 205,000 Total – 684,000 2025/26 MSW – 56,000 C&I – 432,000 C&D – 221,000 Total – 709,000 Estimated residual disposal capacity 2015/16 (tonnes) MSW – 49,000 C&I – 420,000 C&D – 188,000 Total – 657,000 Estimated residual disposal capacity 2025/26 (tonnes) MSW – 56,000 C&I – 432,000 C&D – 221,000 Total – 709,000 [Minerals and waste development

Appendix C - SEA of Revocation of East Midlands Regional Strategy
October 2012 85
framework core strategy. Table CS2(e). Pg 22] Policy CS1: Northamptonshire’s waste management capacity Provide facilities to meet the following indicative waste management capacities during the plan period: Recycling (MSW and C&I) capacity of 439,000 and 516,000 tonnes per annum for 2016 and 2026 respectively, Biological processing (MSW and C&I) capacity of 423,000 and 498,000 tonnes per annum for 2016 and 2026 respectively, Waste management or advanced treatment (MSW and C&I) capacity of 392,000 and 456,000 tonnes per annum for 2016 and 2026 respectively, Inert recycling (C&D) capacity of 928,000 and 1,089,000 tonnes per annum for 2016 and 2026 respectively, Hazardous waste management of 72,000 and 82,000 tonnes per annum for 2016 and 2026 respectively. This provision will come from a mix of

Appendix C - SEA of Revocation of East Midlands Regional Strategy
October 2012 86
extensions to existing sites, intensification or re-development of existing sites and new sites. [Minerals and waste development framework core strategy. Policy CS1. Pg 30] Policy CS3: Strategy for waste disposal Provision should be made to meet the following indicative waste disposal capacities during the plan period: Non-inert disposal (MSW, C&I and C&D) capacity of 657,000 and 709,000 tonnes per annum for 2016 and 2026 respectively, Inert fill disposal capacity of 693,000 and 813,000 tonnes per annum for 2016 and 2026 respectively. Provision of capacity for general non-inert waste disposal should only be made if the need for this can be justified and it is only for residual wastes. [Minerals and waste development framework core strategy. Policy CS3. Pg 30]

Appendix C - SEA of Revocation of East Midlands Regional Strategy
October 2012 87
Minerals Sand and gravel in Northamptonshire to be maintained at average level of 0.97 million tonnes a year. Crushed rock (limestone) in Northamptonshire to be maintained at average level of 0.39 million tonnes a year. [Minerals and waste development framework core strategy. Paragraph 7.2. Pg 31] Policy CS5: Providing for an adequate supply of aggregates Provision will be made over the plan period 2006 to 2026 for the extraction of: 19.36 million tonnes of sand and gravel (equivalent to an annual average of 0.97 million tonnes) provided from glacial and pre-glacial deposits, and the river valleys of the Nene (west of Wellingborough) and the Great Ouse. 7.9 million tonnes of crushed rock (limestone) (equivalent to an annual average of 0.39 million tonnes) provided from deposits outside unworked river valleys or from sites with old permissions upgraded to

Appendix C - SEA of Revocation of East Midlands Regional Strategy
October 2012 88
modern conditions. The maintenance of a landbank of at least seven years for sand & gravel, and at least ten years for crushed rock will be sought. This provision will come from both extensions to existing sites and new sites. [Minerals and waste development framework core strategy. Policy CS5. Pg 35]
Nottinghamshire and Nottingham
Waste Local Plan (2002) saved Local Plan policies Nottinghamshire Minerals Local Plan (2005) saved Local Plan policies
Waste No percentage figures for recycling, landfill diversion etc Nottinghamshire – Annual Waste Arisings 1996 Household – 500,000 tonnes C&I – 850,000 tonnes C&D – 750,000 [Waste Local Plan. Figure 1.1. Chapter 1] Summary of shortfall in disposal space over plan period (1995-2004) in 000 tonnes.
Waste Waste Core Strategy published for consultation February 2012. Minerals Minerals Core Strategy scheduled for public consultation summer 2013.

Appendix C - SEA of Revocation of East Midlands Regional Strategy
October 2012 89
Worst case Household/Commercial/Industrial Greater Nottingham – 220 Mansfield/Ashfield – 186 Construction/demolition Greater Nottingham – 95 Best Case Household/Commercial/Industrial Greater Nottingham – 128 Mansfield/Ashfield – 167 Construction/demolition Greater Nottingham – 85 [Waste Local Plan. Figure 10.4. Chapter 10] Minerals Minerals figures all lower than RS which contains more recent apportionments Nottinghamshire’s share of Regional sand and gravel production (based on approach approved by East Midlands Forum Feb 2004) East Midlands (000 tonnes) 1997 - 11,315 1998 - 9,995 1999 - 10,369
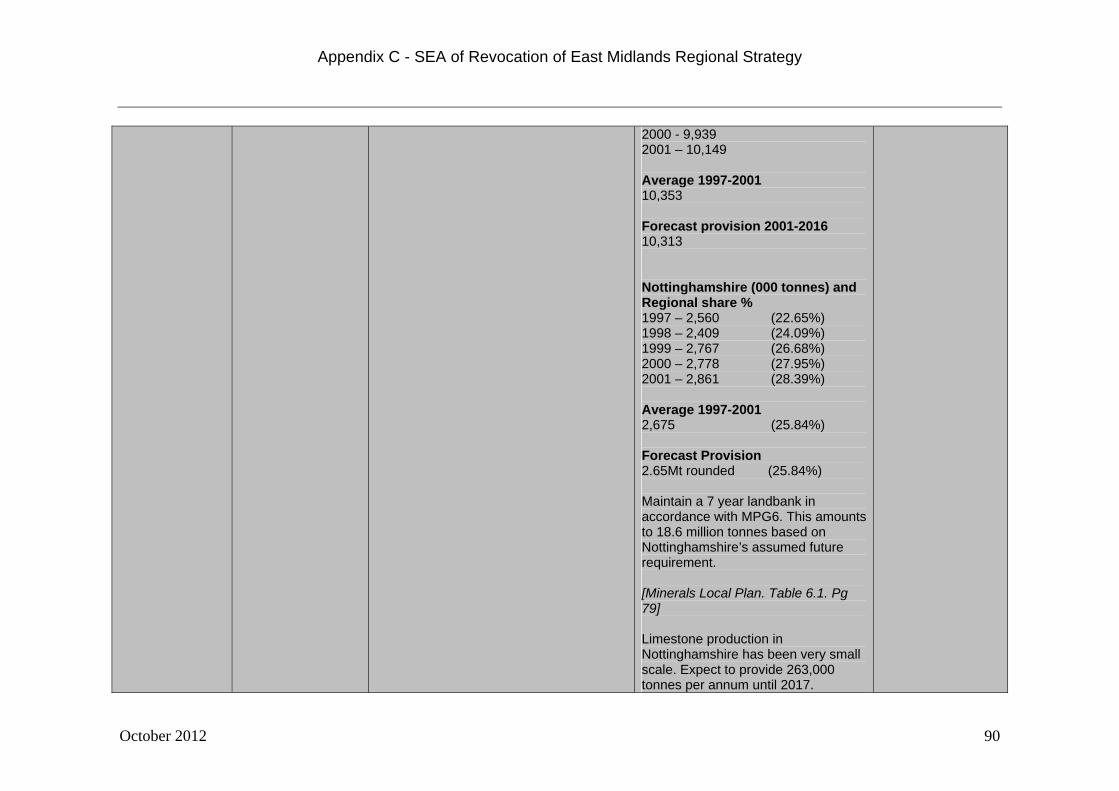
Appendix C - SEA of Revocation of East Midlands Regional Strategy
October 2012 90
2000 - 9,939 2001 – 10,149 Average 1997-2001 10,353 Forecast provision 2001-2016 10,313 Nottinghamshire (000 tonnes) and Regional share % 1997 – 2,560 (22.65%) 1998 – 2,409 (24.09%) 1999 – 2,767 (26.68%) 2000 – 2,778 (27.95%) 2001 – 2,861 (28.39%) Average 1997-2001 2,675 (25.84%) Forecast Provision 2.65Mt rounded (25.84%) Maintain a 7 year landbank in accordance with MPG6. This amounts to 18.6 million tonnes based on Nottinghamshire’s assumed future requirement. [Minerals Local Plan. Table 6.1. Pg 79] Limestone production in Nottinghamshire has been very small scale. Expect to provide 263,000 tonnes per annum until 2017.
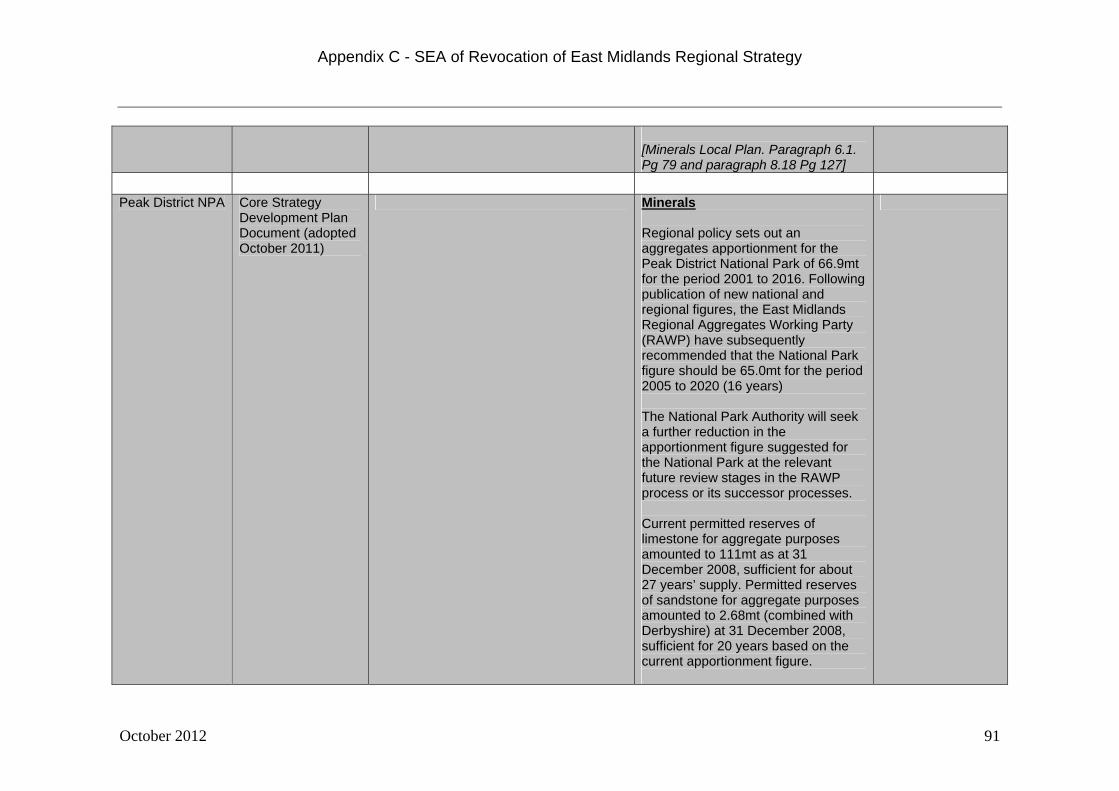
Appendix C - SEA of Revocation of East Midlands Regional Strategy
October 2012 91
[Minerals Local Plan. Paragraph 6.1. Pg 79 and paragraph 8.18 Pg 127]
Peak District NPA Core Strategy
Development Plan Document (adopted October 2011)
Minerals Regional policy sets out an aggregates apportionment for the Peak District National Park of 66.9mt for the period 2001 to 2016. Following publication of new national and regional figures, the East Midlands Regional Aggregates Working Party (RAWP) have subsequently recommended that the National Park figure should be 65.0mt for the period 2005 to 2020 (16 years) The National Park Authority will seek a further reduction in the apportionment figure suggested for the National Park at the relevant future review stages in the RAWP process or its successor processes. Current permitted reserves of limestone for aggregate purposes amounted to 111mt as at 31 December 2008, sufficient for about 27 years’ supply. Permitted reserves of sandstone for aggregate purposes amounted to 2.68mt (combined with Derbyshire) at 31 December 2008, sufficient for 20 years based on the current apportionment figure.
Appendix C - SEA of Revocation of East Midlands Regional Strategy
October 2012 92
[Core Strategy Development Plan Document. Paragraph 14.22 to 14.24. Pg 116]