Enhancing Existing Disaster Recovery Plans Using Backup ...
161
Walden University ScholarWorks Walden Dissertations and Doctoral Studies Walden Dissertations and Doctoral Studies Collection 2017 Enhancing Existing Disaster Recovery Plans Using Backup Performance Indicators Gwen White Walden University Follow this and additional works at: hps://scholarworks.waldenu.edu/dissertations Part of the Databases and Information Systems Commons is Dissertation is brought to you for free and open access by the Walden Dissertations and Doctoral Studies Collection at ScholarWorks. It has been accepted for inclusion in Walden Dissertations and Doctoral Studies by an authorized administrator of ScholarWorks. For more information, please contact [email protected].
Transcript of Enhancing Existing Disaster Recovery Plans Using Backup ...

Walden UniversityScholarWorks
Walden Dissertations and Doctoral Studies Walden Dissertations and Doctoral StudiesCollection
2017
Enhancing Existing Disaster Recovery Plans UsingBackup Performance IndicatorsGwen WhiteWalden University
Follow this and additional works at: https://scholarworks.waldenu.edu/dissertations
Part of the Databases and Information Systems Commons
This Dissertation is brought to you for free and open access by the Walden Dissertations and Doctoral Studies Collection at ScholarWorks. It has beenaccepted for inclusion in Walden Dissertations and Doctoral Studies by an authorized administrator of ScholarWorks. For more information, pleasecontact [email protected].
Walden University
College of Management and Technology
This is to certify that the doctoral dissertation by
Gwen White
has been found to be complete and satisfactory in all respects, and that any and all revisions required by the review committee have been made.
Review Committee Dr. Howard Schechter, Committee Chairperson,
Applied Management and Decision Sciences Faculty
Dr. Salvatore Sinatra, Committee Member, Applied Management and Decision Sciences Faculty
Dr. Robert Kilmer, University Reviewer
Applied Management and Decision Sciences Faculty
Chief Academic Officer Eric Riedel, Ph.D.
Walden University 2017

Abstract
Enhancing Existing Disaster Recovery Plans Using Backup Performance Indicators
by
Gwen R. White
MBA, Morehead State University, 2007
MCP, University of Cincinnati, 1990
BA, Miami University, 1986
Dissertation Submitted in Partial Fulfillment
of the Requirements for the Degree of
Doctor of Philosophy
Management
Walden University
November 2017
Abstract
Companies that perform data backup lose valuable data because they lack reliable data
backup or restoration methods. The purpose of this study was to examine the need for a
Six Sigma data backup performance indicator tool that clarifies the current state of a data
backup method using an intuitive numerical scale. The theoretical framework for the
study included backup theory, disaster recovery theory, and Six Sigma theory. The
independent variables were implementation of data backup, data backup quality, and data
backup confidence. The dependent variable was the need for a data backup performance
indicator. An adapted survey instrument that measured an organization’s data backup
plan, originally administered by Information Week, was used to survey 107 businesses
with 15 to 250 employees in the Greater Cincinnati area. The results revealed that 69 out
of 107 small businesses did not need a data backup performance indicator and the binary
logistic regression model indicated no significant relationship between the dependent and
independent variables. The conclusion of the study is that many small businesses have
not experienced a disaster and cannot see the importance of a data backup indicator that
quantifies recovery potential in case of a disaster. It is recommended that further
research is required to determine if this phenomenon is only applicable only to small
businesses in the Greater Cincinnati area through comparisons based on business size and
location. This study contributes to positive social change through improvement of data
backup, which enables organizations to quickly recover from a disaster, thereby saving
jobs and contributing to the stability of city, state, and national economies.
Enhancing Existing Disaster Recovery Plans Using Backup Performance Indicators
by
Gwen R. White
MBA, Morehead State University, 2007
MCP, University of Cincinnati, 1990
BA, Miami University, 1986
Dissertation Submitted in Partial Fulfillment
of the Requirements for the Degree of
Doctor of Philosophy
Management
Walden University
November 2017

Dedication
I would like to dedicate this paper to my husband David White who put up with me
through this process and encouraged me to continue even when I wanted to quit. My kids
Whitney, Talibah, Malika, Zakiyya and Dontez who endured my constant nagging to do
their homework and their constant questioning of are you finished yet? All those friends
that are too many to mention but had my back through the process.

Acknowledgments
I would like to acknowledge my dissertation chair, Dr. Howard Schechter who said this is
cool and keep plugging away…it will be completed. Dr. Salvatore Sinatra, whose
guidance was great and worked with me through all those figures to clarify the
dissertation. And finally, Dr. Robert Kilmer my URR, who pushed me to understand and
perfect my ideas.

i
Table of Contents
Table of Contents ................................................................................................................. i
List of Tables .......................................................................................................................v
List of Figures ................................................................................................................... vii
Chapter 1: Introduction to the Study ....................................................................................1
Background ....................................................................................................................1
Problem Statement .........................................................................................................5
Purpose of Research .......................................................................................................7
Research Questions and Hypotheses .............................................................................7
Theoretical Support for the Study ..................................................................................8
Disaster Recovery Theory........................................................................................8
Backup Theory .......................................................................................................12
Quality Theories.....................................................................................................20
Six Sigma ...............................................................................................................25
Nature of the Study ......................................................................................................28
Definitions of Terms ....................................................................................................28
Scope of the Study .......................................................................................................30
Assumptions of the Study ............................................................................................30
Limitations of the Study...............................................................................................31
Significance of the Study .............................................................................................31
Summary and Transition ..............................................................................................32

ii
Chapter 2: Literature Review .............................................................................................33
Gap in the Literature ....................................................................................................33
Quality Theories.....................................................................................................34
Backup Methods and Backup Theory ....................................................................34
Disaster Recovery Planning ...................................................................................35
Disaster Recovery Plans ..............................................................................................35
Crisis Examples and DRP Usage ...........................................................................40
Difference Between Disaster Recovery Plans and Business Continuity Plans......42
9/11 and Disaster Recovery Plan Readiness ..........................................................44
Responsibility for the Disaster Recovery Plan ......................................................45
Quality Theories: Foundation Six Sigma .....................................................................46
Zero Defects Quality Theory .................................................................................46
Theory of Inventive Problem Solving (TRIZ) .......................................................49
Total Quality Management (TQM) ........................................................................49
Six Sigma ...............................................................................................................50
DMAIC ..................................................................................................................55
DMADV ................................................................................................................62
Calculation of Six Sigma After Measurement and Analysis .................................68
Backup of Data ............................................................................................................69
Design for Study ..........................................................................................................73
Conclusion ...................................................................................................................76
iii
Chapter 3: Research Method ..............................................................................................78
Research Design and Rationale ...................................................................................78
Methodology ................................................................................................................82
Population ....................................................................................................................82
Sampling and Sampling Procedures ............................................................................83
Procedures for Recruitment, Participation, and Data Collection .................................85
Instrumentation and Operationalization of Constructs ................................................86
Operationalization ........................................................................................................88
Data Analysis Plan .......................................................................................................90
Threats to Validity and Trustworthiness ......................................................................92
Ethical Considerations .................................................................................................94
Summary ......................................................................................................................94
Chapter 4: Results ..............................................................................................................96
Data Collection ............................................................................................................96
Results ..........................................................................................................................97
Results of Hypothesis Testing .............................................................................112
Summary ....................................................................................................................119
Chapter 5: Conclusions and Recommendations ..............................................................120
Interpretation of the Findings.....................................................................................120
Limitations of the Study.............................................................................................122
Recommendations ......................................................................................................123
iv
Implications for Social Change ..................................................................................124
Conclusion .................................................................................................................125
References ........................................................................................................................126
Appendix A: Quantitative and Qualitative Survey Questions .........................................143

v
List of Tables
Table 1. Features of SAN, NAS and RAID ......................................................................19
Table 2. Quality Management Theorist.….………………………………….……… ......21
Table 3. Variables and Corresponding Survey Questions .................................................88
Table 4. Data Analysis Chart .............................................................................................90
Table 5. Coding of Responses ...........................................................................................97
Table 6. Number of Employees .......................................................................................100
Table 7. Company Location .............................................................................................101
Table 8. Job Title .............................................................................................................102
Table 9. Annual Revenue .................................................................................................104
Table 10. Primary Industry ..............................................................................................105
Table 11. Use Backup ......................................................................................................107
Table 12. Problem with Data Backup ..............................................................................108
Table 13. Frequency of Data Backup ..............................................................................109
Table 14. Satisfaction with Data Backup .........................................................................110
Table 15. Confidence with Data Backup .........................................................................111
Table 16. Need for Data Backup Indicator ......................................................................112
Table 17. Box Tidwell Test Interaction Output ...............................................................115
Table 18. Base (Null) Model Comparison .......................................................................116
Table 19. Base (Null) Model Regression Output – Variables in the Equation ................116
Table 20. Variables Not Included in Base (Null) Model Regression Output ..................116

vi
Table 21. Classification Table .........................................................................................117
Table 22. Model Summary ..............................................................................................117
Table 23. Omnibus Test of Model Coefficients...............................................................118
Table 24. Binary Logistic Regression Output..................................................................119

vii
List of Figures
Figure 1. Theoretical support for study ................................................................................8
Figure 2. Phases in emergency management .....................................................................10
Figure 3. Six Sigma process and standard deviations away from the mean ......................27
Figure 4. Major themes of literature review ......................................................................34
Figure 5. Top down method of Six Sigma implementation ...............................................51
Figure 6. Six Sigma decision structure ..............................................................................53
Figure 7. DMAIC explanation of steps ..............................................................................55
Figure 8. DMADV explanation of steps ............................................................................63
Figure 9. The quantitative correlational design ................................................................80
Figure 10. Methodology process .......................................................................................82
Figure 11. Power analysis ..................................................................................................85
Figure 12. Online survey steps...........................................................................................87
Figure 13. Binary logistic regression equation .................................................................90
Figure 14. Number of employees by company size .........................................................100
Figure 15. Business locations ..........................................................................................101
Figure 16. Employee position ..........................................................................................103
Figure 17. Annual revenue ...............................................................................................104
Figure 18. Number of businesses by industry ..................................................................106
Figure 19. Use data backup ..............................................................................................107
Figure 20. Problems with data backup .............................................................................109

viii
Figure 21. Frequency of data backup ...............................................................................110
Figure 22. Satisfaction with data backup .........................................................................110
Figure 23. Confidence in data backup .............................................................................111
Figure 24. Need for data backup indicator .......................................................................112

1
Chapter 1: Introduction to the Study
Disaster recovery plans (DRPs) help organizations return to their former level of
productivity (Nollau, 2009) following a disaster. Business leaders often assume that
DRPs were designed for large corporations’ disaster planning, but smaller companies
need to engage in disaster planning as well (Guy & Lownes-Jackson, 2010). Nollau
(2009) explained that the ability to operate in an alternative manner was crucial to
increasing the probability that a business will remain open after a disaster occurs.
Although some businesses have DRPs and data backup plans, they occasionally did not
test them. Hurricane Katrina proved to the business world that all businesses need an
effective DRP (Omar, Alijani, & Mason, 2011). Organizations should test their data
backups to ensure that they can return to operational status after a disaster (Smith, 2012).
Since Hurricane Katrina, many businesses began requiring mandatory monthly testing of
data backup and restoration functions (Omar et al., 2011). The major sections of this
chapter include (a) an introduction to the topic and a background on disaster recovery,
Six Sigma, and data backup; (b) a discussion of the problem under investigation and the
reason that organizations should use a performance indicator in their data backup; and (c)
theoretical support, including limitations and the significance of the study, in terms of
disaster recovery, data backup, and Six Sigma.
Background
A disaster is a long-term, downtime event that can be catastrophic to a business
(Nollau, 2009; Paldi, Habibullah, & Baharom, 2010). Disasters are events that have no

2
predictable timetable (Paldi et al., 2010) and are classified into three types:
natural, environmental, or human/technological (Omar et al., 2011). Nelson (2011) listed
the following natural threats: drought, earthquakes, floods, storms, tornadoes, volcanoes,
and wildfires. Environmental threats include radioactivity, leakages, fires, explosions,
rodents, hurricanes, and pollution. Human and technological disasters include building
shutdowns, sabotage, computer viruses, terrorism, denial of service attacks, Trojan
worms, software failures, and lack of job knowledge causing catastrophic failure (Nelson,
2011).
Failure to communicate within any organization directly affects operations, as
does hiring the incorrect personnel for a position, such as those who lack the knowledge
or ability to do their jobs properly (Nelson, 2011; Cox, 2011). Hiring the wrong people
can be devastating to a business and may hamper its data restoration efforts (Nelson,
2011). Bad hiring decisions lead to theft, embezzlement, workplace violence, and trade
secret theft, which trigger a disaster (Phillips, 2009).
The Federal Emergency Management Agency (2017) recorded 3,371 disasters in
the United States between 1976 and 2016 (2017). The Centre for Research on the
Epidemiology of Disasters has maintained a database of disaster events since 1988 and
recorded over 1,500 events including the 9/11 terror attacks in 2001; the 2003 U.S.-
Canadian power outage; the 2004 Indian Ocean earthquake and tsunami; Hurricanes Rita
and Wilma in 2005; the 2008 world financial crisis; the H1N1 pandemic, Icelandic
volcano eruptions, and the European floods of 2009; and the 2011 Japan earthquake

3
(Omar et al., 2011). The downtime caused by a disaster event tests a DRP’s
usefulness (Knox, 2012), and businesses must recognize they are vulnerable in the event
of a disaster and design a DRP that minimizes failure (Omar et al., 2011).
The aftermath of the earthquake on January 15, 1995, in Kobe, Japan provided an
example of corporate dependence on information technology and information systems.
The earthquake devastated the region and brought business to a halt (Chang, 2010).
Toyota was affected because it relied on technology and its just-in-time inventory system.
The devastation reached across the globe affecting companies in other countries. IBM in
the United States, for example, was impacted because Japanese suppliers of memory
chips and other computer parts were shut down. None of these organizations had efficient
or effective DRPs at the time (Chang, 2010).
This was important because there was a direct inverse relationship between
disasters and business economics (Paldi et al., 2010). Paldi et al. (2010) reviewed the
relationship between economic development, education, and population in 15 Asian
countries between 1997 and 2005 and found that the relationship between economic
development and disaster loss was nonlinear. In general, lower-income countries were
more disaster resilient, whereas higher-income countries experienced more disasters but
faster recovery. Also, the higher the level of education in a country and the larger its land
area, the lower its number of disaster-related fatalities. Countries with higher incomes
had better recovery options than poorer countries. Developing countries were affected
most, having the highest rates of death and poverty after a disaster (Paldi et al., 2010).

4
Dependence on a central authority that was not responsive to preparedness
and communication failures, meanwhile, decreased predisaster responsiveness, especially
in developing countries (Nollau, 2009).
Decreased response time, cultural differences, and lack of proper equipment and
training contributed to increased economic hardship and response time (Paldi et al.,
2010). As Paldi et al. (2010) explained, higher-income countries and organizations were
capable of a quicker and better response because the population of these countries tended
to minimize their exposure to disasters. Higher-income populations usually practiced
disaster drills, for example, and had better emergency care structures, better construction
and zoning codes, and a higher level of economic development, which all led to an
improved disaster response (Paldi et al., 2010). Islamic countries created disaster plans
but did not always follow through due to beliefs that disasters were God’s will, which
overshadowed the need to put technology in place (Paldi et al., 2010). In addition, strict
adherence to social norms, rigidness, and bureaucracy hampered the effectiveness of
DRPs in countries such as Japan.
Phillips (2009) explained that an immediate response was critical to reopening a
business. Higher-income companies should practice their DRPs and ensure all their data
are secure in more than one location. The DRP must be accurate and, most importantly,
must be understood by everyone in the organization from upper management to IT
personnel. The existing literature, however, lacked information regarding the
incorporation of a quality management program, such as Six Sigma, and a backup

5
measurement system to ensure that businesses are restored to productivity
following a disaster.
Problem Statement
The specific problem addressed in this study was backup personnel did not apply
quantification to data backups, which led to failed data restoration attempts.
Quantification of the data backup was a measurement of the number of files that were
archived. This lack of data backup quantification led to inadequate data restoration,
which led to loss of revenue or productivity and/or total business shutdown. Businesses
that experienced such data loss often closed within 2 years of the disaster (Snedaker &
Rima, 2014).
Research had not been conducted to determine the need for a data backup
performance indicator that explained the accuracy of the data backup for small business
organizations employing 15 to 250 employees. The articles I reviewed contained
information on ways to back up data, ways to prepare a disaster backup plan, ways to
improve the data backup process, and the number of organizations that currently back up
their data. The existing literature did not contain information on effective communication
between data backup personnel or the need for a data backup indicator.
Data backup raised integrity issues, and companies often lacked a simple way to
quantify problems (Toka & Michiardi, 2011). In the literature, there was a lack of
research on the integrity of data backup measurement systems. Symantec’s (2011)
Disaster Preparedness Survey was used to assess a variety of organizations and indicated

6
that data were either not backed up properly or were not backed up at all, and
that only half of organizations backed up 60% of their data. Many organizations either
backed up all their data or picked the data they wished to save. Thirty-one percent did not
back up e-mail, 21% did not back up their application data, and 17% did not back up their
customer data (Symantec, 2011). Fewer than 50% of surveyed companies backed up their
data once per week, and only 23% backed up their data daily (Symantec, 2012).
Other integrity failures included improper storage of media or theft of media,
which rendered them unusable for restoration (Symantec, 2012). Integrity issues involved
skipped or corrupted files, a missing backup schedule, and tape destruction. Further,
organizations did not always test their data backups to ensure that they were fully
functional and that they flowed correctly. This lack of testing led to future problems if
some portions of the plan were not ready to be implemented to bring the organization
back to productivity.
Many organizations frequently tested the DRPs backup plan (Castillo, 2004).
However, other organizations did not test DRPs (Castillo, 2004). Organizations that
tested their backup plans ensured their accuracy and quality (Hu, Yang, & Matthews,
2010). Infrequent testing was problematic because an organization cannot truly recover if
it does not practice the recovery process (Omar et al., 2011; Paldi et al., 2010). There
were a variety of DRPs, but there was a lack of attention paid to the integrity of a
company’s data backup (deGuise, 2008). The DRP must specifically incorporate a data
backup plan that is sufficient, free of errors, and as close to perfect as possible.

7
Purpose of Research
The purpose of this quantitative study was to evaluate the need for a data backup
performance indicator based on Six Sigma principles that explained the accuracy of the
data backup for small businesses with between 15 and 250 employees. A backup
performance indicator benchmarks the data backup to provide a platform for evaluating
the condition of its backup. Six Sigma is used in a variety of environments to increase
productivity and profitability and to streamline production in both the manufacturing and
service industries (Pyzdek & Keller, 2014). Using Six Sigma in a different way could
revolutionize data backup.
The creation of a backup performance indicator provided labeling information to
help determine whether the data backup was useful in a crisis. The need for a data backup
performance indicator was the dependent variable in this study. The independent
variables were the implementation of data backup, data backup quality, and data backup
confidence. The information gathered helped small businesses to understand the
importance of confidence in the quality of the data backup as well as the need for a
backup performance indicator.
Research Questions and Hypotheses
The research question for this study was as follows: What was the relationship
between implementation of data backup, data backup quality, data backup confidence
(independent variables) and the need for a data backup performance indicator (dependent
variable)?
8
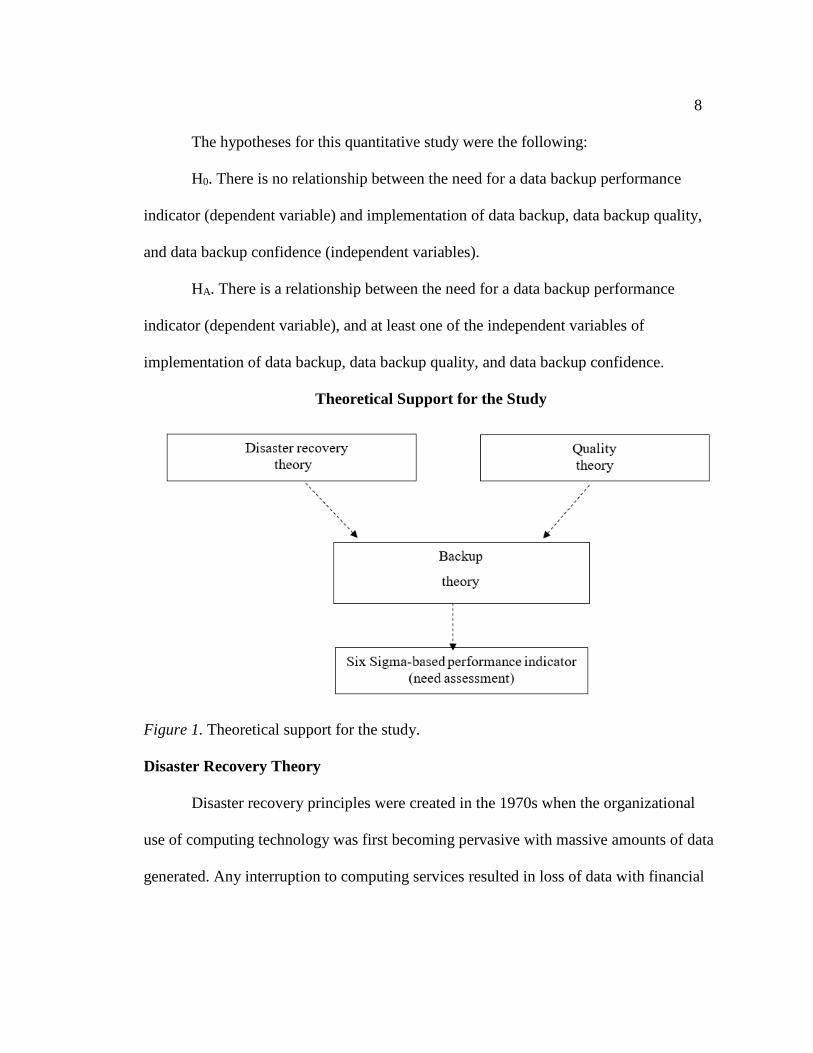
The hypotheses for this quantitative study were the following:
H0. There is no relationship between the need for a data backup performance
indicator (dependent variable) and implementation of data backup, data backup quality,
and data backup confidence (independent variables).
HA. There is a relationship between the need for a data backup performance
indicator (dependent variable), and at least one of the independent variables of
implementation of data backup, data backup quality, and data backup confidence.
Theoretical Support for the Study
Figure 1. Theoretical support for the study.
Disaster Recovery Theory
Disaster recovery principles were created in the 1970s when the organizational
use of computing technology was first becoming pervasive with massive amounts of data
generated. Any interruption to computing services resulted in loss of data with financial

9
repercussions. The ability to return to operations quickly without data loss
was important to businesses (Esnard & Sapat, 2014). For this reason, the disaster
recovery industry grew in the 1980s and 1990s, along with government regulations that
mandated DRPs including a long-term business continuity plan (BCP). Use of the
Internet increased in the 2000s, which in turn increased the importance of DRPs to
ensuring the availability of computing systems.
Classical disaster recovery, which established roots in emergency and disaster
management, typically included four components: mitigation, preparedness, response,
and recovery (Esnard & Sapat, 2014). In this model, there was no performance
measurement designed to reduce or eliminate the risk from disasters. Preparedness meant
the overall ability or readiness to respond to emergencies or crises, response referred to
the action taken to prevent further damage in an emergency, and recovery referred to the
ability to return to normal operations including any reconstruction or rebuilding (Esnard
& Sapat, 2014). When organizations created a DRP, they used all four components to
ensure that a business returned to operations within a reasonable amount of time. One of
the potential issues, however, was whether the data backup portion of such an operation
was viable.
Figure 2 illustrates the expected process for disaster recovery management. In
2009 in the United States, 43% of companies never reopened after a disaster, and 29%
failed within 3 years of reopening (Goldsborough, 2012). For businesses without a BCP,
80% failed within 2 years of a disaster (Goldsborough, 2012). In general, 85% of

10
businesses depended on information technology and information systems
(IT/WAS). Specifically, 60% of financial companies, 50% of service companies, and
40% of retailers were dependent on IT/WAS (Knox, 2012). Without IT/WAS, these
organizations were incapable of operating; therefore, they required an immediate
alternative means of operating (Knox, 2012).
Figure 2. Phases in emergency management – used with permission (Arizona Emergency Management, 2011, p. 2).
A DRP encompasses all the tools necessary to return to functionality, including
personnel coordination, alternate locations for operations, plan testing, and assignment of
responsibility (Nollau, 2009). DRP methodology for recovering from a disaster included
a backup plan, a BCP, and a contingency plan for downtime (Nollau, 2009). Nollau
(2009) and Engemann and Henderson (2012) agreed that a DRP focuses on the
restoration of technology to functionality before a disaster. A backup plan focuses on the
maintenance of company data and records stored in various on- or off-site media. A BCP
creates a map to restore business processes to their predisaster levels. A contingency plan

11
helps an organization move operations in case of a disaster, allowing the
business to operate temporarily in another location until the organization returns to
regular operations (Engemann & Henderson, 2012).
DRPs involve a process that incorporates teamwork, a designated leader, and a
sponsor. The sponsor initiates the DRP, which was designed by the business continuity
manager. The sponsor of the DRP is an executive responsible for the implementation of
the planning process. The business continuity manager (designated leader), meanwhile, is
responsible for ensuring the completion and frequent updates of the project (Hiatt, 2000).
Finally, a team is created to incorporate the various departments that would be affected
by a disaster. For example, the team includes senior managers who are knowledgeable
about the damaged facility, voice communication, and information technology personnel.
These senior managers lead the restoration process (Hiatt, 2000). Risk analysis includes
the identification of threats to assets and business functions. In such an analysis, all assets
are identified along with potential damage to the business if a particular asset fails due to
a disaster (Larrue, Kummer, Müller, & Bluhmki, 2011). The DRP is designed to include
various tasks and activities that help an organization return to regular operations after risk
assessment (Larrue et al., 2011) It is the responsibility of the business continuity manager
to consistently test the DRP and to keep it updated (Larrue et al., 2011). Finally, a plan
should be documented and implemented when a disaster occurs.
Many organizations confuse the DRP of the IT department with the DRP for the
entire organization, which is problematic. A DRP for the IT department usually

12
incorporates only information on data backup and does not include records
from other departments such as marketing (Nelson, 2011). All departments of the
organization are part of the DRP (Omar et al., 2011). In addition, a DRP must be updated
to address changes in hardware, software, personnel, and technology (Acosta, 2013;
Engemann & Henderson, 2012). Although the DRP of an organization varies depending
on the organization’s needs, the components of the plan that most organizations include
are the BCP, the backup plan, and the contingency plan (Habibullah et al., 2010).
Most organizations do not pay sufficient attention to the importance of a backup
plan (Guide, 2008), and many do not distinguish between a BCP and a DRP (Omar et al,
2011). A DRP includes human resources, facilities management, and the executive board,
in addition to basic disaster recovery methods (Omar et al., 2011). BCPs are continually
improving as organizations develop an understanding of the importance of a good backup
to continuing operations and allocate the resources needed to ensure that their data
backup is reliable. A company that creates a BCP that is merely a DRP is only addressing
the business’s IT needs and not the key personnel needed to run the organization
(Wallace & Webber, 2010). In the event of a disaster, the business will have to reorganize
from scratch, which could lead to failure.
Backup Theory
The terms backup and archive were used interchangeably in this study. A backup
is a snapshot of data at a particular time (Nelson, 2011), and the size of a backup changes
depending on the number of files it incorporates. There is a variety of backup methods

13
including full, differential, and incremental. A full backup copies all files on a
drive. A differential backup copies only files that have changed since the last full backup.
An incremental backup copies files that have changed since the last incremental or full
backup (Nelson, 2011).
An archive refers to the long-term storage of backup data. It is an original file
moved to another location. Archived data does not change over the long term and is
restored if necessary at a later date (Nelson, 2011). At the end of a backup cycle, the
unused data are copied to another medium and stored for long-term retention purposes. In
the long term, the data are stored offline or in house. Archives reduce the long-term need
for backup data. Popular locations for archived data backup include CD-ROMs/DVDs,
storage area networks (SANs), hard drives, and cloud backups. Cloud backups are the
most economical and convenient of all the methods due to the accessibility of the cloud
from remote locations (Omar et al., 2011).
Traditionally, data were copied from one medium to another. The first data
backups occurred in the 1950s and involved duplicating and storing punch cards for later
restoration (Nelson, 2011). Magnetic tapes replaced punch cards in the 1960s. Magnetic
tapes stored more data (10,000 punch cards per tape) and were not as volatile. Magnetic
tapes were widely used until the 1980s and are still in use today in some applications. In
the 1960s, the industry introduced floppy drives as an option for backing up files on a
smaller scale (EC-Council, 2011). Floppy drives for disk storage were used primarily for
computer-to-computer file exchanges. Small businesses and home users were the primary

14
benefactors of floppy disk storage and backup. However, backing up to floppy
disks required many disks, which were difficult to store and could easily fall out of order.
By 1979, compact discs (CDs) replaced floppy drives as the next storage medium,
and by 1990 CDs stored 740 MB of data (Nelson, 2011). Later, DVDs were introduced,
which allowed up to 4 GB of data on a single disk. Hard drives were the next media used
to back up data. In the 1960s and 1970s, hard drives were not large enough and were too
expensive for data backup. By the 1990s, however, hard drives increased in capacity, and
their prices dropped. This allowed for their use as viable locations for data backup and
redundant arrays of inexpensive disks (RAIDs), which were used to store data due to
their low cost and high storage capabilities.
Network and online data storage systems were the next methods for storing
backup data. Local area networks (LANs) and wide area networks (WANs) allowed
backup to remote locations. By 1992, network-attached storage (NAS) had become
popular, along with storage area networks (SANs) using high-speed immediate backup
for larger enterprises (Nelson, 2011; Purushothaman & Abburu, 2012). SANs were very
effective because they allowed connection to remote targets such as hard drives and tapes
on a network.
Six Sigma is used in a variety of environments and for a variety of applications,
including standardizing data backup systems. A Six Sigma backup system features a
multitude of components including technologies, processes, people, documentation,
service-level agreements, and testing (deGuise, 2008). The need for such a backup
15
process is important because the amount of data that organizations store
increases each year. Companies began to specialize in such data backup systems as
Exabyte in the 1970s, Remote Backup Systems in 1987, IBM Tivoli in 1993, and
Veritas/Symantec in the 1990s. CommVault, EVault, Acronis, Arkeia, Carbonite, Dell
Backup, and more have been created to meet growing demand.
The typical backup operator backs up data without incident. However, when
everything is working, management tends to perceive the backup operator as a drain on
resources with no income-generating purpose. Backups then remain dormant until a
disaster occurs, at which point their job becomes critical (Symantec, 2012). The job of
the backup operator is “invisible,” especially when everything is working properly
(Nelson, 2011). The ability to use a quality management measurement program that
shows how important backups are to an organization is vital to that organization’s long-
term survival. Technology is the most automated and easy-to-manage part of a backup
system (deGuise, 2008). Conversely, human interaction is the most detrimental to a
backup system, even when people minimize the amount of time spent interacting with the
system (deGuise, 2008).
Organizations must develop a backup plan and not just use a series of backup
software products (deGuise, 2008). Data that are backed up must be consistent and not
skipped over (deGuise, 2008). An organization must address policies, procedures, people,
and attitudes to ensure that the backup plan is high quality, redundant, consistent, and
functional (deGuise, 2008). Redundancy refers to protecting the data through its storage

16
in a variety of locations (Nollau, 2009). Examples of redundancy include
conducting data backup in a local area and repeating the same backup on the cloud and
on an external physical drive.
One organization that uses such a system is Gateway Community and Technical
College. Its servers are backed up to remote locations, and local copies are available in
case of disaster. If one location fails, a secondary location is available to restore the data.
One of the best ways to ensure that a backup plan succeeds is to train personnel in
properly backing up, storing, and retrieving the data (deGuise, 2008).
In addition, any backup plan needs a corresponding recovery plan (Nelson, 2011).
The goal of data backup is error-free operation, but due to factors not under an
administrator’s control, this goal is sometimes not achieved (deGuise, 2008). Data
backup personnel must constantly design, redesign, and test the backup (EC-Council,
2011). Backed up data are stored off-site to protect them for retrieval in the event of a
disaster (EC-Council, 2011).
Toigo (2013) explored how the need for data backup had existed for a long
period. The duplication of books and manuscripts by hand was a long and tedious
process. The need to duplicate electronic data is the current emphasis in backup theory.
The basis for the backup of data is the ability to recover data at a moment’s notice
(Toigo, 2013). Organizations access and retrieve backed up data from the storage location
or entity. Hurricane Katrina devastated many businesses in the Gulf Coast, but
organizations that backed up data in remote locations accessed their data with new

17
computer equipment (Alliance Storage Technologies, 2007). Hospitals in the
region lost data, but a combination of optical drives and remote recovery allowed these
organizations to recover.
A DRP is incomplete if there is no provision for data backup (deGuise, 2008).
Data are backed up internally and frequently for control and protection (Nelson, 2011).
An organization that has control over its data and does not depend on a vendor for its
backup system is likely to recover more quickly than one that does not have control
(deGuise, 2008; Nelson 2011). In addition, industry-standard software is important for
restoration. Standardized software is easier to maintain and is cross compatible with other
programs (Nelson, 2011).
There are three general types of data backup strategies in the computer
environment. The first is a full backup of all data on specific media (deGuise, 2008;
Whitman & Mattord, 2011. The second is incremental, where backup files are changed
on the same day (deGuise, 2008; Whitman & Mattord, 2011). The third is differential
including all files changed since a previous archived full backup (deGuise, 2008; Nelson
2011). Traditionally, data were backed up to tape, USB, CD, DVD, or even a SAN.
However, the size of the backup determined what media to use (Nelson, 2011).
A suggested backup schedule includes backing up before the end-of-day
processing, after the end-of-day processing, before special processing, after system
initialization, or throughout the day. Because not all organizations have the ability to
follow these suggestions, implementing a backup at the most critical points is ideal

18
(Nelson, 2011). Whitman, Mattord, and Green (2013) explained the various
types of RAID backup methods, of which there are eight basic types:
• RAID Level 0 (not redundant) writes data across multiple disks. This
particular type of backup is not beneficial because the failure of a single drive
makes the entire backup invalid.
• RAID Level 1 is a mirrored duplicate of a second drive. If a failure occurs, the
second drive is used to recover data.
• RAID Levels 2, 3, 4, and 5 are striping RAIDs (data written across multiple
disks), so that the data can be recovered when a failure arises by using the
remaining drives to reconstruct it.
• RAID Level 7 (not widely used) is a variation of RAID 5 that uses RAID 5
technology with special software.
• The remaining RAIDs are combinations of the first five types, where the
numbers were added together. For example, RAID 6 is a combination of
RAID 1 and RAID 5, and RAID 10 is a combination of RAID 1 and RAID 0
(Whitman et al., 2013).
Instead of backing up data to tape and storing it to a RAID, data backup personnel
use network-attached storage (NAS) or a SAN. The backup options differences are
outlined in Table 1. NAS uses file sharing to transfer files through TCP/IP to an online
storage environment like a RAID. A SAN, by contrast, uses fiber optics to transfer data to
a storage network to compensate for systems that require additional storage on most high-
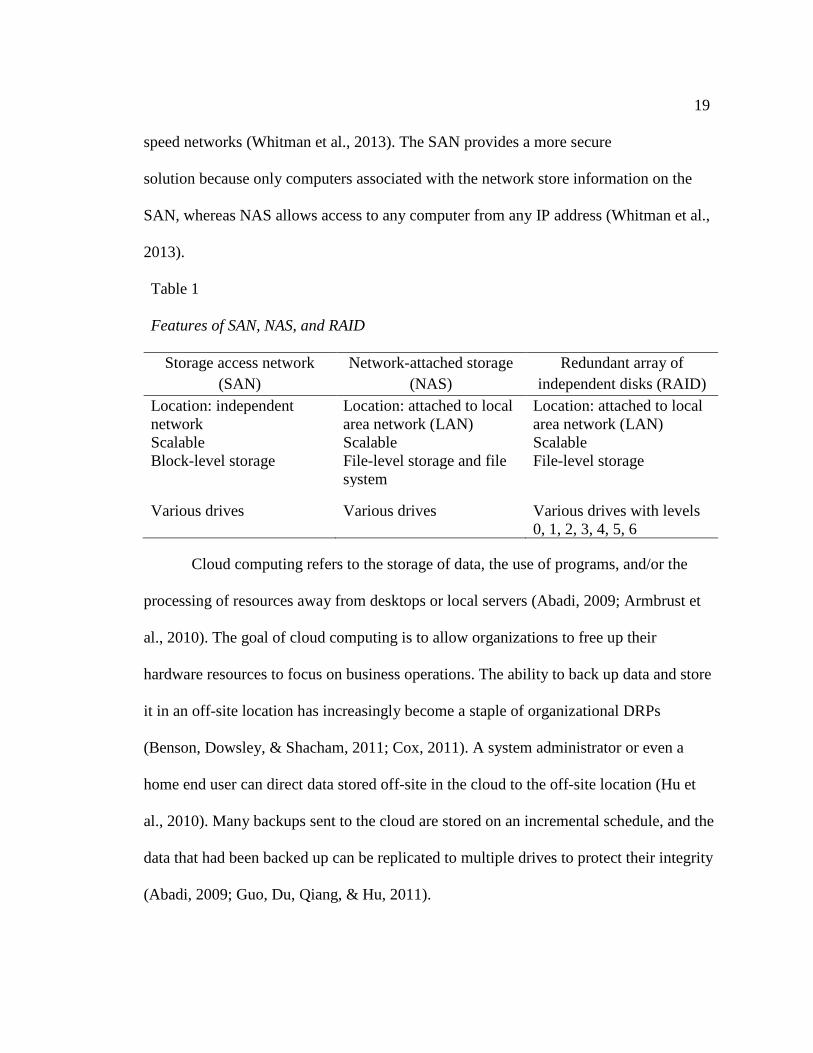
19
speed networks (Whitman et al., 2013). The SAN provides a more secure
solution because only computers associated with the network store information on the
SAN, whereas NAS allows access to any computer from any IP address (Whitman et al.,
2013).
Table 1
Features of SAN, NAS, and RAID
Storage access network (SAN)
Network-attached storage (NAS)
Redundant array of independent disks (RAID)
Location: independent network
Location: attached to local area network (LAN)
Location: attached to local area network (LAN)
Scalable Scalable Scalable Block-level storage File-level storage and file
system File-level storage
Various drives Various drives Various drives with levels 0, 1, 2, 3, 4, 5, 6
Cloud computing refers to the storage of data, the use of programs, and/or the
processing of resources away from desktops or local servers (Abadi, 2009; Armbrust et
al., 2010). The goal of cloud computing is to allow organizations to free up their
hardware resources to focus on business operations. The ability to back up data and store
it in an off-site location has increasingly become a staple of organizational DRPs
(Benson, Dowsley, & Shacham, 2011; Cox, 2011). A system administrator or even a
home end user can direct data stored off-site in the cloud to the off-site location (Hu et
al., 2010). Many backups sent to the cloud are stored on an incremental schedule, and the
data that had been backed up can be replicated to multiple drives to protect their integrity
(Abadi, 2009; Guo, Du, Qiang, & Hu, 2011).

20
Each backup method is responsible for recording data to a tape, CD,
hard drive, SAN, or cloud. Files are either backed up or skipped. Skipped files are points
of failure. Measuring the failure or success of a backup through the use of Six Sigma may
help create a standardized system. A measurement system that uses Six Sigma
mathematical calculations emphasizes the need for perfection, which requires a
managerial understanding of the importance of data backup to an organization’s success.
Quality Theories
Quality theories are the basis for Six Sigma. Five quality theorists, Crosby (1984),
Deming (1986), Goldratt (1990), Altshuller (1994), and Juran (1989) as cited in Pyzdek
(2003) who created the Six Sigma quality measurement system which is used worldwide.
Their contributions to Six Sigma are described in Table 2.

21
Table 2
Quality Management Theorist
Crosby Zero Defects Doing It Right the First Time (DRIFT) 14 Step Process
Deming 14 Step System of Profound Knowledge Best Process – Least Expensive
Altshuller Inventive Problem Solving Systematic Innovation
Juran Total Quality Management (TQM) Cross Functional Teams Improve Quality
Goldratt Theory of Constraints Repair - Optimization
Crosby (1984) created the zero-defects quality management method to eliminate
errors and improve quality. Crosby believed that quality is achieved through a 14-step
process. When no defects exist, it is easier and less expensive for a company to produce a
quality product. According to Crosby (1984), the second aspect of eliminating poor
quality is doing it right the first time (DRIFT). DRIFT referred to just-in-time inventory
systems, which perform the manufacturing processes correctly, thereby eliminating
defects and delays in production. General Motors, for instance, used the principles of
DRIFT in its manufacturing processes (Crosby, 2005). Because General Motors plants in
the United States receive parts from different locations and assemble them into vehicles,
rigorous manufacturing standards for the parts ensure that there are minimal defects
before delivery. Crosby (1984) stated when defects are minimal, it creates a new standard
called “zero defects.” The system of zero defects (Crosby, 1984) requires an
22
understanding of the total process, knowledgeable management and staff, and
an in-depth understanding of human nature.
The system of profound knowledge was one of the first quality management
programs in many organizations. Developed by Deming (1986), it compared processes
and determined which ones were the best and least expensive while still producing the
desired results. There were 14 steps in the system of profound knowledge:
1. Create constancy of purpose toward the improvement of products and services
with the aim of becoming competitive, staying in business, and providing
jobs.
2. Create change, allowing Western managers to learn their responsibilities and
take on leadership.
3. Cease dependence on inspection to achieve quality.
4. End the practice of awarding businesses based on price and instead focus on
minimizing total cost.
5. Constantly improve the system of production and service in order to improve
quality and productivity and decrease costs.
6. Institute training on the job.
7. Institute leadership and drive out fear.
8. Break down barriers between departments.
9. Eliminate slogans, exhortations, and targets asking for zero defects and new
levels of productivity.

23
10. Eliminate work standards (quotas) on the factory floor.
11. Eliminate management by objective, management by numbers, and numerical
goals.
12. Remove barriers that rob the hourly worker of his or her right to pride of
workmanship and remove barriers that rob people in management and
engineering of their right to pride of workmanship.
13. Institute a vigorous program of education and self-improvement.
14. Put everybody in the company to work to accomplish the transformation.
(Deming, 1986, pp. 23-24)
Goldratt (1990) developed the theory of constraints to help eliminate issues
regarding lack of optimization. Goldratt (1990) developed a way to relieve bottlenecks or
delays in the manufacturing process. Goldratt (1990) explained that plants pulled
materials through the process of pushing them in, thereby relieving the constraint
(bottleneck) in the manufacturing process. This was the drum-buffer-rope methodology.
The drum was the problem or constraint, the buffer protected the drum and encouraged
the flow of work, and the rope was the release of work from the plant. If the rope released
too much work, it created a bottleneck. According to Goldratt (1990), working under
constraints to control bottlenecks was the most desirable approach to this problem.
A project manager who used the theory of constraints to discover opportunities
that were relevant to a project used those opportunities to make the items flow through
the system rather than forcing them through. Goldratt (1990) emphasized that all systems

24
must have goals. The prominent theme of the theory of constraints had three
levels: global, sub, and local. In addition, all systems needed a standard of measurement
to determine the effects of the various goals of the project. Goldratt found that when a
system constraint was contained or eliminated, the organization benefitted because the
constraint was usually a small issue that created a large problem.
Another quality program was the theory of inventive problem solving (TRIZ),
also known as systematic innovation. TRIZ solved problems presented in various
manufacturing environments. A cumbersome process did not always provide solutions
and after many years of traditional problem solving. Altshuller (1994) concluded there
was a standardized way to solve problems. TRIZ methodically resolved problems through
the application of innovative solutions for an ideal design. Contradictions helped to solve
problems and the innovative process was structured systematically.
Total quality management (TQM), founded by Juran (1989), required
organizations to allow management to play a significant role in managing quality control.
Juran developed the quality trilogy that helped management improve the quality of an
organization. Companies that use TQM must examine their organization as a whole to
enact the process. TQM means achieving quality regarding all functions of the enterprise.
This includes the interaction between all components of an organization as well as the
components themselves (Hafeez, Malak, & Abdelmeguid, 2006). Quality referred to
meeting the needs of the customer and being free from deficiencies (Juran J. , 1992).

25
Six Sigma
Six Sigma, created by Pyzdek (2003), was based on studies of Japanese
organizations such as Motorola showing that their quality processes were significantly
better than those of U.S. organizations. Six Sigma is a data-driven approach to quality
management derived from North American TQM that works to eliminate defects in
various processes. The original TQM quality standards did not follow all 14 steps for
TQM as suggested by Deming (1994). TQM and the elimination of special causes led to
initial improvements, but eventually these stagnated and innovation decreased. It was not
enough to maintain manufacturing or product leadership levels (Kemp, 2006). For
companies that failed in the effort to achieve a high level of quality, Six Sigma provided
a method to repair the damaged relationship between quality improvement and defect
reduction.
The interrelated theories of Juran (1994), Deming (1986), Goldratt (1990),
Pyzdek (2003), Altshuller (1994), and Crosby (1989) provided the foundation for Six
Sigma. Originally, Six Sigma was designed for manufacturing processes. It was widely
used in service organizations to monitor business management processes. However,
companies were not part of the certification process: only individuals within the
organization could participate. Six Sigma had two levels of certification: green belt and
black belt. A green belt was responsible for supporting Six Sigma projects, and a black
belt was responsible for managing them. Green belts had the responsibility of leading
teams and delivering Six Sigma techniques. Green belts worked on smaller projects that

26
were directly assigned by the black belts. Black belts were team leaders who
used Six Sigma tools but delegated responsibilities to team members.
Six Sigma emphasizes continuous improvement, controls, and top management
commitment to improving quality and reducing costs within an organization. Businesses
achieve certification from Six Sigma through a rigorous and standardized statistical
analysis of performance processes. Organizations strive to achieve Six Sigma quality and
must not exceed 3.4 defects per million opportunities (Aboelmaged, 2010; Goh, 2011;
Pyzdek & Keller, 2014). A single sigma is 690,000 defects per million opportunities or
one standard deviation from the mean. The greater the number of standard deviations
between the mean and the nearest specification, the lower the number of sigmas (see
Figure 3). Anything less than six standard deviations does not meet the Six Sigma
standard of quality (Gabor & Muntenau, 2010; Goh, 2011; Pyzdek & Keller, 2014).

27
Figure 3. Six Sigma process and standard deviations away from the mean.
The popularity of Six Sigma allowed it to spread from manufacturing to other
industries that wished to improve customer service and quality assurance processes
(Pyzdek & Keller, 2014). Organizations such as Honeywell and General Electric used Six
Sigma to reduce costs and improve quality. Because Six Sigma was one of the highest
standards for measuring quality (Juran, 1994), it constituted an appropriate resource to
measure the efficiency and quality of disaster recovery methods.
There are many sigma levels for a project: 4α is 6,210 defects per million
opportunities; 5α, 233 defects per million; and 6α, 3.4 defects per million opportunities (
(Pyzdek T. , 2003). The goal is to achieve a Six Sigma level for many of the individual
processes in the organization. There are two methodologies used in Six Sigma to create
change: (a) define, measure, analyze, improve, and control (DMAIC); and (b) design,

28
measure, analyze, design, and verify (DMADV) (Pyzdek & Keller, 2014). In a
disaster recovery scenario, either of these methodologies is used as a foundation to
develop a way to measure the quality of a plan. These methodologies make the plan more
efficient by decreasing the number of its defects. The use of Six Sigma as the basis for a
backup performance indicator is addressed in the literature review in Chapter 2.
Nature of the Study
I conducted a quantitative study to examine the need for a backup performance
indicator to evaluate data backup conditions. The instrument was an industry-designed
quantitative survey featuring multiple-choice, yes/no, and Likert-scale questions.
Selected information technology professionals in the Greater Cincinnati area took the
survey. The dependent variable was the need for a data backup performance indicator,
and the independent variables were the implementation of the data backup, data backup
quality, and data backup confidence. These variables were analyzed using binary logistic
regression to predict if a business would indicate a yes or no regarding the independent
variable.
Definitions of Terms
Backup confidence: The level of certainty that data are accurately copied from a
storage medium (e.g., a CD, hard drive, tape, or cloud) to a remote medium (e.g., a CD,
hard drive, tape, or cloud). This variable was measured using multiple choice responses
(deGuise, 2008).

29
Backup quality: The standard of measurement for the manual or
automatic electronic process of copying data files from a storage medium (CD, hard
drive, tape, cloud) to a remote medium (CD, hard drive, tape, cloud) (deGuise, 2008).
This variable was measured using the measures of high quality, moderately high quality,
medium quality, moderately low quality, or low quality calculated using a Likert scale of
1 = very satisfied to 5 = very dissatisfied.
Cloud backup: A method of backing up data to a remote location to use for
restoration if computer software fails (Waters, 2011).
Data backup: The copying of files from one medium (e.g., a hard drive) to
another medium (e.g., a CD, hard drive, tape, or cloud) to preserve data for future
retrieval or storage. It was measured using multiple choice responses (deGuise, 2008).
Define, Measure, Analyze, Improve, Control (DMAIC) and Define, Measure,
Analyze, Design, Verify (DMADV): Project methodologies used in Six Sigma to clarify
goals through a systematic 5-phase process (Pyzdek & Keller, 2014).
Need for a data backup performance indicator: The perceived standard of
measurement applied to a single data backup session in which data are copied from a CD,
hard drive, tape, or cloud and stored on another CD, hard drive, tape, or cloud. It was
measured using six responses (daily, weekly, monthly, twice per year, annually, or
never).

30
Six Sigma: A quality management program that helps management
minimize defects in processes by attempting to achieve fewer than 3.4 defects per million
units (Pyzdek & Keller, 2014).
Total quality management (TQM): The process of continuous improvement of the
quality of products or processes through incremental changes in management, employees,
suppliers, and customers (Juran & Godfrey, 1999).
Scope of the Study
This study was limited to a population of 594 small businesses with 15 to 250
employees in the Greater Cincinnati area. The scope was small but it provided valuable
information about the universal need for data backup measurement. Organizations,
regardless of size, should back up their data because the failure of data restoration in a
large organization can have a severe impact (deGuise, 2008). Regardless of the number
of files, the integrity of a backup is crucial, and the ability to measure it may be the
difference between success and failure.
Assumptions of the Study
There were five assumptions in the study that were relevant to the outcome:
1. The organizations selected had access to summary logs of the data backup.
2. There was a single point of data backup.
3. The organizations coveted their backup information because it contains
sensitive data; therefore, they were reluctant to reveal it to an outside source
without some assurance of data protection and confidentiality.

31
4. The length of the survey was sufficient to gather the necessary
data.
5. Yes/no, multiple choice, Likert scale, and fill-in the blank questions with
percentages assigned were adequate for recording the participants’ responses.
Limitations of the Study
The limitations of this study were as follows:
1. The study depended on the availability of businesses with 15 to 250
employees. This can vary depending on the location where the study would be
conducted.
2. The use of organizations with 15 to 250 employees ensured the relevant data
were easily gathered. Larger organizations could possibly require additional
permissions.
3. The number of files backed up in these organizations was less than in larger
organizations, but the results were generalizable.
4. A quantitative study was used to capture data in a limited moment, and
generalizability was supported by additional studies (Leedy & Ormond, 2013;
Yin, 2012).
Significance of the Study
The results of this study may help organizations understand the importance of
having a backup performance indicator for data backup to improve business continuity.
When managers understand the importance of data backup, profitability and productivity

32
improve (deGuise, 2008). Organizations that use Six Sigma may find the
information in this study valuable to their bottom line. This measurement tool is expected
to become a standard for all industries that use data backups. For this reason, it is
important for management to understand data backup and not to rely solely on the IT
department to provide an accurate measurement.
Summary and Transition
Accurate and reliable data backup is crucial for an organization to recover from a
disaster. Many times, organizations do not return to profitability after a disaster due to the
poor restoration of data (EC-Council, 2011). The ability to measure the integrity of the
data backup increases the probability of recovering from a disaster or a computer failure,
so it was important to determine whether a data backup measurement system was needed.
There are a variety of data backup options available, including copy-to-tape, CD, NAS,
SAN, and RAID. Symantec (2011) conducted a survey of organizations and found that
many of these did not properly back up or quantify the results. Based on these results, I
surveyed 107 small businesses regarding their views of a data backup measurement
system to determine whether it was for IT personnel to measure the outcome of data
backups. Chapter 2 provides a broad background on data backup, backup systems, Six
Sigma, the uses of Six Sigma in IT, DRPs, methods, and the mathematical application of
Six Sigma. The review of the literature provides background for the study and indicates
the gaps in the literature concerning data backup measurement.

33
Chapter 2: Literature Review
The introduction provided an overview of the research, which included an
introduction to Six Sigma, DRPs, and backup methods. The purpose of this study was to
use quantitative methods to evaluate the need for a data backup performance indicator
based on Six Sigma principles that explain the condition of the data backup for small
business organizations with 15 to 250 employees. In this chapter, I discuss the relevant
literature and describe the gap on data backup performance indicator measurements. I
used EBSCO and ProQuest databases to conduct the literature review. The key words
used included disaster recovery, disaster recovery planning, data recovery, business
continuity plans, Six Sigma, Six Sigma backup, file backup, backup theory, data backup,
quality, quality theory, DMAIC, and DMADV. The literature review is organized into
three sections: DRPs, Six Sigma, and data backup.
Gap in the Literature
There were current gaps in the literature regarding disaster recovery plans, data
backup methods, and quality control in relation to the validity and measurement of data
backup methods and the creation of a backup theory. In the literature, disaster recovery
plans were detailed, and they included methods for maintaining business continuity, risk
assessment, and the explanation of information technology data backup plans. The data
backup methods covered in detail in the literature included types and frequency, but not
the measurement of data backup outcomes. Various quality control methods emphasized
in the implementation of disaster recovery plans were not applied to data backup or data

34
backup measurement. The gap in the literature left open the option to include
a new and improved way to emphasize backup theory, quality control, and data backup
performance indicators (Figure 4).
Figure 4. Major themes of literature review.
Quality Theories
Quality theories like TQM, TRIZ, theory of constraints, and Six Sigma focus on
making products better through examining flaws in the production or delivery process.
The lack of a direct link of quality theories to disaster recovery or backup methods forced
organizations to prove that their data were protected and easily recoverable. The literature
did not include empirical studies that linked quality control to data backup or data
recovery. Therefore, empirical studies in this area were warranted.
Backup Methods and Backup Theory
There was a variety of data backup methods published, both scholarly and
nonscholarly. The need for data backup using full, incremental, differential, and cloud

35
methods was addressed in the literature. The process was emphasized, but not
the quality. Emphasis on measurement or validation of these backup methods was
missing. In addition, researchers did not combine these backup methods into a backup
theory.
Disaster Recovery Planning
Disaster recovery planning included a variety of options that organizations can
use to protect their business. These plans included the need for business continuity (BC)
and risk assessment (RA), but they did not place major emphasis on data recovery or
backup methods. The literature indicated that a backup method was included, but it did
not address the overall importance of one, the need for validation, or measurement of the
backup.
Disaster Recovery Plans
Businesses prefer to prevent disaster, but it is virtually impossible to determine
when and where a disaster will occur. A disaster directly affects job performance,
confidence, families, and personal health (Karim, 2011). Disaster recovery planning is an
IT process that determines an organization’s ability to recover from a natural or human
disaster (Toigo, 2013). Natural disasters including earthquakes, floods, dust storms,
excessive temperature, fire, magnetic storms, tornadoes, and hurricanes are
environmental and result in damage to property and loss of life. Human disasters include
cyber attacks, acts of terrorism, electrical sabotage, human error, negligence, and
ignorance, which can originate from an internal or external source (Kadlec & Shropshire,

36
2010; Toigo, 2013). Both types of disasters halt business operations for a
significant amount of time and result in catastrophic losses.
The EC-Council (2011) and Toigo (2013) agreed that a disaster is a harmful event
that negatively affects organizations by decreasing their ability to achieve business
objectives. Disasters also cause high mortality regardless of whether they are natural or
unnatural. Disasters are isolated events warranting responses from government entities or
relief agencies (Rahman, 2012). As disasters increase, even with human intervention, the
human losses increase as well. A disaster may be small or large, ranging from electrical
failure to catastrophic data loss (Toigo, 2013). The E-Council (2011) stated that the most
devastating disasters are those of external origin. Abadi (2009) found that human error
comprised 43% of disasters including power outages (39%) and natural disasters (9%).
Software failed 37% of the time, virus and hackers infiltrated systems 26% of the time,
natural disasters caused 14% of all damage, and internal incidents caused 13% of all
damage (Al-Badi, Ashrafi, Al-Majeeni, & Mayhew, 2009). The EC-Council (2011)
reported statistics similar to those of Al-Badi et al. (2009), stating that out of 500 cases
surveyed, 73% of attacks were external, and 18% were from internal sources. There are
many parts of the U.S. infrastructure that are in disrepair, such as the nation’s highways
and railroads. In the event of a disaster, these sections of infrastructure are subject to
collapse (Egli, 2013). Given these circumstances, organizations must make DRPs a
priority instead of hoping for the best.

37
In 2011, natural disasters cost the United States over $55 billion (Egli,
2013). Events like Hurricane Katrina, the Haiti Earthquake, and the Deepwater Horizon
Oil Spill showed the United States was unprepared for a major disaster (Egli, 2013). The
methods used to evaluate disasters were antiquated. “A disaster was evaluated based on
the nature of risk rather than uncertain physical threats” (Egli, 2013, p. 40). The United
States, however, tends to be reactive to disasters and needs to change its method of
preparedness (Egli, 2013).
A DRP is part of business continuity management and includes business impact
analysis (BIA) and risk assessment provisions for testing and creating an information
technology plan (ITP) (Aggelinos & Katsikas, 2011; Piya, 2011). As part of this plan, a
BIA reviews the importance of business activities by assessing impact over time and how
detrimental it would be if they were interrupted (Engemann & Henderson, 2012). There
are six objectives to BIA:
1. Determine the priority of the objectives of the organization.
2. Determine the critical deliverables of the organization.
3. Identify the critical resources required by the deliverables.
4. Determine the impact, over time, of disruptions.
5. Determine resumption time frames for critical operations following
disruptions.
6. Provide information from which appropriate recovery strategies can be
determined (Engemann & Henderson, 2012, p. 22).

38
Part of the BIA is the recovery time objective, which is the point in time when
the organization will return to operations. Returning to operations with gradual
momentum is imperative to a proper focus on recovery (Aggelinos & Katsikas, 2011;
Beggan, 2011). Risk analysis identifies events and causes, along with the estimation of
the probability of occurrence while comparing the levels of risk with established
standards (Beggan, 2011). The steps to RA are as follows:
1. Identify significant threats to critical operations.
2. Identify and evaluate controls.
3. Estimate event probabilities.
4. Estimate impacts.
5. Determine a risk measure combining impact and probability.
6. Prioritize tasks (Beggan, 2011).
The assessor was required to prioritize the most significant threats and then include them
in the DRP (Boyd, Chambers, French, & King, 2014). Normally the most important
business operations dictated the plan. An information technology plan was in one of the
sources, but the other journal articles were amiss at mentioning its incorporation as an
important element. The basis for the information technology plan (ITP) included the
provision for an alternative site were data center controls, a data center recovery plan, an
information management plan, and an information security plan (Engemann &
Henderson, 2012, p. 72). This portion of a DRP was a collaborative effort and based on
BIA and RA suggestions from other parts of the plan.

39
It was important to make decisions about the construction and
implementation of the DRP, such as whether the plan was outsourced or made in-house,
where to store important data, rules that force the implementation of the plan, actual costs
to implement the plan, and whether the organization was ready to implement the plan
(Aggelinos & Katsikas, 2011). Small and medium businesses did not have the resources
to support large DRPs. There was a recommendation to use up to 25% of the budget to
support the DRP (Aggelinos & Katsikas, 2011; Boyd, Chambers, French, & King, 2014).
Larger firms, however, had the advantage of the economy of scale. Choosing to create a
DRP in-house or outsourcing it depended on the personnel in the organization (Guster,
2012). The benefits of an in-house plan included full control, flexibility, the ease of
access, and security. Outsourcing, however, was a possibility when an organization did
not have the time to create the DRP and did not have the internal resources to do so.
Sometimes, these organizations were not knowledgeable about their IT infrastructures.
The benefits of an outsourced DRP were speed of creation, lower cost, and shorter
implementation. Internal DRPs took up to 90 days, and an external DRPs took around 30
days to create (Guster, 2012). Just because an organization had a DRP, did not mean it
should implement it. At a minimum, organizations that use these principles in their DRP
had a higher probability of returning to operations more quickly than those that had not
incorporated BIA, RA, and ITP.

40
Crisis Examples and DRP Usage
Western Digital experienced a crisis on October 14, 2011, due to flooding in
Bangkok, Thailand. Within 46 days after the crisis, Western Digital returned to
operations because of its DRP. There were four factors that contributed Western Digital’s
return to operations: people and leadership, strong cash position, stakeholder support, and
supplier mitigation (Lau, 2013). Western Digital had a well-rehearsed disaster plan.
Management and employees received disaster preparedness training. It was imperative
that a disaster plan was practiced and implemented as smoothly as possible (Al-Badi,
Ashrafi, Al-Majeeni, & Mayhew, 2009). Lamar University experienced two different
hurricanes that affected their operations in 2005 and 2008. Many academic organizations
had ignored the need for a DRP and did not anticipate that they would experience, like
Lamar a second disaster so close to the first. In 2005, only 50% of academic
organizations reported having an information technology disaster recovery plan. In 2010,
that number increased to 65%, but there was still a long way to go (Beggan, 2011).
Academic institutions had a very narrow view of crisis management. Since the first
hurricane in 2005, Lamar University developed a comprehensive DRP in 2006 and tested
it often. A communication plan was included in the new DRP since the university
experienced a problem with communication in the first disaster. Lamar University
learned that it was important to train personnel and identify emergency response
personnel, identify a command and control facility, develop relations with disaster
recovery experts, take pictures, secure sensitive data, and establish a clear chain of

41
command and alternate communication, backup, and computer data storage
systems (Beggan, 2011)
Malaysia was devastated by the tsunami in 2004 and had to implement its disaster
recovery plan (DRP), which was far from adequate (Rahman, 2012). A DRP existed
before the disaster but the country did not practice using the plan. Since the disaster, the
Malaysian government wrote Directive 20, which created guidelines for a disaster plan
implementation. The implementation of the DRP increased the confidence of citizens in
the government in case of the next disaster. The program created three levels that
communicated the severity and the population were more at ease with an understanding
that the government was better prepared.
Bantul, Indonesia devastated by an earthquake in 2006 and did not have an
appropriate DRP. The National Action Plan did not exist in Indonesia. The level of
destruction and lack of DRP readiness made it difficult for the city return to operations
(Kusumasari & Alam, 2012; Seyedin, Ryan, & Keshtgar, 2011). The local government
asked for outside assistance during the recovery efforts. During the recovery, the city
used more local resources and community help, but at the same time, there was a lack of
understanding by the local government as to how it should return to operations. The city
government had since created a DRP that established a strong relationship between the
community and the government.

42
Difference Between Disaster Recovery Plans and Business Continuity
Plans
Many organizations had not distinguished between BCPs and DRPs, which had
directly affected their potential for disaster recovery. Many times, BCPs were combined
with IT department recovery plans under the assumption that the data backup was
sufficient (Omar, Alijani, & Mason, 2011). A BCP ensures that after a disaster a business
can continue operations at an alternate location for a period. A DRP, which was part of a
BCP, was designed to bring a business back to immediate operations at the current
location after a disaster until the BCP can be initiated (Kadlec & Shropshire, 2010;
Krauss, Rubenstein, & Crocker, 2014; Stanciu, Pana, & Bran, 2010). It focuses on a
specific facility, whereas the BCP focuses on the entire business and what was needed to
return to operations (Arduini & Marabito, 2010; Omar, Alijani, & Mason, 2011; Pinta,
2011). Confusion had caused many businesses to make the DRP and BCP all one
document. However, the documents must remain separate because they had two distinct
purposes. Kadlec and Shropshire (2010) and Seyedin, Ryan & Keshtgar (2011) agreed
that a combination of a BCP and DRP was essential to returning an organization to
operations because it contains plans for continuity and survival. If there were no plan, the
business would not have a road map. DRPs were not always error proof, but it was
important to have a plan that assisted in the resumption of business (Al-Badi, Ashrafi, Al-
Majeeni, & Mayhew, 2009). Without a DRP, a business may never return to operations.

43
Ernst and Young (2011) reported that of the 1,700 corporations that
responded to the Global Security Survey, 72% had experienced increased risks from
external factors and internal vulnerabilities. Organizations that lose a large amount of
data did not re-open and those that try to reopen within a one-month period had closed
(Gartner Group, 2013). These organizations did not have a proper DRP that could had led
them to return to operations.
Gartner (2013) explained that 45% of the organizations surveyed were in the
process of updating their DRPs while 25% of organizations surveyed (n=110) had not or
did not have plans in the next year to updated their DRP’s. This represented an increase
from past years, but there was room for improvement. Gartner Incorporated, in 2010,
reported that only 10% of small and medium-size businesses completed a DRP (Knox,
2012). Kadlec and Shropshire (2010) explained that 60% of U.S. companies in 2010 did
not have a DRP. Al-Badi (2009) reported that 50%–55% of businesses in Australia did
not have a DRP and that, in the United Kingdom, many managers admitted that there was
no DRP in place. Among business that had created a plan, their DRPs were inconsistent
or complicated or the organization did not have the resources to devote to them (Kadlec
& Shropshire, 2010; Pinta, 2011; Toigo, 2013). Still, in 2011, only 52% of respondents in
the Ernst and Young 2011 Global Information Security Survey had a DRP and security
strategy (Ernst and Young, 2011).
44
9/11 and Disaster Recovery Plan Readiness
The 9/11 attacks tested the readiness of American businesses. Many businesses
felt that because they had weathered Y2K, they could handle another threat. Castillo
(2004) explained that organizations were not prepared with the proper DRP or BCP to
cope with 9/11. The attacks changed the requirements of DRPs from optional to
mandatory (Karim, 2011; Omar, Alijani, & Mason, 2011), but this overconfidence left
American businesses vulnerable. Even in 2011, most businesses still had not completed a
proper DRP to ensure recovery. Some organizations, however, had become proactive
regarding disaster planning, and DRPs had become part of the regulations of many
industries. Disaster management personnel were very specialized regarding their
knowledge areas, but they did not have the expanded information necessary to handle
other geographies or infrastructures (Egli, 2013; Krauss, Rubenstein, & Crocker, 2014).
Agencies focused on narrow portions of the business and miss the need to understand
how their infrastructure or organization was inter-connected to so many other entities.
Boeing’s experiences showed an example of the need for a comprehensive,
successful DRP after 9/11. The company had to reevaluate its plan as the various
businesses it contained were inconsistent regarding their DRPs and BCPs (Castillo,
2004). The plans in place coped with the loss of data but did not address problems related
to losing key personnel and infrastructure. The resumption of business without key
personnel or infrastructure was detrimental to the organization. The opposite was true for
Lucent Technologies during the 9/11 disaster recovery period. The attacks forced Lucent

45
to move operations from New York and restart them in another city. The
difference between Boeing and Lucent was that Lucent was prepared and Boeing was
not. Lucent was operational within seven days of the disaster because it realized that it
had to constantly update and change its DRP (Tura, Reilly, Narasimhan, & Yin, 2004).
Items that changed due to technology, personnel, and infrastructure prompted the
organization to change its DRP.
Responsibility for the Disaster Recovery Plan
IT management was responsible for the creation of a DRP. In the past, if an
organization did not feel that a plan was necessary, the DRP was not a priority, and many
organizations did not provide the financial or employee support to ensure the success of
the DRP (Reddick, 2011). The greater the likelihood of a disaster, the more an
organization was willing to invest in a DRP. Organizations with computer-based
functions should have a plan to protect their resources. However, less than half of
organizations surveyed (49%) were satisfied with their DRPs and security plan (Ernst and
Young, 2011). Reports about the number of DRPs conflicted, but they stated the same
thing: many businesses had not created a DRP.
An organization’s size was not a factor regarding the creation of a DRP, but DRPs
constantly change due to organizational transformations and advances in technology. At a
minimum, a DRP was easy to use, distributed to all, and should detail responsibilities.
The team that creates the DRP was aware of the tools available for disaster recovery,
identify the threat, back up the data, and ensure that off-site and outline recovery options

46
(Guy & Lownes-Jackson, 2010). These basic options were critical to ensuring
success in the case of a disaster.
It was important to update methods by adding new and more efficient processes to
ensure the success of the plan. Successful DRPs included service analysis, training, off-
site storage, and backup procedures (Kadlec & Shropshire, 2010; Rosenthal, 2010). Test
the DRP frequently and create a backup plan for the organization. Disaster recovery
planning was essential for business survival. Business changes constantly require changes
to the DRP. However, the backup portion of the DRP requires a measurement, and the
basis for this measurement was Six Sigma.
Quality Theories: Foundation Six Sigma
Six Sigma was derived from a variety of quality processes and each process used
contributed to Six Sigma’s overall quality. An explanation of the various quality
movements along with the views of the various theorists provided a foundation for Six
Sigma. A short overview of the seminal works of the quality theorists explained how Six
Sigma originated.
Zero Defects Quality Theory
The zero defects quality management method, suggested that all errors must be
eliminated to improve quality, was founded by Phillip Crosby. Crosby (1994) felt that
quality was achieved through a 14-step process quality system called “zero defects.”
Crosby (1994) stated that when a process was completed the first time, there was a new
conformance to the standard that prevents defects and creates a new “zero defects”
47
standard. Eliminating poor quality was paramount because, once a defect was
eliminated quality becomes free (Crosby, 1986). When no defects exist, it was less
expensive and easier to produce a quality product. According to Crosby (1994), the
second part of eliminating poor quality was doing it right the first time (DRIFT). DRIFT
was originally used in a just in time (JIT) inventory systems where the processes was
performed correctly, thereby eliminating defects and delays in production. The system of
zero defects (Crosby, 1986) required an understanding of the total organizational process,
knowledgeable management and staff, and an in-depth knowledge of human nature.
The System of Profound Knowledge, meanwhile, was one of the first quality
management programs for many organizations developed by William Deming. This
system made comparisons between processes, then determined which ones were better
and least expensive while still producing the desired result (Deming, 1986). There were
14 steps to the System of Profound Knowledge (Deming, 1994):
1. Create constancy of purpose toward improvement of the product and service
with the aim to become competitive, stay in business, and provide jobs.
2. Learn responsibilities and take on leadership for change.
3. Cease dependence on inspection to achieve quality.
4. End the practice of awarding businesses on the basis of price tag. Instead,
minimize total cost.
5. Improve constantly and forever the system of production and service to
improve quality and productivity, and thus constantly decrease costs.

48
6. Institute training on the job.
7. Institute leadership.
8. Drive out fear.
9. Break down barriers between departments.
10. Eliminate slogans, exhortations, and targets for the work force, asking for zero
defects and new levels of productivity.
11. Eliminate work standards (quotas) on the factory floor and eliminate
management by objective and management by numbers and numerical goals.
12. Remove barriers that rob the hourly worker of his right to pride of
workmanship and remove barriers that rob people in management and
engineering of their right to pride of workmanship.
13. Institute a vigorous program of education and self-improvement.
14. Put everybody in the company to work to accomplish the transformation. (pp.
23-24)
The theory of constraints (TOC), developed by Eilyahu Goldratt (1994), was
designed to help eliminate issues regarding lack of optimization. Goldratt emphasized
that all systems must have a goal, which was the prominent theme of TOC. A project
manager can use this theory to discover opportunities that were relevant to a project. The
manager can use the opportunities to make items flow through the system rather than
having to force them. One example was ensuring that a machine had ample inventory to
process, ensuring that the machine did not sit idle and waste resources. The goals of TOC

49
included three levels: global goals, sub-goals, and local goals. Next, all
systems must have a way of being measured to determine the actual impact of the varied
goals of the project. When the system constraint was contained or eliminated, the
organization benefitted because the constraint was usually a small part that causes the
largest problem (Goldratt, 1992).
Theory of Inventive Problem Solving (TRIZ)
Theory of Inventive Problem Solving (TRIZ) was a Russian acronym created by
Altshuller (1994) also known as Systematic Innovation. Manufacturing process problems
were not always solved and did not always provide long-term solutions - even after many
years of traditional problem solving, Altshuller (1994) concluded that there was a
standardized way to solve problems. The basis of TRIZ was that problems were
methodically resolved through the application of innovative solutions. There were three
parts in classical TRIZ theory: a) four tools for settling conflicts, b) eight evolutionary
laws of a technological system, and c) an algorithm called ARIZ for solving an inventive
problem. An inventive problem was one that did not have a satisfactory solution even
though existing knowledge was readily available (Ru & Chao, 2005). The final goal was
reached through the systematic elimination of contradictions.
Total Quality Management (TQM)
Total Quality Management (TQM), founded by Juran (1994), requires
organizations to allow management to play a significant role in quality control. Juran
(1994) wrote the Quality Management Handbook in 1951, in which he developed the

50
quality trilogy designed to use a cross-functional approach to management to
help improve the quality of an organization. An organization involved in Total Quality
Management must look at the entire organization to enact the process. TQM means
achieving quality in terms of all functions of the enterprise. This includes the interaction
between all the components of the organization as well as within the components
themselves (Pyzdek & Keller, 2014). Product features influence quality and those
features must meet the needs of the customer and be free from deficiencies. These
theories, combined, provided the basis for Six Sigma.
Six Sigma
Six Sigma had created a change in organizational culture by its top down method
(Figure 5). Support for the process at the highest level, through management and line
workers was important for success.

51
Figure 5. Top down method of Six Sigma implementation (adapted from Six Sigma Handbook, Pyzdek, 2003). Organizations that had used Six Sigma claim that the process had transformed the
organization (Gijo & Sarkar, 2013). It uses a strategic and tactical approach to solving
problems (Cheng, 2013). Snee (2010) and Riley, Kovach & Carden (2013) states that the
Six Sigma improvement process was better than others were because it uses the human
factor. In addition, Six Sigma was customer, process, and employee oriented. It was
important to create an environment that was customer and employee focused. The gains
made in product and service quality increase company profitability in the long run
(Cheng, 2013). The use of Six Sigma saved countless organizations millions of dollars.
One example of improvement featured was a wind turbine manufacturer in India
that developed suitable wind farm roads using DMAIC methodology. There was an
existing road construction methodology, but it was highly inefficient. A Six Sigma black
CEO
Directors and ManagersLine Staff

52
belt reviewed the project processes. The changes to the processes produced no
failures in the first six months of road construction. Through the identification of critical
to quality (CTQ) items, the project increased the sigma from a 3.9 to a 4.40, saving
$168,000 per year USD (Gijo & Sarkar, 2013; Hanson, 2011).
The goal of the Six Sigma quality management program ensured that there were
no more than 3.4 defects per million opportunities (Pyzdek, 2003). Quality with respect
to the customer’s desires and needs was the focus (Salzarulo, Krehbiel, Mahar, &
Emerson, 2012; Shanmugaraja, Nataraj, & Gunasekaran, 2010). Achieving this level of
quality requires evaluation of a program or product using either DMAIC (Design,
Measure, Analyze, Improve, and Control) or DMADV (Design, Measure, Analyze,
Design, Verify). A manufacturing or customer service project or process can achieve a
higher sigma level by changing some variables. Six Sigma creates savings due to its data-
driven problem-solving methodology and its understanding of customer needs
(Barjaktarovic, Jecmenica, & Corvininesis, 2011; Salzarulo, Krehbiel, Mahar, &
Emerson, 2012; Snee, 2010). By eliminating defects, a project systematically increases its
sigma level. A lower number of defects results in a higher sigma level (Pyzdek, 2003).
There were many sigma levels for a project: Four Sigma was 6,210 defects per
million opportunities, Five Sigma was 233 defects per million, and Six Sigma was 3.4
defects per million opportunities (Pyzdek & Keller, 2014). The goal was to achieve a Six
Sigma level for many of the individual processes in the organization (Figure 6). Either
DMAIC or DMADV can improve a backup plan and make it measurable.
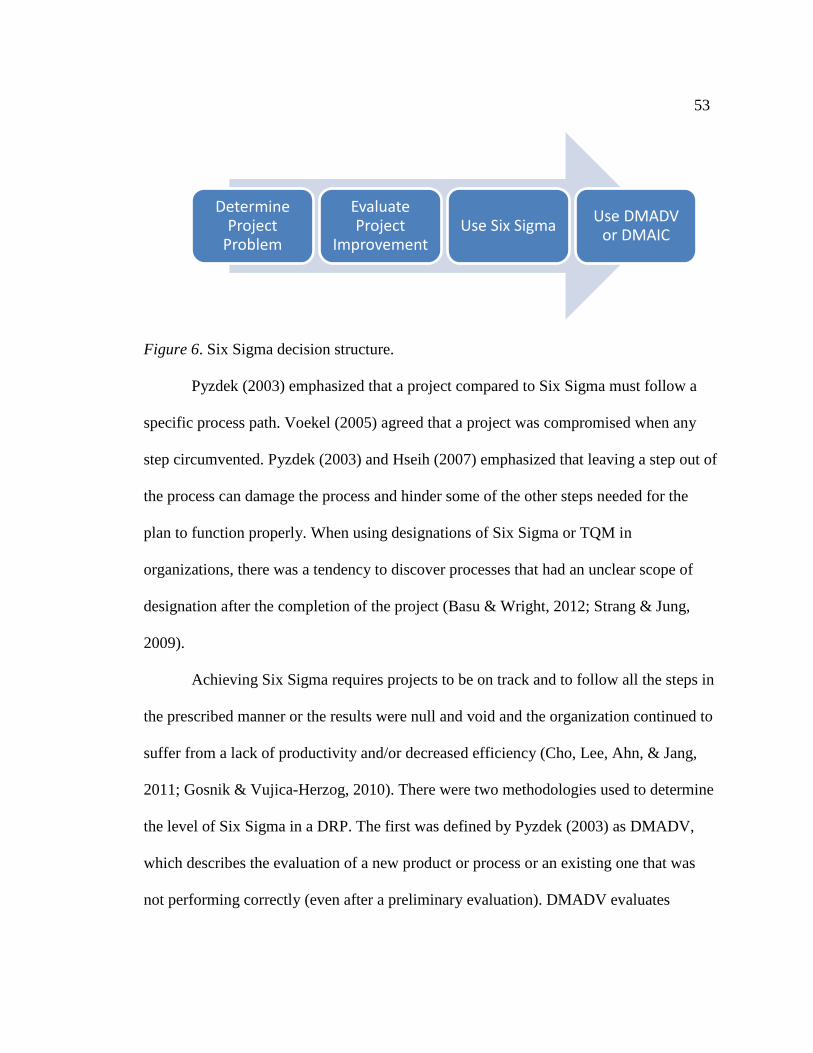
53
Figure 6. Six Sigma decision structure.
Pyzdek (2003) emphasized that a project compared to Six Sigma must follow a
specific process path. Voekel (2005) agreed that a project was compromised when any
step circumvented. Pyzdek (2003) and Hseih (2007) emphasized that leaving a step out of
the process can damage the process and hinder some of the other steps needed for the
plan to function properly. When using designations of Six Sigma or TQM in
organizations, there was a tendency to discover processes that had an unclear scope of
designation after the completion of the project (Basu & Wright, 2012; Strang & Jung,
2009).
Achieving Six Sigma requires projects to be on track and to follow all the steps in
the prescribed manner or the results were null and void and the organization continued to
suffer from a lack of productivity and/or decreased efficiency (Cho, Lee, Ahn, & Jang,
2011; Gosnik & Vujica-Herzog, 2010). There were two methodologies used to determine
the level of Six Sigma in a DRP. The first was defined by Pyzdek (2003) as DMADV,
which describes the evaluation of a new product or process or an existing one that was
not performing correctly (even after a preliminary evaluation). DMADV evaluates
Determine Project
Problem
Evaluate Project
ImprovementUse Six Sigma Use DMADV
or DMAIC

54
existing processes; however, it focuses on the design rather than customers’
needs and expectations. The second methodology defined by Pyzdek (2003) was
DMAIC, which evaluates existing processes. DMAIC had been the most widely used of
the three methods because it improves existing processes. Pyzdek (2003) described the
DMAIC methodology as a process that looks at the underlying problems of a plan or
project and finds the main cause. DMAIC requires the comparison of alternatives against
each other. After evaluating the alternatives, choose the best solution based on the
outcome. Apply the solution and carefully monitor the process to ensure that the problem
did not occur again.
Some organizations use Six Sigma in combination with an emphasis on behavior
and teamwork to give the project more significance for its participants (Kokkranikal,
Antony, Kosgi, & Losekoot, 2013; Strang & Jung, 2009). Allen and Wigglesworth
(2009), for example, used a combination of DMAIC and Lean to reduce delays in sample
management in the pharmaceutical industry. Other organizations had combined a Six
Sigma methodology with TRIZ (an existing quality theory) to enhance the DMAIC
process and solve problems based on a more comprehensive model (Brad, Fulea, Brad, &
Mocan, 2009).
It was important to include valid data that were representative of the process
regardless of choice. If the results were irregular, then they must be evaluated using
probability and correlation. When comparing data, there might be irregularities. It was
important to measure the probability to determine whether an event was random. Also,

55
the distribution of data must be reviewed to determine whether or not it was
normal. DMAIC and DMADV methodologies define, check, and verify the data or
samples used to ensure its validity.
DMAIC
DMAIC methodology evaluates the quality of a procedure or system. Each step was
important in the process and must be fulfilled to make the plan complete. These steps are
illustrated in Figure 7.
Figure 7. DMAIC explanation of steps to evaluate and improve the process. Adapted from Six Sigma Handbook (Pyzdek, 2014, p. 149.).
Define. First, define the goals of an improvement project, including customer
goals and expectations. There were certain steps that evaluators must complete when a
product or process was defined. One way to define these important factors was to use a
project charter. Pyzdek (2014) described a project charter as a document designed to
describe the scope, participants, and the objectives of a project. To keep a project on track
and continue executing the processes in a systematic order, participants can refer to the
•Create Process
Design
•Measure Outcomes
Measure•Review
Outcomes
Analyze
•Change Outcomes
Improve•Return
Project
Control

56
project charter. The project manager must make improvements to inefficient
processes based on the needs of the customer.
Pyzdek (2014) explained that the Six Sigma process was first defined and then
measured. If the project applies to Six Sigma, then the next step was to create key
identifiers. Key identifiers, as described by Pyzdek (2014), were characteristics that must
be part of a plan to ensure the success of a business. These key identifiers included
quality, cost, and schedule. Key identifiers of important processes included indispensable
processes, important outputs of the processes, customer identification, and an outline of
important processes. Next step in the process requires a map that highlights a company’s
core or strategic processes. One organization used a three-year time line to design a
project wherein bank processes were analyzed. The final result included a plan to address
employment practices, team activity, and long-term stability (Strang & Jung, 2009). The
organization narrowed its problems and determined the key identifiers that affected the
outcome of its products (Strang & Jung, 2009).
First, outline and measure key identifiers. Second, key metrics for a process or
project must be determined. These characteristics, as defined by Pyzdek (2014), were
critical to quality (CTQ), critical to cost (CTC), and critical to schedule (CTS). CTQ
determines if a product was viable, CTC emphasized the cost savings, and CTS referred
to the efficient delivery of the product or service. (Pyzdek, 2014). These metrics measure
and analyze the project according to customers’ needs. Service industries analyze CTQ to

57
improve the end process, sometimes using algorithms and workload variations
(Shanmugaraja, Nataraj, & Gunasekaran, 2010).
Motorola was an excellent example of a company singling out customers’ needs
as the most important characteristic of their success. First, Motorola identified all its
customers’ needs and compared them to its products. Then, it defined problem areas and
reworked various processes to better meet those needs. Next, the defects per million
opportunities (DPMO) in the Six Sigma process were determined and resolved to reduce
their number. The DPMO must be defined by the customer in an understandable and
clean manner (Pyzdek, 2014), meaning the customer defines number of defects.
Determining the reasons for each defect was the next step in meeting the customer’s
needs.
Pyzdek (2014) listed the DPMO calculation as DPMO = 1,000,000 (defects /
number of opportunities). Motorola’s defect rate in 1989 was Four Sigma, or 6,200
defects per million opportunities (Pyzdek, 2014). The goal was to achieve a Six Sigma
level, matching its Japanese competition, by 1990. Motorola’s problems were poor
customer service and the high cost of producing pagers. The DMPO calculated the
company’s Sigma level. Pyzdek (2014) outlined the changes that Motorola made to their
service time and materials and noted that the improvements were significant. The project
manager either made improvements or advocated specific tools to validate or determine
sigma levels.

58
Measure. The measure phase looks at key process variables (KPVs),
which describe the potential successes or problems of the process. A process manager
was specifically responsible for determining the KPVs. Pyzdek (2014) emphasized that
this manager chose particular tools to measure KPVs depending on what these were. The
final review in the measurement phase examines the potential causes of problems. These
problems were prioritized based analysis.
Lin and Li (2010) explained that Six Sigma metrics allow for the identification of
performance points in the process or activity. This requires comparisons between the
output/service requirements and current conditions. Lin and Li (2010) cautioned that the
tools used and portions measure correct data; otherwise, bad information was created, and
effort was wasted. In some cases, the DMAIC process can inadvertently measure the
wrong data and produce bad information. Pyzdek (2014) pointed out the mistakes that
some project managers make when measuring data: Those who measured the various
metrics sometimes did not understand what they were measuring. Pyzdek (2014) also
explained that most concepts were measurable, especially business inputs. It may take
work to find a measure, but it can be done. Customers determined whether a process
needs continuous or discrete measurement. The use of a combination of tools in the
measurement phase helped organizations determine problem locations.
Pyzdek (2014) explained that Six Sigma measurement tools were no different
from other measurement tools; they were only used in a different context. The
methodology was unique because customers had some input into the process by naming
59
the most important characteristics they want to accomplish. The problems
highlighted, based on results, became the focus of the next phase, where details of the
problems were further scrutinized.
The measurements used to gather information for Six Sigma vary from
organization to organization. One example was an organization that used a simple
DMAIC model and a baseline comparison to identify factors that needed analysis or
improvement. Global Financial measured employment conditions using personnel
records and contagion/reinforcement (Strang & Jung, 2009), and a supply chain
management company used Six Sigma, along with a capability maturity model
integration, to evaluate its processes (Lin & Tzu-Su, 2010).
Analyze. Root causes of problems were defined, measured, and analyzed. This
analysis helps the process manager to improve performance as the problems listed in the
measure phase were studied in detail. Some tools used in this process included
simulations, process maps, cause and effect diagrams, tree diagrams, and failure mode
and effects analysis.
Next, problems ordered by their importance to the process (based on their priority
and/or frequency). To help analyze the problems found, Snee (2010) focused on
videotape analysis, failure mode and effects analysis, and multivariance studies that
analyzed a process or project. Because Six Sigma focuses on variations in the process or
project, these tools helped to measure those variations.

60
The analyze phase was used to identify fixes. Observations made in
the analyze phase can use multiple regression, mixed-linear statistical models, single
regression, ANOVA, or MANOVA, depending on the data supplied and the analysis
required (Das, Roy, & Antony, 2007). Obviously, the most important problems should
receive priority. Voekel (2005) emphasized that the analysis of a project completed in the
field was best. Evaluate the process within the project itself—not from the outside.
Voekel (2005) also emphasized never “discount[ing] the knowledge of those involved in
a project. Their knowledge was very valuable” (pp. 66–67). Those inside the organization
were the most knowledgeable and had more insight.
Starbird (2002) reviewed Fortune 500 organizations using a tool to analyze the
findings in the measurement stage. Ordinal logistic regression correlates defects and
potential causes to determine the primary drivers of a project’s success or failure. In the
case of Global Financial, a multivariate regression model analyzed the data as follows: y
= a + bx + cx + dx + ex + fx+ gx, with a significance level of either 99% or 95% (Strang
& Jung, 2009). For the organization that needed lot-to-lot consistency, a multiple
regression model was used to analyze dye standards against fabric types, color, and lot to
determine significance in the process (Das, Roy, & Antony, 2007). Depending upon the
answers returned in response the analysis, items to be fixed in the improvement phase of
DMAIC were singled out (Das, Roy, & Antony, 2007). When the Advanced Collegiate
Schools of Business standards evaluation used a MANOVA to test the increase in
knowledge of students in advanced courses, pre- and post-standardization test scores
61
were compared for dependent and independent variables (Meuter, Chapman,
Toy, Wright, & McGowan, 2009).
A newer variation of Six Sigma analysis uses a combination of methods. Sigma-
TRIZ capitalizes on the TRIZ knowledge base of solutions, which were reviewed for
known problems. The solutions must comprise internal or external sources. Problems
with solutions were added to the database and shared with other communities in the
future (Brad, Fulea, Brad, & Mocan, 2009).
Improve. The improve phase acts upon the findings in the analyze phase with the
ultimate goal of eliminating or reducing problems discovered during the analyze phase.
The Six Sigma standard was no more than 3.4 defects per million opportunities.
Improvement methods such as experimentation, 7M tools (which included affinity
diagrams, tree diagrams, process decision program charts, matrix diagrams,
interrelationship diagraphs, prioritization matrices, and network diagrams), and/or
virtualization can be used to test the findings of the previous phase (Pyzdek, 2014). The
best scenario or combination of scenarios comprised the company’s improvement plan.
Snee (2010) looked at the reasons for improvement (which come from previous
measurement and analysis) and recommended using production smoothing and Kaizen
events. Improvements were made in most organizations based on priority and a
monitoring plan (Brad, Fulea, Brad, & Mocan, 2009).
Control. At this point in the implementation, management and employees had
embraced the new and improved process. Provided that these steps had been completed,

62
the new process must be maintained in order serve as a long-term solution. All
documented changes were shared with management and the employees involved with the
project. Documentation includes process changes, cost-benefit analysis, and opportunities
for change in the future of the project. Our Lady of Lourdes, reviewed by Raisinghani
(2005), used a dashboard designed to help monitor the process and help the customer to
understand how to implement the changes necessary to make the project successful for
the long term.
When the process was complete, it was transferred from the project team to the
process owner or customer. An example of a corporate control method was a monitoring
plan that includes observed processes, solutions, and corrective actions to control the
project (Brad, Fulea, Brad, & Mocan, 2009). The organization noted above that needed
lot-to-lot consistency used a control method that closely followed the DMAIC model and
included a control scheme, training for the future development of operators, and
identification of issues that were not addressed in process and redesign (Pyzdek & Keller,
2014). In some projects, these tools were combined in the improvement and control
phases. The tools used for the Fortune 500 company investigated by Starbird (2002)
included process maps, dashboards, a database for tracking purposes, and a prioritization
filter for ranking project opportunities.
DMADV
DMADV was not used as often as DMAIC, and there was little literature
available on the concept; however, the concept was illustrated in Figure 8.

63
Figure 8. DMADV explanation of steps to evaluate and improve an existing
process or project. Adapted from Six Sigma Handbook, (Pyzdek, 2014, p. 151).
Similar to DMAIC, DMADV uses a five-step approach to solving organizational
problems (Figure 8). The difference between DMADV and DMAIC was DMADV
designs or redesigns a product or service. DMAIC works with existing processes that
were inefficient or not functioning as designed. In conjunction with DMADV, a process
called Design for Six Sigma develops processes or projects. There were some slight
variations in DMADV. According to Pyzdek (2014), the define, measure, and analyze
portions of the methodology were the same. Define includes an explanation of the
project’s design goals based on customers’ needs. Measure referred to a review of the
CTQ elements from the customer’s perspective. The analyze portion of the methodology
includes new and innovative concepts designed to provide the best value to the customer.
The difference in methodology was found in the final portion of the process. Then the
product or service was designed meet the customer’s needs. Finally, the verify stage
requires the design to be checked for completeness and functionality in a live
•Review Process
Define
•Measure Outcomes
Measure•Review
Outcomes
Analyze
•Change Process
Design•Check
Processes
Verify
64
environment before it was released to the customer. Further explanation of the
methodology and its specific parts was discussed next.
Define. During the design phase, the needs and desires of the customer control the
process. Pyzdek (2014) explained that the CTQ elements were designed along with the
delighters that make the project customer oriented. The voice of the customer was crucial
to the project elements because it ensures that the process or project met the customer’s
standards.
Measure. CTQs, according to Pyzdek (2014), the outcomes require review and
change to reflect the operations of the organization and the voice of the customer. Many
of the measurements were gathered in the same way under DMAIC methodology. To
gather this information, use all the benchmarking, customer research, and technical
information. The best idea was chosen for each concept, and the concepts were evaluated
in the analyze stage.
Analyze. The difference in the analyze stage in the DMADV methodology was
the application of reasoning. In this stage, analyze the project and choose the best
scenario based on the use of various tools. Pyzdek (2014) underscored the need to assure
that requirements were met in this stage. Once the requirements of a process or project
were met through the analysis, the predictions were compared with the requirements and,
if necessary, the design in reworked.

65
Design. After the define, modifiy, and analyze phases, the new product
was designed based on these earlier specifications. The design phase includes the
following tasks:
Develop detailed design.
Predict CTQ’s (critical to quality).
Revise until simulations were one of the more popular tools used to design
products and processes.
Conduct pilot.
Analyze CTQ’s from pilot results.
Revise design until pilot CTQ’s meet requirements.
Develop an implementation plan (Pyzdek & Keller, 2014, p. 682).
The customers’ demands, or voice of the customer, determines the design of the
process or project. The project team perfects the product at this phase because the voice
of the customer was important by translating the customer demands directly into a
product. Assess each demand and alternatives to ensure that the product was the most
efficient in terms of cost and time (Pyzdek & Keller, 2014). During this phase, a variety
of tests were used, including predictive models, statistical tests, simulations, pilot testing,
and prototypes (Pyzdek & Keller, 2014). The design team was encouraged to be creative
and to use as many prototypes as possible. One example of design was the use of a pilot
to test the product. A pilot was conducted using the new findings to determine whether

66
the process or project was satisfactory and meet specifications. If not, rework
the design until it meets the customer’s demands.
Verify. After the new design was approved, check it against the original CTQs.
Next, a control plan and a transition plan were created. This allows the project manager
to hand over the project to the customer. In addition, review the best practices and
information learned for possible use in other areas.
Data DRPs recover data in case of major data loss, and it was important to
evaluate the data DRP based on a Six Sigma model. Ultimately, it was imperative to
come as close to perfection as possible when backing up data. Thus, it was important to
determine which methodology to use when evaluating data: DMADV or DMAIC.
DMADV evaluates new processes that had no precedent. It also reviews processes
evaluated using the Six Sigma methodology but that did not improve after evaluation.
DMAIC evaluates existing processes that must be adjusted to approach Six Sigma. Many
organizations had a data DRP in place while others did not.
Pyzdek (2014) agreed that when an organization desires to make a change, the
process it uses was important. Pande (2000) recommended that an organization look first
at its financial goals, strategic course, and level of response to changes. Depending on the
answers, the organization must assess where it stands in relation to the process it wants to
fix. After this assessment, the organization can determine whether a Six Sigma plan was
appropriate and if the data DRP can be improved, based on a Six Sigma DMAIC
methodology. The timing was very important.

67
Financial costs were also very important. If the costs were
manageable, then the Six Sigma process should continue; otherwise, discontinue the
process. Pande (2000) explained that decisions made concerning a Six Sigma
implementation must take into consideration staffing and training costs and a review of
the overall objectives of the process or project. Pande (2000) and Pyzdek (2003) also
explained that Six Sigma was not right for some organizations. Organizations must find
potential gains, have a strong performance improvement plan in place, and had personnel
that were willing to change. As Pyzdek & Keller (2014) explained, some organizations
should not use Six Sigma in environments that were resistant to change or had not
established an approach to creating a product. In one example, an organization tried to
use Six Sigma in research and development to implement Six Sigma on a brand-new
product. Six Sigma improves the process and creativity; it was hard to measure before it
had been used (Pyzdek & Keller, 2014). There were environments that should not use Six
Sigma because the process breaks down everything; further, in many cases, a tweak was
necessary. Indeed, Six Sigma can destroy processes and well as improve them, so the
team using Six Sigma must be aware that there was a possibility of breaking an existing
process in favor of a new and improved one (Pyzdek & Keller, 2014). Once a project was
worthy of Six Sigma, it was important that the user understands how to properly calculate
Six Sigma to ensure accurate program outcomes.

68
Calculation of Six Sigma After Measurement and Analysis
Calculation of the sigma level follows a specific process. First, calculate the
defects. These calculations can be derived from measurements taken during the define or
measurement stage. Second, calculate the defects per opportunity. Team members
determine the defects in the process through methods such as brainstorming and using
Pareto charts. Another method was using a form comprised of thirty questions that
represent thirty opportunities for defects. Third, calculate the number of opportunities for
defects. This may be as simple as counting the number of opportunities or as complex as
using statistical evaluations. There were occasions when only one opportunity was
present, which tends to skew the data and make the sigma value look very good. On the
other hand, having too many opportunities can inflate the Sigma score. Therefore, it was
important to combine opportunities to avoid sigma numbers that were too high or too low
(Pyzdek & Keller, 2014).
Defects per opportunity (DPO) were determined using the following formula: no.
of defects / no. of units × no. of opportunities (Pyzdek & Keller, 2014). Then, the DPMO
was calculated as follows: DPO × 1,000,000. The importance of the DPMO was that it
outlines the number of defects per one million opportunities (Pyzdek & Keller, 2014).
The DPMO was also the yield used to calculate the sigma level. The DPMO or yield was
compared to the chart, and the appropriate sigma level was selected.
Six Sigma as a methodology can be either complex or simple. This depends on
the level of data reviewed or the level of investigation. There were two ways to evaluate a

69
project. The project manager can use either DMADV, which was for new
processes, projects or those that need to be reevaluated, or DMAIC, which was for
existing processes that need improvement. Achieving Six Sigma involves evaluating
DPMO. To increase the sigma level, reduce defects and opportunities for defects. Using
DPMO was subjective due to lack of direction regarding what to use as the determinants
for units/opportunities and defects (Pyzdek & Keller, 2014). Six Sigma uses appropriate
facts, reducing bias from organizations or institutions when making decisions, saving
money in the long term (Gijo, Scaria, & Antony, 2011). The ultimate goal of Six Sigma
was difficult to achieve; therefore, many projects settle for any improvements at all. Six
Sigma can be an effective tool for improving a process; however, it had not been used as
a measurement tool for data backup measurement.
Backup of Data
Backup of data was a critical process and an important part of the DRP. The
backup of data, when included in a DRP, provides a map for the organization to restore
data when needed, especially in a disaster. Without a plan, the organization could falter
when restoring data and miss important cues. EC-Council (2011) emphasized the use of
data backup recovery information if the original data were destroyed. Hardware failure,
theft, data corruption, malicious attacks, power outages, fire, flooding, viruses or worms,
and human error were all important reasons to back up data. Further, data was backed up
using a schedule that fits the business model. Each organization operates differently and
not all backup plans were suitable. This portion of the literature review examines the

70
current backup methods, their relevance to organizational survival, and the
need for a measurement tool regarding the viability of a data backup.
Several methods for backing up computers had evolved from storing information
on punch cards to using cloud computing to store backup data. Studies had discussed
traditional backup methods that require an organization to use a particular schedule along
with backup tapes, hard drive storage, and off-site storage (Bedi, Marwaha, Singh, Singh,
& Singh, 2011; Ernst and Young, 2011; Jarraya & Laurent, 2010). Based on this study’s
observation of the literature, the most popular backup methods included full and
incremental backup. Full backup requires nightly back up of all files. This method of
storing data requires a large amount of storage space due to the large amount of data that
was being backed up (Trikha, 2010).
The EC-Council (2011) and Ernst and Young (2011) recommended a graduated
backup plan using multiple tapes to back up data that changes along with a full back up
each week. This method decreases the amount of storage space needed and was more
efficient in both the short and long run. Only data that change were backed up, providing
a better data backup method. In contrast, Toigo (2013) recommended that the best backup
plan for an organization be based on the needs of the company and the amount of data
that must be stored.
EC-Council (2011) and the Trikha (2010) agreed that data was backed up at
regular intervals but stored in a safe, retrievable environment such as off-site storage or a
cloud. Data methods had evolved and the media used to store data should evolve, too.

71
The change from a simple storage method to a more complex one had evolved
over the past 100 years (Trikha, 2010), and the storage of data at an off-site location
increases the probability that the data remained safe. Advantages of off-site backup, as
explained by the EC-Council (2011) and Van Ooijen (2010), included data protection,
encryption, elimination of tapes, reduction of hardware failure, and corruption, and the
off-site method can be cheaper and more convenient than previous methods.
Some organizations had elected to use peer-to-peer (P2P) as a backup method
with a form of data transportation through the Internet similar to cloud computing
(Gutiérrez-Martínez, Núñez-Gaona, Aguirre-Meneses, & Delgado-Esquerra, 2012).
Client server options were not always ideal due to the lack of scalability, the P2P option
did not require a lot of resources, and there was not a need for multiple personnel to
maintain this system (Gutiérrez-Martínez, Núñez-Gaona, Aguirre-Meneses, & Delgado-
Esquerra, 2012). When data were stored in the cloud, the user pays for the service.
Instead of a central location for backup, a group of peers was used and the data were
distributed among them. P2P did require long-term dedicated partners to ensure the
availability of the data, and it was important that the right peer was selected to ensure
data availability (Gutiérrez-Martínez, Núñez-Gaona, Aguirre-Meneses, & Delgado-
Esquerra, 2012). The more P2P partners that use the service, the better the availability of
data retrieval in case of a disaster. A new service called Wuala was a P2P storage
application that relies on data sharing/exchange between users.

72
Currently, the most popular off-site storage method was cloud
computing because of its flexibility and convenience. In the past five years, there had
been an increasing amount of literature on cloud computing and its popularity as a viable
data backup methodology. Marwaha (2011), Mirzoev (2009), Talib (2010), and Trikha
(2010) all explained that cloud computing allows for the remote storage of data and
retrieval through software or web-based programs. Many servers in various locations
store or retrieve data at any time. However, there was a trust issue related to cloud
storage. Cloud computing as an alternative for data backup was popular, but there were
organizations like health care facilities that were still reluctant to use the cloud due to
privacy issues (Brohi, Bamiah, Chuprat, & Manan, 2010) Wallace and Webber (2010)
and Ernst and Young (2010) explained that the cloud was a place to store data that were
replicated in various locations to protect the data. Trikah (2010) agreed that the cloud was
a viable location, but proof of retrievability in case of a disaster was important for the
organization. An organization shows proof of retrieval through documentation and
practice of retrieval of data. Redundancy was incorporated into the storage plan to ensure
that the data were replicated in more than one location, ensuring retrievability and safety
(Talib, 2010; Trikha, 2010; Shen, 2011).
Cloud computing requires the end user to rent space per gigabyte and transfer the
data to be stored across the Internet (Saxena, 2010). The use of cloud storage made the
backup process secure and more affordable for smaller businesses (Paul & Saxena, 2010;
Piccinelli & Gubian, 2011). Although it seems to be popular, some organizations feel it

73
was not a safe option. Marwaha (2011) emphasized that there can be
hesitation to store data in the cloud computing environment due to the feeling of loss of
control over the data. Trikha (2010) emphasized that trust between the storage provider
and end user was critical.
Organizations agreed that it was important to back up data at various intervals
using various media. It was revealed that organizations did not trust the cloud backup
process because it was a newer process that lacks a track record (Ernst and Young, 2011).
Each peer-reviewed article contained information regarding backup concepts, including
cloud computing backup, data backup methods, and off-site storage methods. Various
backup methods, as well as ways to improve a backup, were discussed, but an actual
measurement of the data backup was not addressed. Also, the articles did not discuss the
importance of the quality of the data backup. The articles discussed backing up to high-
quality media, but it did not address the actual quality of the data backup as important. In
addition, the organization’s level of confidence in the data backup was not addressed in
any of the articles. The organizations ensured that data backup was important, but they
did not view quality as a factor. This study examined data backup, data backup
confidence, data backup quality, and the need for data backup indicators.
Design for Study
Studies on data backup used a variety of research methods to explain their
findings. These research methods included qualitative, quantitative, or mixed methods,
but quantitative was the most popular method. Studies that used qualitative analysis

74
asked the participants many questions related to data backup and how the
participants would improve on their plans in the future. The use of qualitative methods in
these studies allowed the researchers to give specific details regarding the participant’s
answers and gave insight into the current state of data backup in organizations.
Two examples from the literature review used a qualitative method. Omar,
Alijani, and Mason (2011) used a qualitative case study to determine the effects of DRPs
on return to operations following a disaster at Houston Community College after
Hurricane Katrina. The reviewed methodology was a qualitative case study of an
implemented disaster recovery plan. Each reviewed section of the data backup plan used
comparisons from other data backup methods such as standby databases, hot-cold data
backup, and offsite storage (Omar, Alijani, & Mason, 2011). The outcome revealed that
the community college was prepared for the disaster and could continue operations with
minimal interruption.
Al-Badi, Ashrafi, Al-Majeeni, and Mayhew (2009), who interviewed and
surveyed information technology professionals in the public and private sectors, used a
mixed methodology. First, the researchers created the framework for a descriptive study
by evaluating previous studies related to disaster recovery in information technology and
business continuity planning. Second, after the descriptive study was completed,
participants were interviewed in the public and private sectors. Third, the researchers
converted the interview questions into a quantitatively based questionnaire and emailed it
to information technology professionals in the public and private sectors. These

75
quantitative questionnaire data were analyzed using cross tabulation and t-
tests (Al-Badi, Ashrafi, Al-Majeeni, & Mayhew, 2009).
Two examples of the use of quantitative methods to examine business disaster
preparedness related to a backup plan included Kaldec and Shropshire (2010), Karim
(2011) and Rosenthal (2010). Kaldec and Shropshire (2010) studied the disaster recovery
and data backup methods of banks. The researchers used a quantitative study that
included both a mail- and a web-based survey sent to 332 institutions that were part of a
professional trade association for banks. The recipients included CEOs and bank
presidents, who received a cover letter that explained the purpose of the survey and a
request that the information technology specialist completes the survey. The study results
suggested that neither method influenced the significance of the response rate. The
researchers received 156 surveys (46.98% response rate) and analyzed the data using
cross-tabulations and multivariate statistics (Kadlec & Shropshire, 2010). Karim (2011)
and Rosenthal (2010) studied disaster recovery and data backup related to the financial
sector business practices. This study used a quantitative method with surveys distributed
to risk management and internal audit departments at a variety of worldwide financial
sector organizations. The data received were analyzed using correlation and linear
regression (Karim, 2011).
The prediction model helped investors determine the probability of a dividend
payout based on 2013 financial data. Logistic regression was used to create a
classification model that predicted whether or not a company would make a dividend

76
payout. Of the 150 companies within the study, 120 had not made a dividend
payout and thirty had (Soric & Šusak, 2015). The dividend per share, debt ratio, and
operating efficiency in 2013 predicted dividend payout. The model was 90.5% accurate.
A second logistic regression model reviewed the probability that a drug addict
would relapse based on a variety of independent variables. The dependent variable was
either a yes or no that predicted relapse. The independent variables included age, age at
first taking drugs, family history, education level, family crisis, community support, and
self-motivation (Ismail & Alias, 2014). Two-hundred participants were surveyed
regarding their drug use. The original regression equation had five predictors. Out of the
five predictors, two (age and self-motivation) were significant and the model was
readjusted based on these two significant predictors. The model successfully predicted
that participants were likely to relapse with the increase of age. However, those with high
self-motivation were not likely to relapse. Overall, 87.5% of the model successfully
classified addicts in the two categories of relapse or no relapse (Ismail & Alias, 2014).
The current study used quantitative methods with a binary logistic regression data
analysis to determine whether there was a need for a data backup indicator. This method
had worked well for researchers who were short on time and had small budgets but
wanted to analyze a binary nominal variable.
Conclusion
This review of the literature revealed the lack of a valid measurement for small
businesses that use a data backup plan. Studies concluded that the backup of data was
77
critical to the longevity of an organization. However, a viable plan listed in
the DRP, along with a particular validation measurement, was not discussed. This lack of
measurement of data backup effectiveness was detrimental to management because the
organization must trust the backup operator instead of the actual method. Currently,
management was dependent on the word of the backup operator and must trust that his or
her explanation was sufficient. The use of a Six Sigma-based measurement tool was a
simple way for management, which had an understanding of quality control, to have
confidence in the backup method that the organization decides to use. Six Sigma contains
elements of all the various quality control methods currently used and was the best
method to apply for a review of the need for a data backup measurement tool, described
in the methodology section. All the data backup options in the literature ensured the safe
back up of data, but they did not quantify the measurement of the accuracy of the data
backup. An explanation of the methodology was used to research whether a measurement
tool was needed to measure the accuracy of the data backup was presented in Chapter 3.

78
Chapter 3: Research Method
The purpose of this quantitative study was to evaluate the need for a backup
performance indicator based on Six Sigma that explained the condition of data backups
for small business organizations with 15 to 250 employees. The data backup performance
indicator benchmarked the data backup to provide a platform for evaluation. This chapter
includes the research design and rationale, methodology, sampling procedures,
procedures for recruitment, participation and data collection procedures, instrumentation
and operationalization of constructs, and a data analysis plan.
Research Design and Rationale
The methodology for this study was a quantitative correlational design in which I
investigated the relationships between the variables without manipulating them (Leedy &
Ormond, 2013). The previous research methods in the literature were qualitative or mixed
methods. Qualitative studies include descriptive phrases or words that may be converted
to quantitative data (Leedy & Ormond, 2013). Quantitative studies include numeric and
statistically analyzed data (Babbie, 2012). Mixed methods include both qualitative and
quantitative data to allow for the exploration of a topic (Hesse-Biber, 2010). A
quantitative design was the best choice for this study because the dependent and
independent variables were measured using a validated instrument. I modified the
validated instrument by adding a question that addressed the need for a data backup
measurement indicator. Babbie (2012) explained that the use of a quantitative
correlational design is ideal when the variables are not manipulated, providing a snapshot

79
in time and measuring multiple variables in a single instance. The quantitative
approach includes a numerical quantification providing an initial investigation of the
research variables to lessen the possibility of bias (Babbie, 2012). In a quantitative study,
hypotheses are tested based on discrete or continuous data. According to Leedy and
Ormond (2013), quantitative methodologies are most appropriate when the independent
and dependent variables are clearly stated and measurable, when the research problem is
understood, and when there is a need for high levels of precision and accuracy for
controlled observations. Quantitative methods are useful when answering the following
types of questions:
1. Questions that demand a quantitative answer.
2. Numeric changes such as increases or decreases in numbers or phenomena.
3. Explanation of phenomena such as predictions or factor determinations.
4. Hypothesis testing in which variables are examined to show a relationship
between them. (Muijs, 2011, pp. 6-7)
There are four types of quantitative research designs: descriptive, correlational, causal-
comparative/quasi-experimental, and experimental (Leedy & Ormond, 2013). In the
current study, I used a correlational design to examine the relationship between data
backup, data backup confidence, data backup quality, and the need for a data backup
performance indicator. Babbie (2012) explained that in a correlational design,
relationships between variables are investigated without manipulation of the variables. In
addition, in a correlational design, causation cannot be determined, and the involvement

80
of the researcher is minimal. The quantitative correlational design of this
study is shown in Figure 9.
Figure 9. The quantitative correlational design.
The independent variables for this study included the implementation of data
backup, data backup quality, and data backup confidence. The dependent variable was
the need for a data backup performance indicator. I examined the views of IT personnel
on the need for a backup performance indicator for data backup. The reviewed literature
provided insight into the fact that many organizations did not have adequate DRPs or data
backup strategies. In addition, existing data backup plans were not quantified into an
easily measurable system whereby all non-IT personnel could understand the current
status of the plan.
Because I was studying a newer process, quantitative analysis was appropriate for
the study. A summary of the data derived from this quantitative study gave breadth and

81
depth to the findings and showed where further study on the topic was needed.
This study was designed to fill a gap in the literature in which the need for a data backup
measurement system was not addressed.
The research question for this study was as follows: What was the relationship
between the implementation of data backup, data backup quality, data backup confidence
(independent variables) and the need for a data backup performance indicator (dependent
variable)? Figure 10 shows the methodology used in the study.
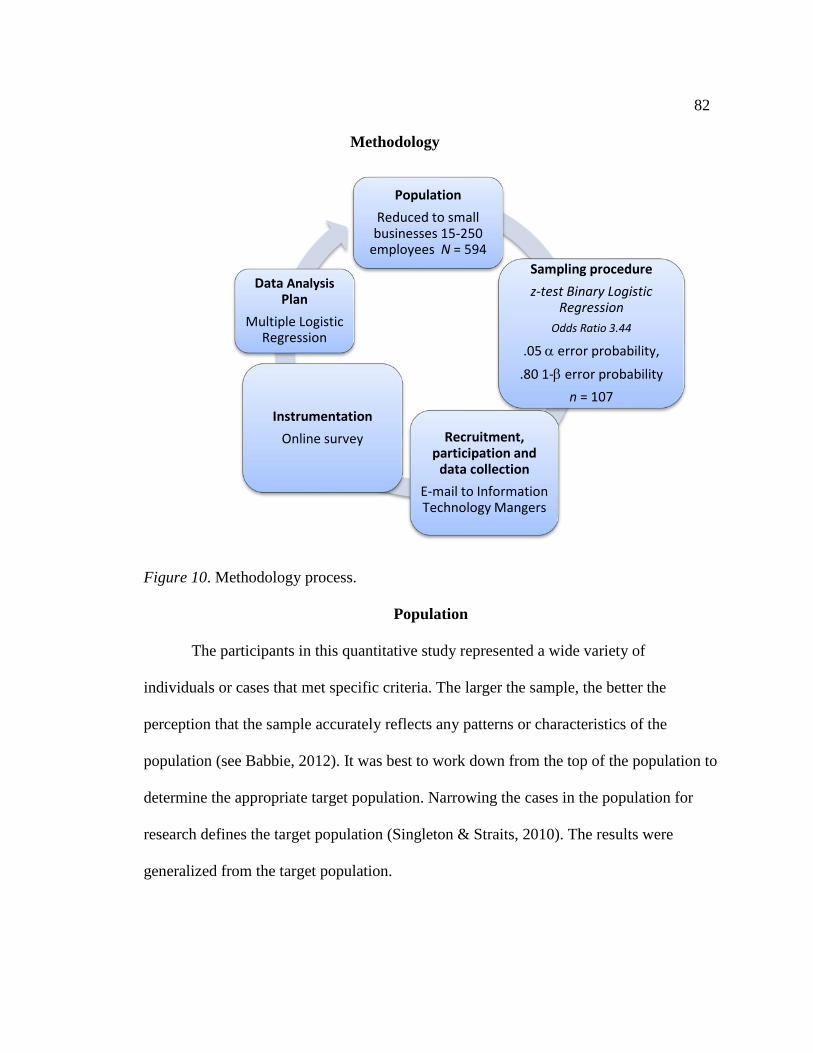
82
Methodology
Figure 10. Methodology process.
Population
The participants in this quantitative study represented a wide variety of
individuals or cases that met specific criteria. The larger the sample, the better the
perception that the sample accurately reflects any patterns or characteristics of the
population (see Babbie, 2012). It was best to work down from the top of the population to
determine the appropriate target population. Narrowing the cases in the population for
research defines the target population (Singleton & Straits, 2010). The results were
generalized from the target population.
PopulationReduced to small
businesses 15-250 employees N = 594
Sampling procedurez-test Binary Logistic
RegressionOdds Ratio 3.44
.05 α error probability,
.80 1-β error probability n = 107
Recruitment, participation and
data collectionE-mail to Information Technology Mangers
InstrumentationOnline survey
Data AnalysisPlan
Multiple Logistic Regression

83
Membership in the Greater Cincinnati Chamber of Commerce includes
4,065 businesses of varying size (Greater Cincinnati Chamber of Commerce, 2014). The
businesses, located in Ohio, Indiana, and Kentucky, were all within a 40-mile radius of
downtown Cincinnati. Many large international companies in this area rely on small
feeder companies for their services. The population was narrowed to include small
businesses only, which significantly reduced the population size. The proposed target
population for this study was small businesses with 15 to 250 employees that use
computers with data backup operations. The Greater Cincinnati Chamber of Commerce
had approximately 594 businesses that met the specified criteria (Greater Cincinnati
Chamber of Commerce, 2014). I selected participants from this filtered listing, from the
Greater Cincinnati Chamber of Commerce of small businesses with 15 to 250 employees.
Sampling and Sampling Procedures
Sampling, a subset of a population chosen for a study using an operational
definition that provided a basis for the sampling, was an inexpensive and efficient way to
gather data about a subject. The sampling frame was the frame for all cases from which
the sample was selected was established with reference to entities from which the
sampling units were chosen for the survey (Singleton & Straits, 2010). The sampling
criterion was an operational definition that provides a basis for the sampling. It ensured
that there was a sufficient population from which to derive an appropriate sample. The
criterion for the sampling frame for this research was a simple filtering of the Greater
Cincinnati Chamber of Commerce business listing. The sample of small businesses

84
narrowed to 15 to 250 employees (N=594), was used because this is the
typical size of organizations that had a need to back up their data but frequently did not
had a robust backup plan (deGuise, 2008). This sampling frame of small businesses with
15 to 250 employees was appropriate because it was possible to find businesses of this
size in more than one market, made it easy to duplicate.
Next, the sample size was selected using power analysis software. Power analysis
was designed to determine the correct sample size to detect an effect of a given size
(G*Power, 2014). Statistical power depended on statistical significance, the magnitude of
the effect on the population, and the sample size that detected the effect (G*Power,
2014). Power analysis determined the proper sample size that allowed the detection of an
effect based on a specific size and degree of confidence (Muijs, 2011). A power analysis
was conducted using G*Power 3.1.9.2 software determined whether the sample size met
minimum standards for logistic regression. Binary logistic regression was the best test. I
chose the power analysis based on this methodology.
Next, a z test logistic binary regression (G*Power 3.1.9.2) was used to calculate
the sample size. The power analysis involved an a priori sample size given α, power, and
effect size. The variables used for the power analysis included an odds ratio of 3.05
(H1=.641 and H0=.369), an alpha error probability of .05, and a β error probability of .20
two tailed test, R2 other X=0, distribution Binary. I used .80, which was a common power
choice for dissertation research (Babbie, 2012). The total sample size returned from the
software was n = 107, with a power of .80 (see Figure 11). Finally, I used the Omnibus

85
Test for Model Coefficients to determine the linearity and significance of the
binary logistic regression. A result of p < .05 indicated a significant result that the overall
model was predictive of the need for a data backup indicator (Lund Research, 2017).
Figure 11. Power analysis. (G*Power Software, 2014).
Procedures for Recruitment, Participation, and Data Collection
The target population for this study was businesses with 15 to 250 employees
determined by filtering the Greater Cincinnati Chamber of Commerce business listing.
Each listing had key personnel from the organization listed, including their name, phone
number, and e-mail address. Each organization’s chief information officer or manager
received an email regarding the purpose of the survey. If no response was received, a

86
follow-up e-mail or letter (if necessary) was sent to confirm participation in
the study. Those who confirmed their participation completed an online consent-to-
participate form. The survey instrument was presented online for ease of access and to
simplify data collection. The survey procedure was detailed in Figure 12. Each returned
survey was assigned a sequential number. The results from the surveys were statistically
analyzed using binary logistic regression.
Instrumentation and Operationalization of Constructs
Surveys were the best instruments for obtaining data or specific information on
participants for this study since Babbie (2012) explained that a survey design provides a
statistical description of the attitudes, trends, or opinions of a population by studying a
sample of that population. The general features of survey research included a large
number of respondents selected using sampling procedures, a questionnaire, or interview
procedures with specific questions related to the subject matter and appropriate coding
and analysis of the collected data to answer the specific research questions (Singleton &
Straits, 2010). The basic design of the survey was a series of questions asked of
participants. The data gathered was summarized using frequencies or percentages. Then,
inferences were made from the responses (Leedy & Ormond, 2013).
Surveys catch a snapshot of attitudes and opinions in time and to allowed for
generalizations about the future (Leedy & Ormond, 2013). Participants in this study
responded to questions online, from the comfort of home, the office, or anywhere with
Internet access. The survey process was outlined in Figure 12. The survey measured the
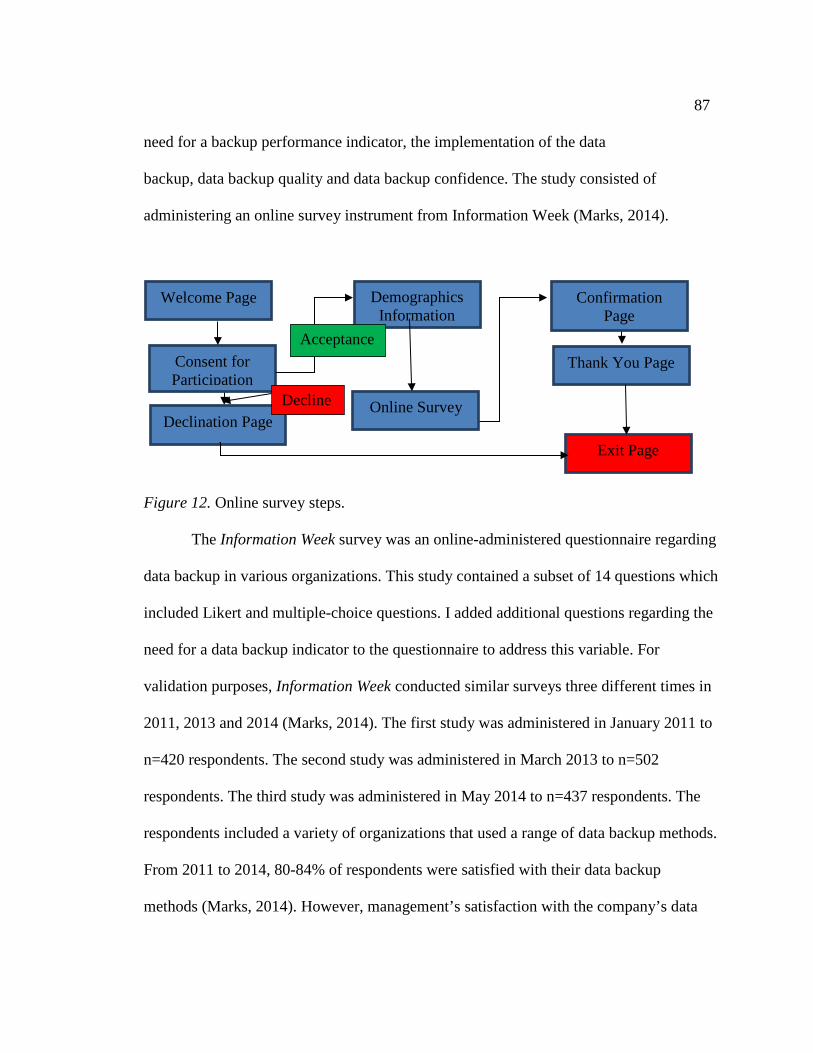
87
need for a backup performance indicator, the implementation of the data
backup, data backup quality and data backup confidence. The study consisted of
administering an online survey instrument from Information Week (Marks, 2014).
Figure 12. Online survey steps.
The Information Week survey was an online-administered questionnaire regarding
data backup in various organizations. This study contained a subset of 14 questions which
included Likert and multiple-choice questions. I added additional questions regarding the
need for a data backup indicator to the questionnaire to address this variable. For
validation purposes, Information Week conducted similar surveys three different times in
2011, 2013 and 2014 (Marks, 2014). The first study was administered in January 2011 to
n=420 respondents. The second study was administered in March 2013 to n=502
respondents. The third study was administered in May 2014 to n=437 respondents. The
respondents included a variety of organizations that used a range of data backup methods.
From 2011 to 2014, 80-84% of respondents were satisfied with their data backup
methods (Marks, 2014). However, management’s satisfaction with the company’s data
Welcome Page
Consent for Participation
Demographics Information
Declination Page
Exit Page
Confirmation Page
Online Survey
Thank You Page
Decline
Acceptance

88
backup method did not necessarily indicate the level of accuracy because
management’s understanding of the data backup process may not have been complete.
Each participant was asked 14 questions in an online format (see Appendix A).
Participants who were comfortable with computers easily completed the questionnaire,
saving time and effort (Leedy & Ormond, 2013). The answers were coded and entered
into SPSS Version 21for analysis.
I received approval from the Walden IRB board for the survey (#09-29-16-
0122660). Cronbach’s alpha determined the validity and measurement of the actual
survey questions (Leedy & Ormond, 2013). SPSS measured the Cronbach’s alpha using
survey questions 6, 10, 12, and 14, directly measured the research question (Table 3).
Table 3
Variables and Corresponding Survey Questions
Variables Questions
Need for data backup performance indicator Implementation of data backup Data backup quality Data backup confidence
14 6 10 12
The expected outcome was a Cronbach alpha of .80 or better (Jaggia & Kelly,
2013).
Operationalization
Operationalization changed variables into measurable data (Leedy & Ormond,
2013). Variables were not easily measured, and the determination of measurability was
difficult to create. The operational definitions for each variable were:

89
Backup confidence: The level of certainty that data copied from a
storage medium (e.g., a CD, hard drive, tape, or cloud) to a remote medium (e.g., a CD,
hard drive, tape, or cloud). This variable was measured using five responses (extremely
confident, very confident, neutral, slightly confident or not confident) on question 12.
Backup quality: The standard of measurement of a manual or automatic electronic
process of copying data files from a storage medium (e.g., a CD, hard drive, tape, or
cloud) to a remote medium (e.g., a CD, hard drive, tape, or cloud). This variable was
measured using five responses (very satisfied, satisfied, neutral, dissatisfied and very
dissatisfied) on question 10.
Data backup problem: Any problem related to the backup of data operation.
Data restoration problem: Any problem related to restoring data from a backup
medium.
Implementation of data backup: The action of copying of files from one medium
(e.g., a hard drive) to another medium (e.g., a CD, hard drive, tape, or cloud) to preserve
data for storage and future retrieval. This variable was measured using two choices (yes
or no) on question 6.
Need for a data backup performance indicator: The perceived standard of
measurement applied to a single data backup session in which data were copied from a
CD, hard drive, tape, or cloud and stored onto another CD, hard drive, tape, or cloud
measured using a yes or no response. This was measured using survey question 14.

90
Data Analysis Plan
The best methodology for this study was a binary logistic regression (Table 4).
The study was designed to establish whether there was a need for a backup performance
indicator by evaluating the relationship between the independent variables of
implementation of data backup, data backup quality, and data backup confidence and the
dependent variable need for a backup performance indicator. An organization enters the
value of the independent variables in the binary logistic regression to determine if there
was a need for a backup performance indicator.
Binary logistic regression has two or more independent variables and the
dependent variable (nominal) has only two outcomes. The binary categories for the
dependent variable were predicted by the independent variables, which can be a
Table 4 Data Analysis Chart
Research Question Hypothesis Data Analysis RQ. What was the relationship between implementation of data backup, data backup quality, data backup confidence, and the need for a backup performance indicator?
H0. There was no relationship between implementation of data backup, data backup quality, data backup confidence, and the need for a backup performance indicator. HA: There was a relationship between the need for a data backup performance indicator (dependent variable), and at least one of the independent variables of implementation of data backup, data backup quality, and data backup confidence.
Binary Logistic Regression

91
combination of discrete or continuous variables (Leedy & Ormond, 2013).
Two possible outcomes for the dependent variable classified the need for a data backup
indicator; therefore, the logistic regression equation accounted for the coefficient bj based
on the observations indexed by i (Figure 13). The binary logistic regression equation
included the natural logarithms e and additional coefficients, including multiple
predictors of Yi, as follows:
P(Yi)=1/1+e-( b0+b1X1i+b2X2i+b3X3i)
P-hat = eb0+b1x1+b2x2+b3x3/1+eb0+b1x1+b2x2+b3b3
Figure 13. Binary logistic regression equation.
The left side of the equation captured the probability P(Yi), where Y occurs for
the i-th observation such that the need for a data backup indicator was classified as yes or
no. P(Yi) produced probabilities between 0 and 1. The value of e was the base of the
natural logarithm, which was a mathematical constant. The closer the probability was to 1
the more likely that there was a desire or need for a performance backup indicator. The
closer the probability was to 0 the less likely there was a desire or need for a performance
backup indicator.
The parameter for bi was estimated using maximum-likelihood estimation. By
selecting values optimized to make the observed data most likely to have occurred,
minimizes the errors. The data were evaluated using SPSS. In SPSS, the binary logistic
regression had three methods to determine the best model: forced entry, forward, or
backwards stepwise. I used forced entry, which was the default in which all the predictors

92
were located in a single block. Next the data were analyzed using the
Omnibus Test for Model Coefficients. This test checked for linearity and significance of
the binary logistic regression.
The binary logistic regression equation requires that an odds ratio indicates the
change in odds, resulting in a unit change in the predictor (X). The odds of an event
occurring were defined as the probability of that event taking place divided by the
probability of the event not taking place (Jaggia & Kelly, 2013). Next, I calculated the
odds and the proportional change in the odds for the variables good fit and not a good fit.
If the calculated odds ratio value was greater than 1, then the odds of the outcome
increased. If the value of the odds ratio was less than 1, then the odds of the outcome
decreased.
Threats to Validity and Trustworthiness
Internal validity was the ability to determine if the independent variable produces
the desired observed effect on the dependent variable (Leedy & Ormond, 2013).
Therefore, to ensure internal validity, the independent variable must produce a variation
that affects the dependent variable. In this study, there were no confounding variables
that would affect internal validity. Due to the nature of the study, the survey was adopted
from the corporate environment because there was difficulty finding studies that were
peer reviewed and contained surveys about data backup practices. I had adapted the
Information Week data backup survey for my study and included one additional question
regarding the need for a data backup indicator. The traditional variables that were

93
controlled included history, maturation, testing, instrumentation, selection,
and mortality (Babbie, 2012; Leedy & Ormond, 2013). Of these four variables, internal
validity was affected by history, instrumentation, and selection.
History affected internal validity because there were few documented studies that
had measured data backup and organizational plans for disaster recovery. History can
also affect internal validity due to the possibility of an event (disaster) occurring before
the quantitative survey was issued, which could have affected the outcome of the study. I
used random sampling for this study, but it was possible that selection could affect the
study due to the limited size of the population. Each potential participant from the
population was assigned a number from 1 to 594. A random number generator in
Microsoft Excel was used to select the 120 participants for the study from the original
population of 594. All participants in the selection pool had the same chance of selection.
External validity tested the generalization of a study to other populations. If the
same results occur in other locations, then that study had external validity (Babbie, 2012).
It was difficult to determine external validity, however, because there were many factors
that affect a study. There were two types of external validity: population and ecological.
Population external validity focused on the study population and how representative the
sample was. Other researchers had the ability to duplicate this study using a larger or
smaller sample size without any repercussions on the outcome. The parameters measured
in this study (Leedy & Ormond, 2013) were universal regardless of the population size.
Further, because computer files were universal in nature, the use of data backup,

94
regardless of business size, did not change. The content was different but the
physical file type remained constant. Ecological external validity measured whether the
results of a study were generalized to other locations. Because the variables in this study
were universal, external validity was not affected. The variables used were universal
because they measure the same concepts regardless of business size.
Ethical Considerations
Ethical issues in research were divided into three categories, including protection
from harm, informed consent, and the right to privacy (Leedy & Ormond, 2013). Data
collected from the Internet were well protected just like data collected in person.
Participants in this study were protected from harm as there were no physical demands,
and there were minimal psychological demands regarding the questionnaires. The
Walden Institutional Review Board ensured that the study was of minimal risk to
participants, that it complied with federal and university regulations on the use of human
subjects, and each participant gave informed consent. Each participant completed an
online informed consent request that outlined the requirements of the study, indicated that
participation was voluntary, and assured anonymity and confidentiality. The consent form
provided an explanation of the right to privacy.
Summary
This chapter was a review of the methodology used to gather data for this
exploration of the relationship between data backup, data backup confidence, data backup
quality, and the need for a backup performance indicator. The research methodology for

95
this study was a correlational quantitative method. The correlational
quantitative method was best because (a) it was the least expensive, (b) it was efficient,
and (c) it explained the relationship between variables. Data collected using a quantitative
survey were analyzed using binary logistic regression. Problems with internal validity,
external validity, and ethics were not expected, and the study was eligible for duplication
in the future.

96
Chapter 4: Results
The purpose of this study was to examine the relationship between the
implementation of data backup, data backup quality, and data backup confidence and the
need for a data backup performance indicator. Small businesses throughout the world are
vulnerable to disasters. Over 40% of small businesses failed immediately after a disaster,
and over 20% failed within 3 years of a disaster (Goldsborough, 2012). This chapter
includes the data collection, results, and a summary. The research question and
hypothesis were as follows:
What was the relationship between the implementation of data backup, data
backup quality, data backup confidence (independent variables) and the need for a data
backup performance indicator (dependent variable)?
H0: There is no relationship between the need for a data backup performance
indicator (dependent variable) and the implementation of data backup, data backup
quality, and data backup confidence (independent variables).
HA: There is a relationship between the need for a data backup performance
indicator (dependent variable) and at least one of the independent variables of
implementation of data backup, data backup quality, and data backup confidence.
Data Collection
The data were collected using the Qualtrics survey instrument from October 2016
to January 2017. The participants were asked to complete 14 questions on the Qualtrics

97
online survey instrument related to demographic information and data backup.
The participants were members of small businesses with 15 to 250 employees in the
Greater Cincinnati, Northern Kentucky, and Southern Indiana areas. I recruited the target
population of 540 participants from the Greater Cincinnati Chamber of Commerce
database. Of these participants, I obtained a sample of 107 participants, which was more
than the G-Power software recommended. The data were coded for analysis in SPSS as
shown in Table 5.
Table 5
Coding of Responses
Questions Coding/conversion of letters to numbers 6, 7 and 14
0 – No and 1 - Yes
1, 2, 3, 4, 5, 9, 10, 12 a-1, b-2, c-3, d-4, e-5, f-6, g-7, h-8, i-9, j-10, k-11, l-12, m-13, n-14, o-15, p-16
Results
The data were analyzed using binary logistic regression featuring three
independent variables (implementation of data backup, data backup quality, and data
backup confidence) and one dependent variable (need for data backup performance
indicator). Binary logistic regression was the best option because the binary categories
for the dependent variable were predicted by the independent variables, which could be
discrete or continuous (Leedy & Ormond, 2013). Binary logistic regression is used to
examine the relationship between one or more independent (predictor) variables and a
single dichotomous dependent (outcome) variable. The purpose of this analysis was to
use the independent variables to estimate the probability that a case was a member of one

98
group versus the other. The binary logistic regression used in this study
created a linear combination of all the independent variables to predict the log-odds of the
dependent variable. In this analysis, the overall significance of the regression model was
tested by computing the X2 statistic (Omnibus Test of Model Coefficients), which was
used with the degrees of freedom (df) to compute the p value (i.e., significance level). A
significant overall model meant the set of independent variables significantly predicted
the dependent variable. If the overall model was significant, then each independent
variable was assessed. In this case, the model was not significant because the resulting p
value was greater than .05. An odds ratio was computed for each independent variable
and showed the extent to which each independent variable affected the probability that a
case was a member of one outcome group or another. In a binary logistic regression
model, the dependent variable must be dichotomous (i.e., there are only two possible
outcomes), the observations must be independent of other outcome groups, and the
relationship between the independent variables and the logit-transformed dependent
variable must be linear. The two outcomes for the dependent variable were yes or no.
Laerd Statistics (Lund Research, 2017) indicated the assumptions of
logistic regression:
1. Logistic regression does not assume a linear relationship between the
dependent and independent variables.
2. The dependent variable must be dichotomous (two categories).

99
3. The independent variables need not be interval, normally
distributed, linearly related, or of equal variance within each group.
4. The categories (groups) must be mutually exclusive and exhaustive; a case can
be in only one group and every case must be a member of one of the groups.
5. Larger samples are needed for linear regression because the maximum
likelihood coefficients are large sample estimates. A minimum of 50 cases per
predictor is recommended.
6. There needs to be a linear relationship between the continuous independent
variables and the logit transformation of the dependent variable.
7. The data must not show multicollinearity.
8. There should be no significant outliers, high leverage points, or highly
influential points (Laerd Statistics, 2017, p. 3).
The first five assumptions were verified in the design of the study. I tested Assumptions 6
through 8 using the Box Tidwell (1962) procedure. The data were deemed satisfactory
and without any irregularities.
I analyzed the data using SPSS v.21. The results are displayed in Tables 6 through
22, which feature descriptive statistics and results from the binary logistic regression.
Most of the respondents were members of small businesses with 15-50 (63.7%)
employees (see Table 6 and Figure 14). Most of the organizations (79.4%) were in the
Greater Cincinnati area. The others were in Northern Kentucky, Southern Indiana, and
outside the area (20.5%) (see Table 7 and Figure 15).

100
Table 6
Number of Employees
Number of employees Frequency Percent Valid percent Cumulative percent
15-50 68 63.7 63.6 63.6 51-100 8 7.5 7.5 71.0 101-150 5 4.7 4.7 75.7 151-200 5 4.7 4.7 80.4 201-250 6 5.6 5.6 86.0 251- greater 15 14 14 100 Total 107 100 100
Figure 14. Number of employees by company size.

101
Table 7
Company Location
Frequency Percent Valid percent Cumulative percent Greater Cincinnati 85 79.4 79.4 79.4
Northern Kentucky 12 11.2 11.2 90.7
Southern Indiana 4 3.7 3.7 94.4 Other 6 5.6 5.6 100 Total 107 100 100
Figure 15. Business locations.
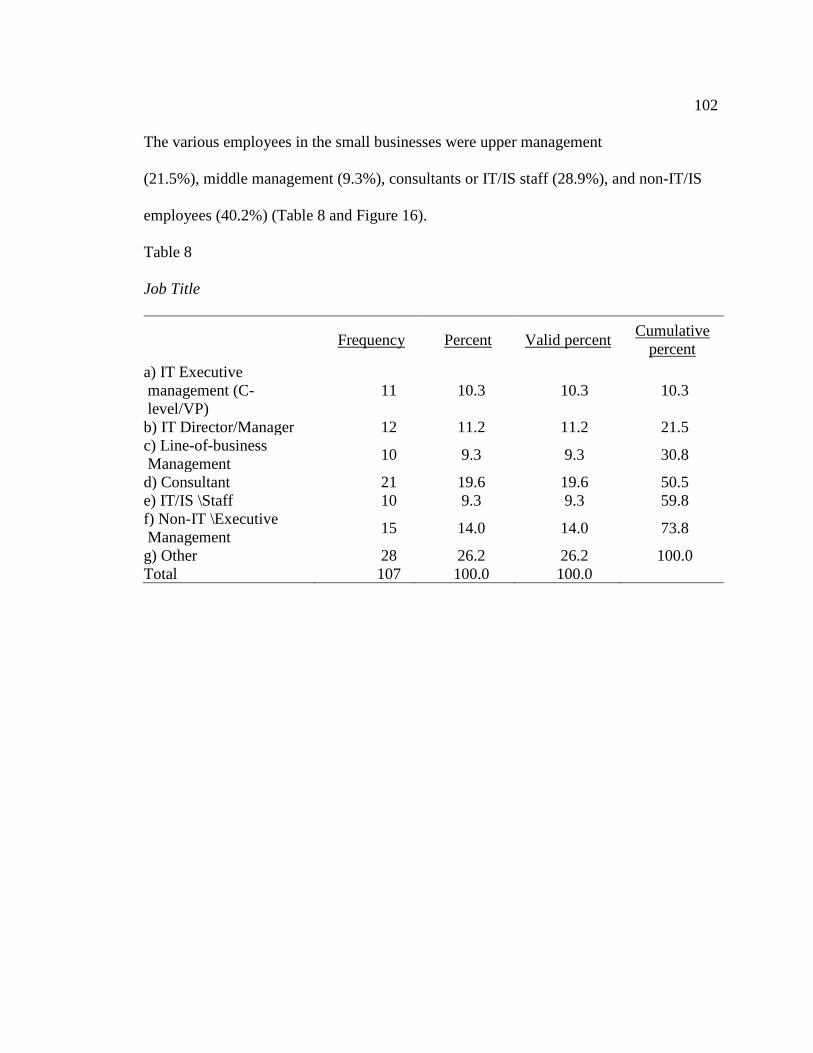
102
The various employees in the small businesses were upper management
(21.5%), middle management (9.3%), consultants or IT/IS staff (28.9%), and non-IT/IS
employees (40.2%) (Table 8 and Figure 16).
Table 8
Job Title
Frequency Percent Valid percent Cumulative percent
a) IT Executive management (C-level/VP)
11 10.3 10.3 10.3
b) IT Director/Manager 12 11.2 11.2 21.5 c) Line-of-business Management 10 9.3 9.3 30.8
d) Consultant 21 19.6 19.6 50.5 e) IT/IS \Staff 10 9.3 9.3 59.8 f) Non-IT \Executive Management 15 14.0 14.0 73.8
g) Other 28 26.2 26.2 100.0 Total 107 100.0 100.0

103
Figure 16. Employee position.
Annual revenue for 32.7% (n=35) of the companies was over $1 million, but there were a
significant number (26.2%, n=28) of small business that earned $50,000 or less per year
(Table 9 and Figure 17).

104
Table 9
Annual Revenue
Frequency Percent Valid percent Cumulative
percent a) Don’t know/decline to say 19 17.8 17.8 17.8
b) 0 - 50,000 28 26.2 26.2 43.9 c) 50,001 - 250,000 12 11.2 11.2 55.1 d) 250,001 -750,000 6 5.6 5.6 60.7 e) 750,001 – 1 Million 7 6.5 6.5 67.3 f) Greater than 1 Million 35 32.7 32.7 100.0 Total 107 100.0 100.0
Figure 17. Annual revenue.
Small business respondents were from a variety of industries, with the largest
percentage of respondents in consulting 16.8% (n=18), retail 12.1% (n=13), and other
15% (n=16) (Table 10 and Figure 18).

105
Table 10
Primary Industry
Frequency Percent Valid
percent Cumulative
percent a) Consulting and business services 18 16.8 16.8 16.8
b) Education 9 8.4 8.4 25.2 d) Financial Services 4 3.7 3.7 29.0 f) Healthcare/Medical 9 8.4 8.4 37.4 g) Insurance/HMOs 2 1.9 1.9 39.3 h) IT Vendors 7 6.5 6.5 45.8 i) Logistics/Transportation 6 4.5 4.5 51.7 j) Manufacturing/Industrial, non-computer 4 3.7 3.7 55.1
k) Media/Entertainment 8 7.5 7.5 62.6 l) Nonprofit 10 9.3 9.3 72.0 m) Retail/E-commerce 13 12.1 12.1 84.1 o) Utilities 1 .9 .9 85.0 p) Other 16 15.0 15.0 100.0 Total 107 100.0 100.0
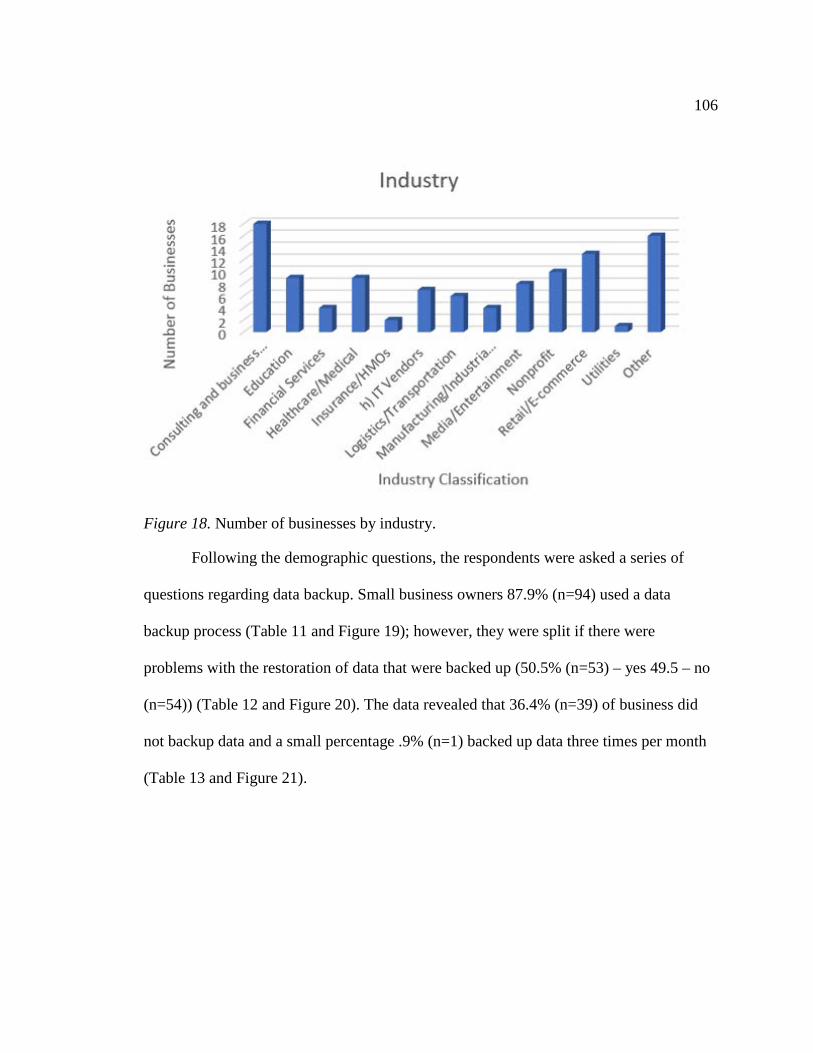
106
Figure 18. Number of businesses by industry.
Following the demographic questions, the respondents were asked a series of
questions regarding data backup. Small business owners 87.9% (n=94) used a data
backup process (Table 11 and Figure 19); however, they were split if there were
problems with the restoration of data that were backed up (50.5% (n=53) – yes 49.5 – no
(n=54)) (Table 12 and Figure 20). The data revealed that 36.4% (n=39) of business did
not backup data and a small percentage .9% (n=1) backed up data three times per month
(Table 13 and Figure 21).
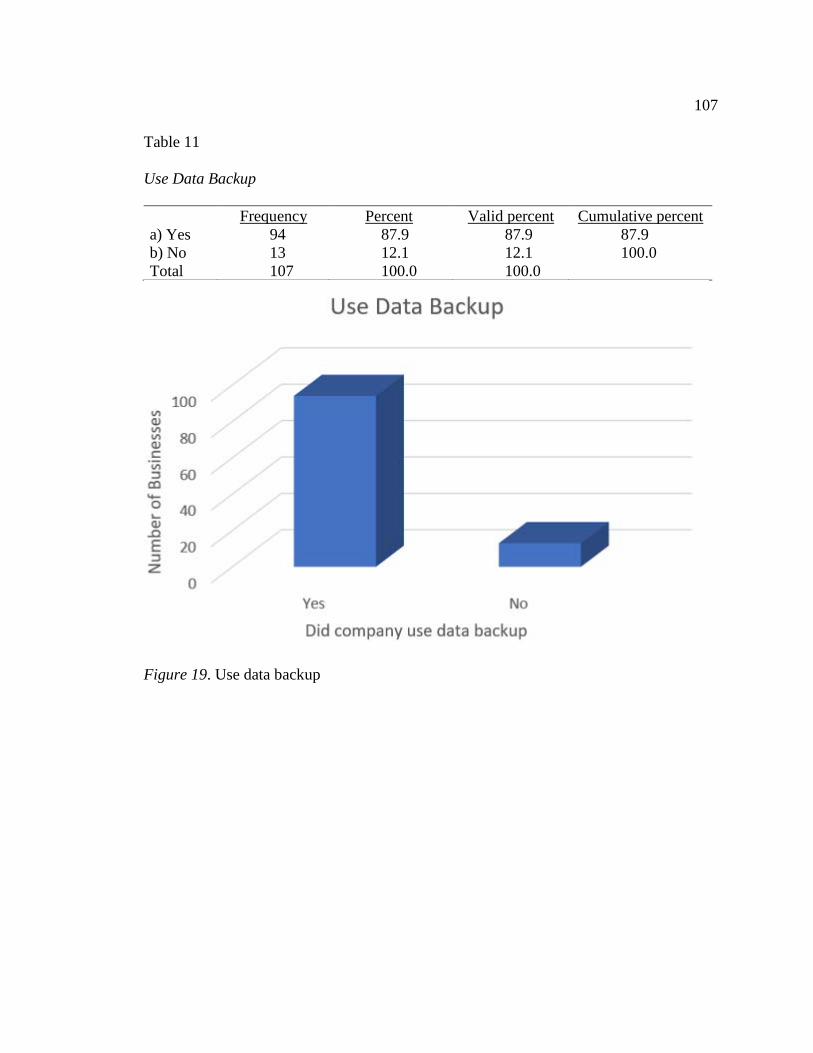
107
Table 11
Use Data Backup
Frequency Percent Valid percent Cumulative percent a) Yes 94 87.9 87.9 87.9 b) No 13 12.1 12.1 100.0 Total 107 100.0 100.0
Figure 19. Use data backup

108
Table 12
Problems with Data Backup
Frequency Percent Valid percent
Cumulative percent
No– with restoration and/or backup
54 50.5 50.5 50.5
Yes - with restoration and/or backup
53 49.6 49.5 100.0
Total 107
100.0
100.0
Figure 20. Problems with data backup

109
Table 13
Frequency of Data Backup
Frequency Percent Valid Percent Cumulative Percent
Never 39 36.4 36.4 36.4 Annually 11 10.3 10.3 46.7 Once per quarter 19 17.8 17.8 64.5 Twice per quarter 5 4.7 4.7 69.2 Once a month 17 15.9 15.9 85.1 Twice per month 8 7.5 7.5 92.6 Three times per month 1 .9 .9 93.5 More than three times per month
7 6.5 6.5 100.0
Total 107 100.0 100.0
Figure 21. Frequency of data backup
Concerning satisfaction with data backup quality, 71% (n=76) of the respondents
reported their level of satisfaction from very satisfied to satisfied, 22.4% (n=24) were
neither satisfied nor dissatisfied and 6.5% (n=7) were either not satisfied or very

110
dissatisfied (Table 14 and Figure 22). There were 68.3% (n=73) small
business that either felt extremely or very confident in their data backup. Only 8.4%
(n=9) were either slightly or not confident in the data backup (Table 15 and Figure 23).
Table 14
Quality of Data Backup
Frequency Percent Valid percent
Cumulative percent
Very dissatisfied 1 .9 .9 .9 Dissatisfied 6 5.6 5.6 6.5 Neither satisfied nor dissatisfied 24 22.4 22.4 28.9 Satisfied 48 44.9 44.9 73.8 Very satisfied 28 26.2 26.2 100.0 Total 107 100.0 100.0
Figure 22. Satisfaction with in data backup

111
Table 15
Confidence with Data Backup
Frequency Percent Valid percent Cumulative percent Not confident 6 5.6 5.6 5.6 Slightly confident 3 2.8 2.8 8.4 Neutral 25 23.3 23.4 31.8 Very confident 48 44.9 44.9 76.7 Extremely confident
25 23.4 23.4 100.0
Total 107 100.0 100.0
Figure 23. Confidence in data backup
Responses to the final question indicated that 64.5% (n=69) of the respondents did not
feel there was a need for a data backup indicator while 35.5% (n=38) did (Table 16 and
Figure 24).

112
Table 16
Need for Data
Backup Indicator
Frequency Percent Valid percent Cumulative
percent No 69 64.5 64.5 64.5 Yes 38 35.5 35.5 100.0 Total 107 100.0 100.0
Figure 24. Need for data backup indicator. Results of Hypothesis Testing
What was the relationship between the implementation of data backup, data
backup quality, data backup confidence (independent variables), and the need for a data
backup performance indicator (dependent variable)?

113
H0: There was no relationship between the need for a data backup
performance indicator (dependent variable), the implementation of data backup, data
backup quality, and data backup confidence (independent variables).
HA: There was a relationship between the need for a data backup performance
indicator (dependent variable), and at least one of the independent variables of
implementation of data backup, data backup quality, and data backup confidence.
The validity was tested using a Cronbach’s Alpha (α) with an expected outcome
of .80 or greater. The (α) measured the reliability of scale. The study results were an α of
.64 for the three independent variables. A small sample can affect the outcome of the
Cronbach’s alpha (Lund Research, 2017). This was less than the initial expected output
but greater than .50 which indicates there was a positive relationship of the measurement
but a poor outcome.
A binary logistic regression was performed to determine the effects of data
backup, data backup quality and data backup confidence (independent variables) on the
need for a data backup indicator (dependent variable). A binary logistic regression is
valid if the continuous independent variables are linearly related to the logit of the
dependent variable (Lund Research, 2017). Linearity of the independent continuous
variables with respect to the logit of the dependent variable was assessed via the Box-
Tidwell (1962) procedure (Lund Research, 2017).
The Box Tidwell (1962) transformation was used to a) perform an initial
analysis with the independent variables of interest in the regression

114
equation, b) transform all independent variables of interest via the Box
Tidwell, c) enter them into the regression simultaneously along with the
original untransformed variables and d) see which one of the transformed
variables were significant (Osborne, 2014, p. 208).
Based on the Box-Tidwell (1962) transformation, the binary logistic regression
was only valid if the p-values of all continuous independent variables were greater than
the Bonferroni corrected alpha. The Bonferroni correction was used to adjust the p-value
to reduce the chances of false-positive (Type 1) errors (Lund Research, 2017). This
correction was calculated by dividing the alpha of .05 by the number of non-categorical
variables in the model including the constant (.05/6). The Bonferroni correction for
statistical significance is .008333.
All continuous independent variables were transformed into their respective
natural logs per the requirements of the Box-Tidwell (1962) transformation (Table 17).
Only non-categorical independent variables were tested for linearity. The variable data
backup was categorical due to the dichotomous outcome of yes and no and was not tested
for linearity. The natural log transformations of In_QualityBU by QualityBU and
In_ConfidenceBU by ConfidenceBU were tested for interaction to determine if the
continuous independent variable is linearly related to the logit of the dependent variable
(Lund Research, 2017). A binary regression is valid when the continuous independent
variables are linearly related to the logic of the dependent variable. If the interaction of
the natural log transformation is not statistically significant the continuous independent

115
variables are linearly related to the logit of the dependent variable (Lund
Research, 2017). Based on this assessment, the interaction terms In_QualityBU by
QualityBU (sig =.980) and In_ConfidenceBU by ConfidenceBU (sig =.656) were found
to be linearly related to the logit of the dependent variable because all p-values are above
.008333 (Table 17). The result indicated that the binary logistic regression was a valid
statistical test.
Table 17
Box Tidwell Test Interaction Output
B S.E. Wald df Sig. Exp(B) 95% C.I. for Exp(B) Lower Upper
Step 1a
UseBU -1.465 .843 3.021 1 .082 .231 .044 1.205 QualityBU .415 1.541 .073 1 .788 1.515 .074 31.070 ConfidenceBU .815 1.566 .271 1 .603 2.260 .105 48.663 In_QualityBU by QualityBU
.020 .778 .001 1 .980 1.020 .222 4.688
In_ConfidenceBU by ConfidenceBU
-.350 .786 .198 1 .656 .705 .151 3.287
Constant -1.044 2.421 .186 1 .666 .352
There were two objectives of the binary logistic regression: 1) to determine
which independent variables were significant and had an effect on the dependent
variable and 2) determine how the binary logistic regression model predicted the
dependent variable. The Omnibus Test Model Coefficients measured the statistical
significance of the model (Lund Research, 2017). This test was used to determine if the
explained variance was significantly greater than the unexplained variance. There were
two models: baseline and current. The baseline was a model without the independent

116
variables. The current model included all independent variables. First, the
baseline model was used to test the model without independent variables. This model
was used as a comparison when the independent variables were re-introduced to the
model. The base model correctly classified 64.5% of the cases (Table 18). The base
model was statistically significant (p=.003) (Table 19). The variables in the equation
showed that the constant was included in the model. The variables that were not
included were listed in Table 20.
Table 18
Base (Null) Model Comparison
Observed
Predicted Yes No
Percentage correct
Need_Data_Backup_ Indicator
Yes 0 38 0 No 0 69 100
Overall Percentage 64.5
Table 19
Base (Null) Model Regression Output - Variables in the Equation
B S.E. Wald df Sig. Exp(B) Step 0 Constant .597 .202 8.720 1 .003 1.816 Table 20
Variables Not Included in Base (Null) Model Regression Output
Score df Sig.
Step 0 Variables UseBU .999 1 .317 QualityBU 2.620 1 .106 ConfidenceBU 2.207 1 .137
Overall Statistics 6.789 3 .079

117
There were no outliers in the analysis. The model correctly classified
75% of the cases (Table 21) and explained 8.5% of the variance in the need for a data
backup indicator (Table 22). The sensitivity of the model (those that had observed
characteristic that was correctly predicted by the model with a “yes”) was 34.2% and
specificity (those that did not have the observed characteristic specified by a “no”) was
89.9%. The positive predictive value (the percentage of correctly predicted cases with the
observed characteristic compared to the total number of cases predicted as having the
characteristic) was 65% (100 x (13/(7+13))) and the negative predictive value was
71.26% (100 x (62/(25+62))).
Table 21
Classification Tablea
Observed
Predicted Percentage correct Yes No
Need_Data_Backup_Indicator Yes 13 25 34.2 No 7 62 89.9
Overall Percentage 75.0
Table 22
Model Summary
Step -2 Log likelihood Cox & Snell R square Nagelkerke R square 1 132.178a .062 .085
Second, the independent variables were re-introduced to the model. A p < .05
indicated that the current model performed better than the null model. The results of the

118
Omnibus Test of Model Coefficients indicated that the overall model was not
statistically significant by a small margin X23 =6.933, p=.074 (Table 23).
Table 23
Omnibus Tests of Model Coefficients
Chi-square Df Sig.
Step 1 Step 6.933 3 .074 Block 6.933 3 .074 Model 6.933 3 .074
Finally, the variables in the equation were assessed to determine if they made a
significant contribution. The Wald statistic was evaluated for significance using an alpha
of .05. If the p-value was less than .05 the variable made a significant contribution.
Within the current model the three predictor variables were not individually significant
indicating that the independent variables did not have an effect on the dependent variable
(Table 24).

119
Table 24
Binary Logistic Regression Output
B S.E. Wald df Sig. Exp(B) 95% C.I.for EXP(B)
95% C.I.for EXP(B)
lower upper
Step 1a
UseBU -1.503 .812 3.431 1 .064 .222 .045 1.091 QualityBU -.560 .337 2.753 1 .097 .571 .295 1.107 ConfidenceBU -.098 .260 .141 1 .707 .907 .545 1.510 Constant 3.351 1.157 8.387 1 .004 28.542
a. Variable(s) entered on step 1: UseBU, QualityBU, ConfidenceBU.
Summary
Chapter 4 described the variables, sample population for this study and addressed
the research question and hypothesis. The purpose of this study was to determine the
need for a data backup indicator for small businesses (15 to 250 employees). Small
businesses were vulnerable to disasters and many did not return to operations after a
disaster. A binary logistic regression was used to test the hypothesis. I examined the
relationship between the implementation of data backup, data backup quality, data
backup confidence and the need for a data backup performance indicator and found the
independent variables did not affect the dependent variable. Based on these results, the
null hypothesis, there was no relationship between the need for a data backup
performance indicator (dependent variable), implementation of data backup, data backup
quality, and data backup confidence (independent variables), was not rejected. In Chapter
5, I discussed the interpretation of the findings, limitations, recommendations for the
future and social change.

120
Chapter 5: Conclusions and Recommendations
This chapter contains this study’s findings, an interpretation of the findings, the
limitations of the study, recommendations, recommendations for further research, and
implications for social change (Figure 26). The purpose of this study was to explore the
relationship between the implementation of data backup, data backup quality, and data
backup confidence and the need for a data backup performance indicator. The ability for
businesses to quickly return to operations after a disaster is important (Paldi et al., 2010).
The key findings indicated that there was not a significant relationship between
implementation of data backup, data backup quality, and data backup quality and the
need for a data backup performance indicator (X23= 6.933, p=.074).
Interpretation of the Findings
In Chapter 2, I reviewed literature addressing the need for businesses to create
disaster recovery plans and enact data backup procedures to ensure survival in the event
of a disaster. Thousands of organizations do not have a disaster recovery plan, or the one
on file has not been tested. The literature indicated that DRPs are not widely tested,
which places organizations in danger if a disaster occurs. Data backup is an important
element, and too many organizations do not take it seriously. Existing DRPs were
missing or lacked critical elements such as data backup and restoration procedures.
Disasters like floods, hurricanes, cyber-attacks, earthquakes, and fires have been
detrimental to business continuity. Abundant evidence showed that small businesses are
especially vulnerable to a disaster, which may result in catastrophic losses.

121
The results of the current study indicated that only a small number of
businesses did not back up data, but participants were split regarding the ability to restore
data after a disaster. This division indicated a reluctance to back up data due to the level
of mistrust in the systems. The literature also indicated that data backed up on a schedule
that fits the business model enhances the potential return to continuity. In the current
study, 68 respondents reported that they backed up data on a schedule, but 39 businesses
indicated they did not back up data at all. These findings were consistent with the
literature on data backup and disaster recovery plans (Gartner Group, 2013). The data
backup performance indicator had not been measured before; therefore, no literature
specifically addressed this indicator.
The true state of a small business’s data backup and restoration could be
explained by the data backup performance indicator. Even though organizations backed
up data and had problems with restoration, they did not see the need for a data
performance backup indicator. An overwhelming majority of participants (n = 69)
answered no regarding the need for a data backup performance indicator while the
remainder (n = 38) answered yes.
Based on the results of The Omnibus Test of Model Coefficients X23 =6.933, p
=.074, the null hypothesis that there is no relationship between the need for a data backup
performance indicator (dependent variable) and the implementation of data backup, data
backup quality, and data backup confidence (independent variables) was not rejected.
However, accepting the null does not mean failure. It means there was not sufficient

122
evidence to support the alternative hypothesis that there was a relationship
between the need for a data backup performance indicator (dependent variable) and at
least one of the independent variables of implementation of data backup, data backup
quality, and data backup confidence. A likely explanation for this result was many small
businesses had not experienced a data loss or disaster; therefore, participants did not
understand the importance of data backup and a data backup performance indicator.
These businesses were similar to the one that did not return to operations after a disaster.
Limitations of the Study
The study focused on small businesses with 15-250 employees in the Greater
Cincinnati area. This was a small and focused sample in relation to the total small
business population. The quantitative method limited the ability to reveal specific details
of the small businesses selected. I could not generalize about the population or the sample
selected. The population and sample were selected from the local area and with a change
of location, it was possible to obtain different results. One of the limitations of
quantitative studies that include self-reported information may be incomplete or
inaccurate data (Jaggia & Kelly, 2013). It was likely that participants under reported their
actual data backup instances. In addition, the inflexibility of the questions did not allow
for any changes once the survey started; therefore, a qualitative or mixed-methods study
might be appropriate to address this problem.

123
Recommendations
Because the results were not significant, I recommend three changes. First, I
recommend conducting a similar study using a mixed-methods approach to reveal
additional information regarding the problems with data backup. A quantitative method
does not allow for exploration of the participants’ viewpoints. A mixed-methods study
may reveal why the participants did not back up their data or see the need for a
performance data backup indicator. This approach would provide additional information
about the participants and allow generalizations of the sample and the results along with
the ability to learn different perspectives from participants. I recommend a triangulated
design with quantitative and qualitative approaches employed at the same time (see
Leedy & Ormond, 2013). The results of the current study indicated that organizations
backed up data and had problems with the restoration of the data backup. I would like to
know the specific problems encountered during a restoration of data.
Second, changing the definition of a performance data backup indicator might
lead to a different result. It is possible that definition of the performance data backup
indicator was not detailed enough for participants to understand what I wanted to
measure. However, when expanding the definition of the performance data backup
indicator, I had to be careful not to create a definition that would bias the results.
Third, the sample was expanded to include businesses that were larger but fit
within the scope of small businesses. Businesses with 15 to 50 employees dominated the
study. I recommend increasing the scope to businesses with a maximum of 1,500

124
employees using the categories from the Small Business Administration
(2016). An expansion of the business size could yield a different and significant result.
Implications for Social Change
Small businesses need to understand when they are in danger if a disaster occurs.
A significant number of small businesses operate without a disaster recovery plan or a
data backup plan (Egli, 2013). Those whose owners prepare for disasters are more likely
to survive a disaster. Preparing for a disaster requires discipline and the understanding
that it is important to have a disaster recovery plan.
Most small businesses did not think about the importance of a good data backup
(Knox, 2012). Even though the results showed no relationship between and among the
need for a data backup performance indicator, data backup, data backup quality and data
backup confidence, the danger was very prevalent. “Small businesses were responsible
for employing about half of private sector businesses and over 65% of new jobs in the
past 17 years” (Small Business Administration, 2012, p. 1). This was a significant sector
of the economy.
After a disaster, over 65% of businesses did not return to operations (Egli, 2013).
Losing these businesses can prove highly detrimental to the economy. Small businesses
should be ready to restore operations as quick as possible. The data backup performance
indicator can alert the organization of a potential problem at the time of restoration.
Warranted for small businesses specific and education and training detailing the
criticality of effective backup on the importance of data backup for a return to operations.

125
Business owners who change their behaviors about disaster planning,
prevented business closures, and contributed to a general unemployment decrease
coupled with an economic growth increase.
Conclusion
Small businesses were vulnerable to disasters and tended to close after one
strikes. Their disaster recovery planning, along with a backup plan, appeared critical to
their very survival. Many of these owners were found not to understand the severity of
data backup and disaster recovery planning and inadvertently consider data backup after a
disaster, which was too late. The use of a data backup performance indicator could
provide them important information regarding their data backup and the probability of
successful restoration. Indeed, in person or online training could well be established that
explains to them how the data backup process works and how important it was for them
to maintain the backup.

126
References
Abadi, D. J. (2009). Data management in the cloud: Limitations and opportunities.
Bulletin of the IEEE Computer Society Technical Committee on Data
Engineering, IEEE.
doi:http://doi.ieeecomputersociety.org/10.1109/TPDS.2013.169
Aboelmaged, M. G. (2010). Six Sigma quality: A structured review and implications for
future research. International Journal of Quality & Reliability Management,
27(3), 168-317. doi:10.1108/02656711011023294
Acostaa, J., & Chandra, A. (2013). Harnessing a community for sustainable disaster
response and recovery: An operational model for integrating non-governmental
organizations. Society for Disaster Medicine and Public Health, 7(4), 361-368.
doi:10.1017/dmp.2012.1
Agency, T. F. (2010). The Federal Emergency Management Agency. Retrieved from The
Federal Emergency Management Agency: https://www.fema.gov/about-agency
Aggelinos, G., & Katsikas, S. K. (2011). Enhancing SSADM with disaster recovery plan
activities. Information Management and Computer Security, 19(4), 248-261.
doi:10.1108/09685221111173067
Al-Badi, A., Ashrafi, R., Al-Majeeni, A., & Mayhew, P. (2009). IT disaster recovery:
Oman and cyclone Gonu lessons learned. Information Management & Computer
Security, 17(2), 114-125. doi:10.1108/09685220910963992

127
Alliance Storage Technologies. (2007). Case study: Hospital's data survives
hurricane Katrina. doi:10.1145/1666420.1666452
Altshuller, H. (1994). The art of inventing (and suddenly the inventor appeared).
Worchester, MA: Technical Innovation Center.
Arduini, F., & Marabito, V. (2010). Business continuity and the banking industry.
Association for Computing Machinery, 53(3), 121-125.
doi:10.1145/1666420.1666452
Arizona Emergency Management. (2011). Arizona emergency management. Retrieved
from Arizona emergency management:
http://www.dem.azdema.gov/operations/mitigation/mitigation.html
Armbrust, M., Fox, A., Griffith, R., Joseph, A., Katz, R., Konwinski, A., . . . Zaharia, M.
(2010). A view of cloud computing. Association for Computing Machinery, 53(1),
50-58. doi:10.1145/1721654.1721672
Babbie, E. (2012). The practice of social research (11th ed.). Belmont, NY:
Wadsworth/Thomson Learning.
Barjaktarovic, L., Jecmenica, D., & Corvininesis, A. T. (2011). Six Sigma concept.
Bulletin of Engineering, 4(4), 103-108. Retrieved from http://acta.fih.upt.ro/
Basu, R., & Wright, J. N. (2012). Quality beyond Six Sigma. Burlington, MA: Elsevier.
Bedi, R., Marwaha, M., Singh, T., Singh, H., & Singh, A. (2011). Analysis of different
privacy preserving cloud storage framework. International Journal of Computer
Science & Information Technology, 3(6), 129-146. doi: 10.5121/ijcsit.2011.3610

128
Beggan, D. M. (2011). Disaster recovery considerations for academic
institutions. Disaster Prevention and Management, 20(4), 413-422.
doi:10.1108/09653561111161734
Benson, K., Dowsley, R., & Shacham, H. (2011, October 21). Do you know where your
cloud files are? Computer and Communications Security Workshop, 73-82.
doi:10.1.1.226.3957
Box, G. E., & Tidwell, P. W. (1962). Transformation of the independent variables.
Technometrics(4), 531-550. doi:10.2307/1266288
Boyd, A., Chambers, N., French, S., & King, R. (2014). A scoping study of emergency
planning and management in health care: What further research is needed?
Manchester, England: National Institute for Health Research. Retrieved from
http://www.netscc.ac.uk/hsdr/files/project/SDO_FR_09-1005-01_V01.pdf
Brad, S., Fulea, M., Brad, E., & Mocan, B. (2009). Systematic integration of innovation
in process improvement projects using the enhanced sigma-TRIZ algorithm and
its effective use by means of a knowledge management software platform.
Informatica Economica, 13(4), 75-89. Retrieved from
https://www.researchgate.net/publication/40646561_Systematic_Integration_of_I
nnovation_in_Process_Improvement_Projects_Using_the_Enhanced_Sigma-
TRIZ_Algorithm_and_Its_Effective_Use_by_Means_of_a_Knowledge_Manage
ment_Software_Platform

129
Brohi, S. N., Bamiah, M. A., Chuprat, S., & Manan, J.-L. A. (2010). Design
and implementation of a privacy preserved off-premises cloud storage. Journal of
Computer Science, 10(2), 2014. doi:10.3844/jcssp.2014.210.223
Castillo, C. (2004). Disaster preparedness and business continuity planning at Boeing: An
integrated model. Journal of Facilities Management, 3(1), 8-26.
doi:10.1108/14725960510808365
Chang, S. E. (2010). Urban disaster recovery: A measurement framework and its
application to the 1995 Kobe earthquake. Disasters, 34(2), 303-327.
Cheng, J.-L. (2013). Linking Six Sigma to business strategy: An empirical study in
Taiwan. Measuring Business Intelligence, 17(1), 22-32. doi:10.1111/j.1467-
7717.2009.01130.x
Cho, J. H., Lee, J. H., Ahn, D. G., & Jang, J. S. (2011). Selection of Six Sigma key
ingredients (kis) in Korean companies. The TQM Journal, 23(6), 611-628.
doi:10.1108/17542731111175239
Cox, R. S. (2011). Like a fish out of water: Reconsidering disaster recovery and the role
of place and social capital in community disaster resilience. American Journal of
Community Psychology, 43(3-4), 395-411. doi:10.1007/s10464-011-9427-0
Crosby, P. (1984). Quality without tears. New York, NY: McGraw-Hill.
Crosby, P. (2005). 14 steps to quality. Quality Progress, 38(12), 60-64. Retrieved from
http://asq.org/quality-progress/2005/12/quality-management/crosbys-14-steps-to-
improvement.pdf
130
deGuise, P. (2008). Enterprise systems backup and recovery: A corporate
insurance policy. Sydney, Australia: Auerbach Publications.
Deming, W. E. (1986). Out of the crisis. Cambridge, MA: Massachusetts Institute of
Technology.
EC-Council. (2011). Disaster recovery. Clifton Park, NY: Cengage Learning.
Egli, D. S. (2013). Beyond the storms: Strengthening preparedness, response, &
resilience in the 21st century. Journal of Strategic Security, 6(2), 32-45.
doi:10.5038/1944-0472.6.2.3
Engemann, K. J., & Henderson, D. M. (2012). Business continuity and risk management.
Brookfield, CT: Rosthsteiin Associates Incorporated.
Ernst and Young. (2011). Into the cloud, out of the fog. Atlanta, GA: Ernst and Young.
Esnard, A. M., & Sapat, A. (2014). Displaced by disaster: Recover and resilience in a
globalizing world. Environmental crises, population displacement, and disaster
recovery. New York, NY: Routledge.
Federal Emergency Management Agency. (2017). Disaster declarations by year.
Retrieved March 2017, from Federal Emergency Management Agency:
https://www.fema.gov/disasters/year
G*Power. (2014, January 31). G*Power. Retrieved from G*Power:
http://www.gpower.hhu.de/fileadmin/redaktion/Fakultaeten/Mathematisch-
Naturwissenschaftliche_Fakultaet/Psychologie/AAP/gpower/GPowerManual.pdf
131
Gabor, C., & Munteanu, D. (2010). A short overview on Six Sigma. Bulletin
of the Transilvania University of Brasov, 3(52), 183-188. Retrieved from
http://webbut.unitbv.ro/BU2010/Series%20I/BULETIN%20I%20PDF/Materials
%20Science%20and%20Engineering/Gabor%20C.pdf
Gartner Group. (2013). Predicts 2014: Business continuity management and IT disaster
recovery management. Stamford, CT: Gartner Group.
Gijo, E. V., Scaria, J., & Antony, J. (2011). Application of Six Sigma methodology to
reduce defects of a grinding process. Quality & Reliability Engineering
International., 27(8), 1221-1234. doi:10.1002/qre.1212
Gijo, E., & Sarkar, A. (2013). Application of Six Sigma to improve the quality of the
road for wind turbine installation. The TQM Journal, 25(3), 244-258.
doi:10.1108/17542731311307438
Goh, T. N. (2011, March). Six Sigma in industry: Some observations after twenty-five
years. Quality & Reliability Engineering International, 27(2), 221-227.
doi:10.1002/qre.1093
Goldratt, E. (1990). Theory of constraints. Great Barrington, MA: North River Press.
Goldratt, E. (1992). The goal: A process of ongoing improvement. Great Barrington, MA:
North River Press.
Goldsborough, R. (2012). Preparing for the next emergency. Teacher Librarian, 40(2),
68. Retrieved from

132
http://eds.b.ebscohost.com.ezp.waldenulibrary.org/eds/pdfviewer/pdfviewer?vid=
6&sid=c18f5e23-be09-4e35-b55b-39512599b0e7%40sessionmgr103
Gosnik, D., & Vujica-Herzog, N. (2010). Success factors for Six Sigma implementation
in Slovenian manufacturing companies. Advances in Production Engineering &
Management, 5(4), 205-216. Retrieved from
http://eds.b.ebscohost.com.ezp.waldenulibrary.org/eds/pdfviewer/pdfviewer?vid=
2&sid=e0193a4e-6a33-4d37-9a40-56f4980a5774%40sessionmgr104
Greater Cincinnati Chamber of Commerce. (2014, June 19). Business Lists. Retrieved
from Greater Cincinnati Chamber of Commerce:
http://www.cincinnatichamber.com/Member-Resources/Marketing-
Benefits/Business-Lists.aspx#.VdUkIvlViko
Guo, D., Du, Y., Qiang, L., & Hu, L. (2011). Design and realization of the cloud backup
system bases on HDFS. In G. Zhiguo, X. Luo, J. Chen, F. L. Wang, & J. Lei,
Emerging Research in Web Information Systems and Mining (pp. 396-403). New
York, NY: Springer. doi:10.1007/978-3-642-24273-1_54
Guster, D. C. (2012). Outsourcing and replication considerations in disaster recovery
planning. Disaster Prevention and Management, 21(2), 172-183.
doi:10.1108/09653561211219982
Gutiérrez-Martínez, J., Núñez-Gaona, M. A., Aguirre-Meneses, H., & Delgado-Esquerra,
R. E. (2012). A software and hardware architecture for a high-availability PACS.
Journal of Digital Imaging, 25, 417-479. doi:10.1007/s10278-012-9494-2

133
Guy, R., & Lownes-Jackson, M. (2010). Business continuity strategies: An
assessment of planning, preparedness, response and recovery activities for
emergency disasters. IHart, 13, 87-97. Retrieved from
http://eds.b.ebscohost.com.ezp.waldenulibrary.org/eds/pdfviewer/pdfviewer?vid=
2&sid=6c5a6b62-aac1-4a94-93fa-5ee0423b8df6%40sessionmgr102
Hafeez, K., Malak, N., & Abdelmeguid, H. (2006). A framework for TQM to achieve
business excellence. Total Quality Mangement & Business Excellence, 17(9),
1213-1229. doi:10.1080/14783360600750485
Hanson, R. G. (2011). Using Six Sigma methodologies to improve quality of design and
detailing. Washington, DC: NSF.
Hesse-Biber, S. N. (2010). Mixed methods research : Merging theory with practice. New
York, NY: Guilford Press.
Hiatt, C. J. (2000). A primer for disaster recovery planning in an IT environment.
Hershey, PA: Idea Group Publishing.
Hu, W., Yang, T., & Matthews, J. N. (2010, July). The good, bad and ugly of consumer
cloud storage. ACM SIGOPS Operating Systems Review, 44(3).
doi:10.1145/1842733.1842751
Ismail, M., & Alias, S. (2014). Binary logistic regression modelling: Measuring the
probability of relapse cases among drug addicts. AIP Conference Proceedings,
1605, 792-797. doi:10.1063/1.4887691
134
Jaggia, S., & Kelly, A. (2013). Business statistics: Communicating with
numbers. New York, NY: McGraw Hill.
Jarraya, H., & Laurent, M. (2010). A secure peer-to-peer backup service keeping great
autonomy while under the supervision of a provider. Computers & Security, 29,
180-195. doi:10.1016/j.cose.2009.10.003
Juran, J. (1992). Juran on quality by design. New York, NY: The Free Press.
Juran, J. M. (1989). Juran on leadership for quality: An executive handbook. New York,
NY: The Free Press.
Juran, J. M., & Godfrey, A. B. (1999). Juran's quality handbook. Columbus, OH:
McGraw Hill.
Kadlec, C., & Shropshire, J. (2010). Best practices in IT disaster recovery planning
among US banks. Journal of Internet Banking and Commerce, 15(1), 1-11.
Retrieved from http://www.icommercecentral.com/open-access/best-practices-in-
it-disaster-recovery-planning-among-us-banks.php?aid=38334
Karim, A. (2011). Business disaster preparedness: An empirical study for measuring the
factors of business continuity to face business disaster. Internal Journal of
Business and Social Science, 2(18), 183-192. Retrieved from
http://ijbssnet.com/journals/Vol_2_No_18_October_2011/23.pdf
Knott, C., & Stuebe, G. (2011). Encryption and portable data storage. Journal of Service
Science, 4(1), 21-30. doi:10.19030/jss.v4i1.4269

135
Knox, K. (2012). Improve your IT disaster recovery plan and your ability to
recover from a disaster. Gartner, Inc., 1-8. Retrieved from
https://www.gartner.com/doc/2646616/improve-it-disaster-recovery-plan
Kokkranikal, J., Antony, J., Kosgi, H., & Losekoot, E. (2013). Barriers and challenges in
the application of Six Sigma in the hospitality industry: Some observations and
findings. International Journal of Productivity and Performance Management,
62(3), 317-322. doi:10.1108/17410401311309203
Krauss, W., Rubenstein, S., & Crocker, J. (2014). The DNA of preparedness: Developing
an integrated framework for emergency response and disaster management. 2013
International Conference onCollaboration Technologies and Systems (CTS) (pp.
307-312). San Diego, CA: IEEE. doi:10.1109/CTS.2013.6567246
Kusumasari, B., & Alam, Q. (2012). Local wisdom-based disaster recovery model in
Indonesia. Disaster Prevention and Management, 21(3), 351-369.
doi:10.1108/09653561211234525
Larrue, V., Kummer, R. v., Müller, A., & Bluhmki, E. (2011). Risk factors for severe
hemorrhagic transformation in ischemic stroke patients treated with recombinant
tissue plasminogen activator: A secondary analysis of the European-Australasian
acute stroke study (ECASS II). Journal of the American Heart Association, 32,
438-441. doi:10.1161/01.STR.32.2.438
136
Lau, C. W. (2013). Crisis management: Western Digital's 46-day recovery
from the 2011 flood disaster in Thailand. Strategy & Leadership, 41(1), 34-38.
doi:10.1108/10878571311290061
Leedy, P. D., & Ormond, J. E. (2013). Practical research: Planning and design (9th ed.).
Upper Saddle River, NY: Pearson Prentice Hall.
Lund Research. (2017, January 20). Laerd Statistics. Retrieved January 20, 2017, from
Laerd Statistics: https://statistics.laerd.com/premium/spss/blr/binomial-logistic-
regression-in-spss.php
Marks, H. (2014). 2014 Backup Technologies Survey. Chicago, IL: Information Week.
Mirzoev, T. (2009). Synchronous replication of remote storage. Journal of
Communication and Computer, 6(3), 34-39. Retrieved from
https://arxiv.org/ftp/arxiv/papers/1404/1404.2176.pdf
Muijs, D. (2011). Doing quantitative research in education with SPSS. Thousand Oaks,
CA: Sage Publications.
Nelson, S. (2011). Pro data backup and recovery. New York, NY: Springer.
Nollau, B. (2009). Disaster recovery and business continuity. Journal of GXP
Compliance, 13(3), 51-58. Retrieved from
http://www.ivtnetwork.com/sites/default/files/DisasterRecovery_01.pdf
Omar, A., Alijani, D., & Mason, R. (2011). Information technology disaster recovery
plan: Case study. Academy of Strategic Management Journal, 10(2), 127-141.
137
Retrieved from https://www.questia.com/library/journal/1P3-
2439526171/information-technology-disaster-recovery-plan-case
Ooijen, P. V., Viddeleer, A. R., Meijer, F., & Oudkerk, M. (2010). Accessibility of data
backup on CD-R after 8 to 11 years. Journal of Digital Imaging, 95-99.
doi:10.1007/s10278-008-9161-9
Osborne, J. (2014). Best practices in logistic regression. Thousand Oaks, CA: Sage
Publications.
Paldi, J., Habibullah, M., & Baharom, A. H. (2010). Economic impact of natural disasters
fatalities. International Journal of Social Economics, 37(6), 429-441.
doi:10.1108/03068291011042319
Paul, M., & Saxena, A. (2010). Zero data remnance proof in cloud storage. International
Journal of Network Security & Its Applications, 2(4), 256-265. doi:
10.5121/ijnsa.2010.2419
Phillips, B. (2009). Disaster recovery. Boca Raton, FL: Auerbach Publications.
Piccinelli, M., & Gubian, P. (2011). Exploring the iPhone backup made by iTunes. The
Journal of Digital Forensics, Security and Law : JDFSL, 6(3), 31-62.
doi:10.15394/jdfsl.2011.1099
Pinta, J. (2011). Disaster recovery planning as a part of business continuity management.
Agris Online Papers in Economics and Informatics, 3, 55-61. Retrieved from
http://purl.umn.edu/120243

138
Purushothaman, D., & Abburu, S. (2012). An approach for data storage
security in cloud computing. International Journal of Computer Science Issues,
9(2), 100-105. Retrieved from https://www.ijcsi.org/papers/IJCSI-9-2-1-100-
105.pdf
Pyzdek, T. (2003). The Six Sigma Handbook. New York, NY: McGraw-Hill.
Pyzdek, T., & Keller, P. (2014). The Six Sigma handbook: Fourth edition. New York,
NY: McGraw-Hill.
Rahman, B. A. (2012). Issues of disaster management preparedness: A case study of
Directive 20 of national security council Malaysia. International Journal of
Business and Social Science, 3(5). Retrieved from
http://www.ijbssnet.com/journals/Vol_3_No_5_March_2012/9.pdf
Reddick, C. (2011). Information technology and emergency management: Preparedness
and planning in the United States. Disasters, 35(1), 45-61. doi:10.1111/j.1467-
7717.2010.01192.x
Riley, B. W., Kovach, J. V., & Carden, L. (2013). Developing a policies and procedures
manual for a consumer lending department: A design for Six Sigma case study.
Engineering Management Journal, 25(3), 3-15.
doi:10.1080/10429247.2013.11431978
Rosenthal, D. (2010). Keeping bits safe: How hard can it be? ACM, 47-57.
doi:10.1145/1839676.1839692

139
Salzarulo, P. A., Krehbiel, T. C., Mahar, S., & Emerson, L. S. (2012). Six
Sigma sales and marketing: Application to NCAA basketball. American Journal
of Business, 27(2), 113-132. doi:10.1108/19355181211274433
Seyedin, H., Ryan, J., & Keshtgar, M. (2011). Disaster management planning for health
organizations in a developing country. Journal of Urban Planning and
Development, 137(1), 77-81. doi:10.1061/(ASCE)UP.1943-5444.0000045
Shanmugaraja, M., Nataraj, M., & Gunasekaran, N. (2010). Customer care management
model for service industry. iBusiness, 2, 145-155. doi:10.4236/ib.2010.22018
Shen, L.-Z. (2011). Research on self-built digital resource backup systems. Journal of
Computers, 9, 1983-1987. Retrieved from http://www.techrepublic.com/resource-
library/whitepapers/research-on-self-built-digital-resource-backup-systems/
Shropshire, J., & Kadlec, C. (2009). Developing the IT disaster recovery planning
construct. Journal of Information Technology and Management, 20(4), 37-56.
Retrieved from
https://pdfs.semanticscholar.org/b973/350df694859817274146c7fceb88000cba6b.
Singleton, R. A., & Straits, B. C. (2010). Approaches to social research (5th ed.). New
York, NY: Oxford University Press.
Small Business Administration. (2012). Small Business Administration frequently asked
questions. Retrieved February 7, 2017, from Small Business Administration:
https://www.sba.gov/sites/default/files/sbfaq.pdf

140
Small Business Administration. (2016, February 26). Small Business
Administration. Retrieved February 22, 2017, from Table of small business
standards: https://www.sba.gov/contracting/getting-started-contractor/make-sure-
you-meet-sba-size-standards/table-small-business-size-standards
Smith, G. (2012). Planning for post-disaster recovery: A review of the United States
disaster assistance framework. Washington, D.C.: Island Press.
Snedaker, S., & Rima, C. (2014). Business continuity and disaster recovery planning for
IT professionals. Walthan, MA: Elsevier.
Snee, R. (2010). Lean Six Sigma: Getting better all the time. International Journal of
Lean Six Sigma, 1(1), 9-29. doi:10.1108/20401461011033130
Soric, B., & Šusak, T. (2015, January). Development of dividend payout model using
logistic regression: The case. Economy Transdisciplinarity Cognition, 117-123.
Retrieved from http://www.ugb.ro/etc/etc2015no1/18_Soric,_Susak.pdf
Strang, D., & Jung, D. I. (2009). Participatory improvement at a global bank: The
diffusion of quality teams and the demise of a Six Sigma initiative. Organization
Studies, 30(1), 31-51. doi:10.1177/0170840608100517
Symantec. (2011). When good backups go bad: Data recovery failures and what to do
about it. Mountain View, CA: Symantec Corporation.
Symantec. (2012). Disaster preparedness survey. Mountain View, CA: Symantec.
Talib, A. (2010). Security framework of cloud data storage based on multiple agent
system architecture: Semantic literature review. Computer and Information

141
Science, 3(4), 175-186. Retrieved from
https://pdfs.semanticscholar.org/7615/5a8604035f94a3eababfb525d57b2486f427.
Toigo, J. (2013). Disaster recovery planning: Getting to business-savvy business
continuity. Upper Saddle River, NJ: Prentice Hall.
Toka, L., & Michiardi, P. (2011). Analysis of user-driven peer selection in peer-to-peer
backup and storage systems. Telecommunication Systems, 47, 49-63.
doi:10.1007/s11235-010-9301-7
Trikha, B. (2010). A journey from floppy disk to cloud storage. International Journal on
Computer Science and Engineering, 2(4), 1449-1452. Retrieved from
http://www.enggjournals.com/ijcse/doc/IJCSE10-02-05-24.pdf
Trochim, W. M., & Donnelly, J. (2015). Research methods: The essential knowledge
base (2nd ed.). Mason, OH: Cengage Learning.
Tura, N. D., Reilly, S., Narasimhan, S., & Yin, Z. (2004). Disaster recovery preparedness
through continious process optimization. Bell Labs Technical Journal, 9(2), 147-
162. doi:10.1002/bltj.20031
Wallace, M., & Webber, L. (2010). The disaster recovery handbook: A step-by-step plan
to ensure business continuity and protect vital operations, facilities, and assets.
New York, NY: AMACOM - American Management Association.
Waters, J. (2011). Cloud-based data storage. Education Digest: Essential Readings
Condensed for Quick Review, 76(8), 28-34. Retrieved from

142
http://eds.b.ebscohost.com.ezp.waldenulibrary.org/eds/pdfviewer/pdfviewer?vid=
2&sid=0f67f3e3-5285-40ce-a421-68a48d54406c%40sessionmgr101
Whitman, M., & Mattord, H. (2007). Principles of information security. Boston, MA:
Cengage.
Whitman, M., Mattord, H., & Green, A. (2013). Principles of incident response and
disaster recovery. Boston, MA: Cengage Learning.

143
Appendix A: Quantitative and Qualitative Survey Questions
SURVEY QUESTIONS
As a data backup administrator, you will be asked a series of questions related to
data backup and the need for a data backup performance indicator. This backup
performance indicator will advise you and management of the condition of the data
backup and its ability to restore in case of an emergency. The following questions are
related to the implementation of the backup performance indicator.
Demographics: 1. How many employees are there in your company?
a) 1-50 b) 51-100 c) 101-150 d) 151-200 e) 201-250 f) 251 or more
2. Where is your company located?
a) Greater Cincinnati b) Northern Kentucky c) Southern Indiana d) Other _______________
3. Which of the following best describes your job title?
a) IT executive management (C-level/VP) b) IT director/manager c) Line-of-business management d) Consultant e) IT/IS staff f) Non-IT executive management g) Other
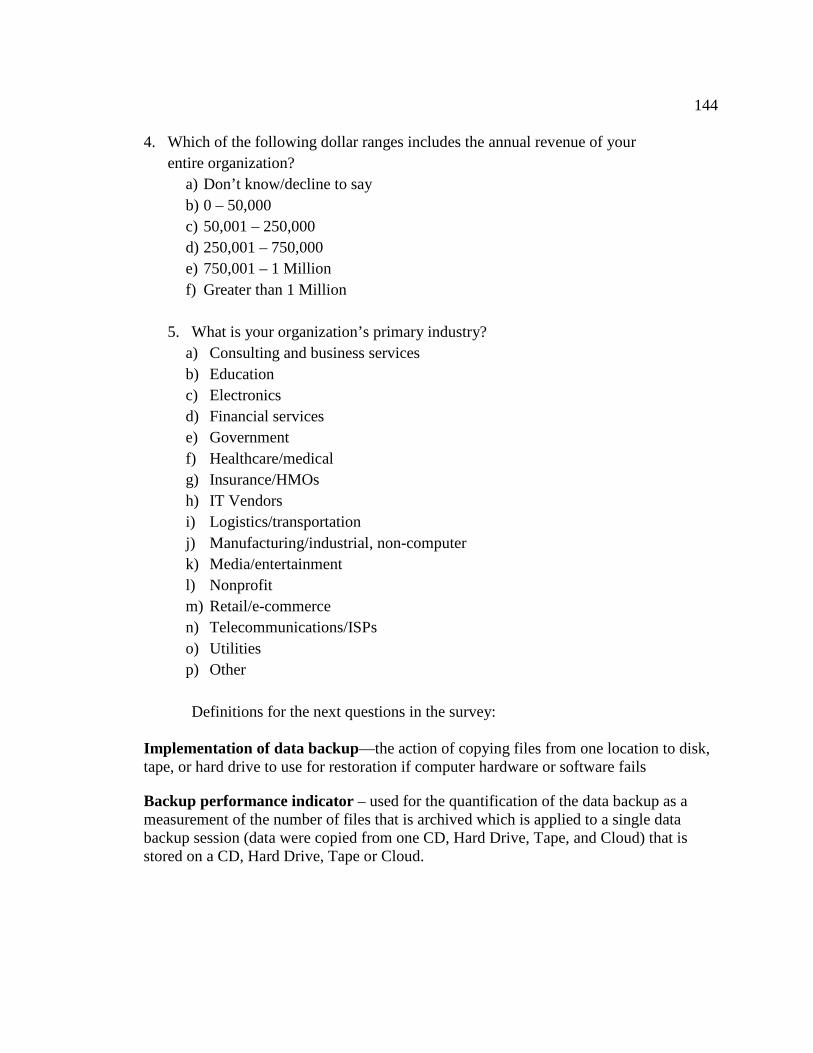
144
4. Which of the following dollar ranges includes the annual revenue of your entire organization?
a) Don’t know/decline to say b) 0 – 50,000 c) 50,001 – 250,000 d) 250,001 – 750,000 e) 750,001 – 1 Million f) Greater than 1 Million
5. What is your organization’s primary industry? a) Consulting and business services b) Education c) Electronics d) Financial services e) Government f) Healthcare/medical g) Insurance/HMOs h) IT Vendors i) Logistics/transportation j) Manufacturing/industrial, non-computer k) Media/entertainment l) Nonprofit m) Retail/e-commerce n) Telecommunications/ISPs o) Utilities p) Other
Definitions for the next questions in the survey:
Implementation of data backup—the action of copying files from one location to disk, tape, or hard drive to use for restoration if computer hardware or software fails
Backup performance indicator – used for the quantification of the data backup as a measurement of the number of files that is archived which is applied to a single data backup session (data were copied from one CD, Hard Drive, Tape, and Cloud) that is stored on a CD, Hard Drive, Tape or Cloud.

145
Backup quality –the standard of measurement of a manual or automatic electronic process of copying data files from a storage medium (CD, Hard Drive, Tape, Cloud) to a remote medium (CD, Hard Drive, Tape, Cloud).
Backup confidence – the level of certainty that data were copied from a storage medium (CD, Hard Drive, Tape, and Cloud) to a remote medium (CD, Hard Drive, Tape, and Cloud).
Data backup problem – any problem related to the backup of data operation.
Data restoration problem – any problem related to restoring data from a backup medium.
6. Does your organization use a data backup process? a) Yes b) No
7. Has your organization ever experienced a problem with its data backup or restoration process (select all that are applicable)? a) Yes – with restoration and backup b) No – with restoration and backup
8. Use a number 0 – 100 (0 is never to 100 is daily) to represent the percentage you back up your data ____________________
9. How often do you conduct test restores of data and/or applications? a) More than three times per month b) Three times per month c) Twice per month d) Once a month e) Twice per quarter f) Once per quarter g) Annually h) Never
10. How satisfied are you with your backup system quality?
a) Very satisfied b) Satisfied c) Neither satisfied nor dissatisfied

146
d) Dissatisfied e) Very dissatisfied
11. Use a number 0 – 100 (0 is low quality to 100 high quality) to represent your data
backup’s level of quality as a percentage _________________
12. Are you confident are in your ability to get the business up and running again in a reasonable time frame after a major disaster that takes out your main data center?
a) Extremely confident b) Very confident c) Neutral d) Slightly confident e) Not confident
13. Use a number 0 – 100 (0 is not confident to 100 completely confident) to represent your level of confidence as a percentage _________________ 14. Does your organization need a data backup performance indicator?
a) Yes b) No