The Productivity Performance in Korean Industries (1990 ... · Hyunbae Chun (Sogang University)...
62
RIETI/G-COE Hi-Stat International Workshop on Establishing Industrial Productivity Database for China India Japan and Korea Industrial Productivity Database for China, India, Japan and Korea October 22, 2010, Tokyo The Productivity Performance The Productivity Performance in Korean Industries (1990-2008): Estimates from KIP Database Hak K. Pyo (Seoul National University) Hyunbae Chun (Sogang University) Keun Hee Rhee (Korea Productivity Center)
Transcript of The Productivity Performance in Korean Industries (1990 ... · Hyunbae Chun (Sogang University)...

RIETI/G-COE Hi-Stat International Workshop on Establishing Industrial Productivity Database for China India Japan and KoreaIndustrial Productivity Database for China, India, Japan and Korea October 22, 2010, Tokyo
The Productivity PerformanceThe Productivity Performance in Korean Industries (1990-2008):
Estimates from KIP Database
Hak K. Pyo (Seoul National University)Hyunbae Chun (Sogang University)
Keun Hee Rhee (Korea Productivity Center)( y )

ContentsContents
I. Introduction to KIP DatabaseII KIP Database: Variables ConstructionII. KIP Database: Variables ConstructionIII. International Comparison IV. Estimates of Comparative Output Growth
and Contributionsa d Co t but o sV. KIP, EUKLEMS and WIODVI. Preliminary Estimates of Intangible
Investment in Korea2

I. Introduction to KIP Database
• Korea Industrial Productivity (KIP) Database Project in 2007
Following EU KLEMS Manual (Timmer et al– Following EU KLEMS Manual (Timmer et al., 2007)
GO S– KIP2007 in Dec., 2007: GO, KLEMS, and TFPGO for 72 industries from 1970 to 2005
3

• Cooperation with Japan Industrial Productivity (JIP) Database through workshops (2007, 2008, 2009)p ( , , )
I i l P d i i C f i• International Productivity Conference in Seoul and Tokyo (2007)y ( )
4

KIP versus EUKLEMSKIP
Korea Productivity CenterEUKLEMS
www.euklems.netyKIP2007 (Dec., 2007)72 industries up to 2005
March 2008 Release72 industries up to 200572 industries up to 2005
GO VA KLEMS TFPGO(VA)72 industries up to 2005GO VA KLEMS TFPVA
KIP2008 (Dec 2008)KIP2008 (Dec., 2008)72 industries up to 2006GO VA KLEMS TFPGO(VA)KIP2009 (Dec., 2009)72 industries up to 2007GO S GO( )
November 2009 Release32 industries up to 2007GOGO VA KLEMS TFPGO(VA) GO VA KLM TFPVA
KIP2010 (preliminary)(p y)72 industries up to 2008GO VA KLEMS TFPGO(VA) 5

II. KIP Database: Variables Construction
• OutputG t t (GO) d l dd d (VA)– Gross output (GO) and value-added (VA)
– Bank of Korea internal data on GO & VA– for 78(147) & 397(399) industry data
• Intermediate Input• Intermediate Input– Use U & V tables to divide intermediate inputs
i t E M Sinto E,M,S
6

KIP Database: Variables Construction
• Labor InputE l t H C ti– Employment, Hours, Compensation
– Sources: Economically Active Population S (NSO) S R t WSurvey (NSO), Survey Report on Wage Structure (MOL) and etc
– Labor Composition:18 types = Gender(2) x Age (3) x Education y ( ) g ( )(3) for 15 industries
7

Capital InputCapital Input
KIP EUKLEMSKIP EUKLEMS
1970 1997• 1970–1997 – National Wealth Survey(1968, 1977, 1987, 1997)
•Perpetual inventory method (PIM)
( , , , )
• 1998–2008 Modified Perpetual
• Same depreciation rates for all EU countries– Modified Perpetual
inventory method– Country-specific
for all EU countries
depreciation rates (Pyo etal., 2007)
8

Depreciation Rates by AssetDepreciation Rates by Asset(Unit: %) Pyo et al. EU KLEMS
(2007) (2007)Asset type 1987~97 Minimum Maximum
Residential structure 3 3 1 1 1 1Residential structure 3.3 1.1 1.1Non-residential structure 3.0 2.3 6.9Infrastructure 1.0 2.3 6.9Transport equipment 16.9 6.1 24.6Computing equipment 11.5 31.5 31.5Communications equipment 11.5 11.5 11.5Other machinery and equipment 9.2 7.3 16.4Products of agriculture and forestry 9 2 7 3 16 4Products of agriculture and forestry 9.2 7.3 16.4Other products 9.2 7.3 16.4Software 24.71 31.5 31.5Other intangibles 24.71 31.5 31.5
9

Issues in KIP DBIssues in KIP DB
• BOK output data updated with chain index
Labor income share adjustment for self• Labor income share adjustment for self-employment– Agriculture, distribution, and personal and
business services
• Capital Income share
10

III. International ComparisonIII. International Comparison
• Data• Data– KIP2010 (1981-2008)– EUKLEMS Nov. 2009 release (1981-2007)
• Output and TFP measureV l dd d L b (h d iti )– Value-added, Labor (hours and composition), capital, and TFP
11

International ComparisonInternational Comparison • Countries
– Korea, 1981-2008– USA 1981-2007– USA, 1981-2007– Japan, 1981-2006– EU15EX, 1981-2007
• Industries30 industries– 30 industries
– 2 AGR/MIN,13 MFG, 2 UTL/CST,13 SER
12
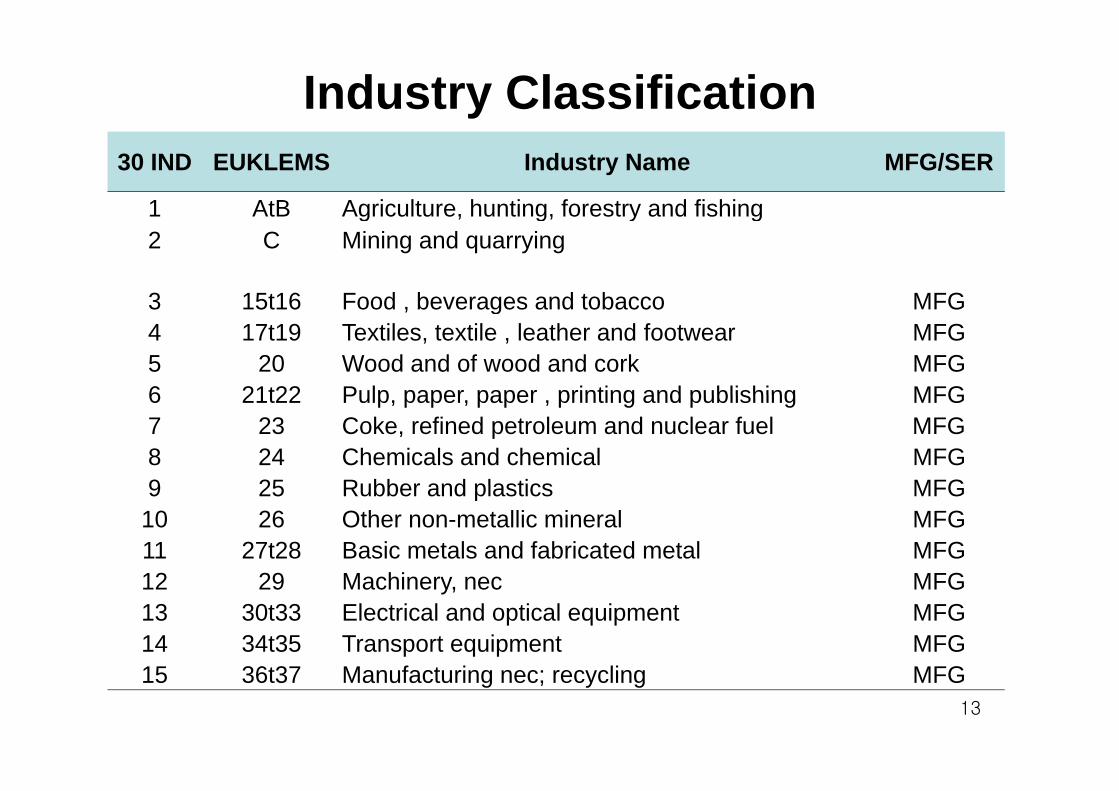
Industry Classification30 IND EUKLEMS Industry Name MFG/SER
1 AtB Agriculture, hunting, forestry and fishing1 AtB Agriculture, hunting, forestry and fishing2 C Mining and quarrying
3 15t16 Food beverages and tobacco MFG3 15t16 Food , beverages and tobacco MFG4 17t19 Textiles, textile , leather and footwear MFG5 20 Wood and of wood and cork MFG6 21t22 Pulp paper paper printing and publishing MFG6 21t22 Pulp, paper, paper , printing and publishing MFG7 23 Coke, refined petroleum and nuclear fuel MFG8 24 Chemicals and chemical MFG9 25 Rubber and plastics MFG9 25 Rubber and plastics MFG
10 26 Other non-metallic mineral MFG11 27t28 Basic metals and fabricated metal MFG12 29 M hi MFG12 29 Machinery, nec MFG13 30t33 Electrical and optical equipment MFG14 34t35 Transport equipment MFG15 36t37 Manufacturing nec; recycling MFG
13

Industry Classification30 IND EUKLEMS Industry Name MFG/SER
16 E Electricity, gas and water supply 17 F Construction17 F Construction
18 50 Sale, maintenance and repair of motor vehicles SERS19 51 Wholesale trade and commission trade SER
20 52 Retail trade SER21 H Hotels and restaurants SER22 60t63 Transport and storage SER23 64 Post and telecommunications SER24 J Financial intermediation SER24 J Financial intermediation SER25 70 Real estate activities Non-Mkt SER26 71t74 Renting of m&eq and other business activities SER27 L P bli d i &d f l i l it N Mkt SER27 L Public admin&defence; compul. social security Non-Mkt SER28 M Education Non-Mkt SER29 N Health and social work Non-Mkt SER30 O Other community, social and personal services SER
14

IV. Estimates of Comparative Output G th d C t ib tiGrowth and Contributions
Output Labor Hours Composition Capital TFP
Total EconomyOutput Labor Hours Composition Capital TFP
Korea1981-2007 6.83 1.59 1.18 0.35 4.75 0.49
(1981-2008) 6.67 1.55 1.15 0.35 4.67 0.46( )1991-2000 6.20 1.38 1.02 0.29 4.18 0.642001-2007 4.10 0.97 0.50 0.46 2.94 0.19
(2001-2008) 3.89 0.90 0.46 0.43 2.89 0.11USAUSA
1981-2007 2.89 1.02 0.79 0.23 1.49 0.391991-2000 3.13 1.19 0.96 0.24 1.72 0.222001-2007 2.32 0.45 0.19 0.26 1.07 0.80
Japan1981-2006 2.56 0.27 -0.04 0.31 1.72 0.581991-2000 1.39 -0.10 -0.41 0.31 1.58 -0.092001 2006 1 28 0 03 0 33 0 36 0 96 0 292001-2006 1.28 0.03 -0.33 0.36 0.96 0.29
EU15EX1981-2007 2.19 0.46 0.22 0.24 1.09 0.651991-2000 2.13 0.37 0.09 0.28 1.20 0.572001-2007 1.93 0.61 0.43 0.18 0.96 0.36
15

Contributions to Output Growth Total EconomyTotal Economy
Output Labor Hours Composition Capital TFPKorea
1981-2007 100 23.3 17.3 5.2 69.5 7.2(1981-2008) 100 23.2 17.2 5.2 69.9 6.91991-2000 100 22.2 16.5 4.7 67.4 10.32001 2007 100 23 6 12 3 11 3 71 8 4 62001-2007 100 23.6 12.3 11.3 71.8 4.6
(2001-2008) 100 23.0 11.9 11.1 74.1 2.8USA
1981 2007 100 35 2 27 1 8 0 51 4 13 41981-2007 100 35.2 27.1 8.0 51.4 13.41991-2000 100 38.1 30.5 7.5 55.0 7.02001-2007 100 19.3 8.2 11.1 46.1 34.6
JapanJapan1981-2006 100 10.4 -1.7 12.1 67.0 22.61991-2000 100 -6.9 -29.4 22.5 113.6 -6.72001-2006 100 2.6 -25.7 28.3 74.5 22.92001 2006 100 2.6 25.7 28.3 74.5 22.9
EU15EX1981-2007 100 20.8 9.9 10.9 49.6 29.61991-2000 100 17.4 4.1 13.3 56.1 26.62001-2007 100 31.8 22.4 9.4 49.6 18.6
16

Output Growth and Contributions, T t l E 1981 2007Total Economy, 1981-2007
8
6
7
4
5 Labor Hours
3
4 Labor Composition
1
2 Capital
0
1 TFP
-1 Korea KOR('81-08) USA Japan EU15EX 17

Contributions to Output Growth, T t l E 1981 2007Total Economy, 1981-2007
120
100
60
80 Labor Hours
40
60 Labor Composition
20 Capital
0 TFP
-20 Korea KOR('81-08) USA Japan EU15EX 18

Output Growth and Contributions, Total Economy, 1991-2000 vs. 2001-2007Total Economy, 1991 2000 vs. 2001 2007
7
5
6
4 Labor Hours
2
3 Labor Composition
C it l
1
2 Capital
TFP
-1
0 TFP
-1 KOR USA JPN EU15EX KOR ('08) USA JPN EU15EX
1991-2000 2001-200719

Contributions to Output Growth, Total Economy 1991-2000 vs 2001-2007Total Economy, 1991-2000 vs. 2001-2007
140
160
120
140
80
100 Labor Hours
40
60 Labor Composition
C it l
0
20 Capital
TFP
-40
-20
TFP
-40 KOR USA JPN EU15EX KOR ('08) USA JPN EU15EX
1991-2000 2001-200720

Output Growth and Contributions, M k t E 1981 2007Market Economy, 1981-2007
8
6
7
4
5 Labor Hours
3
4 Labor Composition
1
2 Capital
0
1 TFP
-1 Korea KOR('81-08) USA Japan EU15EX 21

Contributions to Output Growth, M k t E 1981 2007Market Economy, 1981-2007
120
100
60
80 Labor Hours
40
60 Labor Composition
20 Capital
0 TFP
-20 Korea KOR('81-08) USA Japan EU15EX 22

Output Growth and Contributions, Market Economy, 1991-2000 vs. 2001-2007Market Economy, 1991 2000 vs. 2001 2007
7
8
6
7
4
5 Labor Hours
2
3 Labor Composition
C it l
0
1 Capital
TFP
-2
-1
TFP
-2 KOR USA JPN EU15EX KOR ('08) USA JPN EU15EX
1991-2000 2001-200723

Contributions to Output Growth, Market Economy 1991-2000 vs 2001-2007Market Economy, 1991-2000 vs. 2001-2007
200
150
100 Labor Hours
0
50 Labor Composition
Capital
-50
0 Capital
TFP
-100 KOR USA JPN EU15EX KOR ('08) USA JPN EU15EX
1991-2000 2001-2007 24

TFP Level: Korea, US, JPN, EU15EXTotal Economy, 1981-2008 (2000=100)
110
105
100
95
85
90 KoreaUSJapan
80
85 JapanEU15EX
1981 1983 1985 1987 1989 1991 1993 1995 1997 1999 2001 2003 2005 200725

TFP Level: Korea, US, JPN, EU15EXMarket Economy, 1981-2008 (2000=100)
120
110
115
100
105
90
95
80
85 KoreaUSJapan
70
75
1981 1983 1985 1987 1989 1991 1993 1995 1997 1999 2001 2003 2005 2007
JapanEU15EX
1981 1983 1985 1987 1989 1991 1993 1995 1997 1999 2001 2003 2005 2007
26

TFP Growth Rates, 1981-2007MFG SER MKT TOT
MKT NonMKT TOTKOR 3.34 0.28 -2.94 -0.96 1.37 0.49
KOR('81-'08) 3.26 0.29 -2.97 -0.97 1.34 0.46USA 2.53 0.60 -0.89 -0.06 0.99 0.39JPN 1.58 1.11 -0.99 0.33 1.04 0.58AUT 3.09 0.37 -0.34 0.09 1.41 0.96BEL 1 33 -0 30 -0 46 -0 35 0 37 0 12BEL 1.33 0.30 0.46 0.35 0.37 0.12DNK 0.19 0.43 -0.26 0.10 0.52 0.26ESP 0.62 -0.99 -0.40 -0.77 0.06 -0.05FIN 3 75 0 83 1 22 0 09 1 91 1 03FIN 3.75 0.83 -1.22 -0.09 1.91 1.03FRA 1.63 0.62 0.58 0.60 1.04 0.89GER 1.94 -0.29 1.02 0.26 0.54 0.67ITA 0 9 0 30 0 42 0 04 0 32 0 33ITA 0.95 -0.30 0.42 -0.04 0.32 0.33NLD 1.91 0.44 -0.01 0.31 0.70 0.50UK 2.50 0.88 -0.97 0.21 1.30 0.76
EU15EX 1.67 0.28 0.24 0.27 0.82 0.6527

TFP Growth Rates, 1991-2000 vs. 2001-2007
MFG SER MKT TOTMKT NonMKT TOT
1991 20001991-2000KOR 4.45 -0.32 -0.85 -0.60 1.10 0.64USA 2.39 0.38 -1.10 -0.26 0.84 0.22JPN 0.57 0.78 -0.78 0.21 0.12 -0.09
EU15EX 1.41 0.26 0.28 0.27 0.69 0.572001 20072001-2007
KOR 3.75 1.30 -5.94 -1.55 1.95 0.49KOR('01-'08) 3.44 1.21 -5.68 -1.50 1.78 0.11( )
USA 3.61 1.55 -0.39 0.72 1.39 0.39JPN 0.68 0.67 -0.51 0.21 0.59 0.58
EU15EX 1 73 0 34 0 26 0 09 0 62 0 65EU15EX 1.73 0.34 -0.26 0.09 0.62 0.6528

TFP Growth Gap between Manufacturing and Services Sectors 1981-2008and Services Sectors, 1981-2008
20
15
10
KOR5
KOR
USA
0 JPN
EU15EX-5
EU15EX
-101981 1986 1991 1996 2001 2006
29

TFP Growth Gap between Manufacturing and Market Services Sectors 1981-2008and Market Services Sectors, 1981-2008
20
15
10
KOR5
KOR
USA
0 JPN
EU15EX-5
EU15EX
-101981 1986 1991 1996 2001 2006
30

Industry Contribution to Aggregate Output and TFP Growth
• Data– 30 industry-level data– 30 industry-level data– Korea, USA, Japan, EU15EX– 1991-2000 and 2001-2007
• Industry contribution measuresy– Both output and TFP growth contributions are
weighted by industry nominal value-addedweighted by industry nominal value added
31

Industry Contributions to Output Growth in the Total Economy, Korea, 1991-2000 vs. 2001-2007
Agriculture
Wood Textiles
Food Mining
Agriculture
1991 2000
Non-metallic mineralRubber &plastics
ChemicalsPetroleum
Paper & publishing 1991-2000
2001-2007
M f t iTransport equipment Electrical equipment
Machinery, necBasic & fabricated metal
Non metallic mineral
Wholesale tradeSale of motor vehicles
ConstructionElectricity
Manufacturing nec
Financial intermediationTelecommunications
Transport and storageHotels & restaurants
Retail tradeWholesale trade
Education*Public admin*
Business servicesReal estate activities*
Financial intermediation
-0.5 0.0 0.5 1.0 1.5
social & personal serv.Health and social work*
32

Industry Contributions to TFP Growth in the Total Economy, Korea, 1991-2000 vs. 2001-2007
Agriculture
Wood Textiles
Food Mining
Agriculture
1991 2000
Non-metallic mineralRubber &plastics
ChemicalsPetroleum
Paper & publishing 1991-2000
2001-2007
M f t iTransport equipment Electrical equipment
Machinery, necBasic & fabricated metal
Non metallic mineral
Wholesale tradeSale of motor vehicles
ConstructionElectricity
Manufacturing nec
Financial intermediationTelecommunications
Transport and storageHotels & restaurants
Retail tradeWholesale trade
Education*Public admin*
Business servicesReal estate activities*
Financial intermediation
-1.5 -1.0 -0.5 0.0 0.5 1.0 1.5
social & personal serv.Health and social work*
33

Industry Contributions to Output Growth in the Total Economy, USA, 1991-2000 vs. 2001-2007
Agriculture
Wood Textiles
Food Mining
Agriculture
1991 2000
Non-metallic mineralRubber &plastics
ChemicalsPetroleum
Paper & publishing 1991-2000
2001-2007
M f t iTransport equipment Electrical equipment
Machinery, necBasic & fabricated metal
Non metallic mineral
Wholesale tradeSale of motor vehicles
ConstructionElectricity
Manufacturing nec
Financial intermediationTelecommunications
Transport and storageHotels & restaurants
Retail tradeWholesale trade
Education*Public admin*
Business servicesReal estate activities*
Financial intermediation
-0.2 0.0 0.2 0.4 0.6
social & personal serv.Health and social work*
34

Industry Contributions to TFP Growth in the Total Economy, USA, 1991-2000 vs. 2001-2007Agriculture
Wood Textiles
Food Mining
Agriculture
1991 2000
Non-metallic mineralRubber &plastics
ChemicalsPetroleum
Paper & publishing 1991-2000
2001-2007
M f t iTransport equipment Electrical equipment
Machinery, necBasic & fabricated metal
Non metallic mineral
Wholesale tradeSale of motor vehicles
ConstructionElectricity
Manufacturing nec
Financial intermediationTelecommunications
Transport and storageHotels & restaurants
Retail tradeWholesale trade
Education*Public admin*
Business servicesReal estate activities*
Financial intermediation
-0.4 -0.2 0.0 0.2 0.4
social & personal serv.Health and social work*
35

Industry Contributions to Output Growth in the Total Economy, Japan, 1991-2000 vs. 2001-2006
Agriculture
Wood Textiles
Food Mining
Agriculture
1991 2000
Non-metallic mineralRubber &plastics
ChemicalsPetroleum
Paper & publishing 1991-2000
2001-2006
M f t iTransport equipment Electrical equipment
Machinery, necBasic & fabricated metal
Non metallic mineral
Wholesale tradeSale of motor vehicles
ConstructionElectricity
Manufacturing nec
Financial intermediationTelecommunications
Transport and storageHotels & restaurants
Retail tradeWholesale trade
Education*Public admin*
Business servicesReal estate activities*
Financial intermediation
-0.4 -0.2 0.0 0.2 0.4
social & personal serv.Health and social work*
36

Industry Contributions to TFP Growth in the Total Economy, Japan, 1991-2000 vs. 2001-2006Agriculture
Wood Textiles
Food Mining
Agriculture
1991-2000
Non-metallic mineralRubber &plastics
ChemicalsPetroleum
Paper & publishing2001-2006
M f t iTransport equipment Electrical equipment
Machinery, necBasic & fabricated metal
Non metallic mineral
Wholesale tradeSale of motor vehicles
ConstructionElectricity
Manufacturing nec
Financial intermediationTelecommunications
Transport and storageHotels & restaurants
Retail tradeWholesale trade
Education*Public admin*
Business servicesReal estate activities*
Financial intermediation
-0.4 -0.2 0.0 0.2 0.4
social & personal serv.Health and social work*
37

Industry Contributions to Output Growth in the Total Economy, EU15EX, 1991-2000 vs. 2001-2007
Agriculture
Wood Textiles
Food Mining
Agriculture
1991 2000
Non-metallic mineralRubber &plastics
ChemicalsPetroleum
Paper & publishing 1991-2000
2001-2007
M f t iTransport equipment Electrical equipment
Machinery, necBasic & fabricated metal
Non metallic mineral
Wholesale tradeSale of motor vehicles
ConstructionElectricity
Manufacturing nec
Financial intermediationTelecommunications
Transport and storageHotels & restaurants
Retail tradeWholesale trade
Education*Public admin*
Business servicesReal estate activities*
Financial intermediation
-0.1 0.0 0.1 0.2 0.3 0.4
social & personal serv.Health and social work*
38

Industry Contributions to TFP Growth in the Total Economy, EU15EX, 1991-2000 vs. 2001-2007
Agriculture
Wood Textiles
Food Mining
Agriculture
1991-2000
Non-metallic mineralRubber &plastics
ChemicalsPetroleum
Paper & publishing2001-2007
M f t iTransport equipment Electrical equipment
Machinery, necBasic & fabricated metal
Non metallic mineral
Wholesale tradeSale of motor vehicles
ConstructionElectricity
Manufacturing nec
Financial intermediationTelecommunications
Transport and storageHotels & restaurants
Retail tradeWholesale trade
Education*Public admin*
Business servicesReal estate activities*
Financial intermediation
-0.4 -0.2 0.0 0.2 0.4
social & personal serv.Health and social work*
39

TFP Growth Slowdown in KoreaTFP Growth Slowdown in Korea
• Low TFP growth in the service sectorEspecially in the non market service sector– Especially, in the non-market service sector
Non market ser ice sector• Non-market service sector– Measurement errors– Non-market (non-profit maximization) as well
as low competition (regulation)p ( g )– Other factors: R&D, firm size, and etc
40

V KIP EUKLEMS and WIODV. KIP, EUKLEMS and WIOD
• KIP2010 and EUKLEMS– Available in December 2010 (and to be sent (
to EUKLEMS in the early 2011)– 72 industries for 1970-200872 industries for 1970 2008
• Intangibles g– 27 industries (National Accounts) from the
early 1980s to 2008early 1980s to 2008– Intangible investment (following Corrado,
Hulten and Sichel’s definition) including R&DHulten and Sichel s definition) including R&D41

World Input-Output Database (WIOD) Project
• International collaborative research project based on international Input-Output Tablesp p
• Main purpose– Construction of internationally harmonized– Construction of internationally harmonized
database– for the data between countries and between
industries– about national production structure, international
trade socio economic issues and environmentaltrade, socio-economic issues and environmental issues
42

Korea’s Participation in WIODKorea s Participation in WIODWIOD’ fi t l ti ti• WIOD’s first annual consortium meeting– Vienna, May 26-28, 2010
P t d “Th Eff t f I t ibl I t t– Paper presented: “The Effect of Intangible Investment on Employment in Korea”
– Supplied WIOD with available Korean I-O tables from pp1995 to current
K ’ P ti i ti• Korea’s Participation– Plans to take an active role in this kind of international
researchresearch– Intends to provide Korean data for the construction of
DB, following WIOD’s 3 years(2010-2012) schedule
43

VI. Preliminary Estimates of Intangible Investment in Korea
• Intangible investment data as a part of WIOD projectp j
• DefinitionC d H lt & Si h l (2006 2009)– Corrado, Hulten, & Sichel (2006, 2009)
• Period: 1983-2008• Industry
National Accounts Industry classification– National Accounts Industry classification– 27 industries (11 MFG) (use and make tables)
44

Industry Classification in the National Accounts
No Industry Name No Industry NameNo Industry Name No Industry Name
1 Agriculture, forestry and fishing 14 Electricity, gas and water supply
2 Mining and quarrying 15 Construction
3 Food, beverages and tobacco 16 Wholesale and retail trade
4 Textiles, leather and fur products 17 Restraurants and hotels
5 Wood, paper, printing and reproduction 18 Transport and storage
6 Petroleum, coal and chemicals 19 Financial intermediation
7 Non-metallic mineral products 20 Real estate and renting
8 Metal products 21 Information and communicationp
9 General machinery 22 Business activities
10 Electric machinery 23 Public administration and defence
11 Precision equipment 24 Education11 Precision equipment 24 Education
12 Transport equipment 25 Health and social work
13 Furniture and other manufacturing industries 26 Recreational, cultural and sporting
14 Electricity, gas and water supply 27 Other service activities
45

Definition of Intangibles (Corrado et al.)
• Computerized Information• Computerized Information– Mainly computer software
• Innovative Property– Scientific R&D, Non-scientific R&D (R&D in financial
i d i h & li dindustry, copyrights & license costs, and new architectural & engineering designs)
E i C t i• Economic Competencies– Brand equity (advertising and market research)– Firm-specific resources (job training and consulting
costs)
46

Data SourcesData Sources
• Computerized Information– Computer software investment from BOK National
Accounts; Industry decomposition using industry-asset investment table
I ti P t• Innovative Property– Scientific R&D: Industry-level R&D series from the
S f R h d D l t bli h d bSurvey of Research and Development published by the Ministry of Education, Science and Technology; Industry-level data is availableIndustry-level data is available
47

Data Sources (Continued)Data Sources (Continued)
• Innovative Property (continued)– Non-scientific R&D
• R&D in financial industry (20% of intermediate consumption for financial intermediation industry)
• Copyrights & license costs (20% of intermediate consumption for entertainment industry)Mi l l ti f BOK NA ll f i i• Mineral exploration from BOK NA; all for mining industry
48

Data Sources (Continued)Data Sources (Continued)• Economic Competencies• Economic Competencies
– Brand equity• Advertising expenses from 60% (following CHS)• Advertising expenses from 60% (following CHS)
of gross output of adv. Industry; industry decomposition using IO tablep g
– Firm-specific resources• Employer-provided Job training costs (plus indirectEmployer provided Job training costs (plus indirect
costs) from Report on Labor Cost of Enterprise Survey published by the Ministry of Labor; industry-level data is available
• Consulting costs from BOK detail industry data; i d t d iti i IO t blindustry decomposition using IO table
49

Intangible Investments as share of GDP in Korea, 1983-2008
1983-1990 1991-2000 2001-2008Computerized information 0.4 1.1 1.7Innovative property 1.6 2.6 3.5( ) S i ifi R&D 1 1 1 7 2 3 (a) Scientific R&D 1.1 1.7 2.3
(b) Non-scientific R&D 0.6 0.9 1.2Economic competenecies 1 7 2 3 1 9Economic competenecies 1.7 2.3 1.9 (a) Brand equity 1.0 1.2 1.0(b) Firm-specific resources 0 7 1 1 1 0 (b) Firm-specific resources 0.7 1.1 1.0
Total 3.8 6.0 7.0
50

Intangible Investments as share of GDP in Korea, 1983-2008
9
7
8
4
5
6
TOTCI
2
3
4 CIRDEC
0
1
2
1983 1988 1993 1998 2003 2008
Notes: CI: Computerized InformationRD: Innovative Property
51
RD: Innovative PropertyEC: Economic Competence

Intangible Investments as share of GDP in Korea, 1983-2008
10
8Computerized InfoNon-scientific R&D
6
8 Non scientific R&DScientific R&DFirm-specific resourcesB d it
4
6 Brand equity
4
2
0 1983 1988 1993 1998 2003 2008 52

Intangible Investments as share of GDP in USAof GDP in USA,
Corrado et al. (2006)( )
53

Share of Intangible Investment in GDP: USA, UK, Japan and Korea
USA UK Japan Korea2000 2003 2004 2000 2005 2000 20052000-2003 2004 2000-2005 2000-2005
Computerized information 1.6 1.7 2.2 1.6Innovative property 4.5 3.2 6.0 3.2 (a) Scientific R&D 2.2 1.1 2.8 2.1 (b) Non-scientific R&D 2.3 2.2 3.2 1.1Economic competenecies 5.6 5.0 2.9 1.9Economic competenecies 5.6 5.0 2.9 1.9 (a) Brand equity 1.5 1.0 1.2 1.0 (b) Firm-specific resources 4.0 4.0 1.7 0.9T t l 11 7 10 0 11 1 6 7Total 11.7 10.0 11.1 6.7
Sources: Corrado, Hulten, & Sichel (2009) for USA; , , ( ) ;Marrano, Haskel & Wallis (2009) for UK; Fukao, Miyagawa, Mukai, Shinoda, & Tonogi (2009) for Japan. 54

Share of Intangible Investment in GDP: USA, UK, Japan and Korea
14
10
12
8
10
CI
4
6 RDEC
0
2
0 USA UK Japan Korea
Sources: Corrado, Hulten, & Sichel (2009) for USA; , , ( ) ;Marrano, Haskel & Wallis (2009) for UK; Fukao, Miyagawa, Mukai, Shinoda, & Tonogi (2009) for Japan. 55

ResultsResults
• Level– Korea’s share of Intangible Investment in g
GDP (6.7% during 2000-2005) lags behind USA (11.7%), Japan (11.1%), UK(10.0%)( ), p ( ), ( )
• CompositionC t t d i R&D f J & K b t– Concentrated in R&D for Japan & Korea, but in EC for USA and UK
56

Future WorkFuture Work
• Output measure and income share– Double countingg
• Real investment and capital stockD fl t– Deflators
– Depreciation rates• Ownership
Gov R&D; use or financed by industries– Gov. R&D; use or financed by industries– Foreign R&D
57

Output measureOutput measure
• Framework– Y=C+I (without intangibles)( g )– Y+N = C+I+N (with intangibles)
D bl ti A R&D E l• Double-counting: An R&D Example– A part of R&D is included in tangible
investment– A part of R&D is included in software p
investment – Gov R&D is Gov consumptionGov. R&D is Gov. consumption
58

Effect on Nominal Gross Fixed Capital Formation in 2006
Old GFCF New GFCFOld GFCF New GFCF
Equipment & Structures 231.6 228.1 q p(=231.6-3.5)
Intangibles 14.6 42.5
Computer Software 14.5 14.1 (=14.5-0.4)
Mineral Exploration 0.1 0.1
R&D 27 3R&D 27.3
Total 246.3(trillion won)
269.6Double counting
adjustment f R&D f
59[+9.5%]
for R&D software

R&D by the Types of Expenditures (%) in Korea60
50
40
30
20
L b10
Labor
Capital
Materials
60
0
1970 1975 1980 1985 1990 1995 2000 2005

DeflatorsDeflators
• Choice of deflators is different across studies– CI: software investment deflator
R&D: GDP deflator (or business or market– R&D: GDP deflator (or business or market economy VA deflator), input cost-based deflatordeflator
– Brand equity and firm-specific resources: GDP d fl t d & i t d tiGDP deflator or adv. & private education industry deflators
61

Depreciation ratesDepreciation rates
• CHS’s depreciation rates– CI (33%), R&D (20%), Brand equity (60%), ( %), ( %), q y ( %),
Firm-specific resources (40%)• Too high or too low depreciation rates for• Too high or too low depreciation rates for
Korea– CI Dep. rate by BOK or Pyo lower than CHS’
rate– Highly concentrated R&D in ICT sector in
Korea; 20% seems too low. 62