Simulation-based Ripple Effect Modelling in the Supply … · literature analysis and modelling...
34
This is an Author’s Original Manuscript of an article published by Taylor & Francis in Inter- national Journal of Production Research on 06.01.2017, available online: http://www.tandfonline.com/ http://www.tandfonline.com/doi/abs/10.1080/00207543.2016.1275873?journalCode=tprs20 Simulation-based Ripple Effect Modelling in the Supply Chain Dmitry Ivanov Berlin School of Economics and Law, Department of Business Administration Professor for Supply Chain Management, 10825 Berlin, Germany Phone: +49 3085789155; E-Mail: [email protected] Abstract In light of low-frequency/high-impact disruptions, the ripple effect has recently been intro- duced into academic literature on supply chain management. The ripple effect in the supply chain results from disruption propagation from the initial disruption point to the supply, pro- duction and distribution networks. While optimization modelling dominates this research field, the potential of simulation modelling still remains under-explored. The objective of this study is to reveal research gaps that can be closed with the help of simulation modelling. First, recent literature on both optimization and simulation modelling is analysed. Second, a simula- tion model for multi-stage supply chain design with consideration of capacity disruptions and experimental results are presented in order to depict major areas of simulation application to the ripple effect modelling. Based on both literature analysis and the modelling example, managerial insights and future research areas are identified in regard to simulation modelling
Transcript of Simulation-based Ripple Effect Modelling in the Supply … · literature analysis and modelling...
This is an Author’s Original Manuscript of an article published by Taylor & Francis in Inter-
national Journal of Production Research on 06.01.2017, available online:
http://www.tandfonline.com/
http://www.tandfonline.com/doi/abs/10.1080/00207543.2016.1275873?journalCode=tprs20
Simulation-based Ripple Effect Modelling in the Supply Chain
Dmitry Ivanov
Berlin School of Economics and Law, Department of Business Administration
Professor for Supply Chain Management, 10825 Berlin, Germany
Phone: +49 3085789155; E-Mail: [email protected]
Abstract
In light of low-frequency/high-impact disruptions, the ripple effect has recently been intro-
duced into academic literature on supply chain management. The ripple effect in the supply
chain results from disruption propagation from the initial disruption point to the supply, pro-
duction and distribution networks. While optimization modelling dominates this research
field, the potential of simulation modelling still remains under-explored. The objective of this
study is to reveal research gaps that can be closed with the help of simulation modelling. First,
recent literature on both optimization and simulation modelling is analysed. Second, a simula-
tion model for multi-stage supply chain design with consideration of capacity disruptions and
experimental results are presented in order to depict major areas of simulation application to
the ripple effect modelling. Based on both literature analysis and the modelling example,
managerial insights and future research areas are identified in regard to simulation modelling

application to the ripple effect analysis in the supply chain. The paper concludes by summa-
rizing the most important insights and outlining a future research agenda.
Keywords: supply chain dynamics; ripple effect; supply chain resilience; simulation; risk
management; supply chain engineering
1. Introduction
Significant advancements can be observed in supply chain (SC) risk management in the last
two decades (Wu et al. 2007; Tang and Musa 2012; Fahimnia et al. 2015; Ho et al. 2015;
Tukamuhabwa et al. 2015; Chiu and Choi 2016; Gupta et al. 2016). Each major accident gal-
vanizes the scientific community to renew its efforts towards disruption prevention and re-
covery. But whereas rapid strides have been made in the robust SC design and performance
impact assessment in regard to stand-alone events, much less attention has been paid towards
situations where one disruption in the SC becomes the cause of further disturbances at other
SC stages.
Disruptions in SCs are characterized by different frequency and performance impact (Chopra
et al. 2007: Gurnani et al. 2012; Chopra and Sodhi 2014; Simchi-Levi et al. 2014). High-
frequency/low-impact disruptions are typically considered in light of the bullwhip effect and
refer to demand and lead-time fluctuations (Lee et al. 1997; Chen et al. 2000; Spiegler et al.
2016). Surveys on specific aspects of SC risks in the context of a bullwhip effect are present-
ed in Dolgui and Prodhon 2007; Klibi et al. 2010; Dolgui et al. 2013; Alloulou et al. 2014;
Aglan and Lam 2015; Fahimnia et al. 2015; Ho et al. 2015; Tsai 2016).
In contrast to the well-studied bullwhip effect, low-frequency/high-impact disruptions present
new challenges for SC research and managers and belong to critical company capabilities
(Craighead et al. 2007; Haberman et al. 2015; Snyder et al. 2016). Knemeyer et al. (2009)
underline the necessity for proactive decisions in regard to catastrophic events in the SC. In
light of low-frequency/high-impact disruptions, a new term, ‘ripple effect’ has recently been
introduced into academic literature (Liberatore et al. 2012; Ivanov et al 2014a, 2014b, 2015,
2016a, 2016b; Sokolov et al. 2016). To our knowledge, the study by Liberatore et al. (2012)
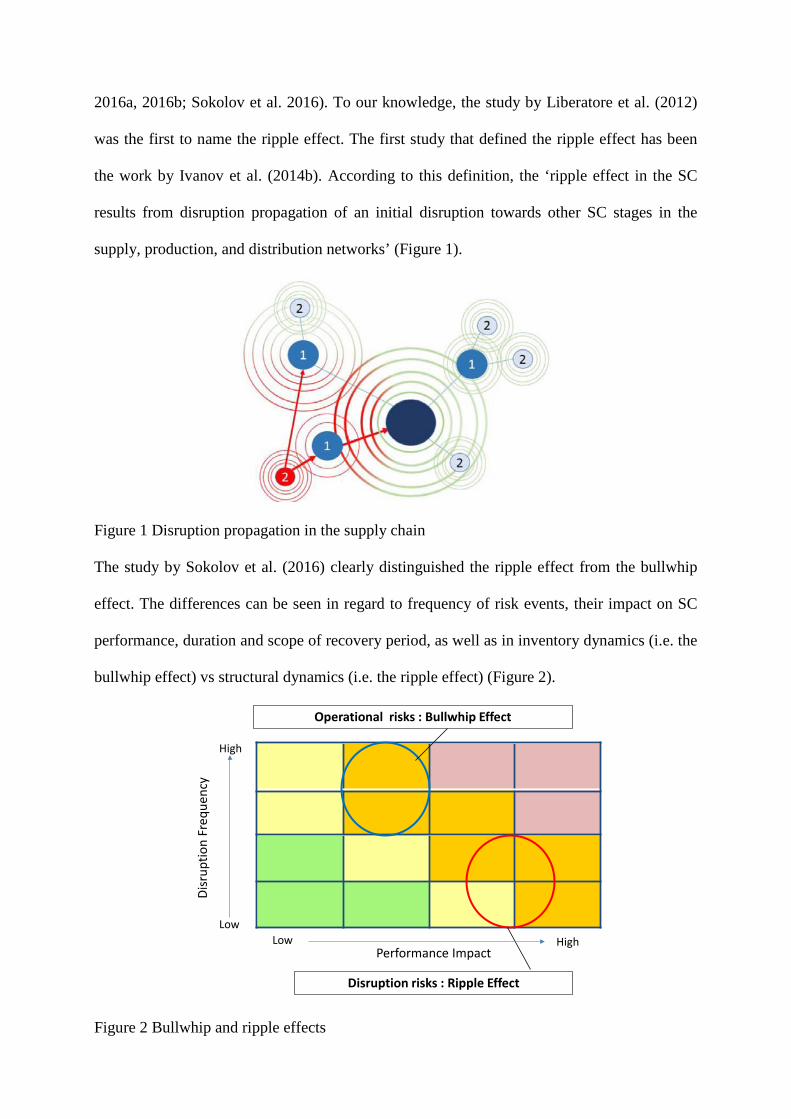
was the first to name the ripple effect. The first study that defined the ripple effect has been
the work by Ivanov et al. (2014b). According to this definition, the ‘ripple effect in the SC
results from disruption propagation of an initial disruption towards other SC stages in the
supply, production, and distribution networks’ (Figure 1).
Figure 1 Disruption propagation in the supply chain
The study by Sokolov et al. (2016) clearly distinguished the ripple effect from the bullwhip
effect. The differences can be seen in regard to frequency of risk events, their impact on SC
performance, duration and scope of recovery period, as well as in inventory dynamics (i.e. the
bullwhip effect) vs structural dynamics (i.e. the ripple effect) (Figure 2).
Figure 2 Bullwhip and ripple effects
Disruption risks : Ripple Effect
Operational risks : Bullwhip Effect
Disr
uptio
n Fr
eque
ncy
Low
High
Low HighPerformance Impact
The ripple effect in the SC occurs if a disruption at a supplier or a transportation link cannot
be localized and spreads out to other parts of the SC. The ripple effect can be related to the
domino effect in process industry infrastructures (Khakzad 2015). Wierczek (2014) names
disruption propagation in the SC as the snowball effect.
The ripple effect is a phenomenon of disruption propagation in the SC and its impact on SC
output performance (e.g. sales, on-time delivery, and total profit). The ripple effect may have
much more serious consequences than the bullwhip effect. It can result in market share losses
(e.g. Toyota lost its market leader position after the tsunami in 2011 and needed to redesign
SC coordination mechanisms (Matsuo et al. 2015)) or company value decreases. Hendricks
and Singhal (2005) quantified the negative effects of SC disruption through empirical analysis
and found 33–40% lower stock returns relative to their benchmarks over a 3-year time period
that started 1 year before and ended 2 years after a disruption; large negative effects on profit-
ability; a 107% drop in operating income; 7% lower sales growth; and an 11% growth in
costs, 2 years at a lower performance level after a disruption. Therefore, the ripple effect im-
plies high commercial costs and its mitigation is of vital importance for companies.
The ripple effect is not an infrequent occurrence. In many examples given (Chopra and Sodhi
2014 and Simchi-Levi et al. 2014), SC disruptions go beyond the disrupted stage; i.e. the orig-
inal disruption causes disruption propagation in the SC; at times there are still worse conse-
quences. Reasons for the ripple effect are not difficult to find. With increasing SC complexity
and consequent pressure on speed and efficiency, ever larger numbers of industries come to
be distributed worldwide and are concentrated in cheek-by-jowl in industrial districts. In addi-
tion, globalized SCs depend heavily on permanent transportation infrastructure availability.
Disruption propagation analysis in regard to the ripple effect in the SC deserves the attention
of optimization (Cui et al. 2010; Liberatore et al. 2012; Benyoucef et al. 2013; Li et al. 2013;
Sawik 2016; He and Zhuang 2016) and simulation (Carvalho et al. 2012; Schmitt and Singh

2012; Bueno-Salano et al. 2014; Ivanov et al. 2013, 2014a, 2014b; Garvey et al. 2015; Han
and Shin 2016; Mizgier 2016; Sawik 2016; Sokolov et al. 2016) communities.
While mathematical and stochastic optimization dominates the research domain in this field,
the potential of simulation modelling still remains under-explored. At the same time, simula-
tion is a recognized approach to modelling SC and logistics dynamics (Deleris and Erhun
2005; Haasis et al. 2008; Longo and Mirabelli 2008; Tako and Robinson 2012; Meisel and
Bierwirth 2014; Oliveira et al. 2016). In the last three decades, simulation applications to flex-
ible manufacturing systems, production-inventory systems, and SCs dynamics have been ex-
tensively presented in the International Journal of Professional Research (IJPR) (Axsäter
1974; Stecke and Solberg 1981; Wu and Wysk 1989; Villegas and Smith 2006; Ivanov et al.
2016b).
The objective of this study is to reveal research gaps that can be closed with the help of simu-
lation modelling in the field of the ripple effect in the SC. In Section 2, recent literature on
simulation modelling is analysed. Section 3 derives a framework for application of the simu-
lation research methodology to the ripple effect analysis in the SC and illustrates this on an
example of anyLogistix software. In Section 4, a ‘typical’ simulation model for multistage SC
design with consideration of capacity disruptions and experimental results is presented in or-
der to depict major areas of simulation application to ripple effect modelling. Based on both
literature analysis and modelling examples, managerial insights and future research directions
on simulation modelling application to ripple effect analysis in the SC are derived in Section
5. Section 6 concludes the paper by summarizing the most important insights and outlining a
future research agenda.
2. State-of-the-art
The need for ripple effect analysis in the SC has been recognized and systematically consid-
ered in risk analysis, performance impact and resilience assessment, and vulnerability analy-

sis. Simulation literature considers the ripple effect in the SC from five different methodical
perspectives:
- system dynamics
- agent-based modelling
- discrete-event simulation
- graph theory based simulation
- optimization-based simulation
Simulation studies on the ripple effect naturally play important roles in research communities
since they are able to handle time-dependent and gradual disruption duration, duration of re-
covery measures, capacity degradation and recovery. For complex problem settings with situ-
ational system behaviour changes in time, simulation can be even more powerful than analyti-
cal closed form analysis.
First, system dynamics has been applied to simulate the ripple effect in the SC. Wilson (2007)
considers transportation disruptions in multistage SC in order to reveal the ripple effect im-
pact on fulfilment rate and inventory fluctuations. The findings suggest that the highest per-
formance impact has transportation disruptions between the Tier-1 supplier and the ware-
house. Further, this study depicts the value of VMI (vendor-managed inventory) for disrup-
tion mitigation. Bueno-Salano et al. (2014) simulate a specific case of ripple effect, so-called
‘border effect’ in the Mexico‒US trade that may occur if products cross land borders or arrive
at seaports. The authors include three disruption duration scenarios at an international border
(three, eight, and ten days in out-of-operation mode respectively) and simulate the impact of
inventory increase to overcome such disruptions on total SC costs. The main finding of this
study is the exponential increase of total SC costs subject to increase in disruption duration
(0.1% costs increase for three days of disruption, 130% for eight days of disruption, and
472% for ten days of disruption). This is in line with results gained by Wilson (2007).

Second, agent-based simulation has been used to model SC disruptions and their impact on
SC performance. Xu et al. (2014) model disrupted capacities at suppliers in a three-stage SC
and consider recovery policies and their impact on the SC service level. The authors use
AnyLogic multi-method simulation software. The authors compare performance impact with
and without recovery measures for four scenarios. The results indicate the ripple effect impact
on customer satisfaction depends not only on recovery measures, but also on proactive resili-
ence planning. An interesting insight of this study is explicit identification of ‘retail-
er‒supplier’ links that are especially sensitive to disruptions at the suppliers. Blos et al. (2015)
present a framework of agent-based modelling of SC disruptions and focus on the refinement
agent process.
Third, discrete-event simulation has been used in the area of severe SC disruptions and resili-
ence analysis. Carvalho et al. (2012) analyse a four-stage SC based on a real case study of a
Portuguese automotive SC. Focusing on the research question of how different recovery strat-
egies influence SC performance in the case of disruptions, the authors analyse two recovery
strategies and six disruption scenarios. The scenarios differ in terms of presence or absence of
a disturbance and presence or absence of a mitigation strategy. The performance impact has
been analysed in regard to lead-time ration and total SC costs using an ARENA-based simula-
tion model.
Schmitt and Singh (2012) present a quantitative estimation of the disruption risk in a multi-
echelon SC using discrete-event simulation. The disruption risk is measured by ‘weeks of
recovery’ as an amplification of the disruption. The modelled proactive and recovery strate-
gies include satisfying demand from an alternate location in the network, procuring material
or transportation from an alternative source or route, and holding strategic inventory reserves
throughout the SC. In regard to the ripple effect, this study provides two interesting results.
First, increases in inventory levels of raw material and finished goods in anticipation of dis-
ruptions significantly exceed those required when only stochastic demand is considered. Sec-

ond, ‘upstream disruptions in the SC may not be felt as quickly as downstream disruptions,
but their impact can be amplified, outlasting the disruptions themselves’. The authors also
reveal a dependence on employment efficiency of back-up mitigation methods on the re-
sponse speed.
Lewis et al. (2013) analyse the disruption risks at ports of entry with the help of closure like-
lihood and duration which are modelled using a completely observed, exogenous Markov
chain. They developed a periodic review inventory control model that for studied scenarios
indicates that operating margins may decrease 10% for reasonably long port-of-entry closures
or eliminated completely without contingency plans, and that expected holding and penalty
costs may increase 20% for anticipated increases in port-of-entry utilization.
Hishamuddin et al. (2015) simulate a three-echelon inventory system in the SC with multiple
sourcing and consider both supply and transportation disruptions. They include disruption
duration, recovery costs, and a random disruption generator in the model. The most important
finding of this study is that back-order quantity and recovery duration have strong positive
correlations with total SC costs as compared to the importance of lost sales. This study con-
tributes to the body of knowledge on the ripple effect in SCs by revealing the fact that disrup-
tions between the supplier and manufacturer imply higher average SC costs as compared to
disruptions between the producer and distributor. At the same time, the authors reveal that
both performance impacts of recovery duration and disruption location are quite similar for
both supply and transportation disruptions. This result is in line with the study by Yu et al.
(2009).
Fourth, graph-theoretical simulation studies need to be named. Li et al. (2006) use directed
acyclic networks and the shortest path method to model an SC and consider disruptions on
sub-graphs in the networks. The authors evaluate the time lags between the disruptions in the
upstream and the consequences of these disruptions in the downstream SC. In addition, per-
formance impact is studied in regard to SC costs. Petri nets have been applied to analyse dis-

ruption propagation through the SC and to evaluate the performance impact of the disruptions
(Wu et al. 2007). Tuncel and Alpan (2010) extend the body of knowledge by incorporating
multiple disruption scenarios (disruptions in demand, transportation, and quality). In addition,
this study also considers recovery actions and the performance impact of such mitigation
strategies. Zegordi and Davarzani (2012) apply coloured Petri nets in order to improve the
visualization abilities of simulation models. The study by Lin et al. (2014) concentrates on the
reliability assessment for a multi-state SC with multiple suppliers as the probability to satisfy
market demand within the budget and production capacity limitations. They develop an algo-
rithm in terms of minimal paths to evaluate network reliability along with a numerical exam-
ple regarding auto-glass. Garvey et al. (2015) build upon minimal paths analysis and suggest
using a Bayesian network to analyse risk propagation in the SC. This is an interesting research
avenue since Bayesian networks have been applied to domino effect analysis in chemical in-
dustry infrastructures (Khakzad 2015).
Kim et al. (2015) apply graph theory to analyse the impact of SC structure on resilience. This
study reveals that the network structure significantly determines the likelihood of disruption.
Sokolov et al. (2016) quantify the ripple effect in the SC with the help of selected indicators
from graph theory subject to disruption propagation in a multistage distribution network. Han
and Shin (2016) assess the SC structural robustness considering disruption propagation in a
connected graph. They perform quantitative assessment of the structural robustness on ran-
dom networks compared with the probability of network disruption due to random risk.
Tang et al. (2016) develop a time-varied cascading failure model and analyse the ripple effect
on failed loads propagation in the SC. They present the SC as an interdependent structure of
an undirected cyber network and a directed physical network, two layers that constitute an
SC. The authors develop robustness measures and analyse the SC collapse situations. Lin et
al. (2016) evaluate the reliability of a multistage SC as the probability that the SC can suc-
cessfully deliver a sufficient amount of the commodity to meet market demand via several

transit stations under the delivery time threshold and time windows. System reliability is
treated as a delivery performance index and evaluated in terms of minimal paths.
Fifth, optimization-based simulation studies can be identified. Benyoucef et al. (2013) consid-
er a two-period SC design model in which selected suppliers are reliable in the first period
and can fail in the second period. The corresponding facility location/supplier reliability prob-
lem is formulated as a non-linear stochastic programming problem. The authors use a Monte
Carlo approach in combination with Lagrangian relaxation. Lim et al. (2013) turned away
from probability estimation issues and faced the trade-off of under- vs overestimation of dis-
ruption probabilities. Simulation results provide the evidence that underestimation of disrup-
tions may have a significantly higher impact on the total SC costs as compared to overestima-
tion. Such analysis has been performed on the basis of a stylized continuous location model.
Lee et al. (2014) simulate supply forecasts during SC disruptions. Ivanov et al. (2014a) use a
hybrid optimization-control model for simulation of SC recovery policies for multiple disrup-
tions in different periods in a multistage SC. The approach developed allows simultaneous
performance impact analysis of SC disruptions and recovery policies simulation. Schmitt et
al. (2015) investigate effects of demand uncertainty and disrupted supply. In contrast to clas-
sical results on risk pooling in multistage inventory systems, the authors find that decentral-
ized inventory system performs better for deterministic demand and stochastic supply. For the
case of stochastic demand and supply, they also recommend using a decentralized inventory
system if the decision maker is risk averse.
Chavez et al. (2016) consider transportation disruption within a multi-objective stochastic
optimization model in regard to freight costs and lead-time minimization. The authors analyse
a special case of products, e.g. perishable goods. Hasani and Khosrojerdi (2016) develop a
non-linear mixed-integer programming model and use it to simulate resilience strategies to
mitigate the risk of correlated disruptions. Ivanov et al. (2016a) extend performance impact
assessment and SC plan reconfiguration with consideration of the duration of disruptions and

the costs of recovery. They analyse seven proactive SC structures, compute recovery policies
to redirect material flows in the case of two disruption scenarios, and assess the performance
impact for both service level and costs with the help of an SC (re)planning model containing
elements of control theory and linear programming. This study reveals the impact of different
parametrical and structural resilience measures on SC service level and efficiency.
3. Simulation research framework on studying the ripple effect in the supply chain
In this section, we derive a framework for application of the simulation research methodology
in the SC to the ripple effect analysis on the basis of literature analysis and subsequently illus-
trate it by an example on anyLogistix software.
3.1. Simulation framework
Analysis of literature allows summarizing of the following framework for investigating the
ripple effect in the SC with the help of simulation research methodology (Figure 3).
Structural dynamics Disruption randomness
Recovery randomness
Operational parameter dynamics Inventory dynamics
Production dynamics
Shipment dynamics
Performance impact dynamics Sales dynamics
Service level dynamics
Costs dynamics
Figure 3 Framework for investigating the ripple effect on the SC with the help of simulation
research methodology
Let us consider in detail the content of the different levels in the framework for investigating
the ripple effect on the SC with the help of simulation research methodology.
3.1.1. Structural dynamics level

Randomness in disruptions. The first stage is to decide how to model the disruptions. Realistic
estimations are important here in regard to frequency and duration of disruptions. For exam-
ple, survey [10] in 426 organizations found that 74% of firms had experienced more than one
SC disruption, with 6–20 disruptions per year for 15% of companies.
One possible option is to work with homogenous or heterogeneous probabilities of disruptions
at different SC elements. The second option is to perform a preliminary analysis and to derive
the most critical elements in the SC in regard to the ripple effect impact on the SC perfor-
mance. For these critical elements random or scheduled disruption events can be modelled
with a probability distribution in regard to their duration.
Randomness in recovery. The ripple effect impact on the SC performance depends both on the
severity of disruptions and the speed and scale of recovery actions. Recovery can be modelled
in two basic ways. The simplest way is to schedule different periods of the capacity restora-
tions and assign some recovery costs whereas the quickest recovery may imply the highest
recovery cost. The second way is to programme individual recovery policies and to define the
rules of recovery policy activation in dependence on the occurrence time, expected duration,
and the severity of the disruption in regard to both local disturbances and the ripple effect
propagation and impact on the SC performance.
3.1.2. Operational parameter dynamics level
Inventory, supply, production and transportation dynamics belong to major SC processes
which are influenced by disruptions and recoveries and which, in turn, influence SC behav-
iour and ripple effect severity. At this stage, inventory control policies, back-ordering rules,
production batching and scheduling algorithms as well as shipment rules and policies need to
be defined and balanced with each other for both normal and disrupted modes. Some prelimi-
nary analysis may be helpful in this area in regard to safety stocks, reorder points, etc.
3.1.3. Performance impact dynamics level

The direct impact of the ripple effect is reflected in the changes of key performance indicators
(KPI). Revenue, sales, service level, fill rate and costs are typically considered in this setting.
A number of issues need to be addressed in this area. First is to decide either planned perfor-
mance needs to be fully recovered or changes to KPI targets are acceptable. Next is to decide
whether the planned KPI targets need to be recovered as soon as possible or at the end of the
planning horizon. Final step is to decide how to aggregate the individual performance impacts
of the ripple effect at different nodes and arcs in the network.
3.2 Modelling approach
Consider an example of simulating the ripple effect in software. Software anyLogistix (2016)
has been used and exhibits the following data structure (Figure 4).
Figure 4. Simulation model data structure (based on Popkov 2015)
AnyLogistix is a multi-method software with a focus on SC optimization, network design and
simulation analysis. It empowers the user with the tools for modelling complex SCs with a
greater level of detail and its comprehensive optimization. With anyLogistix, it becomes pos-
sible to model SC behaviour in dynamics and observe how changes in design, ordering and
transportation policies affect it.
The simulation environment (Figure 4) exhibits the following characteristics. It is a discrete-
event simulation model of which each structural model object is an agent in AnyLogic simu-
lation software. In block ‘demand’, customers are created and demand forecasts are set up
based on either historical data or periodic demand. In the block ‘Ordering’, sourcing policies
from distribution centres (DCs) to customers (e.g. single or multiple sourcing) and inventory
control policies (e.g. s,S or r,q) at DCs are set up and matched logically with demand fore-
casts. Similarly, in block ‘production’, sourcing policies from factories to DCs and inventory
policies at factories are set up and matched logically with production policy with the possibil-
ity of using a BOM (bill of materials). In block ‘transportation’, vehicle types and path data
are set up. Path data define parameters for shipments in the SC. By decreasing capacities at
different points in time and for different durations, performance impacts are observed for dif-
ferent scenarios.
Structural dynamics in the SC is modelled using events of which appearance and duration
may be random, scheduled or triggered by other events. Operational parameter dynamics is
the key advantage of using simulation for the ripple effect analysis since real complexities can
be considered and analysed. A KPI dashboard can be customized on the basis of more than
200 KPI that cover the large range of monetary (e.g. revenue and costs), time (e.g. lead time),
quantity-based (e.g. delayed orders) or ratio (e.g. service level or on-time delivery) KPI.
4. Experiments
4.1 Problem statement
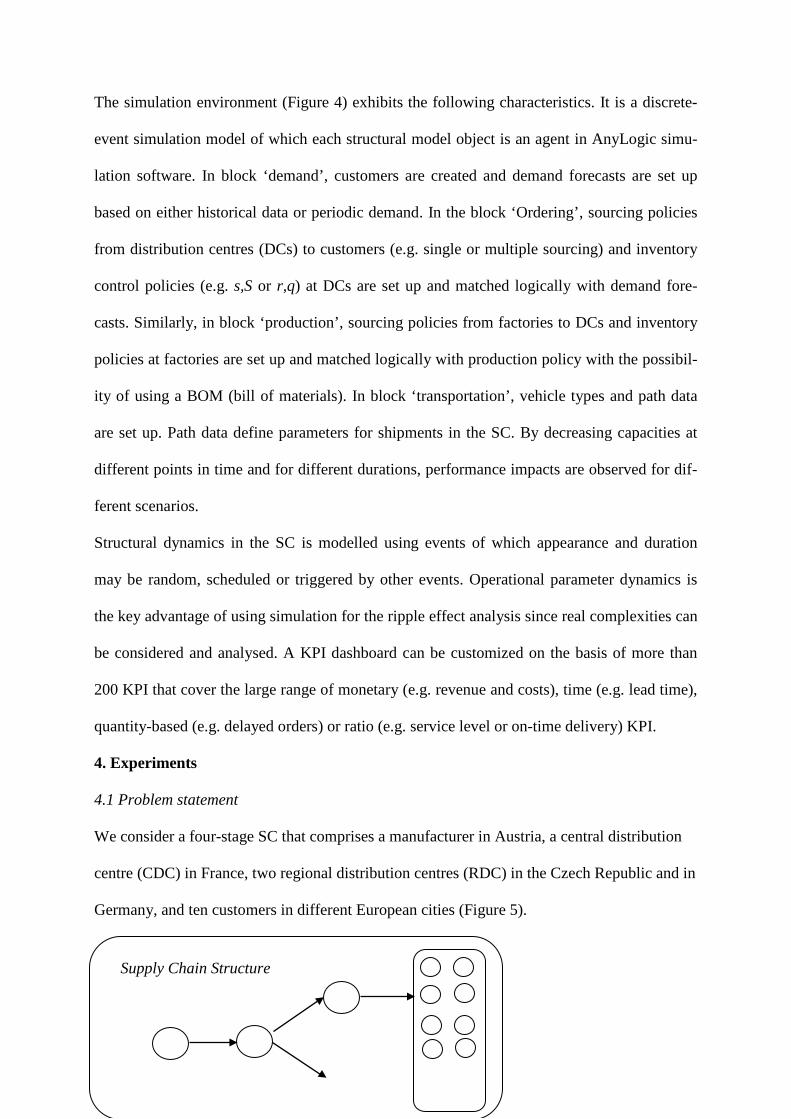
We consider a four-stage SC that comprises a manufacturer in Austria, a central distribution
centre (CDC) in France, two regional distribution centres (RDC) in the Czech Republic and in
Germany, and ten customers in different European cities (Figure 5).
Supply Chain Structure

DC Factory Customer
Figure 5. Four-stage supply chain
A single sourcing strategy is used for deliveries from DCs to customers. The SC design struc-
ture is shown in Figure 6.
Figure 6. Supply chain design structure
The developed simulation model is designed to be as simple as possible in order to derive
insights for a broad audience. This model is used for depicting ‘typical’ simulation features in
SC disruption analysis. We include the following parameters in the problem statement:
• A one-year period is considered.
• All DCs use (s,S)-inventory control policy.
• LTL (less-than-truckload) shipments are allowed.
• Transportation costs are computed subject to product weight and shipment distance
(real routes are used subject to average truck speeds).
Factory CDC RDC Customers
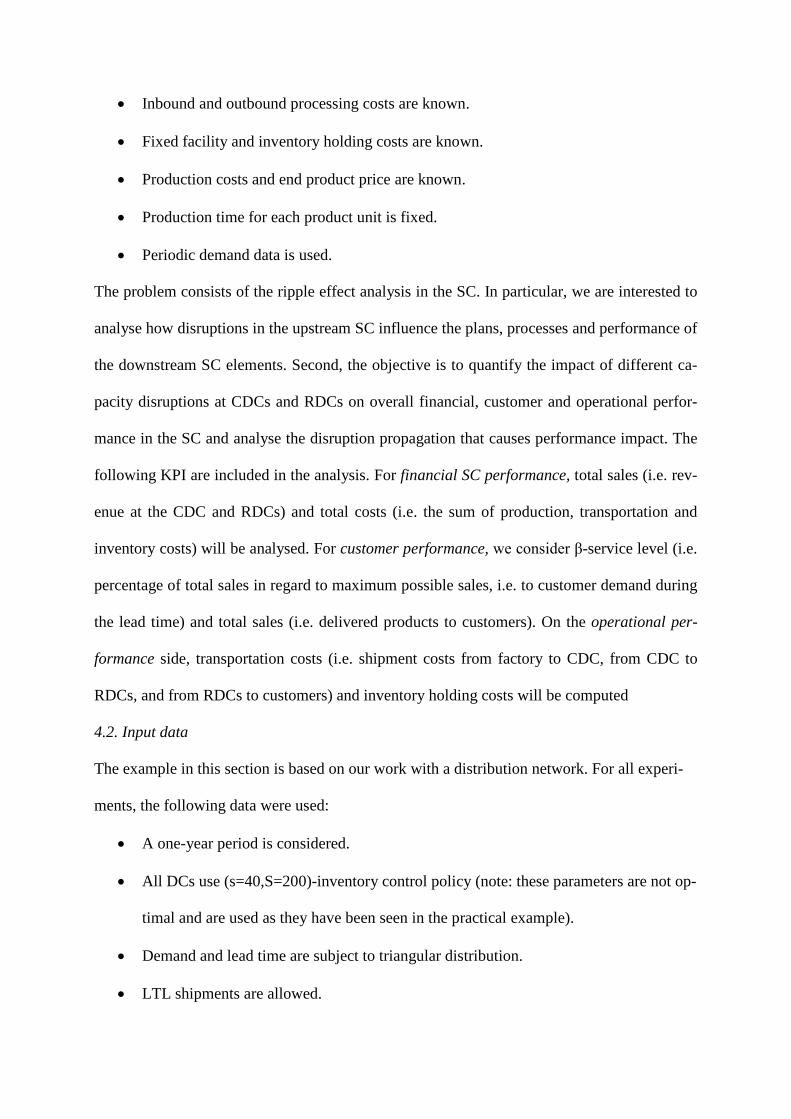
• Inbound and outbound processing costs are known.
• Fixed facility and inventory holding costs are known.
• Production costs and end product price are known.
• Production time for each product unit is fixed.
• Periodic demand data is used.
The problem consists of the ripple effect analysis in the SC. In particular, we are interested to
analyse how disruptions in the upstream SC influence the plans, processes and performance of
the downstream SC elements. Second, the objective is to quantify the impact of different ca-
pacity disruptions at CDCs and RDCs on overall financial, customer and operational perfor-
mance in the SC and analyse the disruption propagation that causes performance impact. The
following KPI are included in the analysis. For financial SC performance, total sales (i.e. rev-
enue at the CDC and RDCs) and total costs (i.e. the sum of production, transportation and
inventory costs) will be analysed. For customer performance, we consider β-service level (i.e.
percentage of total sales in regard to maximum possible sales, i.e. to customer demand during
the lead time) and total sales (i.e. delivered products to customers). On the operational per-
formance side, transportation costs (i.e. shipment costs from factory to CDC, from CDC to
RDCs, and from RDCs to customers) and inventory holding costs will be computed
4.2. Input data
The example in this section is based on our work with a distribution network. For all experi-
ments, the following data were used:
• A one-year period is considered.
• All DCs use (s=40,S=200)-inventory control policy (note: these parameters are not op-
timal and are used as they have been seen in the practical example).
• Demand and lead time are subject to triangular distribution.
• LTL shipments are allowed.

• Transportation costs are computed as 0.01 x weight x distance (real routes are used
subject to average truck speed of 70 km/h).
• Inbound and outbound processing costs at DCs are $2 each per product unit.
• Fixed facility costs are $2 per day.
• Inventory holding costs are $0.1 per day per unit.
• Production costs are $30 per unit and price is $100 per unit.
• Production time is fixed at 0.1 day per unit.
• The following demand data has been used for the experiments (Table 1).
Table 1 Demand data
Customer
Triangular lead-time distribution
Triangular demand distribution
Min Min Mode Max Mode Max Spain 4 4 7 9 15 20 Germany 2 3 3 7 12 15 18 Poland 4 4 7 12 15 17 UK 3 3 7 8 15 22 Germany 1 4 4 7 8 15 21 Italy 2 4 4 7 9 15 20 Denmark 3 3 7 12 15 18 France 4 4 7 12 15 17 Italy 1 3 3 7 8 15 22 Austria 4 4 7 8 15 21
The experimental part comprises consideration of the following disruption and reconfigura-
tion scenarios (Table 2)
Table 2 Disruptions and reconfiguration scenarios
Scenario Disruption Recovery
Scenario 1 Full disruption of CDC on 1 March and
50% capacity disruption at RDC 1 on
1 August
50% CDC capacity recovery on 1 April and full
CDC capacity recovery on 31 May
Full RDC capacity recovery on 1 September
Scenario 2 Full disruption of CDC on 1 May Full CDC capacity recovery on 1 July

Note that the scenarios in Table 2 are consciously selected without a high randomness degree
in order to make the results and their analyses more depictive. For testing, 500 replications
with a duration of 12,000 periods (weeks) with a warming up time of 50 periods have been
applied for a wide range of randomness in disruptions and recovery actions.
For sensitivity analysis, optimization experiments have been performed, the results of which
have been used for testing system behaviour in a number of scenarios. In some cases, embed-
ded an anyLogistix optimizer has been used to find optimal parameter values.
For verification, the following methods have been used: simulation run monitoring, output
data analysis in the log files, and testing with the help of deterministic data.
4.3 Sensitivity analysis
First, we test the sensitivity of the model to S-parameter of the inventory control policy that
depends on DC capacities. We perform experiments for cases without disruptions for three
data sets: S=200 for all DCs, S=100 for all DCs, and S=200 for CDC and S=100 for RDCs.
Financial and customer performance impacts are shown in Figures 7 and 8.
Figure 7. Financial performance impact in sensitivity analysis
0
1000000
2000000
3000000
4000000
Total Sales Revenue SC Total SC costs Transportationcosts
Inventory costs Profit
C O M PA R I S O N
all 100 all 200 CDC 200, RDC 100
0 0,2 0,4 0,6 0,8 1
all 100
all 200
CDC 200, RDC 100
Service Level

Figure 8 Customer performance impact
It can be observed from Figures 7 and 8 that changes in DC capacities directly influence both
financial and customer performance.
4.4 Simulation results
The experiments were performed subject to a no-disruption case and two disruption scenarios
(cf. Table 2). The financial and customer performance impact analysis is shown in Figures
9‒14.
Figure 9 Financial performance impact comparison in regard to scenario 1
It can be observed from Figure 9 that disruption at the CDC (100% in March and 50% in
April) significantly impacts total sales ($3,135,000 in the no-disruption scenario and
$2,650,000 in disruption scenario 1), revenue at DCs ($3,300,000 against $2,795,000 in
disruption scenario 1), and profit ($1,539,320 against $1,125,760 in disruption scenario
1). Figure 10 depicts inventory dynamics for the disruption period from March to April.
0
500000
1000000
1500000
2000000
2500000
3000000
Disruptions Scenario 1
Total Sales Revenue SC
Total SC costs Transportation costs
Inventory costs Profit
0500000
100000015000002000000250000030000003500000
01.янв
01.фев
01.мар
01.апр
01.май
01.июн
01.июл
01.авг
01.сен
01.окт
01.ноя
01.дек
No disruptions
Total Sales Revenue SC
Total SC costs Transportation costs
Inventory costs Profit

Figure 10 Inventory dynamics in the disruption period
The ripple effect can be observed from Figure 10. Disruption in the CDC results in deliv-
ery interruption to RDC 1 and RDC 2 (we can observe shrinking inventory quantities in
Figure 10 at both RDCs and no new replenishments). Therefore disruption propagation
from CDC to customers can be observed. At the same time, the disruption at RDC 1 in
summer does not affect SC financial performance (cf. Figure 9). No ripple effect is
caused by this disruption since deliveries to customers can be continued as planned. This
can indicate that the capacity of RDC 1 is excessive and can be reduced without influenc-
ing overall SC performance.
Insight 1: Ripple effect enhances the performance impact of disruptions. Upstream dis-
ruptions are more likely to result in the ripple effect in the case of single source policy. A
0
10
20
30
40
50
60
70
80
90
100
20 40
Qua
ntity
Days
Central DC Regional DC 1 Regional DC 2
safety stock increase can be recommended at the facilities downstream of the disruption-
risky SC elements. Higher inventory levels in downstream SC dampen the ripple effect
propagation towards the customers. At the same time, safety stock increase at disruption-
risky facilities should be considered carefully since if these facilities are not able to per-
form outbound operations (e.g. fire or strike) the increased safety stock is not useful for
dampening the ripple effect.
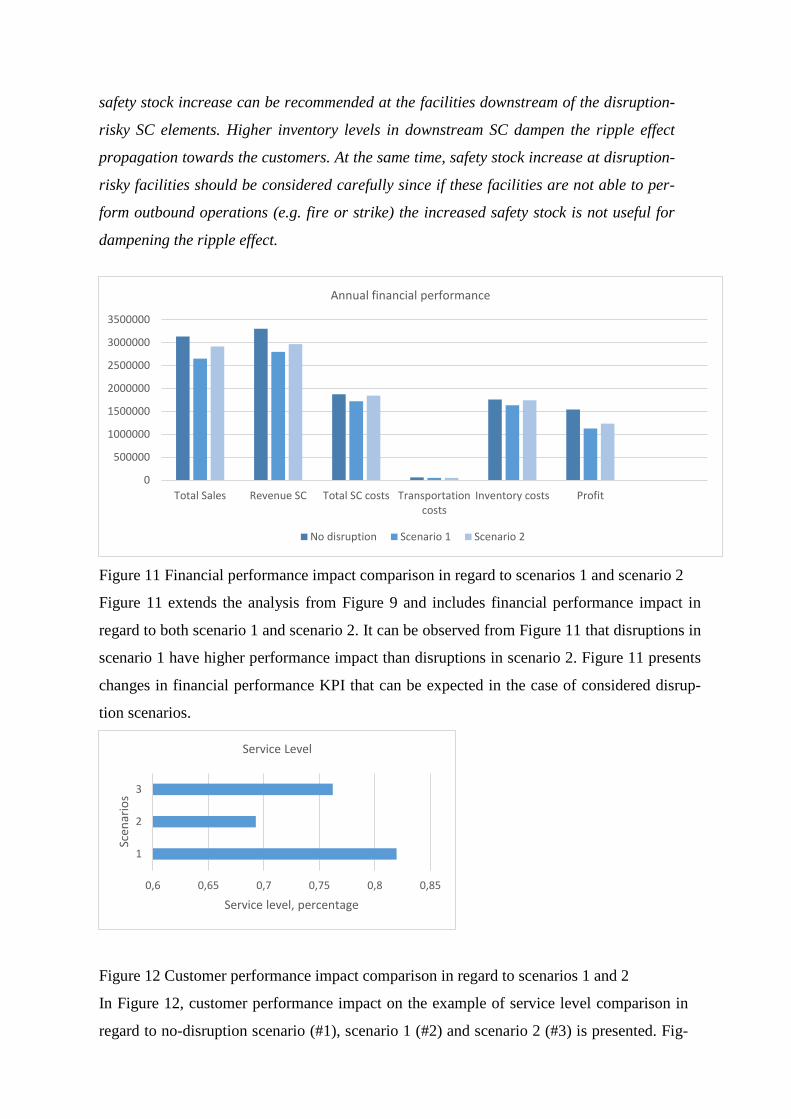
Figure 11 Financial performance impact comparison in regard to scenarios 1 and scenario 2
Figure 11 extends the analysis from Figure 9 and includes financial performance impact in
regard to both scenario 1 and scenario 2. It can be observed from Figure 11 that disruptions in
scenario 1 have higher performance impact than disruptions in scenario 2. Figure 11 presents
changes in financial performance KPI that can be expected in the case of considered disrup-
tion scenarios.
Figure 12 Customer performance impact comparison in regard to scenarios 1 and 2
In Figure 12, customer performance impact on the example of service level comparison in
regard to no-disruption scenario (#1), scenario 1 (#2) and scenario 2 (#3) is presented. Fig-
0
500000
1000000
1500000
2000000
2500000
3000000
3500000
Total Sales Revenue SC Total SC costs Transportationcosts
Inventory costs Profit
Annual financial performance
No disruption Scenario 1 Scenario 2
0,6 0,65 0,7 0,75 0,8 0,85
1
2
3
Service level, percentage
Scen
ario
s
Service Level

ure 10 illustrates that service level decreases in comparison with a no-
disruption scenario (81.9%) to 69.2% in scenario 1 and 76.2% in scenario 2.
Figure 13 Financial performance impact analysis for March
Insight 2: The ripple effect has higher impact on service level and order fulfilment than
disruption duration. This implies that dual sourcing at SC bottlenecks and large inventory
holding points downstream of disruption-risky facilities is more important than hasty in-
vestments in quick recovery.
While Figures 9‒13 depict annual performance impact, let us consider in more detail the periods
when disruptions happened. Figure 13 presents financial performance impact analysis for March
when CDC was supposed to be disrupted 100%. It can be observed from Figure 13 that total
sales, revenue, and profit significantly decrease. The only positive effect is that the total costs
also decrease since the CDC is out of operation.
Figure 14 Recovery impact on monthly performance in April
In Figure 14, we compare the performance impact for March‒April in regard to recovery actions.
In particular, we are interested in revealing the performance impact of recovery strategies. It can
0
200000
400000
600000
800000
1000000
1200000
Total Sales Revenue SC Total SC costs Transportationcosts
Inventory costs Profit
Scenario 1 Full CDC Disruption in March and 50% capacity in April
Disruption - with recovery No disruption
0
200000
400000
600000
800000
1000000
1200000
Total Sales Revenue SC Total SC costs Transportationcosts
Inventory costs Profit
Recovery impact on mothly performance
Disruption - with recovery No disruption Disruption no recovery
Optimization SC structure with back-ups Discrete number of periods Demand (distribution) in periods Production capacities in periods Beginning and ending inventory in periods Production quantities in periods Sourcing quantities in periods Shipment quantities in periods Backorder quantities in periods Production, shipment, setup, holding, delay, lost sales, fixed, processing, ordering, backordering costs Disruption duration, in periods Recovery duration, in periods Individual impact on service level, costs, lost sales at the end of planning horizon
be observed from Figure 14 that KPI increase as compared to the no-recovery case: total sales
increase from $275,000 to $345,000 ($830,000 in the no-disruption scenario), total revenue in-
creases from $405,000 to $475,000 ($995,000 in the no-disruption scenario), and total profit in-
creases from $353,784 to $416,739 ($782,576 in the no-disruption scenario). Having an estima-
tion of recovery costs, a decision maker can simulate different recovery options and analyse both
the recovery costs and performance impact with and without recovery.
Insight 3: Speed of recovery needs to be balanced with recovery costs and performance
impact of recovery. Speed of gradual capacity recovery depends on the severity of the
disruption-driven performance decrease and ripple effect intensity.
5. Managerial insights and future research avenues on simulation application to ripple
effect modelling and decision-making support in supply chain disruption management
5.1. Managerial insights
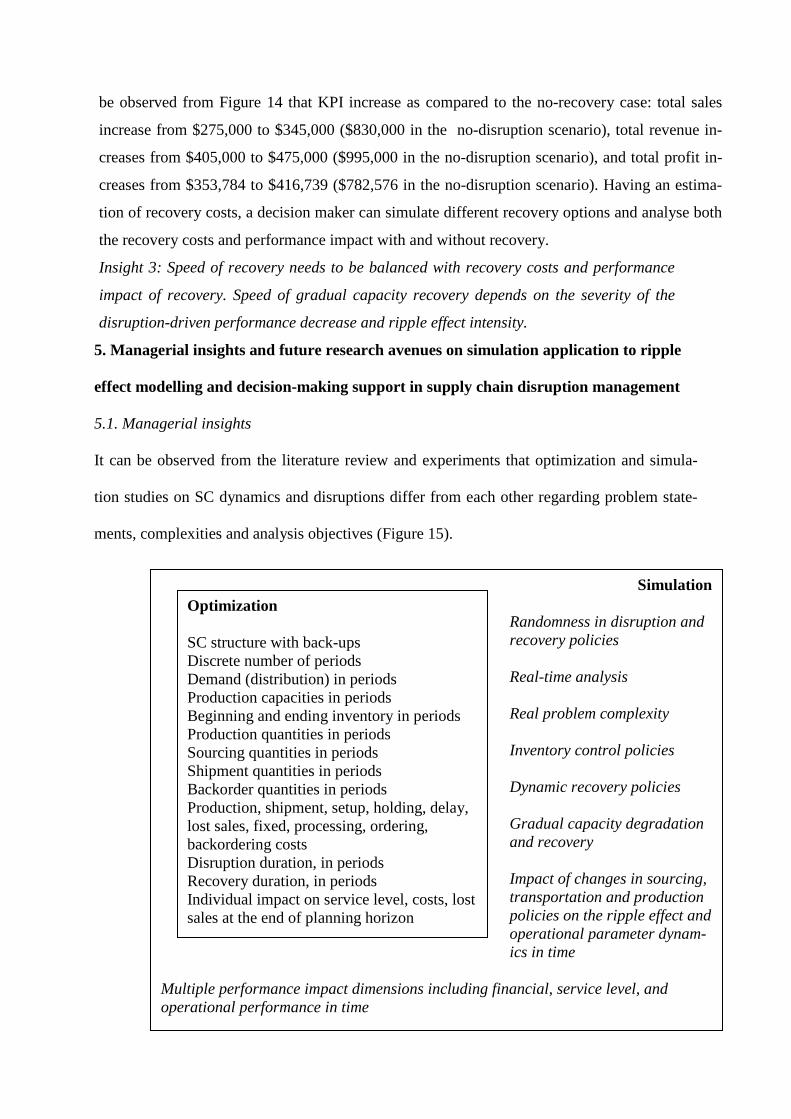
It can be observed from the literature review and experiments that optimization and simula-
tion studies on SC dynamics and disruptions differ from each other regarding problem state-
ments, complexities and analysis objectives (Figure 15).
Simulation
Randomness in disruption and recovery policies Real-time analysis Real problem complexity Inventory control policies Dynamic recovery policies Gradual capacity degradation and recovery Impact of changes in sourcing, transportation and production policies on the ripple effect and operational parameter dynam-ics in time
Multiple performance impact dimensions including financial, service level, and operational performance in time

Figure 15. Optimization and simulation models on the ripple effect in the supply chain
Optimization studies empower decision makers to determine the performance impact and re-
silient SC redesign policies within rigorous analytical solutions. These studies consider a large
variety of parameters, variables and objectives. However, in many cases simulation can en-
large the scope of a ripple effect investigation.
In optimization studies, performance impact analysis has been typically performed in regard
to disrupted elements assuming that other elements are not affected by that disruption and
continue operation in the planned mode (apart from a few studies, e.g. Losada et al. 2012;
Liberatore et al. 2012; Lee et al. 2014; Ivanov et al. 2016a). Optimization studies typically
reduce real complexity in order to obtain feasible solutions in a reasonable time. By nature,
randomness and time-related aspects of disruptions and recovery actions are difficult to repre-
sent within closed forms of mathematical equations.
State-of-the-art simulation research reveals correlations between proactive strategies (backup
vendors, inventory levels and control policies, and capacity buffers and flexibility), perfor-
mance impact, disruption duration, disruption location, disruption propagation and recovery
dynamics. Some of the important findings in optimization and simulation studies on the ripple
effect are summarized in Figure 16, based on studies by Carvalho et al. (2012); Schmitt and
Singh (2012); Bueno-Salano et al. (2014); Ivanov et al. (2014, 2016a); Xu et al. (2014);
Hishamuddin et al. (2015) and in the experiment with the simulation model in Section 4 of
this paper.

Figure 16. State-of-the-art insights on the ripple effect in the supply chain
First, simulation literature provides evidence that disruption duration and propagation impact
SC performance. Second, proactive strategies such as backup facilities and inventory have
positive impacts in regard to both performance and prevention of disruption propagation.
Disruption duration
Serv
ice
Leve
l / F
illra
te
Speed of recovery
Serv
ice
Leve
l / F
illra
te
Number of back-up facilities
Serv
ice
Leve
l / F
illra
te
Disruption propagation
Serv
ice
Leve
l / F
illra
te
SC Resilience
Cost
sofS
C pr
otec
tion
Inventory
Disr
uptio
npr
opag
atio
n
Optimization-based simulation
Optimization
Optimization
Simulation
Simulation
Simulation

Third, speed of recovery plays an important role in mitigating the performance impact of dis-
ruptions. Fourth, SC resilience increase implies significant cost increases in the SC.
However, even in simulation studies disruption duration has been typically modelled without
explicit integration with dynamic recovery time and costs. The performance analysis of the
use of supplier failure probabilities dominates the research domain. At the same time, another
important question of disruption propagation and SC design survivability with regard to both
service level and costs is still at the early stage of investigations. The role of recovery policies
needs to be analysed in more detail.
The expected managerial results of the ripple effect analysis in the SC are to provide new in-
sights in regard to the following questions:
- When does one failure trigger an adjacent set of failures?
- Which SC structures are particularly sensitive to the ripple/domino effect?
- What are the typical ripple effect scenarios and what is the most efficient way to re-
act in each of these scenarios?
In light of the reflections considered, some directions for simulation application to the ripple
effect modelling in the SC can be derived. The possibility of changing parameters dynamical-
ly during the experiment and of observing the performance impact of these changes in real
time allows the closing of some research gaps, e.g.:
- considering disruption propagation in the SC
- considering dynamic recovery policies
- considering gradual capacity degradation and recovery
- considering multiple performance impact dimensions including financial, service
level and operational performance.
Simulation analysis is therefore of vital importance for SC operations planners and dispatch-
ers at tactical and operative decision-making levels while optimization methods provide rig-
orous decision-making support for SC executives at the strategic level. By making changes to

the simulated SC, one expects to gain understanding of the dynamics of the physical SC. Sim-
ulation is an ideal tool for further analysing the performance of a proposed SC design derived
from an optimization model. Simulation-based optimization can be considered in this regard
as a technique that can integrate decision making at strategic and tactical‒operative levels.
5.2 Future research avenues
5.2.1 General use of simulation for ripple effect modelling in the SC
The ripple effect is a phenomenon of disruption propagations in the SC and their impact on
SC performance (e.g. sales, on-time delivery, total profit). With the help of optimization and
simulation approaches, the current research generates new knowledge for the influence of
disruption propagation on output SC performance considering disruption location, duration,
propagation and recovery policies.
It is natural to use simulation to further study disruption propagations and the ripple effect on
the SC. Existing studies considered time and length of disruptions and recovery policies. In
future, sensitivity analysis of output SC performance in regard to both parametrical and struc-
tural resilience levers (i.e. different capacity levels, inventory control policies, dual sourcing
and backup facilities) need to be performed. Such analysis can allow revealing and substanti-
ating major proactive and reactive decision-making support processes and models in regard to
disruption severity, recovery policies, and resilience levers in light of their singular and com-
binatorial performance impacts with consideration of disruption propagation in the SC. The
expected results of this research are to provide new insights on how to estimate the impact of
possible disruptions on performance in the proactive stage, to estimate the impact of real dis-
ruptions on performance at the execution stage, and to generate efficient and effective stabili-
zation and recovery measures.
5.2.2 Disruptions and perishable products
In literature, inventory is typically considered as an SC resilience driver. In perishable product
SCs, inventory management exhibits some specific properties due to limited storage length

and short expiration periods. The major distinguishing features in an SC with perishable
products that may affect resilience are the risks of goods write-off and customer segmentation
according to product freshness requirements. Constraints on product perishability typically
result in safety stock reductions and transportation frequency increase. On the contrary, con-
sideration of the production capacity disruption risks may lead to safety stock increase. Lim-
ited capacities of suppliers can be included in the analysis. On the customer side with typical-
ly vulnerable demand, different requirements on product freshness and penalties for product
unavailability or freshness decrease can be encountered. In addition, batching issues play an
important role in perishable product SCs. In this setting, a broad research avenue can be seen.
5.2.3 Agent-based simulation: collaboration resilience drivers
While discrete event and optimization-based simulation have their focus rather on SC re-
engineering resilience principles such as redundancy and flexibility, agent-based modelling
can be applied to a broader scope of SC resilience principles. These principles may include
collaboration (trust and information sharing) and an SC risk management culture (e.g. leader-
ship and risk-averse behaviour). In this setting, agent-based modelling can be seen as a suita-
ble method to enhance the existing simulation impact on SC ripple effect research in regard to
non-engineering SC resilience principles.
5.2.4 Ripple effect visualization
This is quite an obvious simulation feature for visualizing the processes, one which surpris-
ingly has not been extensively used in literature for modelling the ripple effect in the SC. In
this setting, simulation models can enhance existing tools on SC agility and visibility in re-
gard to disruption velocity.
5.2.5 Interdisciplinary contributions
Finally, the ripple effect can be encountered not only in SCs. Therefore, specific analysis can
be conducted in regard to state-of-the-art in financial management where the ripple effect has
been extensively developed over the last decades. Special attention can also be paid to the
works on the so-called domino effect in the processing industry. According to Khakzad
(2015), the domino effect is a ‘low frequency high consequence chain of accidents, where a
primary accident […] spreads to adjacent units, causing secondary accidents the total conse-
quences of which could be much severer than that of the primary accident’. As such, the dom-
ino effect seems to be quite similar to the ripple effect in the SC, so that the engineering con-
tributions on the domino effect are worth studying in detail.
6. Conclusion
Simulation modelling methods allow us to consider details and specific traits of the SC ele-
ments. This allows not only for visualizing network operations but also for tracing every pro-
cess inside. In addition, using simulation allows us to observe the impact of different disrup-
tions and recovery policies in time and consider gradual capacity degradation and recovery.
This study focused on low-frequency/high-impact disruptions in the four-stage SC in light of
the ripple effect. The ripple effect in the SC results from disruption propagation from the ini-
tial disruption point into the supply, production and distribution networks. The objective of
the study was to reveal research gaps that can be closed with the help of simulation modelling.
First, recent literature on the simulation modelling of the ripple effect was analysed. Second, a
simulation model for multistage SC design with consideration of capacity disruptions and
experimental results were presented.
With the help of simulation approaches, the research can generate new knowledge on the in-
fluence of disruption propagation on output SC performance considering disruption duration
and recovery policies. Sensitivity analysis of output SC performance in regard to both para-
metrical and structural resilience levers (i.e. different capacity levels, inventory control poli-
cies, dual sourcing and backup facilities) allows for revealing and substantiating major proac-
tive and reactive decision-making support processes and models in regard to disruption se-
verity, recovery policies, and resilience levers in light of their singular and combinatorial per-
formance impacts with consideration of disruption propagation in the SC.

Further, observations from the literature review acknowledge the conclusion that while opti-
mization modelling dominated the research field of SC disruption management, the potential
of simulation modelling still remains under-explored. This potential lies in the dynamic analy-
sis of both proactive strategies and recovery contingency plans.
In light of these reflections, some directions for simulation application to ripple effect model-
ling in the SC can be derived. First, the possibility of changing parameters dynamically during
the experiment and observing the performance impact of these changes in real time has to be
acknowledged. Second, simulation models allow consideration of disruption propagation in
the SC (e.g. by analysing inventory dynamics), considering dynamic recovery policies and
utilizing gradual capacity degradation and recovery in time.
In an example of a four-stage SC simulation model implemented in anyLogistix multi-method
simulation software, we developed a case study on ripple effect analysis in the SC using simu-
lation. Three scenarios (a no-disruption scenario and two disruption scenarios) have been
modelled and evaluated in regard to SC financial, customer and operational performance. The
experimental results can be used by SC managers to analyse the performance impact of dif-
ferent disruptions, disruption propagation in the SC (i.e. the ripple effect), and recovery poli-
cies in regard to their dynamics, duration, performance impact and costs.
Future research on simulation-based ripple effect modelling is multifaceted. The model pre-
sented may include extensions in both the conceptual aspect and on the technical side. In the
conceptual, more detailed scenarios and KPI schemes can be explored. On the technical side,
the model presented can be extended in regard to both parameter structure and customization
of sourcing and inventory policies in AnyLogic.
In general, future research directions on the simulation application to ripple effect modelling
in the SC can imply disruption analysis for SCs with deteriorating products, agent-based sim-
ulation of non-engineering drivers of SC resilience, ripple effect visualization, and usage of
methodical tools for domino effect analysis.

7. Literature
Aqlan, F., Lam S. S., 2015. Supply chain risk modelling and mitigation. International Journal of Pro-duction Research 53 (18), 5640-5656.
Aloulou, M.A., Dolgui, A., Kovalyov, M.Y. (2014). A bibliography of non-deterministic lot-sizing models, International Journal of Production Research, 52(8), 2293–2310.
AnyLogistix (2016). http://www.anylogistix.com/, accessed on November 13, 2016. Axsäter S. (1974). On the dynamics of inventory control systems. International Journal of Production
Research, 12(2), 289-298. Benyoucef, L., Xie, X., & Tanonkou, G.A. (2013). Supply chain network design with unreliable sup-
pliers: A lagrangian relaxation-based approach. International Journal of Production Research, 51(21), 6435–6454.
Blos M.F., Da Silva R.M., Miyagi P.E. (2015). Application of an Agent-based Supply Chain to Miti-gate Supply Chain Disruptions. IFAC-PapersOnLine 48-3, 640–645.
Bottani, E., & Montanari, R. (2010). Supply chain design and cost analysis through simulation. Inter-national Journal of Production Research, 48(10), 2859–2886.
Bueno-Solano, A. & Cedillo-Campos. M.G. (2014). Dynamic impact on global supply chain perfor-mance of disruptions propagation produced by terrorist acts. Transportation Research Part E, 61, 1-12.
Carvalho, H., Barroso, A.P., Machado, V.H., Azevedo, S., & Cruz-Machado, V. (2012). Supply chain redesign for resilience using simulation. Computers & Industrial Engineering, 62(1), 329–341.
Chávez H., Castillo-Villar K.K., Herrera L., & A. Bustos (2016). Simulation-based multi-objective model for supply chains with disruptions in transportation. Robotics and Computer-Integrated Manufacturing, in press.
Chen, Y. F., Z. Drezner, J. K. Ryan and D. Simchi-Levi (2000), Quantifying the Bullwhip Effect in a Simple Supply Chain: The Impact of Forecasting, Lead Times and Information. Management Science, 46, pp. 436—443. Chiu, C.H., T.M. Choi. Supply Chain Risk Analysis with Mean-Variance Models: A Technical Re-view. Annals of Operations Research, 240(2), 489-507, 2016. Chopra, S., & Sodhi, M.S. (2014). Reducing the risk of supply chain disruptions. MIT Sloan Man-
agement Review, 55(3), 73–80. Chopra, S., G. Reinhardt, and U. Mohan (2007). The Importance of Decoupling Recurrent and Disrup-
tion Risks in a Supply Chain. Naval Research Logistics 54(5):544–55. Craighead, C.W., Blackhurst, J., Rungtusanatham, M.J. and Handfield, R. (2007). The severity of
supply chain disruptions: design characteristics and mitigation capabilities. Decision Sciences, 38(1), 131‐156.
Cui, T., Ouyang, Y., & Shen, Z.-J.M. (2010). Reliable facility location design under the risk of disrup-tions. Operations Research, 58 (4-part-1), 998–1011.
Deleris, L. A. and Erhun, F. (2005). Risk management in supply networks using Monte-Carlo simula-tion, in M. E. Kuhl, N. M. Steiger, F. B. Armstrong and J. A. Joines, eds, ‘Proceedings of the 2005 Winter Simulation Conference’.
Dolgui, A., Ben Ammar, O., Hnaien, F. & Louly, M.-A. (2013). A state of the art on supply planning and inventory control under lead time uncertainty, Studies in Informatics and Control, 22(3), 255–268.
Dolgui, A., Prodhon, C. (2007). Supply planning under uncertainties in MRP environments: a state of the art, Annual Reviews in Control, 31, 269–279.
Fahimnia, B., Tang, C.S., Davarzani, H., Sarkis J. (2015). Quantitative Models for Managing Supply Chain Risks: A Review. European Journal of Operational Research, 247(1), 1-15.
Garvey, M.D., Carnovale S., Yeniyurt, S. (2014). Analytical framework for supply network risk prop-agation: A Bayesian network approach. European Journal of Operational Research, 243, 618–627.
Gupta, S., Starr, M. K., Farahani, R. Z. and Matinrad, N. (2016), Disaster Management from a POM Perspective: Mapping a New Domain. Prod Oper Manag, 25: 1611–1637.
Gurnani, H., Mehrotra, A. & Ray, S. (Eds.) (2012). Supply Chain Disruptions. Theory and Practice of Managing Risk. Springer, London.
Haasis, H.-D., Kreowski, H.-J., & Scholz-Reiter, B. (Hrsg.) (2008): Dynamics in Logistics, Springer, Berlin.
Habermann M., Blackhurst J., & A.Y. Metcalf (2015). Keep Your Friends Close? Supply Chain De-sign and Disruption Risk. Decision Sciences, 46(3), 491–526.
Han, J., & Shin, K.S. (2016). Evaluation mechanism for structural robustness of supply chain consid-ering disruption propagation. International Journal of Production Research, 54(1), 135-151.
Hasani, A., A. Khosrojerdi (2016). Robust global supply chain network design under disruption and uncertainty considering resilience strategies: A parallel memetic algorithm for a real-life case study. Transportation Research Part E: Logistics and Transportation Review, 87, 20-52.
He F., Zhuang J. (2016). Balancing pre-disaster preparedness and post-disaster relief. European Jour-nal of Operational Research, In Press.
Hendricks, K. B., & Singhal, V. R. (2005). Association between supply chain glitches and operating performance. Management Science, 51(5), 695–711.
Hishamuddin, H., Sarker, R.A., & Essam, D. (2015). A simulation model of a three-echelon supply chain system with multiple supplier subject to supply and transportation disruption. IFAC-PapersOnLine 48-3, 2036–2040.
Ho, W., T. Zheng, H. Yildiz & S. Talluri (2015) Supply chain risk management: a literature review. International Journal of Production Research, 53(16), 5031-5069.
Ivanov D., Sokolov B., Pavlov A., Dolgui A., Pavlov D. (2016a). Disruption-driven supply chain (re)-planning and performance impact assessment with consideration of pro-active and recovery poli-cies. Transportation Research: Part E, 90, 7-24.
Ivanov, D., Hartl, R., Dolgui, A., Pavlov, A., Sokolov, B. (2015) Integration of aggregate distribution and dynamic transportation planning in a supply chain with capacity disruption and the Ripple ef-fect consideration, International Journal of Production Research, 53:23, 6963-6979.
Ivanov, D., Sokolov, B., & Pavlov, A. (2014a). Optimal distribution (re)planning in a centralized mul-ti-stage network under conditions of ripple effect and structure dynamics. European Journal of Operational Research, 237(2), 758–770.
Ivanov, D., Sokolov, B., Dolgui, A. (2014b) The Ripple effect in supply chains: trade-off ‘efficiency-flexibility-resilience’ in disruption management, International Journal of Production Research, 52:7, 2154-2172.
Ivanov, D., Sokolov, B., Dolgui, A., Solovyeva,I., Jie, F. (2016b). Dynamic recovery policies for time-critical supply chains under conditions of ripple effect. International Journal of Production Re-search, 54(23), 7245-7258.
Ivanov D., Sokolov B., Pavlov, A. (2013) Dual problem formulation and its application to optimal re-design of an integrated production-distribution network with structure dynamics and ripple effect considerations: International Journal of Production Research, 51(18), 5386-5403.
Ivanov D., Tsipoulanidis A., Schönberger J. (2017). Global Supply Chain and Operations Manage-ment, Springer, 1st Ed. Khakzad, N. (2015). Application of dynamic Bayesian network to risk analysis of domino effects in
chemical infrastructures. Reliability Engineering and System Safety, 138, 263-272. Klibi, W., Martel, A., & Guitouni, A. (2010). The design of robust value-creating supply chain net-
works: A critical review. European Journal of Operational Research, 203(2), 283–293. Knemeyer, A.M., Zinn, W., and Eroglu, C. 2009. “Proactive planning for catastrophic events in supply
chains.” Journal of Operations Management 27 (2): 141-153. Lee HL, Padmanabhan V, Whang S (1997) Information distortion in a supply chain: The bullwhip effect. Manage Sci 43(4):546-558 Lee, A.J.L., Zhang, A.N., Goh, M., Tan, P.S. (2014). Disruption recovery modeling in supply chain
risk management. In: Proceedings of the 2014 IEEE International Conference on Management of Innovation and Technology (ICMIT), pp. 279-283.

Lewis, B.M, Erera, A.L., Nowak, M.A., & White, C.C., III (2013). Managing inventory in global sup-ply chains facing port-of-entry disruption risks. Transportation Science, 47(2), 162–180.
Li, Q., Zeng, B., & Savachkin, A. (2013). Reliable facility location design under disruptions. Comput-ers & Operations Research, 40(4), 901–909.
Liberatore F, Scaparra M.P., Daskin M.S. (2012). Hedging against disruptions with ripple effects in location analysis. Omega 40 (2012) 21–30
Lim, M.K., Bassamboo, A., Chopra, S., & Daskin, M.S. (2013). Facility location decisions with ran-dom disruptions and imperfect estimation. Manufacturing and Service Operations Management, 15(2), 239–249.
Lin, Y.K., Huang, C.F., & Yeh, C.T. (2014). Network reliability with deteriorating product and pro-duction capacity through a multi-state delivery network. International Journal of Production Re-search, 52(22), 6681–6694.
Lin, Y.K., Huang, C.F., Liao Y.-C. & Yeh, C.T. (2017). System reliability for a multistate intermodal logistics network with time windows. International Journal of Production Research, in press.
Longo, F., and Mirabelli, G. (2008). An advanced supply chain management tool based on modeling and simulation. Computers & Industrial Engineering, 54, 570–588.
Losada, C., M.P. Scaparra, J.R. O’Hanley (2012). Optimizing system resilience: A facility protection model with recovery time. European Journal of Operational Research 217, 519–530.
Matsuo H. (2015). Implications of the Tohoku earthquake for Toyota's coordination mechanism: Sup-ply chain disruption of automotive semiconductors. International Journal of Production Eco-nomics, 161, 217-227
Meisel, F., & Bierwirth, C. (2014). The design of make-to-order supply networks under uncertainties using simulation and optimization. International Journal of Production Research, 52(22), 6590–6607.
Mizgier K. (2016) Global sensitivity analysis and aggregation of risk in multi-product supply chain networks, International Journal of Production Research, in press. Oliveira J.B., Lima R.S., Montevechi, J.A.B. (2016). Perspectives and relationships in Supply Chain
Simulation: A systematic literature review. Simulation Modelling Practice and Theory, 62, 166–191.
Popkov T. (2015). Every Supply Chain is Unique, Capture Yours! Presentation at AnyLogic Confer-ence, Philadelphia, November 4th, 2015.
Sawik T. (2016). On the risk-averse optimization of service level in a supply chain under disruption risks. International Journal of Production Research, 54(1), 98-113.
Schmitt A.J., Sun S.A., Snyder L.V., Shen, Z.J.M. (2015). Centralization versus decentralization: Risk pooling, risk diversification, and supply chain disruptions. Omega, 52, 201-212.
Schmitt, A.J., & Singh, M. (2012). A quantitative analysis of disruption risk in a multi-echelon supply chain. International Journal of Production Economics, 139(1), 23–32.
Simchi-Levi, D., Schmidt, W., & Wei, Y. (2014). From superstorms to factory fires: Managing unpre-dictable supply chain disruptions. Harvard Business Review, February.
Snyder, L V., Zümbül A., Peng P., Ying R., A. J. Schmitt, and B. Sinsoysal (2016). OR/MS Models for Supply Chain Disruptions: A Review. IIE Transactions, 48(2), 89-109.
Sokolov, B., Ivanov, D., Dolgui A., Pavlov A. (2016). Structural analysis of the ripple effect in the supply chain. International Journal of Production Research, 54(1), 152-169.
Spiegler, V.L.M., A.T. Potter, M.M. Naim & D.R. Towill (2016). The value of nonlinear control theo-ry in investigating the underlying dynamics and resilience of a grocery supply chain. International Journal of Production Research, 54(1), 265-286.
Stecke K.E.,Solberg J.J. (1981). Loading and control policies for a flexible manufacturing system. International Journal of Production Research, 19(5), 481-490.
Tako A.A., Robinson S. (2012). The application of discrete event simulation and system dynamics in the logistics and supply chain context. Decision Support Systems 52, 802–815.

Tang, O. and S. N. Musa (2011), Identifying Risk Issues and Research Advancements in Supply Chain Risk Management, International Journal of Production Economics, Vol. 133, pp 25-34
Tang, L., Jing K., He J., Stanley, H.E. (2016). Complex interdependent supply chain networks: Cas-cading failure and robustness. Physica A, 443, 58–69.
Tsai W.C. (2016) A dynamic sourcing strategy considering supply disruption risks. International Jour-nal of Production Research, 54(7), 2170-2184.
Tukamuhabwa, B.R., M. Stevenson, J Busby & Marta Zorzini (2015). Supply chain resilience: defini-tion, review and theoretical foundations for further study. International Journal of Production Re-search, 53(18), 5592-5623.
Tuncel, G., & Alpan, G. (2010). Risk assessment and management for supply chain networks – A case study. Computers in Industry, 61(3), 250–259.
Villegas, F. A., & Smith, N.R., (2006). Supply chain dynamics: Analysis of inventory vs. order oscillations trade off. International Journal of Production Research, 44 (6), 1037–1054.
Wierczek, A. (2014). The impact of supply chain integration on the "snowball effect" in the trans-mission of disruptions: An empirical evaluation of the model. International Journal of Production Economics, 157(1), 89-104.
Wilson, M.C. (2007). The impact of transportation disruptions on supply chain performance. Trans-portation Research Part E: Logistics and Transportation Review, 43, 295–320.
Wu, S.-Y.D., Wysk, R.A. (1989) An application of discrete-event simulation to on-line control and scheduling in flexible manufacturing. International Journal of Production Research, 27(9), 1603-1623. Wu, T., Blackhurst, J., & O’Grady, P. (2007). Methodology for supply chain disruption analysis. In-
ternational Journal of Production Research, 45(7), 1665–1682. Xu, M., Wang, X., & Zhao, L. (2014). Predicted supply chain resilience based on structural evolution
against random supply disruptions. International Journal of Systems Science: Operations & Lo-gistics, 1(2), 105–117.
Yu, H., Zeng, A.Z., & Zhao, L. (2009). Single or dual sourcing: Decision-making in the presence of supply chain disruption risks. Omega, 37(4), 788–800.
Zegordi, S.H., & Davarzani, H. (2012). Developing a supply chain disruption analysis model: Applica-tion of coloured petri-nets. Expert Systems with Applications, 39(2), 2102–2111.