RESULTS PRESENTATION FOR THE FIRST QUARTER … · results presentation for the first quarter of...
40
RESULTS PRESENTATION FOR THE FIRST QUARTER OF 2017 17 MAY 2017 16/05/2017 1
Transcript of RESULTS PRESENTATION FOR THE FIRST QUARTER … · results presentation for the first quarter of...

RESULTS PRESENTATION
FOR THE FIRST QUARTER OF 2017
17 MAY 2017
16/05/20171

Disclaimer
This presentation may contain forward-looking statements that involve assumptions, risks and uncertainties.Actual future performance, outcomes and results may differ materially from those expressed in forward-lookingstatements as a result of a number of risks, uncertainties and assumptions. Representative examples of thesefactors include (without limitation) general industry and economic conditions, interest rate trends, cost of capitaland capital availability, competition from other developments or companies, changes in operating expenses(including employee wages, benefits and training costs), governmental and public policy changes and thecontinued availability of financing in the amounts and the terms necessary to support future business. You arecautioned not to place undue reliance on these forward-looking statements, which are based on the current viewof management on future events.
The information contained in this presentation has not been independently verified. No representation orwarranty expressed or implied is made as to, and no reliance should be placed on, the fairness, accuracy,completeness or correctness of the information or opinions contained in this presentation. Neither Cahya MataSarawak Berhad (“CMSB”) or any of its affiliates, advisers or representatives shall have any liability whatsoever(in negligence or otherwise) for any loss howsoever arising, whether directly or indirectly, from any use, relianceor distribution of this presentation or its contents or otherwise arising in connection with this presentation.
The past performance of CMSB is not indicative of the future performance of CMSB.
The value of shares in CMSB (“Shares”) and the income derived from them may fall as well as rise. Shares arenot obligations of, deposits in, or guaranteed by, CMSB or any of its affiliates. An investment in Shares is subjectto investment risks, including the possible loss of the principal amount invested.
216/05/2017

Today’s Presenters
3
Y D H Dato’ Richard Alexander John Curtis
Group Managing Director
Joined CMS in 2006 as GMD.
Non executive directorship positions include K&N Kenanga Holdings
Bhd, Kenanga Investment Bank Bhd.
Bachelor of Law (LL.B.) Honours from Bristol University, UK, Sloan
Fellow of London Business School, admitted and practised as a
solicitor in England and Hong Kong.
Joined CMS in 2005, appointed GM, Group Finance & Treasury at
end 2005, Group CFO in September 2009.
Non executive directorship positions include KKB Engineering
Berhad.
Bachelor of Science with Finance major and Economics minor,
San José State University, California.
Tuan Syed Hizam Alsagoff
Group Chief Financial Officer
16/05/2017

Contents
Section 1 Sarawak Overview
Section 2 CMS Overview
Section 3 Business Overview
Section 4 Financial Highlights
Section 5 Group Strategies & Going Forward
416/05/2017

5
Section 1
Sarawak Overview
16/05/2017

Malaysia Sarawak
▪ Area: 330,250 Sq.Km
▪ Population: 28.5 Million
▪ Capital City: Kuala Lumpur
▪ Number Of State: 13
▪ Area: 124,449 Sq.Km
▪ Population: 2.5 Million
▪ Capital City: Kuching
▪ Number Of Division: 11
South China Sea
Area and Population
6
Sarawak
16/05/2017
External factors are affecting Sarawak’s growth levels
• Low commodity & oil prices
• Weak RM
• Bank lending constraints
• General sense of global uncertainty & instability
• Latest reports indicate that global economic recovery is gaining momentum
albeit modestly – IMF projects 3.5% – 3.6% growth in 2017 (2016: 3.1%)
• Malaysian economy projected for recovery in 2017; BNM forecast for GDP
growth of 4.3% - 4.8% during 2017 (2016: 4.2%)
SARAWAK OVERVIEW FROM CMS’ PERSPECTIVE
716/05/2017

Sarawak’s medium to long term economic growth:
• Proposed 2017 State Budget: RM5.923b (73%) for development & RM2.21 (27%)
for OPEX
• State Cabinet has been reshuffled with key changes being either to add new
ministers or promote Assistant Ministers
• State to set up its own development bank to fund strategic projects, in line with its
socio-economic transformation plans; proposal has been approved by BNM
• State aims to migrate to a digital driven economy & invest RM1 billion towards
telecommunication infrastructure, increasing from 1,200 to over 5,000 towers
• State looking into LRT to connect Kuching, Serian & Samarahan Divisions
• SCORE - Tokuyama to sell its Samalaju subsidiary to South Korea’s OCI at end-
May 2017 as part of its business rehabilitation efforts; Hebei’s steel mill plans &
USD$800mil state-owned methanol complex are both progressing
SARAWAK OVERVIEW FROM CMS’ PERSPECTIVE
816/05/2017

State Credit Rating
Standard &
Poor’s
A-
Stable Outlook
Moody’s Investors Services
A3
Stable Outlook
Ram Rating
Services
AAA
Strong Outlook
Malaysia Rating Corp.
AAA
Strong Outlook
916/05/2017

5 Growth Nodes of SCORE
1. ACCESS ROAD 62KM TO
MURUM HEP
3. PROPOSED ACCESS ROAD
73KM TO BALEH HEP
5. PROPOSED ACCESS ROAD
TO TUNOH
2. ACCESS ROAD 127KM TO
BARAM HEP
6. SAMARAKAN/SANGAN/ NG.
MERIT/KAPIT ACCESS ROAD
159KM
4. PROPOSED ACCESS ROAD
TO LIMBANG HEP
11. MUKAH WATER SUPPLY
8. WATER SUPPLY TO
SAMALAJU ( Phase 1 Stage 1)
Bintulu
Mukah
Miri
Lawas
Limbang
KAPIT
BAKUN HEP
(2,400 MW)
BALEH HEP
(1200 MW)
BARAM HEP
(1000 MW)
LIMBANG HEP
(150 MW)
LongLama
Belaga
Beluru
MURUM HEP
(990 MW)
Tunoh
TANJUNG
MANIS
10. TG MANIS WATER SUPPLY
12. JALAN HAB HALAL TG MANIS
7. PROPOSED NEW MUKAH
AIRPORT 9. WATER SUPPLY TO
SAMALAJU ( Phase 1 Stage 2)
SAMALAJU INDUSTRIAL PARK
TG. MANIS HALAL HUB DEV’T
TG. MANIS TELECOM.
KanowitSong
Samalaju
Baram
Tunoh
Samarakan
Baleh bridge
Sangan – Sg. Anap 18km
B1 : 16km
Samalaju Heavy and Energy
Intensive IndustriesMukah
Smart City,
Services Hub &
R&D
Baram
HEP, Oil Palm and
Forest Plantation
Eco-Tourism
TunohOil Palm and Forest
Plantation, Agriculture
and Eco-Tourism
Tanjung ManisHalal Hub
SIBU
SARIKEI
BATANG AI
HEP
(100 MW)
BETONG
SRI AMAN
KUCHINGSAMARAHAN
1016/05/2017

11
Section 2
CMS Overview
16/05/2017

Our Vision & Mission
VISION
To be the PRIDE of Sarawak & Beyond
12
MISSION
P Producing Quality, On Spec & On Time
R Respect & Integrity
I Improving, Innovating & Investing in People
D Delivering Sustainable Growth
E Environmentally Conscious, Safe & Conducive Workplace
STAKEHOLDERS\
Shareholders, Staff, Customers & Community
16/05/2017
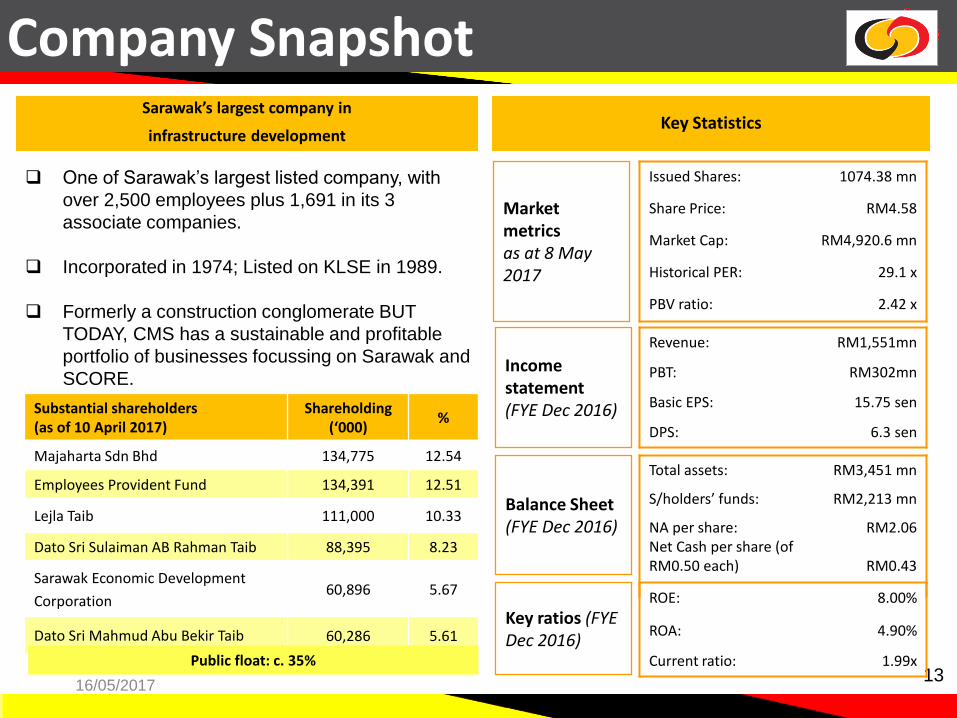
Substantial shareholders (as of 10 April 2017)
Shareholding (‘000)
%
Majaharta Sdn Bhd 134,775 12.54
Employees Provident Fund 134,391 12.51
Lejla Taib 111,000 10.33
Dato Sri Sulaiman AB Rahman Taib 88,395 8.23
Sarawak Economic Development
Corporation 60,896 5.67
Dato Sri Mahmud Abu Bekir Taib 60,286 5.61
Company SnapshotSarawak’s largest company in
infrastructure development
Total assets: RM3,451 mn
S/holders’ funds: RM2,213 mn
NA per share:Net Cash per share (of RM0.50 each)
RM2.06
RM0.43
Key Statistics
Revenue: RM1,551mn
PBT: RM302mn
Basic EPS: 15.75 sen
DPS: 6.3 sen
13
ROE: 8.00%
ROA: 4.90%
Current ratio: 1.99x
Issued Shares: 1074.38 mn
Share Price: RM4.58
Market Cap: RM4,920.6 mn
Historical PER: 29.1 x
PBV ratio: 2.42 x
Balance Sheet(FYE Dec 2016)
Income statement(FYE Dec 2016)
Key ratios (FYE Dec 2016)
Market metricsas at 8 May2017
One of Sarawak’s largest listed company, with
over 2,500 employees plus 1,691 in its 3
associate companies.
Incorporated in 1974; Listed on KLSE in 1989.
Formerly a construction conglomerate BUT
TODAY, CMS has a sustainable and profitable
portfolio of businesses focussing on Sarawak and
SCORE.
Public float: c. 35%
16/05/2017

Share Price Performance
14
High Low
2014 RM 4.72 RM 1.47
2015 RM 6.00 RM 3.87
2016 RM 5.36 RM 3.17
2017 RM 4.70 RM 3.8316/05/2017

15
Section 3
Business Overview
16/05/2017

• 1Q17 PBT is 50% higher than 1Q16’s PBT despite lower
sales volume due to:
➢ lower handling costs and cheaper imported clinker
➢ cement sales no longer supported by imports
• Investment approved for a RM9.15 mil precast & ready-
mix plant at Bintulu and a ready-mix plant in Kuching
• Ready-mix sales expected to remain steady during 2017
16
515548 560
532
127 11897 120 103 105
10 14
0
200
400
600
2013 2014 2015 2016 1Q 16 1Q 17
Revenue PBT
RM
mill
ion Cement
Division

• PBT for 1Q17 reduced, 50% lower than PBT for 1Q16, due
to lower sales volume and lower gross profit margin
• Plans to further increase Sibanyis quarry’s capacity by 1.3m
Mtpa by end-2017 & to acquire 2 additional premix plants
• Supply of stone, premix & sand has commenced for LBU
Packages 2, 5 & Kick-off package
• Supplies of materials to LBU contractors now being
monitored by a special Management Committee
• Plans in hand to use recycled wastes as roads &
construction materials
RM
mill
ion
17
393
599645
532
1096455 76 108 107
17 80
100
200
300
400
500
600
700
2013 2014 2015 2016 1Q 16 1Q 17
Revenue PBT
Construction
Materials
& Trading
Division
16/05/2017

• PBT sustained as profit was recognised upon closing of certain
completed projects.
• Revenue from federal road maintenance was lower in 1Q17 as
a result of reduction in road length maintained due to Pan
Borneo project
• Contribution from Pan Borneo Highway is expected to be
material, coming from the main construction package but
mostly from materials supply & possible other sub-contract
works
• Construction order book outside of road concession revenues
is at approx. RM1.72 bil & cautiously optimistic to grow further
Construction
& Road
Maintenance
Division
RM
mill
ion
18
289
364
444
358
87 7795 84135
94
18 18
0
100
200
300
400
500
2013 2014 2015 2016 1Q 16 1Q 17

• Profits for 1Q17 lower than 1Q16 mainly due to higher loss in the
Samalaju Hotel as a result of lower occupancy
• All current property sales projects at Bandar Samariang & The
Isthmus are selling adequately due to good product quality &
competitive pricing
• Mydin Samariang opened in Aug 2016 & Water Theme Park in
2017-2018
• The Isthmus gathering momentum with multiple projects underway
• Sales for Rivervale Devt. remain solid; represents first foray into
the middle & upper middle range properties
• Divisional GDV projections till 2018 remain on track
*Note: Samalaju Properties & Samalaju Hotel have been reclassified to this Division starting 1 Jan 2016
RM
mill
ion
19
75
114
90
104
19 16
3146
20 24
3 20
20
40
60
80
100
120
2013 2014 2015 2016 1Q 16 1Q 17
Revenue PBT
Property
Development
Division(Kuching)
16/05/2017

• Lower commodity prices affected investor sentiment
leading to output reductions & production start
delays, thus affecting demand for the township
properties & at the hotel
• Lodges, reconfigured for longer term stays, however
exceeded budgets
• Sarawak Govt. signed a Framework Cooperation
Agreement with Hebei Xinwuan Steel Group & MCC
Overseas Limited to set a USD3b steel plant in SIP
• Sewerage plant at Eco Park apartments expected
to be complete in May
• Samalaju Properties engaging with a Bintulu
company to JV to develop light industrial buildings
• New investors & project starts will happen in SIP –
patience is required
Property
Development
Division
(Samalaju)
20

153172
182195
45 4867
80
11998
25 24
0
50
100
150
200
250
2013 2014 2015 2016 1Q16 1Q17
• SACOFA is expecting organic revenue growth on the
back of bandwidth growth, rolling out of LTE sites &
increased fiberisation within the State
• Strategic plan being developed to accelerate SACOFA’s
growth
• Aims to achieve the State’s target of 95% broadband
penetration over next 5 years (current rate is 53%)
• PATNCI contribution to CMS for 2017 is expected to
remain on a steady uptrend
21
RM
mill
ion ICT
Division

• Revenues & PBT on steady uptrend
• End to End automation & systems
enhancements lead to improved analytical
agility & enriched customer experience
• Restructured its business in order to
manage its resources more efficiently
• Strategic alliances regionally with China/HK
& Japan including online broking
Strategic
Investments
22

• PATNCI of (RM1.47m) for 1Q17 due to steep fall
in manufacturing business & increasing cost of
raw materials
• Global economic slowdown & low O&G prices
limit demand for fabrication
• Petronas fabrication license aided by current
focus on Sarawak O&G development & use of
local companies offer longer term potential
• KKB:WCT consortium awarded a RM1.29b Pan
Borneo Highway package in July 2016
KKB ENGINEERING
Strategic
Investments
23

CMS OPUS PRIVATE EQUITY
Strategic
Investments
• CMS recorded profit of RM11.44 mil in 1Q17 from
the share of results of JVs (2016: RM1.64 mil)
mainly due to CMS Opus & 2 private equity funds
• An investee company successfully undertook an IPO
listing in 1Q 17 & was one of the largest Malaysian
IPOs
• As at end-2016, CMS Opus had AUM totalling
RM291.0 mil
25

25
SCORE - Background
One of the 5 development corridors by the Federal and Sarawak State
Government to turn Sarawak into a developed state.
To lift the Sarawak’s economy by increasing income per head and improve the
quality of life for the people of Sarawak.
Core ~ energy resources: Hydropower (28,000 MW), coal (1.46 billion MT) and
natural gas (40.9 trillion sq cubic ft).
Source: ADL Analysis, EPU Sarawak
Expected investment of up
to RM334 billion (20%
from govt. and 80% from
private sector).
CMS is set to be a major
local participant of
developments under
SCORE.

Project ProductCommencement of
OperationAnnual Capacity
Investment Value (USD)
Status
Tokuyama Polycrystalline Silicon 1st Phase: Jun 20132nd Phase: Apr 2014
1st Phase: 6,200 MT2nd Phase: 13,800 MT
2.5 billionPending Sale to OCI Co Ltd (of S. Korea)
Press Metal Aluminium Sep 20121st & 2nd Phase: 440,000 MTFull Capacity: 760,000 MT
2 billion In operation
AML (PertamaFerroalloy)
Manganese Ferroalloy 2016 Full Capacity: 434,000 MT 325 millionCommissioned - June
2016
Asia Advanced Materials
Metallic Silicon 2017 Full Capacity: 100,000 MT 203 million Earthwork completed
Sakura Ferroalloys
Ferro manganese & Silicon Manganese
2016Ferro Manganese: 100, 000 MTSilicon Manganese: 60, 000 MT
328 millionCommissioned - May
2016
Cosmos Chemicals
High quality solar and electronics grade
polysilicon2017 25,000 MT 1.6 billion Pre-earthwork stage
OM Materials (Sarawak)
Ferrosilicon Alloys & Manganese Alloys
Partially Commissioned: 2H 2014
Full production: 2H 2017
Ferrosilicon Alloys: 192,500 MTManganese Alloys: 200,000 MT –
300,000 MT458 million (Next slides)
MPA (Sarawak)Phosphate Products &
Coke
Commission: 1H 2018Full production:
2H 2018
Phosphate Products: 500,000 MTAmmonia: 100,000 MT
Coke: 900,000 MT545 million (Next slides)
Key Projects at Samalaju Industrial Park
26

• Recorded a loss in 1Q 17 mainly due to unrealized forex loss
and finance costs
• Project loans have been restructured to ease cash flows
pending market upturn & full commissioning
• First original phase of the smelter has been reconfigured to
produce both ferrosilicon & manganese
• In short term, commodity prices have stabilised and in the
medium/long term, OMS’ 3 key strengths will bring it to
sustainable profitability. These strengths are 1st quartile
production cost positioning, its large scale & its location
• CMS confident in OMS over the long term which is why it
acquired an additional 5% stake & subscribed in 2016 to
RM110.0 mil of CPS
OM MATERIALS (SARAWAK) Strategic
Investments
27

• Complex to be operational by Q1 2018;
fully commissioned by Q4 2018
• The PPA contract for 150 MW of power
was formalised during 1Q 16
• EPC agreement signed during 2Q 16
• Applied for UKAS grant incentive from
the Federal Government
• Parties now working towards Financial
Close in 3Q17
MALAYSIAN PHOSPHATE ADDITIVES (SARAWAK)
Strategic
Investments
28
29
Section 4
Financial Highlights
16/05/2017

Group Financials
30
2008 2009 2010 2011 2012 2013 2014 2015 2016 1Q 2017
Revenue(RM’000)
893,033 874,600 943,476 1,012,609 1,203,565 1,416,841 1,693,898 1,788,008 1,551,319 282,297
PBT(RM’000)
150,570 98,526 118,796 178,715 226,906 294,894 341,452 388,596 302,139 38,542
PATNCI(RM’000)
95,770 40,989 65,781 120,023 135,735 175,072 221,335 248,149 169,177 22,657
S/holders’funds
(RM’000)1,248,825 1,277,970 1,312,667 1,416,025 1,480,923 1,654,117 1,811,732 2,017,501 2,212,836 2,225,331
ROE(%)
7.70 /4.51
3.24 5.08 8.80 9.37 11.17 12.77 12.96 8.00 1.07
Borrowing(RM’000)
649,767 534,236 394,586 215,747 89,826 100,102 104,796 163,678 247,956 195,399
Gearingsratio
(times)0.52 0.42 0.30 0.15 0.06 0.06 0.06 0.08 0.11 0.09
EPS (sen) 29.07 12.44 19.97 36.43 41.3952.56/17.46
21.42 23.31 15.75 2.11
Cash(company)(RM’000)
322,086 404,726 753,990 625,542 493,129 579,392 674,600 256,881 391,129 284,123
16/05/2017

PBT (INRM’000) Q1 Q2 Q3 Q4
2013 54,813 68,813 62,526 108,742
2014 66,191 98,648 104,179 72,434
2015 95,010 66,707 104,564 122,315
2016 22,906 42,763 94,744 141,728
2017 38,542
31
PATNCI (INRM’000)
Q1 Q2 Q3 Q4
2013 28,727 40,014 40,992 65,339
2014 38,896 66,117 72,379 43,943
2015 57,423 40,661 65,480 84,585
2016 1,049 7,900 58,715 101,515
2017 22,657
Group Key Financials 2013 – 1Q 2017
16/05/2017

REVENUE
1,4171,674 1,788
1,551
347 282
0
200
400
600
800
1,000
1,200
1,400
1,600
1,800
2,000
2013 2014 2015 2016 1Q 16 1Q 17
RM
mill
ion
17.5221.42 23.31
15.75
0.1 2.11
11.17%12.77% 12.96%
8.03%
0.05%1.07%
-1%
1%
3%
5%
7%
9%
11%
13%
0
5
10
15
20
25
2013 2014 2015 2016 1Q 16 1Q 17
EPS ROE 1Q ROE
RM
se
n
EARNINGS PER SHARE
PBT & PBT MARGIN
295341
389
266
23 39
20.8% 20.4%21.8% 20.8%
6.6%
13.7%
0.0%
5.0%
10.0%
15.0%
20.0%
25.0%
0
50
100
150
200
250
300
350
400
450
2013 2014 2015 2016 1Q 16 1Q 17
RM
mill
ion
PBT PBT Margin
1,6541,812
2,018 2,213 2,225
614 830325 457 326100 105 164 248 195
0.06 0.06
0.08
0.11
0.09
0
0.02
0.04
0.06
0.08
0.1
0.12
0
500
1,000
1,500
2,000
2,500
2013 2014 2015 2016 1Q 17
tim
es
RM
mill
ion
S/holders’ funds Cash Borrowing Gearings
Group Key Financials 2013 – 1Q 2017
BALANCE SHEET32

Revenue Breakdown 2013 – 1Q 2017
33
515 548 560 532
127 118
393
599 645 531
109 64
289
364
444
358
87 77
75
114
90
104
19 16
113
15
17
32
34
32
26
5 8
-
0
200
400
600
800
1,000
1,200
1,400
1,600
1,800
2,000
2013 2014 2015 2016 1Q 16 1Q 17
Revenue by segment (RM'm)
Others
SamalajuDevelopment
PropertyDevelopment
Construction &Road Maintenance
ConstructionMaterials &Trading
Cement 36% 33% 31% 34% 37%42%
28% 36% 36%34% 31% 23%
20%
22% 25% 23% 25%27%
5%
7% 5% 7% 5% 6%8%1% 1%
2% 2%2% 2% 2%
3%
0%
10%
20%
30%
40%
50%
60%
70%
80%
90%
100%
2013 2014 2015 2016 1Q 16 1Q 17
Revenue by segment (%)
16/05/2017

PBT Breakdown 2013 – 1Q 2017
34
97 120
103 105
10 14
55
76 108 107
17 8
95
84
135
94
18 18
31
46
20
24
3 2
27
9
2
0
(10)(11) (14)
(15) (10) (12)
17
34
(12)(15)
7
(50)
-
50
100
150
200
250
300
350
400
2013 2014 2015 2016 1Q 16 1Q 17
PBT by segment (RM'm)
Associates
Others
SamalajuDevelopment
PropertyDevelopment
Construction & RoadMaintenance
ConstructionMaterials & Trading
Cement
33% 35%27%
35%
42%38%
19%22%
28%
35%
74%22%
32%25% 35%
31%
77%46%
11% 13% 5%8%
14%6%
9% 3%1%
-3% -3% -4% -5%
-43% -30%
5%9%
-4%
-63%
19%
-30%
-10%
10%
30%
50%
70%
90%
2013 2014 2015 2016 1Q 16 1Q 17
PBT by segment (%)
16/05/2017

Dividend Policy
Dividend policy since November 2014 is a minimum of 40% PATNCI, subject to minimum of 2 sen per share and other considerations.
35
Net Payout Ratio = Percentage of PATNCI paid out in dividends to shareholders
17 17 8.5 4.5 6.3
31.3 30.9
40.9
20
40.01
0
5
10
15
20
25
30
35
40
45
0
2
4
6
8
10
12
14
16
18
2012 2013 2014 2015 2016
Ne
t P
ayo
ut
Rat
io (
%)
DP
S (C
en
t)
Gross DPS and Net Payout Ratio (%)
Ordinary Dividend Net Payout Ratio (%)
RM 42.53m
RM48.35m
RM67.69m
RM54.13m
RM 90.42m
16/05/2017

36
Section 5
Group Strategies & Going Forward
16/05/2017

Group Strategies And Going Forward
3716/05/2017

Malaysian GDP growth for 2017 projected to be 4.3% to 4.8% (2016: 4.2%) indicating strong trade activity & improved domestic growth
Sarawak is more insulated from external downturns & turmoil due to the long term nature of its economic drivers in SCORE
Sarawak’s economic growth rate expected to remain strong at 3.5% - 4% in 2017
38
Group Strategies and Going Forward
Riding on the Sarawak Growth Story
Maximise our core business divisions & our Strategic Investments to take advantage of Sarawak’s growth
Adopt an ‘Edging strategy’ i.e. focus on business opportunities in our near field (or immediate periphery) to provide significant profits growth
Investment criteria for projects:
▪ Hurdle rate / IRR: At least 18%;
▪ Scaleable / long term sustainability;
▪ Quality partners / JVs;
▪ Raw materials processing / manufacturing and/or infra / services focus.
An indispensable ally to State development regardless of politics – thru professionalism and neutrality
Be known for our Corporate Governance, Sustainability & Management Competency
Acquire expertise / knowledge for regional expansion outside Sarawak later
To maintain a moderate risk profile
Strategies
Be the best proxy investment for Sarawak’saccelerating growth via:
Energy intensive industry investments; and
consequential infrastructure and relatedservices required across the State.
16/05/2017

• Continued focus towards a development oriented State
budget & focus towards ‘digital economy’ bodes well for
CMS
• Typically 1Q is always our slowest & sluggish; market
conditions exacerbated it in 1Q17
• With upcoming Pan Borneo contribution from materials’
sales, a likely land sale & OMS turnaround, CMS confident
on achieving a much-improved performance for 2017
financial results as against 2016
Conclusions
3916/05/2017

THANK YOU.
ANY QUESTIONS?
4016/05/2017