PC - Metals Monthly - May 2014 -...
33
Please refer to Disclosures and Disclaimers at the end of the Research Report. Metals Monthly wrap up PhillipCapital (India) Pvt. Ltd. Weak demand and increasing supply has seen pressure in the domestic flat steel prices however the Long products has shown resilience with low inventory and stable demand. The domestic industry is awaiting SC order on Orissa iron ore case which could significantly disrupt the supply in the event of mining restrictions. Global steel prices were mixed with higher steel prices in the developing economies and developed nations showing flat to marginal weakness in the prices. The current month also stood bad for the raw material prices with both iron ore and coking coal (contract) showing strong declines during the month. Non Ferrous metals gained during the month with zinc leading the pack. Key Highlights Ferrous • Flat product prices have corrected by 1‐2% across India in Apr 2014 post gaining 3‐7% since start of the calendar year. Long products prices increased by 1‐5% across India. Improved demand, higher semi product prices and low inventory led to another hike of Rs 500‐1,000 per tonne in May 2014. • Flat products prices in China and CIS have seen 2‐4% gain in April 2014 while it has corrected in US and Europe. Long products prices stood flat in CIS and Europe while improved in US and China. • Global iron ore prices of 62% Fe grade fell by 9.8% to US$ 105 per tonnes during the month as Chinese banking regulator has urged local authorities and banks to step up investigation into iron ore financing deals to minimize default risks. This overhang could drive down the prices further in near future. Indian iron ore miners have kept their prices unchanged while NMDC has reduced lumps prices by Rs 200 per tonne after keeping it constant for five months. Domestic pellet prices increased by Rs 300/tn to Rs 6,650/tn in Apr 2014. • Scrap prices increased across geographies with domestic market leading the pack (up 4.0% mom). • Spot coking coal prices increased by US$ 5/tn to US$ 112/tn. Contract prices for Q2CY14 were down 16% to US$ 120. Thermal coal prices fell across regions (except South Africa) with highest fall reported in Indonesia. • Global steel inventory excluding EU fell by 6.2% (~2.2mn tonnes) in Apr 2014 on falling inventory in China. Iron ore inventory at ports in China stands at 105.2mn tonnes, up 1.4% mom. Non Ferrous • All base metal prices gained during the month with Zinc leading the pack. Prices of aluminium/ zinc/ lead/ copper moved +2.3%/ +3.6%/ +2.0%/ +0.1% respectively. Base metal prices in Shanghai increased by 1‐6% with copper leading the pack. • Aluminium regional premiums have increased significantly post UK court has scrapped plan of changes in warehousing rules to be implemented from 1st April, 2014. Premium in Japan/ Europe/ China increased by US$ 112/ 20/ 33 to US$ 367/ 375/ 363 respectively. Premium for zinc in Singapore improved by 12.1% while premium for lead decreased by 12.5% in Apr 2014. • Alumina price as a % of LME decreased to 17.8% in Apr 2014 against 18.5% in Mar 2014. • LME inventory have fell across base metals with highest fall reported by copper. LME inventory of aluminium/ zinc/ lead/ copper fell by 0.5%/ 0.3%/ 3.3%/ 12.0% respectively. Valuations FY15E (x) P/E P/BV EV/EBITDA JSW Steel 9.3 1.1 5.8 Tata Steel 11.1 1.0 11.1 SAIL 14.6 0.7 9.4 JSPL 9.9 2.1 6.6 Hindalco 12.5 0.7 8.0 Nalco 11.7 0.8 3.7 Hindustan Zinc 7.7 1.2 3.3 Sesa Sterlite 6.9 1.5 4.4 Regional Performance (rebased) 60 70 80 90 100 110 120 130 140 India Brazil Australia London Indices (rebased) 60 70 80 90 100 110 120 130 140 BSE Ssnsex BSE Metal Index Absolute Performance Change (table) 1M 3M 6M Aluminium 2.3 6.4 (3.5) Zinc 3.6 3.9 6.3 Copper 0.1 (6.2) (8.0) Lead 2.0 (0.6) (3.7) HRC (1.0) (0.5) 1.0 TMT 5.4 3.4 12.8 Iron Ore (9.8) (14.0) (20.1) Coking Coal 4.3 (10.6) (23.2) Thermal Coal (0.4) (8.9) (9.7) Source: Company, PhillipCapital India Research Dhawal Doshi (+ 9122 6667 9769) [email protected] Dharmesh Shah (+ 9122 6667 9974) [email protected]
Transcript of PC - Metals Monthly - May 2014 -...
Please refer to Disclosures and Disclaimers at the end of the Research Report.
Metals Monthly wrap up
PhillipCapital (India) Pvt. Ltd.
Weak demand and increasing supply has seen pressure in the domestic flat steel prices however the Long products has shown resilience with low inventory and stable demand. The domestic industry is awaiting SC order on Orissa iron ore case which could significantly disrupt the supply in the event of mining restrictions. Global steel prices were mixed with higher steel prices in the developing economies and developed nations showing flat to marginal weakness in the prices. The current month also stood bad for the raw material prices with both iron ore and coking coal (contract) showing strong declines during the month. Non Ferrous metals gained during the month with zinc leading the pack. Key Highlights Ferrous • Flat product prices have corrected by 1‐2% across India in Apr 2014 post gaining 3‐7% since start of the calendar year. Long products prices increased by 1‐5% across India. Improved demand, higher semi product prices and low inventory led to another hike of Rs 500‐1,000 per tonne in May 2014.
• Flat products prices in China and CIS have seen 2‐4% gain in April 2014 while it has corrected in US and Europe. Long products prices stood flat in CIS and Europe while improved in US and China.
• Global iron ore prices of 62% Fe grade fell by 9.8% to US$ 105 per tonnes during the month as Chinese banking regulator has urged local authorities and banks to step up investigation into iron ore financing deals to minimize default risks. This overhang could drive down the prices further in near future. Indian iron ore miners have kept their prices unchanged while NMDC has reduced lumps prices by Rs 200 per tonne after keeping it constant for five months. Domestic pellet prices increased by Rs 300/tn to Rs 6,650/tn in Apr 2014.
• Scrap prices increased across geographies with domestic market leading the pack (up 4.0% mom).
• Spot coking coal prices increased by US$ 5/tn to US$ 112/tn. Contract prices for Q2CY14 were down 16% to US$ 120. Thermal coal prices fell across regions (except South Africa) with highest fall reported in Indonesia.
• Global steel inventory excluding EU fell by 6.2% (~2.2mn tonnes) in Apr 2014 on falling inventory in China. Iron ore inventory at ports in China stands at 105.2mn tonnes, up 1.4% mom.
Non Ferrous • All base metal prices gained during the month with Zinc leading the pack. Prices of aluminium/ zinc/ lead/ copper moved +2.3%/ +3.6%/ +2.0%/ +0.1% respectively. Base metal prices in Shanghai increased by 1‐6% with copper leading the pack.
• Aluminium regional premiums have increased significantly post UK court has scrapped plan of changes in warehousing rules to be implemented from 1st April, 2014. Premium in Japan/ Europe/ China increased by US$ 112/ 20/ 33 to US$ 367/ 375/ 363 respectively. Premium for zinc in Singapore improved by 12.1% while premium for lead decreased by 12.5% in Apr 2014.
• Alumina price as a % of LME decreased to 17.8% in Apr 2014 against 18.5% in Mar 2014.
• LME inventory have fell across base metals with highest fall reported by copper. LME inventory of aluminium/ zinc/ lead/ copper fell by 0.5%/ 0.3%/ 3.3%/ 12.0% respectively.
Valuations FY15E (x) P/E P/BV EV/EBITDAJSW Steel 9.3 1.1 5.8Tata Steel 11.1 1.0 11.1SAIL 14.6 0.7 9.4JSPL 9.9 2.1 6.6Hindalco 12.5 0.7 8.0Nalco 11.7 0.8 3.7Hindustan Zinc 7.7 1.2 3.3Sesa Sterlite 6.9 1.5 4.4 Regional Performance (rebased)
60708090
100110120130140 India Brazil
Australia London
Indices (rebased)
60708090
100110120130140
BSE Ssnsex
BSE Metal Index
Absolute Performance Change (table)
1M 3M 6MAluminium 2.3 6.4 (3.5)Zinc 3.6 3.9 6.3Copper 0.1 (6.2) (8.0)Lead 2.0 (0.6) (3.7)HRC (1.0) (0.5) 1.0TMT 5.4 3.4 12.8Iron Ore (9.8) (14.0) (20.1)Coking Coal 4.3 (10.6) (23.2)Thermal Coal (0.4) (8.9) (9.7)
Source: Company, PhillipCapital India Research Dhawal Doshi (+ 9122 6667 9769) [email protected] Dharmesh Shah (+ 9122 6667 9974) [email protected]
– 2 of 33 –
12 May 2014 / INDIA EQUITY RESEARCH / METALS – MONTHLY WRAP UP
INDEX Ferrous ‐‐‐‐‐‐‐‐‐‐‐‐‐‐‐‐‐‐‐‐‐‐‐‐‐‐‐‐‐‐‐‐‐‐‐‐‐‐‐‐‐‐‐‐‐‐‐‐‐‐‐‐‐‐‐‐‐‐‐‐‐‐‐‐‐‐‐‐‐‐‐‐‐‐‐‐‐‐ 3
Steel Prices ‐‐‐‐‐‐‐‐‐‐‐‐‐‐‐‐‐‐‐‐‐‐‐‐‐‐‐‐‐‐‐‐‐‐‐‐‐‐‐‐‐‐‐‐‐‐‐‐‐‐‐‐‐‐‐‐‐‐‐‐‐‐‐‐‐‐‐ 3
Raw Material Prices (Iron ore, Scrap, Coal) ‐‐‐‐‐‐‐‐‐‐‐‐‐‐‐‐‐‐‐‐‐‐‐‐‐‐ 6
Ferro Alloy Prices ‐‐‐‐‐‐‐‐‐‐‐‐‐‐‐‐‐‐‐‐‐‐‐‐‐‐‐‐‐‐‐‐‐‐‐‐‐‐‐‐‐‐‐‐‐‐‐‐‐‐‐‐‐‐‐‐‐‐‐ 9
Steel Profitability & Cost Index ‐‐‐‐‐‐‐‐‐‐‐‐‐‐‐‐‐‐‐‐‐‐‐‐‐‐‐‐‐‐‐‐‐‐‐‐‐‐‐‐‐‐ 10
Production & Inventory ‐‐‐‐‐‐‐‐‐‐‐‐‐‐‐‐‐‐‐‐‐‐‐‐‐‐‐‐‐‐‐‐‐‐‐‐‐‐‐‐‐‐‐‐‐‐‐‐‐‐‐ 11
Trade Data ‐‐‐‐‐‐‐‐‐‐‐‐‐‐‐‐‐‐‐‐‐‐‐‐‐‐‐‐‐‐‐‐‐‐‐‐‐‐‐‐‐‐‐‐‐‐‐‐‐‐‐‐‐‐‐‐‐‐‐‐‐‐‐‐‐‐‐ 13
Non Ferrous ‐‐‐‐‐‐‐‐‐‐‐‐‐‐‐‐‐‐‐‐‐‐‐‐‐‐‐‐‐‐‐‐‐‐‐‐‐‐‐‐‐‐‐‐‐‐‐‐‐‐‐‐‐‐‐‐‐‐‐‐‐‐‐‐‐‐‐‐‐‐‐ 15
Aluminium, Alumina & Bauxite ‐‐‐‐‐‐‐‐‐‐‐‐‐‐‐‐‐‐‐‐‐‐‐‐‐‐‐‐‐‐‐‐‐‐‐‐‐‐‐‐‐ 15
Zinc ‐‐‐‐‐‐‐‐‐‐‐‐‐‐‐‐‐‐‐‐‐‐‐‐‐‐‐‐‐‐‐‐‐‐‐‐‐‐‐‐‐‐‐‐‐‐‐‐‐‐‐‐‐‐‐‐‐‐‐‐‐‐‐‐‐‐‐‐‐‐‐‐‐‐‐‐‐ 20
Lead ‐‐‐‐‐‐‐‐‐‐‐‐‐‐‐‐‐‐‐‐‐‐‐‐‐‐‐‐‐‐‐‐‐‐‐‐‐‐‐‐‐‐‐‐‐‐‐‐‐‐‐‐‐‐‐‐‐‐‐‐‐‐‐‐‐‐‐‐‐‐‐‐‐‐‐‐ 22
Copper ‐‐‐‐‐‐‐‐‐‐‐‐‐‐‐‐‐‐‐‐‐‐‐‐‐‐‐‐‐‐‐‐‐‐‐‐‐‐‐‐‐‐‐‐‐‐‐‐‐‐‐‐‐‐‐‐‐‐‐‐‐‐‐‐‐‐‐‐‐‐‐‐‐ 24
Trade Data ‐‐‐‐‐‐‐‐‐‐‐‐‐‐‐‐‐‐‐‐‐‐‐‐‐‐‐‐‐‐‐‐‐‐‐‐‐‐‐‐‐‐‐‐‐‐‐‐‐‐‐‐‐‐‐‐‐‐‐‐‐‐‐‐‐‐‐ 27
– Aluminium ‐‐‐‐‐‐‐‐‐‐‐‐‐‐‐‐‐‐‐‐‐‐‐‐‐‐‐‐‐‐‐‐‐‐‐‐‐‐‐‐‐‐‐‐‐‐‐‐‐‐‐‐‐‐‐‐‐‐‐‐‐‐‐‐‐ 27
– Zinc & Lead ‐‐‐‐‐‐‐‐‐‐‐‐‐‐‐‐‐‐‐‐‐‐‐‐‐‐‐‐‐‐‐‐‐‐‐‐‐‐‐‐‐‐‐‐‐‐‐‐‐‐‐‐‐‐‐‐‐‐‐‐‐‐‐‐ 28
– Copper ‐‐‐‐‐‐‐‐‐‐‐‐‐‐‐‐‐‐‐‐‐‐‐‐‐‐‐‐‐‐‐‐‐‐‐‐‐‐‐‐‐‐‐‐‐‐‐‐‐‐‐‐‐‐‐‐‐‐‐‐‐‐‐‐‐‐‐‐‐‐ 29
LME Cancelled Warrant ‐‐‐‐‐‐‐‐‐‐‐‐‐‐‐‐‐‐‐‐‐‐‐‐‐‐‐‐‐‐‐‐‐‐‐‐‐‐‐‐‐‐‐‐‐‐‐‐‐‐‐ 30
Open Interest – LME ‐‐‐‐‐‐‐‐‐‐‐‐‐‐‐‐‐‐‐‐‐‐‐‐‐‐‐‐‐‐‐‐‐‐‐‐‐‐‐‐‐‐‐‐‐‐‐‐‐‐‐‐‐‐‐ 31
– 3 of 33 –
12 May 2014 / INDIA EQUITY RESEARCH / METALS – MONTHLY WRAP UP
Ferrous: Steel Prices
Domestic HRC – Regionwise(Rs / tonne) Domestic TMT – Regionwise (Rs / tonne)
34,500
35,500
36,500
37,500
38,500
39,500
40,500
41,500
42,500
43,500 Ahm Hyd Ludhiana
31,000 32,000 33,000 34,000 35,000 36,000 37,000 38,000 39,000 40,000
Chennai Mumbai
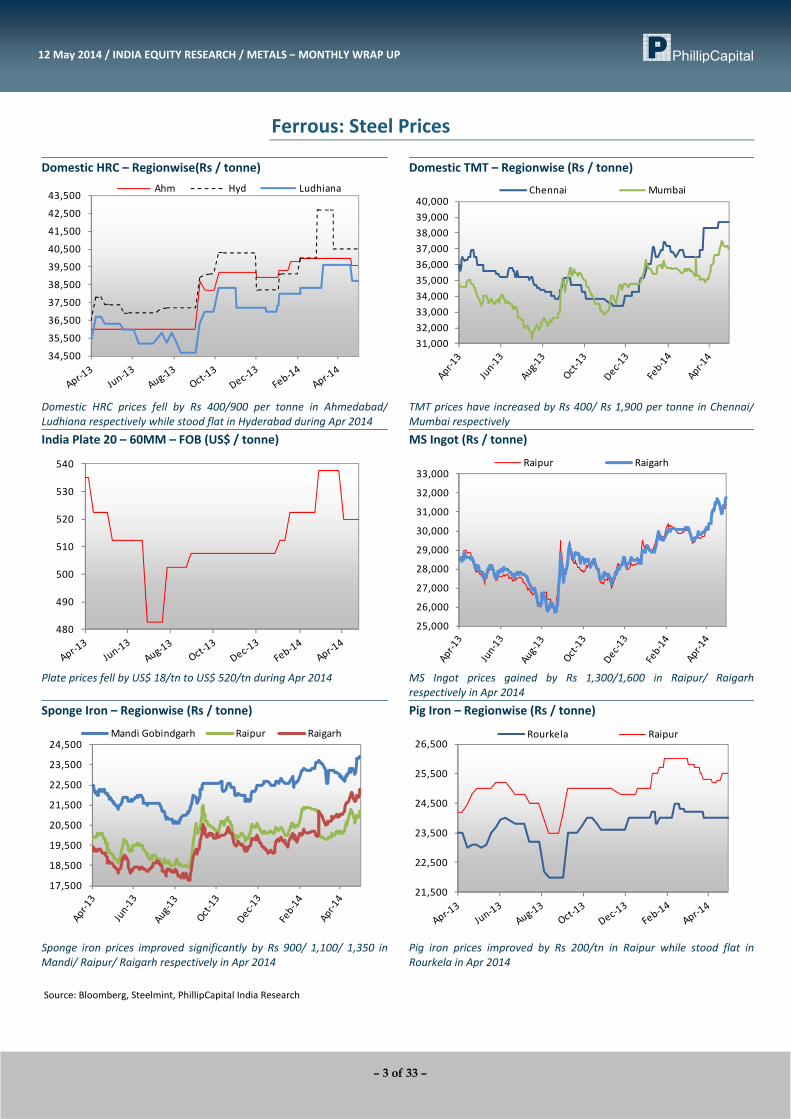
Domestic HRC prices fell by Rs 400/900 per tonne in Ahmedabad/Ludhiana respectively while stood flat in Hyderabad during Apr 2014
TMT prices have increased by Rs 400/ Rs 1,900 per tonne in Chennai/ Mumbai respectively
India Plate 20 – 60MM – FOB (US$ / tonne) MS Ingot (Rs / tonne)
480
490
500
510
520
530
540
25,000
26,000
27,000
28,000
29,000
30,000
31,000
32,000
33,000 Raipur Raigarh
Plate prices fell by US$ 18/tn to US$ 520/tn during Apr 2014
MS Ingot prices gained by Rs 1,300/1,600 in Raipur/ Raigarh respectively in Apr 2014
Sponge Iron – Regionwise (Rs / tonne) Pig Iron – Regionwise (Rs / tonne)
17,500
18,500
19,500
20,500
21,500
22,500
23,500
24,500 Mandi Gobindgarh Raipur Raigarh
21,500
22,500
23,500
24,500
25,500
26,500 Rourkela Raipur
Sponge iron prices improved significantly by Rs 900/ 1,100/ 1,350 inMandi/ Raipur/ Raigarh respectively in Apr 2014
Pig iron prices improved by Rs 200/tn in Raipur while stood flat in Rourkela in Apr 2014
Source: Bloomberg, Steelmint, PhillipCapital India Research
– 4 of 33 –
12 May 2014 / INDIA EQUITY RESEARCH / METALS – MONTHLY WRAP UP
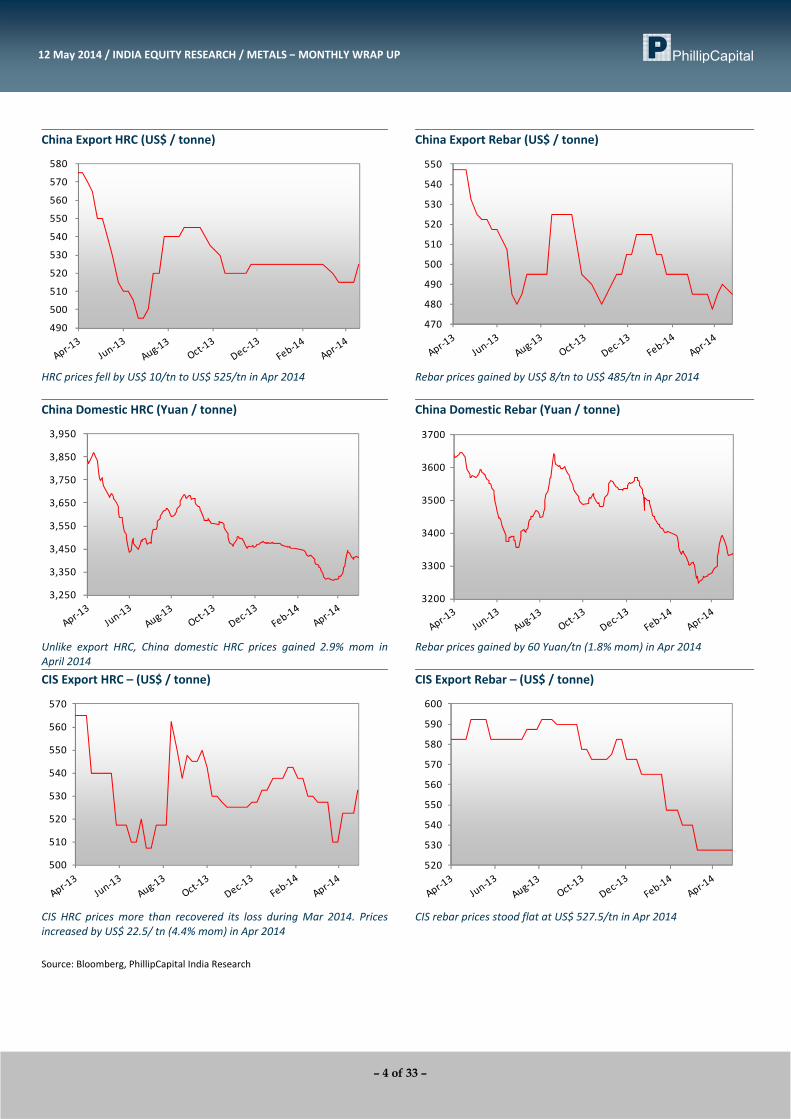
China Export HRC (US$ / tonne) China Export Rebar (US$ / tonne)
490
500
510
520
530
540
550
560
570
580
470
480
490
500
510
520
530
540
550
HRC prices fell by US$ 10/tn to US$ 525/tn in Apr 2014
Rebar prices gained by US$ 8/tn to US$ 485/tn in Apr 2014
China Domestic HRC (Yuan / tonne) China Domestic Rebar (Yuan / tonne)
3,250
3,350
3,450
3,550
3,650
3,750
3,850
3,950
3200
3300
3400
3500
3600
3700
Unlike export HRC, China domestic HRC prices gained 2.9% mom in April 2014
Rebar prices gained by 60 Yuan/tn (1.8% mom) in Apr 2014
CIS Export HRC – (US$ / tonne) CIS Export Rebar – (US$ / tonne)
500
510
520
530
540
550
560
570
520
530
540
550
560
570
580
590
600
CIS HRC prices more than recovered its loss during Mar 2014. Pricesincreased by US$ 22.5/ tn (4.4% mom) in Apr 2014
CIS rebar prices stood flat at US$ 527.5/tn in Apr 2014
Source: Bloomberg, PhillipCapital India Research

– 5 of 33 –
12 May 2014 / INDIA EQUITY RESEARCH / METALS – MONTHLY WRAP UP
EU Domestic HRC (Euro / tonne) EU Domestic Rebar (Euro / tonne)
425435445455465475485495505515
Northern Southern
440450460470480490500510520530
Northern Southern
Price in Northern Europe stood flat at 447.5 euros while it fell by 5 euros in Southern Europe to 430 euros in Apr 2014
Price in Northern Europe stood flat at 490 euros while it gained by 7.5 euros in Southern Europe to 455 euros in Apr 2014
US Import HRC – (US$ / tonne) US Import Rebar (US$ / tonne)
560
570
580
590
600
610
620
550
560
570
580
590
600
610
US import HRC fell by US$ 5/tn to US$ 590/tn in Apr 2014
US import Rebar price stood flat at US$ 605/tn in Apr 2014
US Domestic Carbon Steel Plate (US$ / tonne)
680
700
720
740
760
780
800
820
840
Plate prices marginally gained by US$ 2/tn to US$ 818/tn in Apr 2014
Source: Bloomberg, PhillipCapital India Research

– 6 of 33 –
12 May 2014 / INDIA EQUITY RESEARCH / METALS – MONTHLY WRAP UP
Raw Material Prices
NMDC Prices (Rs / tonne) Iron Ore Fines CFR China (US$ / tonne)
2,000
2,500
3,000
3,500
4,000
4,500
5,000 Fines 10‐150mm 6‐40mm
5.0%
7.5%
10.0%
12.5%
15.0%
95
105
115
125
135
14558% 62% discount
NMDC cut lumps prices by Rs 200/tn after keeping it constant for last 5months. It has kept fines prices unchanged for May 2014
62% Fe grade iron ore price declined by US$ 11 (‐9.8% mom) in Apr 2014
China Iron Ore spot Price Hebei (Yuan / tonne) 63% Fe Pellet Barbill – (Rs / tonne)
900
950
1000
1050
1100
1150
6000
6400
6800
7200
7600
8000
China Iron ore spot prices fell by 1.5% (15 Yuan/ tn) to 960 Yuan/ tn in Apr 2014
Pellet prices gained by Rs 300/tn to Rs 6,650/tn in Apr 2014
65% Pellet Import Price (US$ / tonne) 65% Pellets / Iron ore fines spread (US$ / tonne)
135
140
145
150
155
160
165
170
175
180
10
15
20
25
30
35
40
Unlike domestic prices, imported pellet prices fell US$ 6/tn (‐4.2% mom) to US$ 141/tn in Apr 2014. Prices have corrected by US$ 37/tn (20.9%) in YTD CY14
Iron ore pellet and fines price spread decreased marginally (‐0.7% mom) in Apr 2014
Source: Bloomberg, Steelmint, Cris Infac, PhillipCapital India Research
– 7 of 33 –
12 May 2014 / INDIA EQUITY RESEARCH / METALS – MONTHLY WRAP UP
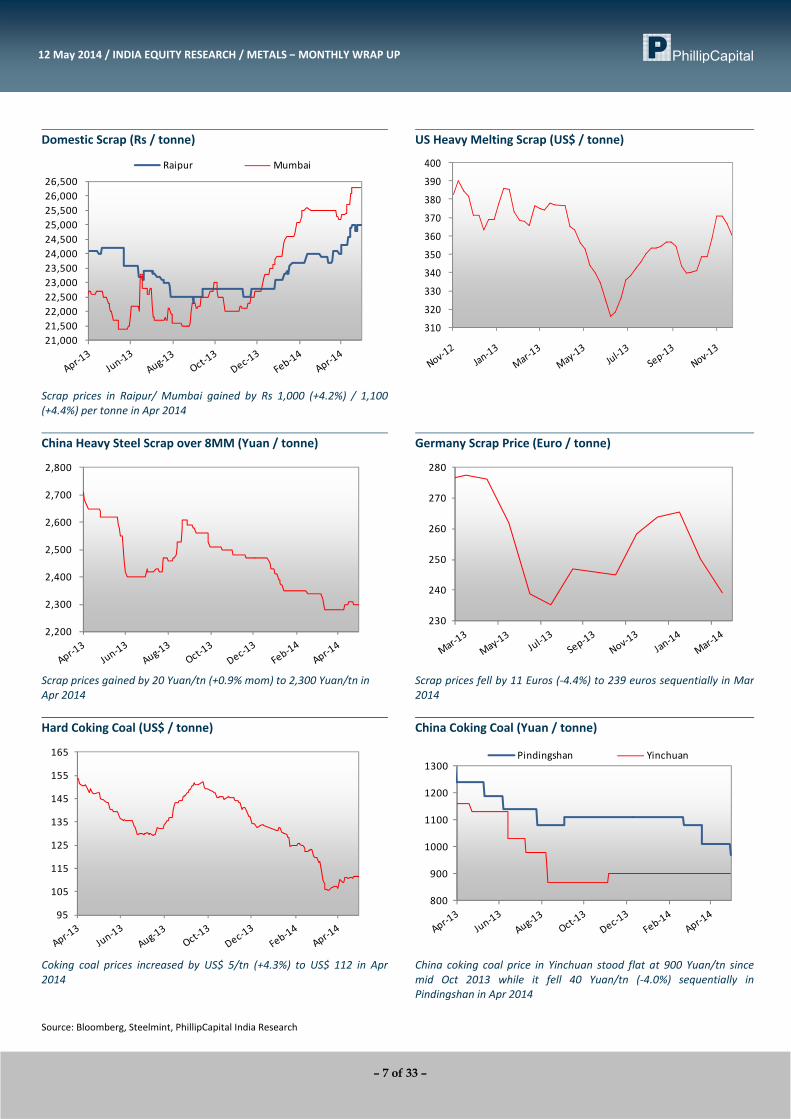
Domestic Scrap (Rs / tonne) US Heavy Melting Scrap (US$ / tonne)
21,000 21,500 22,000 22,500 23,000 23,500 24,000 24,500 25,000 25,500 26,000 26,500
Raipur Mumbai
310
320
330
340
350
360
370
380
390
400
Scrap prices in Raipur/ Mumbai gained by Rs 1,000 (+4.2%) / 1,100 (+4.4%) per tonne in Apr 2014
China Heavy Steel Scrap over 8MM (Yuan / tonne) Germany Scrap Price (Euro / tonne)
2,200
2,300
2,400
2,500
2,600
2,700
2,800
230
240
250
260
270
280
Scrap prices gained by 20 Yuan/tn (+0.9% mom) to 2,300 Yuan/tn in Apr 2014
Scrap prices fell by 11 Euros (‐4.4%) to 239 euros sequentially in Mar2014
Hard Coking Coal (US$ / tonne) China Coking Coal (Yuan / tonne)
95
105
115
125
135
145
155
165
800
900
1000
1100
1200
1300Pindingshan Yinchuan
Coking coal prices increased by US$ 5/tn (+4.3%) to US$ 112 in Apr2014
China coking coal price in Yinchuan stood flat at 900 Yuan/tn since mid Oct 2013 while it fell 40 Yuan/tn (‐4.0%) sequentially in Pindingshan in Apr 2014
Source: Bloomberg, Steelmint, PhillipCapital India Research
– 8 of 33 –
12 May 2014 / INDIA EQUITY RESEARCH / METALS – MONTHLY WRAP UP
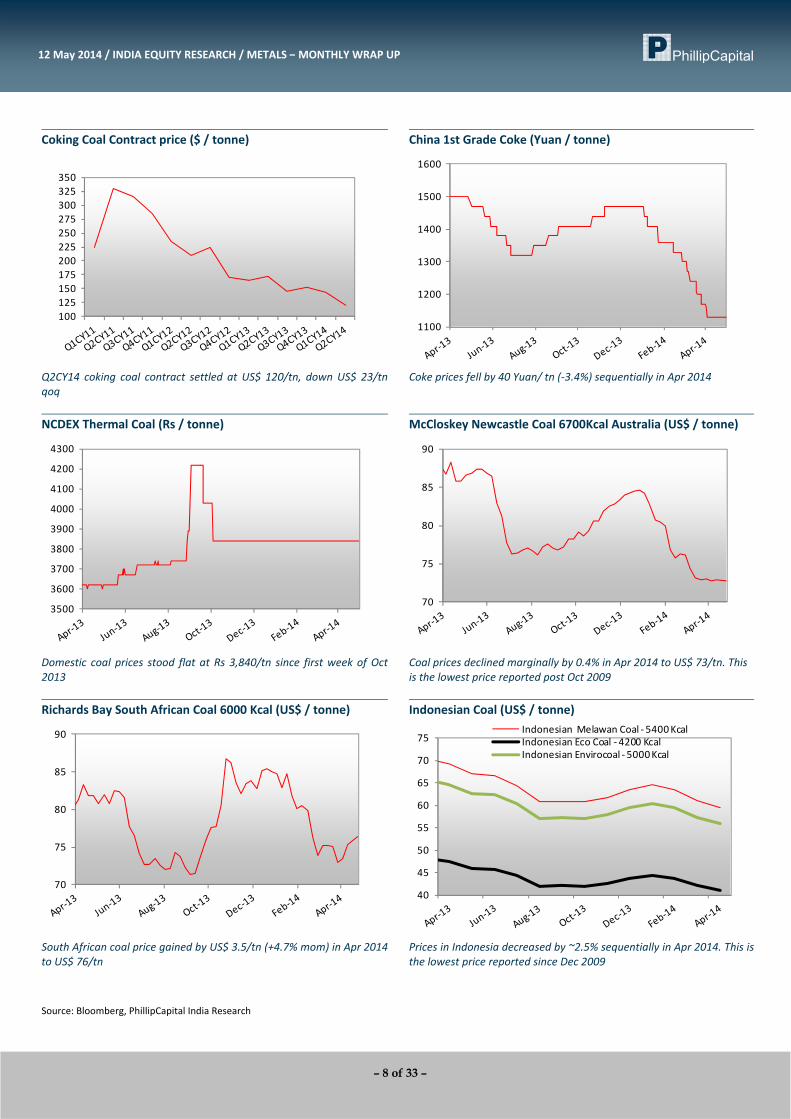
Coking Coal Contract price ($ / tonne) China 1st Grade Coke (Yuan / tonne)
100125150175200225250275300325350
1100
1200
1300
1400
1500
1600
Q2CY14 coking coal contract settled at US$ 120/tn, down US$ 23/tn qoq
Coke prices fell by 40 Yuan/ tn (‐3.4%) sequentially in Apr 2014
NCDEX Thermal Coal (Rs / tonne) McCloskey Newcastle Coal 6700Kcal Australia (US$ / tonne)
3500
3600
3700
3800
3900
4000
4100
4200
4300
70
75
80
85
90
Domestic coal prices stood flat at Rs 3,840/tn since first week of Oct2013
Coal prices declined marginally by 0.4% in Apr 2014 to US$ 73/tn. This is the lowest price reported post Oct 2009
Richards Bay South African Coal 6000 Kcal (US$ / tonne) Indonesian Coal (US$ / tonne)
70
75
80
85
90
40
45
50
55
60
65
70
75Indonesian Melawan Coal ‐5400 KcalIndonesian Eco Coal ‐4200 KcalIndonesian Envirocoal ‐5000 Kcal
South African coal price gained by US$ 3.5/tn (+4.7% mom) in Apr 2014to US$ 76/tn
Prices in Indonesia decreased by ~2.5% sequentially in Apr 2014. This is the lowest price reported since Dec 2009
Source: Bloomberg, PhillipCapital India Research
– 9 of 33 –
12 May 2014 / INDIA EQUITY RESEARCH / METALS – MONTHLY WRAP UP
Ferro Alloy Prices
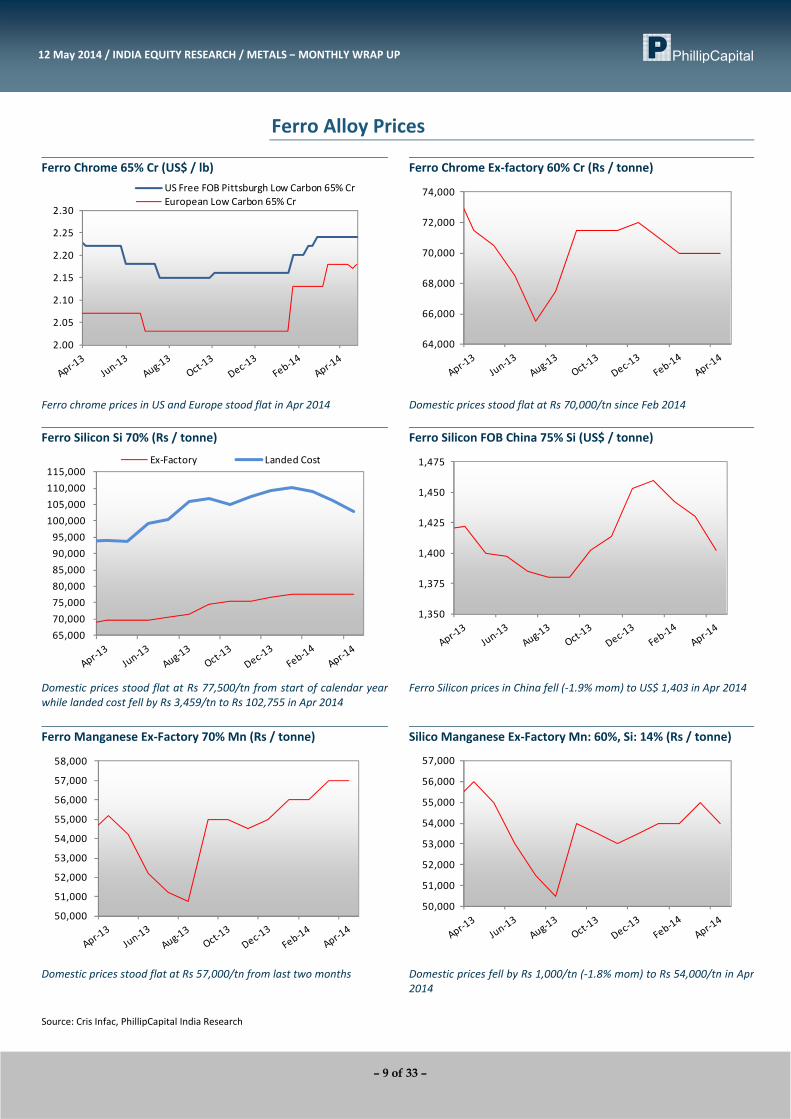
Ferro Chrome 65% Cr (US$ / lb) Ferro Chrome Ex‐factory 60% Cr (Rs / tonne)
2.00
2.05
2.10
2.15
2.20
2.25
2.30
US Free FOB Pittsburgh Low Carbon 65% CrEuropean Low Carbon 65% Cr
64,000
66,000
68,000
70,000
72,000
74,000
Ferro chrome prices in US and Europe stood flat in Apr 2014
Domestic prices stood flat at Rs 70,000/tn since Feb 2014
Ferro Silicon Si 70% (Rs / tonne) Ferro Silicon FOB China 75% Si (US$ / tonne)
65,000 70,000 75,000 80,000 85,000 90,000 95,000
100,000 105,000 110,000 115,000
Ex‐Factory Landed Cost
1,350
1,375
1,400
1,425
1,450
1,475
Domestic prices stood flat at Rs 77,500/tn from start of calendar yearwhile landed cost fell by Rs 3,459/tn to Rs 102,755 in Apr 2014
Ferro Silicon prices in China fell (‐1.9% mom) to US$ 1,403 in Apr 2014
Ferro Manganese Ex‐Factory 70% Mn (Rs / tonne) Silico Manganese Ex‐Factory Mn: 60%, Si: 14% (Rs / tonne)
50,000
51,000
52,000
53,000
54,000
55,000
56,000
57,000
58,000
50,000
51,000
52,000
53,000
54,000
55,000
56,000
57,000
Domestic prices stood flat at Rs 57,000/tn from last two months Domestic prices fell by Rs 1,000/tn (‐1.8% mom) to Rs 54,000/tn in Apr
2014 Source: Cris Infac, PhillipCapital India Research
– 10 of 33 –
12 May 2014 / INDIA EQUITY RESEARCH / METALS – MONTHLY WRAP UP
Steel Profitability & Cost Index
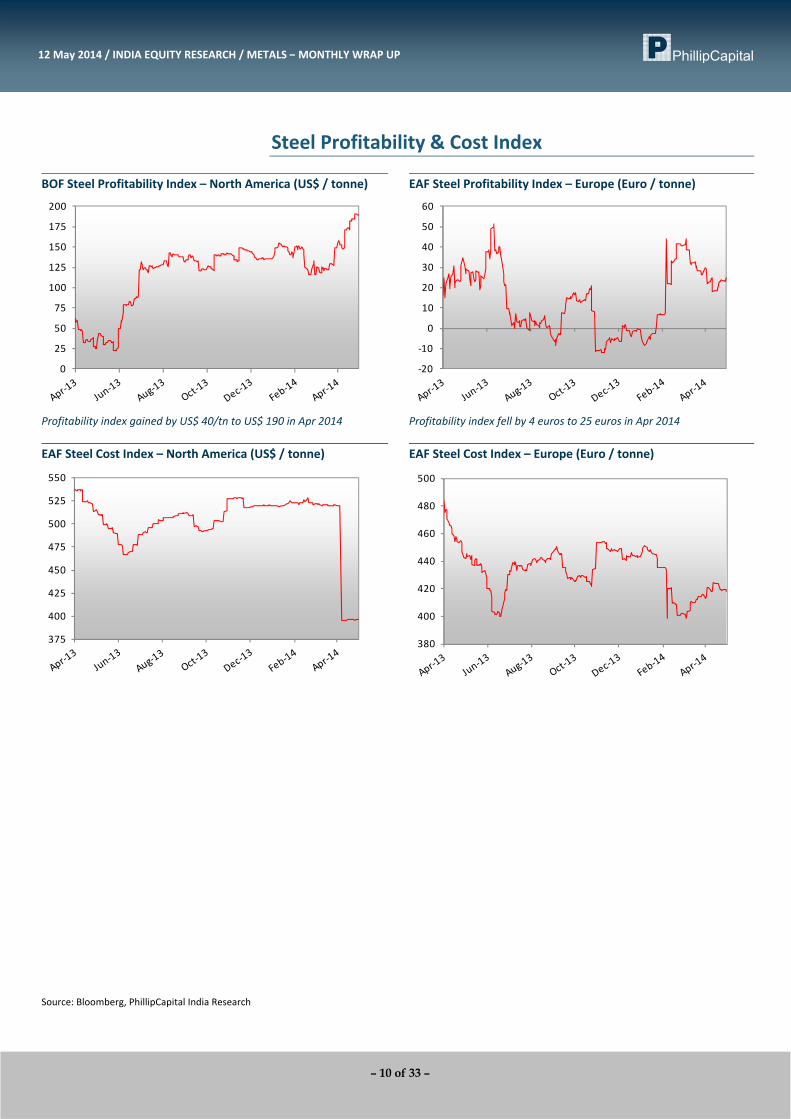
BOF Steel Profitability Index – North America (US$ / tonne) EAF Steel Profitability Index – Europe (Euro / tonne)
0
25
50
75
100
125
150
175
200
‐20
‐10
0
10
20
30
40
50
60
Profitability index gained by US$ 40/tn to US$ 190 in Apr 2014
Profitability index fell by 4 euros to 25 euros in Apr 2014
EAF Steel Cost Index – North America (US$ / tonne) EAF Steel Cost Index – Europe (Euro / tonne)
375
400
425
450
475
500
525
550
380
400
420
440
460
480
500
Source: Bloomberg, PhillipCapital India Research
– 11 of 33 –
12 May 2014 / INDIA EQUITY RESEARCH / METALS – MONTHLY WRAP UP
Production & Inventory
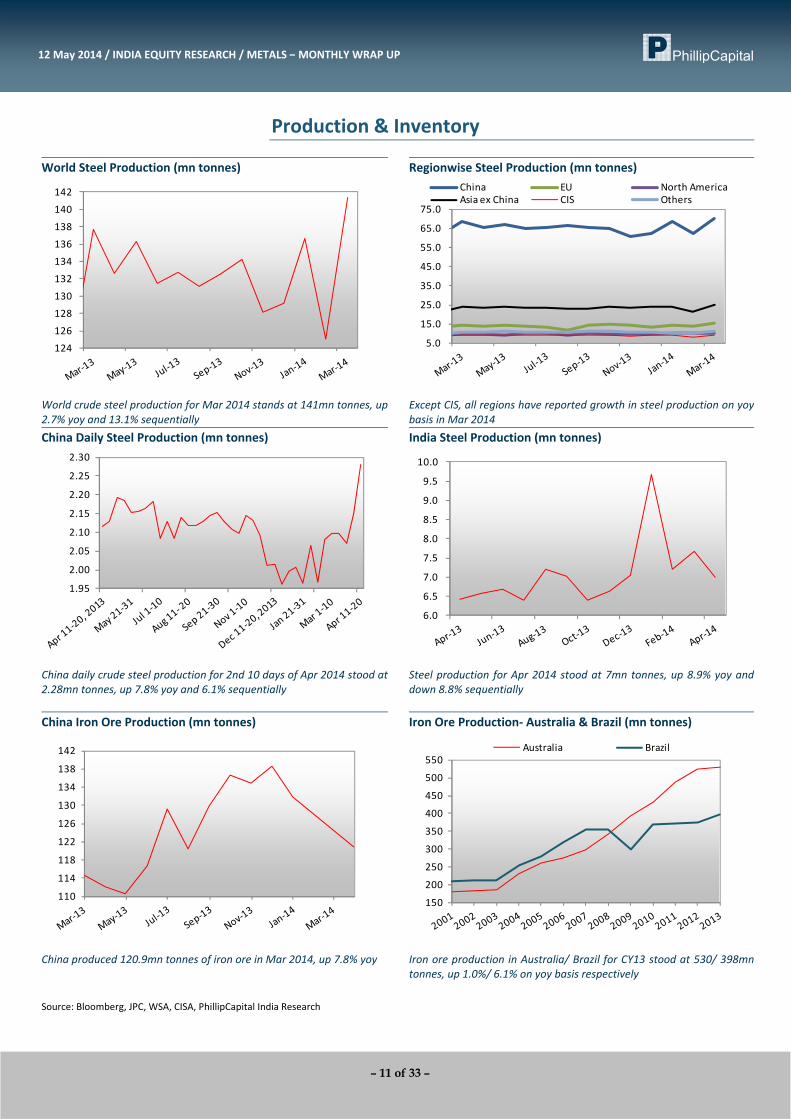
World Steel Production (mn tonnes) Regionwise Steel Production (mn tonnes)
124
126
128
130
132
134
136
138
140
142
5.0
15.0
25.0
35.0
45.0
55.0
65.0
75.0
China EU North AmericaAsia ex China CIS Others
World crude steel production for Mar 2014 stands at 141mn tonnes, up2.7% yoy and 13.1% sequentially
Except CIS, all regions have reported growth in steel production on yoy basis in Mar 2014
China Daily Steel Production (mn tonnes) India Steel Production (mn tonnes)
1.95
2.00
2.05
2.10
2.15
2.20
2.25
2.30
6.0
6.5
7.0
7.5
8.0
8.5
9.0
9.5
10.0
China daily crude steel production for 2nd 10 days of Apr 2014 stood at 2.28mn tonnes, up 7.8% yoy and 6.1% sequentially
Steel production for Apr 2014 stood at 7mn tonnes, up 8.9% yoy anddown 8.8% sequentially
China Iron Ore Production (mn tonnes) Iron Ore Production‐ Australia & Brazil (mn tonnes)
110
114
118
122
126
130
134
138
142
150
200
250
300
350
400
450
500
550Australia Brazil
China produced 120.9mn tonnes of iron ore in Mar 2014, up 7.8% yoy Iron ore production in Australia/ Brazil for CY13 stood at 530/ 398mntonnes, up 1.0%/ 6.1% on yoy basis respectively
Source: Bloomberg, JPC, WSA, CISA, PhillipCapital India Research

– 12 of 33 –
12 May 2014 / INDIA EQUITY RESEARCH / METALS – MONTHLY WRAP UP
Global Steel Inventory excl EU (mn tonnes) China Steel Inventory (mn tonnes)
29 30 31 32 33 34 35 36 37 38 39 40
500600700800900
100011001200130014001500
Longs Flats
World steel inventory fell by 6.2% (~2.2mn tonnes) sequentially to 33.9mn tonnes in Apr 2014 led by fall in inventory in China
Flat/ Long inventory fell by 9.8%/ 13.7% sequentially in Apr 2014
US Service Centre Inventory Canada Service Centre Inventory (mn tonnes)
2
2.2
2.4
2.6
2.8
3
3.2
3.4
3.6
5
5.5
6
6.5
7
7.5
8
8.5
9
US Steel products inventory (mn tonnes)US Steel products months of inventory
1,200 1,250 1,300 1,350 1,400 1,450 1,500 1,550 1,600 1,650 1,700 1,750 1,800
US steel products inventory fell to 2.3 months in Mar 2014 from 2.5months
Canada service centre inventory fell (‐1.1% mom) in Feb 2014 aftergaining from past 3 months
Japan Steel Inventory (mn tonnes) China Iron Ore Inventory at Ports (mn tonnes)
7.9
8.0
8.1
8.2
8.3
8.4
8.5
65707580859095
100105110
Japan steel inventory gained 2.7% sequentially to 8.4mn tonnes in Jan 2014
Iron ore inventory at port stands at 105.2mn tonnes, up 1.4% mom.This is the highest inventory ever reported by China
Source: Bloomberg, PhillipCapital India Research
– 13 of 33 –
12 May 2014 / INDIA EQUITY RESEARCH / METALS – MONTHLY WRAP UP
Trade Data
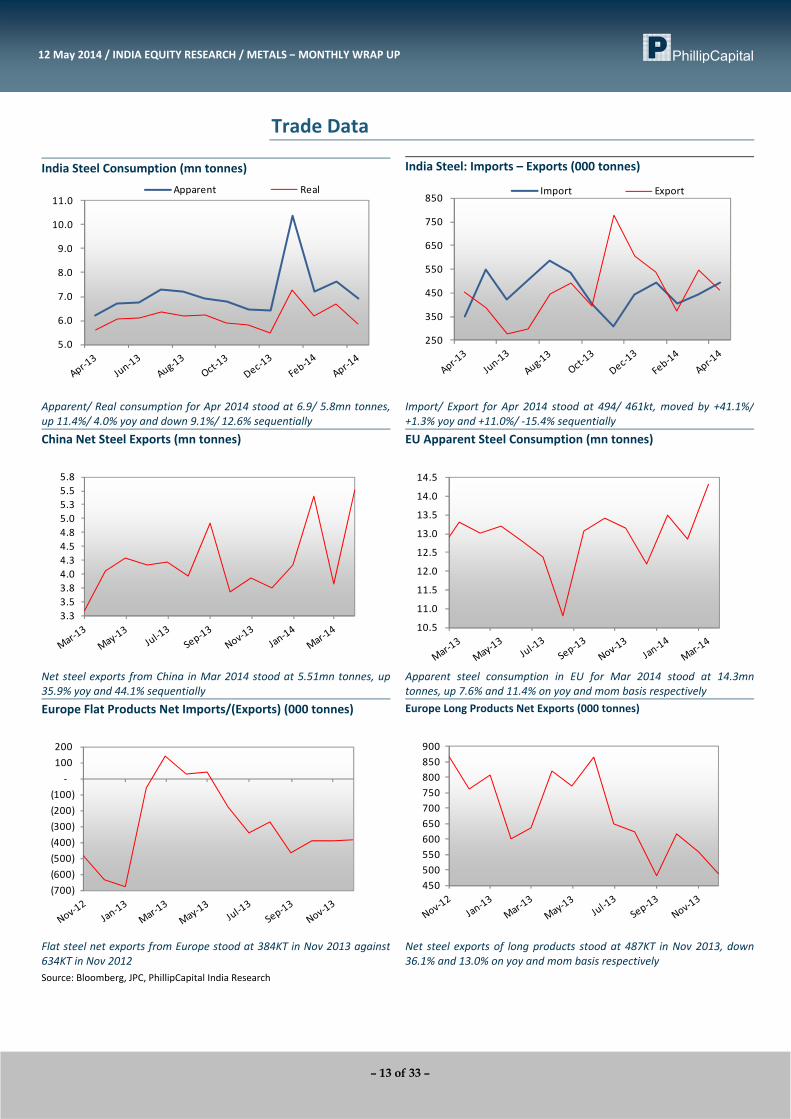
India Steel Consumption (mn tonnes) India Steel: Imports – Exports (000 tonnes)
5.0
6.0
7.0
8.0
9.0
10.0
11.0 Apparent Real
250
350
450
550
650
750
850 Import Export
Apparent/ Real consumption for Apr 2014 stood at 6.9/ 5.8mn tonnes,up 11.4%/ 4.0% yoy and down 9.1%/ 12.6% sequentially
Import/ Export for Apr 2014 stood at 494/ 461kt, moved by +41.1%/+1.3% yoy and +11.0%/ ‐15.4% sequentially
China Net Steel Exports (mn tonnes) EU Apparent Steel Consumption (mn tonnes)
3.33.53.84.04.34.54.85.05.35.55.8
10.5
11.0
11.5
12.0
12.5
13.0
13.5
14.0
14.5
Net steel exports from China in Mar 2014 stood at 5.51mn tonnes, up35.9% yoy and 44.1% sequentially
Apparent steel consumption in EU for Mar 2014 stood at 14.3mntonnes, up 7.6% and 11.4% on yoy and mom basis respectively
Europe Flat Products Net Imports/(Exports) (000 tonnes) Europe Long Products Net Exports (000 tonnes)
(700)(600)(500)(400)(300)(200)(100)
‐100 200
450500550600650700750800850900
Flat steel net exports from Europe stood at 384KT in Nov 2013 against 634KT in Nov 2012
Net steel exports of long products stood at 487KT in Nov 2013, down36.1% and 13.0% on yoy and mom basis respectively
Source: Bloomberg, JPC, PhillipCapital India Research
– 14 of 33 –
12 May 2014 / INDIA EQUITY RESEARCH / METALS – MONTHLY WRAP UP
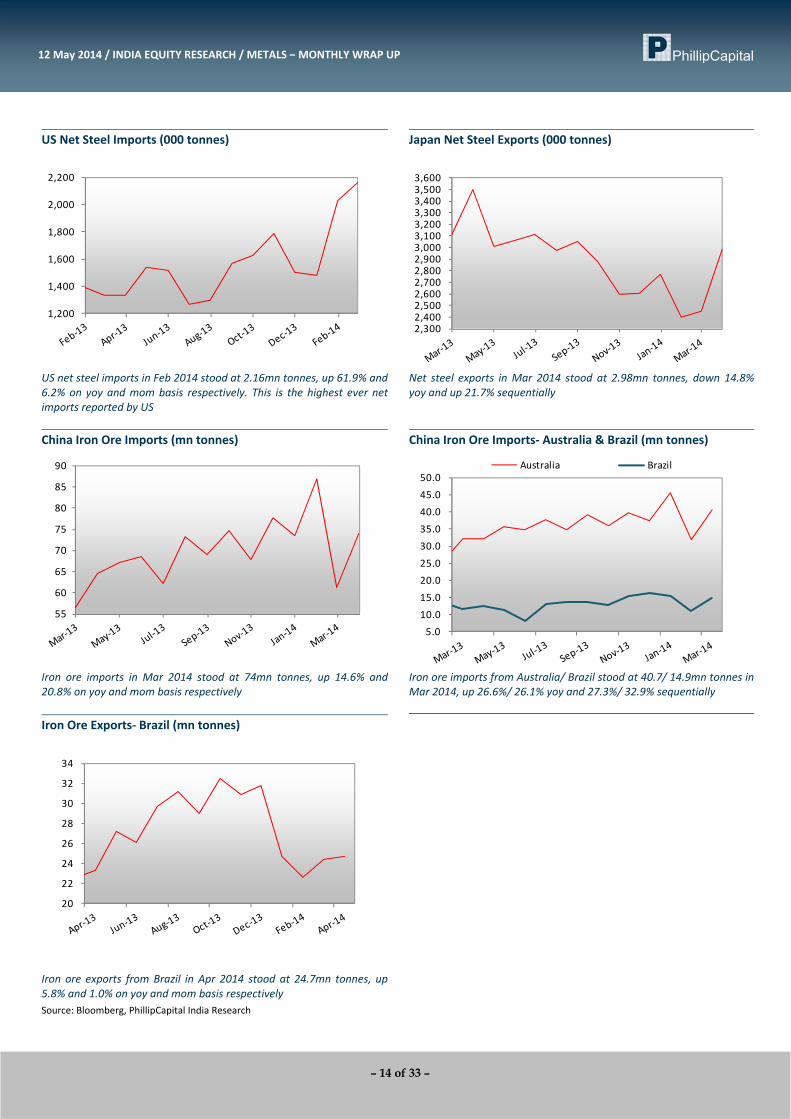
US Net Steel Imports (000 tonnes) Japan Net Steel Exports (000 tonnes)
1,200
1,400
1,600
1,800
2,000
2,200
2,300 2,400 2,500 2,600 2,700 2,800 2,900 3,000 3,100 3,200 3,300 3,400 3,500 3,600
US net steel imports in Feb 2014 stood at 2.16mn tonnes, up 61.9% and 6.2% on yoy and mom basis respectively. This is the highest ever netimports reported by US
Net steel exports in Mar 2014 stood at 2.98mn tonnes, down 14.8% yoy and up 21.7% sequentially
China Iron Ore Imports (mn tonnes) China Iron Ore Imports‐ Australia & Brazil (mn tonnes)
55
60
65
70
75
80
85
90
5.0 10.0
15.0
20.0 25.0
30.0 35.0
40.0 45.0
50.0 Australia Brazil
Iron ore imports in Mar 2014 stood at 74mn tonnes, up 14.6% and20.8% on yoy and mom basis respectively
Iron ore imports from Australia/ Brazil stood at 40.7/ 14.9mn tonnes in Mar 2014, up 26.6%/ 26.1% yoy and 27.3%/ 32.9% sequentially
Iron Ore Exports‐ Brazil (mn tonnes)
20
22
24
26
28
30
32
34
Iron ore exports from Brazil in Apr 2014 stood at 24.7mn tonnes, up 5.8% and 1.0% on yoy and mom basis respectively Source: Bloomberg, PhillipCapital India Research
– 15 of 33 –
12 May 2014 / INDIA EQUITY RESEARCH / METALS – MONTHLY WRAP UP
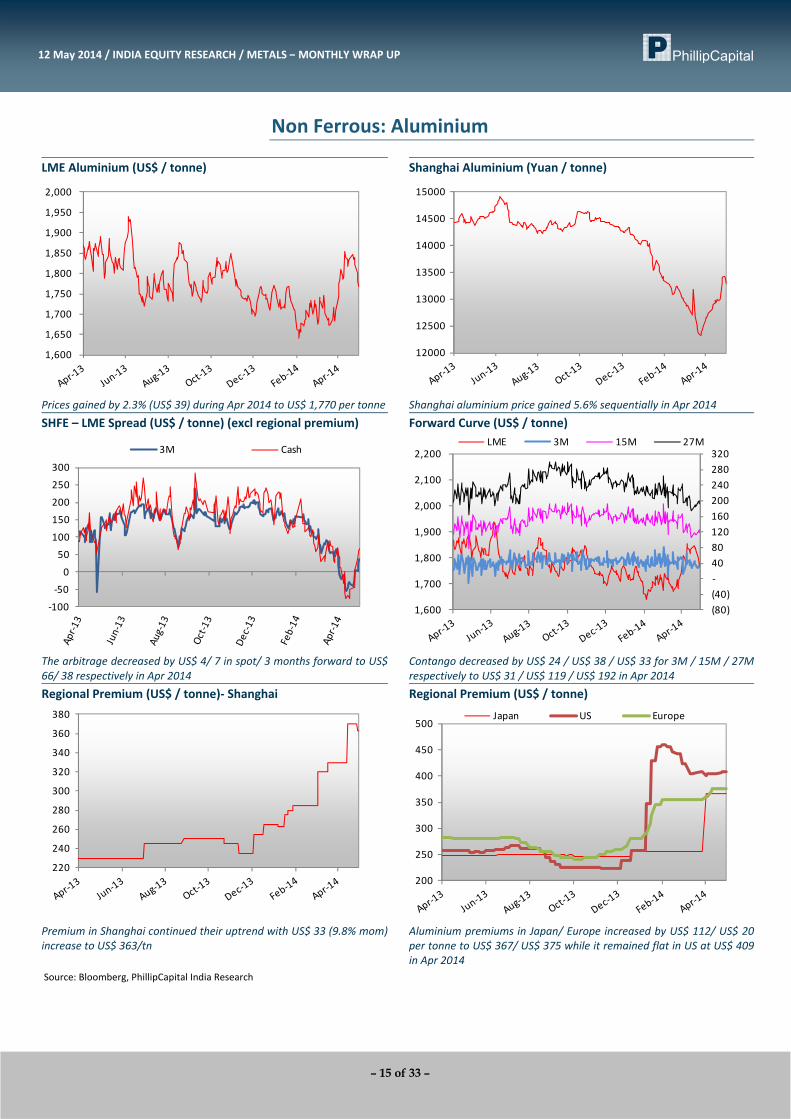
Non Ferrous: Aluminium
LME Aluminium (US$ / tonne) Shanghai Aluminium (Yuan / tonne)
1,600
1,650
1,700
1,750
1,800
1,850
1,900
1,950
2,000
12000
12500
13000
13500
14000
14500
15000
Prices gained by 2.3% (US$ 39) during Apr 2014 to US$ 1,770 per tonne Shanghai aluminium price gained 5.6% sequentially in Apr 2014 SHFE – LME Spread (US$ / tonne) (excl regional premium) Forward Curve (US$ / tonne)
‐100
‐50
0
50
100
150
200
250
300
3M Cash
(80)(40)‐40 80 120 160 200 240 280 320
1,600
1,700
1,800
1,900
2,000
2,100
2,200 LME 3M 15M 27M
The arbitrage decreased by US$ 4/ 7 in spot/ 3 months forward to US$66/ 38 respectively in Apr 2014
Contango decreased by US$ 24 / US$ 38 / US$ 33 for 3M / 15M / 27M respectively to US$ 31 / US$ 119 / US$ 192 in Apr 2014
Regional Premium (US$ / tonne)‐ Shanghai Regional Premium (US$ / tonne)
220
240
260
280
300
320
340
360
380
200
250
300
350
400
450
500Japan US Europe
Premium in Shanghai continued their uptrend with US$ 33 (9.8% mom)increase to US$ 363/tn
Aluminium premiums in Japan/ Europe increased by US$ 112/ US$ 20 per tonne to US$ 367/ US$ 375 while it remained flat in US at US$ 409 in Apr 2014
Source: Bloomberg, PhillipCapital India Research

– 16 of 33 –
12 May 2014 / INDIA EQUITY RESEARCH / METALS – MONTHLY WRAP UP
Warehousing Profit / Loss (US$ / tonne) LME / Used Beverages Cans spread – N America (US$ / tonne)
(60)
(40)
(20)
‐
20
40
60
80
100
27M 15M
‐
50
100
150
200
250
300
350
1,450
1,550
1,650
1,750
1,850
1,950
2,050 LME aluminium UBC Spread (RHS)
Profit in financing deals for 15M/ 27M moved by US$ +3/‐6 per tonneto US$ 35/14 per tonne in Apr 2014
LME Aluminium / UBC spread further decreased by US$ 17 (‐32.0% mom) to US$ 36/tn in Feb 2014
Scrap – North America (US$ / tonne) Aluminium Scrap – Italy (Euro / tonne)
64
66
68
70
72
74
76
78
80
Used Beverage Cans Mixed low copper clipsOld Sheet Old CastTurnings (Clean and dry)
1,160 1,180 1,200 1,220 1,240 1,260 1,280 1,300 1,320 1,340 1,360 1,380
Scrap prices in North America increased across products between 2.0% to 5.0% sequentially in Feb 2014
Aluminium scrap prices recovered its last month loss with prices increasing by 15 euros (+1.2% mom) to 1,210 euros in Apr 2014
Aluminium Scrap – US Foundry Ingot (US$ / lb) Aluminium Scrap – UK Foundary Ingot (GBP / tonne)
1.01
1.02
1.03
1.04
1.05
1.06
1.07
1.08
875 900 925 950 975
1,000 1,025 1,050 1,075 1,100 1,125 1,150
Aluminium scrap prices fell marginally (‐0.9% mom) in Apr 2014 Aluminium scrap prices gained 20 GBP/ tn (+2.2% mom) sequentially in Apr 2014
Source: Bloomberg, USGS, PhillipCapital India Research
– 17 of 33 –
12 May 2014 / INDIA EQUITY RESEARCH / METALS – MONTHLY WRAP UP
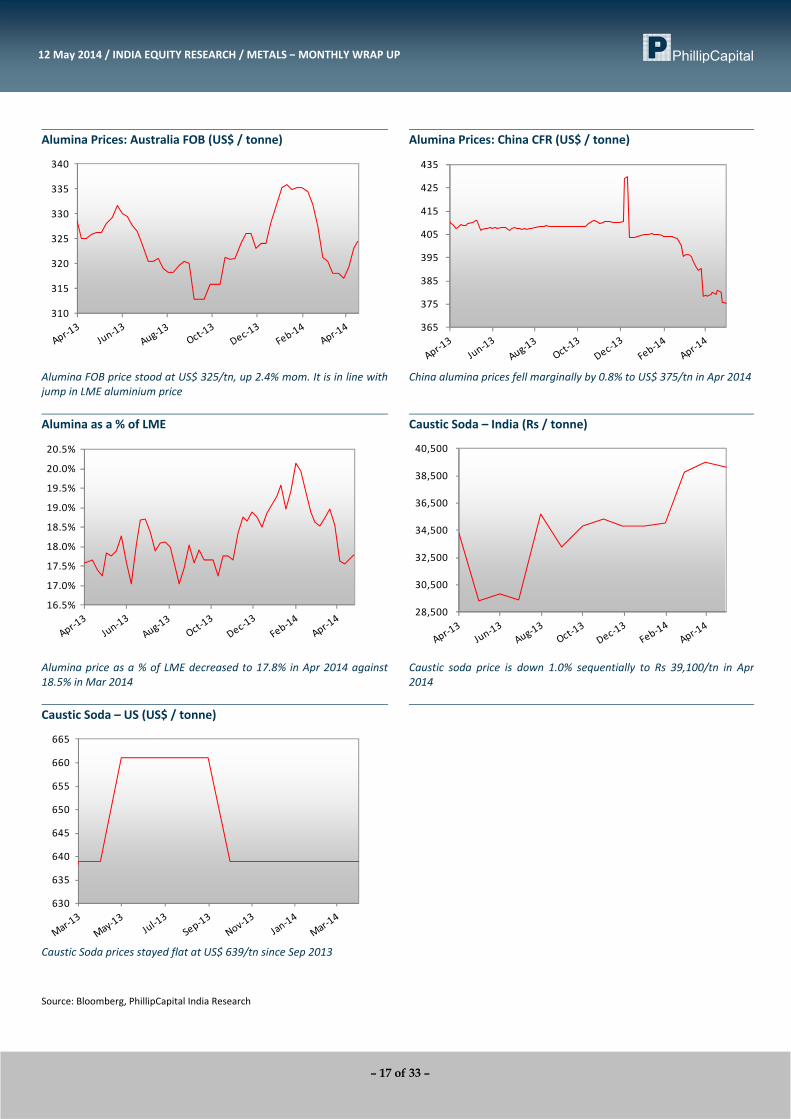
Alumina Prices: Australia FOB (US$ / tonne) Alumina Prices: China CFR (US$ / tonne)
310
315
320
325
330
335
340
365
375
385
395
405
415
425
435
Alumina FOB price stood at US$ 325/tn, up 2.4% mom. It is in line withjump in LME aluminium price
China alumina prices fell marginally by 0.8% to US$ 375/tn in Apr 2014
Alumina as a % of LME Caustic Soda – India (Rs / tonne)
16.5%
17.0%
17.5%
18.0%
18.5%
19.0%
19.5%
20.0%
20.5%
28,500
30,500
32,500
34,500
36,500
38,500
40,500
Alumina price as a % of LME decreased to 17.8% in Apr 2014 against18.5% in Mar 2014
Caustic soda price is down 1.0% sequentially to Rs 39,100/tn in Apr2014
Caustic Soda – US (US$ / tonne)
630
635
640
645
650
655
660
665
Caustic Soda prices stayed flat at US$ 639/tn since Sep 2013
Source: Bloomberg, PhillipCapital India Research
– 18 of 33 –
12 May 2014 / INDIA EQUITY RESEARCH / METALS – MONTHLY WRAP UP
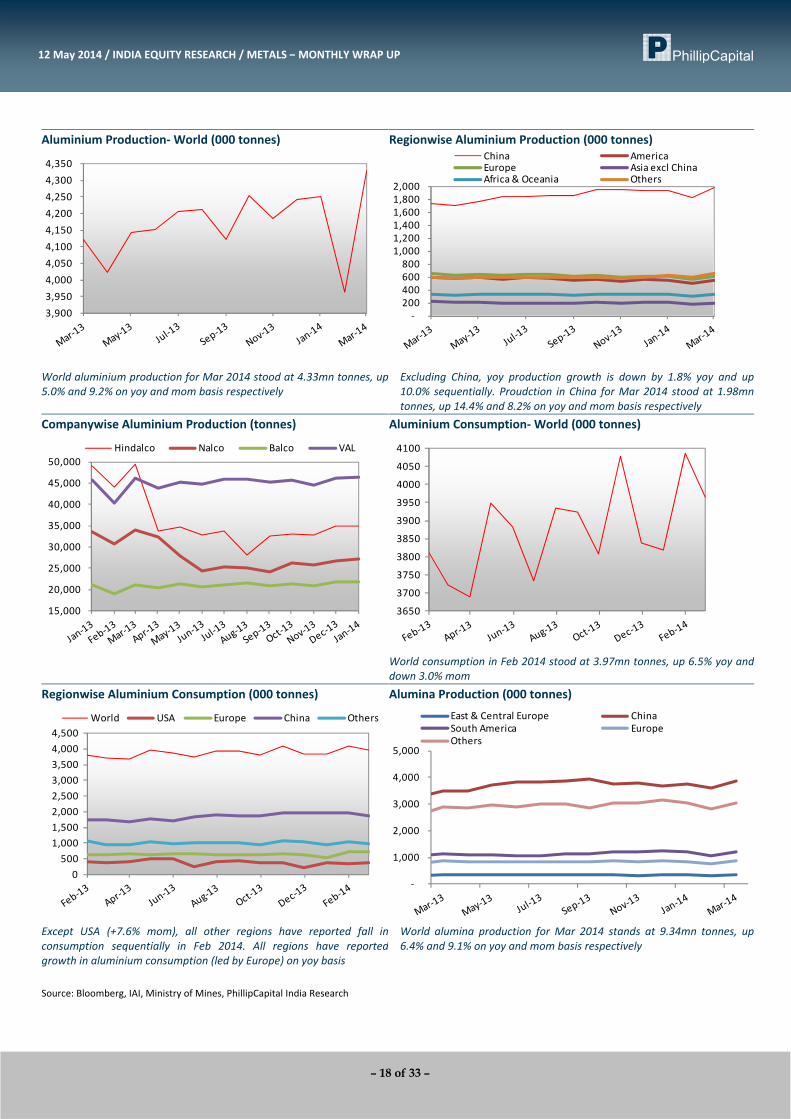
Aluminium Production‐ World (000 tonnes) Regionwise Aluminium Production (000 tonnes)
3,900 3,950 4,000 4,050 4,100 4,150 4,200 4,250 4,300 4,350
‐200 400 600 800
1,000 1,200 1,400 1,600 1,800 2,000
China AmericaEurope Asia excl ChinaAfrica & Oceania Others
World aluminium production for Mar 2014 stood at 4.33mn tonnes, up5.0% and 9.2% on yoy and mom basis respectively
Excluding China, yoy production growth is down by 1.8% yoy and up 10.0% sequentially. Proudction in China for Mar 2014 stood at 1.98mn tonnes, up 14.4% and 8.2% on yoy and mom basis respectively
Companywise Aluminium Production (tonnes) Aluminium Consumption‐ World (000 tonnes)
15,000
20,000
25,000
30,000
35,000
40,000
45,000
50,000 Hindalco Nalco Balco VAL
3650
3700
3750
3800
3850
3900
3950
4000
4050
4100
World consumption in Feb 2014 stood at 3.97mn tonnes, up 6.5% yoy and down 3.0% mom
Regionwise Aluminium Consumption (000 tonnes) Alumina Production (000 tonnes)
0500
1,0001,5002,0002,5003,0003,5004,0004,500
World USA Europe China Others
‐
1,000
2,000
3,000
4,000
5,000
East & Central Europe ChinaSouth America EuropeOthers
Except USA (+7.6% mom), all other regions have reported fall inconsumption sequentially in Feb 2014. All regions have reportedgrowth in aluminium consumption (led by Europe) on yoy basis
World alumina production for Mar 2014 stands at 9.34mn tonnes, up 6.4% and 9.1% on yoy and mom basis respectively
Source: Bloomberg, IAI, Ministry of Mines, PhillipCapital India Research
– 19 of 33 –
12 May 2014 / INDIA EQUITY RESEARCH / METALS – MONTHLY WRAP UP
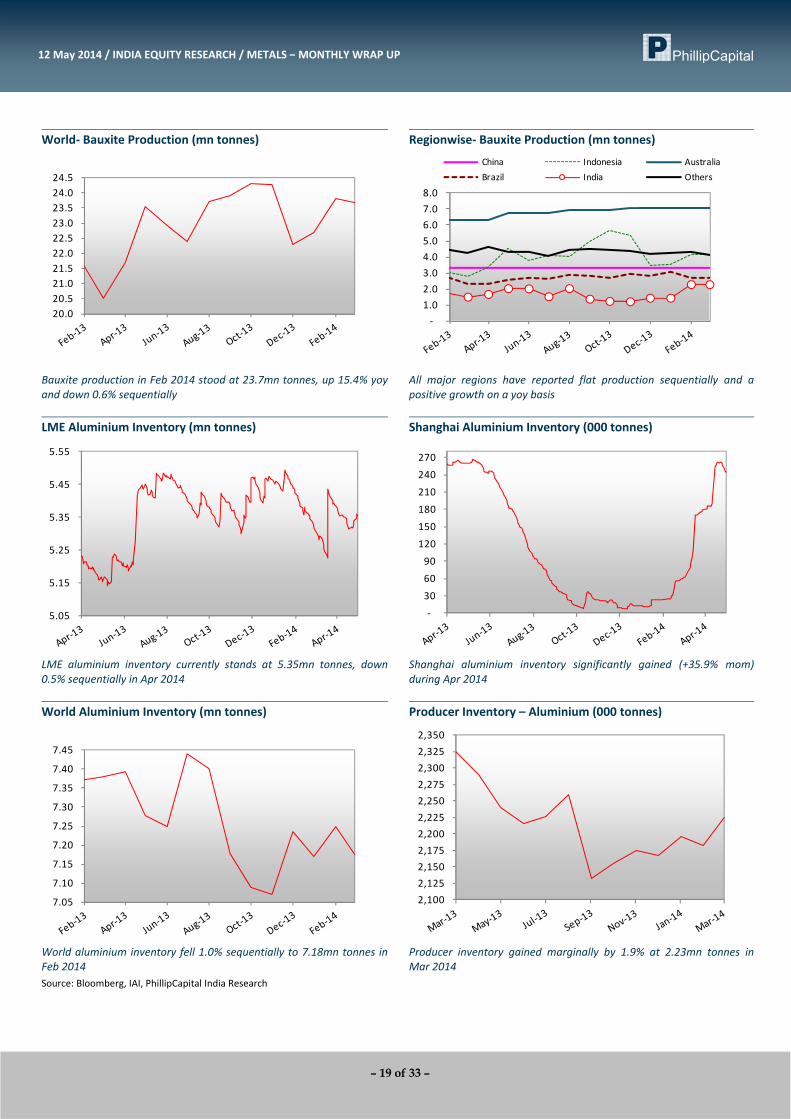
World‐ Bauxite Production (mn tonnes) Regionwise‐ Bauxite Production (mn tonnes)
20.0 20.5 21.0 21.5 22.0 22.5 23.0 23.5 24.0 24.5
‐1.0 2.0 3.0 4.0 5.0 6.0 7.0 8.0
China Indonesia AustraliaBrazil India Others
Bauxite production in Feb 2014 stood at 23.7mn tonnes, up 15.4% yoy and down 0.6% sequentially
All major regions have reported flat production sequentially and a positive growth on a yoy basis
LME Aluminium Inventory (mn tonnes) Shanghai Aluminium Inventory (000 tonnes)
5.05
5.15
5.25
5.35
5.45
5.55
‐
30
60
90
120
150
180
210
240
270
LME aluminium inventory currently stands at 5.35mn tonnes, down 0.5% sequentially in Apr 2014
Shanghai aluminium inventory significantly gained (+35.9% mom)during Apr 2014
World Aluminium Inventory (mn tonnes) Producer Inventory – Aluminium (000 tonnes)
7.05
7.10
7.15
7.20
7.25
7.30
7.35
7.40
7.45
2,100 2,125 2,150 2,175 2,200 2,225 2,250 2,275 2,300 2,325 2,350
World aluminium inventory fell 1.0% sequentially to 7.18mn tonnes inFeb 2014
Producer inventory gained marginally by 1.9% at 2.23mn tonnes in Mar 2014
Source: Bloomberg, IAI, PhillipCapital India Research

– 20 of 33 –
12 May 2014 / INDIA EQUITY RESEARCH / METALS – MONTHLY WRAP UP
Zinc
LME Zinc (US$ / tonne) Shanghai Zinc (Yuan / tonne)
1750
1800
1850
1900
1950
2000
2050
2100
2150
2200
14600
14800
15000
15200
15400
15600
15800
16000
Zinc prices reported highest gain across base metals with 3.6% (US$ 70)jump during Apr 2014 to US$ 2,040 per tonne
Shanghai Zinc prices gain 3.0% mom in Apr 2014
SHFE – LME Spread (US$ / tonne) (excl regional premium) Forward Curve (US$ / tonne)
0
50
100
150
200
250
3003M Cash
‐60‐300306090120150180210
1750180018501900195020002050210021502200
LME 3M 15M 27M
The arbitrage decreased by US$ 20/ 37 in spot/ 3 months forward toUS$ 50/ 68 respectively in Apr 2014
Zinc prices for 3M moved back into a backwardation of US$ 0.25 while contango for 15M / 27M fell by US$ 38.5/ US$ 59.5 and stood at US$ 26/ US$ 35 respectively
Regional Premium (US$ / tonne)
100
120
140
160
180
200
220Shanghai Singapore
Premium in Singapore/ Shanghai increased by US$ 20/2.5 per tonne toUS$ 185/152.5 in Apr 2014
Source: Bloomberg, PhillipCapital India Research

– 21 of 33 –
12 May 2014 / INDIA EQUITY RESEARCH / METALS – MONTHLY WRAP UP
Zinc Production (000 tonnes) Company wise production – India (tonnes)
950
1,000
1,050
1,100
1,150
1,200
1,250 Metal production Mine production
500 750 1,000 1,250 1,500 1,750 2,000 2,250 2,500 2,750 3,000
50,000
55,000
60,000
65,000
70,000
75,000
80,000
85,000
90,000 Hindustan Zinc Binani (RHS)
Mine /Metal production is down 4.3% /5.1% on mom basis in Dec 2013 and 8.5% / 4.6% on yoy basis respectively. Mine/ Metal production inCY13 moved ‐3.6%/ 3.7% respectively
Zinc consumption (000 tonnes) LME Zinc Inventory (mn tonnes)
990101010301050107010901110113011501170119012101230
0.70 0.75 0.80 0.85 0.90 0.95 1.00 1.05 1.10 1.15 1.20
Zinc consumption stood at 1.1mn tonnes in Dec 2013, up 1.6% yoy and down 6.3% mom. CY13 consumption stood at 13.3mn tonnes, up 6.2%yoy
LME zinc inventory fell by 0.3% to 0.78mn tonnes in Apr 2014
Shanghai Zinc Inventory (000 tonnes)
215
235
255
275
295
315
335
Shanghai exchange inventory fell by 8.2% sequentially in Apr 2014 Source: Bloomberg, ILZSG, Ministry of Mines, PhillipCapital India Research
– 22 of 33 –
12 May 2014 / INDIA EQUITY RESEARCH / METALS – MONTHLY WRAP UP
Lead
LME Lead (US$ / tonne) Shanghai Lead (Yuan / tonne)
1900
1950
2000
2050
2100
2150
2200
2250
2300
13500
13750
14000
14250
14500
14750
15000
15250
15500
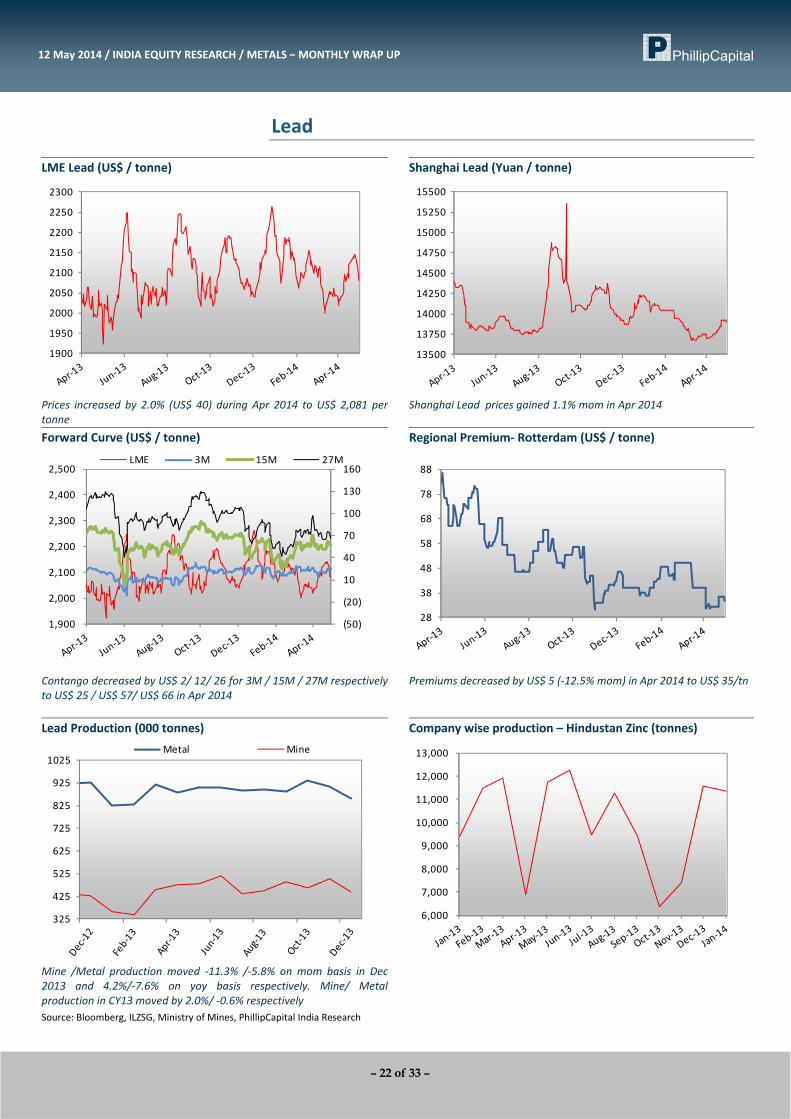
Prices increased by 2.0% (US$ 40) during Apr 2014 to US$ 2,081 per tonne
Shanghai Lead prices gained 1.1% mom in Apr 2014
Forward Curve (US$ / tonne) Regional Premium‐ Rotterdam (US$ / tonne)
(50)
(20)
10
40
70
100
130
160
1,900
2,000
2,100
2,200
2,300
2,400
2,500 LME 3M 15M 27M
28
38
48
58
68
78
88
Contango decreased by US$ 2/ 12/ 26 for 3M / 15M / 27M respectivelyto US$ 25 / US$ 57/ US$ 66 in Apr 2014
Premiums decreased by US$ 5 (‐12.5% mom) in Apr 2014 to US$ 35/tn
Lead Production (000 tonnes) Company wise production – Hindustan Zinc (tonnes)
325
425
525
625
725
825
925
1025Metal Mine
6,000
7,000
8,000
9,000
10,000
11,000
12,000
13,000
Mine /Metal production moved ‐11.3% /‐5.8% on mom basis in Dec2013 and 4.2%/‐7.6% on yoy basis respectively. Mine/ Metalproduction in CY13 moved by 2.0%/ ‐0.6% respectively
Source: Bloomberg, ILZSG, Ministry of Mines, PhillipCapital India Research
– 23 of 33 –
12 May 2014 / INDIA EQUITY RESEARCH / METALS – MONTHLY WRAP UP
Lead Consumption (000 tonnes) LME Lead Inventory (000 tonnes)
800
825
850
875
900
925
950
175
195
215
235
255
275
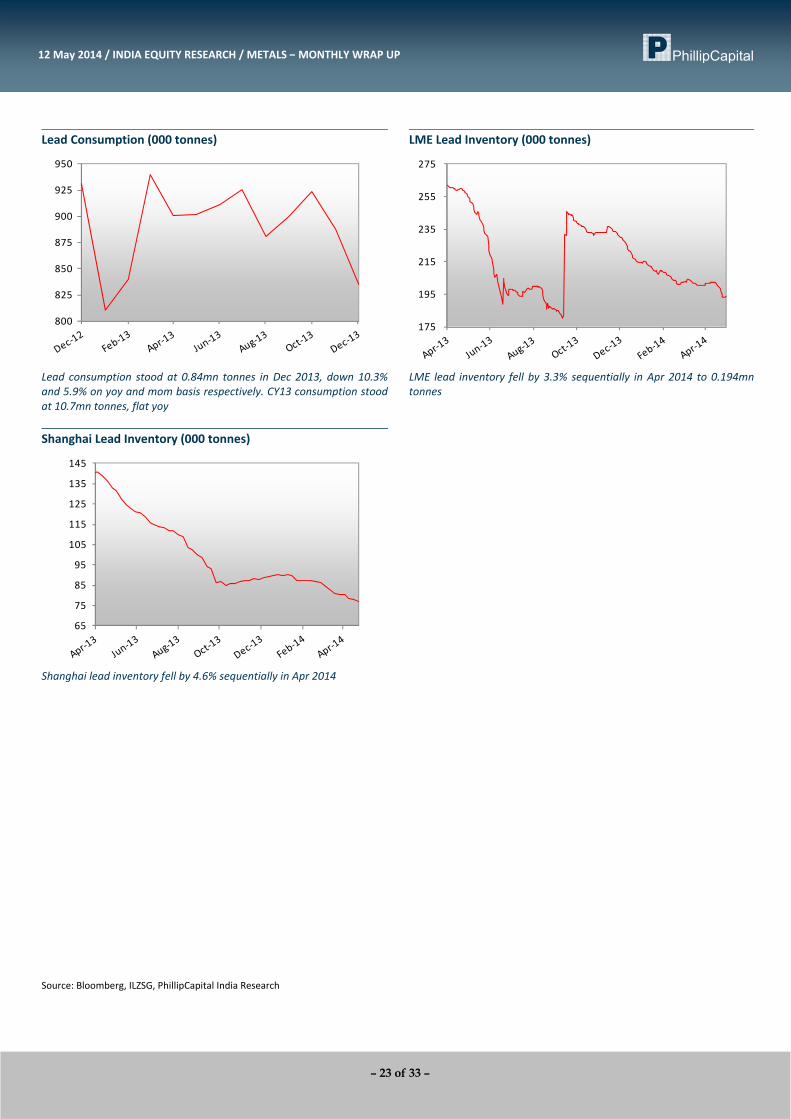
Lead consumption stood at 0.84mn tonnes in Dec 2013, down 10.3%and 5.9% on yoy and mom basis respectively. CY13 consumption stoodat 10.7mn tonnes, flat yoy
LME lead inventory fell by 3.3% sequentially in Apr 2014 to 0.194mntonnes
Shanghai Lead Inventory (000 tonnes)
65
75
85
95
105
115
125
135
145
Shanghai lead inventory fell by 4.6% sequentially in Apr 2014
Source: Bloomberg, ILZSG, PhillipCapital India Research
– 24 of 33 –
12 May 2014 / INDIA EQUITY RESEARCH / METALS – MONTHLY WRAP UP
Copper
LME Copper (US$ / tonne) Shanghai Copper (Yuan / tonne)
6300
6500
6700
6900
7100
7300
7500
7700
44,000
46,000
48,000
50,000
52,000
54,000
56,000
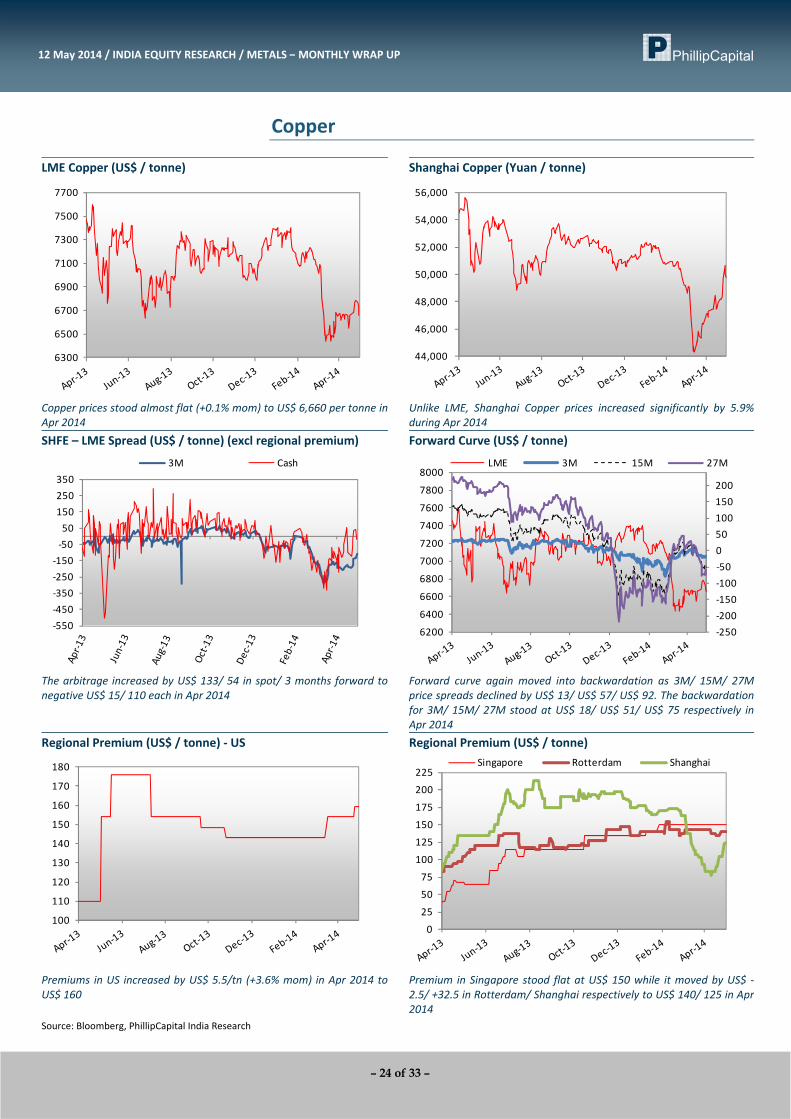
Copper prices stood almost flat (+0.1% mom) to US$ 6,660 per tonne in Apr 2014
Unlike LME, Shanghai Copper prices increased significantly by 5.9% during Apr 2014
SHFE – LME Spread (US$ / tonne) (excl regional premium) Forward Curve (US$ / tonne)
‐550‐450‐350‐250‐150‐5050
150250350
3M Cash
‐250‐200‐150‐100‐50050100150200
6200
6400
6600
6800
7000
7200
7400
7600
7800
8000LME 3M 15M 27M
The arbitrage increased by US$ 133/ 54 in spot/ 3 months forward to negative US$ 15/ 110 each in Apr 2014
Forward curve again moved into backwardation as 3M/ 15M/ 27M price spreads declined by US$ 13/ US$ 57/ US$ 92. The backwardation for 3M/ 15M/ 27M stood at US$ 18/ US$ 51/ US$ 75 respectively in Apr 2014
Regional Premium (US$ / tonne) ‐ US Regional Premium (US$ / tonne)
100
110
120
130
140
150
160
170
180
0
25
50
75
100
125
150
175
200
225Singapore Rotterdam Shanghai
Premiums in US increased by US$ 5.5/tn (+3.6% mom) in Apr 2014 toUS$ 160
Premium in Singapore stood flat at US$ 150 while it moved by US$ ‐2.5/ +32.5 in Rotterdam/ Shanghai respectively to US$ 140/ 125 in Apr2014
Source: Bloomberg, PhillipCapital India Research
– 25 of 33 –
12 May 2014 / INDIA EQUITY RESEARCH / METALS – MONTHLY WRAP UP
Copper Scrap (Euro / tonne)‐ France Copper Scrap China (US$ / tonne)
4,200
4,400
4,600
4,800
5,000
5,200
5,400
5,600
3,000
3,050
3,100
3,150
3,200
3,250
3,300
3,350
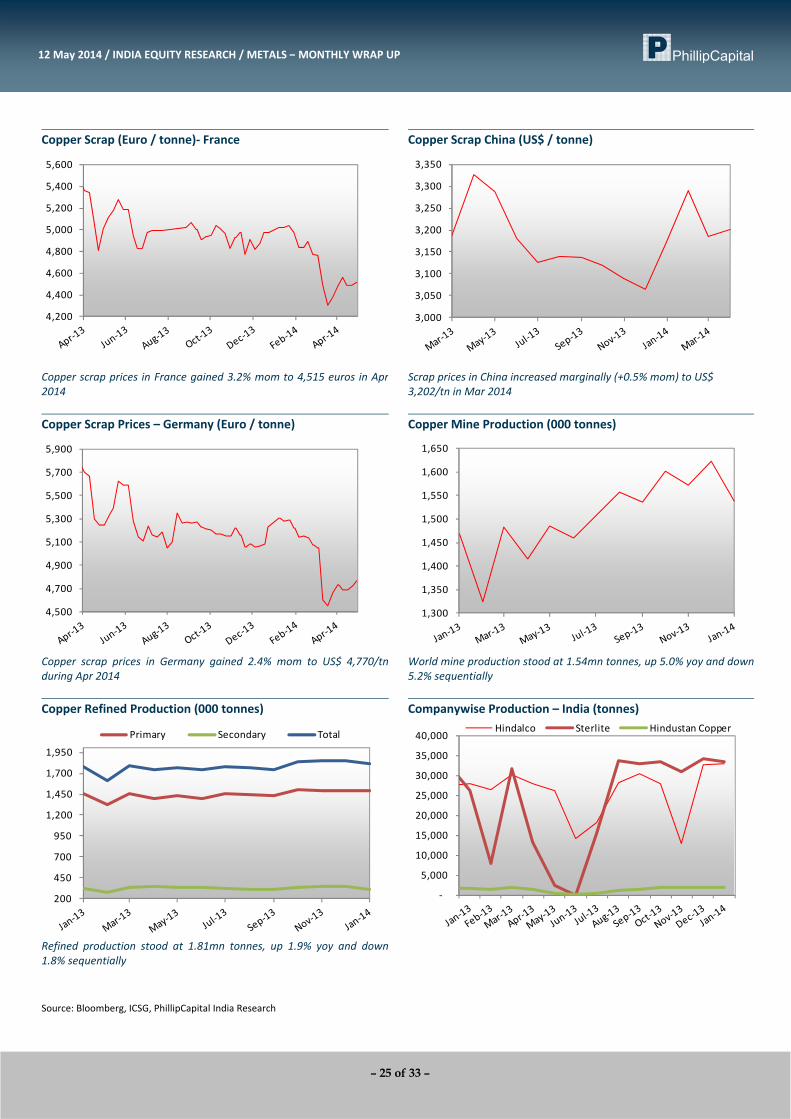
Copper scrap prices in France gained 3.2% mom to 4,515 euros in Apr2014
Scrap prices in China increased marginally (+0.5% mom) to US$ 3,202/tn in Mar 2014
Copper Scrap Prices – Germany (Euro / tonne) Copper Mine Production (000 tonnes)
4,500
4,700
4,900
5,100
5,300
5,500
5,700
5,900
1,300
1,350
1,400
1,450
1,500
1,550
1,600
1,650
Copper scrap prices in Germany gained 2.4% mom to US$ 4,770/tn during Apr 2014
World mine production stood at 1.54mn tonnes, up 5.0% yoy and down5.2% sequentially
Copper Refined Production (000 tonnes) Companywise Production – India (tonnes)
200
450
700
950
1,200
1,450
1,700
1,950
Primary Secondary Total
‐
5,000
10,000
15,000
20,000
25,000
30,000
35,000
40,000 Hindalco Sterlite Hindustan Copper
Refined production stood at 1.81mn tonnes, up 1.9% yoy and down1.8% sequentially
Source: Bloomberg, ICSG, PhillipCapital India Research

– 26 of 33 –
12 May 2014 / INDIA EQUITY RESEARCH / METALS – MONTHLY WRAP UP
Copper Consumption (000 tonnes) LME Copper Inventory (000 tonnes)
1,550
1,600
1,650
1,700
1,750
1,800
1,850
1,900
1,950
2,000
200250300350400450500550600650700
World copper consumption for Jan 2014 stands at 1.87mn tonnes, up9.6% on yoy and mom basis respectively each
LME copper inventory has seen highest fall across base metals with12% decline to 0.233mn tonnes in Apr 2014. It has corrected by 61.9% since July 2013
Shanghai Copper Inventory (000 tonnes) World Refined Copper Stocks (mn tonnes)
0
10
20
30
40
50
60
70
80
0.8
0.9
1.0
1.1
1.2
1.3
1.4
Like LME, Shanghai copper inventory has seen highest fall across basemetals with 84.8% fall to 6KT in Apr 2014
World refined copper stocks currently stands at 0.88mn tonnes, up 0.9% sequentially in Feb 2014
Source: Bloomberg, ICSG, PhillipCapital India Research
– 27 of 33 –
12 May 2014 / INDIA EQUITY RESEARCH / METALS – MONTHLY WRAP UP
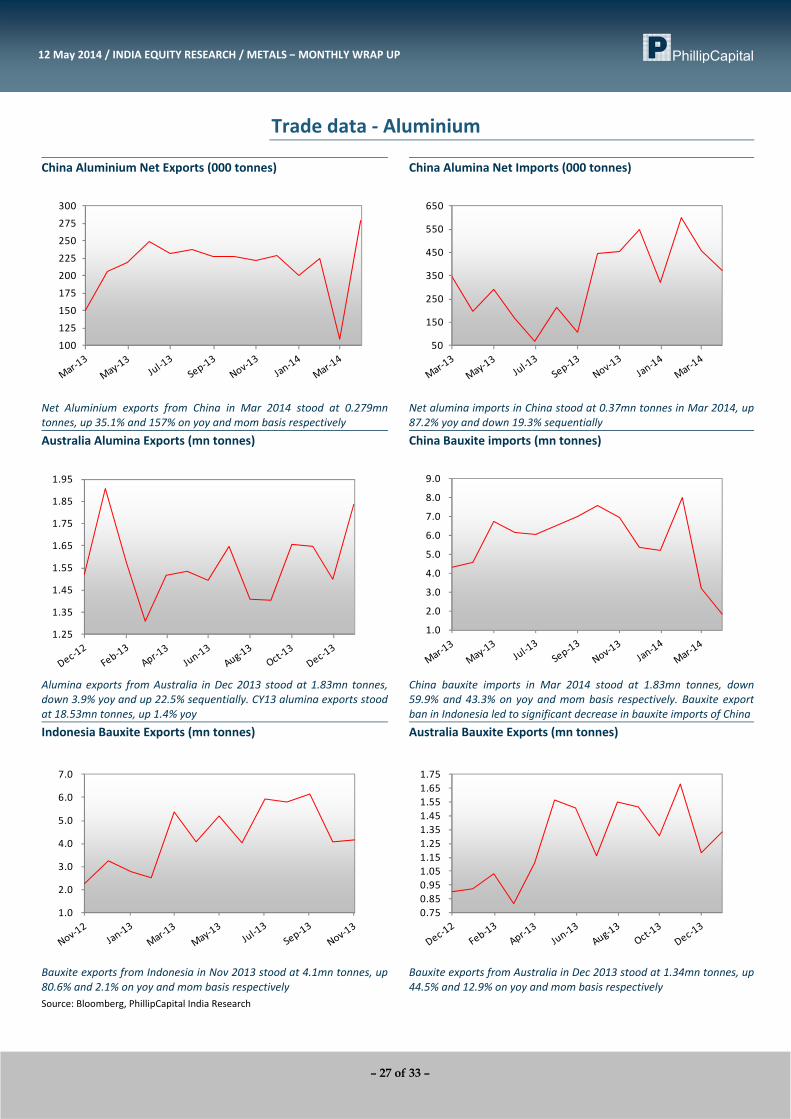
Trade data ‐ Aluminium
China Aluminium Net Exports (000 tonnes) China Alumina Net Imports (000 tonnes)
100
125
150
175
200
225
250
275
300
50
150
250
350
450
550
650
Net Aluminium exports from China in Mar 2014 stood at 0.279mn tonnes, up 35.1% and 157% on yoy and mom basis respectively
Net alumina imports in China stood at 0.37mn tonnes in Mar 2014, up 87.2% yoy and down 19.3% sequentially
Australia Alumina Exports (mn tonnes) China Bauxite imports (mn tonnes)
1.25
1.35
1.45
1.55
1.65
1.75
1.85
1.95
1.0
2.0
3.0
4.0
5.0
6.0
7.0
8.0
9.0
Alumina exports from Australia in Dec 2013 stood at 1.83mn tonnes, down 3.9% yoy and up 22.5% sequentially. CY13 alumina exports stoodat 18.53mn tonnes, up 1.4% yoy
China bauxite imports in Mar 2014 stood at 1.83mn tonnes, down 59.9% and 43.3% on yoy and mom basis respectively. Bauxite export ban in Indonesia led to significant decrease in bauxite imports of China
Indonesia Bauxite Exports (mn tonnes) Australia Bauxite Exports (mn tonnes)
1.0
2.0
3.0
4.0
5.0
6.0
7.0
0.75 0.85 0.95 1.05 1.15 1.25 1.35 1.45 1.55 1.65 1.75
Bauxite exports from Indonesia in Nov 2013 stood at 4.1mn tonnes, up80.6% and 2.1% on yoy and mom basis respectively
Bauxite exports from Australia in Dec 2013 stood at 1.34mn tonnes, up 44.5% and 12.9% on yoy and mom basis respectively
Source: Bloomberg, PhillipCapital India Research
– 28 of 33 –
12 May 2014 / INDIA EQUITY RESEARCH / METALS – MONTHLY WRAP UP
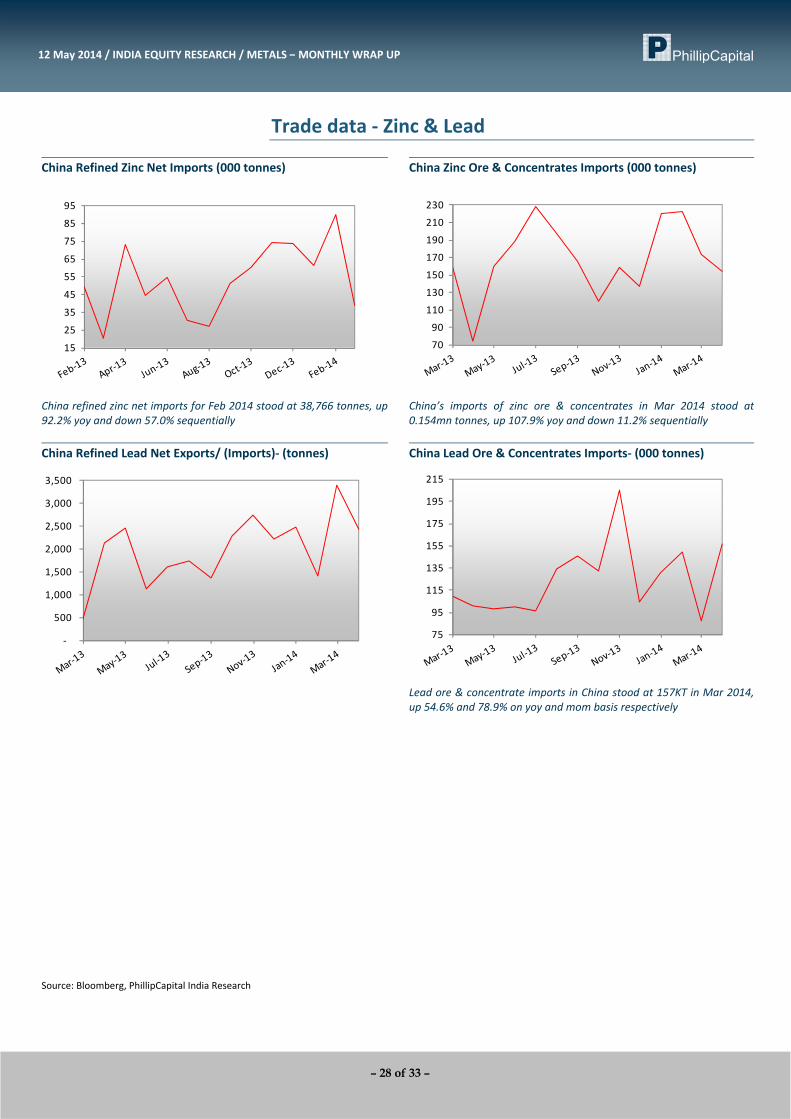
Trade data ‐ Zinc & Lead
China Refined Zinc Net Imports (000 tonnes) China Zinc Ore & Concentrates Imports (000 tonnes)
15
25
35
45
55
65
75
85
95
70
90
110
130
150
170
190
210
230
China refined zinc net imports for Feb 2014 stood at 38,766 tonnes, up92.2% yoy and down 57.0% sequentially
China’s imports of zinc ore & concentrates in Mar 2014 stood at 0.154mn tonnes, up 107.9% yoy and down 11.2% sequentially
China Refined Lead Net Exports/ (Imports)‐ (tonnes) China Lead Ore & Concentrates Imports‐ (000 tonnes)
‐
500
1,000
1,500
2,000
2,500
3,000
3,500
75
95
115
135
155
175
195
215
Lead ore & concentrate imports in China stood at 157KT in Mar 2014,up 54.6% and 78.9% on yoy and mom basis respectively
Source: Bloomberg, PhillipCapital India Research
– 29 of 33 –
12 May 2014 / INDIA EQUITY RESEARCH / METALS – MONTHLY WRAP UP
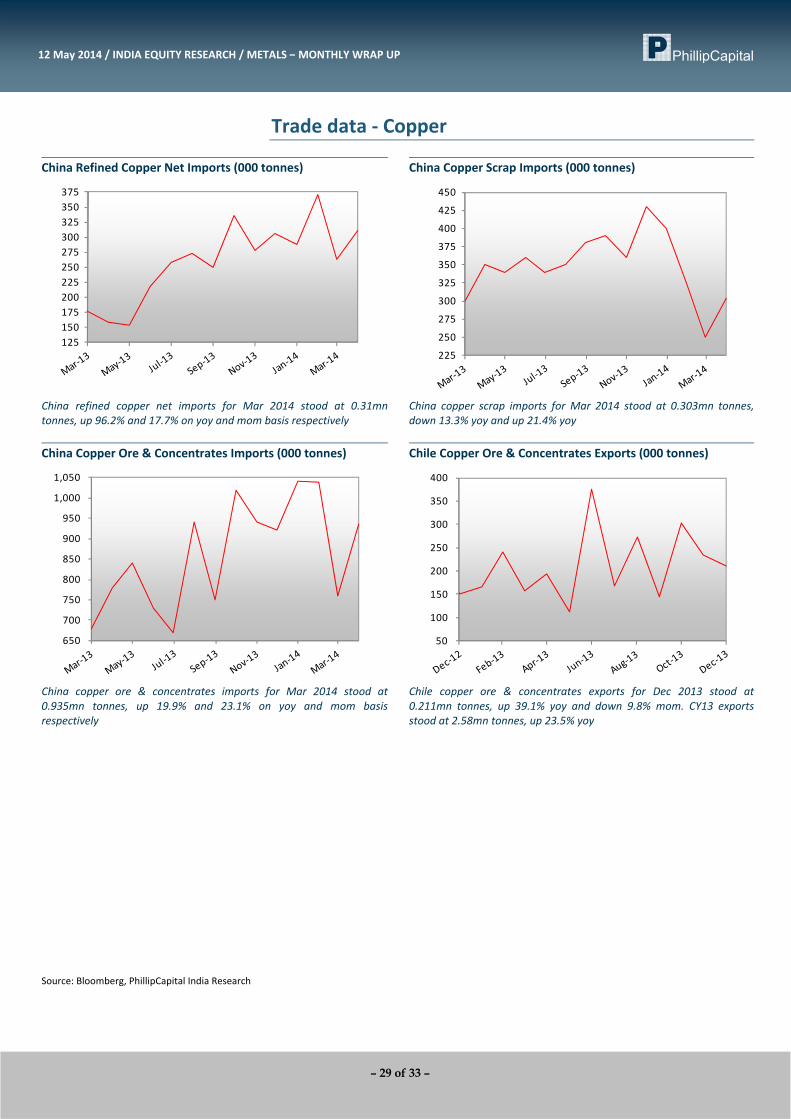
Trade data ‐ Copper
China Refined Copper Net Imports (000 tonnes) China Copper Scrap Imports (000 tonnes)
125150175200225250275300325350375
225
250
275
300
325
350
375
400
425
450
China refined copper net imports for Mar 2014 stood at 0.31mn tonnes, up 96.2% and 17.7% on yoy and mom basis respectively
China copper scrap imports for Mar 2014 stood at 0.303mn tonnes,down 13.3% yoy and up 21.4% yoy
China Copper Ore & Concentrates Imports (000 tonnes) Chile Copper Ore & Concentrates Exports (000 tonnes)
650
700
750
800
850
900
950
1,000
1,050
50
100
150
200
250
300
350
400
China copper ore & concentrates imports for Mar 2014 stood at 0.935mn tonnes, up 19.9% and 23.1% on yoy and mom basisrespectively
Chile copper ore & concentrates exports for Dec 2013 stood at 0.211mn tonnes, up 39.1% yoy and down 9.8% mom. CY13 exports stood at 2.58mn tonnes, up 23.5% yoy
Source: Bloomberg, PhillipCapital India Research
– 30 of 33 –
12 May 2014 / INDIA EQUITY RESEARCH / METALS – MONTHLY WRAP UP
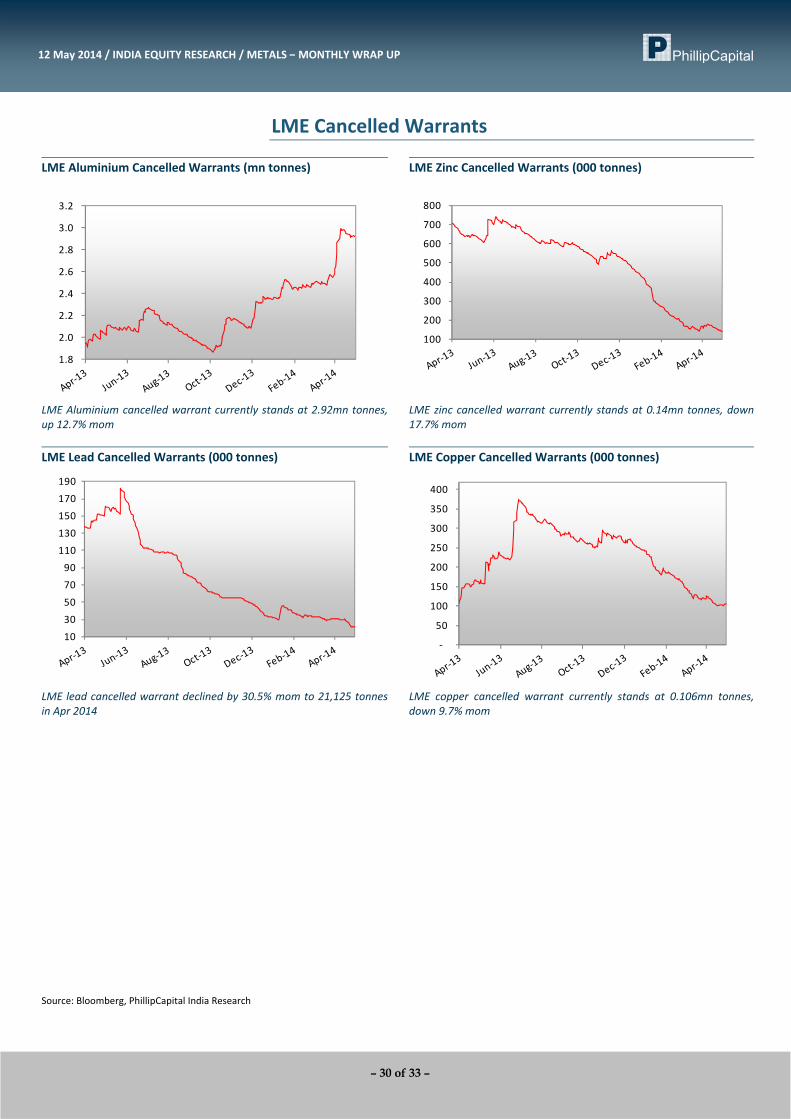
LME Cancelled Warrants
LME Aluminium Cancelled Warrants (mn tonnes) LME Zinc Cancelled Warrants (000 tonnes)
1.8
2.0
2.2
2.4
2.6
2.8
3.0
3.2
100
200
300
400
500
600
700
800
LME Aluminium cancelled warrant currently stands at 2.92mn tonnes, up 12.7% mom
LME zinc cancelled warrant currently stands at 0.14mn tonnes, down17.7% mom
LME Lead Cancelled Warrants (000 tonnes) LME Copper Cancelled Warrants (000 tonnes)
10
30
50
70
90
110
130
150
170
190
‐
50
100
150
200
250
300
350
400
LME lead cancelled warrant declined by 30.5% mom to 21,125 tonnesin Apr 2014
LME copper cancelled warrant currently stands at 0.106mn tonnes, down 9.7% mom
Source: Bloomberg, PhillipCapital India Research
– 31 of 33 –
12 May 2014 / INDIA EQUITY RESEARCH / METALS – MONTHLY WRAP UP
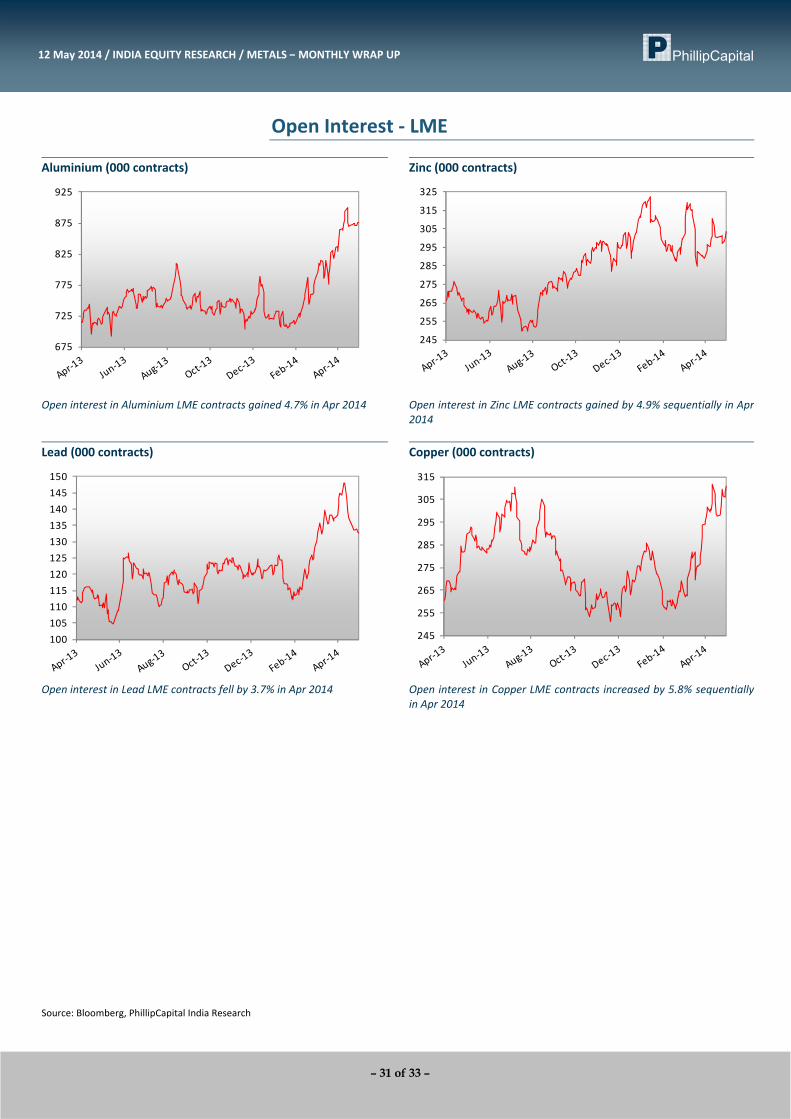
Open Interest ‐ LME
Aluminium (000 contracts) Zinc (000 contracts)
675
725
775
825
875
925
245
255
265
275
285
295
305
315
325
Open interest in Aluminium LME contracts gained 4.7% in Apr 2014 Open interest in Zinc LME contracts gained by 4.9% sequentially in Apr2014
Lead (000 contracts) Copper (000 contracts)
100105110115120125130135140145150
245
255
265
275
285
295
305
315
Open interest in Lead LME contracts fell by 3.7% in Apr 2014 Open interest in Copper LME contracts increased by 5.8% sequentiallyin Apr 2014
Source: Bloomberg, PhillipCapital India Research
– 32 of 33 –
12 May 2014 / INDIA EQUITY RESEARCH / METALS – MONTHLY WRAP UP
Management
(91 22) 2300 2999(91 22) 6667 9735
Research Pharma
Deepak Jain (9122) 6667 9758 Anjali Verma (9122) 6667 9969 Surya Patra (9122) 6667 9768Priya Ranjan (9122) 6667 9965
Engineering, Capital Goods Retail, Real EstateAnkur Sharma (9122) 6667 9759 Abhishek Ranganathan, CFA (9122) 6667 9952
Manish Agarwalla (9122) 6667 9962 Aditya Bahety (9122) 6667 9986 Neha Garg (9122) 6667 9996Sachit Motwani, CFA, FRM (9122) 6667 9953Paresh Jain (9122) 6667 9948 Infrastructure & IT Services Technicals
Vibhor Singhal (9122) 6667 9949 Subodh Gupta, CMT (9122) 6667 9762Varun Vijayan (9122) 6667 9992
Naveen Kulkarni, CFA, FRM (9122) 6667 9947 Production ManagerVivekanand Subbaraman (9122) 6667 9766 Metals Ganesh Deorukhkar (9122) 6667 9966Manish Pushkar, CFA (9122) 6667 9764 Dhawal Doshi (9122) 6667 9769
Dharmesh Shah (9122) 6667 9974 Database ManagerCement Vishal Randive (9122) 6667 9944Vaibhav Agarwal (9122) 6667 9967 Oil&Gas, Agri Inputs
Gauri Anand (9122) 6667 9943 Sr. Manager – Equities SupportDeepak Pareek (9122) 6667 9950 Rosie Ferns (9122) 6667 9971
Sales & Distribution Kinshuk Tiwari (9122) 6667 9946 Sales Trader ExecutionAshvin Patil (9122) 6667 9991 Dilesh Doshi (9122) 6667 9747 Mayur Shah (9122) 6667 9945Shubhangi Agrawal (9122) 6667 9964 Suniil Pandit (9122) 6667 9745Kishor Binwal (9122) 6667 9989Sidharth Agrawal (9122) 6667 9934Dipesh Sohani (9122) 6667 9756
Economics
Consumer, Media, Telecom
Vineet Bhatnagar (Managing Director)Jignesh Shah (Head – Equity Derivatives)
Automobiles
Banking, NBFCs
Contact Information (Regional Member Companies)
SINGAPORE
Phillip Securities Pte Ltd 250 North Bridge Road, #06‐00 Raffles City Tower,
Singapore 179101 Tel : (65) 6533 6001 Fax: (65) 6535 3834
www.phillip.com.sg
MALAYSIA Phillip Capital Management Sdn Bhd B‐3‐6 Block B Level 3, Megan Avenue II,
No. 12, Jalan Yap Kwan Seng, 50450 Kuala Lumpur Tel (60) 3 2162 8841 Fax (60) 3 2166 5099
www.poems.com.my
HONG KONG Phillip Securities (HK) Ltd
11/F United Centre 95 Queensway Hong Kong Tel (852) 2277 6600 Fax: (852) 2868 5307
www.phillip.com.hk
JAPAN Phillip Securities Japan, Ltd
4‐2 Nihonbashi Kabutocho, Chuo‐ku Tokyo 103‐0026
Tel: (81) 3 3666 2101 Fax: (81) 3 3664 0141 www.phillip.co.jp
INDONESIA PT Phillip Securities Indonesia
ANZ Tower Level 23B, Jl Jend Sudirman Kav 33A, Jakarta 10220, Indonesia
Tel (62) 21 5790 0800 Fax: (62) 21 5790 0809 www.phillip.co.id
CHINA Phillip Financial Advisory (Shanghai) Co. Ltd.
No 550 Yan An East Road, Ocean Tower Unit 2318 Shanghai 200 001
Tel (86) 21 5169 9200 Fax: (86) 21 6351 2940 www.phillip.com.cn
THAILAND Phillip Securities (Thailand) Public Co. Ltd.
15th Floor, Vorawat Building, 849 Silom Road, Silom, Bangrak, Bangkok 10500 Thailand
Tel (66) 2 2268 0999 Fax: (66) 2 2268 0921 www.phillip.co.th
FRANCE King & Shaxson Capital Ltd.
3rd Floor, 35 Rue de la Bienfaisance 75008 Paris France
Tel (33) 1 4563 3100 Fax : (33) 1 4563 6017 www.kingandshaxson.com
UNITED KINGDOM King & Shaxson Ltd.
6th Floor, Candlewick House, 120 Cannon Street London, EC4N 6AS
Tel (44) 20 7929 5300 Fax: (44) 20 7283 6835 www.kingandshaxson.com
UNITED STATES Phillip Futures Inc.
141 W Jackson Blvd Ste 3050 The Chicago Board of Trade Building
Chicago, IL 60604 USA Tel (1) 312 356 9000 Fax: (1) 312 356 9005
AUSTRALIA PhillipCapital Australia
Level 37, 530 Collins Street Melbourne, Victoria 3000, Australia
Tel: (61) 3 9629 8380 Fax: (61) 3 9614 8309 www.phillipcapital.com.au
SRI LANKA Asha Phillip Securities Limited
Level 4, Millennium House, 46/58 Navam Mawatha, Colombo 2, Sri Lanka
Tel: (94) 11 2429 100 Fax: (94) 11 2429 199 www.ashaphillip.net/home.htm
INDIA PhillipCapital (India) Private Limited
No. 1, C‐Block, 2nd Floor, Modern Center , Jacob Circle, K. K. Marg, Mahalaxmi Mumbai 400011 Tel: (9122) 2300 2999 Fax: (9122) 6667 9955 www.phillipcapital.in
– 33 of 33 –
12 May 2014 / INDIA EQUITY RESEARCH / METALS – MONTHLY WRAP UP
Disclosures and Disclaimers PhillipCapital (India) Pvt. Ltd. has three independent equity research groups: Institutional Equities, Institutional Equity Derivatives and Private Client Group. This report has been prepared by Institutional Equities Group. The views and opinions expressed in this document may or may not match or may be contrary at times with the views, estimates, rating, target price of the other equity research groups of PhillipCapital (India) Pvt. Ltd. This report is issued by PhillipCapital (India) Pvt. Ltd. which is regulated by SEBI. PhillipCapital (India) Pvt. Ltd. is a subsidiary of Phillip (Mauritius) Pvt. Ltd. References to "PCIPL" in this report shall mean PhillipCapital (India) Pvt. Ltd unless otherwise stated. This report is prepared and distributed by PCIPL for information purposes only and neither the information contained herein nor any opinion expressed should be construed or deemed to be construed as solicitation or as offering advice for the purposes of the purchase or sale of any security, investment or derivatives. The information and opinions contained in the Report were considered by PCIPL to be valid when published. The report also contains information provided to PCIPL by third parties. The source of such information will usually be disclosed in the report. Whilst PCIPL has taken all reasonable steps to ensure that this information is correct, PCIPL does not offer any warranty as to the accuracy or completeness of such information. Any person placing reliance on the report to undertake trading does so entirely at his or her own risk and PCIPL does not accept any liability as a result. Securities and Derivatives markets may be subject to rapid and unexpected price movements and past performance is not necessarily an indication to future performance. This report does not have regard to the specific investment objectives, financial situation and the particular needs of any specific person who may receive this report. Investors must undertake independent analysis with their own legal, tax and financial advisors and reach their own regarding the appropriateness of investing in any securities or investment strategies discussed or recommended in this report and should understand that statements regarding future prospects may not be realized. In no circumstances it be used or considered as an offer to sell or a solicitation of any offer to buy or sell the Securities mentioned in it. The information contained in the research reports may have been taken from trade and statistical services and other sources, which we believe are reliable. PhillipCapital (India) Pvt. Ltd. or any of its group/associate/affiliate companies do not guarantee that such information is accurate or complete and it should not be relied upon as such. Any opinions expressed reflect judgments at this date and are subject to change without notice Important: These disclosures and disclaimers must be read in conjunction with the research report of which it forms part. Receipt and use of the research report is subject to all aspects of these disclosures and disclaimers. Additional information about the issuers and securities discussed in this research report is available on request. Certifications: The research analyst(s) who prepared this research report hereby certifies that the views expressed in this research report accurately reflect the research analyst’s personal views about all of the subject issuers and/or securities, that the analyst have no known conflict of interest and no part of the research analyst’s compensation was, is or will be, directly or indirectly, related to the specific views or recommendations contained in this research report. The Research Analyst certifies that he /she or his / her family members does not own the stock(s) covered in this research report. Independence/Conflict: PhillipCapital (India) Pvt. Ltd. has not had an investment banking relationship with, and has not received any compensation for investment banking services from, the subject issuers in the past twelve (12) months, and PhillipCapital (India) Pvt. Ltd does not anticipate receiving or intend to seek compensation for investment banking services from the subject issuers in the next three (3) months. PhillipCapital (India) Pvt. Ltd is not a market maker in the securities mentioned in this research report, although it or its employees, directors, or affiliates may hold either long or short positions in such securities. PhillipCapital (India) Pvt. Ltd may not hold more than 1% of the shares of the company(ies) covered in this report. Suitability and Risks: This research report is for informational purposes only and is not tailored to the specific investment objectives, financial situation or particular requirements of any individual recipient hereof. Certain securities may give rise to substantial risks and may not be suitable for certain investors. Each investor must make its own determination as to the appropriateness of any securities referred to in this research report based upon the legal, tax and accounting considerations applicable to such investor and its own investment objectives or strategy, its financial situation and its investing experience. The value of any security may be positively or adversely affected by changes in foreign exchange or interest rates, as well as by other financial, economic or political factors. Past performance is not necessarily indicative of future performance or results. Sources, Completeness and Accuracy: The material herein is based upon information obtained from sources that PCIPL and the research analyst believe to be reliable, but neither PCIPL nor the research analyst represents or guarantees that the information contained herein is accurate or complete and it should not be relied upon as such. Opinions expressed herein are current opinions as of the date appearing on this material and are subject to change without notice. Furthermore, PCIPL is under no obligation to update or keep the information current. Copyright: The copyright in this research report belongs exclusively to PCIPL. All rights are reserved. Any unauthorized use or disclosure is prohibited. No reprinting or reproduction, in whole or in part, is permitted without the PCIPL’s prior consent, except that a recipient may reprint it for internal circulation only and only if it is reprinted in its entirety. Caution: Risk of loss in trading in can be substantial. You should carefully consider whether trading is appropriate for you in light of your experience, objectives, financial resources and other relevant circumstances. For U.S. persons only: This research report is a product of PhillipCapital (India) Pvt Ltd. which is the employer of the research analyst(s) who has prepared the research report. The research analyst(s) preparing the research report is/are resident outside the United States (U.S.) and are not associated persons of any U.S. regulated broker‐dealer and therefore the analyst(s) is/are not subject to supervision by a U.S. broker‐dealer, and is/are not required to satisfy the regulatory licensing requirements of FINRA or required to otherwise comply with U.S. rules or regulations regarding, among other things, communications with a subject company, public appearances and trading securities held by a research analyst account. This report is intended for distribution by PhillipCapital (India) Pvt Ltd. only to "Major Institutional Investors" as defined by Rule 15a‐6(b)(4) of the U.S. Securities andExchange Act, 1934 (the Exchange Act) and interpretations thereof by U.S. Securities and Exchange Commission (SEC) in reliance on Rule 15a 6(a)(2). If the recipient of this report is not a Major Institutional Investor as specified above, then it should not act upon this report and return the same to the sender. Further, this report may not be copied, duplicated and/or transmitted onward to any U.S. person, which is not the Major Institutional Investor. In reliance on the exemption from registration provided by Rule 15a‐6 of the Exchange Act and interpretations thereof by the SEC in order to conduct certain business with Major Institutional Investors, PhillipCapital (India) Pvt Ltd. has entered into an agreement with a U.S. registered broker‐dealer, Marco Polo Securities Inc. ("Marco Polo").Transactions in securities discussed in this research report should be effected through Marco Polo or another U.S. registered broker dealer. PhillipCapital (India) Pvt. Ltd. Registered office: 2nd Floor, C‐Block, Modern Centre, Mahalaxmi, Mumbai – 400011