PC - Power Snapshots -Oct 14 -...
13
Please refer to Disclosures and Disclaimers at the end of the Research Report. Power Snapshots Demand revives and so does the power deficits 21 October 2014 PhillipCapital (India) Pvt. Ltd. Our monthly chart book tracks key variables across the power sector including power generation, deficits, capacity addition, coal production/off take and short term market prices. Key highlights for the month are: » All India power generation up 4% YoY, PLF’s suboptimal. In Sept, all India generation grew 4% YoY to 85BU’s; generation growth was mainly driven by hydro and nuclear based generation up 8.5% and 8% respectively. All India PLF’s at 54% was down 300bps YoY. » NTPC’s generation up 2%, PAF also takes a hit: NTPC’s coal based generation was up 2% YoY to 17.7BU due to base effect, (Sept’13 generation grew 17%). Coal based PLF was down 4.1 ppt YoY to 74% (+4ppt on MoM basis). Gas based generation improved 32% YoY. Gas based PLF was down 100 bps to 31%. » IPP’s utilization improves: The utilization for IPP’s improved 600bps YoY to 69% and generation was up 12% YoY. Also since few state based plants were under shutdown, it also lead to improvement in PLF. Rosa TPS reported PLF of 93% and JSW Ratnagiri TPS reported PLF of 95%. » Sharp fall in coal prices; CIL production steady but off take subdued. RB index prices were down 6% mom to ~ USD66/ton and low grade Indonesian coal prices were flat mom. The dip in RB index prices would be beneficial for imported coal dependent project like Adani’s Mundra TPS, JSW Energy Vijaynagar and Ratnagiri TPS. CIL‘s production in Sept ’14 stood at 35mn tons up 5% YoY and dispatches were down 2% YoY. For FY15, production during April‐ September was up 5.5 % YoY and dispatches were up 3%. » Demand improves: Demand has picked up significantly and was up 7% YoY in Sept’14 and supply grew 6.5% YoY leading to base deficit at 4.1%, up 70bps YoY. We note sharp increase in deficit in Southern India in Telangana (6%) and in UP (22%). The peak deficit was flat YoY at 3.6%. The average IEX prices were up 38% to Rs 4.2/kwh and in Southern region IEX prices stood at 15%. » 3,320 MW capacities added in August ’14; 5GW added YTDFY15. In Aug ’14 capacity addition stood at 3320 MW including thermal capacity and during FY15 (April‐August’14) capacity addition was 8.3 GW, 153% of the targeted capacity. Key capacities commissioned during August include 600 MW Akaltara Project (KSK Energy), 600MW Raghunathpur (DVC) , 660 MW Unit 5 of Sasan UMPP , 660 MW Unit 1 of Nigri TPS (JPVL) and 800 MW Damodar Sanjeeviah by AP Discom Ankur Sharma (+ 9122 6667 759 [email protected]) Hrishikesh Bhagat (+ 9122 6667 9986 [email protected])
Transcript of PC - Power Snapshots -Oct 14 -...

Please refer to Disclosures and Disclaimers at the end of the Research Report.
Power Snapshots Demand revives and so does the power deficits
21 October 2014PhillipCapital (India) Pvt. Ltd.
Our monthly chart book tracks key variables across the power sector including power generation, deficits, capacity addition, coal production/off take and short term market prices. Key highlights for the month are:
» All India power generation up 4% YoY, PLF’s suboptimal. In Sept, all India generation grew 4% YoY to 85BU’s; generation growth was mainly driven by hydro and nuclear based generation up 8.5% and 8% respectively. All India PLF’s at 54% was down 300bps YoY.
» NTPC’s generation up 2%, PAF also takes a hit: NTPC’s coal based generation was up 2% YoY to 17.7BU due to base effect, (Sept’13 generation grew 17%). Coal based PLF was down 4.1 ppt YoY to 74% (+4ppt on MoM basis). Gas based generation improved 32% YoY. Gas based PLF was down 100 bps to 31%.
» IPP’s utilization improves: The utilization for IPP’s improved 600bps YoY to 69% and generation was up 12% YoY. Also since few state based plants were under shutdown, it also lead to improvement in PLF. Rosa TPS reported PLF of 93% and JSW Ratnagiri TPS reported PLF of 95%.
» Sharp fall in coal prices; CIL production steady but off take subdued. RB index prices were down 6% mom to ~ USD66/ton and low grade Indonesian coal prices were flat mom. The dip in RB index prices would be beneficial for imported coal dependent project like Adani’s Mundra TPS, JSW Energy Vijaynagar and Ratnagiri TPS. CIL‘s production in Sept ’14 stood at 35mn tons up 5% YoY and dispatches were down 2% YoY. For FY15, production during April‐ September was up 5.5 % YoY and dispatches were up 3%.
» Demand improves: Demand has picked up significantly and was up 7% YoY in Sept’14 and supply grew 6.5% YoY leading to base deficit at 4.1%, up 70bps YoY. We note sharp increase in deficit in Southern India in Telangana (6%) and in UP (22%). The peak deficit was flat YoY at 3.6%. The average IEX prices were up 38% to Rs 4.2/kwh and in Southern region IEX prices stood at 15%.
» 3,320 MW capacities added in August ’14; 5GW added YTDFY15. In Aug ’14 capacity addition stood at 3320 MW including thermal capacity and during FY15 (April‐August’14) capacity addition was 8.3 GW, 153% of the targeted capacity. Key capacities commissioned during August include 600 MW Akaltara Project (KSK Energy), 600MW Raghunathpur (DVC) , 660 MW Unit 5 of Sasan UMPP , 660 MW Unit 1 of Nigri TPS (JPVL) and 800 MW Damodar Sanjeeviah by AP Discom
Ankur Sharma (+ 9122 6667 759 [email protected]) Hrishikesh Bhagat (+ 9122 6667 9986 [email protected])

– 2 of 13 –
21 October 2014 / INDIA EQUITY RESEARCH / POWER SECTOR SNAPSHOTS
All India generation and PLF’s
All India Capacity (excl renew.) and PLF (MW)
In August ’14 all India PLF was flat YoY at 55.5% and was up 400 bps MoM driven by seasonal variation.
Fuel wise generation and growth (%)
Thermal generation stood at 66BU up 2.6% YoY lead by robust coal based generation. Nuclear generation was up 9% to 2.7BU and hydro generation was up 7.8% .
Thermal PLF’s (sector wise) (%)
Central utilities PLF declined YoY to 61%. State utilities PLF stood at 56% and IPP’s PLF although sub optimal improved 600bps to 69%.
PLF by fuel type (%)
Overall coal PLF’s were flat MoM at 60% but down 500bps YoY. Gas based plants continue to operate at sub‐optimal PLF of 19%.
Source: CEA, PhillipCapital India Research

– 3 of 13 –
21 October 2014 / INDIA EQUITY RESEARCH / POWER SECTOR SNAPSHOTS
NTPC’s generation and PLF’s
Coal based generation and PLF
NTPC’s coal based generation was up 2% to 17.7 BU. We note decline in share of NTPC’s generation as a % of overall generation to ~20% vs. 28‐30% historically.
Gas based generation and PLF
NTPC’s gas based generation was down 2% and PLF’s continue to languish at 31% on low availability of gas.
Coal based PLF (Plant wise)
NTPC’s Rihand TPS and Sipat TPS reported substantial improvement on YoY basis. PLF of Tanda TPS and Singrauli TPS declined significantly yoy
Gas based PLF (plant wise)
PLF for most gas based plants improved MoM.
Source: CEA, PhillipCapital India Research

– 4 of 13 –
21 October 2014 / INDIA EQUITY RESEARCH / POWER SECTOR SNAPSHOTS
NTPC’s generation and PLF’s
NTPC’ coal based generation (MU)
Sep‐13 Oct‐13 Nov‐13 Dec‐13 Jan‐14 Feb‐14 Mar‐14 Apr‐14 May‐14 Jun‐14 Jul‐14 Aug‐14 Sep‐14Growth
YoYGrowth MoM
Badarpur 342 344 250 300 382 321 281 270 371 433 405 290 237 (13) 38 Dadri 1,113 1,155 1,098 1,100 1,239 1,042 1,082 847 1,168 1,166 1,086 1,015 1,055 3 38 Farakka 1,079 1,134 1,091 1,282 1,302 1,095 1,244 1,026 1,148 1,034 1,130 1,086 919 9 12 Kahalgaon 1,130 1,213 1,291 1,402 1,387 1,186 1,338 1,381 1,311 1,242 1,096 1,179 1,140 16 (5) Korba 1,797 1,794 1,893 1,798 1,909 1,742 1,853 1,626 1,743 1,756 1,403 1,344 1,700 (8) 7 Mauda 18 5 100 136 193 195 148 380 329 215 216 284 274 (14) Ramagundem 1,437 1,453 1,716 1,802 1,729 1,722 1,881 1,875 1,623 1,592 1,565 1,554 1,444 (15) (13) Rihand 1,408 1,390 1,475 1,705 1,554 1,549 1,810 1,939 1,882 1,775 1,729 1,466 1,567 8 (3) Simhadri 1,133 1,043 1,025 1,295 1,382 1,310 1,445 1,458 1,452 1,380 1,386 1,034 1,048 19 (0) Singrauli 1,316 1,483 1,446 1,457 1,429 1,300 1,089 1,329 1,308 1,267 1,290 1,145 1,099 (5) (2) Sipat 1,465 1,062 1,568 1,950 1,983 1,624 2,025 2,021 1,601 1,547 1,567 1,690 1,921 16 (21) Talcher 323 323 322 344 348 311 349 334 647 318 267 308 300 91 93 Talcher 1,674 1,433 1,955 2,015 2,165 1,938 2,204 2,095 1,795 1,731 1,722 1,658 2,183 17 (14) Tanda 239 263 317 331 319 296 302 272 303 251 284 242 248 (10) 11 Unchahar 716 591 702 710 704 644 644 618 644 696 751 708 555 (8) 4 Vindhyachal 2,162 2,361 2,525 2,677 2,393 2,335 2,753 2,849 2,874 2,620 2,320 1,830 2,083 16 1 Coal gen 17,351 17,049 18,776 20,304 20,418 18,610 20,449 20,392 20,217 19,065 18,330 16,875 17,773 8 (1)
NTPC’ coal based PLF’s (%)
PLF (%) Sep‐13 Oct‐13 Nov‐13 Dec‐13 Jan‐14 Feb‐14 Mar‐14 Apr‐14 May‐14 Jun‐14 Jul‐14 Aug‐14 Sep‐14YoY (%)
MoM (%)
Badarpur 67 66 49 57 73 68 64 53 71 85 77 55 46 (10.8) 17.6 Dadri 85 85 84 81 91 85 80 65 86 82 80 75 77 2.4 21.7 Farakka 71 73 72 82 83 78 80 68 73 68 72 69 61 5.9 5.6 Kahalgaon 67 70 77 81 80 75 77 82 75 74 63 68 60 10.1 (6.7)Korba 96 93 101 93 99 100 96 87 90 94 73 69 70 (7.5) 3.3 Mauda 5 1 28 36 52 58 18 53 44 30 29 38 44 44.2 (8.6)Ramagundem 77 75 92 93 89 99 97 100 84 85 81 80 76 (14.4) (16.3)Rihand 78 75 82 92 84 92 89 90 84 82 77 66 74 (9.0) (5.5)Simhadri 79 70 71 87 93 97 97 101 98 96 93 69 71 15.6 (3.6)Singrauli 91 100 100 98 96 97 73 92 88 88 87 77 75 (5.0) (4.4)Sipat 68 48 73 88 89 81 91 94 72 72 71 76 87 10.0 (22.0)Talcher 95 92 95 98 100 98 100 101 102 96 78 90 88 5.6 1.5 Talcher 78 64 91 90 97 96 99 97 96 80 77 74 81 27.2 (1.1)Tanda 75 80 100 101 97 100 92 86 92 79 87 74 74 (10.0) 6.6 Unchahar 95 76 93 91 90 91 82 82 82 92 96 91 73 (6.9) 0.6 Vindhyachal 80 84 93 96 86 92 93 93 91 85 73 58 68 2.2 (2.2)Coal PLF (rhs) 78 74 84 88 89 90 87 87 84 82 76 70 74 2.7 (3.3)
Source: CEA, PhillipCapital India Research

– 5 of 13 –
21 October 2014 / INDIA EQUITY RESEARCH / POWER SECTOR SNAPSHOTS
IPP’s generation and PLF’s
Tata Power ‐ Mundra UMPP
Mundra UMPP’s PLF stood at 66% as one of the unit was under shut down.
Tata Power ‐ Maithon power
Maithon PLF stood at 73% down MoM.
Adani Power ‐ Mundra
Adani Power’s Mundra unit operated at PLF of 66% as it has stopped supply to Haryana due to uneconomical operation..
Reliance Power ‐ Rosa
Rosa TPS PLF at 93% due to higher demand from UP.
Source: CEA, PhillipCapital India Research

– 6 of 13 –
21 October 2014 / INDIA EQUITY RESEARCH / POWER SECTOR SNAPSHOTS
IPP’s generation and PLF’s
JSW Energy ‐ Vijaynagar
JSW continued generation at robust PLF in Vijaynagar. For the260MW plant, PLF stood at 101% and in the 660MW plant PLF stood at 60%.
JSW Energy‐ Ratnagiri
Ratnagiri generation stood at 818MU and PLF stood at 95%.
JSW Energy‐ RWPL
Rajwest PLF improved to 79% lead by clearance for mineexpansion.
Torrent – Sugen
Subdued performance in Sugen continued due to lower availability of gas. PLF stood at 26%.
Source: CEA, PhillipCapital India Research
– 7 of 13 –
21 October 2014 / INDIA EQUITY RESEARCH / POWER SECTOR SNAPSHOTS
IPP’s generation and PLF’s
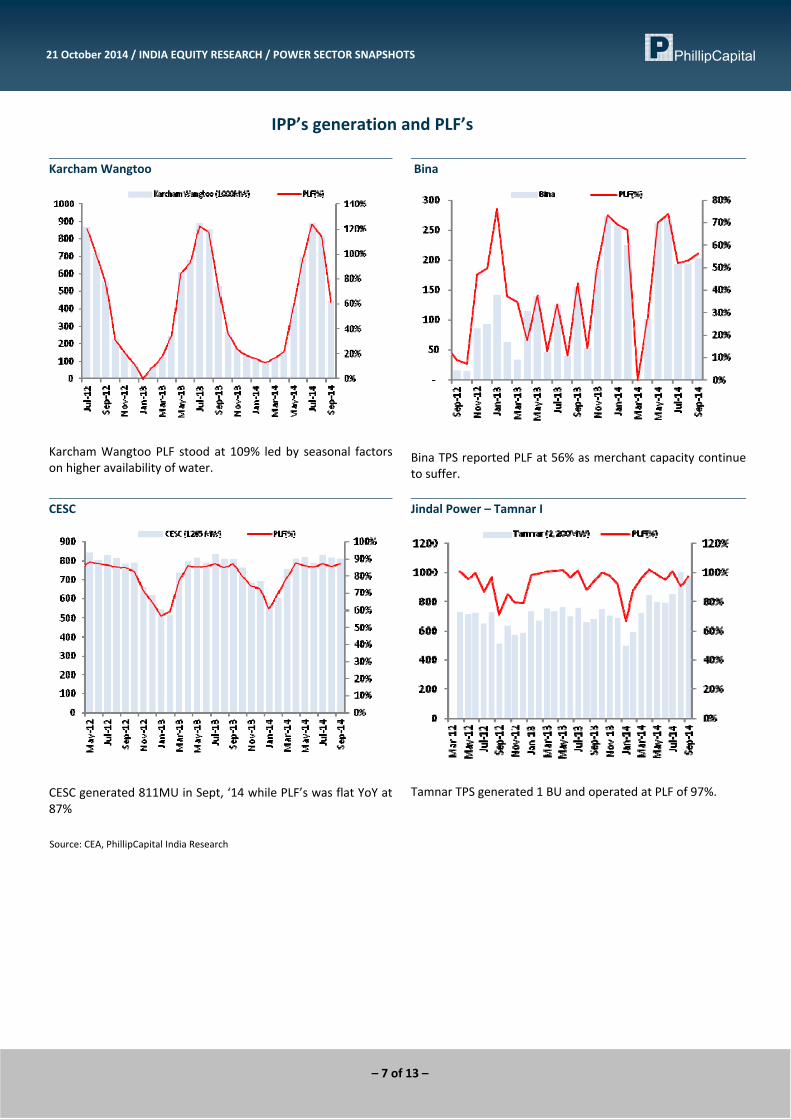
Karcham Wangtoo
Karcham Wangtoo PLF stood at 109% led by seasonal factors on higher availability of water.
Bina
Bina TPS reported PLF at 56% as merchant capacity continueto suffer.
CESC
CESC generated 811MU in Sept, ‘14 while PLF’s was flat YoY at87%
Jindal Power – Tamnar I
Tamnar TPS generated 1 BU and operated at PLF of 97%.
Source: CEA, PhillipCapital India Research

– 8 of 13 –
21 October 2014 / INDIA EQUITY RESEARCH / POWER SECTOR SNAPSHOTS
International coal prices and Coal India’s production/off take Richard Bay, New Castle and HBA index (USD/ton)
Source: Bloomberg, PhillipCapital India Research
RB index prices were down 6% mom to ~ USD66/ton to almost 4 year lows in the month of Sept’14. New Castle and HBA index also followed a similar trend.
CIL production (mn ton) & growth
CIL production in Sept ’14 stood at 35mton up 5% yoy due tolower base. In FY15, production during April‐ Sept was up 5.4%yoy.
CIL off take (mn ton) & growth
CIL off take in Sept ’14 stood at 35mton down 2% yoy. In FY15, during April‐ Sept offtake grew 3% yoy.
Source: Company, PhillipCapital India Research

– 9 of 13 –
21 October 2014 / INDIA EQUITY RESEARCH / POWER SECTOR SNAPSHOTS
Energy demand and supply
Power demand(MU) and growth
Demand has picked up meaningfully and was up 7% YoY in Sept’14
Base deficit and Peak deficit
Base deficit was up 70bps yoy to 4.1%. The peak deficit was flat yoy at 3.5%
Region wise base deficit
The deficit in Northern region was up 200bps yoy to 6%. In Southern region deficit was flat at 3%.
Power cut on industry
Power cut in industry in Northern region was mainly led by Uttarakhand (140 MW) and UP (700MW). In Southern region,all the states contributed leading to power cuts on industry of 5,667MW.
Source: CEA, PhillipCapital India Research

– 10 of 13 –
21 October 2014 / INDIA EQUITY RESEARCH / POWER SECTOR SNAPSHOTS
Short term volumes and prices
Short term volumes (MU) & as % of overall gen Bilateral volumes(MU) and prices
Short term volumes stood at 9.6BU’s, ~11% of total generation
Bilateral volumes improved 26% mom to 5.5BU and Bilateral prices was up 3% yoy to Rs 4.03/kwh.
UI volumes(MU) and prices
UI volumes were up 4% yoy and UI prices were down 3% mom to Rs 2.87/kwh.
IEX volumes(MU) and prices
The IEX prices were down 6% mom Rs 3.5/kwh in the month of July ’14 and volumes were down 10% mom. The average IEX price in Sept was up 38% YoY to Rs 4.2/kwh and in southern region was up 15% to Rs 4.5/kwh.
Source: CERC, PhillipCapital India Research

– 11 of 13 –
21 October 2014 / INDIA EQUITY RESEARCH / POWER SECTOR SNAPSHOTS
Capacity addition
Capacity addition month wise
In Aug ’14 capacity addition stood at 3320MW of thermal capacity
Installed capacity break up as on Sept,’14 – 237GW
All India installed capacity stood at 249GW in Sep ‘14. Coal capacity comprised 60%. We expect contribution of coal based capacity to further improve.
Capacity Addition: Capacity Addition Aug '14 Target Ach (%) YTDFY15 Target Ach (%)Thermal 3320 1233 260 8051 5,151 156Nuclear ‐ ‐ na ‐ na Hydro 130 85 267 286 93Total 3320 1363 260 8318 5,437 153
Source: CEA, PhillipCapital India Research In Aug ’14 capacity addition stood at 3320 MW including thermal capacity and during FY15 (April‐August’14) capacity addition was 8.3 GW, 153% of the targeted capacity. Key capacities commissioned during August include 600 MW Akaltara Project (KSK Energy), 600MW Raghunathpur (DVC) , 660 MW Unit 5 of Sasan UMPP , 660 MW Unit 1 of Nigri TPS (JPVL) and 800 MW Damodar Sanjeeviah by AP Discom

– 12 of 13 –
21 October 2014 / INDIA EQUITY RESEARCH / POWER SECTOR SNAPSHOTS
Management
(91 22) 2300 2999(91 22) 6667 9735
Research Engineering, Capital Goods Pharma
Dhawal Doshi (9122) 6667 9769 Ankur Sharma (9122) 6667 9759 Surya Patra (9122) 6667 9768Priya Ranjan (9122) 6667 9965 Hrishikesh Bhagat (9122) 6667 9986
Retail, Real EstateInfrastructure & IT Services Abhishek Ranganathan, CFA (9122) 6667 9952
Manish Agarwalla (9122) 6667 9962 Vibhor Singhal (9122) 6667 9949 Neha Garg (9122) 6667 9996Pradeep Agrawal (9122) 6667 9953 Varun Vijayan (9122) 6667 9992Paresh Jain (9122) 6667 9948 Technicals
Midcap Subodh Gupta, CMT (9122) 6667 9762Consumer, Media, Telecom Vikram Suryavanshi (9122) 6667 9951Naveen Kulkarni, CFA, FRM (9122) 6667 9947 Production ManagerVivekanand Subbaraman (9122) 6667 9766 Metals Ganesh Deorukhkar (9122) 6667 9966Manish Pushkar, CFA (9122) 6667 9764 Dhawal Doshi (9122) 6667 9769
Database ManagerCement Oil&Gas, Agri Inputs Vishal Randive (9122) 6667 9944Vaibhav Agarwal (9122) 6667 9967 Gauri Anand (9122) 6667 9943
Deepak Pareek (9122) 6667 9950 Sr. Manager – Equities SupportEconomics Rosie Ferns (9122) 6667 9971Anjali Verma (9122) 6667 9969
Sales & Distribution Kinshuk Bharti Tiwari (9122) 6667 9946 Dipesh Sohani (9122) 6667 9756 Zarine Damania (9122) 6667 9976Ashvin Patil (9122) 6667 9991 Sales TraderShubhangi Agrawal (9122) 6667 9964 Dilesh Doshi (9122) 6667 9747 Kishor Binwal (9122) 6667 9989 Suniil Pandit (9122) 6667 9745Sidharth Agrawal (9122) 6667 9934 ExecutionBhavin Shah (9122) 6667 9974 Mayur Shah (9122) 6667 9945
Corporate Communications
Vineet Bhatnagar (Managing Director)Jignesh Shah (Head – Equity Derivatives)
Automobiles
Banking, NBFCs
Contact Information (Regional Member Companies)
SINGAPORE Phillip Securities Pte Ltd
250 North Bridge Road, #06‐00 Raffles City Tower, Singapore 179101
Tel : (65) 6533 6001 Fax: (65) 6535 3834 www.phillip.com.sg
MALAYSIA Phillip Capital Management Sdn Bhd B‐3‐6 Block B Level 3, Megan Avenue II,
No. 12, Jalan Yap Kwan Seng, 50450 Kuala Lumpur Tel (60) 3 2162 8841 Fax (60) 3 2166 5099
www.poems.com.my
HONG KONG Phillip Securities (HK) Ltd
11/F United Centre 95 Queensway Hong Kong Tel (852) 2277 6600 Fax: (852) 2868 5307
www.phillip.com.hk
JAPAN Phillip Securities Japan, Ltd
4‐2 Nihonbashi Kabutocho, Chuo‐ku Tokyo 103‐0026
Tel: (81) 3 3666 2101 Fax: (81) 3 3664 0141 www.phillip.co.jp
INDONESIA PT Phillip Securities Indonesia
ANZ Tower Level 23B, Jl Jend Sudirman Kav 33A, Jakarta 10220, Indonesia
Tel (62) 21 5790 0800 Fax: (62) 21 5790 0809 www.phillip.co.id
CHINA Phillip Financial Advisory (Shanghai) Co. Ltd.
No 550 Yan An East Road, Ocean Tower Unit 2318 Shanghai 200 001
Tel (86) 21 5169 9200 Fax: (86) 21 6351 2940 www.phillip.com.cn
THAILAND Phillip Securities (Thailand) Public Co. Ltd.
15th Floor, Vorawat Building, 849 Silom Road, Silom, Bangrak, Bangkok 10500 Thailand
Tel (66) 2 2268 0999 Fax: (66) 2 2268 0921 www.phillip.co.th
FRANCE King & Shaxson Capital Ltd.
3rd Floor, 35 Rue de la Bienfaisance 75008 Paris France
Tel (33) 1 4563 3100 Fax : (33) 1 4563 6017 www.kingandshaxson.com
UNITED KINGDOM King & Shaxson Ltd.
6th Floor, Candlewick House, 120 Cannon Street London, EC4N 6AS
Tel (44) 20 7929 5300 Fax: (44) 20 7283 6835 www.kingandshaxson.com
UNITED STATES Phillip Futures Inc.
141 W Jackson Blvd Ste 3050 The Chicago Board of Trade Building
Chicago, IL 60604 USA Tel (1) 312 356 9000 Fax: (1) 312 356 9005
AUSTRALIA PhillipCapital Australia
Level 37, 530 Collins Street Melbourne, Victoria 3000, Australia
Tel: (61) 3 9629 8380 Fax: (61) 3 9614 8309 www.phillipcapital.com.au
SRI LANKA Asha Phillip Securities Limited
Level 4, Millennium House, 46/58 Navam Mawatha, Colombo 2, Sri Lanka
Tel: (94) 11 2429 100 Fax: (94) 11 2429 199 www.ashaphillip.net/home.htm
INDIA PhillipCapital (India) Private Limited
No. 1, 18th Floor, Urmi Estate, 95 Ganpatrao Kadam Marg, Lower Parel West, Mumbai 400013 Tel: (9122) 2300 2999 Fax: (9122) 6667 9955 www.phillipcapital.in

– 13 of 13 –
21 October 2014 / INDIA EQUITY RESEARCH / POWER SECTOR SNAPSHOTS
Disclosures and Disclaimers PhillipCapital (India) Pvt. Ltd. has three independent equity research groups: Institutional Equities, Institutional Equity Derivatives and Private Client Group. This report has been prepared by Institutional Equities Group. The views and opinions expressed in this document may or may not match or may be contrary at times with the views, estimates, rating, target price of the other equity research groups of PhillipCapital (India) Pvt. Ltd. This report is issued by PhillipCapital (India) Pvt. Ltd. which is regulated by SEBI. PhillipCapital (India) Pvt. Ltd. is a subsidiary of Phillip (Mauritius) Pvt. Ltd. References to "PCIPL" in this report shall mean PhillipCapital (India) Pvt. Ltd unless otherwise stated. This report is prepared and distributed by PCIPL for information purposes only and neither the information contained herein nor any opinion expressed should be construed or deemed to be construed as solicitation or as offering advice for the purposes of the purchase or sale of any security, investment or derivatives. The information and opinions contained in the Report were considered by PCIPL to be valid when published. The report also contains information provided to PCIPL by third parties. The source of such information will usually be disclosed in the report. Whilst PCIPL has taken all reasonable steps to ensure that this information is correct, PCIPL does not offer any warranty as to the accuracy or completeness of such information. Any person placing reliance on the report to undertake trading does so entirely at his or her own risk and PCIPL does not accept any liability as a result. Securities and Derivatives markets may be subject to rapid and unexpected price movements and past performance is not necessarily an indication to future performance. This report does not have regard to the specific investment objectives, financial situation and the particular needs of any specific person who may receive this report. Investors must undertake independent analysis with their own legal, tax and financial advisors and reach their own regarding the appropriateness of investing in any securities or investment strategies discussed or recommended in this report and should understand that statements regarding future prospects may not be realized. In no circumstances it be used or considered as an offer to sell or a solicitation of any offer to buy or sell the Securities mentioned in it. The information contained in the research reports may have been taken from trade and statistical services and other sources, which we believe are reliable. PhillipCapital (India) Pvt. Ltd. or any of its group/associate/affiliate companies do not guarantee that such information is accurate or complete and it should not be relied upon as such. Any opinions expressed reflect judgments at this date and are subject to change without notice Important: These disclosures and disclaimers must be read in conjunction with the research report of which it forms part. Receipt and use of the research report is subject to all aspects of these disclosures and disclaimers. Additional information about the issuers and securities discussed in this research report is available on request. Certifications: The research analyst(s) who prepared this research report hereby certifies that the views expressed in this research report accurately reflect the research analyst’s personal views about all of the subject issuers and/or securities, that the analyst have no known conflict of interest and no part of the research analyst’s compensation was, is or will be, directly or indirectly, related to the specific views or recommendations contained in this research report. The Research Analyst certifies that he /she or his / her family members does not own the stock(s) covered in this research report. Independence/Conflict: PhillipCapital (India) Pvt. Ltd. has not had an investment banking relationship with, and has not received any compensation for investment banking services from, the subject issuers in the past twelve (12) months, and PhillipCapital (India) Pvt. Ltd does not anticipate receiving or intend to seek compensation for investment banking services from the subject issuers in the next three (3) months. PhillipCapital (India) Pvt. Ltd is not a market maker in the securities mentioned in this research report, although it or its employees, directors, or affiliates may hold either long or short positions in such securities. PhillipCapital (India) Pvt. Ltd may not hold more than 1% of the shares of the company(ies) covered in this report. Suitability and Risks: This research report is for informational purposes only and is not tailored to the specific investment objectives, financial situation or particular requirements of any individual recipient hereof. Certain securities may give rise to substantial risks and may not be suitable for certain investors. Each investor must make its own determination as to the appropriateness of any securities referred to in this research report based upon the legal, tax and accounting considerations applicable to such investor and its own investment objectives or strategy, its financial situation and its investing experience. The value of any security may be positively or adversely affected by changes in foreign exchange or interest rates, as well as by other financial, economic or political factors. Past performance is not necessarily indicative of future performance or results. Sources, Completeness and Accuracy: The material herein is based upon information obtained from sources that PCIPL and the research analyst believe to be reliable, but neither PCIPL nor the research analyst represents or guarantees that the information contained herein is accurate or complete and it should not be relied upon as such. Opinions expressed herein are current opinions as of the date appearing on this material and are subject to change without notice. Furthermore, PCIPL is under no obligation to update or keep the information current. Copyright: The copyright in this research report belongs exclusively to PCIPL. All rights are reserved. Any unauthorized use or disclosure is prohibited. No reprinting or reproduction, in whole or in part, is permitted without the PCIPL’s prior consent, except that a recipient may reprint it for internal circulation only and only if it is reprinted in its entirety. Caution: Risk of loss in trading in can be substantial. You should carefully consider whether trading is appropriate for you in light of your experience, objectives, financial resources and other relevant circumstances. For U.S. persons only: This research report is a product of PhillipCapital (India) Pvt Ltd. which is the employer of the research analyst(s) who has prepared the research report. The research analyst(s) preparing the research report is/are resident outside the United States (U.S.) and are not associated persons of any U.S. regulated broker‐dealer and therefore the analyst(s) is/are not subject to supervision by a U.S. broker‐dealer, and is/are not required to satisfy the regulatory licensing requirements of FINRA or required to otherwise comply with U.S. rules or regulations regarding, among other things, communications with a subject company, public appearances and trading securities held by a research analyst account. This report is intended for distribution by PhillipCapital (India) Pvt Ltd. only to "Major Institutional Investors" as defined by Rule 15a‐6(b)(4) of the U.S. Securities and Exchange Act, 1934 (the Exchange Act) and interpretations thereof by U.S. Securities and Exchange Commission (SEC) in reliance on Rule 15a 6(a)(2). If the recipient of this report is not a Major Institutional Investor as specified above, then it should not act upon this report and return the same to the sender. Further, this report may not be copied, duplicated and/or transmitted onward to any U.S. person, which is not the Major Institutional Investor. In reliance on the exemption from registration provided by Rule 15a‐6 of the Exchange Act and interpretations thereof by the SEC in order to conduct certain business with Major Institutional Investors, PhillipCapital (India) Pvt Ltd. has entered into an agreement with a U.S. registered broker‐dealer, Marco Polo Securities Inc. ("Marco Polo").Transactions in securities discussed in this research report should be effected through Marco Polo or another U.S. registered broker dealer. PhillipCapital (India) Pvt. Ltd. Registered office: No. 1, 18th Floor, Urmi Estate, 95 Ganpatrao Kadam Marg, Lower Parel West, Mumbai 400013