Oil & Natural Gas Technology - National Energy … Library/Research/Oil-Gas/methane... · Oil &...
24
Oil & Natural Gas Technology DOE Award No.: DEFC2606NT43067 Quarterly Progress Report (July – September 2011) Mechanisms Leading to CoExistence of Gas and Hydrate in Ocean Sediments Submitted by: Massachusetts Institute of Technology 77 Massachusetts Ave Cambridge, MA 02139 The University of Texas at Austin 1 University Station C0300 Austin, TX 787120228 Prepared for: United States Department of Energy National Energy Technology Laboratory October 30, 2011 Office of Fossil Energy
Transcript of Oil & Natural Gas Technology - National Energy … Library/Research/Oil-Gas/methane... · Oil &...

Oil & Natural Gas Technology
DOE Award No.: DE-FC26-06NT43067
Quarterly Progress Report (July – September 2011)
Mechanisms Leading to Co-Existence of Gas
and Hydrate in Ocean Sediments
Submitted by: Massachusetts Institute of Technology
77 Massachusetts Ave Cambridge, MA 02139
The University of Texas at Austin
1 University Station C0300 Austin, TX 78712-‐0228
Prepared for:
United States Department of Energy National Energy Technology Laboratory
October 30, 2011
Office of Fossil Energy

Disclaimer - This report was prepared as an account of work sponsored by an agency of the United States Government. Neither the United States Government nor any agency thereof, nor any of their employees, makes any warranty, express or implied, or assumes any legal liability or responsibility for the accuracy, completeness, or usefulness of any information, apparatus, product, or process disclosed, or represents that its use would not infringe privately owned rights. Reference herein to any specific commercial product, process, or service by trade name, trademark, manufacturer, or otherwise does not necessarily constitute or imply its endorsement, recommendation, or favoring by the United States Government or any agency thereof. The views and opinions of authors expressed herein do not necessarily state or reflect those of the United States Government or any agency thereof.

Executive summary
Work during this period of performance has focused on research activities under Task 8(Modeling methane transport at the bed scale).
In this report, we describe the development of a simple, mechanistic model of methanemigration with hydrate formation and dissociation through soft sediments, building on pre-vious work of methane venting [35]. It is well documented that free gas can traverse thehydrate stability zone, often through preferential pathways, such as fractures and faults.We hypothesize that the observed episodicity of bubble venting (ebullition) into the watercolumn is controlled by the dilation of dynamic flow paths in response to changes in effectivestress, both from fluid pressurization associated with the methane source and from tidalloading on the sediment surface. In previous work, we have captured the temporal distri-bution of methane venting from lake sediments using a 1D continuum numerical model ofgas release through such “breathing” dynamic flow conduits that respond to a hydrostaticforcing. Here, we model a characteristic shallow, hydrate-bearing region in order to explorehow fracture flow, tidal forcing and hydrate formation interact to determine the episodicityand magnitude of methane released into the water column. We identify two time scales thatinteract with the tidal period to determine the episodicity of release, and we find that theamount of gas released to the ocean depends critically on the vertical gas conductivity andkinetic hydrate formation rate.
Technology transfer activities
During this reporting period, 5 papers were written and the corresponding presentations weregiven at the 2011 International Conference on Gas Hydrates, which took place in Edinburgh,UK.
Two other papers were published in Geophysical Research Letters, one on the thermo-dynamic and hydrodynamic controls on the overpressure caused by hydrate dissociation[17], and one on the experimental verification, at reservoir conditions, of the crossover fromfingering to fracturing [8].
1

Discussion of activities in this reporting period
Task 8: Modeling methane transport at the bed scale
NUMERICAL MODELING OF HYDRATE FORMATION AND METHANE
GAS TRANSPORT THROUGH DYNAMIC CONDUITS
Abstract. Methane is a potent greenhouse gas that is generated geothermally and biolog-ically in lake and ocean sediments. The mode of methane transport impacts the distributionof hydrates in the sediment, as well as the magnitude of releases into the water column andatmosphere. It is well documented that free gas can traverse the hydrate stability zone,often through preferential pathways, such as fractures and faults. We hypothesize that theobserved episodicity of bubble venting (ebullition) into the water column is controlled bythe dilation of dynamic flow paths in response to changes in effective stress, both fromfluid pressurization associated with the methane source and from tidal loading on the sed-iment surface. In previous work, we have captured the temporal distribution of methaneventing from lake sediments using a 1D continuum numerical model of gas release throughsuch “breathing” dynamic flow conduits that respond to a hydrostatic forcing. Here, wemodel a characteristic shallow, hydrate-bearing region in order to explore how fracture flow,tidal forcing and hydrate formation interact to determine the episodicity and magnitude ofmethane released into the water column. We identify two time scales that interact withthe tidal period to determine the episodicity of release, and we find that the amount of gasreleased to the ocean depends critically on the vertical gas conductivity and kinetic hydrateformation rate.
Introduction. The dissociation of methane hydrates in shallow ocean sediments has longbeen suggested as a potential feedback to climate change [2, 3, 11, 19, 20]. One of theprimary modes of methane export from submerged sediments is free-gas ebullition, but gasbubbles dissolve during rise, exposing the methane to oxidation to the less potent greenhousegas CO2 [44]. The ability of rising bubbles to transport methane to the atmosphere dependson the release depth, bubble density and size distribution [15, 16, 25, 26, 29]. Thus, theatmospheric release depends not only on how much hydrate dissociates but how it is releasedfrom the sediments.
Focused ebullition has been observed at Hydrate Ridge, especially in a periodic pat-tern during low tides [40, 41]. The gas is likely supplied from a deep geologic reservoir,but the mechanism that allows it to travel through the Hydrate Stability Zone (HSZ) fromnear the base of the HSZ (BHSZ) and to escape only during low tides has yet to be de-termined. Multiple mechanisms have been proposed for coexistence of free gas & hydratesin the HSZ [30, 34, 42]: (1) regional geotherms, (2) reduction in hydrate stability by saltaccumulation, (3) kinetics of hydrate formation, and (4) fast, focused flow of free gas throughhigh-permeability conduits. Evidence of fractures and flow through them at Hydrate Ridgehas been inferred from field observations [13, 41, 43, 47] and modeling studies [10, 28].
The combined observations of tidally-controlled ebullition with evidence of gas flowthrough conduits gives us an opportunity to investigate the mechanisms controlling gasmigration through the hydrate stability zone. Previous modeling work has sought to esti-
2

tides
sea !oor~800 m
hydratestabilityzone ~180m
gas!ow
conduit
hydratehydrate
gas bubbles
gas release
gas source
Figure 1: Conceptual model of gas flowing through the hydrate stability zone by dilatingnear-vertical conduits. These conduits access gas in a small domain of surrounding porousmedia, especially through conductive horizontal strata [47], and transport the gas vertically.Vertical dimensions reflect the south summit of Hydrate Ridge, where tidally-forced ebullitionhas been observed [40, 41].
mate the distribution of hydrates by considering methane transport in the dissolved phaseonly [7, 10, 48] or as gas flowing by capillary invasion [9, 14, 28, 33]. These models captureslow processes of pore water flow, heat and salt transport to capture important impacts onhydrate stability and the equilibrium distribution of hydrates [23]. Other models have beenused to estimate the hydrate response to slow sea level change [27] and the onset time forfracturing [9, 10, 28].
In contrast, we model fast processes of free-gas flow through fractures, tidal variations,and kinetic hydrate formation. Previous modeling of gas release from hydrate-free lakesediments has shown that conduit flow can reproduce the observed, hydrostatically-forcedepisodicity of gas venting [36], and we hypothesize that a similar mechanism controls tidally-forced venting from hydrate-bearing sediments. Here, we develop a numerical model of thismechanism and show that it can indeed reproduce the tidally-dependent ebullition recordobserved at Hydrate Ridge. In addition, we find that within a tidal low the ebullition willmanifest as distinct bursts that arise from a geyser-like instability. The ability of gas totraverse the HSZ depends on the vertical gas conductivity and kinetic hydrate formationrate.
Theory, formulation, and methods.
Model domain. We investigate the dynamics of gas flow through the hydrate stabilityzone with a one-dimensional, continuum-scale numerical model. The model attempts tocapture the aggregate behavior of sediments fractured periodically in space. Because themodel is 1D, the transport and accumulation reflect the vertical flow through the fractures
3

as well as the fluid exchange between the fracture and the sediment matrix.The model is intended to resolve the release of methane at sub-tidal timescales (minutes
to hours). At this timescale, fast transport mechanisms such as gas-phase flow are expectedto dominate pore-fluid solute advection and diffusion. Thus, we neglect the accumulationand transport of dissolved methane, salt, and heat, with hydrate formation and aqueous flow.These mechanisms control the hydrate distribution by changing the local hydrate stabilityconditions [4, 10, 14, 27, 28] and thus the long-term hydrate distribution. In turn, hydrateformation can influence the transport regime by cementing the grains [22, 45] or clogging thepores [10, 28, 32]. We neglect these slow feedback mechanism to develop a simple continuummodel of fast gas flow through conduits that respond to both internal pressurization and atidal forcing.
Poromechanics. Gas behaves differently in fine-grained sediments, such as the clay-dominated sediments found in the HSZ at Hydrate Ridge [43], compared with coarse-grainedsediments. Gas invades large-grained porous media when the capillary pressure (Pg−Pw) be-comes large enough for the curved interface to squeeze through a pore throat. In fine-grainedsediments, gas invades by deforming the grains because the capillary pressure required tosqueeze through the throats is prohibitively large [18]. Instead of small interstitial bub-bles characteristic of a capillary-controlled system, gas bubbles in fine sediments take theform relatively large gas cavities surrounded by a matrix of water and sediment grains [37].Because these bubbles grow in a highly-eccentric, cornflake-shaped fracture pattern [1, 6],rather than as spherical bubbles, this mode of growth may also allow for vertical mobility.
The effective stress, σ′, controlling the deformation of this continuum around the gascavities may then be approximated as,
σ′ = σh − Pg, (1)
where σh is the horizontal stress and Pg is the gas pressure [36]. This contrasts with thetypical form of the effective stress, in which the fluid pressure of concern is the water pres-sure [10, 38] or when both fluid pressures are considered [5, 22]. Equation 1 is consistentwith the view that sediment and water form a coherent “mud” phase against which largegas bubbles must push to expand.
The deformation of this matrix-water continuum may be treated as a plastic process thatoccurs at yield limits in tension (σT ) and compression (σC):
−σT ≤ σ′≤ σC . (2)
Cavities dilate in tension (σ′ = −σT ), reducing the gas pressure sufficiently to maintain theplastic equilibrium defined in Equation 2. In compression (σ′ = σC), the cavities shrinkand the gas pressure rises in step with the horizontal stress. This mechanism of cavitydeformation is used to attribute accumulation of gas mass to changes in pressure and volume,in the following order as necessary:
1. Generate maximum gas pressure change at current volume, up to a plastic yield limit
∆Pmaxg =
∆MgRT
SgφmCH4
. (3)
4

2. If a yield limit is reached, deform cavities to change volume. Vary saturation at thenew fixed gas pressure, according to the ideal gas law, up to a maximum that satisfiesthe volume constraints Sg + Sh ≤ 1 and Sg ≥ Smin
g .
3. If a volume constraint is reached, allow pressure to rise or fall outside the plastic limits(σh − σC ≤ Pg ≤ σh + σT ) at the new fixed saturation according to the ideal gas law.
Thus, gas accumulation first forces the gas pressure to a yield limit before changing the gassaturation. This allows for compressible gas flow but requires a small time step to resolvefrequent pressure changes.
In all simulations here we assume σC = 0 and σT = 0.3 MPa, consistent with estimatesfrom combined modeling and field observations at South Hydrate Ridge [47]. The gas pres-sure may exceed the plastic yield limits, especially when hydrate formation depletes the gasto a minimum saturation (for stability) Smin
g = 0.005. However, this does not occur in anyof the simulations shown here.
Gas flow through conduits. The core of our model is free-gas flow through dynamic,vertical conduits. These conduits dilate at the tensile plastic yield limit and close at thecompressive limit (Figure 2). In addition to the dependence on effective stress, we imposea minimum gas saturation, Sconduit
g = 0.1, which is required for the conduits to connectacross depth intervals [47]. Similar model behavior is obtained when Sconduit
g = 0, exceptthe low gas saturations exacerbate the gas pressure fluctuations during cavity deformation(Equation 3), and resolving these larger pressure swings requires a smaller time step.
The model captures gas flow through fractured porous media without distinguishing thepools of gas in the conduit and porous medium separately. Instead, the effect of dilationis captured by increasing the vertical intrinsic permeability, k, from 0 to a parameterizedpermeability of the conduit-matrix continuum, kconduit, which accounts for both the dimen-sions and lateral spacing of conduits. The gas mass conservation equation uses a multiphaseextended form of Darcy’s law for the gas flux [31]:
∂(φρgSg)
∂t= −
∂Fg
∂z+Qh
g (4)
Fg = −ρgkkrgµg
(
∂Pg
∂z− ρgg
)
(5)
krg = Sg (6)
where Qhg is the rate of gas mass generation from hydrate per unit volume and constitutes
all the gas loss from hydrate dissociation, Qh:
Qhg = −χCH4
h Qh (7)
The model is initially free of hydrate but includes gas saturations equal to the minimumfor conduit opening, Sconduit
g , in order to eliminate the initial time necessary to accumulatethis minimum saturation. The gas pressure, however, is assumed to begin at the compressiveyield limit so that the conduit is initially closed everywhere. At the top boundary the gaspressure equals the tidally-forced hydrostatic pressure, with Sg = 0, and the gas flux inthe bottom is set by the parameter F source
g , which represents the source supplied throughHorizon A at the BHSZ [43, 47].
5
Conduit
depth
Trapped
bubbles
Water
level
drop
Conduit
dilation
Gas
release
Pg
σh
σh+σ
T
σh-σ
C
Pressure / stress
Stress
reduction
Gas
decompression
a
b
c
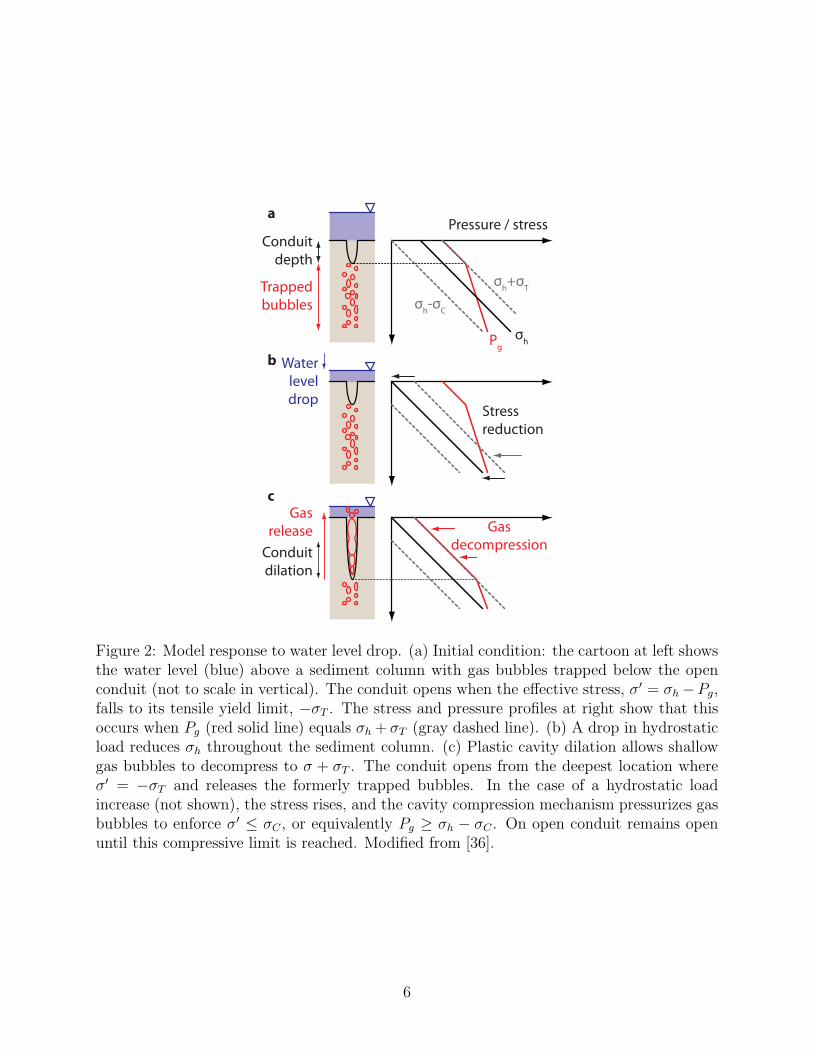
Figure 2: Model response to water level drop. (a) Initial condition: the cartoon at left showsthe water level (blue) above a sediment column with gas bubbles trapped below the openconduit (not to scale in vertical). The conduit opens when the effective stress, σ′ = σh −Pg,falls to its tensile yield limit, −σT . The stress and pressure profiles at right show that thisoccurs when Pg (red solid line) equals σh + σT (gray dashed line). (b) A drop in hydrostaticload reduces σh throughout the sediment column. (c) Plastic cavity dilation allows shallowgas bubbles to decompress to σ + σT . The conduit opens from the deepest location whereσ′ = −σT and releases the formerly trapped bubbles. In the case of a hydrostatic loadincrease (not shown), the stress rises, and the cavity compression mechanism pressurizes gasbubbles to enforce σ′ ≤ σC , or equivalently Pg ≥ σh − σC . On open conduit remains openuntil this compressive limit is reached. Modified from [36].
6

Hydrate formation and dissociation. Given the high temporal resolution of themodel (seconds to minutes), a kinetic model of hydrate formation was adopted following [21].The model for microscale hydrate formation is driven by the departure from equilibriumfugacity, and we simplify this by considering the nearly-equivalent departure from equilibriumpressure [12]. We also adopt the same temperature dependence but neglect the dependenceon surface area of hydrate [21]. The rate of hydrate mass generation per bulk volume is:
Qh = Kh(Pg − Peq) exp(−E
RT), (8)
where Kh is a rate constant with units of kg/m3/Pa/s, E = 8.1×10⁴ J/mol is the activationenergy of the reaction, R = 8.314 J/mol/K is the gas constant. This model transfers massof CH4 from the gas to hydrate phases when Pg > Peq, in the hydrate stability zone, and ittransfers mass in the other direction when Pg < Peq, generally below the hydrate stabilityzone. The equilibrium pressure is evaluated as the hydrate-gas phase boundary, Peq[kPa] =exp(40.234−8860/T [K]) [24], for a temperature profile from a seafloor temperature of 277 Kand constant geothermal gradient of 0.053 K/m at Hydrate Ridge [10]. This causes hydrateto form slightly below the traditional BHSZ, defined as Pw = Peq, because Pg ≥ Pw whenfree gas is present. Whenever either phase is depleted or when the sum of gas and hydratesaturations exceeds 1, the rate of transfer is reduced to avoid unphysical mass transfer.
Tidal forcing. A central goal of our model is to capture the observed relationship be-tween tides and ebullition from hydrate-bearing sediments [41], and the link is made throughthe impact of hydrostatic pressure on total and effective stresses. The total vertical (litho-static) stress, σv, is the sum of the hydrostatic pressure at the sea floor and the integratedbulk density:
σv(z, t) = Ph(t) +
z∫
0
ρb(z′)gdz′ (9)
Ph(t) = ρwg
(
D + ztide ∗ sin
(
2πt
ttide
))
, (10)
where ρb is the bulk density, Ph is the hydrostatic pressure at the seafloor, ztide and ttideare the tidal amplitude and period, respectively. These equations simply show that tidalvariations reflect the total vertical stress throughout the HSZ.
The total vertical stress varies with tides as shown above, but near-vertical conduitsshould in the direction where the gas opposes the minimum stress, which is generally hor-izontal near the crest of south Hydrate Ridge [47]. We calculate the horizontal stress thatwould be imposed on the model domain by the surrounding, water-saturated sediments. Thevertical and lateral stresses are connected through the water-saturated effective stresses bythe lateral stress coefficient, K0. In water-saturated rock and soil, K0 may be expressed as
K0 =σ′
hw
σ′
vw
=ν
1− ν, (11)
where σ′
hw = σh − Pw and σ′
vw = σv − Pw are the water-saturated effective stresses, and ν isPoisson’s ratio [46]. We adopt ν = 3/7 → K0 = 0.75 and for our system [39]. Estimating
7

0 2 4 6 8 10
−1
−0.5
0
0.5
1
Tid
al variation (
m)
Time (days)0 2 4 6 8 10
0
5
10
15
20
Rela
tive g
as f
lux
Figure 3: Periodic venting of gas (green, right scale) at the seafloor in response to 1 m tidalsignal (blue, left scale). Gas flux is normalized by the input flux at the bottom of the model,F sourceg . The delay before the initial release reflects the timescale for gas to build up pressure
and traverse the HSZ. The strong peak leading each release reflects a buildup of pressurejust below the seafloor that is released during plastic tensile opening of the gas flow conduitat the surface, after which the gas pressure drive is reduced. Gas vents only during fallingtides.
the horizontal stress from the vertical stress requires both the lateral stress coefficient andwater pressure:
σh = σ′
hw + Pw = K0σv + (1−K0)Pw (12)
The water pressure response on short timescales and deep in sediments is undrained, wherethe fluid pressurization with laterally-uniform variations in vertical stress is determined bythe loading efficiency, λ = ∂Pw/∂σv [46]. For the water-saturated sediments surroundingthe model domain, we assume λ = 1 [27], and therefore that the water pressure changessynchronously and in the same amount as vertical stress.
Combined model. During each time step, the mechanisms are applied in a staggeredmanner:
1. Impose hydrostatic forcing.
2. Determine where conduits open and close to impose permeability profile.
3. Flow gas through the open conduits.
4. Exchange mass between gas and hydrate phases.
5. Deform cavities, altering Pg and Sg, to plastic equilibrium in response to the hydrostaticforcing and the mass accumulation combined from flow and phase transfer.
Results.
8

8 8.5 9 9.5 10 10.5 11
0
20
40
60
80
100
120
140
160
180
Pressure (MPa)
De
pth
(m
)
σh
Pg
Pw
Figure 4: Profile of pressures and stresses at the end of the base simulation. The horizontalstress, gas and water pressures appear as solid lines of black, red and blue, respectively. Thetensile limit on gas pressure, σh + σT , is shown as a dotted black line, and the equilibriumgas pressure, Peq is a red dashed curve. The region from 0 − 80 mbsf is a connected gasplume where the conduit remains open because Pg > σh−σC . This plume is separated fromthe other rising plume, from 100 − 180 mbsf, by a region where the gas pressure has fallento the compressive yield limit and the conduit has closed.
Episodicity of gas release at the seafloor. We perform a base-case scenario designedto reproduce the general pattern of ebullition during tidal lows for conditions observed at thesouthern summit of Hydrate Ridge [41]. The parameter values used for this base scenarioare D = 800 m, H = 180 m, ztide = 1 m, ttide = 12 hours, kconduit = 2× 10⁻¹⁴ m2, Kh = 100kg/m3/Pa/s, F source
g = 10−4 kg/m2/s, σT = 0.3 × 10⁶ Pa, and Sconduitg = 0.1. Under these
conditions gas indeed traverses the HSZ and escapes during falling tides (Figure 3).The time for gas to traverse the HSZ may be estimated using the multiphase Darcy flux
(Equation 5):
tflow ∼zBHSZµgφ
kconduitρbg, (13)
where the characteristic gas pressure gradient has been approximated by a characteristicvalue relative to the lithostatic gradient, ρbg. The model predicts that gas typically accumu-lates beneath the sediment surface until the hydrostatic pressure falls with tides (Figure 4)and the tensile plastic deformation at the surface allows gas to escape into the water col-umn. After an initial peak in gas flux, the ebullition continues at a moderate rate until thenear-surface gas is depleted or the tides begin to rise again and cause the conduits to close(Figure 3).
Timescales of flow through dynamic conduits. Even without a tidal forcing orhydrate formation, compressible gas flow through a system of dynamic conduits displays twoprimary time scales at steady state: the release time for a connected gas plume, and theduration of an individual ebullition event. Each rising gas plume, displayed as a region of gaspressure elevated above the horizontal stress and the conduit remains open (Figure 4), may
9

reach the sediment surface and escape over a time period on the order of 1 day (Figure 5,top). This release time scales as
tplume ∼ tflowhplume
zBHSZ
, (14)
where hplume is the height of a rising gas plume. This height depends on the ratio of gasinflux from below (F source
g ) and the vertical conductivity and may be estimated as
hplume ∼ tflowF sourceg
M0g
, (15)
where M0
g is the initial mass of gas per unit bulk volume. This equation yields an estimateof ∼ 130 m for the base simulation and agrees well with the observed heights of ∼ 100 m inFigure 4.
However, a plume is not necessarily released in a continuous event. The release of methanegas from the top of the sediment column locally reduces the gas pressure and can close theconduit before the underlying gas plume is depleted. This geyser-like instability releases arising gas plume as multiple separate ebullition events (Figure 5, bottom).
Interaction of flow with tides and hydrates. The inherent episodicity of gas releasethrough conduits is complicated by the influence of tides and hydrate formation. The rela-tively slow release of a connected plume may be broken up into individual releases as fallingtides facilitate conduit opening by reducing the hydrostatic load and total stress (Equation 9and Figure 6, top). The release during a single cycle may then be further divided by thegeyser instability (Figure 6, bottom).
Hydrate formation simultaneously reduces the gas pressure and closes the conduits morequickly, which delays the arrival at the surface, reduces the total output of gas, and changesthe fine-scale episodicity of gas release (Figure 7).
Gas survival through the HSZ. The amount of methane that traverses the HSZdepends on the relative rates of gas flow and conversion to hydrate. The time requiredfor gas to traverse the HSZ is estimated from Equation 13, although the flow timescaleitself depends on the rate of hydrate formation because hydrate formation tends to close theconduits or prevent their opening by reducing the gas pressure. The flow timescale should becompared with the timescale for hydrate formation, which may be estimated from Equation 8as the time required to consume the initial gas at its initial pressure:
thydrate ≈M0
g /χhCH4
Kh(Pg − Peq) exp(−E/(RT )), (16)
where χhCH4
is the mass fraction of methane in hydrates. Because the initial pressure andtemperature profiles are not spatially uniform, thydrate is estimated as the average over alldepth intervals.
We quantify the fraction of methane flowing through the model that reaches the oceanby tracking these fluxes over the course of a given simulation. If the time period is long
10

0 2 4 6 8−1
−0.5
0
0.5
1
Tid
al variation (
m)
Time (days)0 2 4 6 8
0
20
40
60
80
Rela
tive g
as f
lux
5 5.1 5.2 5.3 5.4 5.5
−1
−0.5
0
0.5
Tid
al v
ari
ati
on
(m
)
Time (days)5 5.1 5.2 5.3 5.4 5.5
0
20
40
60
Re
lati
ve
ga
s "
ux
Figure 5: Time series showing an internally-driven run with no tidal forcing. The topfigure shows two timescales relevant to the release: a longer timescale created by the riseof connected gas plumes, which vent for and are separated by about a day, and a shortertimescale of discrete ebullition events. The zoomed bottom figure shows that these releasesare separated by about 1/20 day.
11
0 2 4 6 8
−1
0
1T
ida
l va
ria
tio
n (
m)
Time (days)0 2 4 6 8
0
50
100
Re
lati
ve
ga
s "
ux
7.5 8 8.5 9
−1
0
1
Tid
al v
ari
ati
on
(m
)
Time (days)7.5 8 8.5 9
0
50
100
Re
lati
ve
ga
s "
ux
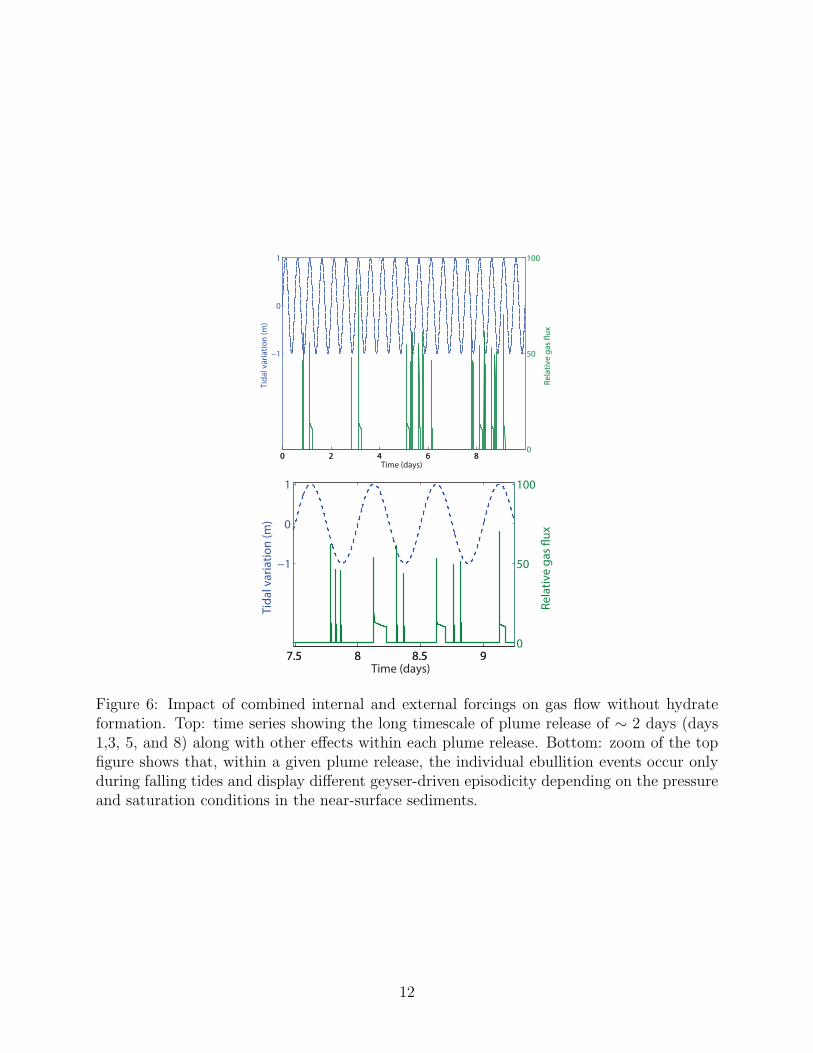
Figure 6: Impact of combined internal and external forcings on gas flow without hydrateformation. Top: time series showing the long timescale of plume release of ∼ 2 days (days1,3, 5, and 8) along with other effects within each plume release. Bottom: zoom of the topfigure shows that, within a given plume release, the individual ebullition events occur onlyduring falling tides and display different geyser-driven episodicity depending on the pressureand saturation conditions in the near-surface sediments.
12
2 2.5 3 3.50
5
10
15
20
25
30
35
Time (days)
Re
lati
ve
ga
s !
ux
2100
1050
525
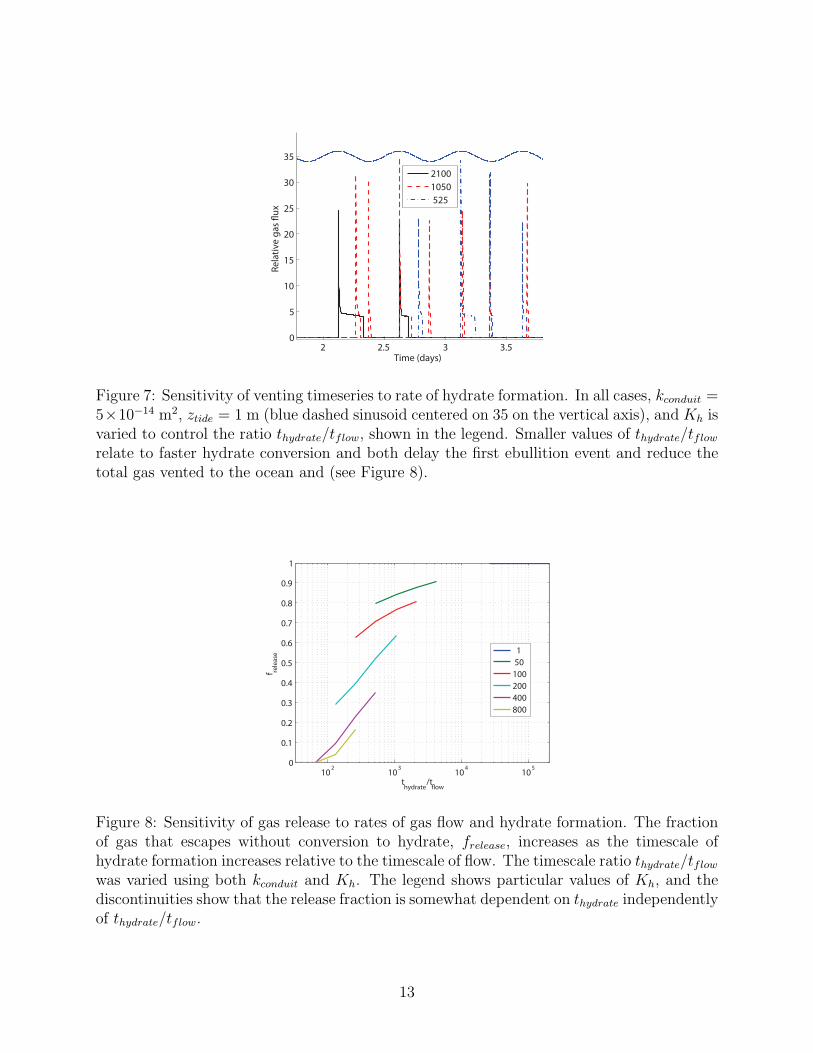
Figure 7: Sensitivity of venting timeseries to rate of hydrate formation. In all cases, kconduit =5×10⁻¹⁴ m2, ztide = 1 m (blue dashed sinusoid centered on 35 on the vertical axis), and Kh isvaried to control the ratio thydrate/tflow, shown in the legend. Smaller values of thydrate/tflowrelate to faster hydrate conversion and both delay the first ebullition event and reduce thetotal gas vented to the ocean and (see Figure 8).
102
103
104
105
0
0.1
0.2
0.3
0.4
0.5
0.6
0.7
0.8
0.9
1
thydrate
/t ow
f rele
ase
1
50
100
200
400
800
Figure 8: Sensitivity of gas release to rates of gas flow and hydrate formation. The fractionof gas that escapes without conversion to hydrate, frelease, increases as the timescale ofhydrate formation increases relative to the timescale of flow. The timescale ratio thydrate/tflowwas varied using both kconduit and Kh. The legend shows particular values of Kh, and thediscontinuities show that the release fraction is somewhat dependent on thydrate independentlyof thydrate/tflow.
13

0 1 2 3
x 10−3
0
50
100
150
200
Hydrate Saturation
De
pth
(m
)
Figure 9: Final hydrate saturation profile for the same conditions as in Figure 3 after 10days.
enough to reach pseudo-steady state conditions, changes in the methane storage becomesmall relative to the cumulative fluxes into and out of the system. In this case, the ability ofmethane to escape to the sediment surface may be estimated as the ratio of time-integratedfluxes across the top and bottom of the model. However, the poorly-constrained initial gascontent of the system motivates us to account for the change in gas storage over the timeperiod:
∆Mg =
H∫
0
(Mg(z, tf )−Mg(z, t = 0)) dz (17)
frelease ≈
tf∫
0
F (z = 0, t)dt
tf∫
0
F (z = H, t)dt−∆Mg
, (18)
where Mg = ρgSgφ is the mass of accumulated gas per volume. This release fraction ishighly sensitive to the ratio of flow and hydrate timescales, and it also depends on thehydrate generation rate (Figure 8).
Vertical hydrate distribution. Hydrate formation increases the saturation of hy-drate, but the assumed formation rates are slow and cause little to appear during the courseof simulations here. A profile of hydrate saturation shows this growth throughout the HSZ(Figure 9). The distribution reflects the balance of the driving force, Pg−Peq, which increasesupwards (Figure 4), against the temperature-dependent term, which increases about three-fold downward from the water column to the BHSZ. Hydrate may form or dissociate basedon Equation 8, but because the HSZ is always populated with gas for these simulations,Pg ≥ Peq in this region and hydrate only forms and never dissociates.
14

0 2 4 6 8 10
−1
−0.5
0
0.5
1
Tid
al v
ari
ati
on
(m
)
Time (days)0 2 4 6 8 10
0
10
20
30
40
Re
lati
ve
ga
s "
ux
Figure 10: Spatial discretization sensitivity with nz = 64 and dz = 2.8 m, compared withnz = 32 and dz = 5.6 m in Figure 3. Increasing the spatial discretization causes the initialpeaks in gas release to be larger due to the stronger gas pressure gradient between the top celland seafloor. In both these cases, the finite volume interface permeabilities were estimatedfrom the cell values using a moving average filter with enough cells to cover a width of 10 m.
Numerical techniques. The flow Equations (4–6) are discretized in space using afinite volume method with first-order upwinding and integrated in time using a forwardEuler scheme. The model is sensitive to the spatial discretization because of the nonlinearrelationship between permeability and effective stress through conduit dilation. This meansthat the gas pressure gradients which build up at the top of the sediment column are largerfor finer discretization, and hence the driving force for gas flow is stronger and the initialpeak in ebullition is larger (compare Figures 3 and 10).
The model timestep is chosen dynamically to keep the magnitude of gas pressure changesfrom flow and hydrate formation small compared with the sediment strength. This conditionis strict enough that the results do not change when a smaller timestep is imposed.
Discussion and Conclusions. The model developed here shows that free gas flow throughdynamic conduits is a potential mechanism by which tides trigger ebullition from hydrate-bearing sediments at South Hydrate Ridge [40, 41] (Figure 3). Although the model neglectsspatial heterogeneity and processes that control the long-term dynamics of hydrate-bearingsediments, its ability to balance free-gas flow through dynamic conduits against conversionto hydrates allows us to identify emergent behavior and the relevant temporal and spatialscales that may control venting at the seafloor. For example, the tidal forcing imposes gas-flux periodicity on the release of connected gas plumes that rise through the HSZ, and withina tidal ebb the release may break into multiple bursts as the flow conduit opens and closesnear the surface, in a mechanism reminiscent of fluid expulsion from a geyser.
This fraction of injected gas that escapes conversion to hydrate is sensitive to the timescalesof fluid flow and hyrdate formation. More gas escapes conversion to hydrate when the ra-tio thydrate/tflow is larger, but even at a given value of this ratio, faster hydrate formationcauses less gas to survive the rise (Figure 8). We suggest the explanation that gas rises more
15

slowly as the hydrate formation rate increases because hydrate formation reduces the gaspressure and delays conduit opening. As the time for gas to rise increases, a corrected ratiothydrate/tflow would be smaller, and the lines might coincide better in Figure 8.
A number of neglected mechanisms impact the efficiency of gas transport and hydrateformation assumed by our model. The transport and accumulation of heat and dissolvedmethane and salt all tend to inhibit gas flow and hydrate formation and dissociation. Gasand hydrate are only stable when surrounded by methane- saturated pore water, and back-ground aqueous flow flushes away concentrated methane, dissolving gas and hydrates. Ourmodel overestimates the efficiencies of both vertical gas transport and mass transfer fromgas to hydrate phases. Meanwhile, salt expulsion from pore water and heat generationduring hydrate formation reduce hydrate stability, providing negative feedbacks on hydrategeneration.
Given that neither gas flow nor hydrate formation in our model depends on the presenceof hydrates, the current model is not an ideal tool for speculating on the impact of gasflow on the vertical hydrate distribution. Future models may be made sensitive to hydratesby considering increased tensile strength [22, 45] or pore clogging [10, 28, 32] with hydrateformation, as well as a dependence of the hydrate formation rate on the available hydratesurface area [21]. Such models may test the stability of hydrate distributions suggestedby models that capture long-timescale effects [10, 28, 32] in the presence gas flow throughfractures.
Nomenclature
D mean water depth [m]E activation energy [J/mol]frelease fraction of flowing gas released [-]F sourceg deep source of gas [kg/m2/s]
g gravitational acceleration [m/s2]H model domain depth [m]hplume height of a rising gas plume [m]k intrinsic vertical permeability [m2]K0 lateral stress coefficient [-]kconduit conduit intrinsic permeability [m2]Kh hydrate formation rate [kg/m3/Pa/s]krg gas relative permeability [-]mCH4
molar mass of methane [kg/mol]Mg mass of gas per unit bulk volume [kg/m3]M0
g initial mass of gas [kg/m3]∆Mg gas accumulation per unit area [kg/m2]Peq gas-hydrate equilibrium pressure [Pa]Pg gas pressure [Pa]Ph hydrostatic pressure at sea floor [Pa]Pw water pressure [Pa]R ideal gas constant [J/mol/K]Sg gas saturation [-]
16

Sming minimum gas saturation [-]
Sconduitg minimum open-conduit gas saturation [-]
Sh hydrate saturation [-]t time [s]tf simulation length [s]tflow flow timescale [s]thydrate hydrate formation timescale [s]ttide tidal period [s]∆t time step [s]T temperature [K]z depth below sea floor [m]zBHSZ depth of hydrate stability zone base [m]ztide tidal height [m]
Greek letters
λ loading efficiency [-]µg gas viscosity [Pa.s]µw water viscosity [Pa.s]ν Poisson’s ratio [-]φ porosity [-]ρb bulk density [kg/m3]ρg gas density [kg/m3]ρw water density [kg/m3]σ stress (positive in compression) [Pa]σ′ effective stress [Pa]σh horizontal stress [Pa]σv vertical stress [Pa]σC compressive yield strength [Pa]σT tensile yield strength [Pa]σ′
wv vertical water-saturated effective stress [Pa]σ′
wv vertical water-saturated effective stress [Pa]χhCH4
mass fraction of methane in hydrates
References
[1] C. K. Algar and B. P. Boudreau. Stability of bubbles in a linear elastic medium:Implications for bubble growth in marine sediments. J. Geophys. Res., 115, 2010.
[2] D. Archer. Methane hydrate stability and anthropogenic climate change. Biogeosci., 4(4):521–544, 2007.
[3] D. Archer, B. Buffett, and V. Brovkin. Ocean methane hydrates as a slow tipping pointin the global carbon cycle. Proc. Natl. Acad. Sci. U.S.A., 106:20596–20601, 2008.
17

[4] Gaurav Bhatnagar, Walter G. Chapman, Gerald R. Dickens, Brandon Dugan, andGeorge J. Hirasaki. Generalization of gas hydrate distribution and saturation in marinesediments by scaling of thermodynamic and transport processes. Am. J. Sci., 307(6):861–900, 2007.
[5] A W Bishop. The principle of effective stress. Teknisk Ukeblad, 39:859–863, 1959.
[6] BP Boudreau, C Algar, BD Johnson, I Croudace, A Reed, Y Furukawa, KM Dorgan,PA Jumars, AS Grader, and BS Gardiner. Bubble growth and rise in soft sediments.Geology, 33(6):517–520, 2005.
[7] B Buffett and D Archer. Global inventory of methane clathrate: sensitivity to changesin the deep ocean. Earth Planet. Sci. Lett., 227(3-4):185–199, 2004.
[8] J.-H. Choi, Y. Seol, R. Boswell, and R. Juanes. X-ray computed-tomography imaging ofgas migration in water-saturated sediments: from capillary invasion to conduit opening.38:L17310, doi:10.1029/2011GL048513, 2011.
[9] Hugh Daigle and Brandon Dugan. Effects of multiphase methane supply on hydrateaccumulation and fracture generation. Geophys. Res. Lett., 37, 2010.
[10] Hugh Daigle and Brandon Dugan. Origin and evolution of fracture-hosted methanehydrate deposits. J. Geophys. Res., 115, 2010.
[11] G R Dickens, J R O’Neil, D K Rea, and R M Owen. Dissociation of oceanic methanehydrate as a cause of the carbon-isotope excursion at the end of the paleocene. Paleo-ceanography, 10(6):965–971, 1995.
[12] ZH Duan, N Moller, and JH Weare. An equation of state for the CH4-CO2-H2O system:II. Mixtures from 50 to 1000-degrees-C and 0 to 1000 bar. Geochim. Cosmochim. Acta,56(7):2619–2631, 1992.
[13] PB Flemings, XL Liu, and WJ Winters. Critical pressure and multiphase flow in BlakeRidge gas hydrates. Geology, 31(12):1057–1060, 2003.
[14] Sabodh K. Garg, John W. Pritchett, Arata Katoh, Kei Baba, and Tetsuya Fujii. Amathematical model for the formation and dissociation of methane hydrates in themarine environment. J. Geophys. Res., 113(B1), 2008.
[15] Xiaobo Gong, Shu Takagi, and Yoichiro Matsumoto. The effect of bubble-induced liquidflow on mass transfer in bubble plumes. Int. J. Multiphase Flow, 35(2):155–162, 2009.
[16] J Greinert and B Nutzel. Hydroacoustic experiments to establish a method for thedetermination of methane bubble fluxes at cold seeps. Geo-Mar. Lett., 24(2):75–85,2004.
[17] R. Holtzman and R. Juanes. Thermodynamic and hydrodynamic constraints onoverpressure caused by hydrate dissociation: a pore-scale model. 38:L14308,doi:10.1029/2011GL047937, 2011.
18

[18] A. K. Jain and R. Juanes. Preferential Mode of gas invasion in sediments: Grain-scalemechanistic model of coupled multiphase fluid flow and sediment mechanics. J. Geophys.
Res., 114(B08101), 2009.
[19] AG Judd, M Hovland, LI Dimitrov, SG Gil, and V Jukes. The geological methanebudget at Continental Margins and its influence on climate change. Geofluids, 2(2):109–126, 2002.
[20] JP Kennett, KG Cannariato, IL Hendy, and RJ Behl. Carbon isotopic evidence formethane hydrate instability during quaternary interstadials. Science, 288(5463):128–133, 2000.
[21] HC Kim, PR Bishnoi, RA Heidemann, and SSH Rizvi. Kinetics of methane hydratedecomposition. Chem. Eng. Sci., 42(7):1645–1653, 1987.
[22] A. Klar, K. Soga, and M. Y. A. Ng. Coupled deformation-flow analysis for methanehydrate extraction. Geotechnique, 60(10):765–776, 2010.
[23] Michael B. Kowalsky and George J. Moridis. Comparison of kinetic and equilibriumreaction models in simulating gas hydrate behavior in porous media. Energy Conversion
and Management, 48(6):1850–1863, 2007.
[24] Tae-Hyuk Kwon, Gye-Chun Cho, and J. Carlos Santamarina. Gas hydrate dissociationin sediments: Pressure-temperature evolution. Geochem. Geophys. Geosyst., 9, 2008.
[25] Ira Leifer, Bruce P. Luyendyk, Jim Boles, and Jordan F. Clark. Natural marine seepageblowout: Contribution to atmospheric methane. Glob. Biogeochem. Cycle, 20(3), 2006.
[26] AM Leitch and WD Baines. Liquid volume flux in a weak bubble plume. J. Fluid Mech.,205:77–98, 1989.
[27] Xiaoli Liu and Peter Flemings. Dynamic response of oceanic hydrates to sea level drop.Geophys. Res. Lett., 36, 2009.
[28] Xiaoli Liu and Peter B. Flemings. Dynamic multiphase flow model of hydrate formationin marine sediments. J. Geophys. Res., 112(B3), 2007.
[29] D. F. McGinnis, J. Greinert, Y. Artemov, S. E. Beaubien, and A. Wuest. Fate of risingmethane bubbles in stratified waters: How much methane reaches the atmosphere? J.
Geophys. Res., 111(C9), 2006.
[30] AV Milkov and WY Xu. Comment on “Gas hydrate growth, methane transport, andchloride enrichment at the southern summit of Hydrate Ridge, Cascadia margin offOregon” by Torres et al. [Earth Planet. Sci. Lett. 226 (2004) 225-241]. Earth Planet.
Sci. Lett., 239(1-2):162–167, 2005.
[31] M. Muskat. Physical Principles of Oil Production. McGraw-Hill Book Co. (New York),1949.
19
[32] J Nimblett and C Ruppel. Permeability evolution during the formation of gas hydratesin marine sediments. J. Geophys. Res., 108(B9), 2003.
[33] Matthew T. Reagan and George J. Moridis. Large-scale simulation of methane hydratedissociation along the West Spitsbergen Margin. Geophys. Res. Lett., 36, 2009.
[34] C Ruppel, GR Dickens, DG Castellini, W Gilhooly, and D Lizarralde. Heat and saltinhibition of gas hydrate formation in the northern Gulf of Mexico. Geophys. Res. Lett.,32(4), 2005.
[35] B. P. Scandella, C. Varadharajan, H. Hemond, C. Ruppel, and R. Juanes. Aconduit dilation model of methane venting from lake sediments. 38:L06408,doi:10.1029/2011GL046768, 2011.
[36] Benjamin P. Scandella, Charuleka Varadharajan, Harold F. Hemond, Carolyn Ruppel,and Ruben Juanes. A conduit dilation model of methane venting from lake sediments.Geophys. Res. Lett., 38(L06408), 2011.
[37] G. C. Sills, S. .J. Wheeler, S. D. Thomas, and N. T. Gardner. Behavior of offshore soilscontaining gas-bubbles. Geotechnique, 41(2):227–241, 1991.
[38] K. Terzaghi. Theoretical Soil Mechanics. John Wiley, New York, 1943.
[39] Stephen David Thomas. The consolidation behaviour of gassy soil. PhD thesis, Univer-sity of Oxford, 1987.
[40] M. E. Torres. , 2010. Pers. comm.
[41] M.E. Torres, J. McManus, D.E. Hammond, M.A. de Angelis, K.U. Heeschen, S.L. Col-bert, M.D. Tryon, K.M. Brown, and E. Suess. Fluid and chemical fluxes in and outof sediments hosting methane hydrate deposits on Hydrate Ridge, OR, I: Hydrologicalprovinces. Earth Planet. Sci. Lett., 201(3-4):525 – 540, 2002.
[42] ME Torres, KWallmann, AM Trehu, G Bohrmann, WS Borowski, and H Tomaru. Replyto comment on: “Gas hydrate growth, methane transport and chloride enrichment atthe southern summit of Hydrate Ridge, Cascadia Margin off Oregon”. Earth Planet.
Sci. Lett., 239(1-2):168–175, 2005.
[43] AM Trehu, PB Flemings, NL Bangs, J Chevallier, E Gracia, JE Johnson, CS Liu,XL Liu, M Riedel, and ME Torres. Feeding methane vents and gas hydrate deposits atsouth Hydrate Ridge. Geophys. Res. Lett., 31(23), 2004.
[44] DL Valentine, DC Blanton, WS Reeburgh, and M Kastner. Water column methaneoxidation adjacent to an area of active hydrate dissociation, Eel River Basin. Geochim.
Cosmochim. Acta, 65(16):2633–2640, 2001.
[45] W. F. Waite, J. C. Santamarina, D. D. Cortes, B. Dugan, D. N. Espinoza, J. Germaine,J. Jang, J. W. Jung, T. J. Kneafsey, H. Shin, K. Soga, W. J. Winters, and T-S. Yun.Physical properties of hydrate-bearing sediments. Reviews of Geophysics, 47, 2009.
20

[46] Herbert F. Wang. Theory of Linear Poroelasticity with Applications to Geomechanics
and Hydrogeology. Princeton University Press, 2000.
[47] JL Weinberger and KM Brown. Fracture networks and hydrate distribution at HydrateRidge, Oregon. Earth Planet. Sci. Lett., 245(1-2):123–136, 2006.
[48] WY Xu and C Ruppel. Predicting the occurrence, distribution, and evolution ofmethane gas hydrate in porous marine sediments. J. Geophys. Res., 104(B3):5081–5095, 1999.
21

National Energy Technology Laboratory 626 Cochrans Mill Road P.O. Box 10940 Pittsburgh, PA 15236-0940 3610 Collins Ferry Road P.O. Box 880 Morgantown, WV 26507-0880 One West Third Street, Suite 1400 Tulsa, OK 74103-3519 1450 Queen Avenue SW Albany, OR 97321-2198 2175 University Ave. South Suite 201 Fairbanks, AK 99709 Visit the NETL website at: www.netl.doe.gov Customer Service: 1-800-553-7681