Oil Natural Gas Technology - National Energy Technology ... library/Research/oil-gas/enhanced...
106
Oil & Natural Gas Technology DOE Award No.: DE-FC26-08NT43291 Project Manager: John Terneus Final Report SUBTASK 1.2 – EVALUATION OF KEY FACTORS AFFECTING SUCCESSFUL OIL PRODUCTION IN THE BAKKEN FORMATION, NORTH DAKOTA Submitted by: James A. Sorensen, Darren D. Schmidt, Steven A. Smith, Terry P. Bailey, Blaise A.F. Mibeck, John A. Harju Energy & Environmental Research Center University of North Dakota 15 North 23rd Street, Stop 9018 Grand Forks, ND 58202-9018 Prepared for: United States Department of Energy National Energy Technology Laboratory May 19, 2010 Office of Fossil Energy
-
Upload
phungnguyet -
Category
Documents
-
view
215 -
download
1
Transcript of Oil Natural Gas Technology - National Energy Technology ... library/Research/oil-gas/enhanced...
Oil & Natural Gas Technology
DOE Award No.: DE-FC26-08NT43291 Project Manager: John Terneus
Final Report
SUBTASK 1.2 – EVALUATION OF KEY
FACTORS AFFECTING SUCCESSFUL OIL PRODUCTION IN THE BAKKEN FORMATION,
NORTH DAKOTA
Submitted by: James A. Sorensen, Darren D. Schmidt, Steven A. Smith,
Terry P. Bailey, Blaise A.F. Mibeck, John A. Harju Energy & Environmental Research Center
University of North Dakota 15 North 23rd Street, Stop 9018 Grand Forks, ND 58202-9018
Prepared for:
United States Department of Energy National Energy Technology Laboratory
May 19, 2010
Office of Fossil Energy
DISCLAIMER
This report was prepared as an account of work sponsored by an agency of the United States Government. Neither the United States Government, nor any agency thereof, nor any of their employees, makes any warranty, express or implied, or assumes any legal liability or responsibility for the accuracy, completeness, or usefulness of any information, apparatus, product, or process disclosed, or represents that its use would not infringe privately owned rights. Reference herein to any specific commercial product, process, or service by trade name, trademark, manufacturer, or otherwise does not necessarily constitute or imply its endorsement, recommendation, or favoring by the United States Government or any agency thereof. The views and opinions of authors expressed herein do not necessarily state or reflect those of the United States Government or any agency thereof.
This report is available to the public from the National Technical Information Service, U.S.
Department of Commerce, 5285 Port Royal Road, Springfield, VA 22161; phone orders accepted at (703) 487-4650. EERC DISCLAIMER
LEGAL NOTICE This research report was prepared by the Energy & Environmental Research Center (EERC), an agency of the University of North Dakota, as an account of work sponsored by the U.S. Department of Energy National Energy Technology Laboratory. Because of the research nature of the work performed, neither the EERC nor any of its employees makes any warranty, express or implied, or assumes any legal liability or responsibility for the accuracy, completeness, or usefulness of any information, apparatus, product, or process disclosed or represents that its use would not infringe privately owned rights. Reference herein to any specific commercial product, process, or service by trade name, trademark, manufacturer, or otherwise does not necessarily constitute or imply its endorsement or recommendation by the EERC. ACKNOWLEDGMENTS
The authors wish to acknowledge and thank the U.S. Department of Energy National Energy Technology Laboratory (NETL) for its tremendous support of this project. We specifically want to thank John Duda, James Ammer, and John Terneus of the Strategic Center for Natural Gas & Oil for their invaluable guidance, insight, and support throughout the course of the project. The authors would like to acknowledge the hard work and dedication of several individuals and organizations, without whose help and support the research described in this report would not have been possible. We want to extend special thanks to the following individuals at the North Dakota Department of Mineral Resources: Mr. Lynn Helms, Director of the North Dakota Department of Mineral Resources, for his invaluable guidance, insight, and critique of some of the critical elements of this research program at every stage of its progress; Mr. Ed Murphy, North Dakota State Geologist, for his unwavering support and commitment to ensuring the technical success of this project; and Dr. Julie LeFever, Director of the North
Dakota Core Library, and Dr. Stephan Nordeng of the North Dakota Geological Survey for their guidance and assistance in selecting and providing the EERC with the physical samples used to conduct the mineralogical and geomechanical analytical activities. The authors also appreciate the efforts of Mr. Monte Besler of Hohn Engineering for providing the research team with valuable guidance in identifying the engineering elements that historically have had the greatest impact on success in the Bakken and Mr. David Brimberry of Marathon Oil Company for providing an industry perspective and support to the early stages of this project. The authors thank the following members of the EERC technical staff for their critical contributions to this project: Mr. Ryan Klapperich for developing and populating the Bakken well file database; Mr. Jordan Bremer and Mr. Ben Huffman for providing technical support to the laboratory analytical activities; Mr. Ron Rovenko for his efforts in organizing and evaluating drilling and completion data; and Mr. Wes Peck, Ms. Tera Buckley, and Ms. Madhavi Marasinghe for their efforts in creating a Web-based geographic information system (GIS) platform for working with the well file database. Finally, the authors recognize the tremendous efforts of Ms. Kim Dickman, Ms. Heather Johnson, and Ms. Jane Russell for their invaluable contributions in the preparation and finalization of this report.
SUBTASK 1.2 – EVALUATION OF KEY FACTORS AFFECTING SUCCESSFUL OIL PRODUCTION IN THE BAKKEN FORMATION, NORTH DAKOTA
ABSTRACT
The Bakken Formation oil play is still in the early stages of development at a time when data collection, investigations, and research are vital to improving and optimizing the ultimate production from the resource. As a play that is limited by low permeability and fracture porosity, greater understanding of formation parameters is critical to improving production. The Energy & Environmental Research Center (EERC) has conducted a multidisciplinary research program to identify key attributes of successful Bakken wells and provide technically based guidance to stakeholders regarding future exploitation efforts. The EERC’s Bakken research program has taken a four-pronged approach to evaluate and compare key attributes of the Bakken play in two North Dakota counties, Mountrail and Dunn. The four topic areas upon which the research program focused are geology, geochemistry, geomechanics, and engineering. The evaluations were conducted largely through the use of a database of well drilling, completion, stimulation, and production statistics and information that was created under this project. Also laboratory data on the geochemical, mineralogic, and geomechanical properties from over 30 wells were generated. Preliminary conclusions derived from the research activities conducted include the following:
1) Horizontal drilling of the middle member of the Bakken coupled with multistage
fracturing has outperformed all previously completed Bakken wells in North Dakota. 2) Geologic influences appear to be dictating the hydrocarbon production rates for given
areas within North Dakota that have similar completion practices. 3) Production in Mountrail County greatly exceeds production in Dunn County and has
significantly higher variability, with the higher production appearing to be linked to greater total organic carbon and shale thicknesses which, in turn, have the potential to create greater pore pressure-related fracturing.
4) The presence of structural elements is consistent with areas of higher production. 5) Multistage hydraulic fracturing appears to be outperforming fewer-stage hydraulic
fracturing when compared in proximity. 6) Multilateral wells do not appear to gain significant production advantage over single
lateral wells, despite lower per-foot drilling costs.
i
TABLE OF CONTENTS LIST OF FIGURES ....................................................................................................................... iii LIST OF TABLES ......................................................................................................................... vi EXECUTIVE SUMMARY .......................................................................................................... vii INTRODUCTION .......................................................................................................................... 1 BACKGROUND ............................................................................................................................ 2 APPROACH ................................................................................................................................... 5 BASIS OF EVALUATIONS .......................................................................................................... 6 GENERAL GEOLOGIC SETTING AND FEATURES OF THE BAKKEN STUDY AREA ..... 7 Lithofacies of the Middle Bakken Member .......................................................................... 8 Regional-Scale Structure of the Bakken ............................................................................... 9 Dunn County Local-Scale Structure and Relationship to Oil Productivity......................... 11 Mountrail County Local-Scale Structure and Relationship to Productivity ....................... 12 The Role of Hydrocarbon Generation Formation Pressure on Bakken Productivity .......... 16 THE POTENTIAL ROLE OF MINERALOGY AND PETROLOGY IN BAKKEN PRODUCTIVITY ......................................................................................................................... 19 Overview of General Bakken Mineralogy .......................................................................... 20 Illite–Smectite Overview ..................................................................................................... 22 Opal–Chert Overview ......................................................................................................... 23 Dunn County and Mountrail County Case Comparisons .................................................... 23 Mineralogy and Petrology Conclusions .............................................................................. 25 GEOMECHANICAL EVALUATION ......................................................................................... 26 Geomechanical Test Results ............................................................................................... 29 Proppant Evaluation ............................................................................................................ 34 Evaluation of Engineering Elements ................................................................................... 36 Considerations Regarding Completions .............................................................................. 38 The Role of Azimuth ........................................................................................................... 41 Initial Production ................................................................................................................. 41 Lateral Length ..................................................................................................................... 42 Stimulation Differences ....................................................................................................... 44 Production from Dunn County Wells .................................................................................. 45 Production from Mountrail County Wells .......................................................................... 48 Production in Eastern Mountrail County ................................................................... 49
Continued . . .

ii
TABLE OF CONTENTS (continued)
Production in Western Mountrail County .................................................................. 50 DISCUSSION ............................................................................................................................... 53 Well Azimuth ...................................................................................................................... 54 Production ........................................................................................................................... 54 Completions ........................................................................................................................ 55 Geologic Factors ................................................................................................................. 56 CONCLUSIONS........................................................................................................................... 57 REFERENCES ............................................................................................................................. 58 FIGURE REFERENCES .............................................................................................................. 60 OTHER RELEVANT LITERATURE ......................................................................................... 60 MAPS OF KEY GEOLOGICAL CHARACTERISTICS OF THE BAKKEN FORMATION IN THE DUNN COUNTY–MOUNTRAIL COUNTY STUDY AREA ............................................................................................................................. Appendix A KEY ELEMENTS AND IMAGES OF THE STATIC PETROPHYSICAL MODEL OF THE BAKKEN FORMATION IN DUNN COUNTY, NORTH DAKOTA .......... Appendix B DESCRIPTION OF THE ROCK EVAL PYROLYSIS METHOD FOR MEASURING HYDROCARBON-GENERATING POTENTIAL IN A HYDROCARBON SOURCE ROCK ............................................................................ Appendix C PROPPANT STRENGTH-TESTING DATA ............................................................... Appendix D
iii
LIST OF FIGURES 1 Historical estimates of Bakken oil resources ........................................................................ 1 2 Map of the extent of the Bakken Formation in North Dakota and Montana ........................ 2 3 Stratigraphic column for rocks of the Williston Basin in North Dakota and generalized
stratigraphy of the Bakken Formation in North Dakota ........................................................ 3 4 Oil fields represented within the Bakken well file database ................................................. 7 5 Map of the study area showing areas of high-producing wells in Dunn and Mountrail
Counties compared to the relative presence of L3 ................................................................ 8 6 Extent of CBF ........................................................................................................................ 9 7 Major structural features within the Williston Basin of North Dakota ............................... 10 8 Structure on top of the Bakken Formation located in Mountrail and Dunn Counties ......... 10 9 Dunn County study area for which a static petrophysical model of the Bakken
was developed ..................................................................................................................... 11 10 Base map of the study area shown in Figure 9 and geological data sources for the
Dunn County Bakken petrophysical model ......................................................................... 12 11 Model-generated map view of the structure of the middle Bakken in the Dunn County
subplay area based on the top of the middle Bakken .......................................................... 13 12 Model-generated oblique view of the structure of the middle Bakken in the Dunn County
subplay area ......................................................................................................................... 14 13 Model-generated map of average daily oil production from the middle Bakken in the
Dunn County play area overlain with structure to illustrate the potential relationship between the Heart River Fault and areas of higher productivity ......................................... 15
14 Interpreted seismic section showing the two-way travel times for seven reflectors in
southeastern Mountrail County ........................................................................................... 16 15 Estimation of the extent of high formation pressure within the Bakken ............................. 18 16 Original TOC deposition in upper Bakken shale compared to present-day TOC ............... 18 17 TTI for Mountrail and Dunn Counties ................................................................................ 20
Continued . . .
iv
LIST OF FIGURES (continued) 18 Map showing the locations of wells for which samples were provided to the EERC by
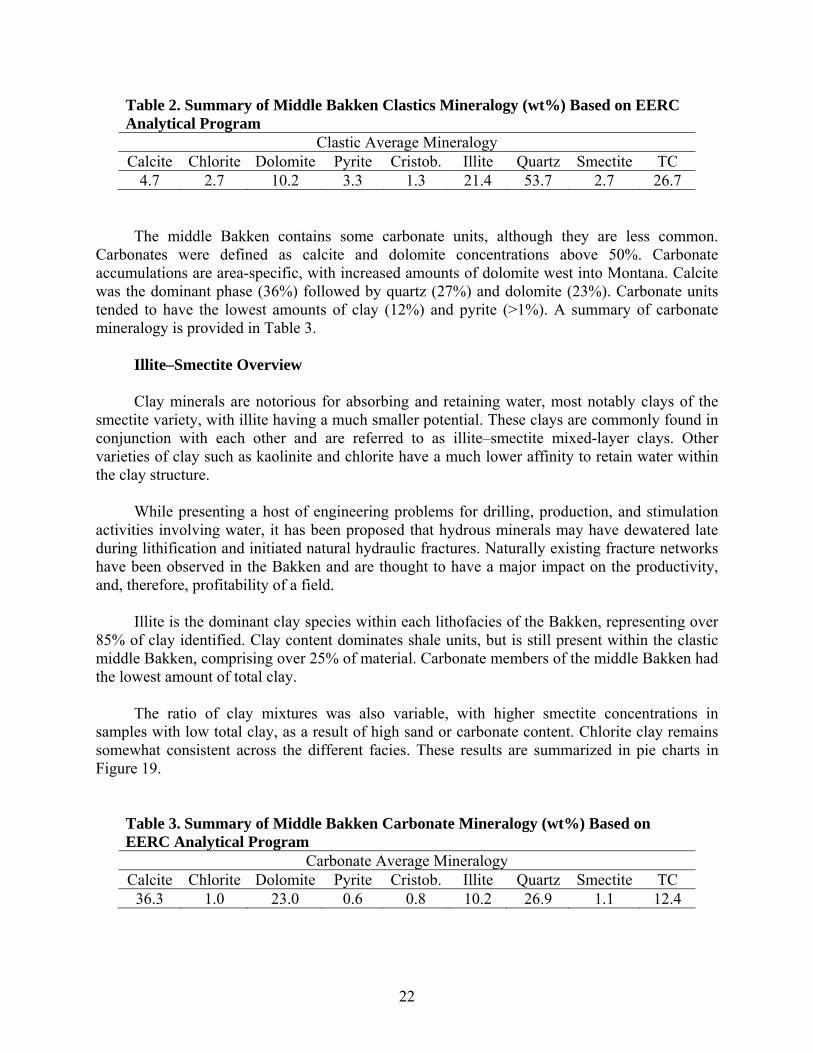
NDGS for geochemical, mineralogical, and petrological analyses ..................................... 21 19 Charts represent the ratio of specific clay minerals to total clay from all
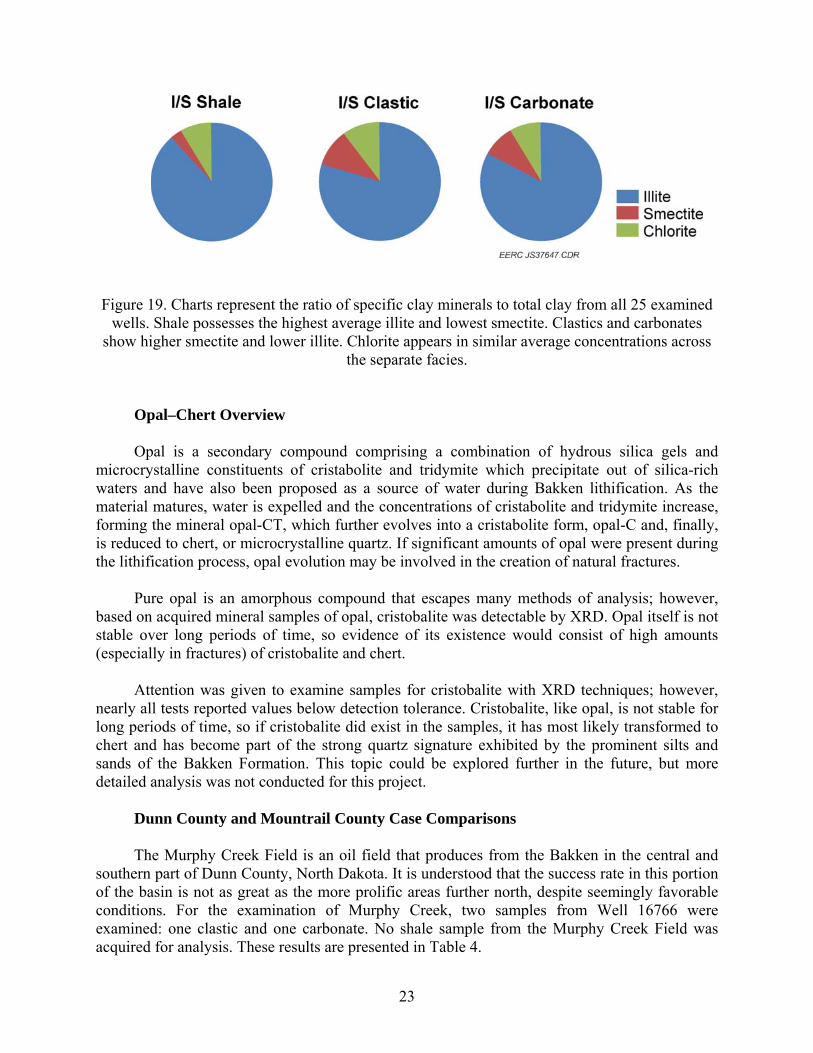
25 examined wells ............................................................................................................... 23 20 Chart representing the ratio of specific clay minerals to total clay from the Murphy Creek
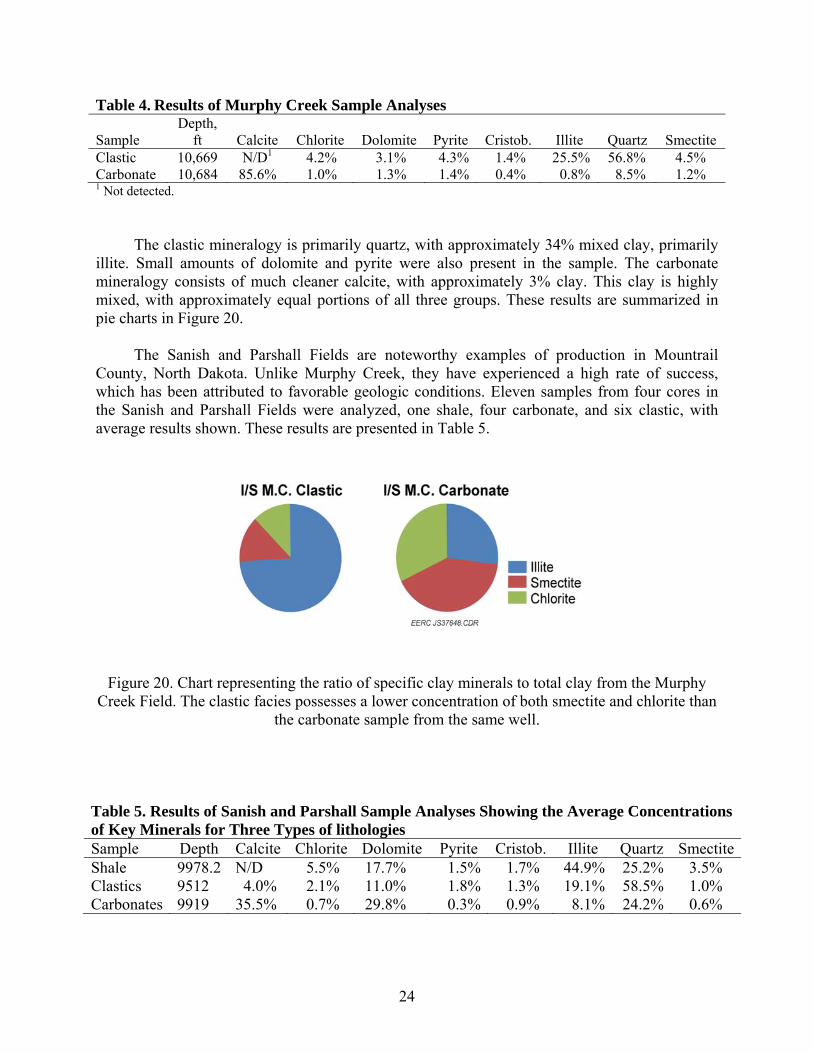
Field ..................................................................................................................................... 24 21 This chart represents the ratio of specific clay minerals to total clay from data averaged
among facies from the Sanish and Parshall Fields .............................................................. 25 22 Map of total clay content in the middle Bakken Formation in northwestern
North Dakota ....................................................................................................................... 26 23 Location of samples selected for geomechanical testing .................................................... 27 24 Example of a CT scan using Core Sample 17023-1 ............................................................ 29 25 Example of a posttest image using Core Sample 17023-1 .................................................. 29 26 Example of a sample (17023-1) after testing ...................................................................... 30 27 In situ static Young’s modulus results ................................................................................ 31 28 Brazil indirect tensile strength results ................................................................................. 32 29 In situ static Poisson’s ratio results ..................................................................................... 32 30 Linear cohesion results ........................................................................................................ 33 31 Friction angle results ........................................................................................................... 33 32 Scanning electron microscopy (SEM) photomicrographs of sand ...................................... 35 33 SEM photomicrographs of sintered bauxite ........................................................................ 35 34 SEM photomicrographs of sand and sintered bauxite ......................................................... 35 35 Sample results from one-dimensional compressive strength testing................................... 36
Continued . . .
v
LIST OF FIGURES (continued) 36 Sample sieve results from sieve testing ............................................................................... 37 37 Generalized depiction of an open-hole completion in the middle Bakken ......................... 39 38 Generalized depiction of a middle Bakken uncemented liner completion .......................... 39 39 Generalized depiction of a cemented liner completion in the middle Bakken .................... 40 40 Generalized wellbore schematic showing the placement of swell packers for a
multistage fracture treatment ............................................................................................... 41 41 Well azimuth distribution .................................................................................................... 42 42 Initial oil production compared to 3-month cumulative production ................................... 43 43 Cumulative oil production for completed horizontal length in Dunn County wells ........... 43 44 Cumulative oil production for completed horizontal length in Mountrail County wells. ... 44 45 Proppant use versus initial production ................................................................................ 45 46 6-month cummulative production versus spud date for Bakken oil-producing wells in Dunn County .......................................................................................................... 46 47 Highest- and lowest-producing wells in Dunn County ....................................................... 47 48 Fracture fluid volumes relative to oil production for Dunn County wells .......................... 48 49 Map of wells in Mountrail County that were evaluated in this project ............................... 49 50 6-month cummulative prodcution versus spud date for Bakken oil-producing wells in eastern Mountrail County ...................................................................................... 50 51 Higher- and lower-producing wells in western Mountrail County ..................................... 51 52 Proppant (sand) totals and production from 640-acre short lateral ..................................... 52 53 Production comparison of long and short lateral wells for west Mountrail County ........... 53 54 Bakken-oriented core stress and fracture analysis .............................................................. 54 55 Costs for various Bakken well completions ........................................................................ 56
vi
LIST OF TABLES 1 Summary of Shale Mineralogy Based on EERC Analytical Program ................................ 21 2 Summary of Middle Bakken Clastics Mineralogy Based on EERC Analytical
Program ............................................................................................................................... 22 3 Summary of Middle Bakken Carbonates Mineralogy Based on EERC Analytical
Program ............................................................................................................................... 22 4 Results of Murphy Creek Sample Analyses ........................................................................ 24 5 Results of Sanish and Parshall Sample Analyses Showing the Average Concentrations
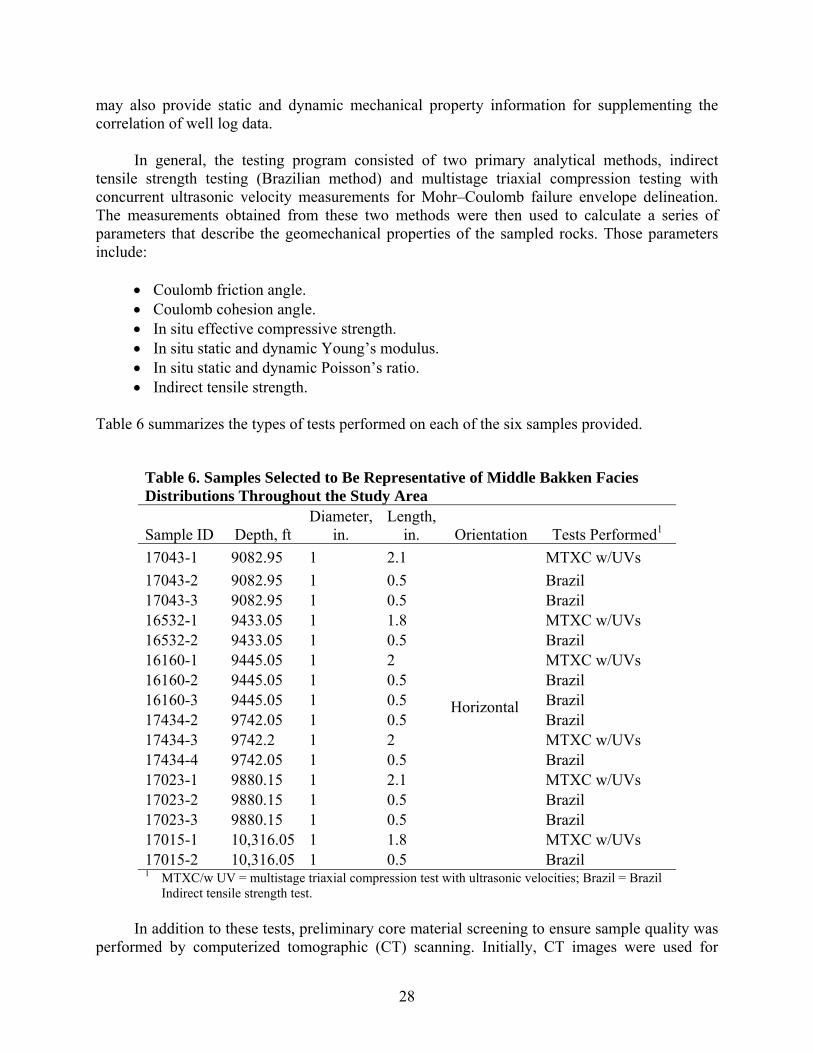
of Key Minerals for Three Types of Lithologies ................................................................ 24 6 Samples Selected to Be Representative of Middle Bakken Facies Distributions
Throughout the Study Area ................................................................................................. 28 7 Summary of Principal Results ............................................................................................. 31 8 Capital Costs Related to Well Configuration Options ........................................................ 55
vii
SUBTASK 1.2 – EVALUATION OF KEY FACTORS AFFECTING SUCCESSFUL OIL PRODUCTION IN THE BAKKEN FORMATION, NORTH DAKOTA
EXECUTIVE SUMMARY
The significance of oil production from the Bakken Formation in North Dakota and the importance of gaining a greater understanding of the technical issues facing its further development can be demonstrated by the recent growth in oil production activity. The Associated Press announced on October 28, 2009, that North Dakota had become the fourth largest producer of oil in the United States, ahead of Louisiana and Oklahoma. Although operators in North Dakota are experiencing success in producing oil from the Bakken, the play is still in the early stages of development at a time when data collection, investigations, and research are vital to improving and optimizing the ultimate production from the resource. As a highly technical play that is limited by low permeability and fracture porosity, greater understanding of formation parameters is paramount to unlocking tightly held hydrocarbons within the reservoir.
The Energy & Environmental Research Center (EERC) has implemented a research
program to bring to the forefront the data that are critical to the efficient development of the Bakken resource. Since October 2008, the EERC has conducted a multidisciplinary research program to identify key attributes of successful Bakken wells and provide technically based guidance to stakeholders regarding future exploitation efforts. The EERC’s Bakken research program has taken a four-pronged approach to evaluate and compare key attributes of the Bakken play in two North Dakota counties, Mountrail and Dunn. Mountrail and Dunn Counties were chosen to be the study area for the project because while some level of success has been seen in both counties, wells in Mountrail County have generally been more prolific producers than those in Dunn County. The premise of the approach for this project was that by comparing key geological and engineering attributes of the two counties, insight would be gained that could improve the productivity of Dunn County wells and/or provide guidance in exploring for and exploiting new subplays. In broad terms, the four topic areas upon which the research program focused are geology, geochemistry, geomechanics, and engineering. Aspects of each of these areas were evaluated and compared between the two counties. The evaluations of various Bakken play parameters were conducted largely through the use of a database of well-drilling, completion, stimulation, and production statistics and information that was created under this project. Also, a variety of laboratory-generated data on the geochemical and mineralogic composition of chip samples from 26 locations and geomechanical properties of core samples from six locations were also developed over the course of the project and applied to the evaluations.
The results of the research activities indicate that a greater understanding of the natural
fracture network system of the Bakken is critical to improving production performance. Optimizing completion practices involving horizontal drilling and fracture stimulation is important to unlocking tightly held reservoir fluids. Horizontal drilling of the middle member of the Bakken coupled with multistage fracturing has outperformed all previously completed Bakken wells in North Dakota. However, geologic influences appear to be dictating the hydrocarbon production rates for given areas within North Dakota that have similar completion
viii
practices. Although more detailed geologic study is required to further support the preliminary conclusions stated, the following trends within the middle Bakken Formation of Dunn and Mountrail County have been identified:
1. Production in Mountrail County greatly exceeds production in Dunn County and has
significantly higher variability.
2. The higher production of Mountrail County appears to be linked to greater total organic carbon (TOC) and shale thicknesses which, together, have the potential to create greater pore pressure-related fracturing.
3. The presence of structural elements, although different in both Dunn and Mountrail County, is consistent with areas of higher production. The influence of these structural elements on the creation of both natural and operationally induced fracture systems may be their major contribution to successful production.
4. Higher production within Dunn County is associated along the Heart River Fault which coincides with an area of high original TOC content.
5. Lithology could potentially play a role in oil mobility, an improved understanding of which may serve to guide the design of stimulation practices and provide insight regarding future exploration efforts.
6. Multistage fracture completions appear to be outperforming lesser-stage completions when compared in proximity. It appears that at least in some areas multistage hydraulic fracturing should improve the chances of greater oil production.
7. Various multilateral wells do not appear to gain significant production advantage despite lower per-foot drilling costs.
8. Well azimuth, although relevant to the direction of principal stress, does not appear to be a factor regarding oil production.
9. Longer lateral wells appear to produce more oil when compared to shorter laterals within proximity.

1
SUBTASK 1.2 – EVALUATION OF KEY FACTORS AFFECTING SUCCESSFUL OIL PRODUCTION IN THE BAKKEN FORMATION, NORTH DAKOTA
INTRODUCTION
The Bakken Formation is known to be an important source rock for oil in the Williston Basin. The formation typically consists of three members: the upper and lower members, comprising shales, and the middle member, comprising dolomitic siltstone and sandstone. Total organic carbon (TOC) within the shales may be as high as 40%, with estimates of total oil in place across the entire Bakken Formation ranging from 10 to 500 billion barrels (Figure 1). While the hydrocarbon resource within the Bakken Formation is tremendous, the Bakken is considered to be an unconventional oil play because it is typically characterized by very low porosity and permeability. Despite its unconventional nature, the significance of oil production from the Bakken Formation in North Dakota and the importance of gaining a greater understanding of the technical issues facing its further development can be demonstrated by the recent growth in oil production activity. The Associated Press announced on October 28, 2009, that North Dakota had become the fourth largest producer of oil in the United States, ahead of Louisiana and Oklahoma, with the top three being Texas, Alaska, and California, respectively. North Dakota produced 7.5 million barrels (242,000 barrels per day [bpd]) in December 2009, which is more than double the amount in December 2006 at 3.6 million barrels (115,000 bpd). Recent forecasts predict production in 2011 to range from 300,000–400,000 bpd and to remain at this level for 10 to 15 years (1). This forecast was raised from a previous forecast of
Figure 1. Historical estimates of Bakken oil resources.
2
280,000 bpd and is based on the success of the middle Bakken and Three Forks–Sanish plays, which are both believed to be sourced from Bakken shales.
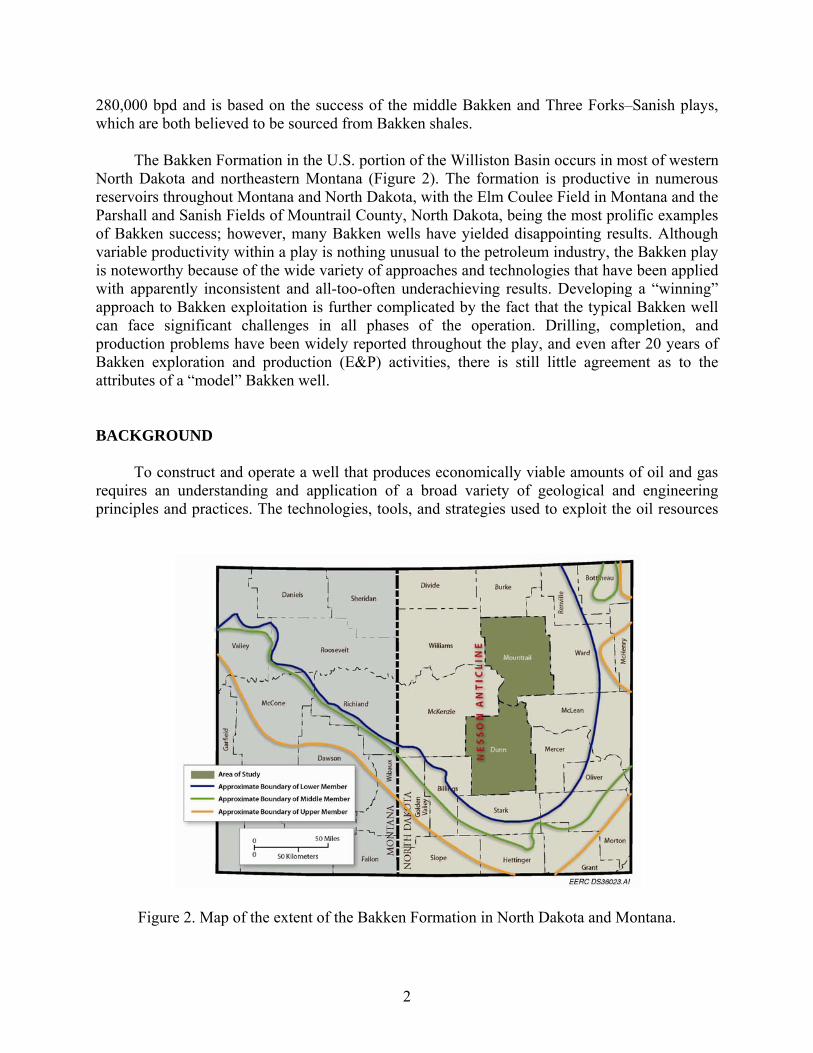
The Bakken Formation in the U.S. portion of the Williston Basin occurs in most of western North Dakota and northeastern Montana (Figure 2). The formation is productive in numerous reservoirs throughout Montana and North Dakota, with the Elm Coulee Field in Montana and the Parshall and Sanish Fields of Mountrail County, North Dakota, being the most prolific examples of Bakken success; however, many Bakken wells have yielded disappointing results. Although variable productivity within a play is nothing unusual to the petroleum industry, the Bakken play is noteworthy because of the wide variety of approaches and technologies that have been applied with apparently inconsistent and all-too-often underachieving results. Developing a “winning” approach to Bakken exploitation is further complicated by the fact that the typical Bakken well can face significant challenges in all phases of the operation. Drilling, completion, and production problems have been widely reported throughout the play, and even after 20 years of Bakken exploration and production (E&P) activities, there is still little agreement as to the attributes of a “model” Bakken well. BACKGROUND
To construct and operate a well that produces economically viable amounts of oil and gas requires an understanding and application of a broad variety of geological and engineering principles and practices. The technologies, tools, and strategies used to exploit the oil resources
Figure 2. Map of the extent of the Bakken Formation in North Dakota and Montana.

3
of any oil and/or gas play are largely dependent on the geological and geomechanical characteristics of the target reservoir formation and cap rock. Key geological characteristics include stratigraphy, lithology, and structure. The Bakken Formation has been known to be hydrocarbon-bearing in the Williston Basin since the 1950s, with each decade since the 1970s seeing periods of interest among oil producers as oil recovery strategies and technologies evolved. As such, the stratigraphic, lithological, and structural characteristics of the Bakken Formation in North Dakota have been the subject of many studies.
With respect to stratigraphy, the Devonian–Mississippian-aged Bakken Formation in the Williston Basin is typically composed of three members: the upper, middle, and lower Bakken (Figure 3). Lithologically, the upper and lower members of the Bakken are dominated by shales rich in organic carbon that act as the source rock for oil reservoirs in the middle Bakken. The lithology of the middle Bakken varies widely from clastics (including shales, silts, and sandstones) to carbonates (primarily dolomites), with five distinct lithofacies being identified in the North Dakota portion of the Williston Basin. In general, all of these rocks are characterized by low porosity and permeability (2). With respect to structure, the Williston Basin is
Figure 3. Stratigraphic column for rocks of the Williston Basin in North Dakota and generalized stratigraphy of the Bakken Formation in North Dakota.
4
characterized by relatively few and subtle structural features (3). The Nesson Anticline in northwestern North Dakota is the dominant tectonic structural feature in the area of North Dakota Bakken productivity, and while the most prolific Bakken reservoirs in North Dakota are not on the Nesson Anticline, it may have some degree of influence on Bakken productivity. Smaller structures that are likely associated with salt collapse features also occur in North Dakota and may exert some influence on the productivity of some Bakken reservoirs (4). These structures may not only serve as traps for oil within the Bakken, but may also exert influence on the stress and strain fields that affect the geomechanical properties of the Bakken. The geomechanical properties of the various Bakken members and lithofacies are a key component in their ability to serve as productive oil reservoirs, as those properties will dictate the size, frequency, pattern, and orientation of fracture networks (natural and artificial) at both the micro- and macroscale.
In general, approaches to the selection of exploitation strategies and application of technologies and tools for the drilling, completion, and stimulation of wells in the Bakken play have been largely dictated by knowledge (or lack thereof) of lithology, structure, and geomechanical properties within a localized area. A vast majority of Bakken wells in the last several years have been drilled horizontally into the middle member where geology is thought to be most favorable (e.g., areas of relatively higher porosity and permeability). Ideally, wells are drilled in a manner that maximizes contact with natural fractures and maximizes drainage from the entire potential “pay” zone. A wide variety of well drilling and completion techniques have been applied to the Bakken play, with disparate results and varying degrees of success. For most Bakken wells, the use of hydraulic fracturing is critical to establishing long-term productivity.
Current approaches to economically and sustainably produce oil from the Bakken rely
heavily, in one way or another, on exploiting natural fracture networks and/or artificially enhancing those networks or creating new ones. The positive aspects of fractures include the fact that they enhance existing porosity and permeability. This is very important in the Bakken because it is typically characterized by low matrix porosity and permeability, and therefore, it is the fracture network that will provide a bulk of the production pathway. This is especially true in the shale lithofacies. Fractures also facilitate or provide a conduit for oil from the reservoir to the borehole, thereby yielding higher production rates. However, the presence of fractures can also lead to borehole stability problems. Careless drilling and completion operations that do not account for the presence and orientation of fractures can increase the potential for damage to microfractures. This can be caused by the use of overbalanced muds, rapid pressure drawdown (producing too much, too fast), and water blocking (this is caused in areas where the Bakken is oil-wet). With these positive and negative aspects of fractures in mind, it is critical that the influence of natural fracture systems and the geomechanical properties affecting those systems, on the direction of fracture stimulation treatment be considered when designing and executing drilling, completion, and stimulation programs in the Bakken.
Over the past decades, hundreds of wells have been drilled in the Bakken Formation in a
search for oil that has produced widely variable results. The fact that many wells have been very successful, some even producing oil at world-class rates, demonstrates that the Bakken Formation is a tremendous source of oil. Unfortunately, many more wells have seen less successful results. While such inconsistency is not unusual in the world of oil and gas E&P, the
5
deep and tight nature of the Bakken Formation in the Williston Basin makes it a very expensive target for E&P. The inconsistency associated with the Bakken play coupled with the high costs associated with Bakken E&P have limited its exploitation. The research activities conducted over the course of this project are valuable because, while it is clear that geologic characteristics and geomechanical properties are the primary factors controlling the sustainable productivity of any given well, the Bakken is extremely heterogeneous with respect to its geological characteristics, and its geomechanical properties are not well understood (5). A robust, systematic scientific and engineering research effort can play a vital role in overcoming these challenges and unlocking the vast resource potential of the Bakken Formation in the Williston Basin. APPROACH
Since October 2008, the Energy & Environmental Research Center (EERC) has conducted a multidisciplinary research program to identify key attributes of successful Bakken wells and provide technically based guidance to stakeholders regarding future exploitation efforts. The EERC’s Bakken research program has taken a four-pronged approach to evaluate and compare key attributes of the Bakken play in two North Dakota counties, Mountrail and Dunn. The Bakken in each of these counties has relatively unique qualities, and for the purposes of this report, they may be considered to be subplays of the larger Bakken play. In broad terms, the four topic areas of the research program are geology, geochemistry, geomechanics, and engineering and aspects of each of these areas were evaluated and compared between the two subplays. The four focal areas of the project are briefly described below:
• With respect to geology, a broad range of published papers, publicly available technical presentations, and previously unavailable seismic survey data reviewed by the North Dakota Geological Survey (NDGS) were used to identify and evaluate geological characteristics that are likely to control the movement and production of oil. Geological elements that were examined in detail include structure, stratigraphy, lithofacies, pore pressure, and total organic carbon.
• Bakken samples from 26 wells were examined using x-ray fluorescence, x-ray
diffraction (XRD), and scanning microprobe techniques to evaluate selected geochemistry and petrological parameters across the study area, with an emphasis on clays (smectite and illite), TOC, and carbonates.
• Geomechanical testing of six samples of the middle Bakken were conducted to gain
improved understanding of factors that may control the creation of natural and artificially induced micro- and macrofracture networks.
• The evaluations of engineering elements for the Mountrail and Dunn subplays were
based on well file data from both publicly available and proprietary sources. These data provided information on drilling, completion, stimulation, and production from over 200 wells in the two counties.
6
Mountrail and Dunn Counties were chosen to be the study area for the project because while some level of success has been seen in both counties, wells in Mountrail County have generally been significantly more prolific producers than those in Dunn County. The premise of the approach for this project was that by comparing key geological and engineering attributes of the two subplays, insight would be gained that could improve the productivity of Dunn County wells and/or provide guidance in exploring for and exploiting the next subplay.
The project work plan comprised four activities: Activity 1 – Analysis of Well File Data; Activity 2 – Seismic Data Study, Petrophysical Modeling, and Geomechanical Testing; Activity 3 – Geochemical Studies; and Activity 4 – Technology Transfer. While the activities were organized and conducted in this manner, this report has been organized to first present the results of the project in terms of the four focal areas—geology, geochemistry, geomechanics, and engineering—followed by discussion of selected results that bring two or more areas together. These later discussions will provide stakeholders with a more holistic interpretation of the various data sets with an eye toward illustrating potential important relationships between attributes. BASIS OF EVALUATIONS
The evaluations conducted over the course of this project and discussed in this report are based on data and technical information gathered from professional papers, technical presentations at conferences and workshops, publicly available well files, and confidential well files of a major oil company operating in the study area. The technical papers and presentations used in this project were published by professional geoscience and petroleum engineering organizations including the Society of Petroleum Engineers, American Association of Petroleum Geologists, U.S. Geological Survey, and NDGS. The publicly available well files were obtained from the North Dakota Department of Mineral Resources – Oil and Gas Division (NDDMR–OGD) subscription-based Web site. The confidential data sets were provided by an operating company. The specific wells and associated data for which confidential data were included in the evaluations are not specifically identified in this report in order to maintain the confidentiality of the company and the data.
From these data sources, the EERC created a database with information on 232 wells
completed in the Bakken, with spud dates ranging from July 2005 to March 2009. The vast majority of data come from wells completed in 2007–2008 in Mountrail and Dunn Counties. The database provides a means to compare available information from well file and other data to identify developmental trends of the Bakken resource in those two counties. The objectives of the evaluation include identification of trends to provide:
• A better understanding of applied techniques. • An ability for operators and regulators to utilize historical support for future operations. • An ability to compare past results.
7
• Insight into drilling, completion, and stimulation practices.
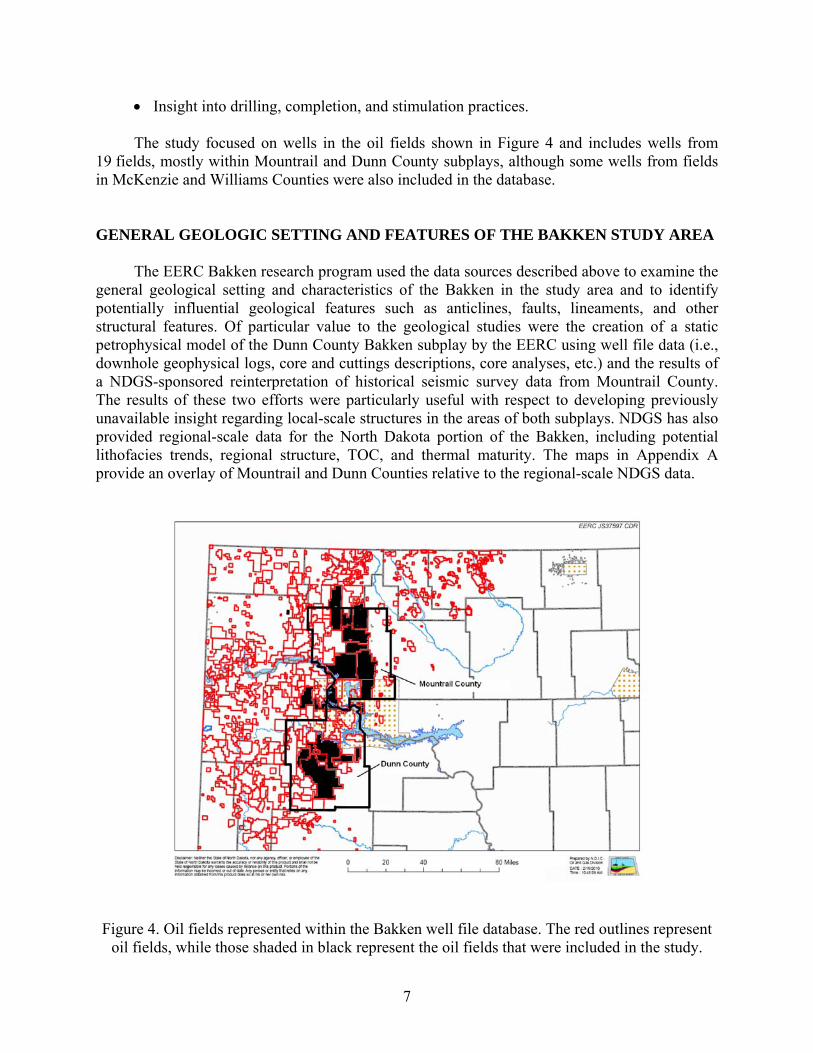
The study focused on wells in the oil fields shown in Figure 4 and includes wells from 19 fields, mostly within Mountrail and Dunn County subplays, although some wells from fields in McKenzie and Williams Counties were also included in the database.
GENERAL GEOLOGIC SETTING AND FEATURES OF THE BAKKEN STUDY AREA
The EERC Bakken research program used the data sources described above to examine the general geological setting and characteristics of the Bakken in the study area and to identify potentially influential geological features such as anticlines, faults, lineaments, and other structural features. Of particular value to the geological studies were the creation of a static petrophysical model of the Dunn County Bakken subplay by the EERC using well file data (i.e., downhole geophysical logs, core and cuttings descriptions, core analyses, etc.) and the results of a NDGS-sponsored reinterpretation of historical seismic survey data from Mountrail County. The results of these two efforts were particularly useful with respect to developing previously unavailable insight regarding local-scale structures in the areas of both subplays. NDGS has also provided regional-scale data for the North Dakota portion of the Bakken, including potential lithofacies trends, regional structure, TOC, and thermal maturity. The maps in Appendix A provide an overlay of Mountrail and Dunn Counties relative to the regional-scale NDGS data.
Figure 4. Oil fields represented within the Bakken well file database. The red outlines represent
oil fields, while those shaded in black represent the oil fields that were included in the study.
8
Lithofacies of the Middle Bakken Member
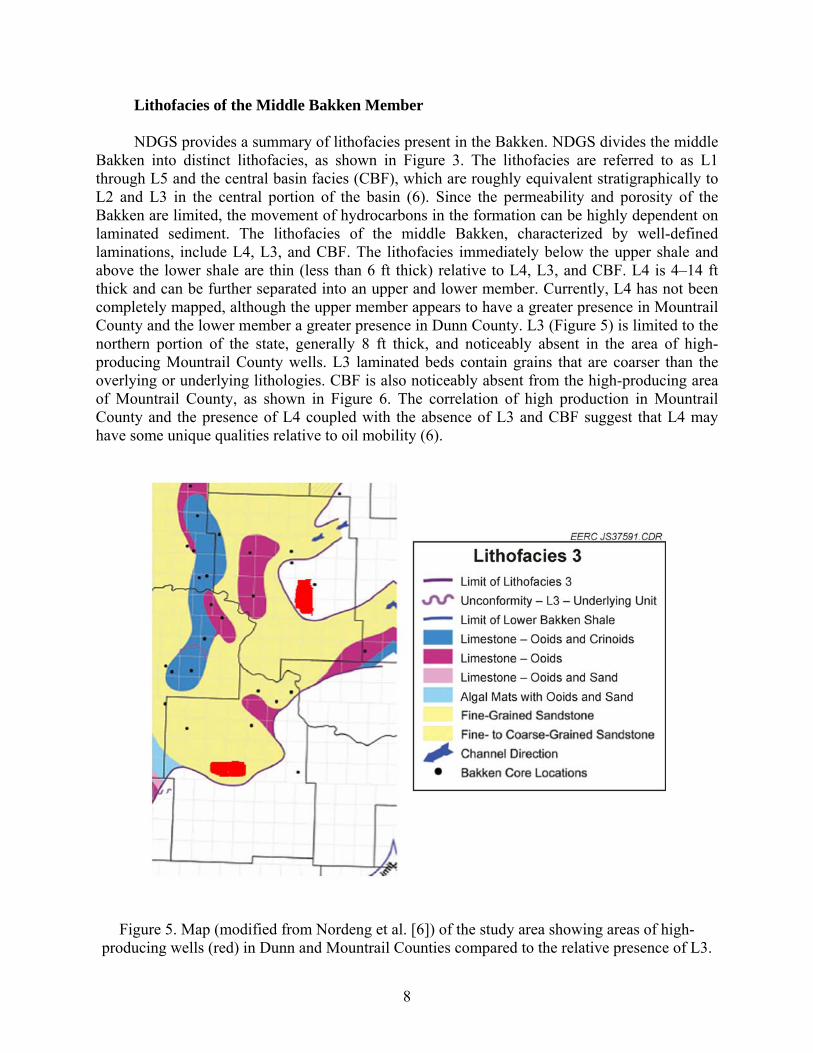
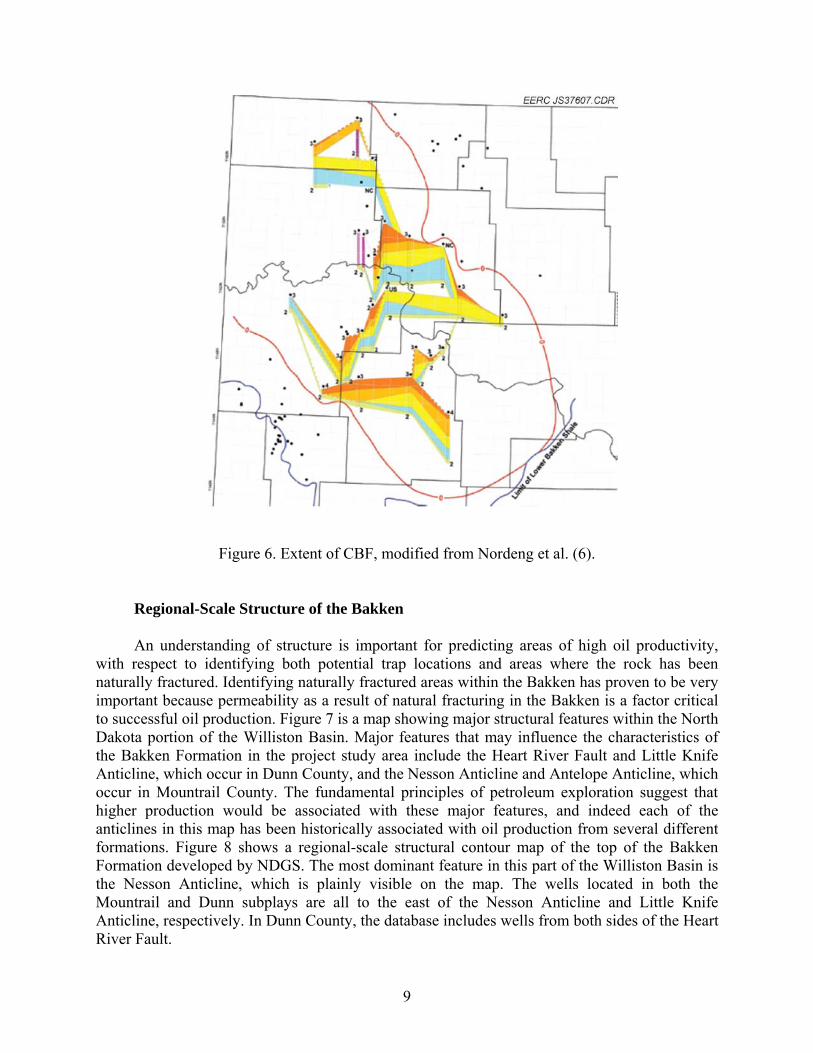
NDGS provides a summary of lithofacies present in the Bakken. NDGS divides the middle Bakken into distinct lithofacies, as shown in Figure 3. The lithofacies are referred to as L1 through L5 and the central basin facies (CBF), which are roughly equivalent stratigraphically to L2 and L3 in the central portion of the basin (6). Since the permeability and porosity of the Bakken are limited, the movement of hydrocarbons in the formation can be highly dependent on laminated sediment. The lithofacies of the middle Bakken, characterized by well-defined laminations, include L4, L3, and CBF. The lithofacies immediately below the upper shale and above the lower shale are thin (less than 6 ft thick) relative to L4, L3, and CBF. L4 is 4–14 ft thick and can be further separated into an upper and lower member. Currently, L4 has not been completely mapped, although the upper member appears to have a greater presence in Mountrail County and the lower member a greater presence in Dunn County. L3 (Figure 5) is limited to the northern portion of the state, generally 8 ft thick, and noticeably absent in the area of high-producing Mountrail County wells. L3 laminated beds contain grains that are coarser than the overlying or underlying lithologies. CBF is also noticeably absent from the high-producing area of Mountrail County, as shown in Figure 6. The correlation of high production in Mountrail County and the presence of L4 coupled with the absence of L3 and CBF suggest that L4 may have some unique qualities relative to oil mobility (6).
Figure 5. Map (modified from Nordeng et al. [6]) of the study area showing areas of high-producing wells (red) in Dunn and Mountrail Counties compared to the relative presence of L3.
9
Figure 6. Extent of CBF, modified from Nordeng et al. (6).
Regional-Scale Structure of the Bakken
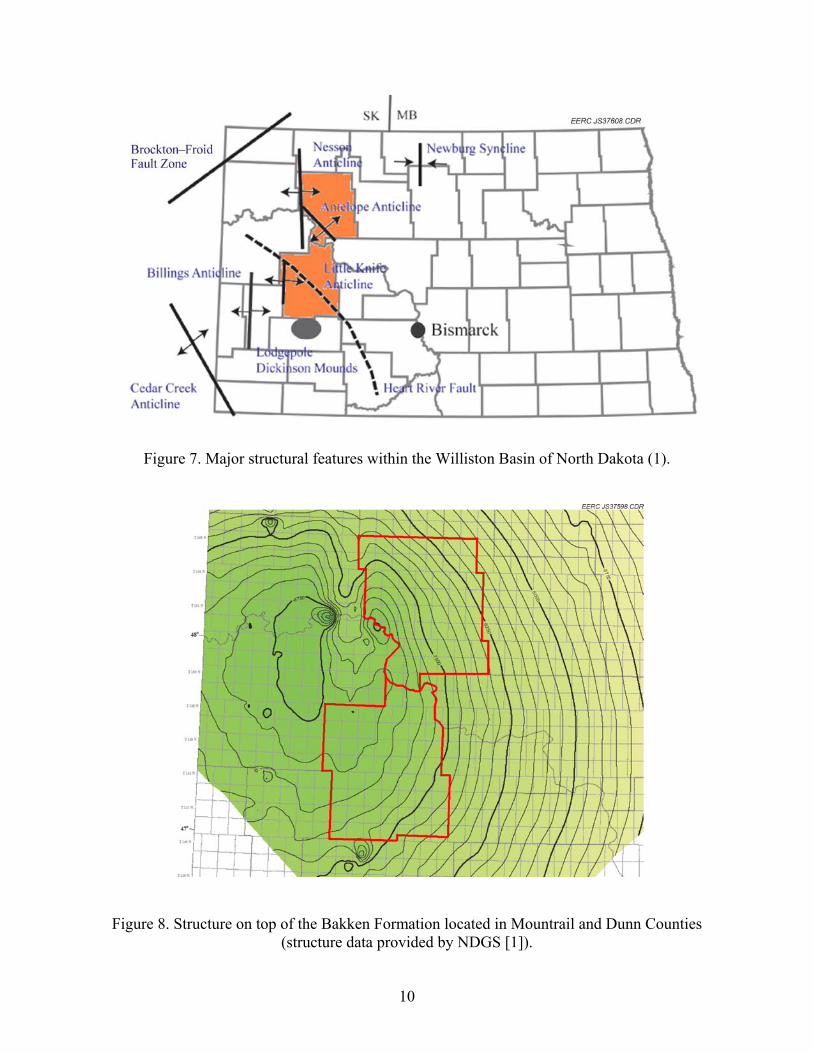
An understanding of structure is important for predicting areas of high oil productivity, with respect to identifying both potential trap locations and areas where the rock has been naturally fractured. Identifying naturally fractured areas within the Bakken has proven to be very important because permeability as a result of natural fracturing in the Bakken is a factor critical to successful oil production. Figure 7 is a map showing major structural features within the North Dakota portion of the Williston Basin. Major features that may influence the characteristics of the Bakken Formation in the project study area include the Heart River Fault and Little Knife Anticline, which occur in Dunn County, and the Nesson Anticline and Antelope Anticline, which occur in Mountrail County. The fundamental principles of petroleum exploration suggest that higher production would be associated with these major features, and indeed each of the anticlines in this map has been historically associated with oil production from several different formations. Figure 8 shows a regional-scale structural contour map of the top of the Bakken Formation developed by NDGS. The most dominant feature in this part of the Williston Basin is the Nesson Anticline, which is plainly visible on the map. The wells located in both the Mountrail and Dunn subplays are all to the east of the Nesson Anticline and Little Knife Anticline, respectively. In Dunn County, the database includes wells from both sides of the Heart River Fault.
10
Figure 7. Major structural features within the Williston Basin of North Dakota (1).
Figure 8. Structure on top of the Bakken Formation located in Mountrail and Dunn Counties
(structure data provided by NDGS [1]).
11
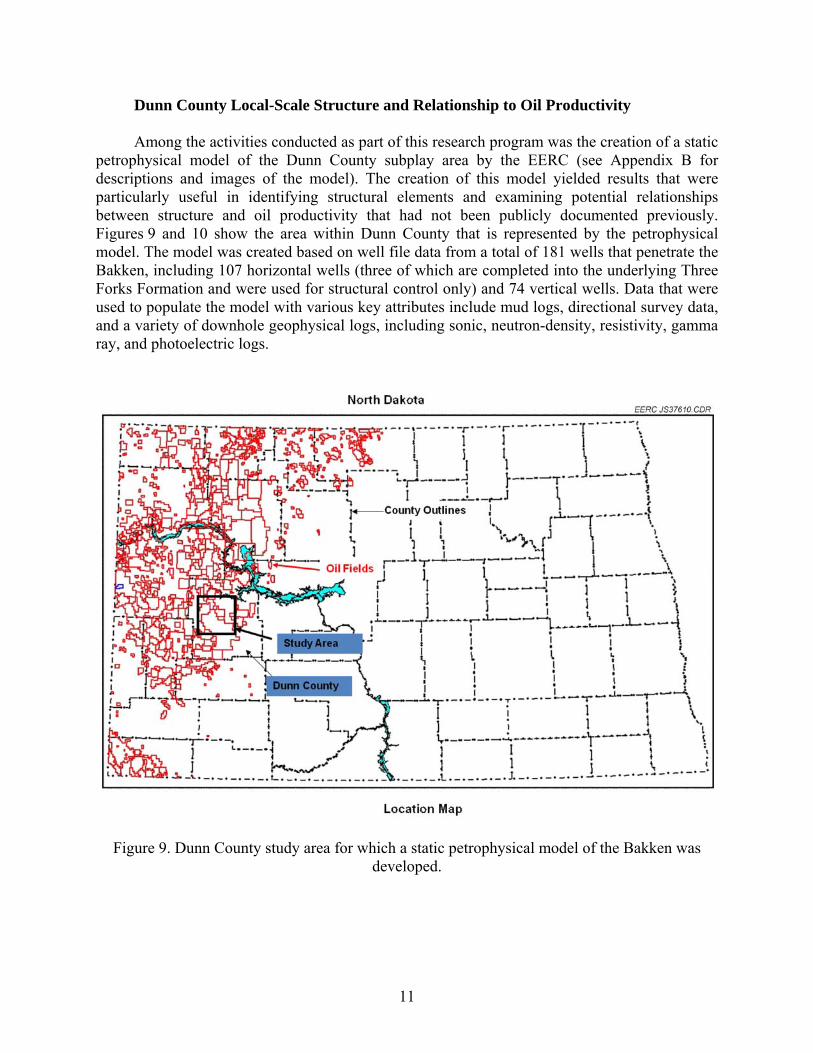
Dunn County Local-Scale Structure and Relationship to Oil Productivity
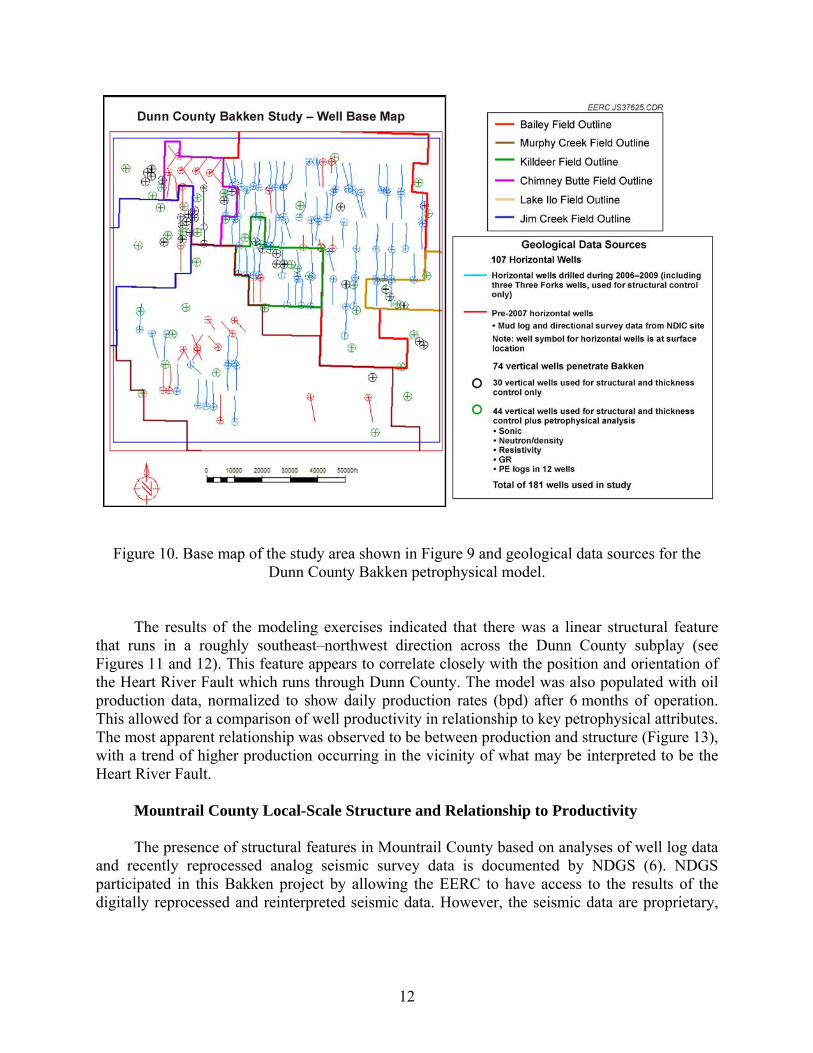
Among the activities conducted as part of this research program was the creation of a static petrophysical model of the Dunn County subplay area by the EERC (see Appendix B for descriptions and images of the model). The creation of this model yielded results that were particularly useful in identifying structural elements and examining potential relationships between structure and oil productivity that had not been publicly documented previously. Figures 9 and 10 show the area within Dunn County that is represented by the petrophysical model. The model was created based on well file data from a total of 181 wells that penetrate the Bakken, including 107 horizontal wells (three of which are completed into the underlying Three Forks Formation and were used for structural control only) and 74 vertical wells. Data that were used to populate the model with various key attributes include mud logs, directional survey data, and a variety of downhole geophysical logs, including sonic, neutron-density, resistivity, gamma ray, and photoelectric logs.
Figure 9. Dunn County study area for which a static petrophysical model of the Bakken was developed.
12
Figure 10. Base map of the study area shown in Figure 9 and geological data sources for the
Dunn County Bakken petrophysical model.
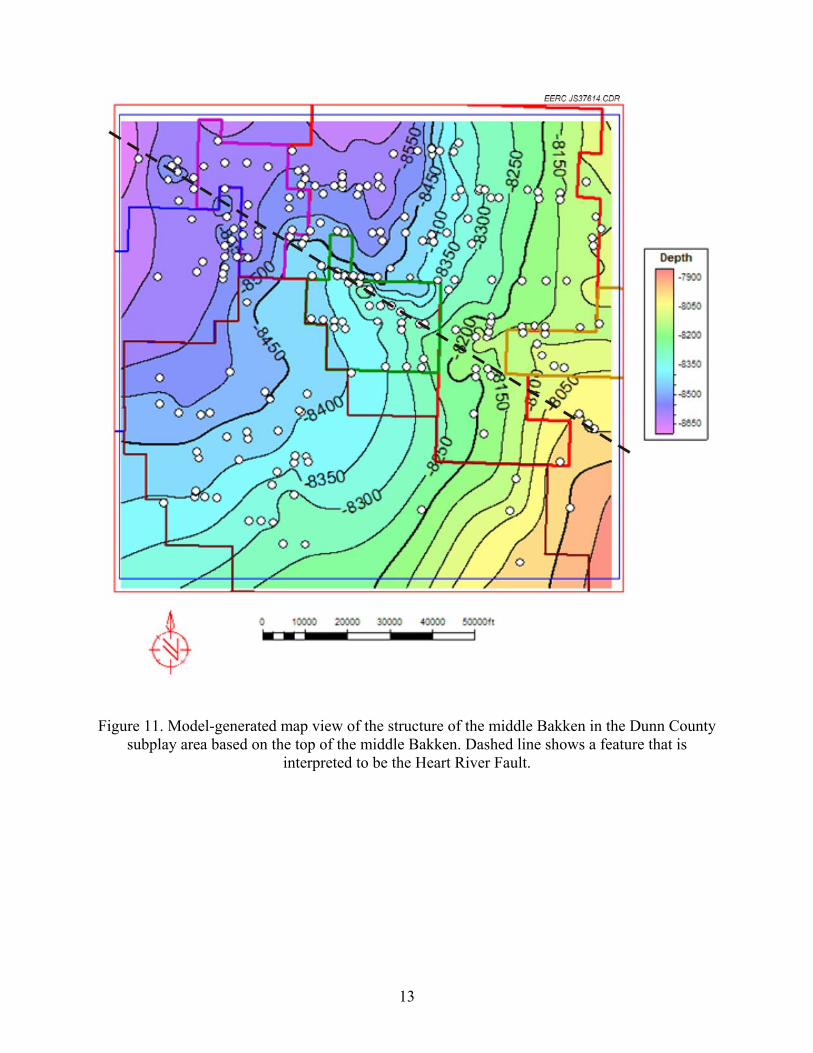
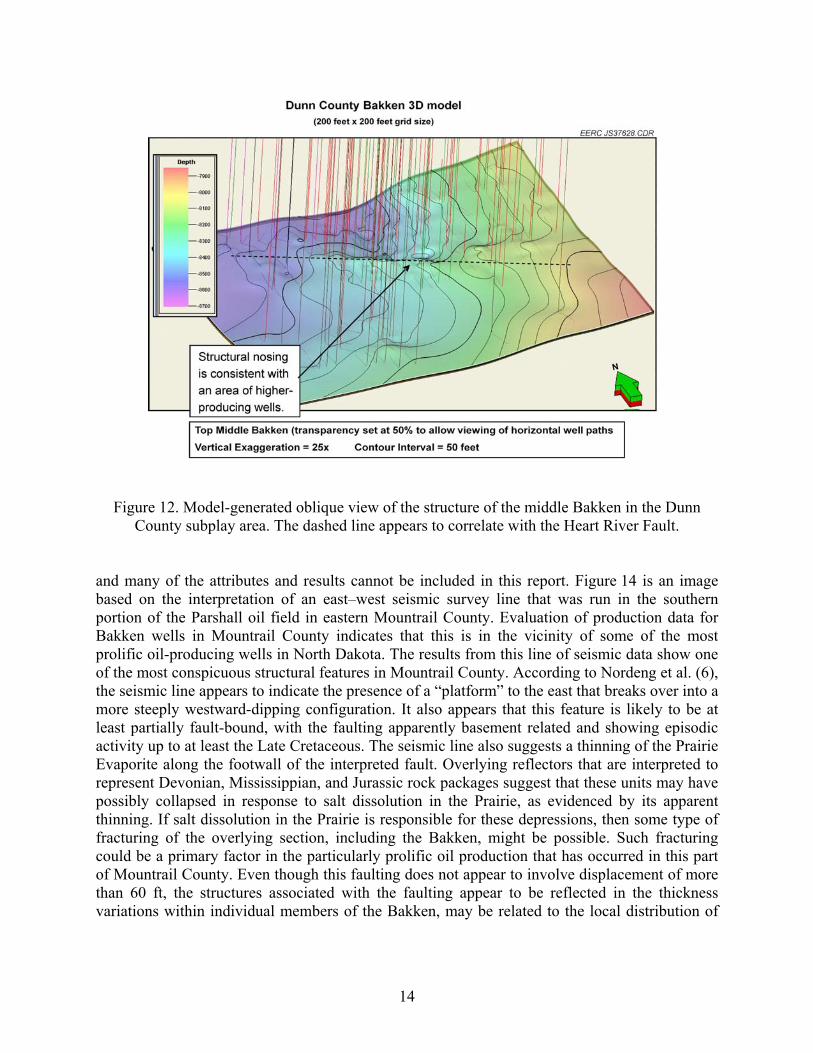
The results of the modeling exercises indicated that there was a linear structural feature that runs in a roughly southeast–northwest direction across the Dunn County subplay (see Figures 11 and 12). This feature appears to correlate closely with the position and orientation of the Heart River Fault which runs through Dunn County. The model was also populated with oil production data, normalized to show daily production rates (bpd) after 6 months of operation. This allowed for a comparison of well productivity in relationship to key petrophysical attributes. The most apparent relationship was observed to be between production and structure (Figure 13), with a trend of higher production occurring in the vicinity of what may be interpreted to be the Heart River Fault.
Mountrail County Local-Scale Structure and Relationship to Productivity
The presence of structural features in Mountrail County based on analyses of well log data
and recently reprocessed analog seismic survey data is documented by NDGS (6). NDGS participated in this Bakken project by allowing the EERC to have access to the results of the digitally reprocessed and reinterpreted seismic data. However, the seismic data are proprietary,
13
Figure 11. Model-generated map view of the structure of the middle Bakken in the Dunn County
subplay area based on the top of the middle Bakken. Dashed line shows a feature that is interpreted to be the Heart River Fault.
14
Figure 12. Model-generated oblique view of the structure of the middle Bakken in the Dunn County subplay area. The dashed line appears to correlate with the Heart River Fault.
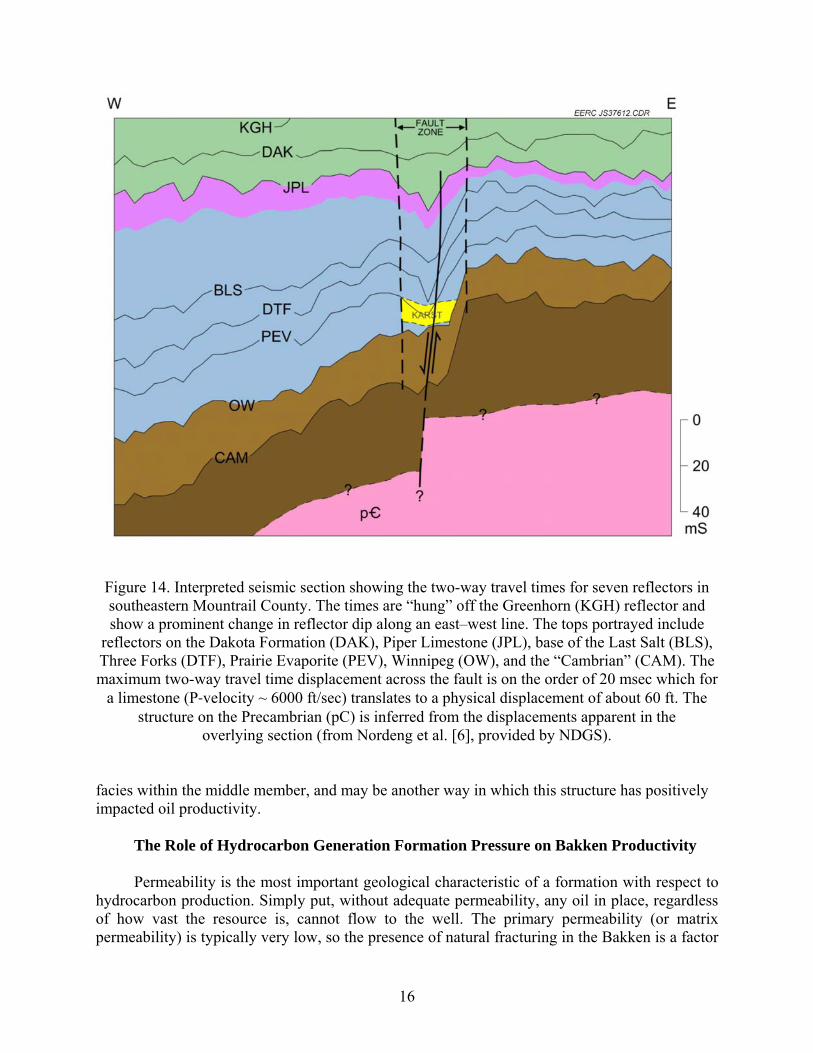
and many of the attributes and results cannot be included in this report. Figure 14 is an image based on the interpretation of an east–west seismic survey line that was run in the southern portion of the Parshall oil field in eastern Mountrail County. Evaluation of production data for Bakken wells in Mountrail County indicates that this is in the vicinity of some of the most prolific oil-producing wells in North Dakota. The results from this line of seismic data show one of the most conspicuous structural features in Mountrail County. According to Nordeng et al. (6), the seismic line appears to indicate the presence of a “platform” to the east that breaks over into a more steeply westward-dipping configuration. It also appears that this feature is likely to be at least partially fault-bound, with the faulting apparently basement related and showing episodic activity up to at least the Late Cretaceous. The seismic line also suggests a thinning of the Prairie Evaporite along the footwall of the interpreted fault. Overlying reflectors that are interpreted to represent Devonian, Mississippian, and Jurassic rock packages suggest that these units may have possibly collapsed in response to salt dissolution in the Prairie, as evidenced by its apparent thinning. If salt dissolution in the Prairie is responsible for these depressions, then some type of fracturing of the overlying section, including the Bakken, might be possible. Such fracturing could be a primary factor in the particularly prolific oil production that has occurred in this part of Mountrail County. Even though this faulting does not appear to involve displacement of more than 60 ft, the structures associated with the faulting appear to be reflected in the thickness variations within individual members of the Bakken, may be related to the local distribution of

15
Figure 13. Model-generated map of average daily oil production from the middle Bakken in the Dunn County play area overlain with structure to illustrate the potential relationship between the
Heart River Fault and areas of higher productivity.
16
Figure 14. Interpreted seismic section showing the two-way travel times for seven reflectors in southeastern Mountrail County. The times are “hung” off the Greenhorn (KGH) reflector and show a prominent change in reflector dip along an east–west line. The tops portrayed include
reflectors on the Dakota Formation (DAK), Piper Limestone (JPL), base of the Last Salt (BLS), Three Forks (DTF), Prairie Evaporite (PEV), Winnipeg (OW), and the “Cambrian” (CAM). The maximum two-way travel time displacement across the fault is on the order of 20 msec which for
a limestone (P‐velocity ~ 6000 ft/sec) translates to a physical displacement of about 60 ft. The structure on the Precambrian (pC) is inferred from the displacements apparent in the
overlying section (from Nordeng et al. [6], provided by NDGS).
facies within the middle member, and may be another way in which this structure has positively impacted oil productivity.
The Role of Hydrocarbon Generation Formation Pressure on Bakken Productivity
Permeability is the most important geological characteristic of a formation with respect to hydrocarbon production. Simply put, without adequate permeability, any oil in place, regardless of how vast the resource is, cannot flow to the well. The primary permeability (or matrix permeability) is typically very low, so the presence of natural fracturing in the Bakken is a factor

17
that is critical to oil production. The two prevailing theories that explain how natural fractures occur in the Bakken include fracturing as a result of structural flexures, such as those that have been discussed above, and fracturing caused from internal pressures that build up during oil generation. It is well understood that the Bakken is an overpressured reservoir (6) and that the high pore pressures can influence production and oil migration.
Meissner (7) attributes abnormally high pressures in the Bakken to oil maturation and
subsequent source rock compaction. In a 2001 study of diagenesis and fracture development of the middle Bakken (2), Pittman concluded the following:
“Most oil in the Bakken petroleum system resides in open, horizontal (bedding-parallel) fractures and in secondary microporosity adjacent to fractures, with only small amounts dispersed in matrix pores. Horizontal fractures form a pervasive network in deeply buried reservoir rocks with high residual oil saturations, but they are generally absent in shallowly buried rocks with little to no residual oil. These fractures resulted from superlithostatic pressures that formed in response to increased fluid volumes in the source rocks during hydrocarbon generation. Unlike mineralized fractures that are incapable of transmitting fluids, porous and permeable horizontal fractures serve to focus hydrocarbon fluids and, locally, enhance the quality of oil reservoirs at depth.”
Additionally, the degree of abnormal pressures and the extent of fracturing with oil
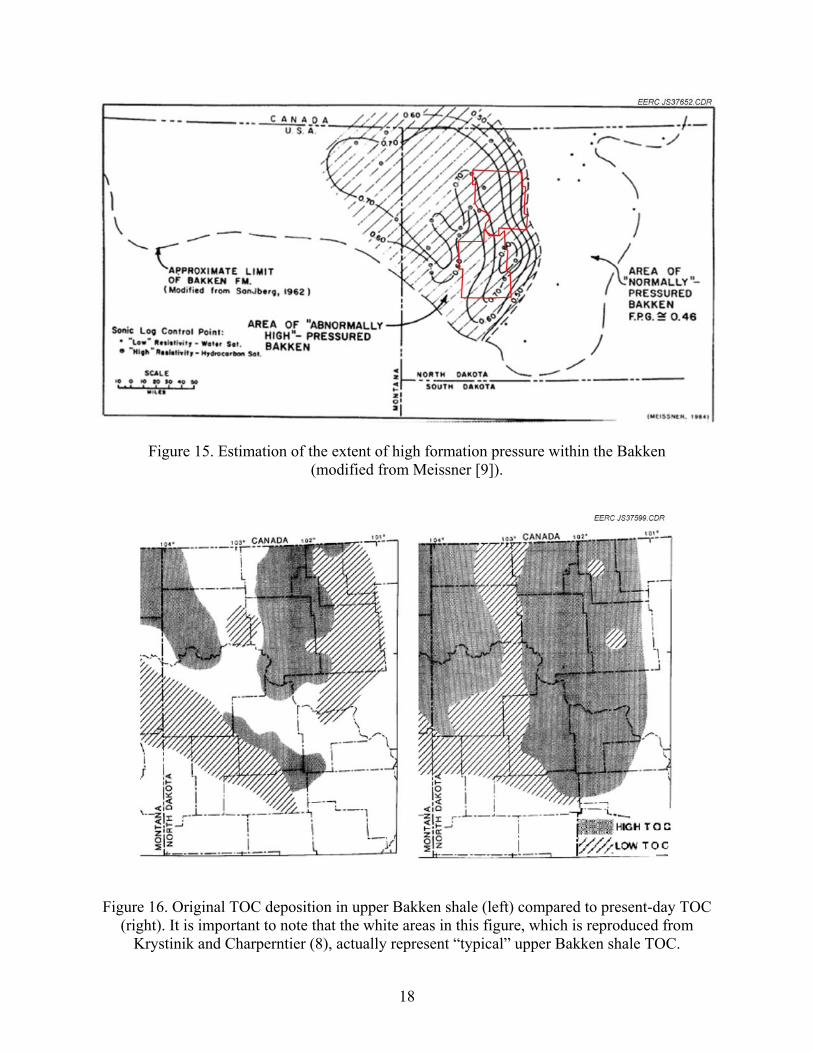
migration are explained to be a function of organic richness, thickness, and maturity of the upper and lower shales. Strata associated with thick, mature shales typically have more fractures than reservoir rocks associated with thin, mature shales (2). Therefore, it could be possible to draw a correlation between shale thickness, maturity, organic richness, and formation pressure to explain differences in current Bakken production trends. Figure 15 provides an estimation of formation pressures of the Bakken relative to Mountrail and Dunn Counties and shows a generally higher formation pressure for Mountrail County, which would be consistent with the higher oil production of Mountrail County. Mud weights analyzed from well files provided an average mud weight used in Dunn County <10 ppg and >11.5 ppg used in Mountrail County, which supports the idea of higher pore pressures in Mountrail leading to greater production volumes.
With respect to the distribution of organic richness within the shales, Krystinik and
Charperntier (8) mapped the pattern for the original deposition of organic material for the upper Bakken shale prior to effects from maturation, lithostatic pressure, and tectonic stresses. The difference in original versus present-day TOC content is believed to be related to hydrocarbon maturity. The data may provide insight regarding the potential occurrence and distribution of microfractures in the middle Bakken and, possibly, even oil migration patterns. The original TOC deposition indicated in Figure 16 for Dunn County appears to correlate to the same location trend of higher-producing wells that was identified in the study of formation structure (i.e., along the Heart River Fault). The original TOC deposition in Mountrail County is more widespread and cannot be specifically correlated to the location of higher oil production. The areas absent of high original deposited TOC in Dunn are many more than in Mountrail and do correlate with the greater overall production in Mountrail County versus Dunn County.
18
Figure 15. Estimation of the extent of high formation pressure within the Bakken (modified from Meissner [9]).
Figure 16. Original TOC deposition in upper Bakken shale (left) compared to present-day TOC
(right). It is important to note that the white areas in this figure, which is reproduced from Krystinik and Charperntier (8), actually represent “typical” upper Bakken shale TOC.
19
Another perspective on the maturity of the bounding shale members of the Bakken is provided by an investigation by NDGS that was focused on developing regional distributions of time–temperature index (TTI), TOC content, and hydrogen index for North Dakota (10). The TTI is a measure of the hydrocarbon generation potential for source rocks, taking into account the burial history. The method assumes that the hydrocarbon generation rate doubles for every 10°C rise in temperature and the rate accumulates with time. Therefore, source rocks that experience lower temperatures over extended periods of time would have the same generation rate of source rocks at higher temperatures for shorter times. A separate measure of hydrocarbon-generating potential is through Rock Eval analysis. Rock Eval pyrolysis is used to identify the type and maturity of organic matter and to detect petroleum potential in sediments. The Rock Eval pyrolysis method consists of programmed temperature heating (in a pyrolysis oven) of a small sample (~100 mg) in an inert atmosphere (helium) to quantitatively and selectively determine 1) the free hydrocarbons contained in the sample and 2) the hydrocarbon- and oxygen-containing compounds (CO2) that are volatilized during the cracking of the unextractable organic matter in the sample (kerogen). A detailed description of the Rock Eval pyrolysis method is presented in Appendix B.
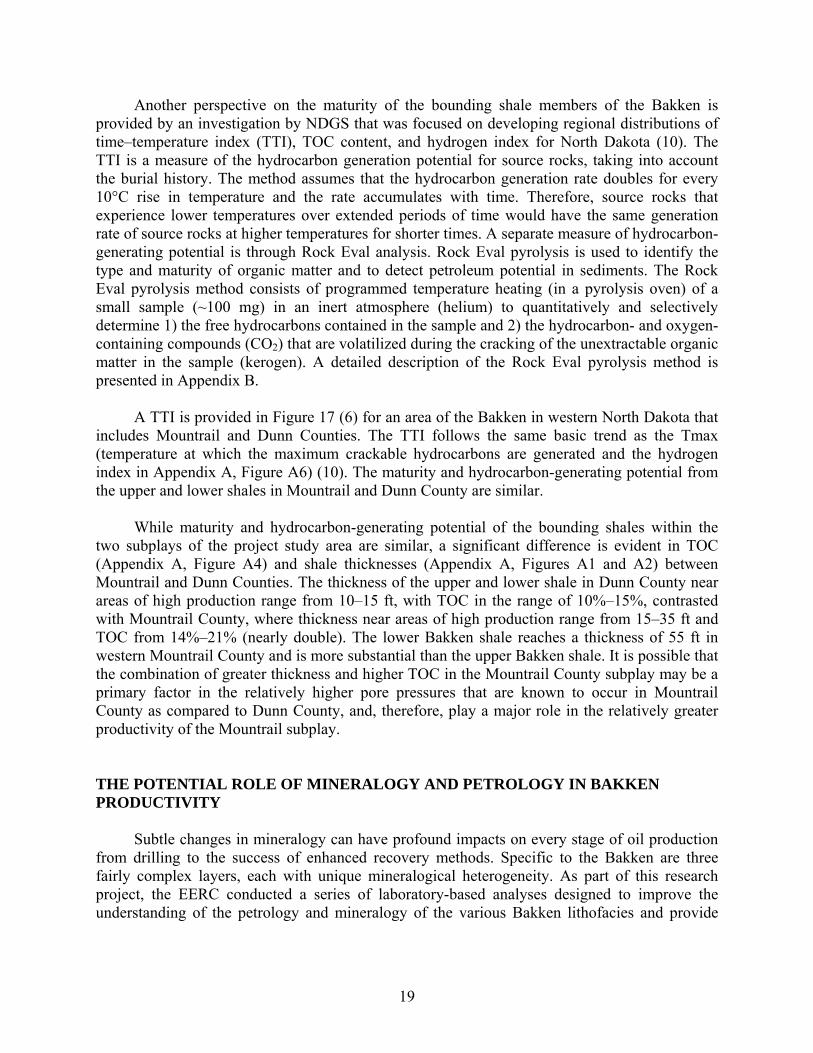
A TTI is provided in Figure 17 (6) for an area of the Bakken in western North Dakota that includes Mountrail and Dunn Counties. The TTI follows the same basic trend as the Tmax (temperature at which the maximum crackable hydrocarbons are generated and the hydrogen index in Appendix A, Figure A6) (10). The maturity and hydrocarbon-generating potential from the upper and lower shales in Mountrail and Dunn County are similar.
While maturity and hydrocarbon-generating potential of the bounding shales within the
two subplays of the project study area are similar, a significant difference is evident in TOC (Appendix A, Figure A4) and shale thicknesses (Appendix A, Figures A1 and A2) between Mountrail and Dunn Counties. The thickness of the upper and lower shale in Dunn County near areas of high production range from 10–15 ft, with TOC in the range of 10%–15%, contrasted with Mountrail County, where thickness near areas of high production range from 15–35 ft and TOC from 14%–21% (nearly double). The lower Bakken shale reaches a thickness of 55 ft in western Mountrail County and is more substantial than the upper Bakken shale. It is possible that the combination of greater thickness and higher TOC in the Mountrail County subplay may be a primary factor in the relatively higher pore pressures that are known to occur in Mountrail County as compared to Dunn County, and, therefore, play a major role in the relatively greater productivity of the Mountrail subplay.
THE POTENTIAL ROLE OF MINERALOGY AND PETROLOGY IN BAKKEN PRODUCTIVITY
Subtle changes in mineralogy can have profound impacts on every stage of oil production from drilling to the success of enhanced recovery methods. Specific to the Bakken are three fairly complex layers, each with unique mineralogical heterogeneity. As part of this research project, the EERC conducted a series of laboratory-based analyses designed to improve the understanding of the petrology and mineralogy of the various Bakken lithofacies and provide
20
Figure 17. TTI for Mountrail and Dunn Counties (modified from Nordeng et al. [6]). insight regarding the potential effects of those parameters on geochemical processes, such as fluid expulsion. One specific observation is the presence of natural hydraulic fractures that may have been formed in some areas of the Bakken as hydrous minerals once present during deposition were dewatered during lithification, specifically smectite group clays and opal.
To test this hypothesis and simultaneously begin the development of a database on Bakken
petrology and mineralogy, 109 fragments of core samples from 25 wells within North Dakota were obtained from the North Dakota core library. Samples were micronized into a powder, then suspended in water and allowed to settle and dry over two standard petrographic slides. This method of gravity segregation was assumed to produce oriented aggregate slides composed of uniform particle sizes. Samples were submitted for XRD analysis to determine baseline conditions. A second scan was conducted after samples had been saturated with ethylene glycol to identify swelling clays.
Overview of General Bakken Mineralogy
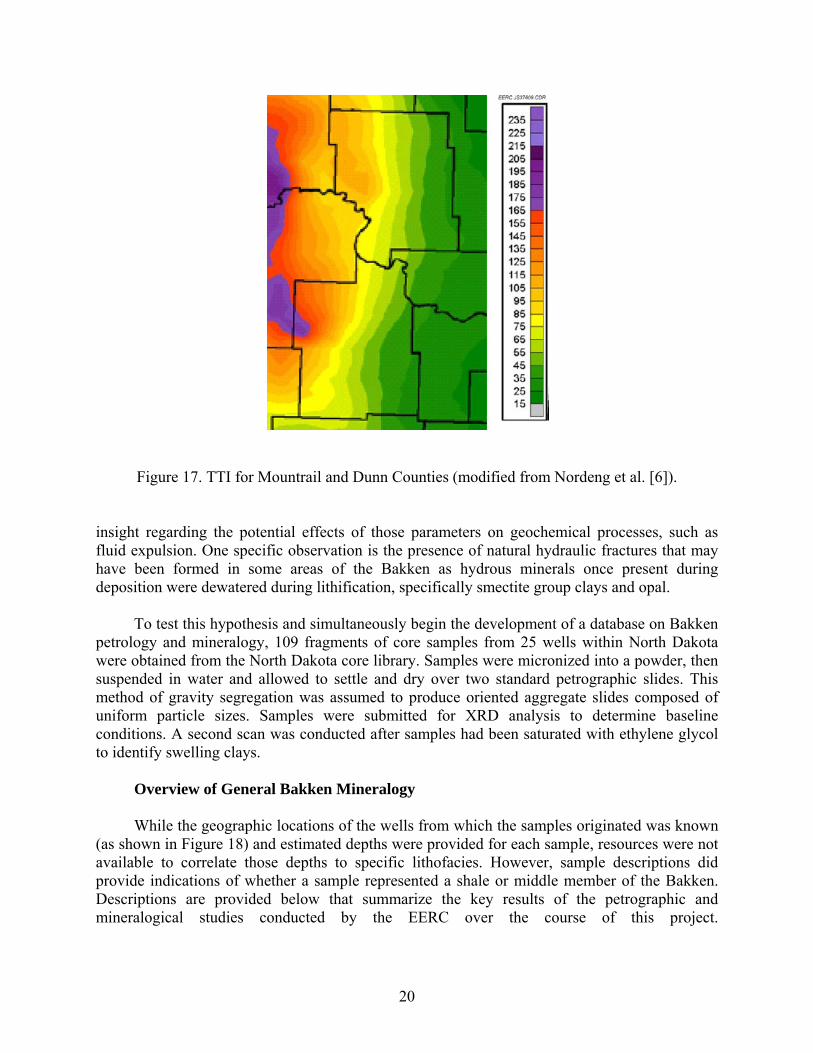
While the geographic locations of the wells from which the samples originated was known
(as shown in Figure 18) and estimated depths were provided for each sample, resources were not available to correlate those depths to specific lithofacies. However, sample descriptions did provide indications of whether a sample represented a shale or middle member of the Bakken. Descriptions are provided below that summarize the key results of the petrographic and mineralogical studies conducted by the EERC over the course of this project.
21
Figure 18. Map showing the locations of wells for which samples were provided to the EERC by
NDGS for geochemical, mineralogical, and petrological analyses.
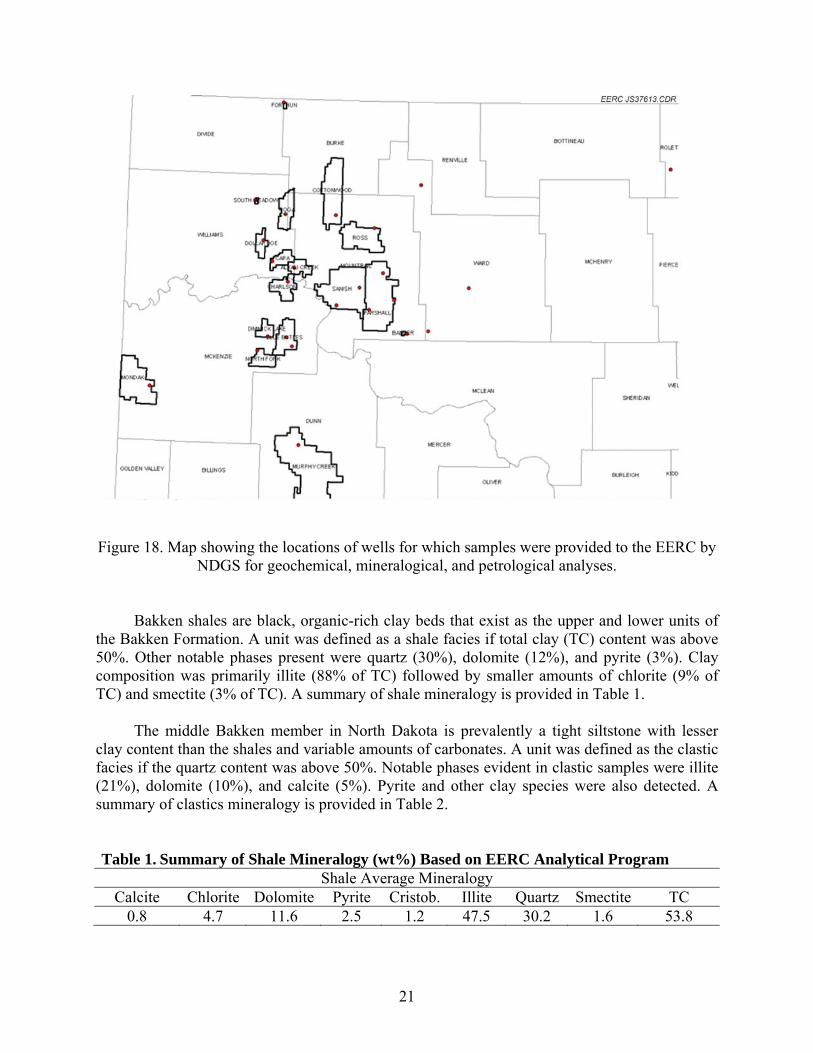
Bakken shales are black, organic-rich clay beds that exist as the upper and lower units of
the Bakken Formation. A unit was defined as a shale facies if total clay (TC) content was above 50%. Other notable phases present were quartz (30%), dolomite (12%), and pyrite (3%). Clay composition was primarily illite (88% of TC) followed by smaller amounts of chlorite (9% of TC) and smectite (3% of TC). A summary of shale mineralogy is provided in Table 1.
The middle Bakken member in North Dakota is prevalently a tight siltstone with lesser
clay content than the shales and variable amounts of carbonates. A unit was defined as the clastic facies if the quartz content was above 50%. Notable phases evident in clastic samples were illite (21%), dolomite (10%), and calcite (5%). Pyrite and other clay species were also detected. A summary of clastics mineralogy is provided in Table 2.
Table 1. Summary of Shale Mineralogy (wt%) Based on EERC Analytical ProgramShale Average Mineralogy
Calcite Chlorite Dolomite Pyrite Cristob. Illite Quartz Smectite TC 0.8 4.7 11.6 2.5 1.2 47.5 30.2 1.6 53.8
22
Table 2. Summary of Middle Bakken Clastics Mineralogy (wt%) Based on EERC Analytical Program
Clastic Average Mineralogy Calcite Chlorite Dolomite Pyrite Cristob. Illite Quartz Smectite TC
4.7 2.7 10.2 3.3 1.3 21.4 53.7 2.7 26.7
The middle Bakken contains some carbonate units, although they are less common. Carbonates were defined as calcite and dolomite concentrations above 50%. Carbonate accumulations are area-specific, with increased amounts of dolomite west into Montana. Calcite was the dominant phase (36%) followed by quartz (27%) and dolomite (23%). Carbonate units tended to have the lowest amounts of clay (12%) and pyrite (>1%). A summary of carbonate mineralogy is provided in Table 3.
Illite–Smectite Overview
Clay minerals are notorious for absorbing and retaining water, most notably clays of the smectite variety, with illite having a much smaller potential. These clays are commonly found in conjunction with each other and are referred to as illite–smectite mixed-layer clays. Other varieties of clay such as kaolinite and chlorite have a much lower affinity to retain water within the clay structure.
While presenting a host of engineering problems for drilling, production, and stimulation
activities involving water, it has been proposed that hydrous minerals may have dewatered late during lithification and initiated natural hydraulic fractures. Naturally existing fracture networks have been observed in the Bakken and are thought to have a major impact on the productivity, and, therefore, profitability of a field.
Illite is the dominant clay species within each lithofacies of the Bakken, representing over
85% of clay identified. Clay content dominates shale units, but is still present within the clastic middle Bakken, comprising over 25% of material. Carbonate members of the middle Bakken had the lowest amount of total clay.
The ratio of clay mixtures was also variable, with higher smectite concentrations in
samples with low total clay, as a result of high sand or carbonate content. Chlorite clay remains somewhat consistent across the different facies. These results are summarized in pie charts in Figure 19.
Table 3. Summary of Middle Bakken Carbonate Mineralogy (wt%) Based on EERC Analytical Program
Carbonate Average Mineralogy Calcite Chlorite Dolomite Pyrite Cristob. Illite Quartz Smectite TC
36.3 1.0 23.0 0.6 0.8 10.2 26.9 1.1 12.4
23
Figure 19. Charts represent the ratio of specific clay minerals to total clay from all 25 examined
wells. Shale possesses the highest average illite and lowest smectite. Clastics and carbonates show higher smectite and lower illite. Chlorite appears in similar average concentrations across
the separate facies.
Opal–Chert Overview
Opal is a secondary compound comprising a combination of hydrous silica gels and microcrystalline constituents of cristabolite and tridymite which precipitate out of silica-rich waters and have also been proposed as a source of water during Bakken lithification. As the material matures, water is expelled and the concentrations of cristabolite and tridymite increase, forming the mineral opal-CT, which further evolves into a cristabolite form, opal-C and, finally, is reduced to chert, or microcrystalline quartz. If significant amounts of opal were present during the lithification process, opal evolution may be involved in the creation of natural fractures.
Pure opal is an amorphous compound that escapes many methods of analysis; however,
based on acquired mineral samples of opal, cristobalite was detectable by XRD. Opal itself is not stable over long periods of time, so evidence of its existence would consist of high amounts (especially in fractures) of cristobalite and chert.
Attention was given to examine samples for cristobalite with XRD techniques; however,
nearly all tests reported values below detection tolerance. Cristobalite, like opal, is not stable for long periods of time, so if cristobalite did exist in the samples, it has most likely transformed to chert and has become part of the strong quartz signature exhibited by the prominent silts and sands of the Bakken Formation. This topic could be explored further in the future, but more detailed analysis was not conducted for this project.
Dunn County and Mountrail County Case Comparisons The Murphy Creek Field is an oil field that produces from the Bakken in the central and
southern part of Dunn County, North Dakota. It is understood that the success rate in this portion of the basin is not as great as the more prolific areas further north, despite seemingly favorable conditions. For the examination of Murphy Creek, two samples from Well 16766 were examined: one clastic and one carbonate. No shale sample from the Murphy Creek Field was acquired for analysis. These results are presented in Table 4.
24
Table 4. Results of Murphy Creek Sample Analyses
Sample Depth,
ft Calcite Chlorite Dolomite Pyrite Cristob. Illite Quartz Smectite Clastic 10,669 N/D1 4.2% 3.1% 4.3% 1.4% 25.5% 56.8% 4.5% Carbonate 10,684 85.6% 1.0% 1.3% 1.4% 0.4% 0.8% 8.5% 1.2% 1 Not detected.
The clastic mineralogy is primarily quartz, with approximately 34% mixed clay, primarily illite. Small amounts of dolomite and pyrite were also present in the sample. The carbonate mineralogy consists of much cleaner calcite, with approximately 3% clay. This clay is highly mixed, with approximately equal portions of all three groups. These results are summarized in pie charts in Figure 20.
The Sanish and Parshall Fields are noteworthy examples of production in Mountrail
County, North Dakota. Unlike Murphy Creek, they have experienced a high rate of success, which has been attributed to favorable geologic conditions. Eleven samples from four cores in the Sanish and Parshall Fields were analyzed, one shale, four carbonate, and six clastic, with average results shown. These results are presented in Table 5.
Figure 20. Chart representing the ratio of specific clay minerals to total clay from the Murphy Creek Field. The clastic facies possesses a lower concentration of both smectite and chlorite than
the carbonate sample from the same well.
Table 5. Results of Sanish and Parshall Sample Analyses Showing the Average Concentrations of Key Minerals for Three Types of lithologies Sample Depth Calcite Chlorite Dolomite Pyrite Cristob. Illite Quartz SmectiteShale 9978.2 N/D 5.5% 17.7% 1.5% 1.7% 44.9% 25.2% 3.5% Clastics 9512 4.0% 2.1% 11.0% 1.8% 1.3% 19.1% 58.5% 1.0% Carbonates 9919 35.5% 0.7% 29.8% 0.3% 0.9% 8.1% 24.2% 0.6%
25
As shown, the mineralogic data are quite different between the two locations. The Mountrail County samples have much higher dolomite contents, and the carbonate units are much dirtier, with both clay and quartz. The clastics contain more carbonates and significantly less clay and pyrite. Total clay was 53% in the shale unit (lower Bakken) and averaged 22% in the clastic member and 9% in the carbonates. The results also indicate that the clay mineralogy is very consistent in the Mountrail County fields. The dominant clay species is illite, followed by chlorite then smectite. These results are summarized in pie charts in Figure 21.
Mineralogy and Petrology Conclusions
The successes present in Mountrail County may be due, in part, to mineralogy; however, a
very limited data set was utilized for this study. Mineralogy will continue to be a topic for examination. From the reconnaissance study performed, it appears that illite/smectite ratios are not the sole variable in the formation of natural hydraulic fractures. Smectite clays occupy only a minor phase in Bakken rocks, easily overshadowed by the dominant illite phase. The potential effects of opal–cristobalite dewatering was unable to be assessed by XRD methods as cristobalite levels were often below the limit of detection. Also, primary opal and secondary phases may have evolved over time into chert which, in turn, becomes lost in the strong quartz signal associated with the depositional silts and sands present in the formation.
An attempt was made to use the results of the mineralogy and lithology analytical activities
to populate a rudimentary reconnaissance-level model of the middle Bakken in northwestern North Dakota. A series of stochastic modeling techniques, based not only on the EERC’s analytical results but also well log data and previously published information on the middle Bakken, were applied over the course of the model development in an attempt to predict the distribution of some of the key parameters. Unfortunately, examinations of the output of these modeling efforts clearly indicated that the model is severely limited in its representation of the middle Bakken. The extreme heterogeneity of the middle Bakken has been well documented, and the data upon which the model is based are too sparse to support a model that reflects that
Figure 21. This chart represents the ratio of specific clay minerals to total clay from data averaged among facies from the Sanish and Parshall Fields. The shale and carbonate facies are nearly identical concentrations, with slightly less illite present in the averaged clastic sample.
26
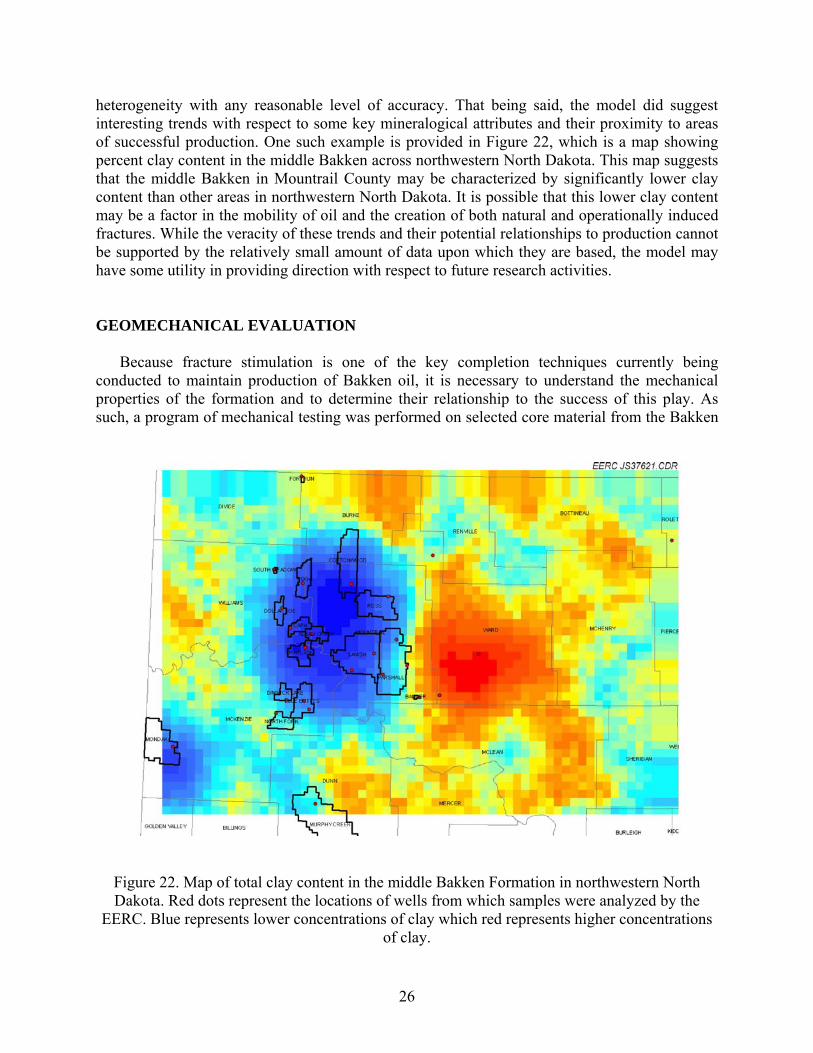
heterogeneity with any reasonable level of accuracy. That being said, the model did suggest interesting trends with respect to some key mineralogical attributes and their proximity to areas of successful production. One such example is provided in Figure 22, which is a map showing percent clay content in the middle Bakken across northwestern North Dakota. This map suggests that the middle Bakken in Mountrail County may be characterized by significantly lower clay content than other areas in northwestern North Dakota. It is possible that this lower clay content may be a factor in the mobility of oil and the creation of both natural and operationally induced fractures. While the veracity of these trends and their potential relationships to production cannot be supported by the relatively small amount of data upon which they are based, the model may have some utility in providing direction with respect to future research activities. GEOMECHANICAL EVALUATION
Because fracture stimulation is one of the key completion techniques currently being conducted to maintain production of Bakken oil, it is necessary to understand the mechanical properties of the formation and to determine their relationship to the success of this play. As such, a program of mechanical testing was performed on selected core material from the Bakken
Figure 22. Map of total clay content in the middle Bakken Formation in northwestern North Dakota. Red dots represent the locations of wells from which samples were analyzed by the
EERC. Blue represents lower concentrations of clay which red represents higher concentrations of clay.
27
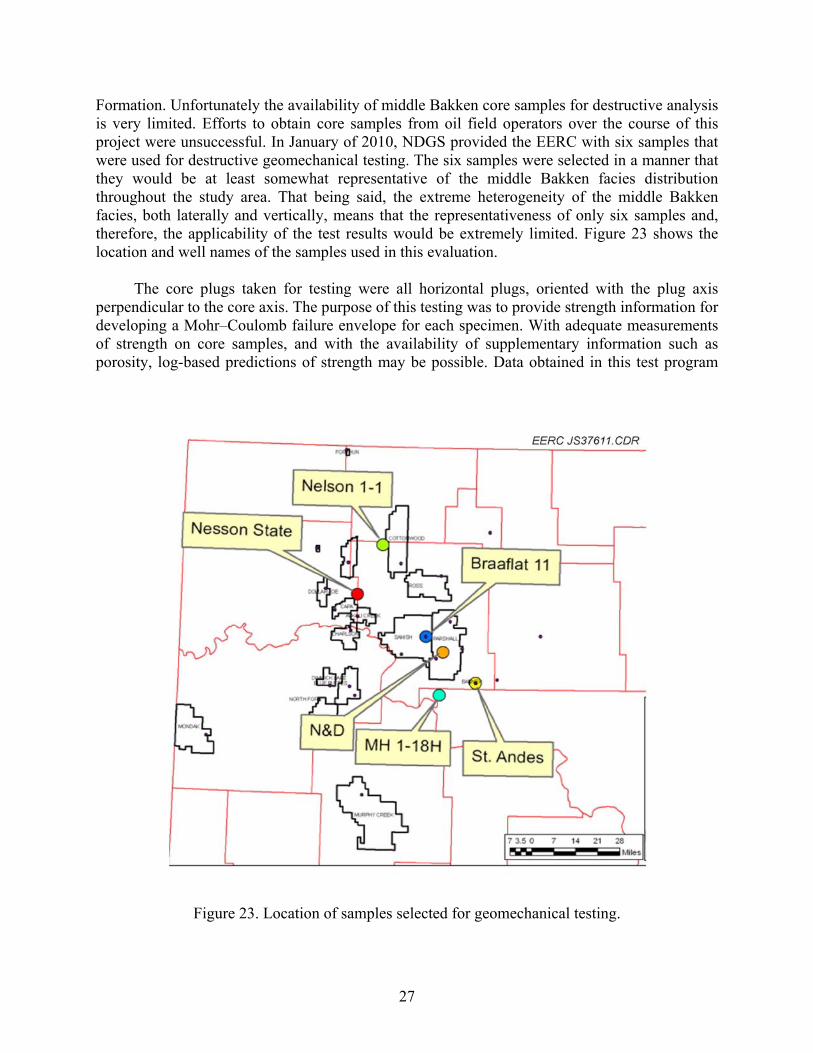
Formation. Unfortunately the availability of middle Bakken core samples for destructive analysis is very limited. Efforts to obtain core samples from oil field operators over the course of this project were unsuccessful. In January of 2010, NDGS provided the EERC with six samples that were used for destructive geomechanical testing. The six samples were selected in a manner that they would be at least somewhat representative of the middle Bakken facies distribution throughout the study area. That being said, the extreme heterogeneity of the middle Bakken facies, both laterally and vertically, means that the representativeness of only six samples and, therefore, the applicability of the test results would be extremely limited. Figure 23 shows the location and well names of the samples used in this evaluation.
The core plugs taken for testing were all horizontal plugs, oriented with the plug axis perpendicular to the core axis. The purpose of this testing was to provide strength information for developing a Mohr–Coulomb failure envelope for each specimen. With adequate measurements of strength on core samples, and with the availability of supplementary information such as porosity, log-based predictions of strength may be possible. Data obtained in this test program
Figure 23. Location of samples selected for geomechanical testing.
28
may also provide static and dynamic mechanical property information for supplementing the correlation of well log data.
In general, the testing program consisted of two primary analytical methods, indirect tensile strength testing (Brazilian method) and multistage triaxial compression testing with concurrent ultrasonic velocity measurements for Mohr–Coulomb failure envelope delineation. The measurements obtained from these two methods were then used to calculate a series of parameters that describe the geomechanical properties of the sampled rocks. Those parameters include:
• Coulomb friction angle. • Coulomb cohesion angle. • In situ effective compressive strength. • In situ static and dynamic Young’s modulus. • In situ static and dynamic Poisson’s ratio. • Indirect tensile strength.
Table 6 summarizes the types of tests performed on each of the six samples provided.
Table 6. Samples Selected to Be Representative of Middle Bakken Facies Distributions Throughout the Study Area
Sample ID Depth, ft Diameter,
in. Length,
in. Orientation Tests Performed1 17043-1 9082.95 1 2.1
Horizontal
MTXC w/UVs 17043-2 9082.95 1 0.5 Brazil 17043-3 9082.95 1 0.5 Brazil 16532-1 9433.05 1 1.8 MTXC w/UVs 16532-2 9433.05 1 0.5 Brazil 16160-1 9445.05 1 2 MTXC w/UVs 16160-2 9445.05 1 0.5 Brazil 16160-3 9445.05 1 0.5 Brazil 17434-2 9742.05 1 0.5 Brazil 17434-3 9742.2 1 2 MTXC w/UVs 17434-4 9742.05 1 0.5 Brazil 17023-1 9880.15 1 2.1 MTXC w/UVs 17023-2 9880.15 1 0.5 Brazil 17023-3 9880.15 1 0.5 Brazil 17015-1 10,316.05 1 1.8 MTXC w/UVs 17015-2 10,316.05 1 0.5 Brazil 1 MTXC/w UV = multistage triaxial compression test with ultrasonic velocities; Brazil = Brazil Indirect tensile strength test.
In addition to these tests, preliminary core material screening to ensure sample quality was
performed by computerized tomographic (CT) scanning. Initially, CT images were used for
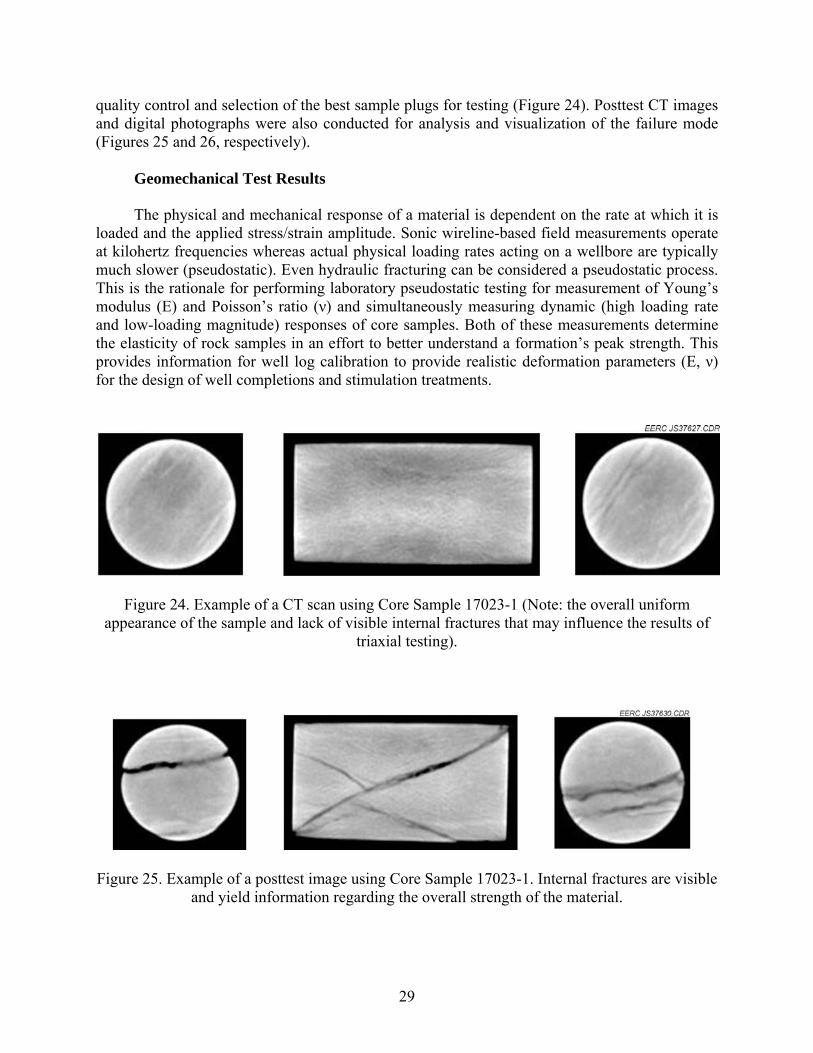
29
quality control and selection of the best sample plugs for testing (Figure 24). Posttest CT images and digital photographs were also conducted for analysis and visualization of the failure mode (Figures 25 and 26, respectively).
Geomechanical Test Results
The physical and mechanical response of a material is dependent on the rate at which it is
loaded and the applied stress/strain amplitude. Sonic wireline-based field measurements operate at kilohertz frequencies whereas actual physical loading rates acting on a wellbore are typically much slower (pseudostatic). Even hydraulic fracturing can be considered a pseudostatic process. This is the rationale for performing laboratory pseudostatic testing for measurement of Young’s modulus (E) and Poisson’s ratio (ν) and simultaneously measuring dynamic (high loading rate and low-loading magnitude) responses of core samples. Both of these measurements determine the elasticity of rock samples in an effort to better understand a formation’s peak strength. This provides information for well log calibration to provide realistic deformation parameters (E, ν) for the design of well completions and stimulation treatments.
Figure 24. Example of a CT scan using Core Sample 17023-1 (Note: the overall uniform appearance of the sample and lack of visible internal fractures that may influence the results of
triaxial testing).
Figure 25. Example of a posttest image using Core Sample 17023-1. Internal fractures are visible and yield information regarding the overall strength of the material.
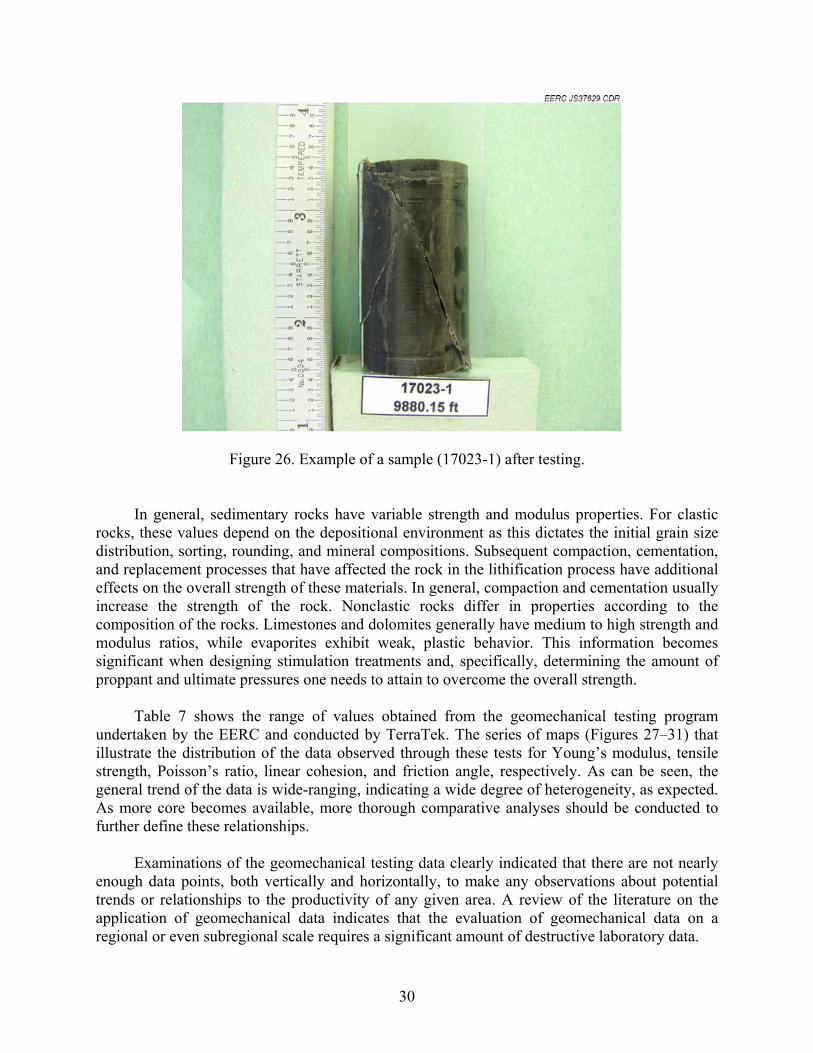
30
Figure 26. Example of a sample (17023-1) after testing.
In general, sedimentary rocks have variable strength and modulus properties. For clastic rocks, these values depend on the depositional environment as this dictates the initial grain size distribution, sorting, rounding, and mineral compositions. Subsequent compaction, cementation, and replacement processes that have affected the rock in the lithification process have additional effects on the overall strength of these materials. In general, compaction and cementation usually increase the strength of the rock. Nonclastic rocks differ in properties according to the composition of the rocks. Limestones and dolomites generally have medium to high strength and modulus ratios, while evaporites exhibit weak, plastic behavior. This information becomes significant when designing stimulation treatments and, specifically, determining the amount of proppant and ultimate pressures one needs to attain to overcome the overall strength.
Table 7 shows the range of values obtained from the geomechanical testing program
undertaken by the EERC and conducted by TerraTek. The series of maps (Figures 27–31) that illustrate the distribution of the data observed through these tests for Young’s modulus, tensile strength, Poisson’s ratio, linear cohesion, and friction angle, respectively. As can be seen, the general trend of the data is wide-ranging, indicating a wide degree of heterogeneity, as expected. As more core becomes available, more thorough comparative analyses should be conducted to further define these relationships.
Examinations of the geomechanical testing data clearly indicated that there are not nearly
enough data points, both vertically and horizontally, to make any observations about potential trends or relationships to the productivity of any given area. A review of the literature on the application of geomechanical data indicates that the evaluation of geomechanical data on a regional or even subregional scale requires a significant amount of destructive laboratory data.
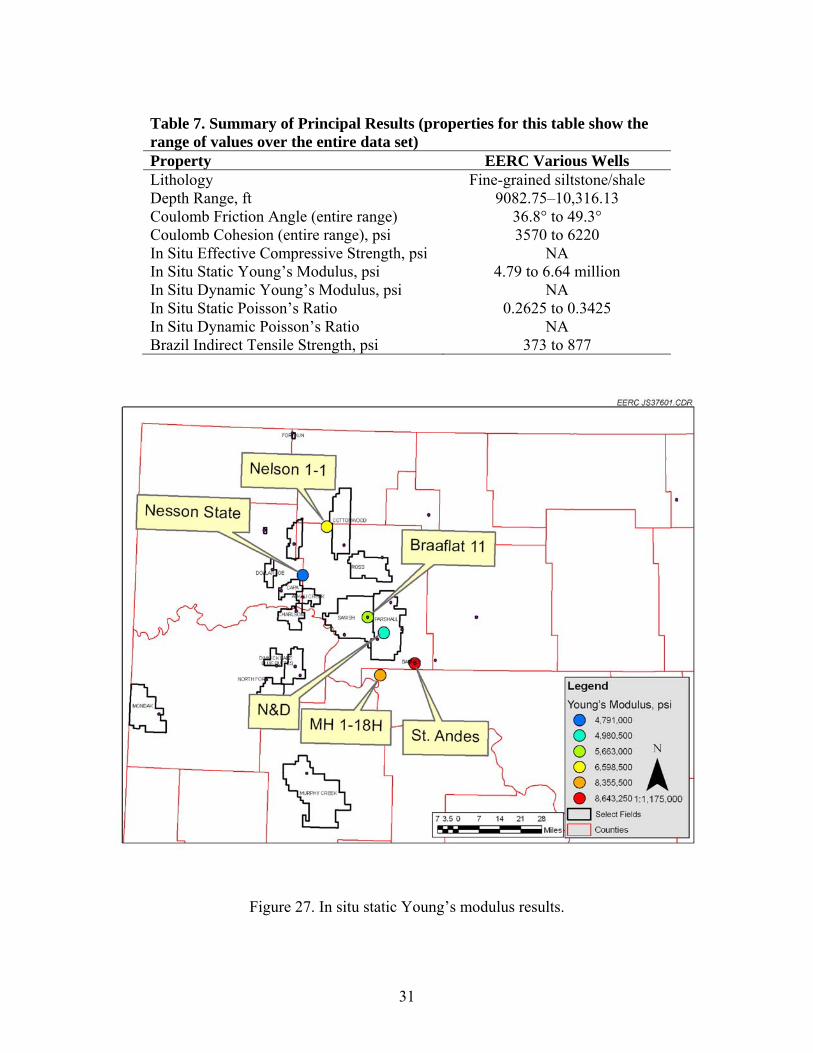
31
Table 7. Summary of Principal Results (properties for this table show the range of values over the entire data set) Property EERC Various Wells Lithology Fine-grained siltstone/shale Depth Range, ft 9082.75–10,316.13 Coulomb Friction Angle (entire range) 36.8° to 49.3° Coulomb Cohesion (entire range), psi 3570 to 6220 In Situ Effective Compressive Strength, psi NA In Situ Static Young’s Modulus, psi 4.79 to 6.64 million In Situ Dynamic Young’s Modulus, psi NA In Situ Static Poisson’s Ratio 0.2625 to 0.3425 In Situ Dynamic Poisson’s Ratio NA Brazil Indirect Tensile Strength, psi 373 to 877
Figure 27. In situ static Young’s modulus results.
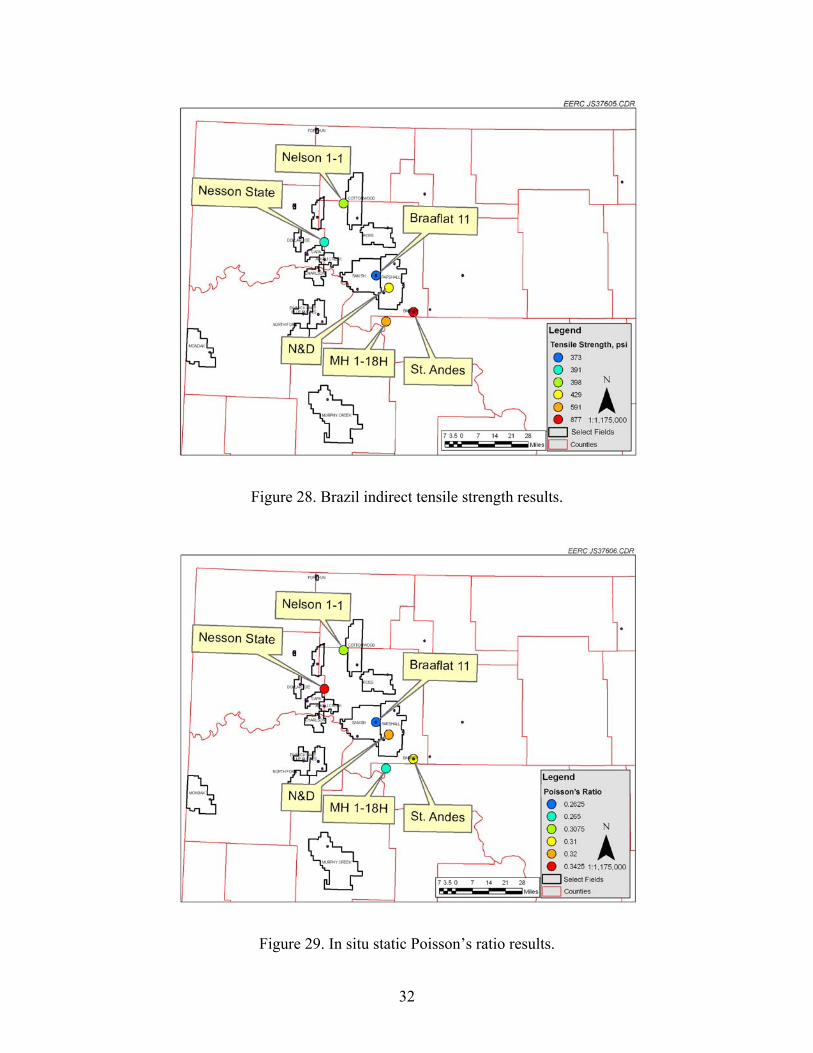
32
Figure 28. Brazil indirect tensile strength results.
Figure 29. In situ static Poisson’s ratio results.
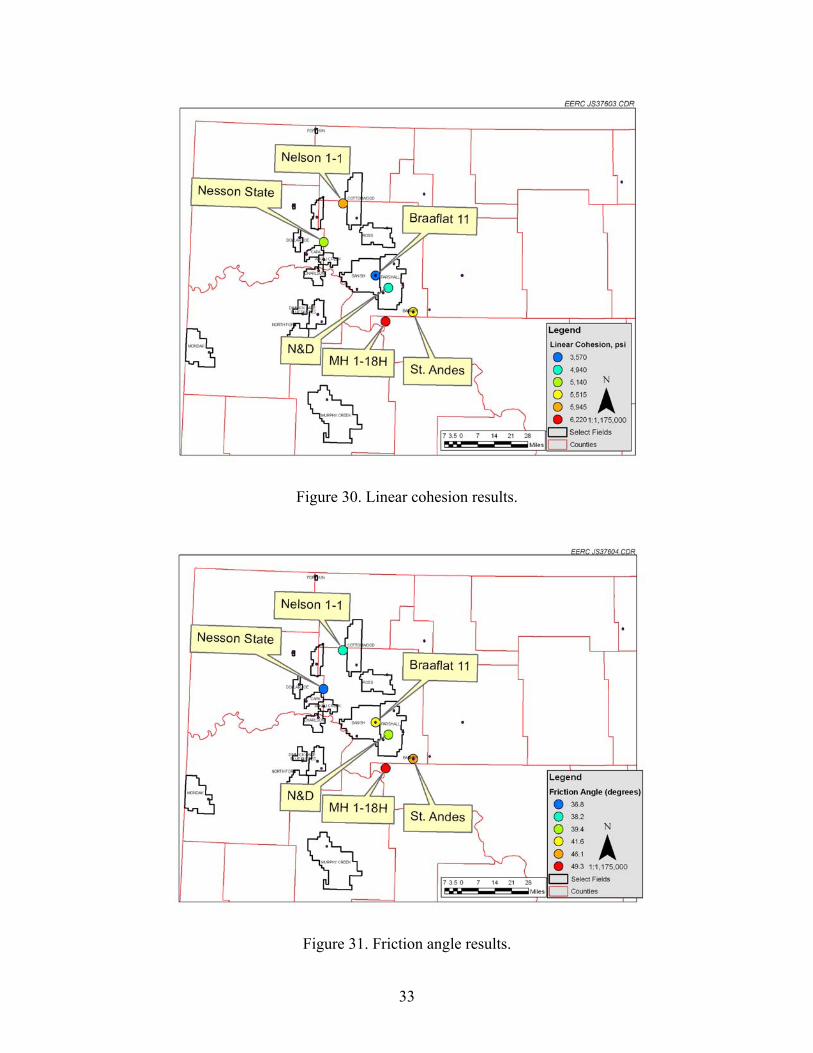
33
Figure 30. Linear cohesion results.
Figure 31. Friction angle results.

34
Future efforts should focus on not only obtaining samples to generate new geomechanical data, but also searching well files for existing geomechanical data. Such data were noted to occasionally be found in well files in the NDDMR–OGD database, and the compilation of such data into a database focused on geomechanical properties may enable researchers to make reasonable observations regarding trends and relationships to production.
Proppant Evaluation
Hydraulic fracturing has been identified as one of the key technologies in the application of unconventional resources because of its ability to increase well production characteristics and near-well reservoir properties. While hydraulic fracturing has been largely successful, there are still unique challenges present in the Bakken Formation, and there is no general agreement in the operating community as to the best practices for hydraulic fracturing in the middle Bakken. One of the key aspects of hydraulic fracturing is the use of proppants. Proppants are small, well-sorted grains that are hard and either granular or spherical in shape. They are introduced into the fracture network of a reservoir as a slurry of proppants suspended in a liquid (fracture fluid) and pumped down a well during hydraulic fracturing to hold the fractures open when the fracture fluid is flowed back. Sand is the most commonly used type of proppant, with Ottawa sands the most commonly used in North Dakota Bakken hydraulic fracturing. Resin-coated sands, sintered bauxite pellets, and ceramic spheres are also used.
Attributes of the Bakken Formation that make it such a challenging play can affect the
choice an operator makes regarding the design of hydraulic fracturing, including the selection of a proppant. The Bakken Formation, in particular, has very high fracture closure stress, on the scale of 8000 psi (55 MPa) (11), which can lead to low performance and even failure. At high fracture closure stress, proppant can become embedded within the rock formation or become completely crushed by the forces, both of which may reduce fracture width and length or produce pore throat-clogging fines. Furthermore, downhole environments are especially hostile for proppants; a combination of high flow of reactive fluids, high exposed surface area (Figures 32–34), and elevated temperature and pressure can lead to degradation, even for relatively inert materials. Furthermore, two recent developments in the operational aspects of the Bakken play may act to further increase the hostile nature of the fracture environment for a proppant. First, some operators have shown interest in the injection of CO2 as a component of well stimulation operations in the Bakken. Second, some operators have reported increased levels of H2S in their produced fluids. Both CO2 and H2S can be reactive with some materials, and it is possible this reactivity may compromise the mechanical integrity of some proppants. To address these questions, the EERC conducted a reconnaissance-level examination of proppant materials focused on the feasibility of the materials after being subjected to downhole conditions and exposure to supercritical CO2 and to acid gas containing 85% CO2 and 15% H2S.
Samples of 16 different proppant products known to be used in North Dakota Bakken
hydraulic fracturing jobs were obtained from three vendors representing common natural and synthetic materials including sand, ceramics, and sintered bauxites. The samples were placed in brine and subjected to gas exposure within heat and pressure vessels at conditions of 200°F and 4000 psi for a period of 28 days. Samples removed from the reactor were subjected to one-dimensional confined compressive strength testing up to 80 MPa (Figure 35) and sieve analysis
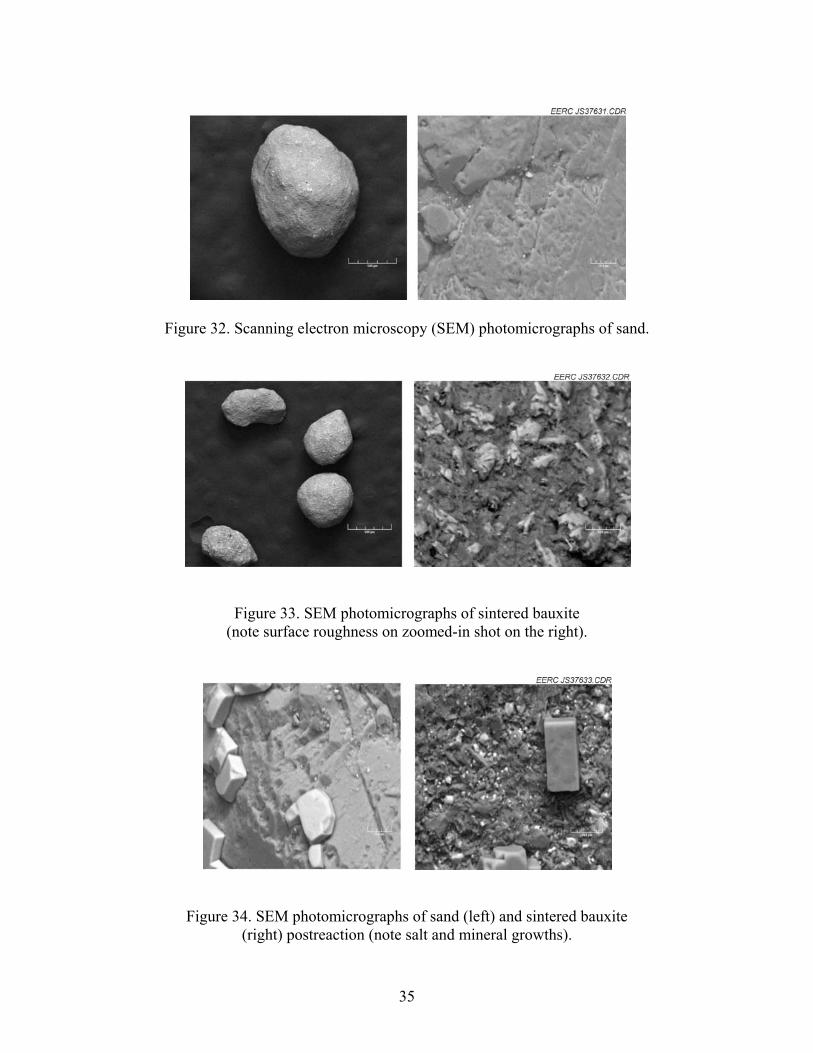
35
Figure 32. Scanning electron microscopy (SEM) photomicrographs of sand.
Figure 33. SEM photomicrographs of sintered bauxite (note surface roughness on zoomed-in shot on the right).
Figure 34. SEM photomicrographs of sand (left) and sintered bauxite (right) postreaction (note salt and mineral growths).
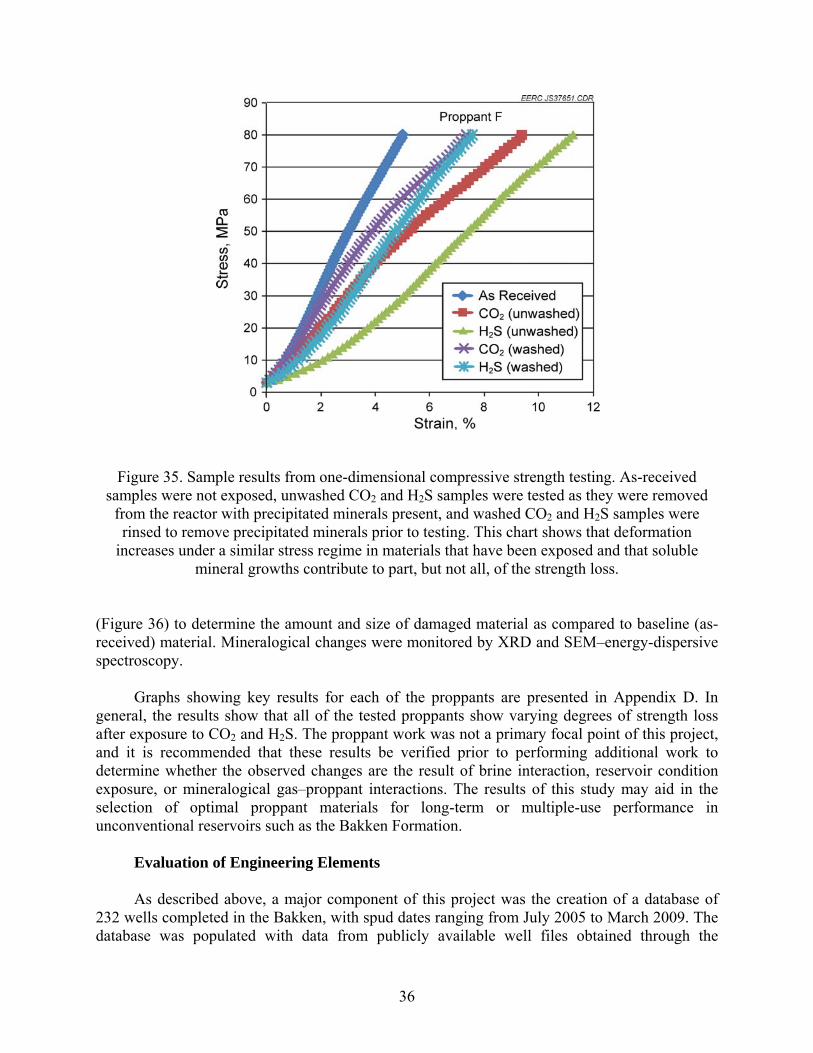
36
Figure 35. Sample results from one-dimensional compressive strength testing. As-received
samples were not exposed, unwashed CO2 and H2S samples were tested as they were removed from the reactor with precipitated minerals present, and washed CO2 and H2S samples were rinsed to remove precipitated minerals prior to testing. This chart shows that deformation
increases under a similar stress regime in materials that have been exposed and that soluble mineral growths contribute to part, but not all, of the strength loss.
(Figure 36) to determine the amount and size of damaged material as compared to baseline (as-received) material. Mineralogical changes were monitored by XRD and SEM–energy-dispersive spectroscopy.
Graphs showing key results for each of the proppants are presented in Appendix D. In general, the results show that all of the tested proppants show varying degrees of strength loss after exposure to CO2 and H2S. The proppant work was not a primary focal point of this project, and it is recommended that these results be verified prior to performing additional work to determine whether the observed changes are the result of brine interaction, reservoir condition exposure, or mineralogical gas–proppant interactions. The results of this study may aid in the selection of optimal proppant materials for long-term or multiple-use performance in unconventional reservoirs such as the Bakken Formation.
Evaluation of Engineering Elements
As described above, a major component of this project was the creation of a database of 232 wells completed in the Bakken, with spud dates ranging from July 2005 to March 2009. The database was populated with data from publicly available well files obtained through the
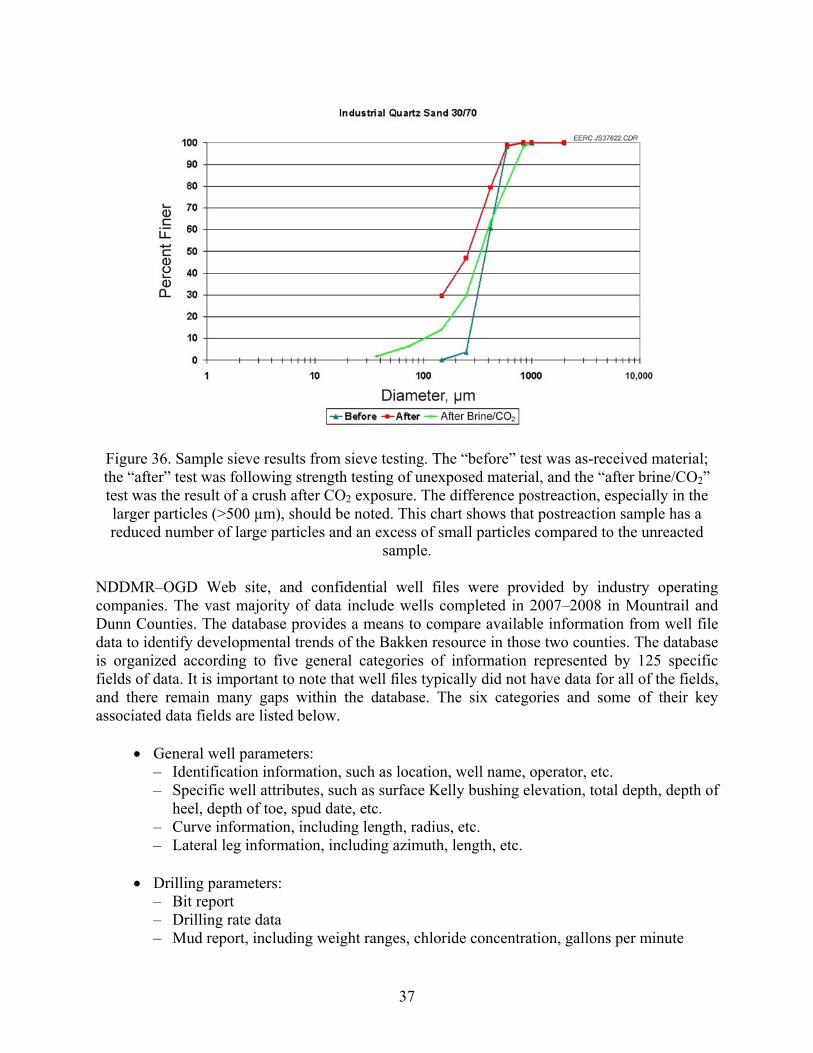
37
Figure 36. Sample sieve results from sieve testing. The “before” test was as-received material; the “after” test was following strength testing of unexposed material, and the “after brine/CO2” test was the result of a crush after CO2 exposure. The difference postreaction, especially in the larger particles (>500 µm), should be noted. This chart shows that postreaction sample has a reduced number of large particles and an excess of small particles compared to the unreacted
sample.
NDDMR–OGD Web site, and confidential well files were provided by industry operating companies. The vast majority of data include wells completed in 2007–2008 in Mountrail and Dunn Counties. The database provides a means to compare available information from well file data to identify developmental trends of the Bakken resource in those two counties. The database is organized according to five general categories of information represented by 125 specific fields of data. It is important to note that well files typically did not have data for all of the fields, and there remain many gaps within the database. The six categories and some of their key associated data fields are listed below.
• General well parameters:
– Identification information, such as location, well name, operator, etc. – Specific well attributes, such as surface Kelly bushing elevation, total depth, depth of
heel, depth of toe, spud date, etc. – Curve information, including length, radius, etc. – Lateral leg information, including azimuth, length, etc.
• Drilling parameters:
– Bit report – Drilling rate data – Mud report, including weight ranges, chloride concentration, gallons per minute
38
• Completion parameters: – Surface and production casing, including size, depth, weight, and production cement
depth – Tubing size and depth – Liner type, size, weight, perforation size and intervals
• Stimulation parameters:
– Treatment intervals, including top and bottom zone and sleeve length and depth – Treatment materials, including fluid types and volumes, proppant types and volumes – Treatment parameters, including treatment pressure, clean rate, slurry rate, proppant
concentrations, bottomhole pressure, etc.
• Production: – Initial production – Cumulative production – 3-month production – 6-month production
• Test data and miscellaneous:
– Test conditions, including choke size – Test results, including oil, gas, water, oil gravity, gas/oil ratio – Tubing and casing pressure measurements – Percent-in-zone estimates – Utilization of artificial lift
Once the database was created, the data were assessed and evaluated in a variety of
different ways, with the general goal being the identification of potentially important relationships between various engineering strategies, techniques, and technologies and oil production. Many of the comparisons yielded little to no valuable insights, which was often the result of a lack of data for some of the parameters of interest, but there were many examinations that did yield potentially valuable insights regarding successful Bakken exploitation strategies. The following sections describe and discuss what are considered to be the most valuable observations gained through this project.
Considerations Regarding Completions
Completions in the Bakken Formation vary, and consideration of the completion details is
required to accurately characterize parameters that affect well performance. Well completions consist of horizontally drilled wells at depths greater than 8000 ft and lateral lengths of 5000–10,000 ft. Completions include open-hole and variations of cemented and uncemented liners, generalized depictions of which are shown in Figures 37–39. Liners are either perforated or slotted. Fracture techniques include a single treatment of the entire lateral or multistage fracturing using liners equipped with either mechanical or swellable packers. Proppants used to hold fractures open include sand or ceramics of various sizes and are pumped into place with fracture fluids including water, gels, and engineered fracture fluids. The horizontal azimuth of
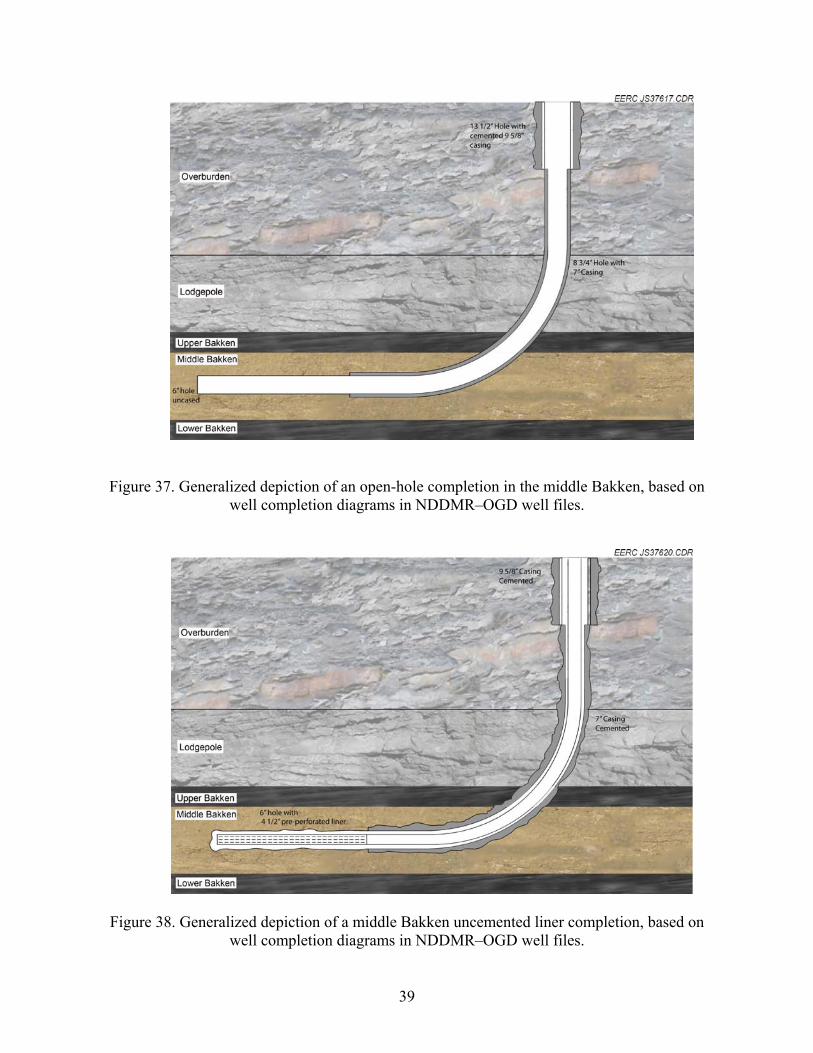
39
Figure 37. Generalized depiction of an open-hole completion in the middle Bakken, based on
well completion diagrams in NDDMR–OGD well files.
Figure 38. Generalized depiction of a middle Bakken uncemented liner completion, based on well completion diagrams in NDDMR–OGD well files.
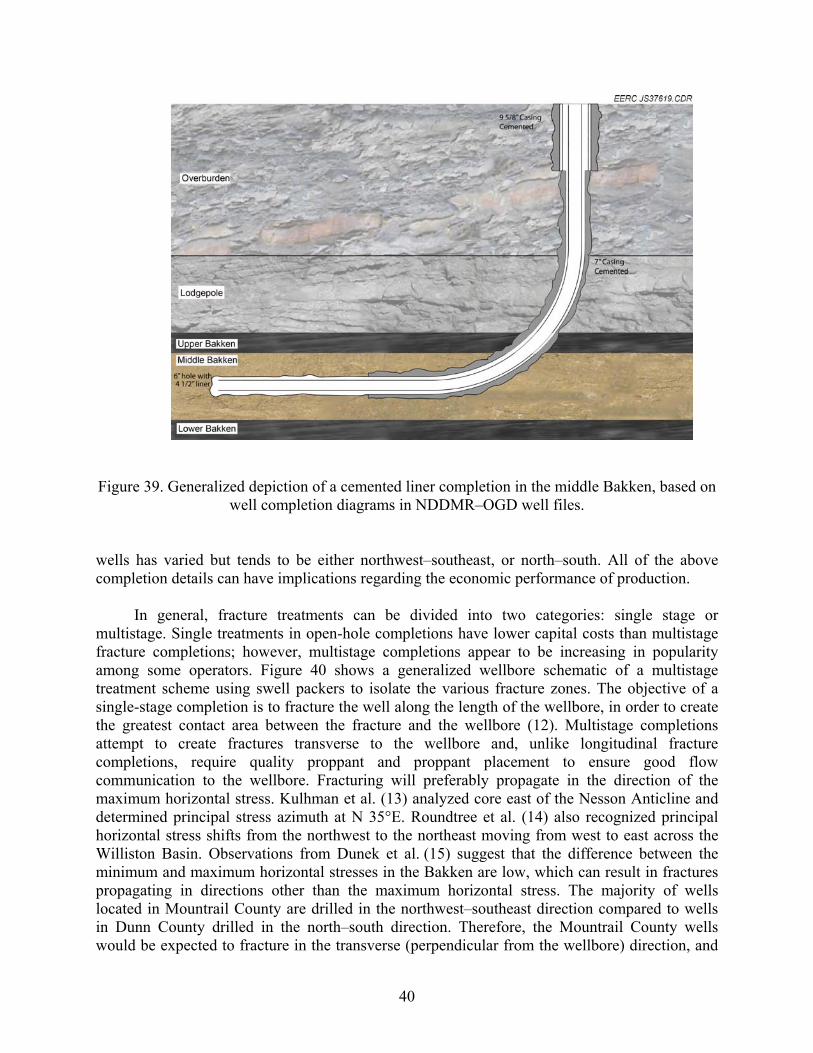
40
Figure 39. Generalized depiction of a cemented liner completion in the middle Bakken, based on
well completion diagrams in NDDMR–OGD well files. wells has varied but tends to be either northwest–southeast, or north–south. All of the above completion details can have implications regarding the economic performance of production.
In general, fracture treatments can be divided into two categories: single stage or
multistage. Single treatments in open-hole completions have lower capital costs than multistage fracture completions; however, multistage completions appear to be increasing in popularity among some operators. Figure 40 shows a generalized wellbore schematic of a multistage treatment scheme using swell packers to isolate the various fracture zones. The objective of a single-stage completion is to fracture the well along the length of the wellbore, in order to create the greatest contact area between the fracture and the wellbore (12). Multistage completions attempt to create fractures transverse to the wellbore and, unlike longitudinal fracture completions, require quality proppant and proppant placement to ensure good flow communication to the wellbore. Fracturing will preferably propagate in the direction of the maximum horizontal stress. Kulhman et al. (13) analyzed core east of the Nesson Anticline and determined principal stress azimuth at N 35°E. Roundtree et al. (14) also recognized principal horizontal stress shifts from the northwest to the northeast moving from west to east across the Williston Basin. Observations from Dunek et al. (15) suggest that the difference between the minimum and maximum horizontal stresses in the Bakken are low, which can result in fractures propagating in directions other than the maximum horizontal stress. The majority of wells located in Mountrail County are drilled in the northwest–southeast direction compared to wells in Dunn County drilled in the north–south direction. Therefore, the Mountrail County wells would be expected to fracture in the transverse (perpendicular from the wellbore) direction, and
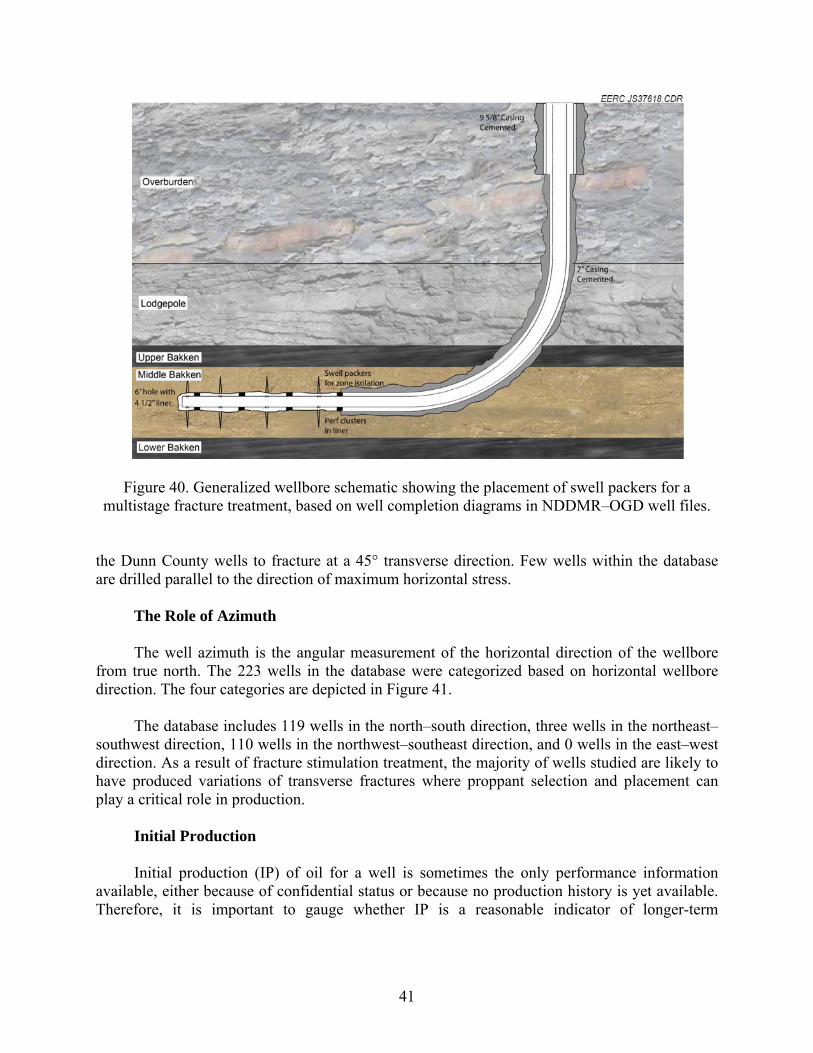
41
Figure 40. Generalized wellbore schematic showing the placement of swell packers for a multistage fracture treatment, based on well completion diagrams in NDDMR–OGD well files.
the Dunn County wells to fracture at a 45° transverse direction. Few wells within the database are drilled parallel to the direction of maximum horizontal stress.
The Role of Azimuth
The well azimuth is the angular measurement of the horizontal direction of the wellbore
from true north. The 223 wells in the database were categorized based on horizontal wellbore direction. The four categories are depicted in Figure 41.
The database includes 119 wells in the north–south direction, three wells in the northeast–
southwest direction, 110 wells in the northwest–southeast direction, and 0 wells in the east–west direction. As a result of fracture stimulation treatment, the majority of wells studied are likely to have produced variations of transverse fractures where proppant selection and placement can play a critical role in production.
Initial Production
Initial production (IP) of oil for a well is sometimes the only performance information
available, either because of confidential status or because no production history is yet available. Therefore, it is important to gauge whether IP is a reasonable indicator of longer-term
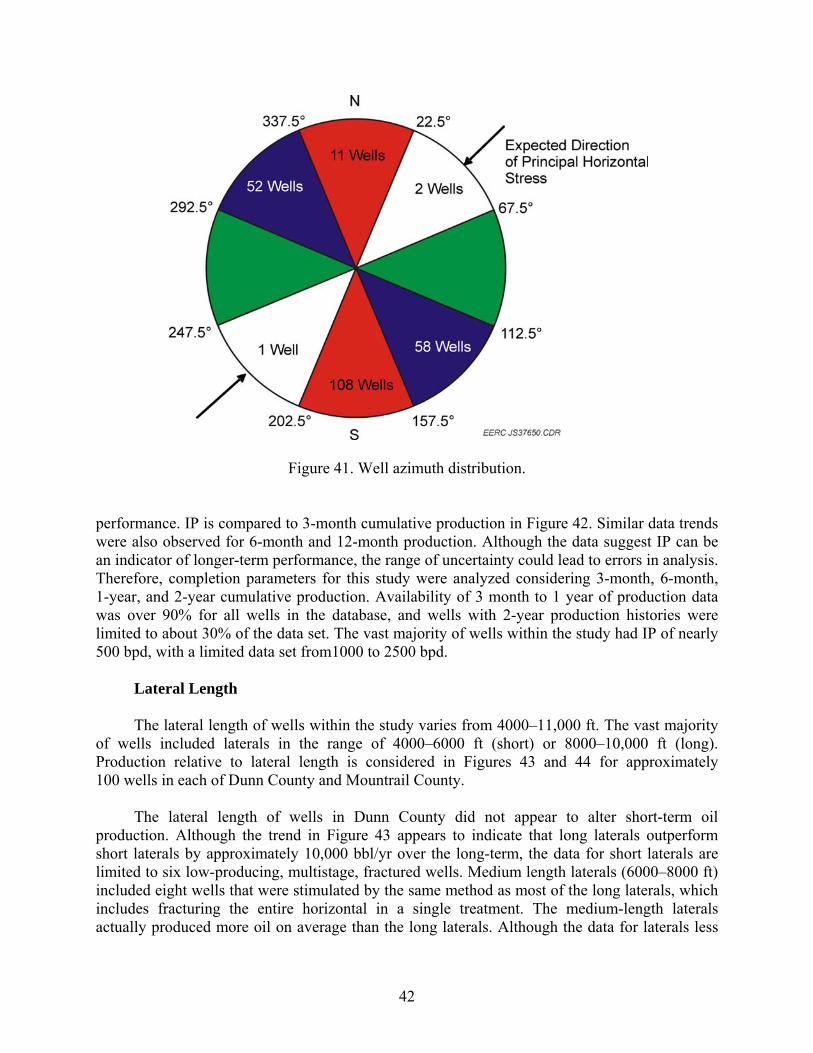
42
Figure 41. Well azimuth distribution. performance. IP is compared to 3-month cumulative production in Figure 42. Similar data trends were also observed for 6-month and 12-month production. Although the data suggest IP can be an indicator of longer-term performance, the range of uncertainty could lead to errors in analysis. Therefore, completion parameters for this study were analyzed considering 3-month, 6-month, 1-year, and 2-year cumulative production. Availability of 3 month to 1 year of production data was over 90% for all wells in the database, and wells with 2-year production histories were limited to about 30% of the data set. The vast majority of wells within the study had IP of nearly 500 bpd, with a limited data set from1000 to 2500 bpd.
Lateral Length
The lateral length of wells within the study varies from 4000–11,000 ft. The vast majority of wells included laterals in the range of 4000–6000 ft (short) or 8000–10,000 ft (long). Production relative to lateral length is considered in Figures 43 and 44 for approximately 100 wells in each of Dunn County and Mountrail County.
The lateral length of wells in Dunn County did not appear to alter short-term oil production. Although the trend in Figure 43 appears to indicate that long laterals outperform short laterals by approximately 10,000 bbl/yr over the long-term, the data for short laterals are limited to six low-producing, multistage, fractured wells. Medium length laterals (6000–8000 ft) included eight wells that were stimulated by the same method as most of the long laterals, which includes fracturing the entire horizontal in a single treatment. The medium-length laterals actually produced more oil on average than the long laterals. Although the data for laterals less
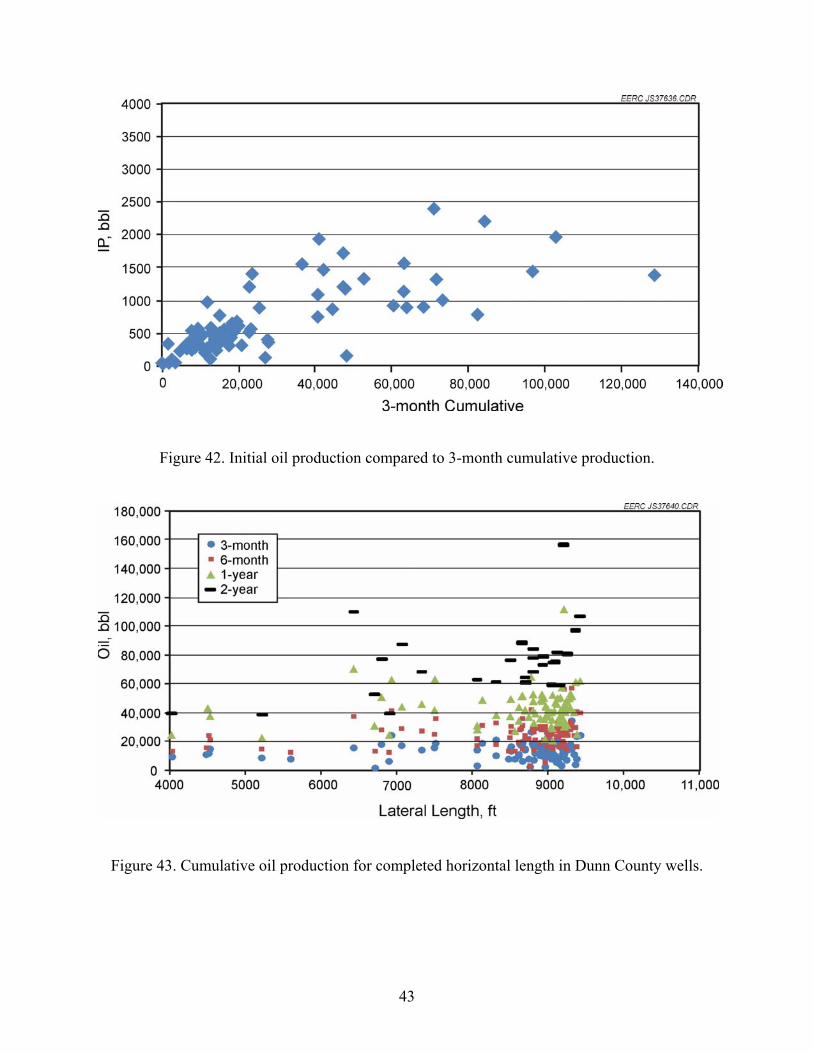
43
Figure 42. Initial oil production compared to 3-month cumulative production.
Figure 43. Cumulative oil production for completed horizontal length in Dunn County wells.
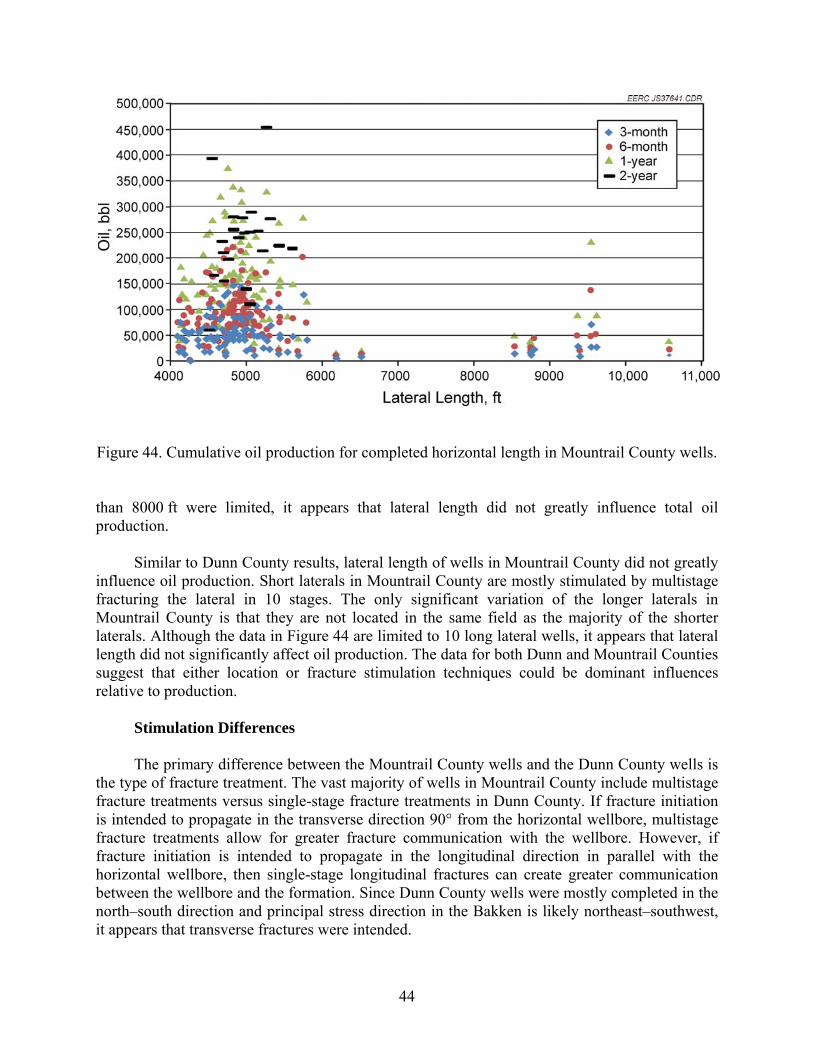
44
Figure 44. Cumulative oil production for completed horizontal length in Mountrail County wells. than 8000 ft were limited, it appears that lateral length did not greatly influence total oil production.
Similar to Dunn County results, lateral length of wells in Mountrail County did not greatly influence oil production. Short laterals in Mountrail County are mostly stimulated by multistage fracturing the lateral in 10 stages. The only significant variation of the longer laterals in Mountrail County is that they are not located in the same field as the majority of the shorter laterals. Although the data in Figure 44 are limited to 10 long lateral wells, it appears that lateral length did not significantly affect oil production. The data for both Dunn and Mountrail Counties suggest that either location or fracture stimulation techniques could be dominant influences relative to production.
Stimulation Differences
The primary difference between the Mountrail County wells and the Dunn County wells is
the type of fracture treatment. The vast majority of wells in Mountrail County include multistage fracture treatments versus single-stage fracture treatments in Dunn County. If fracture initiation is intended to propagate in the transverse direction 90° from the horizontal wellbore, multistage fracture treatments allow for greater fracture communication with the wellbore. However, if fracture initiation is intended to propagate in the longitudinal direction in parallel with the horizontal wellbore, then single-stage longitudinal fractures can create greater communication between the wellbore and the formation. Since Dunn County wells were mostly completed in the north–south direction and principal stress direction in the Bakken is likely northeast–southwest, it appears that transverse fractures were intended.
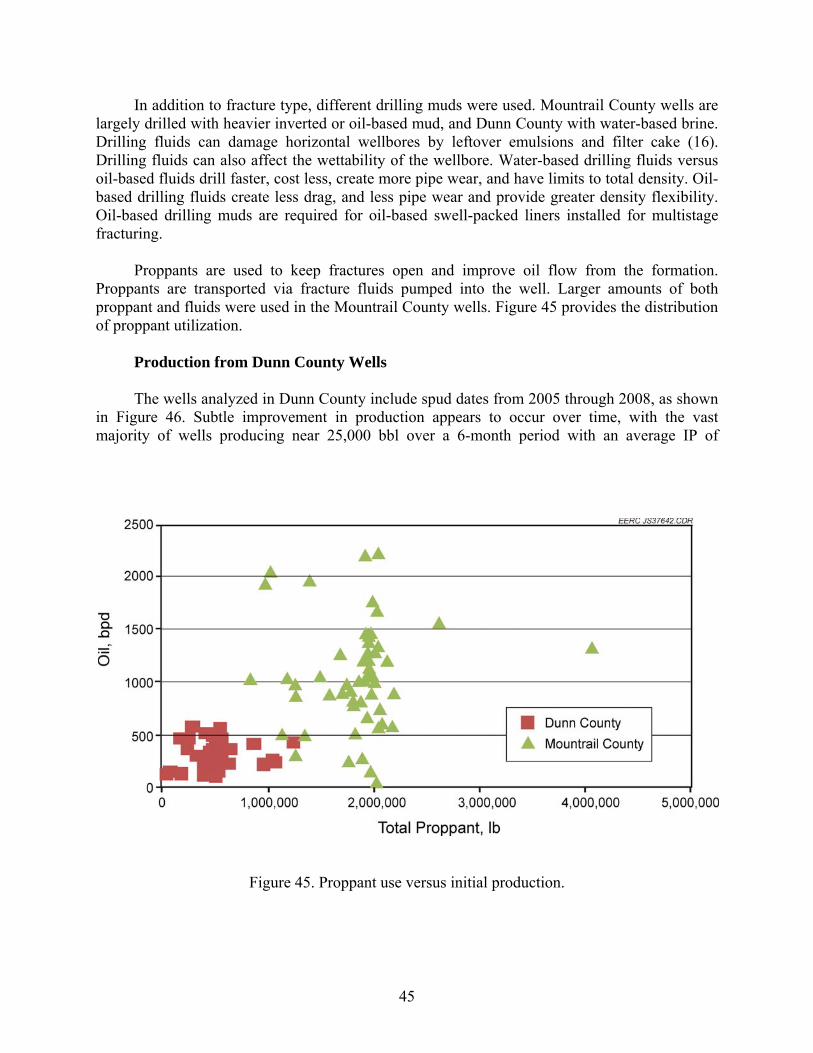
45
In addition to fracture type, different drilling muds were used. Mountrail County wells are largely drilled with heavier inverted or oil-based mud, and Dunn County with water-based brine. Drilling fluids can damage horizontal wellbores by leftover emulsions and filter cake (16). Drilling fluids can also affect the wettability of the wellbore. Water-based drilling fluids versus oil-based fluids drill faster, cost less, create more pipe wear, and have limits to total density. Oil-based drilling fluids create less drag, and less pipe wear and provide greater density flexibility. Oil-based drilling muds are required for oil-based swell-packed liners installed for multistage fracturing.
Proppants are used to keep fractures open and improve oil flow from the formation.
Proppants are transported via fracture fluids pumped into the well. Larger amounts of both proppant and fluids were used in the Mountrail County wells. Figure 45 provides the distribution of proppant utilization.
Production from Dunn County Wells
The wells analyzed in Dunn County include spud dates from 2005 through 2008, as shown in Figure 46. Subtle improvement in production appears to occur over time, with the vast majority of wells producing near 25,000 bbl over a 6-month period with an average IP of
Figure 45. Proppant use versus initial production.
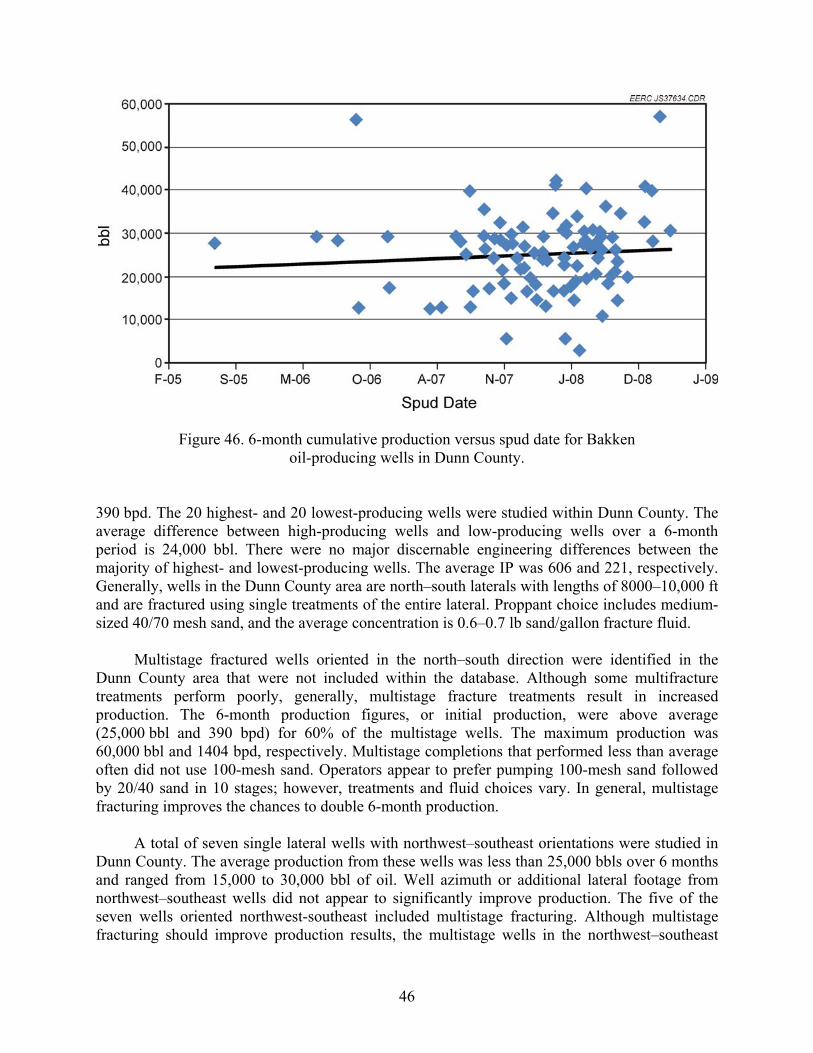
46
Figure 46. 6-month cumulative production versus spud date for Bakken oil-producing wells in Dunn County.
390 bpd. The 20 highest- and 20 lowest-producing wells were studied within Dunn County. The average difference between high-producing wells and low-producing wells over a 6-month period is 24,000 bbl. There were no major discernable engineering differences between the majority of highest- and lowest-producing wells. The average IP was 606 and 221, respectively. Generally, wells in the Dunn County area are north–south laterals with lengths of 8000–10,000 ft and are fractured using single treatments of the entire lateral. Proppant choice includes medium-sized 40/70 mesh sand, and the average concentration is 0.6–0.7 lb sand/gallon fracture fluid.
Multistage fractured wells oriented in the north–south direction were identified in the
Dunn County area that were not included within the database. Although some multifracture treatments perform poorly, generally, multistage fracture treatments result in increased production. The 6-month production figures, or initial production, were above average (25,000 bbl and 390 bpd) for 60% of the multistage wells. The maximum production was 60,000 bbl and 1404 bpd, respectively. Multistage completions that performed less than average often did not use 100-mesh sand. Operators appear to prefer pumping 100-mesh sand followed by 20/40 sand in 10 stages; however, treatments and fluid choices vary. In general, multistage fracturing improves the chances to double 6-month production.
A total of seven single lateral wells with northwest–southeast orientations were studied in
Dunn County. The average production from these wells was less than 25,000 bbls over 6 months and ranged from 15,000 to 30,000 bbl of oil. Well azimuth or additional lateral footage from northwest–southeast wells did not appear to significantly improve production. The five of the seven wells oriented northwest-southeast included multistage fracturing. Although multistage fracturing should improve production results, the multistage wells in the northwest–southeast
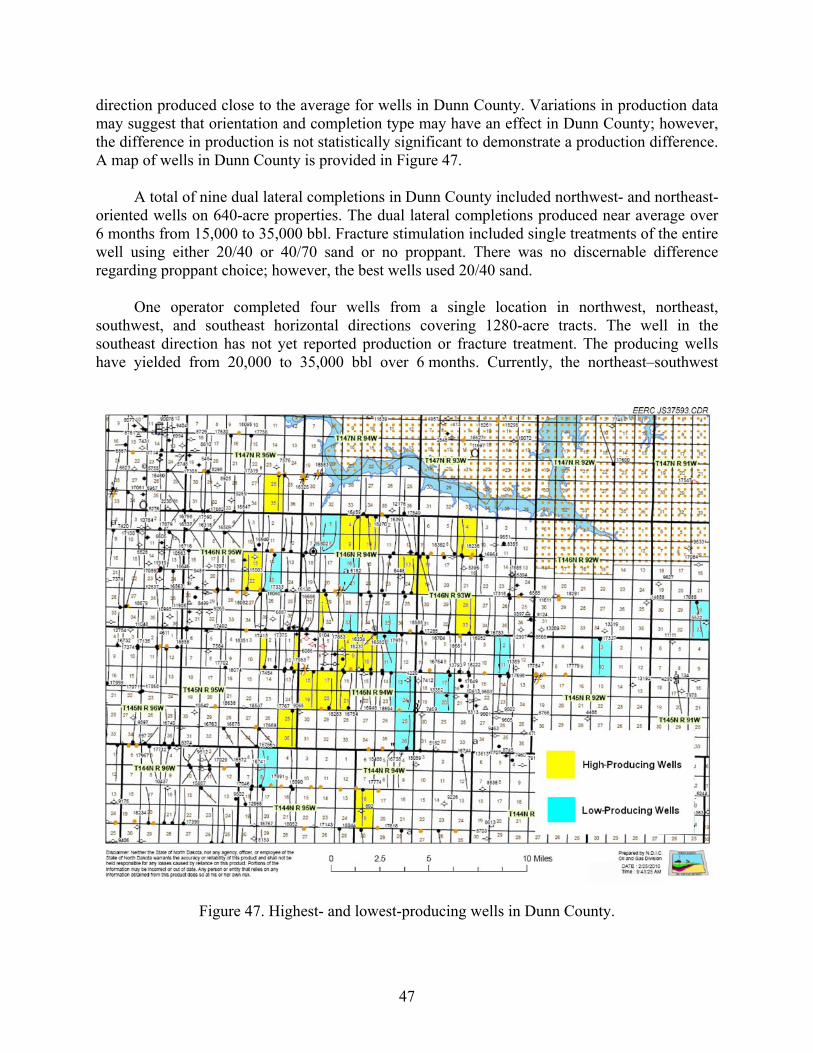
47
direction produced close to the average for wells in Dunn County. Variations in production data may suggest that orientation and completion type may have an effect in Dunn County; however, the difference in production is not statistically significant to demonstrate a production difference. A map of wells in Dunn County is provided in Figure 47.
A total of nine dual lateral completions in Dunn County included northwest- and northeast-oriented wells on 640-acre properties. The dual lateral completions produced near average over 6 months from 15,000 to 35,000 bbl. Fracture stimulation included single treatments of the entire well using either 20/40 or 40/70 sand or no proppant. There was no discernable difference regarding proppant choice; however, the best wells used 20/40 sand.
One operator completed four wells from a single location in northwest, northeast, southwest, and southeast horizontal directions covering 1280-acre tracts. The well in the southeast direction has not yet reported production or fracture treatment. The producing wells have yielded from 20,000 to 35,000 bbl over 6 months. Currently, the northeast–southwest
Figure 47. Highest- and lowest-producing wells in Dunn County.
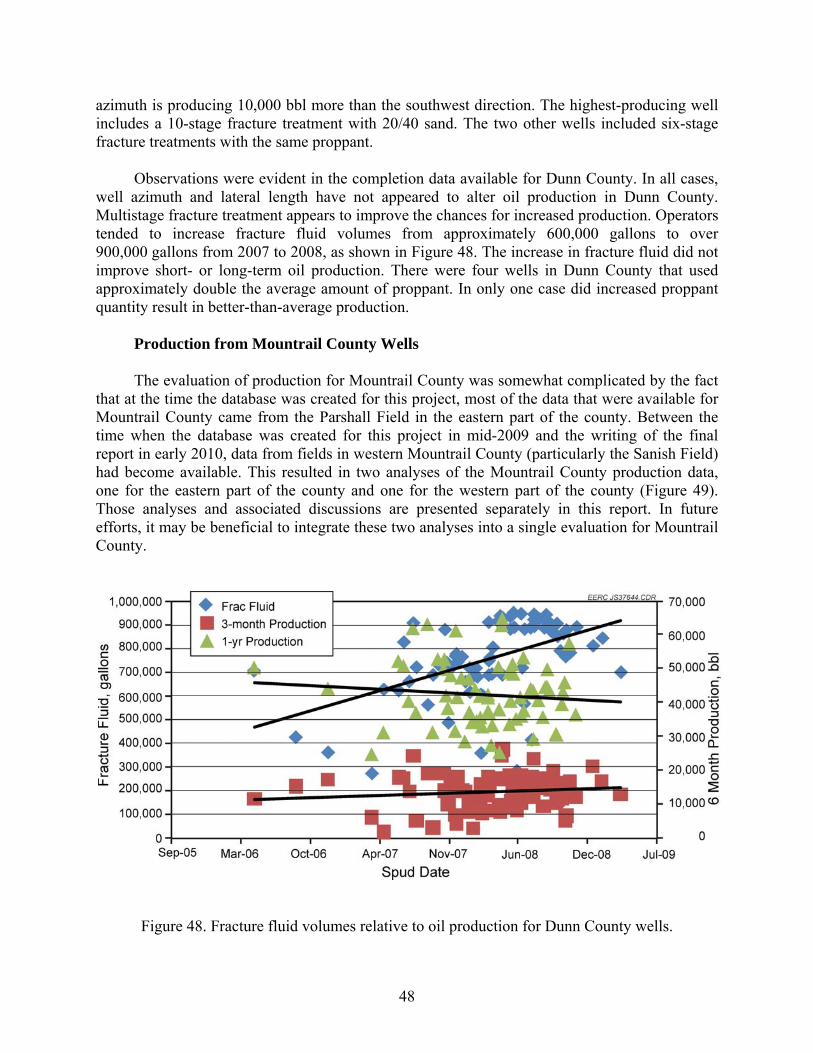
48
azimuth is producing 10,000 bbl more than the southwest direction. The highest-producing well includes a 10-stage fracture treatment with 20/40 sand. The two other wells included six-stage fracture treatments with the same proppant.
Observations were evident in the completion data available for Dunn County. In all cases, well azimuth and lateral length have not appeared to alter oil production in Dunn County. Multistage fracture treatment appears to improve the chances for increased production. Operators tended to increase fracture fluid volumes from approximately 600,000 gallons to over 900,000 gallons from 2007 to 2008, as shown in Figure 48. The increase in fracture fluid did not improve short- or long-term oil production. There were four wells in Dunn County that used approximately double the average amount of proppant. In only one case did increased proppant quantity result in better-than-average production.
Production from Mountrail County Wells
The evaluation of production for Mountrail County was somewhat complicated by the fact that at the time the database was created for this project, most of the data that were available for Mountrail County came from the Parshall Field in the eastern part of the county. Between the time when the database was created for this project in mid-2009 and the writing of the final report in early 2010, data from fields in western Mountrail County (particularly the Sanish Field) had become available. This resulted in two analyses of the Mountrail County production data, one for the eastern part of the county and one for the western part of the county (Figure 49). Those analyses and associated discussions are presented separately in this report. In future efforts, it may be beneficial to integrate these two analyses into a single evaluation for Mountrail County.
Figure 48. Fracture fluid volumes relative to oil production for Dunn County wells.
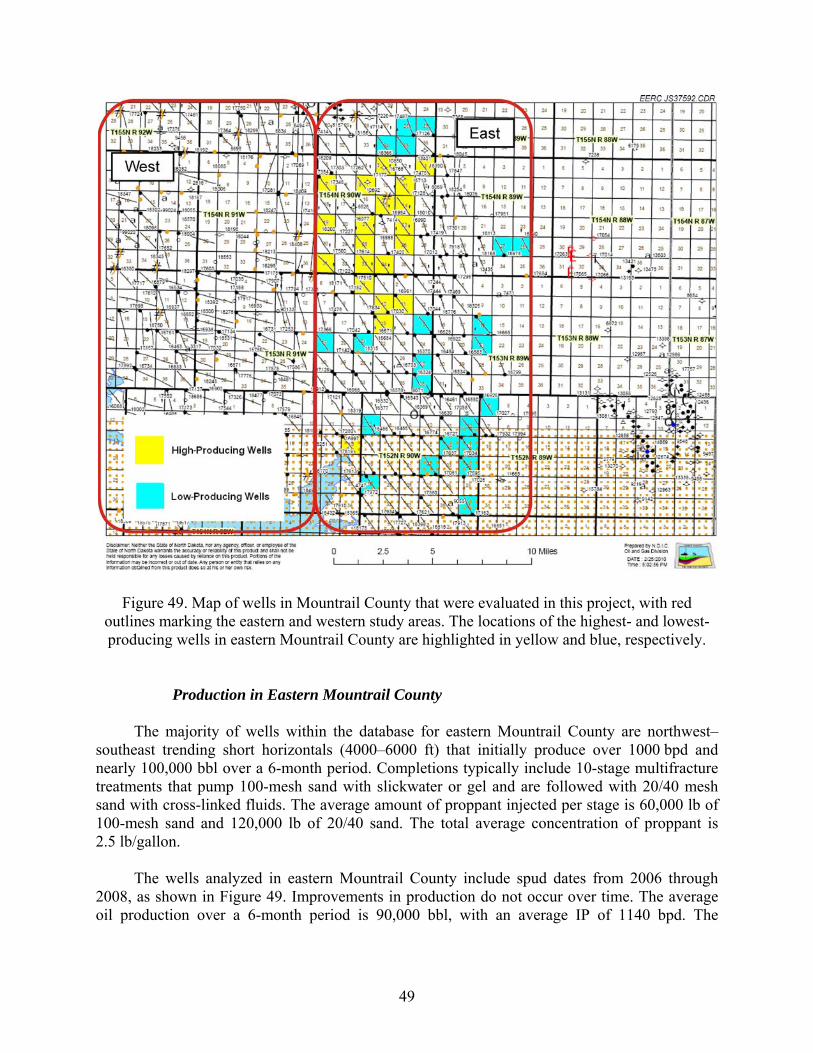
49
Figure 49. Map of wells in Mountrail County that were evaluated in this project, with red outlines marking the eastern and western study areas. The locations of the highest- and lowest-producing wells in eastern Mountrail County are highlighted in yellow and blue, respectively.
Production in Eastern Mountrail County
The majority of wells within the database for eastern Mountrail County are northwest–southeast trending short horizontals (4000–6000 ft) that initially produce over 1000 bpd and nearly 100,000 bbl over a 6-month period. Completions typically include 10-stage multifracture treatments that pump 100-mesh sand with slickwater or gel and are followed with 20/40 mesh sand with cross-linked fluids. The average amount of proppant injected per stage is 60,000 lb of 100-mesh sand and 120,000 lb of 20/40 sand. The total average concentration of proppant is 2.5 lb/gallon.
The wells analyzed in eastern Mountrail County include spud dates from 2006 through
2008, as shown in Figure 49. Improvements in production do not occur over time. The average oil production over a 6-month period is 90,000 bbl, with an average IP of 1140 bpd. The
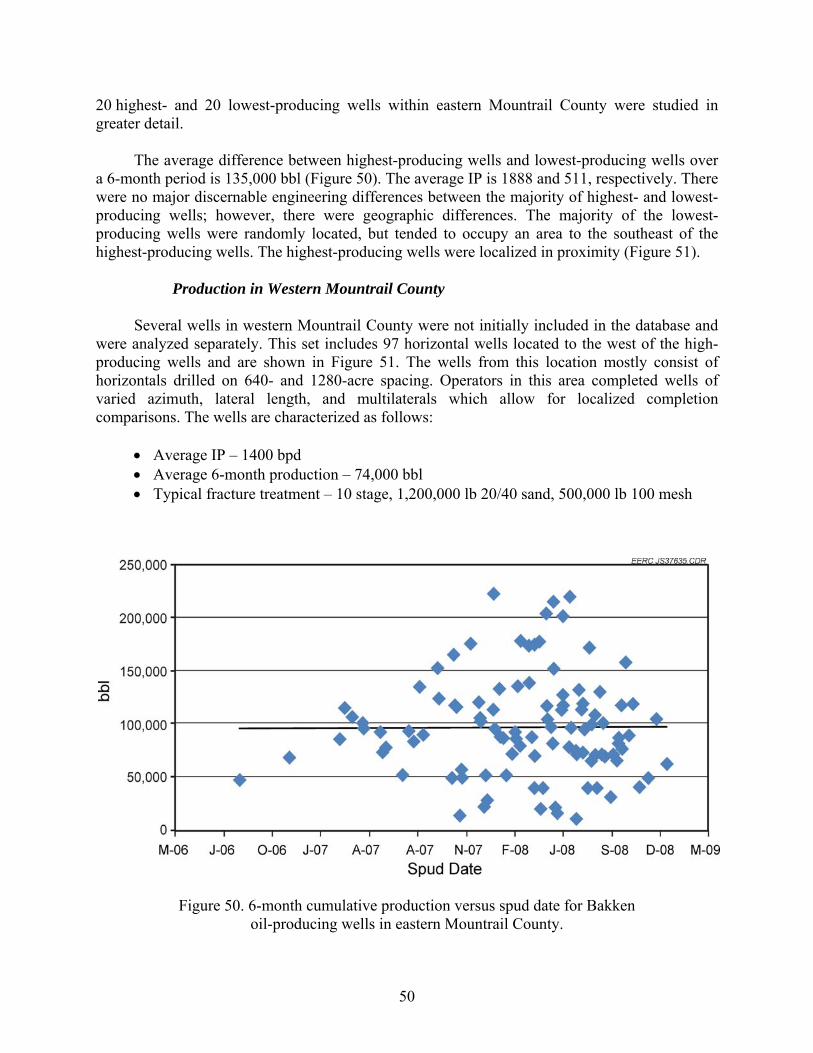
50
20 highest- and 20 lowest-producing wells within eastern Mountrail County were studied in greater detail.
The average difference between highest-producing wells and lowest-producing wells over a 6-month period is 135,000 bbl (Figure 50). The average IP is 1888 and 511, respectively. There were no major discernable engineering differences between the majority of highest- and lowest-producing wells; however, there were geographic differences. The majority of the lowest-producing wells were randomly located, but tended to occupy an area to the southeast of the highest-producing wells. The highest-producing wells were localized in proximity (Figure 51).
Production in Western Mountrail County
Several wells in western Mountrail County were not initially included in the database and were analyzed separately. This set includes 97 horizontal wells located to the west of the high-producing wells and are shown in Figure 51. The wells from this location mostly consist of horizontals drilled on 640- and 1280-acre spacing. Operators in this area completed wells of varied azimuth, lateral length, and multilaterals which allow for localized completion comparisons. The wells are characterized as follows:
• Average IP – 1400 bpd • Average 6-month production – 74,000 bbl • Typical fracture treatment – 10 stage, 1,200,000 lb 20/40 sand, 500,000 lb 100 mesh
Figure 50. 6-month cumulative production versus spud date for Bakken oil-producing wells in eastern Mountrail County.
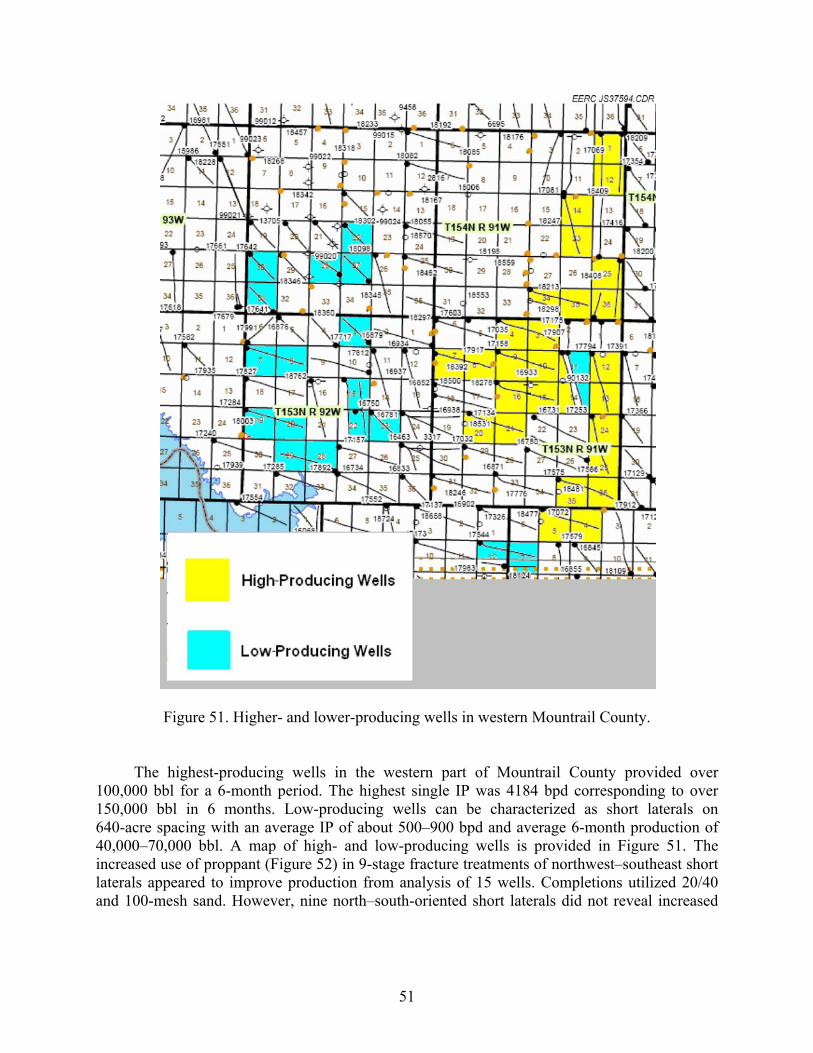
51
Figure 51. Higher- and lower-producing wells in western Mountrail County.
The highest-producing wells in the western part of Mountrail County provided over 100,000 bbl for a 6-month period. The highest single IP was 4184 bpd corresponding to over 150,000 bbl in 6 months. Low-producing wells can be characterized as short laterals on 640-acre spacing with an average IP of about 500–900 bpd and average 6-month production of 40,000–70,000 bbl. A map of high- and low-producing wells is provided in Figure 51. The increased use of proppant (Figure 52) in 9-stage fracture treatments of northwest–southeast short laterals appeared to improve production from analysis of 15 wells. Completions utilized 20/40 and 100-mesh sand. However, nine north–south-oriented short laterals did not reveal increased

52
Figure 52. Proppant (sand) totals and production from 640-acre short laterals.
production from the application of greater proppant. The production from the north–south wells was double the northwest-southeast wells, and the difference in production could potentially be attributed to differences in location and operator. The north–south short laterals utilized lesser amounts of 20/40 and 100-mesh sand and may have benefited from slickwater and gel as the primary fracture fluids.
High-producing wells in western Mountrail County consisted of long laterals on 1280-acre spacing and included northwest–southeast wells along either north–south azimuth of 340° or an E-W azimuth of 100°. There was no discernable difference in production versus azimuth. Production on average was 80,000–100,000 bbl over 6 months, with an average production greater than shorter laterals, and average IP of 1700 bpd. Although some short laterals produced 80,000–100,000 bbl, the majority of longer laterals outproduced short laterals (Figure 53). The long laterals were mostly fractured in 10 stages and injected with 2 million pounds of proppant. Proppant included 20/40 and 100 mesh. Two wells included 20-stage fracture treatments that produced 80,000–100,000 bbl over 6 months and reported initial production near 2000 bpd. The 20-stage fracture treatments are within proximity to other long and short laterals that produce significantly less oil. Also, there were two identical east–west trilateral completions on 1280 acres. The trilateral wells did not outperform other types of completions. The multilaterals produced approximately 90,000 bbl over 6 months. No open-hole single fracture treatments were analyzed within this area.
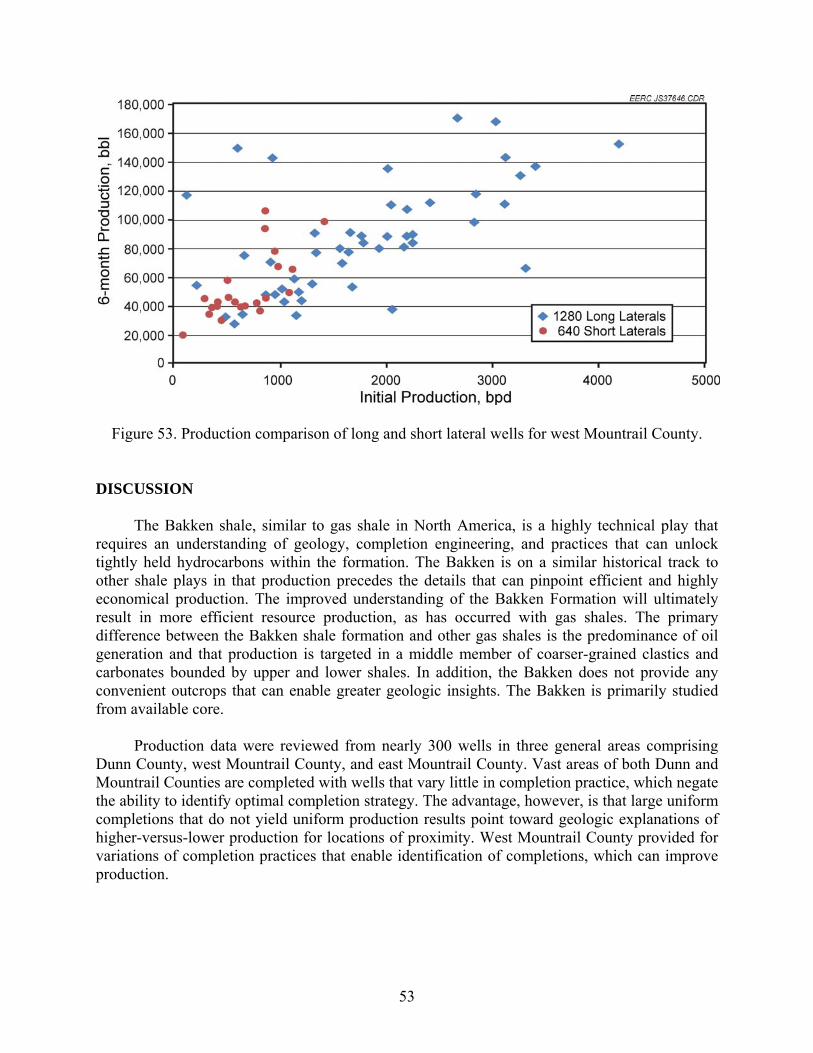
53
Figure 53. Production comparison of long and short lateral wells for west Mountrail County. DISCUSSION
The Bakken shale, similar to gas shale in North America, is a highly technical play that requires an understanding of geology, completion engineering, and practices that can unlock tightly held hydrocarbons within the formation. The Bakken is on a similar historical track to other shale plays in that production precedes the details that can pinpoint efficient and highly economical production. The improved understanding of the Bakken Formation will ultimately result in more efficient resource production, as has occurred with gas shales. The primary difference between the Bakken shale formation and other gas shales is the predominance of oil generation and that production is targeted in a middle member of coarser-grained clastics and carbonates bounded by upper and lower shales. In addition, the Bakken does not provide any convenient outcrops that can enable greater geologic insights. The Bakken is primarily studied from available core.
Production data were reviewed from nearly 300 wells in three general areas comprising
Dunn County, west Mountrail County, and east Mountrail County. Vast areas of both Dunn and Mountrail Counties are completed with wells that vary little in completion practice, which negate the ability to identify optimal completion strategy. The advantage, however, is that large uniform completions that do not yield uniform production results point toward geologic explanations of higher-versus-lower production for locations of proximity. West Mountrail County provided for variations of completion practices that enable identification of completions, which can improve production.
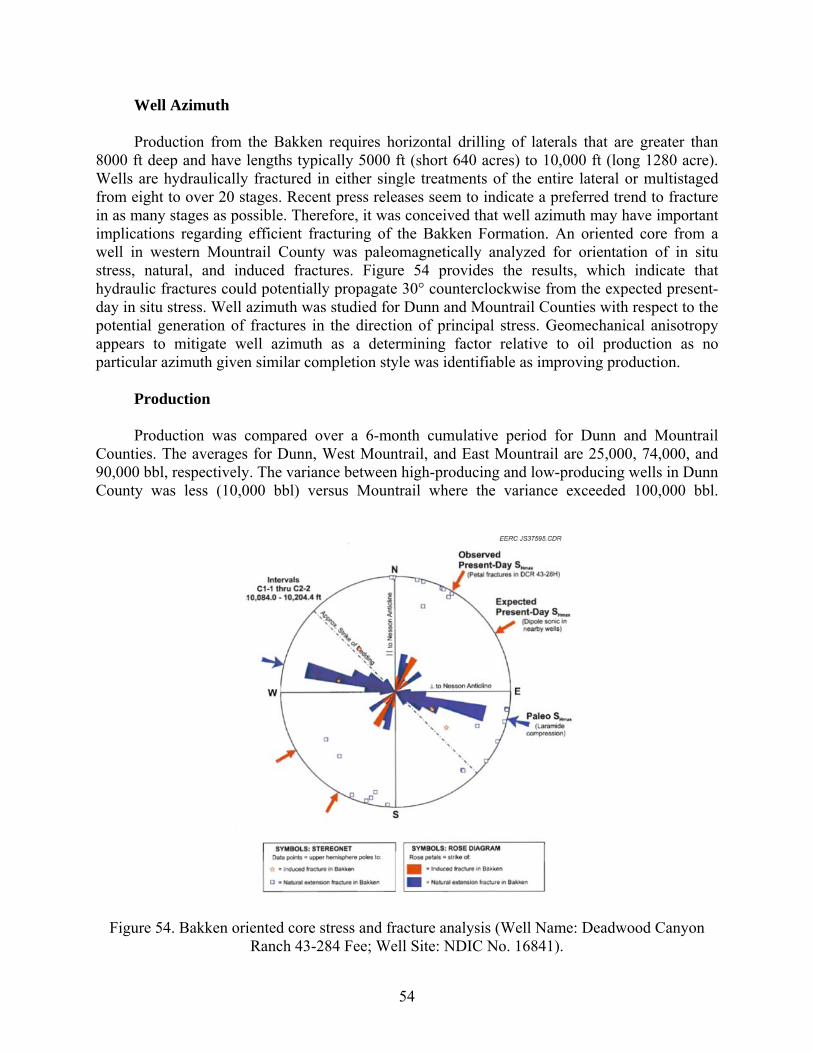
54
Well Azimuth
Production from the Bakken requires horizontal drilling of laterals that are greater than 8000 ft deep and have lengths typically 5000 ft (short 640 acres) to 10,000 ft (long 1280 acre). Wells are hydraulically fractured in either single treatments of the entire lateral or multistaged from eight to over 20 stages. Recent press releases seem to indicate a preferred trend to fracture in as many stages as possible. Therefore, it was conceived that well azimuth may have important implications regarding efficient fracturing of the Bakken Formation. An oriented core from a well in western Mountrail County was paleomagnetically analyzed for orientation of in situ stress, natural, and induced fractures. Figure 54 provides the results, which indicate that hydraulic fractures could potentially propagate 30° counterclockwise from the expected present-day in situ stress. Well azimuth was studied for Dunn and Mountrail Counties with respect to the potential generation of fractures in the direction of principal stress. Geomechanical anisotropy appears to mitigate well azimuth as a determining factor relative to oil production as no particular azimuth given similar completion style was identifiable as improving production.
Production
Production was compared over a 6-month cumulative period for Dunn and Mountrail Counties. The averages for Dunn, West Mountrail, and East Mountrail are 25,000, 74,000, and 90,000 bbl, respectively. The variance between high-producing and low-producing wells in Dunn County was less (10,000 bbl) versus Mountrail where the variance exceeded 100,000 bbl.
Figure 54. Bakken oriented core stress and fracture analysis (Well Name: Deadwood Canyon Ranch 43-284 Fee; Well Site: NDIC No. 16841).
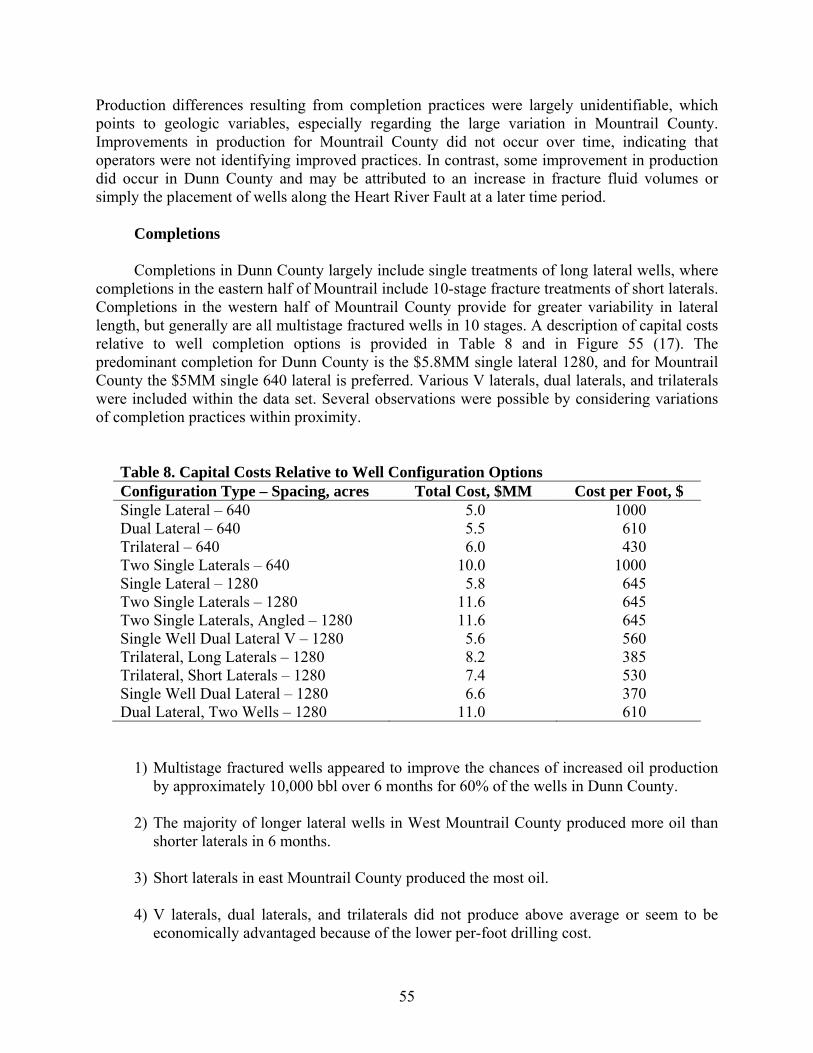
55
Production differences resulting from completion practices were largely unidentifiable, which points to geologic variables, especially regarding the large variation in Mountrail County. Improvements in production for Mountrail County did not occur over time, indicating that operators were not identifying improved practices. In contrast, some improvement in production did occur in Dunn County and may be attributed to an increase in fracture fluid volumes or simply the placement of wells along the Heart River Fault at a later time period.
Completions
Completions in Dunn County largely include single treatments of long lateral wells, where completions in the eastern half of Mountrail include 10-stage fracture treatments of short laterals. Completions in the western half of Mountrail County provide for greater variability in lateral length, but generally are all multistage fractured wells in 10 stages. A description of capital costs relative to well completion options is provided in Table 8 and in Figure 55 (17). The predominant completion for Dunn County is the $5.8MM single lateral 1280, and for Mountrail County the $5MM single 640 lateral is preferred. Various V laterals, dual laterals, and trilaterals were included within the data set. Several observations were possible by considering variations of completion practices within proximity.
Table 8. Capital Costs Relative to Well Configuration Options Configuration Type – Spacing, acres Total Cost, $MM Cost per Foot, $ Single Lateral – 640 5.0 1000 Dual Lateral – 640 5.5 610 Trilateral – 640 6.0 430 Two Single Laterals – 640 10.0 1000 Single Lateral – 1280 5.8 645 Two Single Laterals – 1280 11.6 645 Two Single Laterals, Angled – 1280 11.6 645 Single Well Dual Lateral V – 1280 5.6 560 Trilateral, Long Laterals – 1280 8.2 385 Trilateral, Short Laterals – 1280 7.4 530 Single Well Dual Lateral – 1280 6.6 370 Dual Lateral, Two Wells – 1280 11.0 610
1) Multistage fractured wells appeared to improve the chances of increased oil production by approximately 10,000 bbl over 6 months for 60% of the wells in Dunn County.
2) The majority of longer lateral wells in West Mountrail County produced more oil than
shorter laterals in 6 months. 3) Short laterals in east Mountrail County produced the most oil.
4) V laterals, dual laterals, and trilaterals did not produce above average or seem to be
economically advantaged because of the lower per-foot drilling cost.
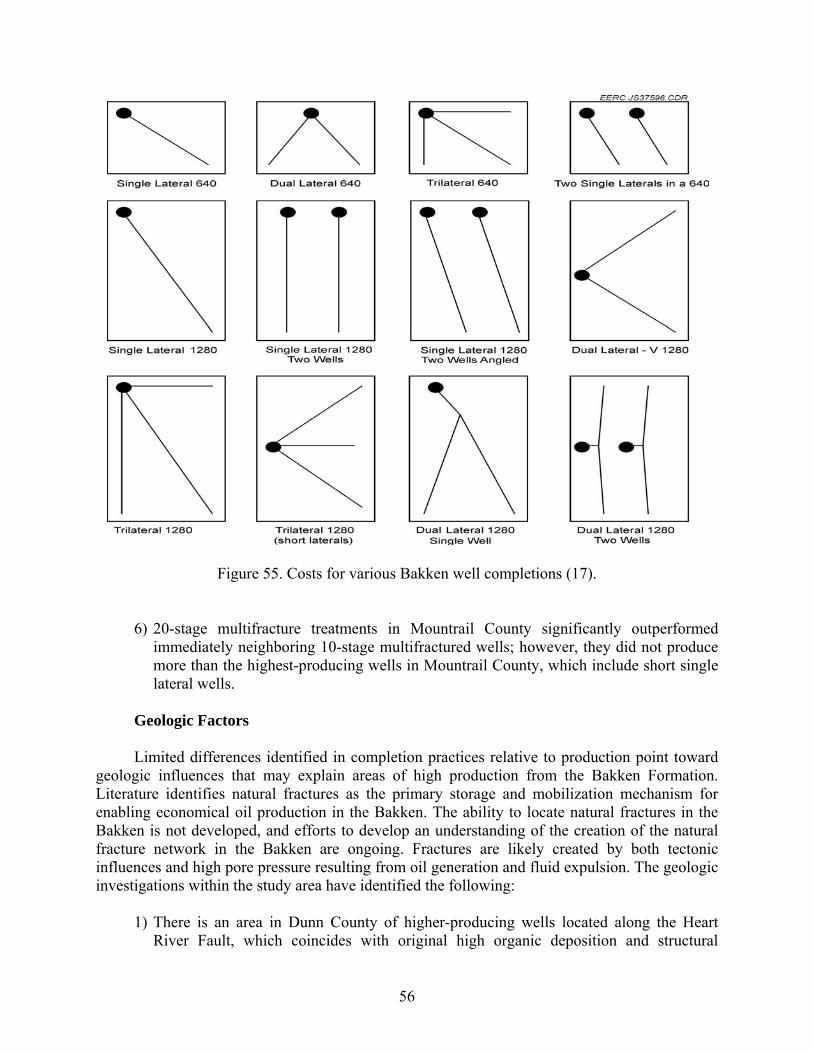
56
Figure 55. Costs for various Bakken well completions (17).
6) 20-stage multifracture treatments in Mountrail County significantly outperformed immediately neighboring 10-stage multifractured wells; however, they did not produce more than the highest-producing wells in Mountrail County, which include short single lateral wells.
Geologic Factors
Limited differences identified in completion practices relative to production point toward
geologic influences that may explain areas of high production from the Bakken Formation. Literature identifies natural fractures as the primary storage and mobilization mechanism for enabling economical oil production in the Bakken. The ability to locate natural fractures in the Bakken is not developed, and efforts to develop an understanding of the creation of the natural fracture network in the Bakken are ongoing. Fractures are likely created by both tectonic influences and high pore pressure resulting from oil generation and fluid expulsion. The geologic investigations within the study area have identified the following:
1) There is an area in Dunn County of higher-producing wells located along the Heart
River Fault, which coincides with original high organic deposition and structural
57
nosing. It is likely that both tectonic and relative high pore pressures have led to increased fractures within this area.
2) There is an area in Mountrail County of higher-producing wells that coincide with a
structural high, and correlate with generally thicker shale and localized higher TOC content of the lower Bakken shale.
3) L3 and the central basin facies are not present in the highest-producing area of
Mountrail County. 4) Mountrail County benefits from greater shale thicknesses and TOC, which have likely
produced greater pore pressures. The combination of greater structural influence and pore pressure-produced fractures is likely the cause of increased oil production in Mountrail versus Dunn County.
CONCLUSIONS
It has been demonstrated over the last decade that successful development of hydrocarbon production from shale is highly site-specific and requires local solutions based on the characteristics of the play. Although shale plays can vary significantly, they do exhibit some commonality in that the resources are typically low-permeability, require hydraulic facture stimulation, and require a thorough technical investigation to realize greater production potential. This project was conducted to identify production trends that may lead to a better understanding of what drives enhanced production potential of the Bakken Formation.
There is no question that a greater understanding of the natural fracture network system of
the Bakken is critical to improving production performance. Optimizing completion practices involving horizontal drilling and fracture stimulation is important to unlocking tightly held reservoir fluids. Horizontal drilling of the middle member of the Bakken coupled with multistage fracturing has outperformed all previously completed Bakken wells in North Dakota. However, geologic influences appear to be dictating the hydrocarbon production rates for given areas within North Dakota that have similar completion practices. Although, more detailed geologic study is required to further support the conclusions stated, the following trends within the middle Bakken Formation of Dunn and Mountrail Counties have been identified:
1) Production in Mountrail County greatly exceeds production in Dunn County and has
significantly higher variability. 2) The higher production of Mountrail County appears to be linked to greater TOC and
shale thicknesses, which together have the potential to create greater pore pressure-related fracturing.
3) The presence of structural elements, although different in both Dunn and Mountrail
Counties, is consistent with areas of higher production. The major contribution of these structural elements to successful production may not be as much their ability to serve as
58
traps as their influence on the creation of both natural and operationally induced fracture systems.
4) Higher production within Dunn County is associated with the Heart River Fault which
coincides with an area of high original TOC content. 5) Lithology could potentially play a role in oil mobility, an improved understanding of
which may serve to guide the design of stimulation practices and provide insight regarding future exploration efforts.
6) Multistage fracture completions appear to be outperforming lesser-stage completions
when compared in proximity. It appears that at least in some areas, multistage hydraulic fracturing should improve the chances of greater oil production.
7) Various multilateral wells do not appear to gain significant production advantage
despite lower per-foot drilling costs. 8) Well azimuth, although relevant to the direction of principal stress, does not appear to
be a factor regarding oil production.
9) Longer lateral wells appear to produce more oil when compared to shorter laterals within proximity.
REFERENCES 1. North Dakota Geological Survey, 2008, Structure on top of the Bakken Formation: North
Dakota Geological Survey Geologic Investigation 59, Bakken Formation Map Series, sheet 5.
2. Pittman, J.K., Price, L.C., and LeFever, J.A., 2001, Diagenesis and fracture development in
the Bakken Formation, Williston Basin—implications for reservoir quality in the middle member: U.S. Geological Survey Professional Paper 1653.
3. LeFever, R.D., and Crashell, J.J., 1991, Structural development of the Williston Basin in
southwestern North Dakota, in Christopher, J.E., and Haidl, F. (eds.), Proceedings of the 6th International Williston Basin Symposium: Saskatchewan Geological Society Special Publication 11, p. 222–233.
4. LeFever, J.A., and LeFever, R.D., 1995, Relationship of salt patterns to hydrocarbon
accumulations, North Dakota Williston Basin, in Hunter, L.D.V., and Schalla, R.A. (eds.), 7th International Williston Basin Symposium Guidebook: Montana Geological Society, p. 69–88.
5. Helms, L., and LeFever, J., 2006, Middle Bakken play technical problems and questions—
possible solutions: North Dakota Geological Survey Gologic Investigation 16, presented to the North Dakota Petroleum Council, April.
59
6. Nordeng, S.H., LeFever, J.A., Anderson, M. B., and Johnson, E.H., 2010, An examination of the factors that impact oil production from the middle member of the Bakken Formation in Mountrail County, North Dakota: North Dakota Geologic Survey Report on Investigation 109.
7. Meissner, F.F., 1978, Petroleum geology of the Bakken Formation, Williston Basin, North
Dakota and Montana, in The economic geology of the Williston Basin, 1978 Williston Basin Symposium, Billings, Montana: Montana Geological Society, p. 207–230.
8. Krystinik, K.B., and Charperntier, R.R., 1987, Statistical model for source rock maturity and
organic richness using well-log data, Bakken Formation, Williston Basin, United States: Geologic Notes, The American Association of Petroleum Geologists Bulletin, v. 71, no. 1.
9. Meissner, F.F., 1984, Petroleum geology of the Bakken Formation, Williston basin, North
Dakota and Montana, in G. Demaison and R. J. Murris, eds., Petroleum geochemistry and basin evaluation: AAPG Memoir 35, p. 159–179.
10. LeFever, J.A., 2008, North Dakota Geologic Survey Geologic Investigation 63, Bakken
Formation Map Series, sheets 1–6. 11. Grape, S.G., 2006, Technology-based oil and natural gas plays: Energy Information
Administration Office of Oil and Gas, Reserves and Production Division, November, 9 p. 12. Besler, M.R., Steele, J.W., Egan, T., and Wagner, J., 2007, Improving well productivity and
profitability in the Bakken—a summary of our experiences drilling, stimulating, and operating horizontal wells: Society of Petroleum Engineers SPE-110679.
13. Kuhlman, R.D., Perez, J.I., and Claiborne, E.B., 1992, Microfracture stress tests, anelastic
strain recovery, and differential strain analysis assist in Bakken Shale Horizontal Drilling Program: Society of Petroleum Engineers SPE-24379.
14. Roundtree, R., Eberhard, M., and Barree, R., 2009, Horizontal, near-wellbore stress effects
on fracture initiation: Society of Petroleum Engineers SPE-123589. 15. Dunek, K.L., Walser, D. W., and Astakhov, D. K., 2009, Far-field volumetric distribution of
fracturing fluids away from an uncemented horizontal liner in the Bakken Formation: Society of Petroleum Engineers SPE-115826.
16. Chaabouni, H., Baux, P., Manalu, D., and Sobirin, M., 2008, A case study of oil-based mud
effect on horizontal-well productivity: Society of Petroleum Engineers SPE-112077. 17. Miller, B., 2009, Successful Bakken multistage frac using frac-sleeves and swell-packers:
American Association of Drilling Engineers Symposium.
60
FIGURE REFERENCES Bohrer, M., Fried, S., Helms, L., Hicks, B., Juenker, B., McCusker, D., Anderson, F., LeFever,
J., Murphy, E., and Nordeng, S., 2008, Bakken Formation Resource Study Project: North Dakota Department of Mineral Resources Report, 23 p.
Dow, W.G., 1974, Application of oil correlation and source rock data to exploration in Williston
Basin: American Association of Petroleum Geologists Bulletin, v. 58, p. 1253–1262. Flannery, J., and Kraus, J., 2006, Integrated analysis of the Bakken petroleum system, U.S.
Williston Basin: American Association of Petroleum Geologists Search and Discovery Article 10105.
Meissner, F.F., and Banks, R.B., 2000, Computer simulation of hydrocarbon generation,
migration, and accumulation under hydrodynamic conditions – examples from the Williston and San Juan Basins, USA: American Association of Petroleum Geologists Search and Discovery Article 40179.
Price, L.C., 1999. Origins and characteristics of the basin-centered continuous-reservoir
unconventional oil resource base of the Bakken source system, Williston Basin: Unpublished manuscript, www.undeerc.org/Price (accessed January 2010).
Sandberg, C.A., 1962, Stratigraphic section of type Three Forks and Jefferson Formations at
Logan, Montana, in Billings Geological Society 13th Annual Field Conference: Proceedings, p. 47–50.
Schmoker, J.W., and Hester, T.C., 1983, Organic carbon in the Bakken Formation, United States
portion of Williston Basin: American Association of Petroleum Geologists Bulletin, v. 67, no. 12, p. 2165–2174.
U.S. Geological Survey, 2008, Assessment of undiscovered oil resources in the Devonian–
Mississippian Bakken Formation, Williston Basin province, Montana and North Dakota, 2008: U.S. Geological Survey Fact Sheet 2008–3021, April, 2 p.
Webster, R.L., 1982, Analysis of petroleum source rocks of the Bakken Formation (Devonian
and Mississippian) in North Dakota: Master’s Thesis, University of North Dakota, Grand Forks, North Dakota, 150 p.
OTHER RELEVANT LITERATURE Cook, D.M., 2010, Evaluations critical in resource plays—special report oil & gas shales: The
American Oil & Gas Reporter, February, p. 58–59.
61
LeFever, J., and Helms, L., 2008, Bakken Formation reserve estimates: North Dakota Geological Survey white paper, Bismarck, North Dakota, North Dakota Geological Survey, March, 6 p.
LeFever, J.A., 2008, North Dakota Geologic Survey Geologic Investigation 59, Bakken Formation Map Series, sheets 2–4.
LeFever, J.A., 1991, History of oil production from the Bakken Formation, North Dakota, in
1991 guidebook to geology and horizontal drilling of the Bakken Formation: Billings Montana, Montana Geological Society.
Murray, G.H., 1968, Quantitative fracture study—Sanish Pool, McKenzie County, North
Dakota: American Association of Petroleum Geologists Bulletin, v. 52, p. 57–65. Sonnenberg, S.A., and Pramudito, A., 2009, Petroleum geology of the Giant Elm Coulee Field,
Williston Basin: AAPG Bulletin, v. 93, no. 9, p. 1127–1153.
APPENDIX A
MAPS OF KEY GEOLOGICAL CHARACTERISTICS OF THE BAKKEN FORMATION IN THE DUNN COUNTY–
MOUNTRAIL COUNTY STUDY AREA
A-1
MAPS OF KEY GEOLOGICAL CHARACTERISTICS OF THE BAKKEN FORMATION IN THE DUNN COUNTY–MOUNTRAIL COUNTY STUDY AREA
The maps presented in this appendix are modified from LeFever (2008), a map series published by the North Dakota Geological Survey. The maps show selected geological and geochemical parameters as they occur across the Dunn County–Mountrail County study area. Parameters include thickness isopachs of the upper, middle, and lower members of the Bakken Formation; total organic carbon of the upper and lower Bakken Formation; maximum temperature of the upper and lower Bakken Formation; and hydrogen index of the upper and lower Bakken Formation. Reference LeFever, J.A., 2008, North Dakota Geologic Survey Geologic Investigation 59, Bakken Formation Map Series, sheets 2–4.
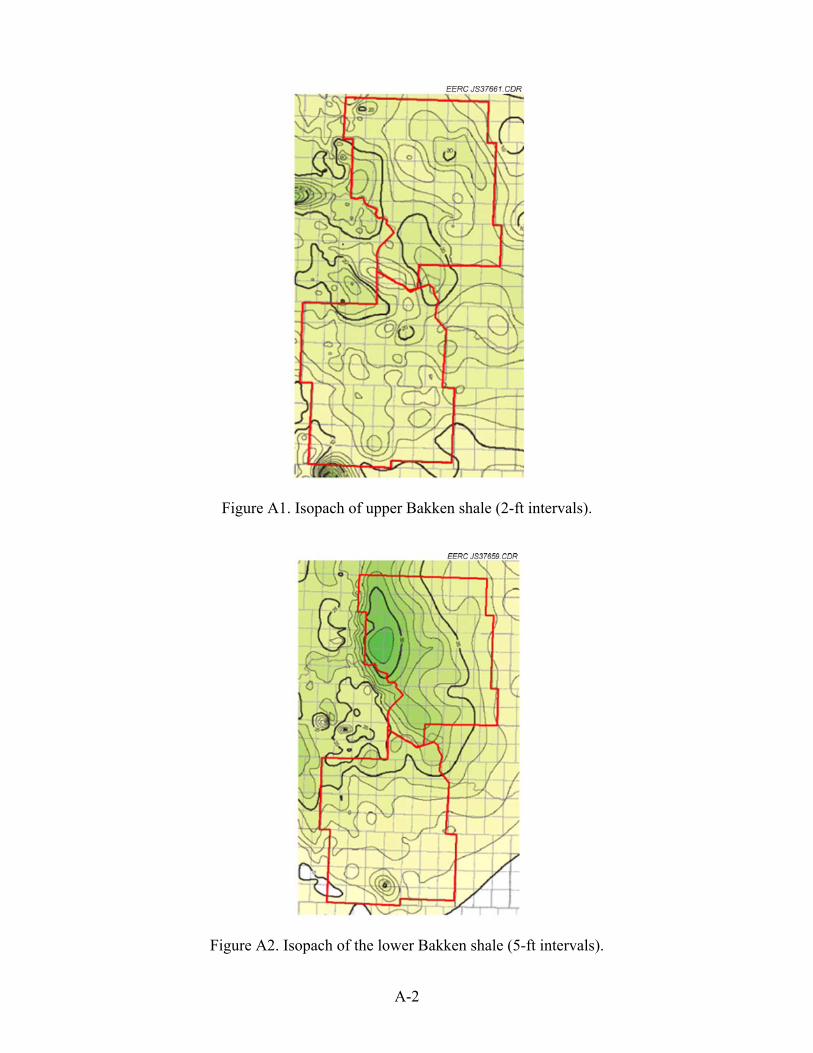
A-2
Figure A1. Isopach of upper Bakken shale (2-ft intervals).
Figure A2. Isopach of the lower Bakken shale (5-ft intervals).
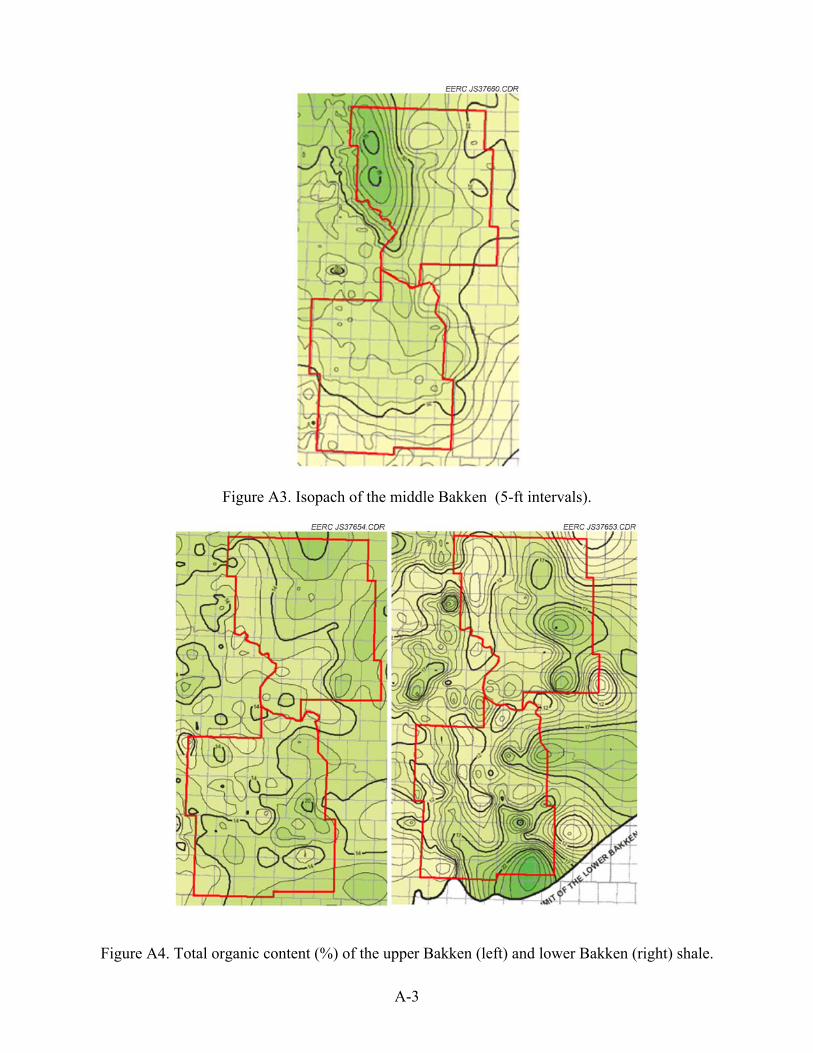
A-3
Figure A3. Isopach of the middle Bakken (5-ft intervals).
Figure A4. Total organic content (%) of the upper Bakken (left) and lower Bakken (right) shale.
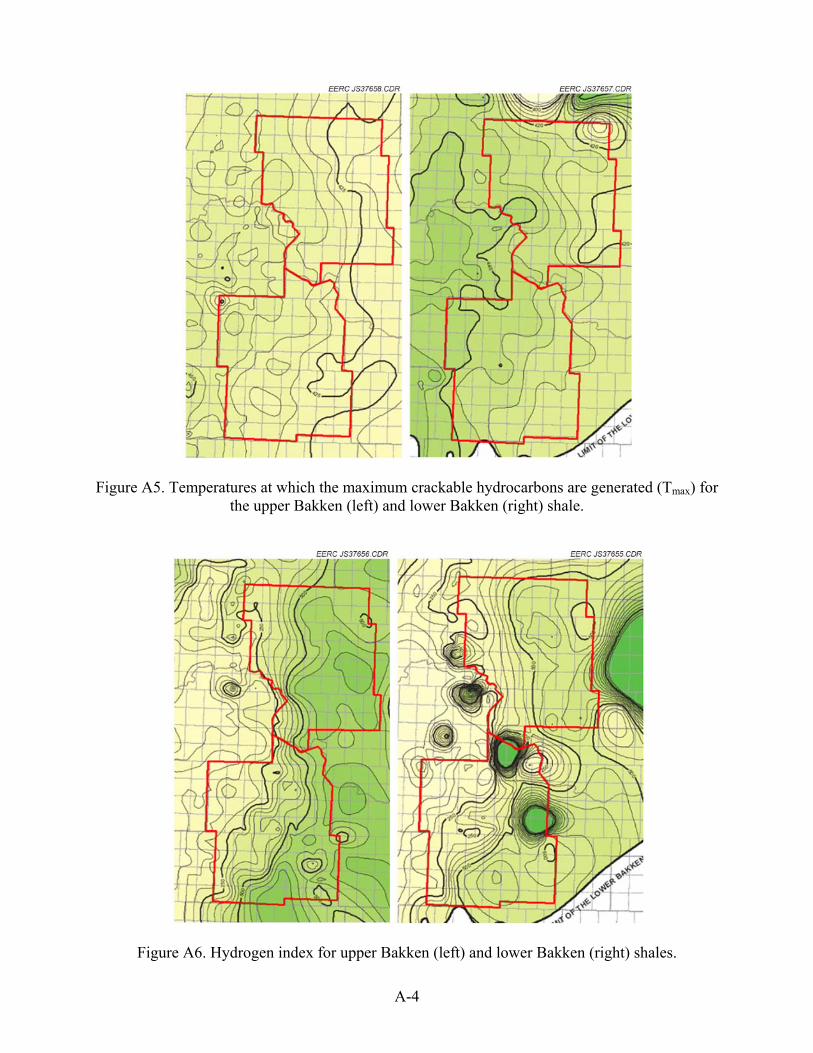
A-4
Figure A5. Temperatures at which the maximum crackable hydrocarbons are generated (Tmax) for the upper Bakken (left) and lower Bakken (right) shale.
Figure A6. Hydrogen index for upper Bakken (left) and lower Bakken (right) shales.
APPENDIX B
KEY ELEMENTS AND IMAGES OF THE STATIC PETROPHYSICAL MODEL OF THE BAKKEN FORMATION IN DUNN COUNTY,
NORTH DAKOTA
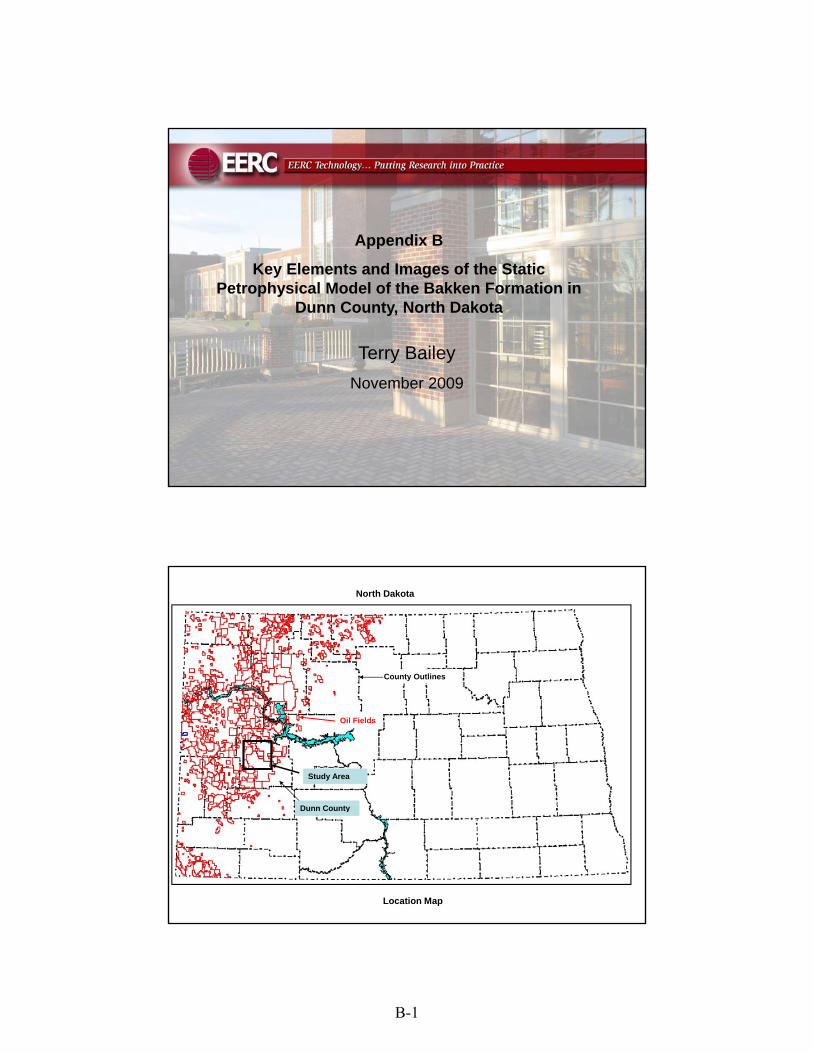
Appendix Bpp
Key Elements and Images of the Static Petrophysical Model of the Bakken Formation in
Dunn County, North Dakota
Terry BaileyNovember 2009
County Outlines
North Dakota
Study Area
Oil Fields
Location Map
Dunn County
B-1
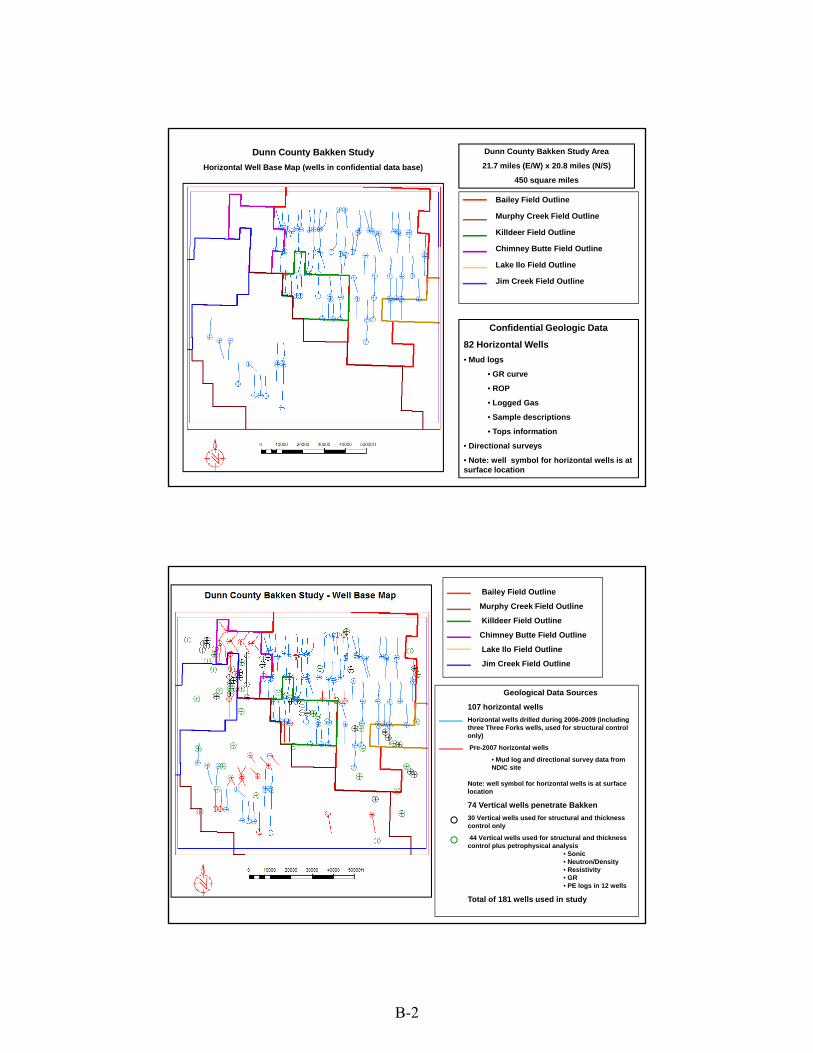
Dunn County Bakken Study Area
21.7 miles (E/W) x 20.8 miles (N/S)
450 square miles
Bailey Field Outline
Murphy Creek Field Outline
Killdeer Field Outline
Chimney Butte Field Outline
Dunn County Bakken StudyHorizontal Well Base Map (wells in confidential data base)
Confidential Geologic Data
82 Horizontal Wells• Mud logs
Chimney Butte Field Outline
Lake Ilo Field Outline
Jim Creek Field Outline
• GR curve
• ROP
• Logged Gas
• Sample descriptions
• Tops information
• Directional surveys
• Note: well symbol for horizontal wells is at surface location
Bailey Field Outline
Murphy Creek Field Outline
Killdeer Field Outline
Chimney Butte Field Outline
Lake Ilo Field Outline
Jim Creek Field Outline
Geological Data Sources
107 horizontal wellsHorizontal wells drilled during 2006-2009 (including three Three Forks wells, used for structural control only)
Pre-2007 horizontal wells
• Mud log and directional survey data from NDIC site
Note: well symbol for horizontal wells is at surface location
74 Vertical wells penetrate Bakken74 Vertical wells penetrate Bakken30 Vertical wells used for structural and thickness control only
44 Vertical wells used for structural and thickness control plus petrophysical analysis
• Sonic• Neutron/Density• Resistivity • GR• PE logs in 12 wells
Total of 181 wells used in study
B-2
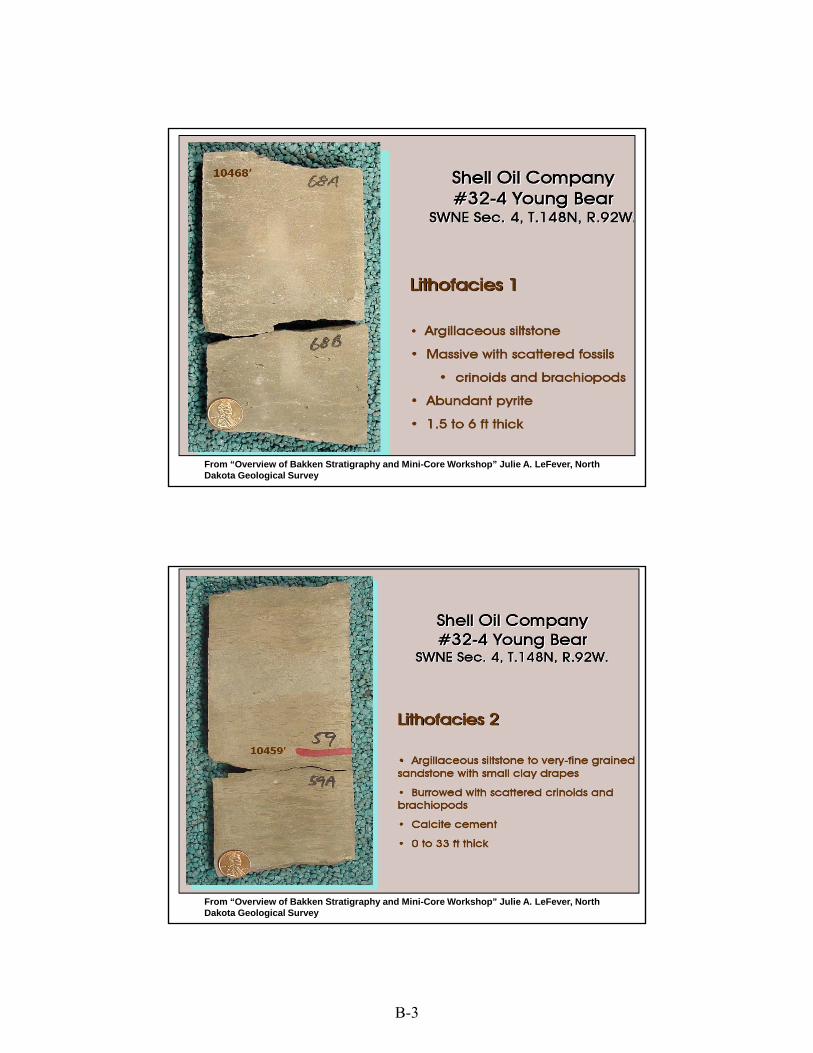
From “Overview of Bakken Stratigraphy and Mini-Core Workshop” Julie A. LeFever, North Dakota Geological Survey
From “Overview of Bakken Stratigraphy and Mini-Core Workshop” Julie A. LeFever, North Dakota Geological Survey
B-3
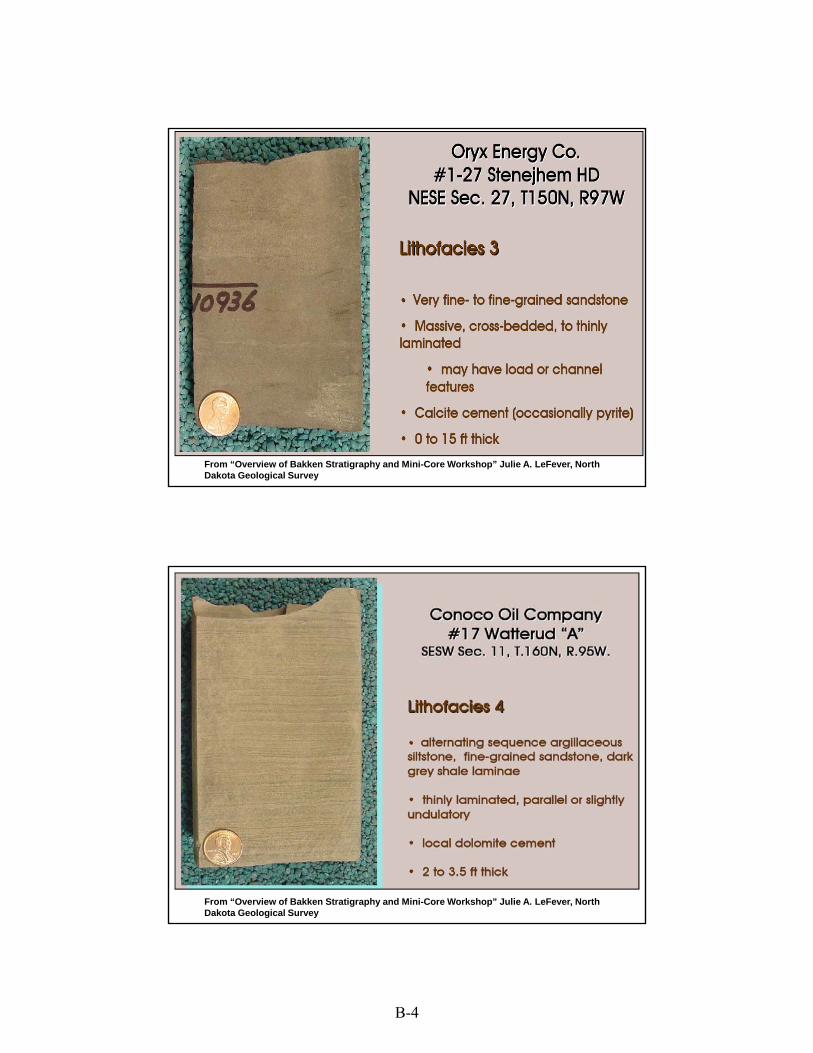
From “Overview of Bakken Stratigraphy and Mini-Core Workshop” Julie A. LeFever, North Dakota Geological Survey
From “Overview of Bakken Stratigraphy and Mini-Core Workshop” Julie A. LeFever, North Dakota Geological Survey
B-4

From “Overview of Bakken Stratigraphy and Mini-Core Workshop” Julie A. LeFever, North Dakota Geological Survey
From “Overview of Bakken Stratigraphy and Mini-Core Workshop” Julie A. LeFever, North Dakota Geological Survey
B-5
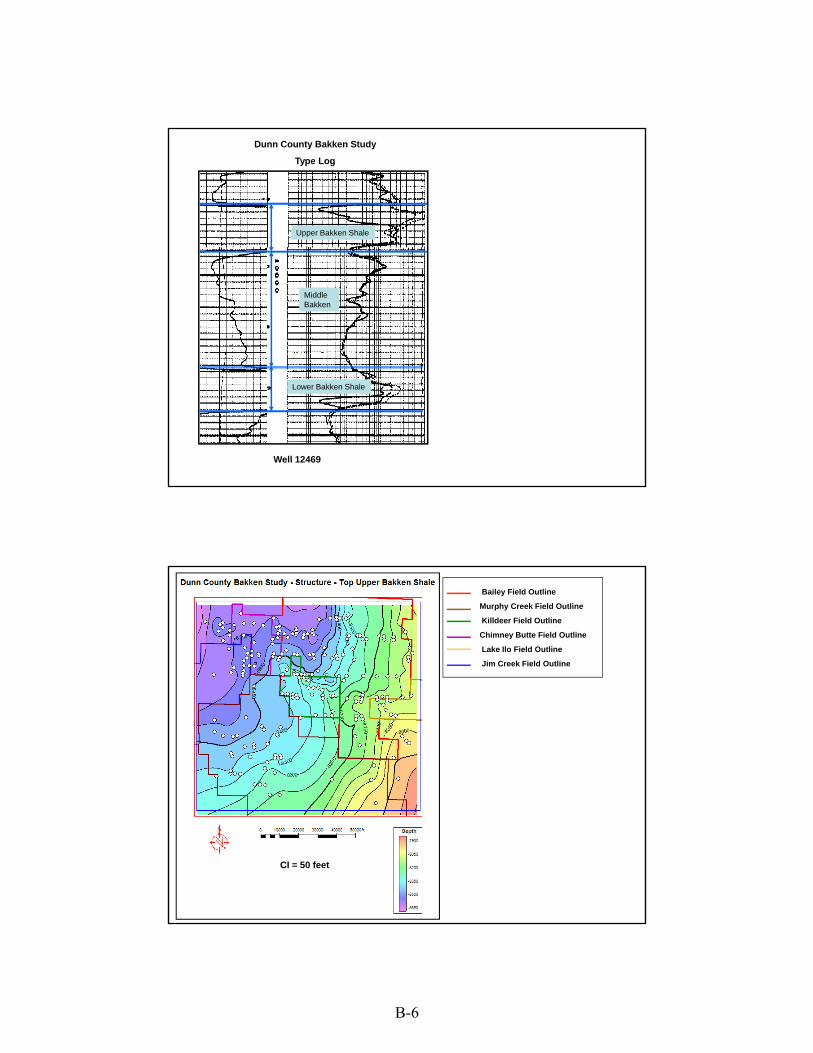
Dunn County Bakken Study
Type Log
Upper Bakken Shale
Middle Bakken
Well 12469
Lower Bakken Shale
Bailey Field Outline
Murphy Creek Field Outline
Killdeer Field Outline
Chimney Butte Field Outline
Lake Ilo Field Outline
Jim Creek Field Outline
CI = 50 feet
B-6
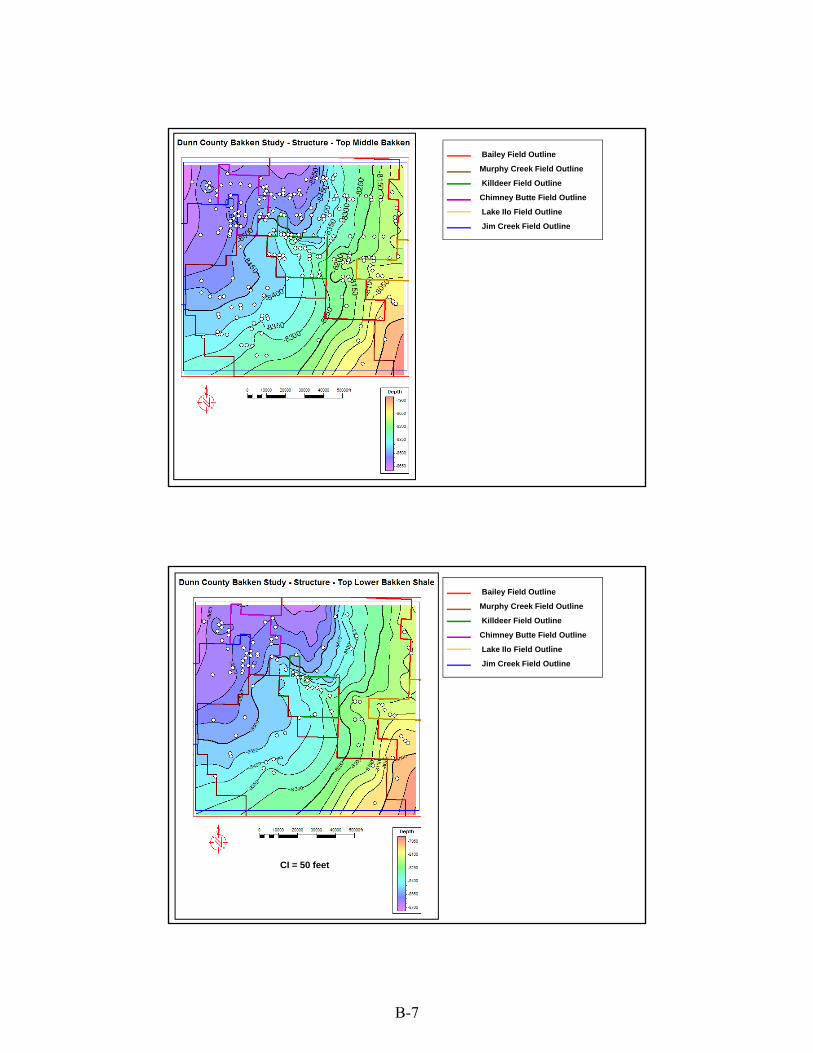
Bailey Field Outline
Murphy Creek Field Outline
Killdeer Field Outline
Chimney Butte Field Outline
Lake Ilo Field Outline
Jim Creek Field Outline
CI = 50 feet
Bailey Field Outline
Murphy Creek Field Outline
Killdeer Field Outline
Chimney Butte Field Outline
Lake Ilo Field Outline
Jim Creek Field Outline
CI = 50 feet
B-7

Bailey Field Outline
Murphy Creek Field Outline
Killdeer Field Outline
Chimney Butte Field Outline
Lake Ilo Field Outline
Jim Creek Field Outline
CI = 50 feet
Dunn County Bakken 3D model(200 feet x 200 feet grid size)
Top Middle Bakken (transparency set at 50% to allow viewing of horizontal well paths
Vertical Exaggeration = 25x Contour Interval = 50 feet
B-8
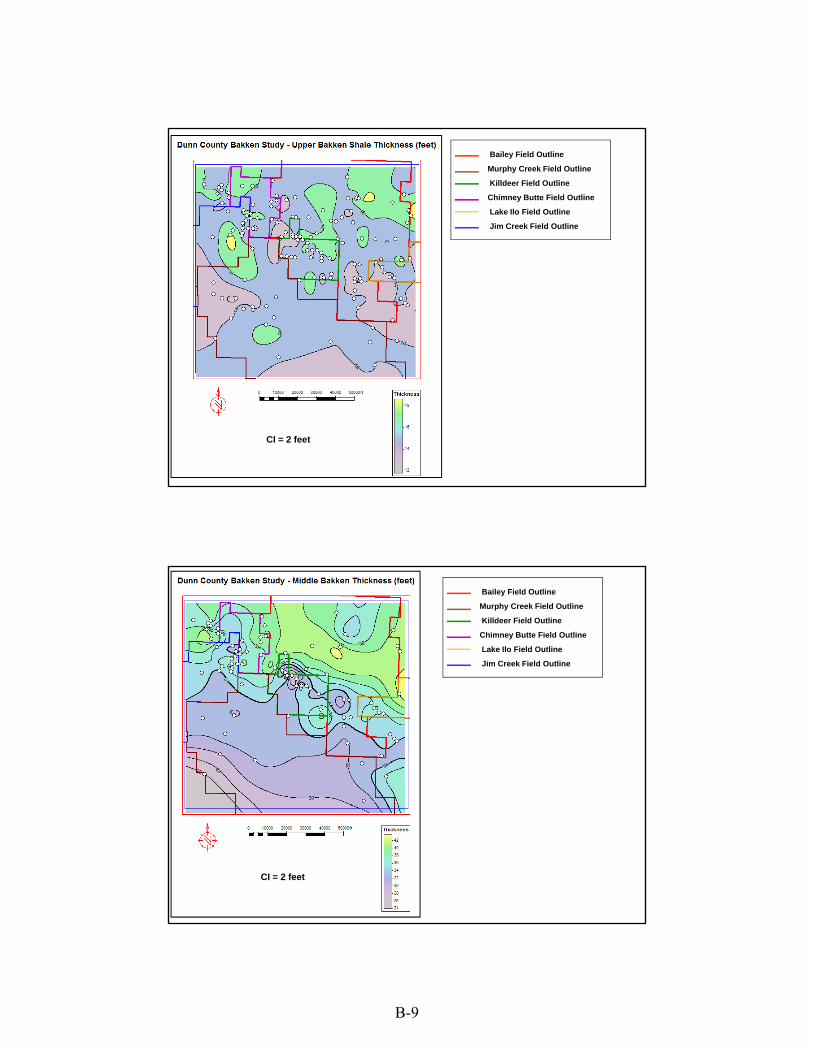
Bailey Field Outline
Murphy Creek Field Outline
Killdeer Field Outline
Chimney Butte Field Outline
Lake Ilo Field Outline
Jim Creek Field Outline
CI = 2 feet
Bailey Field Outline
Murphy Creek Field Outline
Killdeer Field Outline
Chimney Butte Field Outline
Lake Ilo Field Outline
Jim Creek Field Outline
CI = 2 feet
B-9
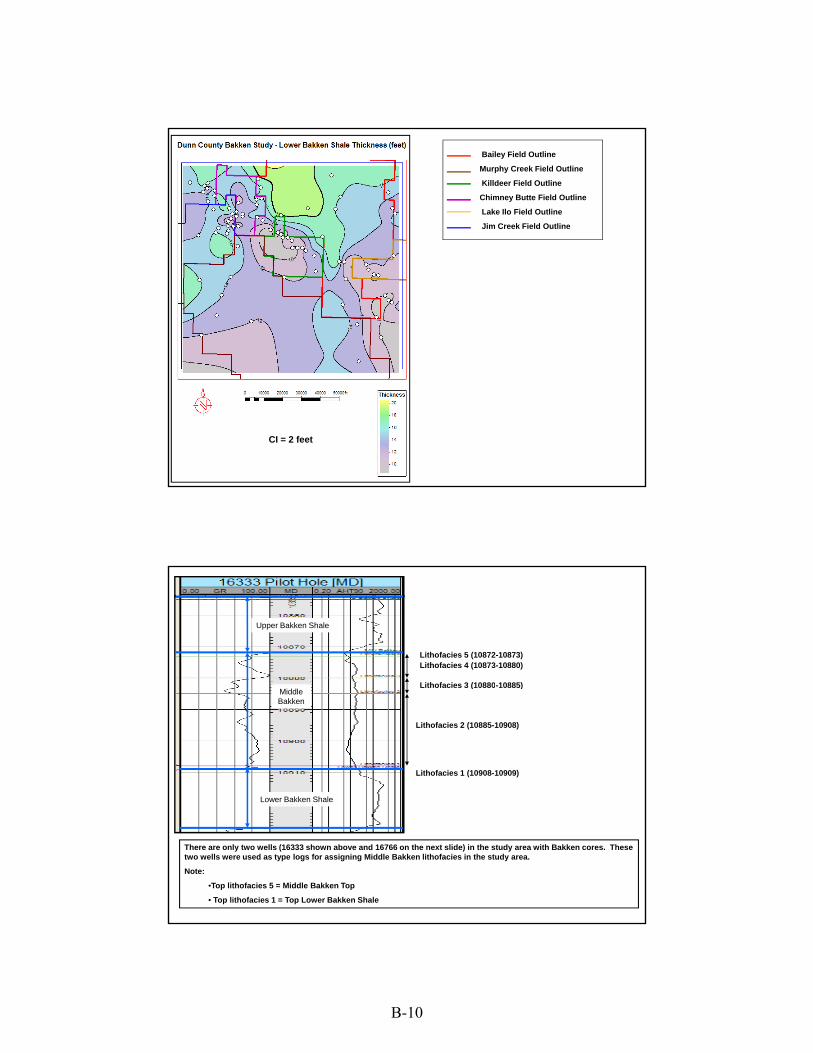
Bailey Field Outline
Murphy Creek Field Outline
Killdeer Field Outline
Chimney Butte Field Outline
Lake Ilo Field Outline
Jim Creek Field Outline
CI = 2 feet
Lithofacies 5 (10872-10873) Lithofacies 4 (10873-10880)
Lithofacies 3 (10880 10885)
Upper Bakken Shale
Lithofacies 3 (10880-10885)
Lithofacies 2 (10885-10908)
Lithofacies 1 (10908-10909)
Lower Bakken Shale
Middle Bakken
There are only two wells (16333 shown above and 16766 on the next slide) in the study area with Bakken cores. These two wells were used as type logs for assigning Middle Bakken lithofacies in the study area.
Note:
•Top lithofacies 5 = Middle Bakken Top
• Top lithofacies 1 = Top Lower Bakken Shale
B-10
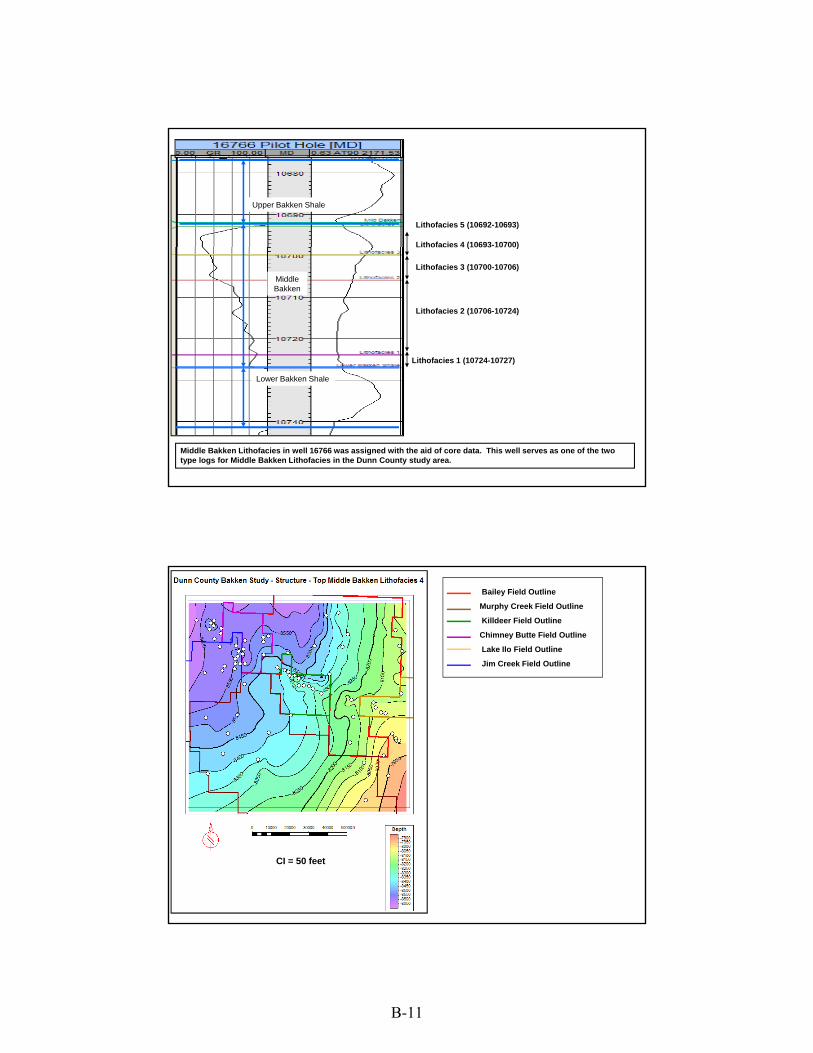
Upper Bakken Shale
Lithofacies 5 (10692-10693)
Lithofacies 4 (10693-10700)
Middle Bakken
( )
Lithofacies 3 (10700-10706)
Lithofacies 2 (10706-10724)
Lithofacies 1 (10724-10727)
Middle Bakken Lithofacies in well 16766 was assigned with the aid of core data. This well serves as one of the two type logs for Middle Bakken Lithofacies in the Dunn County study area.
Lower Bakken Shale
Bailey Field Outline
Murphy Creek Field Outline
Killdeer Field Outline
Chimney Butte Field Outline
Lake Ilo Field Outline
Jim Creek Field Outline
CI = 50 feet
B-11
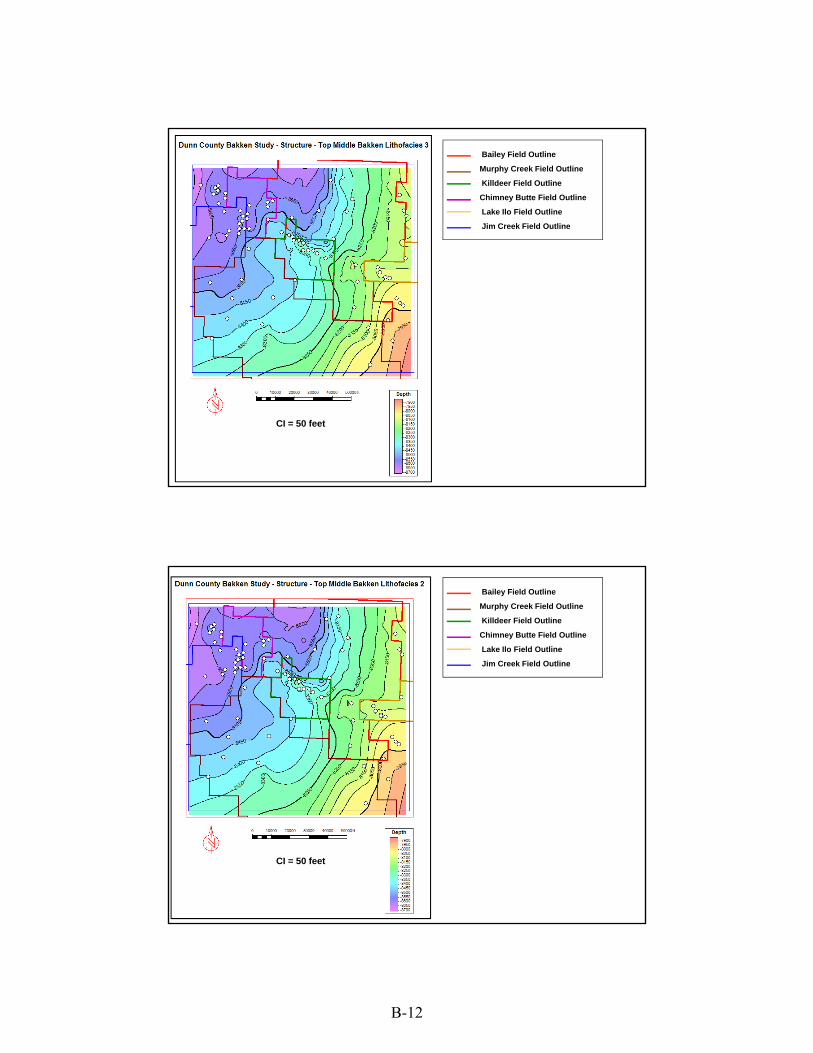
Bailey Field Outline
Murphy Creek Field Outline
Killdeer Field Outline
Chimney Butte Field Outline
Lake Ilo Field Outline
Jim Creek Field Outline
CI = 50 feet
Bailey Field Outline
Murphy Creek Field Outline
Killdeer Field Outline
Chimney Butte Field Outline
Lake Ilo Field Outline
Jim Creek Field Outline
CI = 50 feet
B-12
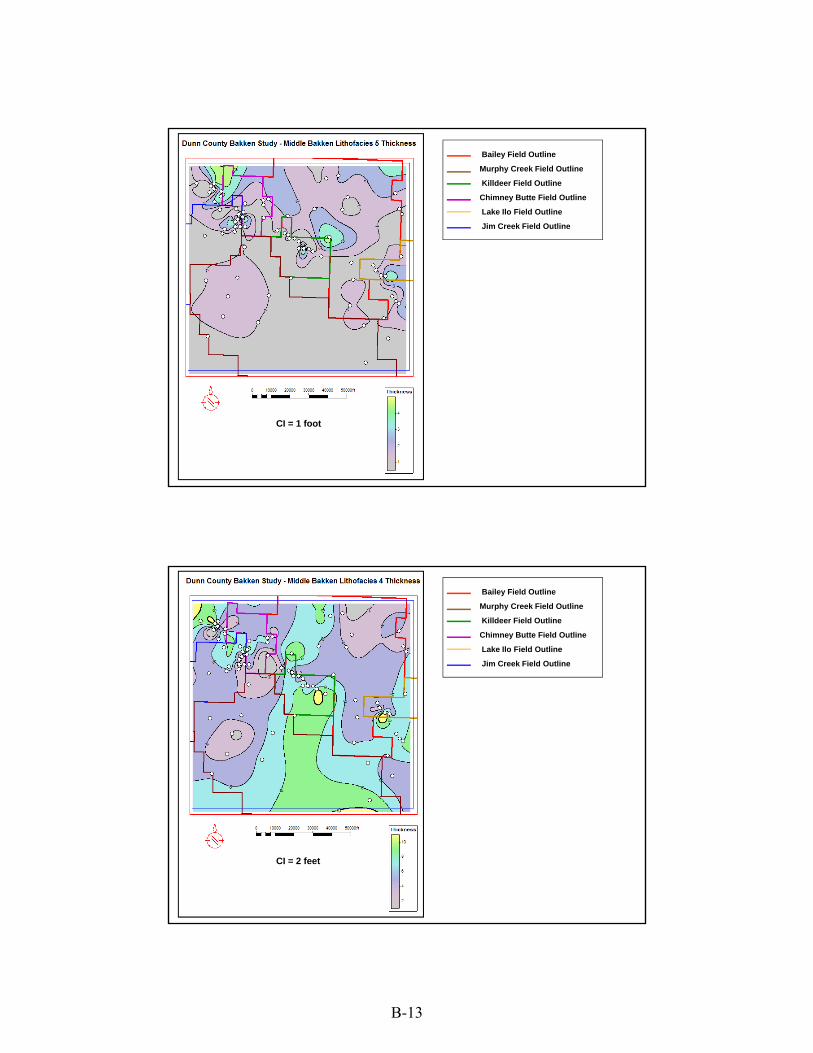
Bailey Field Outline
Murphy Creek Field Outline
Killdeer Field Outline
Chimney Butte Field Outline
Lake Ilo Field Outline
Jim Creek Field Outline
CI = 1 foot
Bailey Field Outline
Murphy Creek Field Outline
Killdeer Field Outline
Chimney Butte Field Outline
Lake Ilo Field Outline
Jim Creek Field Outline
CI = 2 feet
B-13

Bailey Field Outline
Murphy Creek Field Outline
Killdeer Field Outline
Chimney Butte Field Outline
Lake Ilo Field Outline
Jim Creek Field Outline
CI = 2 feet
Bailey Field Outline
Murphy Creek Field Outline
Killdeer Field Outline
Chimney Butte Field Outline
Lake Ilo Field Outline
Jim Creek Field Outline
CI = 2 feet
B-14

Bailey Field Outline
Murphy Creek Field Outline
Killdeer Field Outline
Chimney Butte Field Outline
Lake Ilo Field Outline
Jim Creek Field Outline
CI = 1 foot
1
2
3
4
5
6
7
8
9
10
11
Dunn County Bakken Study
Cuttings lithology along HW path
12
13
14
15
16
17
18
19
20
21
22
23
24
25
26
27
28
29
Lithology penetrated by horizontal well paths as described on mud logs. A continuous lithology log was created by assigning a numerical code (shown at left above) at one foot intervals to the well path. The resulting lithology log was up-scaled into the 3D model by assigning the most abundant value to every 200 x 200 cell. Results are displayed on the above map.
N
B-15
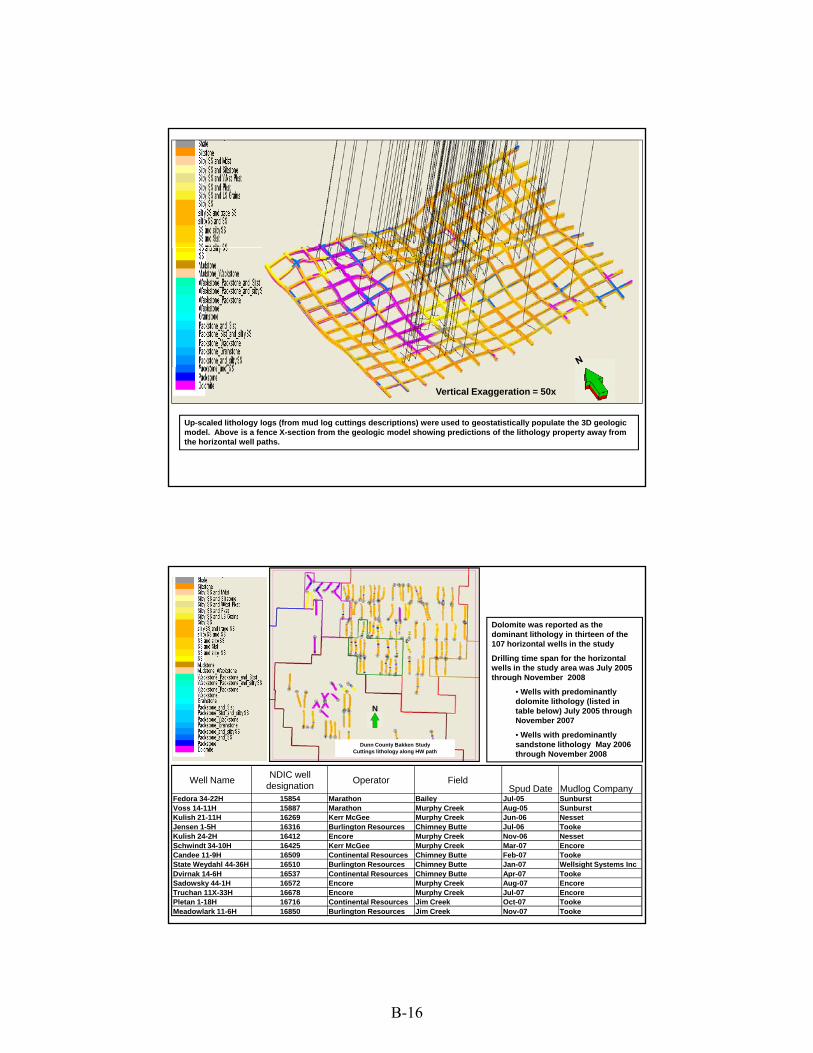
Up-scaled lithology logs (from mud log cuttings descriptions) were used to geostatistically populate the 3D geologic model. Above is a fence X-section from the geologic model showing predictions of the lithology property away from the horizontal well paths.
Vertical Exaggeration = 50x
Dolomite was reported as the dominant lithology in thirteen of the 107 horizontal wells in the study
Drilling time span for the horizontal wells in the study area was July 2005 through November 2008
Well Name NDIC well designation Operator Field
Spud Date Mudlog CompanyFedora 34-22H 15854 Marathon Bailey Jul-05 Sunburst
• Wells with predominantly dolomite lithology (listed in table below) July 2005 through November 2007
• Wells with predominantly sandstone lithology May 2006 through November 2008
Dunn County Bakken StudyCuttings lithology along HW path
N
Voss 14-11H 15887 Marathon Murphy Creek Aug-05 SunburstKulish 21-11H 16269 Kerr McGee Murphy Creek Jun-06 NessetJensen 1-5H 16316 Burlington Resources Chimney Butte Jul-06 TookeKulish 24-2H 16412 Encore Murphy Creek Nov-06 NessetSchwindt 34-10H 16425 Kerr McGee Murphy Creek Mar-07 EncoreCandee 11-9H 16509 Continental Resources Chimney Butte Feb-07 TookeState Weydahl 44-36H 16510 Burlington Resources Chimney Butte Jan-07 Wellsight Systems IncDvirnak 14-6H 16537 Continental Resources Chimney Butte Apr-07 TookeSadowsky 44-1H 16572 Encore Murphy Creek Aug-07 EncoreTruchan 11X-33H 16678 Encore Murphy Creek Jul-07 EncorePletan 1-18H 16716 Continental Resources Jim Creek Oct-07 TookeMeadowlark 11-6H 16850 Burlington Resources Jim Creek Nov-07 Tooke
B-16
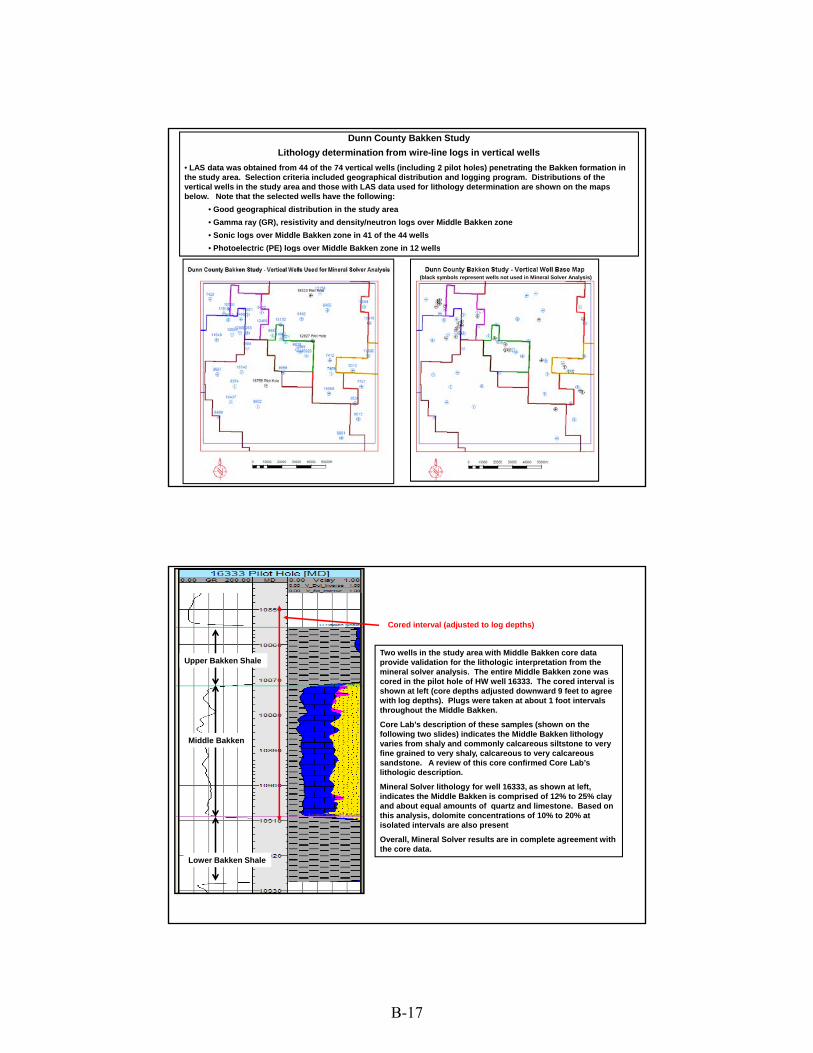
Dunn County Bakken StudyLithology determination from wire-line logs in vertical wells
• LAS data was obtained from 44 of the 74 vertical wells (including 2 pilot holes) penetrating the Bakken formation in the study area. Selection criteria included geographical distribution and logging program. Distributions of the vertical wells in the study area and those with LAS data used for lithology determination are shown on the maps below. Note that the selected wells have the following:
• Good geographical distribution in the study area• Gamma ray (GR), resistivity and density/neutron logs over Middle Bakken zone• Sonic logs over Middle Bakken zone in 41 of the 44 wells• Photoelectric (PE) logs over Middle Bakken zone in 12 wells• Photoelectric (PE) logs over Middle Bakken zone in 12 wells
(black symbols represent wells not used in Mineral Solver Analysis)
Upper Bakken Shale
Cored interval (adjusted to log depths)
Two wells in the study area with Middle Bakken core data provide validation for the lithologic interpretation from the mineral solver analysis. The entire Middle Bakken zone was cored in the pilot hole of HW well 16333. The cored interval is
Middle Bakken
pshown at left (core depths adjusted downward 9 feet to agree with log depths). Plugs were taken at about 1 foot intervals throughout the Middle Bakken.
Core Lab’s description of these samples (shown on the following two slides) indicates the Middle Bakken lithology varies from shaly and commonly calcareous siltstone to very fine grained to very shaly, calcareous to very calcareous sandstone. A review of this core confirmed Core Lab’s lithologic description.
Mineral Solver lithology for well 16333, as shown at left, indicates the Middle Bakken is comprised of 12% to 25% clay and about equal amounts of quartz and limestone Based on
Lower Bakken Shale
and about equal amounts of quartz and limestone. Based on this analysis, dolomite concentrations of 10% to 20% at isolated intervals are also present
Overall, Mineral Solver results are in complete agreement with the core data.
B-17
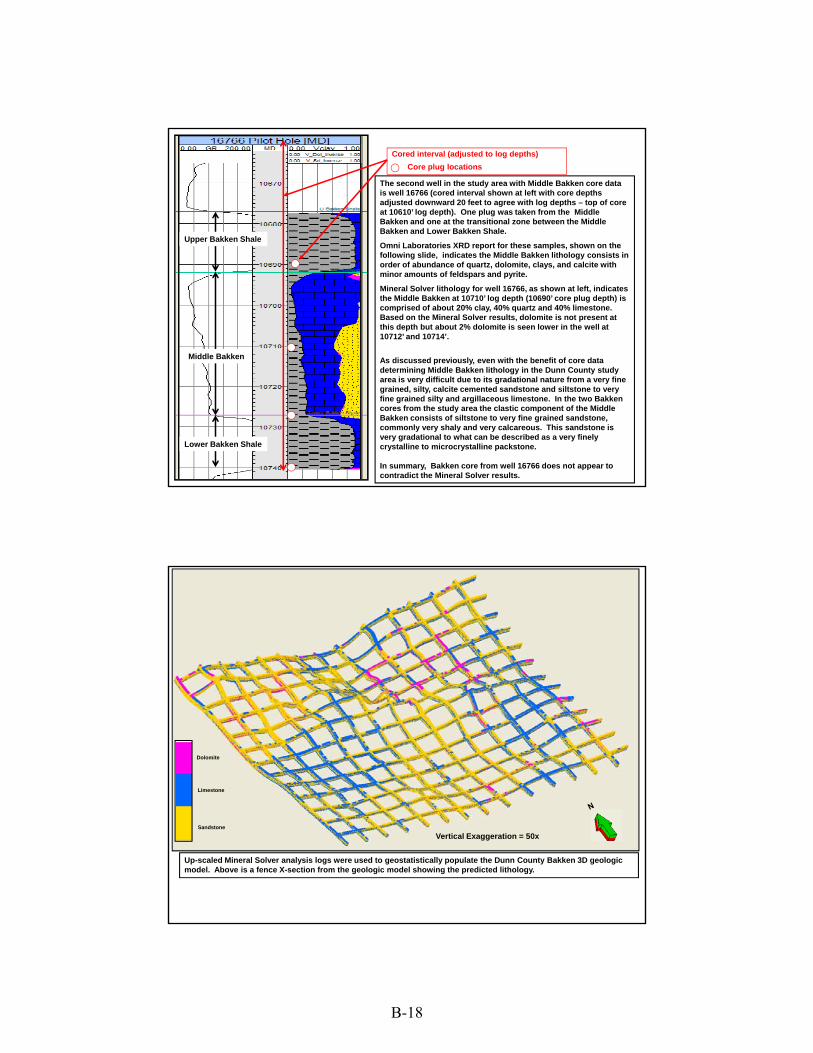
Upper Bakken Shale
The second well in the study area with Middle Bakken core data is well 16766 (cored interval shown at left with core depths adjusted downward 20 feet to agree with log depths – top of core at 10610’ log depth). One plug was taken from the Middle Bakken and one at the transitional zone between the Middle Bakken and Lower Bakken Shale.
Omni Laboratories XRD report for these samples, shown on the
Cored interval (adjusted to log depths)Core plug locations
Middle Bakken
Omni Laboratories XRD report for these samples, shown on the following slide, indicates the Middle Bakken lithology consists in order of abundance of quartz, dolomite, clays, and calcite with minor amounts of feldspars and pyrite.
Mineral Solver lithology for well 16766, as shown at left, indicates the Middle Bakken at 10710’ log depth (10690’ core plug depth) is comprised of about 20% clay, 40% quartz and 40% limestone. Based on the Mineral Solver results, dolomite is not present at this depth but about 2% dolomite is seen lower in the well at 10712’ and 10714’.
As discussed previously, even with the benefit of core data d t i i Middl B kk lith l i th D C t t d
Lower Bakken Shale
determining Middle Bakken lithology in the Dunn County study area is very difficult due to its gradational nature from a very fine grained, silty, calcite cemented sandstone and siltstone to very fine grained silty and argillaceous limestone. In the two Bakken cores from the study area the clastic component of the Middle Bakken consists of siltstone to very fine grained sandstone, commonly very shaly and very calcareous. This sandstone is very gradational to what can be described as a very finely crystalline to microcrystalline packstone.
In summary, Bakken core from well 16766 does not appear to contradict the Mineral Solver results.
Limestone
Dolomite
Sandstone
Up-scaled Mineral Solver analysis logs were used to geostatistically populate the Dunn County Bakken 3D geologic model. Above is a fence X-section from the geologic model showing the predicted lithology.
Vertical Exaggeration = 50x
B-18

APPENDIX C
DESCRIPTION OF THE ROCK EVAL PYROLYSIS METHOD FOR MEASURING HYDROCARBON-
GENERATING POTENTIAL IN A HYDROCARBON SOURCE ROCK
C-1
DESCRIPTION OF THE ROCK EVAL PYROLYSIS METHOD FOR MEASURING HYDROCARBON GENERATING POTENTIAL IN A HYDROCARBON SOURCE
ROCK
A separate measure of hydrocarbon-generating potential can be conducted through what is referred to as a Rock Eval pyrolysis analysis. Rock Eval pyrolysis is used to identify the type and maturity of organic matter and to detect petroleum potential in sediments. The Rock Eval pyrolysis method consists of a programmed temperature heating (in a pyrolysis oven) in an inert atmosphere (helium) of a small sample (~100 mg) to quantitatively and selectively determine 1) the free hydrocarbons contained in the sample and 2) the hydrocarbon- and oxygen-containing compounds (CO2) that are volatilized during the cracking of the unextractable organic matter in the sample (kerogen). A detailed description of the Rock Eval pyrolysis method is presented below.
The pyrolysis oven temperature program is as follows: for 3 min, the oven is kept
isothermally at 300°C and the free hydrocarbons are volatilized and measured as the S1 peak is detected by a flame ionization detector (FID). The temperature is then increased from 300° to 550°C (at 25°C/min). This is the phase of volatilization of the very heavy hydrocarbons compounds (>C40) as well as the cracking of nonvolatile organic matter. The hydrocarbons released from this thermal cracking are measured as the S2 peak (by FID). The temperature at which S2 reaches its maximum depends on the nature and maturity of the kerogen and is called Tmax. The CO2 issued from kerogen cracking is trapped in the 300°–390°C range. The trap is heated, and CO2 is released and detected during the cooling of the pyrolysis oven (S3 peak).
In summary, the four basic parameters obtained by pyrolysis are as follows:
• S1 = the amount of free hydrocarbons (gas and oil) in the sample. If S1 is >1 mg/g, it
may be indicative of an oil show. S1 normally increases with depth. Contamination of samples by drilling fluids and mud can give an abnormally high value for S1.
• S2 = the amount of hydrocarbons generated through thermal cracking of nonvolatile
organic matter. S2 is an indication of the quantity of hydrocarbons that the rock has the potential of producing should burial and maturation continue. This parameter normally decreases with burial depths.
• S3 = the amount of CO2 (in milligrams CO2 per gram of rock) produced during
pyrolysis of kerogen. S3 is an indication of the amount of oxygen in the kerogen and is used to calculate the oxygen index.
• Tmax = the temperature at which the maximum release of hydrocarbons from cracking
of kerogen occurs during pyrolysis (top of S2 peak). Tmax is an indication of the stage of maturation of the organic matter.
The type and maturity of organic matter in petroleum source rocks can be characterized
from Rock Eval pyrolysis data.
C-2
• HI = hydrogen index (HI = [100 × S2]/TOC). HI is a parameter used to characterize the
origin of organic matter. Marine organisms and algae, in general, are composed of lipid- and protein-rich organic matter, where the ratio of H to C is higher than in the carbohydrate-rich constituents of land plants. HI typically ranges from ~100 to 600 in geological samples.
• OI = oxygen index (OI = [100 × S3]/TOC). OI is a parameter that correlates with the
ratio of O to C, which is high for polysacharride-rich remains of land plants and inert organic material (residual organic matter) encountered as background in marine sediments. OI values range from near 0 to ~150.
• PI = production index (PI = S1/[S1 + S2]). PI is used to characterize the evolution level
of the organic matter. • PC = pyrolyzable carbon (PC = 0.083 × [S1 + S2]). PC corresponds to carbon content
of hydrocarbons volatilized and pyrolyzed during the analysis.
Maturation of the organic matter can be estimated by 1) the location of HI and OI and 2) Tmax range. Tmax = 400°–430°C represents immature organic matter; Tmax = 435°–450°C represents mature or oil zone; Tmax > 450°C represents the overmature zone.
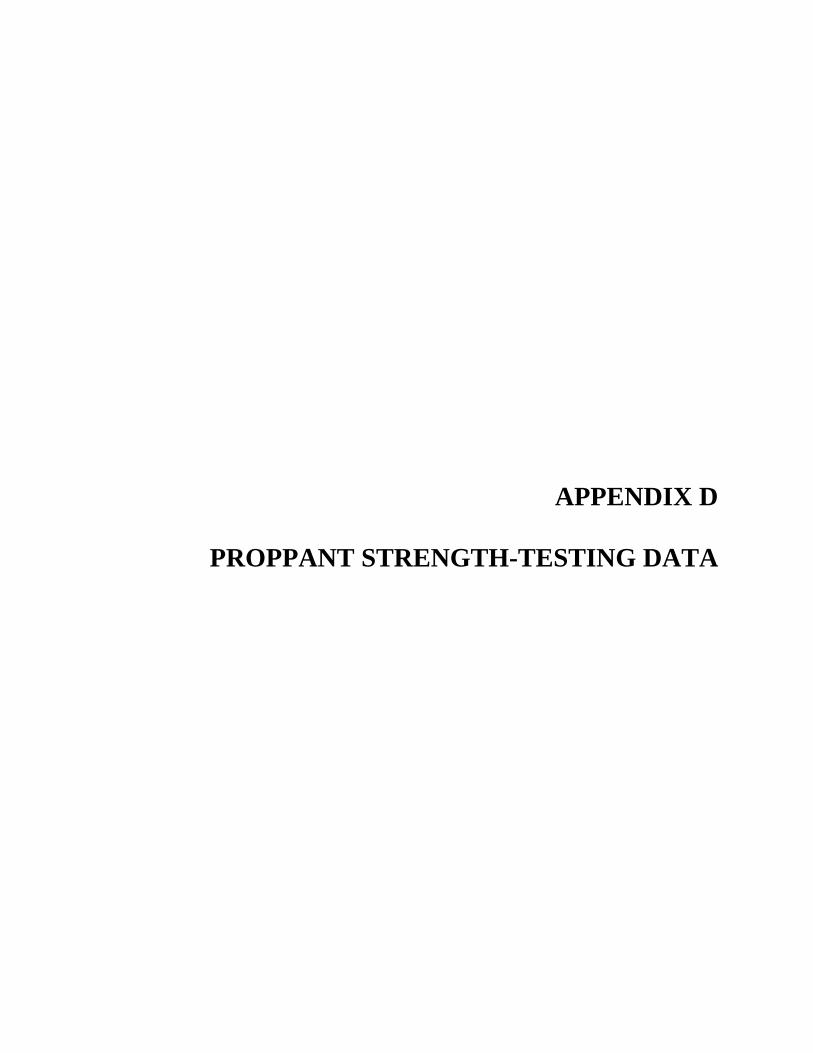
APPENDIX D
PROPPANT STRENGTH-TESTING DATA
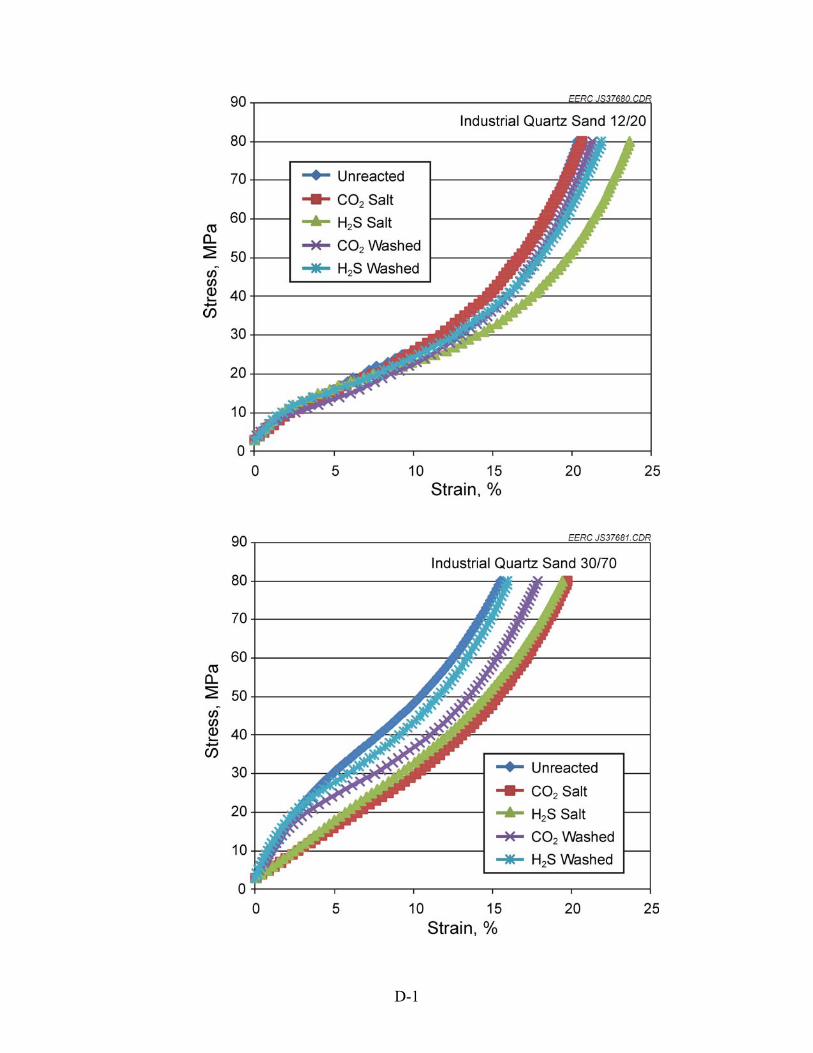
D-1
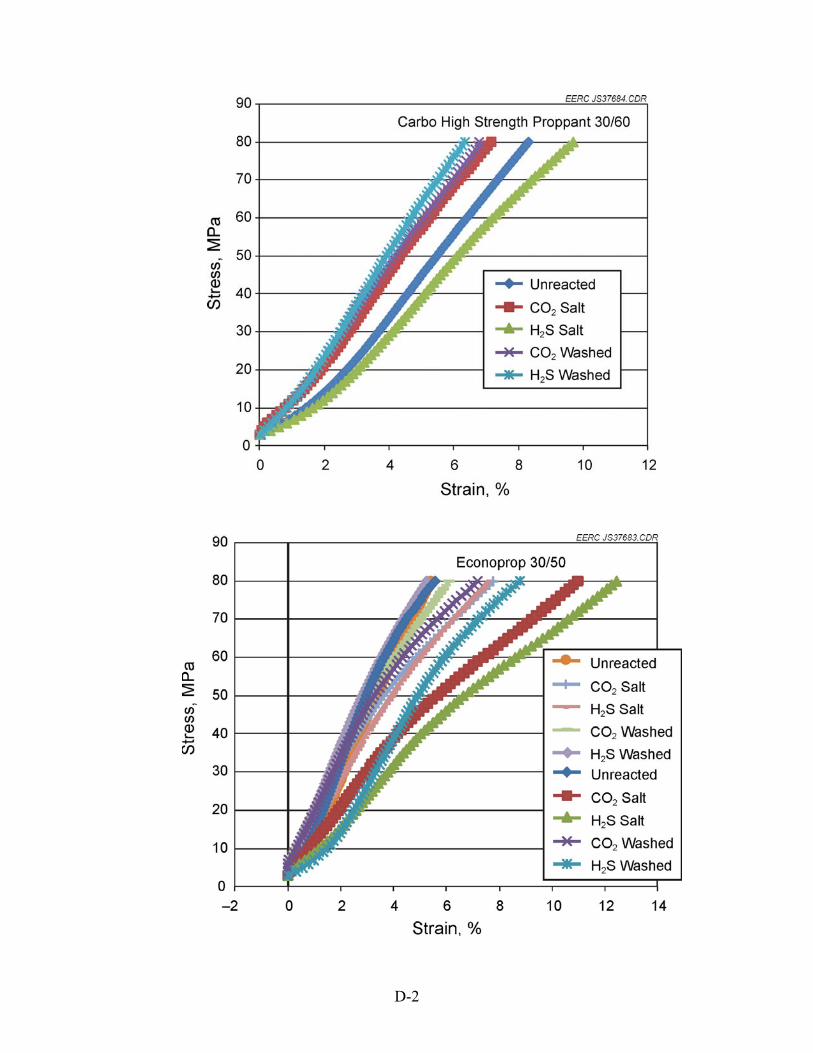
D-2
D-3
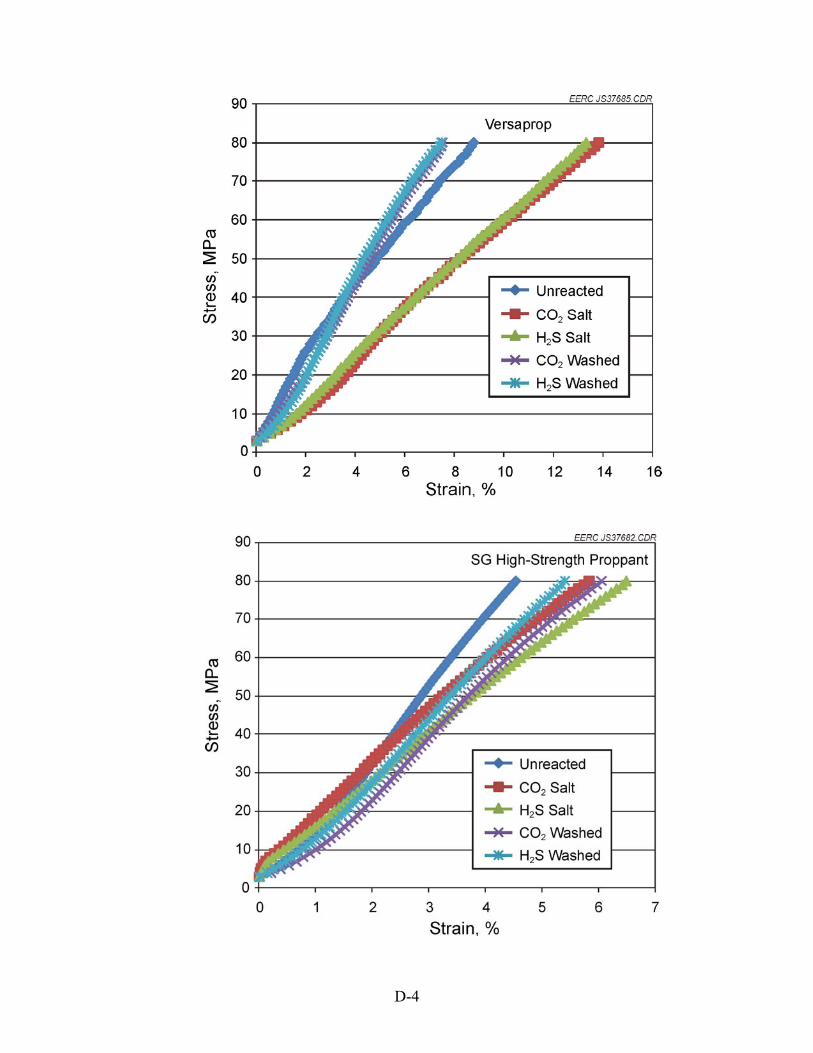
D-4
National Energy Technology Laboratory 626 Cochrans Mill Road P.O. Box 10940 Pittsburgh, PA 15236-0940 3610 Collins Ferry Road P.O. Box 880 Morgantown, WV 26507-0880 One West Third Street, Suite 1400 Tulsa, OK 74103-3519 1450 Queen Avenue SW Albany, OR 97321-2198 2175 University Ave. South Suite 201 Fairbanks, AK 99709 Visit the NETL website at: www.netl.doe.gov Customer Service: 1-800-553-7681