Oil&Gas Strategic Future | Oil& Gas Workforce Management |Oges.info

Oil & Natural Gas Technology
DOE Award No.: DE-FE0024297
Quarterly Research Performance Progress Report
(Period ending: 9/30/2016)
Marcellus Shale Energy and Environment Laboratory (MSEEL)
Project Period: October 1, 2014 – September 30, 2019
Submitted by: Samuel Taylor
West Virginia University Research Corporation DUN’s Number: 191510239 886 Chestnut Ridge Road,
PO Box 6845, Morgantown WV, 26505 [email protected]
304-293-9660
Prepared for: United States Department of Energy
National Energy Technology Laboratory
October 30, 2016
Office of Fossil Energy

DE-FE0024297_WVURC-Coop-Agreement_FY16_Q4-ProgressReport_1Jul-30Sep2016 final.docx 2 of 36
Quarterly Progress Report
July 1 – September 30, 2016
Executive Summary
The objective of the Marcellus Shale Energy and Environment Laboratory (MSEEL) is to
provide a long-term field site to develop and validate new knowledge and technology to improve
recovery efficiency and minimize environmental implications of unconventional resource
development.
This quarter continued to be very active, as the team has started in-depth analysis of more than
four terabytes of data collected during well drilling, completion and initial production.
Production started on 15 December, 2015, but has been choked due to insufficient demand,
which has limited compete production documentation. Plans are developed to complete
production testing during the winter of 2016-17. The team held several meetings, presented
numerous papers and participated in numerous sessions, including one at the Eastern Section of
American Association of Petroleum Geologists dedicated to results of the MSEEL project. A
large team meeting is planned for November 1, 2016 to discuss project progress, plans for
publications, and for team breakout sessions to discuss technical work plans and sample (rock,
water, etc.) workflows to ensure that all project partners had access to needed materials.
Monitoring of the wells continued through this quarter during the initial production phase with
the fiber-optic DTS system. The team also has worked to update the Project Management Plan
to capture the plans developed for the coming budget period.

DE-FE0024297_WVURC-Coop-Agreement_FY16_Q4-ProgressReport_1Jul-30Sep2016 final.docx 3 of 36
Quarterly Progress Report
July 1 – September 30, 2016
Project Performance
This report summarizes the activities of Cooperative Agreement DE-FE0024297 (Marcellus
Shale Energy and Environment Laboratory – MSEEL) with the West Virginia University
Research Corporation (WVURC) during the fourth quarter of the FY2016 (July 1 through
September 30, 2016).
This report outlines the approach taken, including specific actions by subtopic. If there was no
identified activity during the reporting period, the appropriate section is included but without
additional information.
DE-FE0024297_WVURC-Coop-Agreement_FY16_Q4-ProgressReport_1Jul-30Sep2016 final.docx 4 of 36
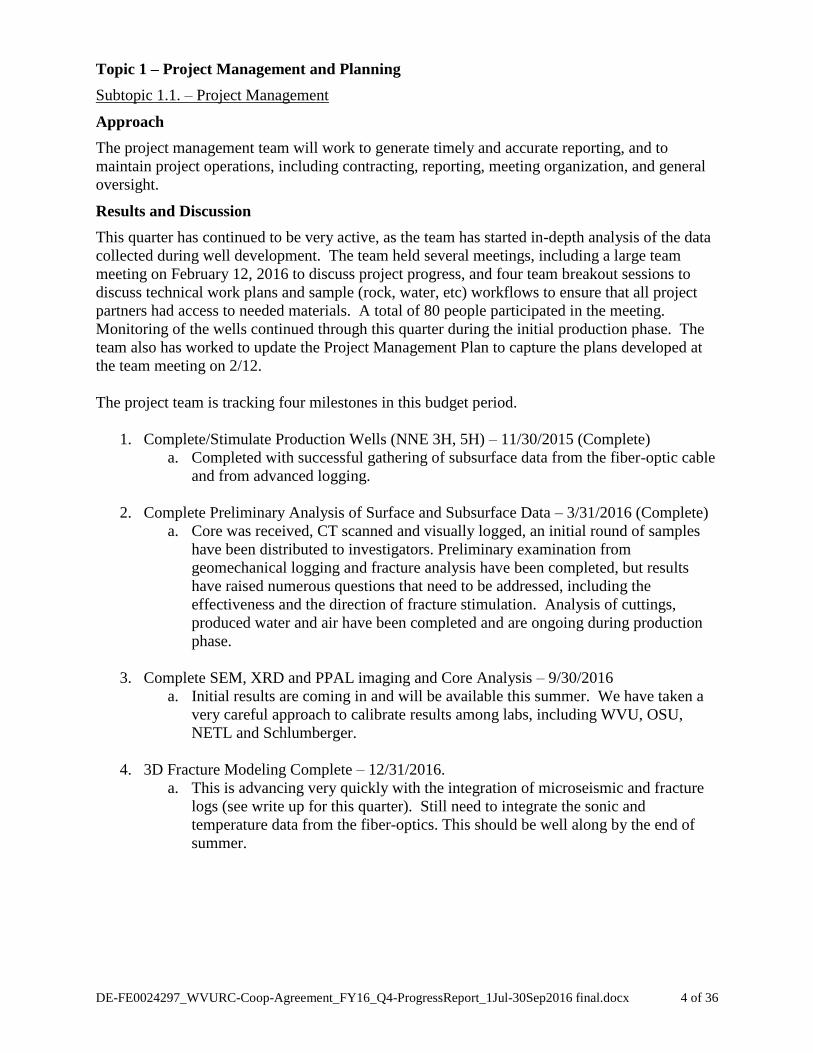
Topic 1 – Project Management and Planning
Subtopic 1.1. – Project Management
Approach
The project management team will work to generate timely and accurate reporting, and to
maintain project operations, including contracting, reporting, meeting organization, and general
oversight.
Results and Discussion
This quarter has continued to be very active, as the team has started in-depth analysis of the data
collected during well development. The team held several meetings, including a large team
meeting on February 12, 2016 to discuss project progress, and four team breakout sessions to
discuss technical work plans and sample (rock, water, etc) workflows to ensure that all project
partners had access to needed materials. A total of 80 people participated in the meeting.
Monitoring of the wells continued through this quarter during the initial production phase. The
team also has worked to update the Project Management Plan to capture the plans developed at
the team meeting on 2/12.
The project team is tracking four milestones in this budget period.
1. Complete/Stimulate Production Wells (NNE 3H, 5H) – 11/30/2015 (Complete)
a. Completed with successful gathering of subsurface data from the fiber-optic cable
and from advanced logging.
2. Complete Preliminary Analysis of Surface and Subsurface Data – 3/31/2016 (Complete)
a. Core was received, CT scanned and visually logged, an initial round of samples
have been distributed to investigators. Preliminary examination from
geomechanical logging and fracture analysis have been completed, but results
have raised numerous questions that need to be addressed, including the
effectiveness and the direction of fracture stimulation. Analysis of cuttings,
produced water and air have been completed and are ongoing during production
phase.
3. Complete SEM, XRD and PPAL imaging and Core Analysis – 9/30/2016
a. Initial results are coming in and will be available this summer. We have taken a
very careful approach to calibrate results among labs, including WVU, OSU,
NETL and Schlumberger.
4. 3D Fracture Modeling Complete – 12/31/2016.
a. This is advancing very quickly with the integration of microseismic and fracture
logs (see write up for this quarter). Still need to integrate the sonic and
temperature data from the fiber-optics. This should be well along by the end of
summer.

DE-FE0024297_WVURC-Coop-Agreement_FY16_Q4-ProgressReport_1Jul-30Sep2016 final.docx 5 of 36
Subtopic 1.2. – Database Development
Approach
We will use CKAN, open source data portal software (www.ckan.org). This platform is used by
NETL-EDX and Data.gov among other organizations and agencies. We will use this platform to
store, manage, publish and find datasets.
Results and Discussion
CKAN is up and running and has been used to share data from the existing wells and
presentations among research personnel. The MSEEL web site has been enhanced with MSEEL
News articles, a time line and with images. We have generated static and dynamic 3D images of
the surface and subsurface at the MSEEL site (Figure 1.1)
Figure 1.1. Static 3D image of the MSEEL sit showing the existing production wells and the two new
production wells along with the science/observation well.
Plan for Next Quarter
Upload 3D static and dynamic images to online site and federate MSEEL portal with EDX.
Topic 2 – Geologic Engineering
Approach
The geologic engineering team will work to generate to improve the effectiveness of fracture
stage design. Evaluating innovative stage spacing and cluster density practices to optimize
recovery efficiency. The team will use a data driven approach to integrate geophysical, fluid flow

DE-FE0024297_WVURC-Coop-Agreement_FY16_Q4-ProgressReport_1Jul-30Sep2016 final.docx 6 of 36
and mechanical properties logs, microseismic and core data to better to characterize subsurface
rock properties, faults and fracture systems to model and identify the best practices for field
implementation, and assess potential methods that could enhance shale gas recovery through
experimental and numerical studies integrated with the results of the production wells at the
MSEEL site.
Results and Discussion
Task 2a – Rock Analysis
During the reporting period, a new core plug sample from the science well has been obtained.
The established protocols for sample analysis have been implemented to characterize the core
plugs. The base set of experiments using Helium for measurement of porosity, permeability, and
compressibility are under way.
The analysis of the production and stimulation data from the new horizontal wells (3H and 5H)
at the MIP site is under way..
In addition, the analysis of the data generated during drilling wells MIP-3H and MIP-5H at NNE
site is in progress. The determining formation characteristics from wireline and thermal logs is
also in progress.
Task 2b – Water Treatment
Our first research activity of produced water treatment focuses on developing an
(bio)electrochemical method to remove scale-forming cations as a pre-treatment system for
produced water treatment. A two-chamber bioelectrochemical system used in this study
contained an anode and cathode chambers separated by a cation exchange membrane. Each
chamber contained graphite woven felt electrodes. An electric current was used to create a pH
unbalance between the anode and cathode. The high-pH cathlyte was then used to treat raw
produced water to remove multi-valent cations as a softening process. Produced water sample
was collected at the MSEEL site and used in the study. The treatment method was shown to be
effective in removing scale-forming cations.
Results and Discussion
1. Produced water chemical characterization (Table 2.b.1)
Table 2.b.1. Chemical characterization of the raw produced water collected from the MSEEL site.
Parameter Unit Concentration Parameter Unit Concentration
pH 4.55 Aluminum (Al) mg/L 0.29
TSS g/L 0.21 Magnesium
(Mg) g/L 2.30
COD mg/L 958 Strontium (Sr) g/L 3.85
Alkalinity mg CaCO3/L 107.84 Calcium (Ca) g/L 38.64
Acidity mg CaCO3/L 280.87 Sodium (Na) g/L 27.00
Conductivity mS/cm 109.70 Iron (Fe) mg/L 156.00
Sulfate (SO42-) mg/L 5.00
Manganese
(Mn) mg/L 3.56
Chloride (Cl) g/L 68.20 Barium (Ba) g/L 11.01

DE-FE0024297_WVURC-Coop-Agreement_FY16_Q4-ProgressReport_1Jul-30Sep2016 final.docx 7 of 36
Products
Production Monitoring
Gas and fluid production at the surface has continued to be monitored using a supervisory
control and data acquisition (SCADA) to remotely monitor production of gas and water (Figures
2.1 and 2.3). Production is limited to the City of Morgantown’s consumption and has been
limited since production began. However, production was severely limited in May 2016 due to
warmer weather (Choked to 20%). The constrained production was reflected in the fiber optic
distributed temperature system (DTS) with an instantaneous increase in temperature (reduced
production) (Figure 2.2). We have attempted to normalize the increased temperature to examine
production under constrained conditions (Figure 2.4). It appears that production from the
engineered stages (14-19) is higher than the other stages as evidenced by decreased normalized
temperatures.
Figure 2.1 Daily and cumulative gas production from the MIP 3H and MIP 5H at the MSEEL site. Gas
production was curtailed beginning in May 2016 due to weak demand. Production has begun to increase at
the end of September 2016.
0
200
400
600
800
1,000
1,200
1,400
1,600
0
1,000
2,000
3,000
4,000
5,000
6,000
7,000
Cu
m G
as (
MM
SCF)
Gas
Pro
du
ctio
n R
ate
(M
SCF)
Date
MIP-3H and MIP-5H Gas Production
MIP-5H Cum Gas MIP-3H Cum GasMIP-3H Gas Rate MIP-5H Gas Rate

DE-FE0024297_WVURC-Coop-Agreement_FY16_Q4-ProgressReport_1Jul-30Sep2016 final.docx 8 of 36
Figure 2.2 Distributed fiber-optic determined temperature by stage from the MIP 3H showing the increase in
temperature due to curtailed production at the beginning of May 2016.
April 2016
May 2016
Sept 2016
Jan 2016

DE-FE0024297_WVURC-Coop-Agreement_FY16_Q4-ProgressReport_1Jul-30Sep2016 final.docx 9 of 36
Figure 2.3 Water production from both the MIP 3H and MIP 5H. Daily water production decreased quickly
from 1,000 barrels per day to one to ten barrels per day. A small increase is evident due to small increase in
production in late September and October.
0
2,000
4,000
6,000
8,000
10,000
12,000
14,000
0.01
0.10
1.00
10.00
100.00
1,000.00
10,000.00Water Production MIP-3H & MIP-5H
Cum Water MIP-3H Cum Water MIP-5HMIP-3H MIP-5H
Wat
er
Pro
du
ctio
n (
bb
l/d
ay)
Date
Cu
mW
ate
r P
rod
uct
ion
(b
bl)

DE-FE0024297_WVURC-Coop-Agreement_FY16_Q4-ProgressReport_1Jul-30Sep2016 final.docx 10 of 36
Figure 2.4 Normalized distributed fiber-optic determined temperature by stage from the MIP 3H showing the
decrease temperature departing from the general trend indicating that the engineered stages 14 to 19 may be
producing more gas than the earlier geometric stages.
Plans for Next Quarter
The measurement on the core plug samples will continue to obtain a complete set of
characteristics. In addition, experiments with Carbon Dioxide or Methane will be initiated to
evaluate the adsorption characteristic of the core plugs.
Plans have been developed to run production logs in the MIP 3H while shutting in the MIP 5H.
This is planned to occur during the winter when gas consumption due to heating in Morgantown
will be significant higher. It is also planned to closely monitor the fiber-optic system for
temperature and sonic. This should enable us to directly assign production to individual clusters
within individual stages and evaluate the effectiveness of engineered completion design.
Topic 3 – Deep Subsurface Rock, Fluids, and Gas
Approach
May 2016
Sept 2016

DE-FE0024297_WVURC-Coop-Agreement_FY16_Q4-ProgressReport_1Jul-30Sep2016 final.docx 11 of 36
The “Deep Subsurface Rock, Fluids & Gas” team will be responsible for high resolution
temporal and/or spatial characterization of the core, produced fluids, and produced gases. The
team will use whole and sidewall core and geophysical logs from the science well to conduct
various petrophysical analyses to analyze physical rock properties. Data generated by all team
members will be integrated to answer following key research questions: 1) geological controls
on microbial distribution, diversity and function and how it can effect gas productivity, potential
for fracture and pore clogging, well infrastructure and souring 2) major controls on
distribution/source/type of organic matter that has implications for oil vs gas production,
frackability, restimulation and porosity/permeability effects 3) what are spatiotemporal variations
in elemental, isotopic, mineralogical and petrological properties that control presence, geological
migration, and modern flow of fluids, water, gases and microorganisms and also effect long-term
production behavior of reservoir 4) what are possible water-rock-microbial interactions as a
result of injection of fracturing fluids, and 5) does hydraulic fracturing create new pathways for
fluid/gas migration
Results and Discussion
Accomplishments:
The main focus of the subsurface team led by Sharma this quarter was to analyze core, fluid and
gas samples collected from the MSEEL site. Members of Sharma’s lab group (Dr. Warrier and
Mr. Wilson) and Dr. Hanson from Mouser’s lab group continue to coordinate and supervise all
sample collection. Samples were also distributed to research team at OSU and NETL for analysis
under different sub-tasks. Several talks and presentations were given at local and regional
conferences /universities.
1. Major goals – progress towards
Goal 1: Sample collection and Analysis
Sidewall Core, Vertical Core & Cuttings
The side wall cores are curated at OSU and WVU. Based on the geophysical logs eight samples
were selected from different lithologies i.e. zones where we expect to see maximum
biogeochemical variations. Samples were homogenized and distributed among different PI’s are
currently being processed for biomarker, isotope analysis, elemental analysis, porosity/pore
structure, and noble gas analysis. For whole core analysis cores were taken from 1foot interval
through the 111 feet of whole vertical core. Samples were ground homogenized and distributed
to different groups at WVU, OSU and NETL for different analysis.
Lopano and Hakala’s research group at NETL finished initial analysis of drill cuttings. Samples
were analyzed for elemental composition by inductively coupled plasma-mass spectroscopy
(ICP-MS) mineral phases by X-ray diffraction (XRD), and trace metal associations were mapped
by micro X-ray florescence (m-XRF) at Stanford Synchrotron Light Source (SSRL). Preliminary
results show that cutting samples containing trace metals such as: As, U, Zn, and Cu, tend to be
samples that contain high organic carbon (up to 10.3 wt%) and pyrite content. Micro-XRF
mapping shows 50-100µm size U, As and Cu hotspots, mainly co-localized with small Fe grains
(50-200 µm), or distributed on larger Fe grains (0.5-2 mm). Barium content is elevated
throughout all samples (~ 5 wt%) and can in part be attributed to residual drill mud. Micro-XRF
mapping reveals Ba coatings on mineral grains; which supports Ba being primarily from residual
drilling muds in these samples. Leaching tests further identify various leaching conditions
influencing trace metal mobility, such as different leachate composition (simulating rainfall or
landfill conditions), pH and liquid: solid ratio. Tests are designed to mimic short-term and long-

DE-FE0024297_WVURC-Coop-Agreement_FY16_Q4-ProgressReport_1Jul-30Sep2016 final.docx 12 of 36
term leaching tests under different conditions in order
to evaluate key elements to monitor in Marcellus shale
drill cutting disposal scenarios. Preliminary XRD
analysis of 35 samples was performed by Weislogel’s
student Hupp to assess bulk mineralogy using the
reference intensity ratio (RIR) method. Results show
the samples are mainly dominated by muscovite/illite
(approximately 40-60%), quartz (~20-40%), and pyrite
(~10-15%). These findings are consistent with
previous XRD analyses performed on another well in
Monongalia Co. by the Eastern Gas Shales Project in
the 1970’s. Other minor minerals found in the samples
include calcite, dolomite, albite, and barite. Thin-
section petrography is needed to evaluate diagenetic
versus detrital origin of these phases. Additional
analyses to be completed include bulk-sample major-
element XRF and Sm-Nd radioisotopic dating. The
objective is to further constrain provenance evolution of fine-grained Middle Devonian
sediments in the central Appalachian Basin. All Results were presented at the annual Geological
Society of America Meeting.
Julie Sheets from Cole’s research group presented results of XRD, SEM and MICP analysis of
core samples at the Eastern Section AAPG meeting in Lexington, Kentucky. XRD analysis to
determine bulk mineralogy of core samples from well MIP 3H shows that Marcellus core is
composed mainly of siliciclastic mudstones with interbedded carbonates. Of the four sidewall
cores targeted within the Marcellus, three (Marcellus Top (depth 7451’), Middle (7509’) and
Lower (7543’) are mainly comprised of phyllosilicates (illite and chlorite), quartz, pyrite, and
alkali feldspar. One (Upper Marcellus, depth 7467’) is a carbonate mudstone composed mostly
of calcite, quartz, and dolomite, but with minor illite and chlorite detected. SEM images of
unpolished fragments of this sample show sub-micron scale chlorite platelets (Figure 3.1)
disseminated throughout a dominantly calcite matrix, with some relatively small organic matter
(OM) patches disseminated throughout the carbonate. SEM analysis of unpolished cleavage
fragments of Marcellus Top (7451’) show 100-200
micron diameter pods of organic material (OM),
interpreted as preserved algal cysts (Tasmanites?)
containing large (several 10s of microns in
dimension), euhedral dendritic chlorite crystals, as
well as euhedral forms of calcite, quartz, and
pyrite. Figure 3.3 shows an example of such an
OM-rich feature that was targeted for dual beam
FIB/SEM. In addition, gallium-ion beam slices and
subsequent images of a large (40 x 40 µm) region
of interest including one the pods, obtained from
the Molecular Foundry (LBNL), reveal small,
porous patches of OM dispersed within the fine
grained illitic clay matrix, as well as pores formed
at mineral phase boundaries and between OM and
minerals. These data suggest that more than one
Figure 3.1 Calcite-rich matrix with
dispersed, sub-micron platelets of
chlorite in Marcellus, depth 7467’
Figure 3.2 Algal material (Tasmanites?)
replaced by OM, euhedral chlorite, and
other secondary minerals in Marcellus Top,
depth 7451’

DE-FE0024297_WVURC-Coop-Agreement_FY16_Q4-ProgressReport_1Jul-30Sep2016 final.docx 13 of 36
type of OM exist within a single core sample, and that OM/mineral/pore microstructure also
varies with depth in the formation.
Produced Fluid and Gas
Produced water samples were collected in 5 gallon carboys every 4-6 weeks. The samples were
the tranported, filtered and processed in Sharma Laboratory at WVU. All water samples were
collected in different containers using different methods/ preservatives etc. specified for different
kinds of analysis. All PI’s at OSU and NETL and provided their detailed sampling instructions.
Dr. Warrier, Wilson from WVU and Daly from OSU were primarirly incharge of sample
collection and distribution among different PI’s at WVU, OSU and NETL. The collected fluids
are curretly being processsed for biomass, reactive chemistry, organic acids, and noble gas and
stable isotope analysis at different institutes. Geochemistry data from MIP 3H and 5H wells run
at Cole’s lab show that Chloride concentrations range from approximately 55,000 to 84,000
mg/L, however, the Cl- concentrations did not increase systematically over time, nor did these
two wells exhibit similar changes. Dissolved sulfate was not detected in the flowback samples
collected from April through September. Fluoride concentrations were approximately an order of
magnitude lower during this time, as compared to the first month of flowback samples.
Ammonia and phosphate were measured on the Skalar nutrient analyzer. Dissolved NH3
followed a similar trend as Cl-, with concentrations ranging from approximately 80 to 100 mg/L
N. Data reduction from trace metal analysis on the ICP-OES and ICP-MS continues.
Goal 2: Test methods biomarker extraction, identification and quantification
The complex shale matrix, including high concentrations of organic constituents and salts as well
as exceedingly low porosities constitute serious challenges in extracting microbial lipids from
shales. Mature Shale like the Marcellus pose further challenge because high temperatures and
pressures during burial destroy or modify
microbial existence. Sharma’s PhD.
student Akondi in collaboration with
Texler from Mouser’s group at OSU has
finalized a manuscript that summarizes a
novel modified lipid extraction method in
which a combination of solvents, buffers,
and spikes were tested for their ability to
improve recovery and reproducibility of
extracted microbial lipid biomarkers from
deep subsurface shale sediments. In this
paper the authors summarize results from
three different methods; viz. modified
Bligh and Dyer (mBD), Folch (FOL), a
Lipid biomarker analyses (inc.
phospholipid fatty acids (PLFAs),
diglyceride fatty acids (DGFAs)d
microwave assisted extraction (MAE). The
modified Bligh and Dyer method using a
phosphate buffer and phospholipid spike
(mBD+Phos+POPC) consistently provided
Figure 3.3. Relative abundances of PLFA (n=20) and DGFA-FAME (n=19) profiles based on the classes of each sample across all extraction treatments (n=7), and RSD measurements for PLFA and DGFA FAME classes for each treatment. (From: Akondi et. al., in prep for Frontiers-Extreme Microbiology)

DE-FE0024297_WVURC-Coop-Agreement_FY16_Q4-ProgressReport_1Jul-30Sep2016 final.docx 14 of 36
reproducible results and higher recovery of biomarkers for both PLFA and DGFA over other
methods (Figure 3.3), suggesting that the addition of the POPC spike helped with the extraction
of a pool of lipid material that was not accessible with the other methods. This method
demonstrates that the extraction solvent mixtures are polar enough to release PLFA from
microbial cell membranes, and non-polar enough to release DGFA from neutral lipids. The
results from these experiment will be used for effective extraction of microbial lipid biomarkers
from all MSEEL samples.
Goal 3: Microbial DNA analysis and microbial cultivation
This quarter Mouser group has begun to characterize optimal salinities and carbon donor profiles
for microbial isolates cultured from MSEEL wells. Samples were also submitted DNA to DOE
JGI to sequence the genomes for these isolates. Samples were prepared and shipped to Germany
for intact lipid analyses. Andrea Hanson, a post-doc partially funded on the MSEEL project is
currently in Germany to extract and analyze lipids using high resolution MS.
Using pristine cleaned core materials, the Wilkins lab has been mainly focusing on the potential
sulfide generation by Halanaerobium over the last few months. Initial results demonstrate that
Halanaerobium can generate sulfide in the presence of thiosulfate (but not sulfate) (Figure 3.4).
Halanaerobium central metabolic flux is altered in the presence of thiosulfate, resulting in greater
concentrations of organic acid fermentation products which have implications for corrosive
potential. They also interpret that these reactions proceed through a series of genes (rhodanase
and sulfide reductases) that are nearly always detected in produced fluid samples
2. Data Dissemination
Agrawal V, Sharma S, and Warrier A. 2016. Understanding kerogen composition and
structure in pristine shale cores collected from Marcellus Shale Energy and Environment
Laboratory. Eastern Section American Association of Petroleum Geologists’ Meeting,
Lexington, Kentucky, September 2016
Figure 3.4. (A) Sulfide production via thiosulfate transformations in live-cell incubations. (B) Growth
curves for Halanaerobium WG8 in both the presence and absence of thiosulfate. (C) Changes in major
Halanaerobium fermentation products when cultured in the presence and absence of thiosulfate (+/-), at
both mid-log (Mid) and stationary (Stat) growth phases (From: Booker et. al., in prep for Environmental
Science & Technology)

DE-FE0024297_WVURC-Coop-Agreement_FY16_Q4-ProgressReport_1Jul-30Sep2016 final.docx 15 of 36
Akondi R, Trexler RV, Pfiffner SM, Mouser PJ, Sharma S. 2016. Comparing Different
Extraction Methods for Analyses of Ester-linked Diglyceride Fatty Acids in Marcellus
Shale. Eastern Section American Association of Petroleum Geologists’ Meeting,
Lexington, Kentucky, September 2016
Booker AE, Borton MA, Daly R, Welch S, Nicora CD, Sharma S, et. al., 2016. Sulfide
Generation by Dominant Colonizing Halanaerobium Microorganisms in Hydraulically
Fractured Shales. Eastern Section American Association of Petroleum Geologists’
Meeting, Lexington, Kentucky, September 2016
Crandall D, Moore J, Paronish T, Hakala A, Sharma S, and Lopano C 2016. Preliminary
analyses of core from the Marcellus Shale Energy and Environment Laboratory. Eastern
Section American Association of Petroleum Geologists’ Meeting, Lexington, Kentucky,
September 2016.
Daly RA, Borton MA, Wilson T, Welch S., Cole D. R., Sharma S., et. al., 2016.
Microbes in the Marcellus Shale: Distinguishing Between Injected and Indigenous
Microorganisms, Eastern Section American Association of Petroleum Geologists’
Meeting, Lexington, Kentucky, September 2016
Evert M, Panescu J, Daly R, Welch S, Hespen J, Sharma S, Cole D, Darrah TH, Wilkins
M, Wrighton K, Mouser PJ 2016. Temporal Changes in Fluid Biogeochemistry and
Microbial Cell Abundance after Hydraulic Fracturing in Marcellus Shale. Eastern Section
American Association of Petroleum Geologists’ Meeting, Lexington, Kentucky,
September 2016
Hanson AJ, Trexler RV, Mouser PJ (2016). Analysis of Microbial Lipid Biomarkers as
Evidence of Deep Shale Microbial Life. Eastern Section American Association of
Petroleum Geology (AAPG), Lexington, KY, Sept 25-27, 2016.
Lopano, C.L., Stuckman, M.Y., and J.A. Hakala (2016) Geochemical characteristics of
drill cuttings from Marcellus Shale energy development. Annual Geological Society of
America Meeting, Denver, CO, September 2016.
Pansecu J, Evert M, Hespen J, Daly RA, Wrighton KC, Mouser PJ (2016). Arcobacter
isolated from the produced fluids of a Marcellus shale well may play a currently
unappreciated role in sulfur cycling. Eastern Section American Association of Petroleum
Geology (AAPG), Lexington, KY, Sept 25-27, 2016.
Sharma S, Carr T, Vagnetti R, Carney BJ, Hewitt J. 2016. Role of Marcellus Shale
Energy and Environment Laboratory in Environmentally Prudent Development of Shale
Gas. Annual Geological Society of America Meeting, Denver, CO, September 2016.
Sharma S, Agrawal V, Akondi R, and Warrier A. 2016. Understanding biogeochemical
controls on spatiotemporal variations in total organic carbon in cores from Marcellus
Shale Energy and Environment Laboratory. Eastern Section American Association of
Petroleum Geologists’ Meeting, Lexington, Kentucky, September 2016
Trexler RV, Akondi R, Pfiffner S, Daly RA, Wilkins MJ, Sharma S, Wrighton KC, and
Mouser, PJ (2016). Phospholipid Fatty Acid Evidence of Recent Microbial Life in
Pristine Marcellus Shale Cores. Eastern Section American Association of Petroleum
Geology (AAPG), Lexington, KY, Sept 25-27, 2016.
Wilson T and Sharma S 2016. Assessing biogeochemical interactions in the reservoir at
Marcellus Shale Energy and Environment Laboratory Annual Geological Society of
America Meeting, Denver, CO, September 2016.
3. Data Dissemination
DE-FE0024297_WVURC-Coop-Agreement_FY16_Q4-ProgressReport_1Jul-30Sep2016 final.docx 16 of 36
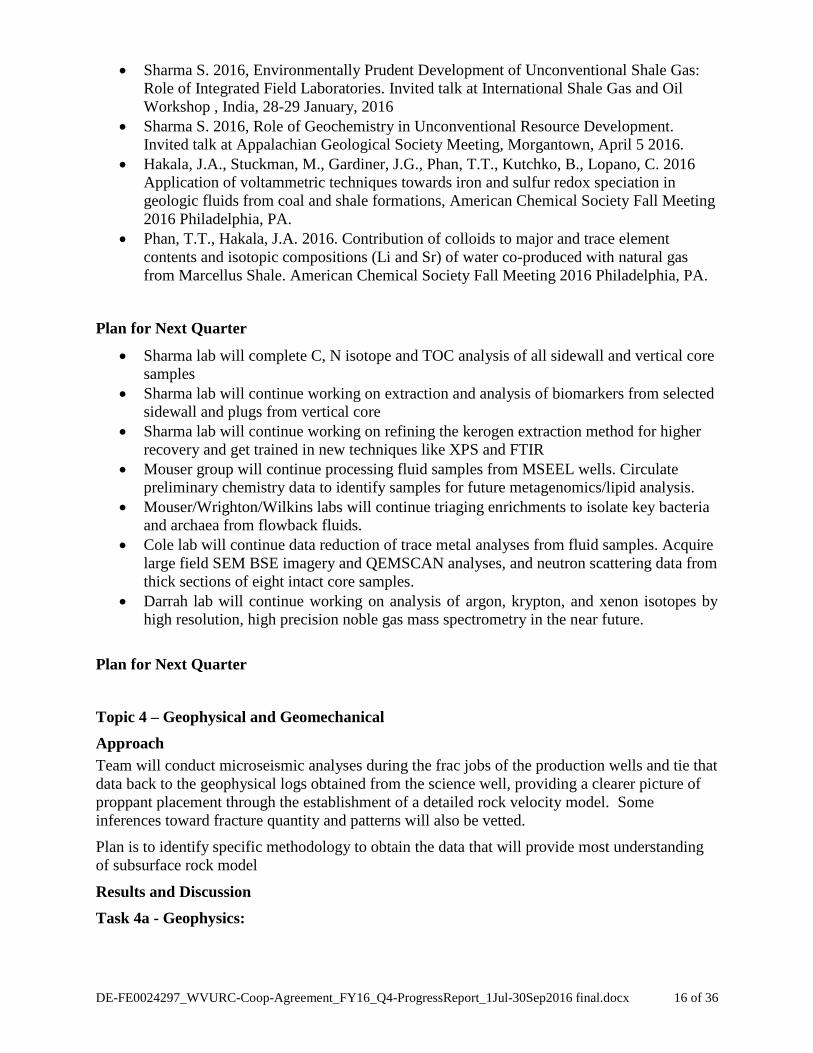
Sharma S. 2016, Environmentally Prudent Development of Unconventional Shale Gas:
Role of Integrated Field Laboratories. Invited talk at International Shale Gas and Oil
Workshop , India, 28-29 January, 2016
Sharma S. 2016, Role of Geochemistry in Unconventional Resource Development.
Invited talk at Appalachian Geological Society Meeting, Morgantown, April 5 2016.
Hakala, J.A., Stuckman, M., Gardiner, J.G., Phan, T.T., Kutchko, B., Lopano, C. 2016
Application of voltammetric techniques towards iron and sulfur redox speciation in
geologic fluids from coal and shale formations, American Chemical Society Fall Meeting
2016 Philadelphia, PA.
Phan, T.T., Hakala, J.A. 2016. Contribution of colloids to major and trace element
contents and isotopic compositions (Li and Sr) of water co-produced with natural gas
from Marcellus Shale. American Chemical Society Fall Meeting 2016 Philadelphia, PA.
Plan for Next Quarter
Sharma lab will complete C, N isotope and TOC analysis of all sidewall and vertical core
samples
Sharma lab will continue working on extraction and analysis of biomarkers from selected
sidewall and plugs from vertical core
Sharma lab will continue working on refining the kerogen extraction method for higher
recovery and get trained in new techniques like XPS and FTIR
Mouser group will continue processing fluid samples from MSEEL wells. Circulate
preliminary chemistry data to identify samples for future metagenomics/lipid analysis.
Mouser/Wrighton/Wilkins labs will continue triaging enrichments to isolate key bacteria
and archaea from flowback fluids.
Cole lab will continue data reduction of trace metal analyses from fluid samples. Acquire
large field SEM BSE imagery and QEMSCAN analyses, and neutron scattering data from
thick sections of eight intact core samples.
Darrah lab will continue working on analysis of argon, krypton, and xenon isotopes by
high resolution, high precision noble gas mass spectrometry in the near future.
Plan for Next Quarter
Topic 4 – Geophysical and Geomechanical
Approach
Team will conduct microseismic analyses during the frac jobs of the production wells and tie that
data back to the geophysical logs obtained from the science well, providing a clearer picture of
proppant placement through the establishment of a detailed rock velocity model. Some
inferences toward fracture quantity and patterns will also be vetted.
Plan is to identify specific methodology to obtain the data that will provide most understanding
of subsurface rock model
Results and Discussion
Task 4a - Geophysics:

DE-FE0024297_WVURC-Coop-Agreement_FY16_Q4-ProgressReport_1Jul-30Sep2016 final.docx 17 of 36
The effort this past quarter concentrated on: 1) preparation of presentations for the SEG Dallas
meeting (16-21 October); 2) preparation of a paper for submission to the Journal Interpretation
by November 1.
Summary
Paper and presentations have been prepared and circulated for comment by co-authors.
The accelerated effort this past fiscal year has brought most of my work on the first four years of the
MSEEL project to completion.
This quarter I will present a paper at the SEG annual international meeting in Dallas and submit
another paper, just completed, to the Journal Interpretation for their special section on
Appalachian unconventionals (see next two pages for information on the special section).
The paper is currently in review by co-authors and is titled:
Marcellus Shale model stimulation tests and microseismic response yield insights into
mechanical properties and the reservoir DFN
Thomas H. Wilson1, Malcolm Yates3, Keith MacPhail3, Ian Costello2, Tim Carr1, B. J. Carney2, Jay Hewitt2, Emily
Jordon2, Natalie Uschner3, Mandy Thomas3, Si Akin3, Oluwaseun, Magbagbeola3, Adrian Morales3, Asbjoern
Johansen3, Leah Hogarth3, Olatunbosun Anifowoshe3, Kashif Naseem3
1West Virginia University, 2Northeast Natural Energy, LLC, 3Schlumberger
I will also serve as editor of this special section. Related information follows on the next two pages. Note
that several associate editors will share review solicitation responsibilities. The paper I have prepared will
be submitted to one of the associate editors for independent review. Considerable effort will be expended
on this activity in FY2017.
See http://library.seg.org/journal/inteio (& next page couple pages) for additional information
http://library.seg.org/journal/inteio

DE-FE0024297_WVURC-Coop-Agreement_FY16_Q4-ProgressReport_1Jul-30Sep2016 final.docx 18 of 36
DE-FE0024297_WVURC-Coop-Agreement_FY16_Q4-ProgressReport_1Jul-30Sep2016 final.docx 19 of 36

DE-FE0024297_WVURC-Coop-Agreement_FY16_Q4-ProgressReport_1Jul-30Sep2016 final.docx 20 of 36
Task 4b - Geomechanical:
During this quarterly period, numerical modeling simulations were conducted to simulate stage
1, stage 2, and stage 3 of well MIP 3H by using measured injection data. Stimulation input
parameters were selected from available measured data for stage 3. Figure 4.b.1 and Figure 4.b.2
show a comparison of the slurry volumes and the slurry rates used in the model and the available
measured data. Figure 4.b.3 shows the proppant concentrations used in the model and those
which were measured. In the model, the termination time for proppant injection needed to be
adjusted in order to match the measured slurry volume and proppant mass. An idealized step-
wise schedule for the proppant injection was used in the model, as shown in this figure. Figure
4.b.4 shows the idealized proppant injection rate, while Figure 4.b.5 shows the proppant mass
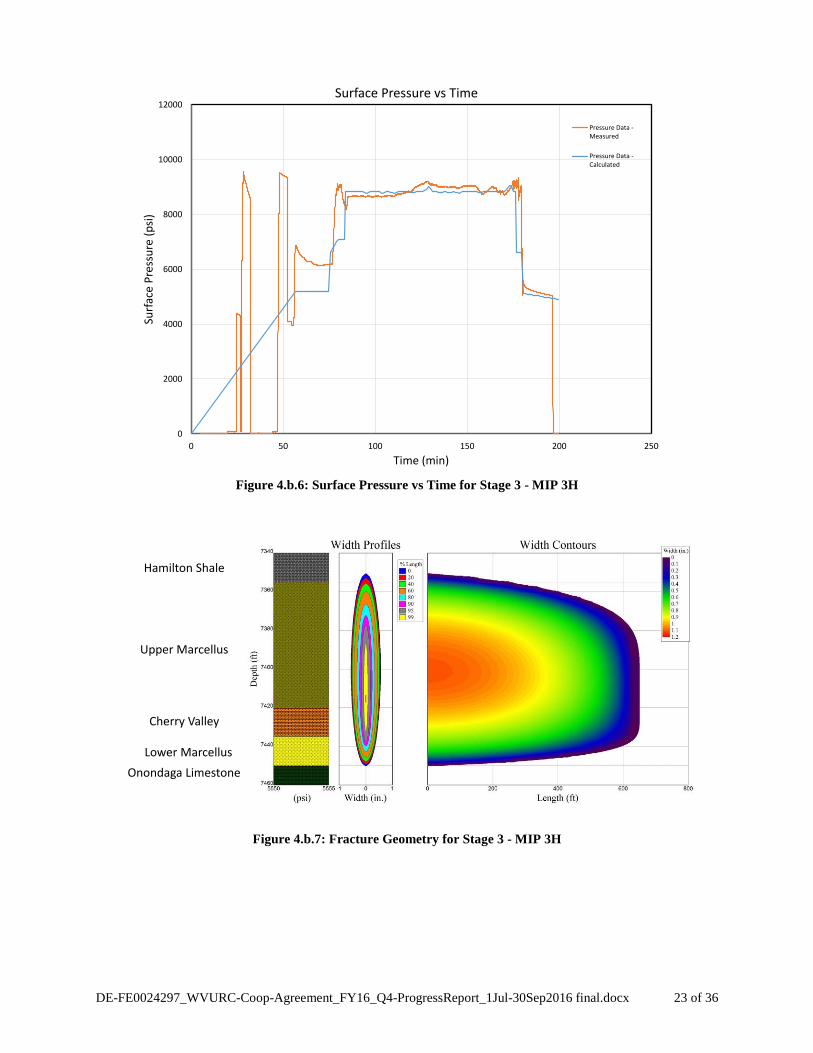
used in the model in comparison with the measured injection data. Figure 4.b.6 shows a
comparison of computed and measured surface pressures. These computed values compare well
with the measured surface pressure data. Figure 4.b.7 shows the computed fracture geometry
from the model. Table 4.b.1 shows a comparison of computed fracture dimensions for stages 1,
2, and 3. No microseismic data was available for stages 1-3 of MIP 3H.
Figure 4.b.1: Slurry Volume vs Time - Stage 3 - MIP 3H
0
50000
100000
150000
200000
250000
300000
350000
400000
450000
0
1000
2000
3000
4000
5000
6000
7000
8000
9000
10000
0 50 100 150 200 250
Slu
rry
Vo
lum
e (U
.S. G
allo
ns)
Slu
rry
Vo
lum
e (b
bl)
Time (minutes)
Cumulative Slurry Volume
Slurry Volume - Measured
Slurry Volume - Model

DE-FE0024297_WVURC-Coop-Agreement_FY16_Q4-ProgressReport_1Jul-30Sep2016 final.docx 21 of 36
Figure 4.b.2: Slurry Rate vs Time for Stage 3 - MIP 3H
Figure 4.b.3: Proppant Concentration vs Time for Stage 3 - MIP 3H
0
10
20
30
40
50
60
70
80
90
100
0 50 100 150 200 250
Slu
rry
Rat
e (
bb
l/m
in)
Time (minutes)
Slurry Rate
Slurry Rate - Measured
Slurry Rate - Model
0
0.5
1
1.5
2
2.5
3
0 50 100 150 200 250
Pro
pp
ant
Co
nce
ntr
atio
n (
lbm
/gal
)
Time (minutes)
Proppant Concentrations
PROP CON 2 - Measured
PROP CON - Model

DE-FE0024297_WVURC-Coop-Agreement_FY16_Q4-ProgressReport_1Jul-30Sep2016 final.docx 22 of 36
Figure 4.b.4: Idealized Proppant Rate vs Time for Stage 3 - MIP 3H
Figure 4.b.5: Proppant Mass vs Time for Stage 3 – MIP 3H
0
1000
2000
3000
4000
5000
6000
7000
8000
9000
10000
0 50 100 150 200 250
Pro
pp
ant
Rat
e (
lbm
/min
)
Time(min)
0
50000
100000
150000
200000
250000
300000
350000
400000
450000
0 50 100 150 200 250
Pro
pp
ant
Mas
s (l
bm
)
Time (minutes)
Proppant Mass
Proppant Mass - Measured
Proppant Mass - Model
DE-FE0024297_WVURC-Coop-Agreement_FY16_Q4-ProgressReport_1Jul-30Sep2016 final.docx 23 of 36
Figure 4.b.6: Surface Pressure vs Time for Stage 3 - MIP 3H
Figure 4.b.7: Fracture Geometry for Stage 3 - MIP 3H
0
2000
4000
6000
8000
10000
12000
0 50 100 150 200 250
Surf
ace
Pre
ssu
re (
psi
)
Time (min)
Surface Pressure vs Time
Pressure Data -Measured
Pressure Data -Calculated
Upper Marcellus
Hamilton Shale
Cherry Valley
Lower Marcellus
Onondaga Limestone

DE-FE0024297_WVURC-Coop-Agreement_FY16_Q4-ProgressReport_1Jul-30Sep2016 final.docx 24 of 36
Table 4.b.1: Comparison of Stages 1 - 3 Fracture Dimensions
Products
Plan for Next Quarter
Task 4a – Geophysical:
Much of the following depends on available funding and student assistance.
1) The following paper will be submitted for review for inclusion in in the 2016 SEG
meeting volume of expanded abstracts:
Thomas H. Wilson and Tim Carr, West Virginia University; B. J. Carney, Jay Hewitt, Ian Costello, Emily Jordon,
Northeast Natural Energy LLC; Keith MacPhail, Oluwaseun Magbagbeola, Adrian Morales, Asbjoern Johansen,
Leah Hogarth, Olatunbosun Anifowoshe, Kashif Naseem, Natalie Uschner, Mandy Thomas, Si Akin, Schlumberger,
in prep.: Microseismic and model stimulation of natural fracture networks in the Marcellus
Shale, West Virginia, 5p.
2) Additional experiments will be designed and incorporated into the zone set property grid
as part of continued efforts to model fracture stimulation of reservoir intervals and better
understand microseismic activity associated with HFT.
3) Fiber optic observations will be incorporated in the model studies noted in 1 and 2 above.
4) Direct geophysics student (if student and funds available) in the analysis of b-values
stage-by-stage following the format of efforts undertaken by Zhu, Y., T. Wilson, P.
Sullivan, 2016 (submitted) - Variations of microseismic b-values and their relationship to 3D seismic
structure in the Marcellus Shale: Southwestern Pennsylvania: submitted for presentation at the 86th Annual
International Meeting, SEG in Dallas, TX., 5p.
5) Direct geophysics student (if funding and student available) to assist with additional
stage-by-stage simulations.
6) Use calculated seismic moment for microseismic events observed along the 3H and 5H
wells to develop stage-by-stage 3D function to distribute intensity of stimulated fractures
following the efforts of Wilson and Sullivan (submitted) - Microseismic energy density and event
trend constraints on model DFN development for hydraulically fractured reservoirs: Marcellus shale,
southwestern Pennsylvania, U. S. A.: submitted for presentation at the 86th Annual International Meeting, SEG
in Dallas, TX, 5p.
Task 4b - Geomechanical:
MIP 3-H
Stage #
Maximum
Fracture
Length (ft)
Maximum
Fracture
Height (ft)
Average Fracture
Width (in)
1 749.5 100.7 0.7041
2 657 100.4 0.7050
3 651.4 100.9 0.7071

DE-FE0024297_WVURC-Coop-Agreement_FY16_Q4-ProgressReport_1Jul-30Sep2016 final.docx 25 of 36
The modeling study will be continued to investigate other stimulation stages at well MIP 3H by
using available information on the hydraulic fracturing field parameters (fluid volumes, pumping
rate, proppant schedule, and geophysical data). The analysis of microseismic data will be
continued and a comparison of fracture geometries will be made with available microseismic
data.
Products
Topic 5 – Surface Environmental
Task 5a – Surface Environmental – Water
Approach
The Monongahela River surface water network has been sampled twelve times since June 2015.
Two sets of baseline samples were collected one month prior to gas well development activity at
the MSEEL site. Surface water samples have been collected during and after each phase of gas
well development at the three points selected along the Monongahela River. Figure 5.1 shows
the locations of sampling points MR-1, MR-2, and MR-3 in red with the Northeast Energy site
indicated in purple. Due to a shortage of funds for surface environmental monitoring, the
Monongahela River surface water network was last sampled during the previous quarter on May
25, 2016.
Figure 5.a.1: MSEEL surface water sampling locations

DE-FE0024297_WVURC-Coop-Agreement_FY16_Q4-ProgressReport_1Jul-30Sep2016 final.docx 26 of 36
The sampling schedule for surface water and gas well development water/waste streams is
detailed in Table 5.a.1.
Table 5.a.1: MSEEL sampling schedule
Surface water samples are being analyzed for the following parameters, see Table 5.a.2.
Table 5.a.2: Analytical parameters
Results and Discussion
Parameters analyzed for FPW are listed in Table 5.1. Makeup water was pumped from the
Monongahela River and mixed with the hydraulic fracturing fluids. FPW samples were taken at
the upstream end of each well’s separator.
Mon ground HF fluid HF flowback/ drilling drilling drilling total total Sampling
River water makeup fluids produced fluids muds* cuttings aqueous solids Dates
Sampling Stations 3 0 2 2 2 2 2 2
Subtask 1.4.1 Test surface sampling plan
ID and review existing GW/SW data
Finalize project surface sampling plan
Subtask 1.4.3 Develop water qualiity baseline
Groundwater baseline prior to drilling
Surface water baseline prior to drilling 3 3 6/12/2015
4 4 6/25/2015 Field duplicate taken
Subtask 2.1.1 Environmental monitoring-Drilling
Vertical drilling 3 3 7/8/2015 surface water only
1 1
1 1
Horizontal drilling 3 1 1 1 5 2
liquids & solids fraction
of muds
1 1 1 2 2
liquids & solids fraction
of muds
Subtask 2.2.1 Environmental monitoring-Completion
Hydraulic fracturing 3 2 2 7
flowback Initial 3 2 5
Flowback 1 week 3 2 5
Flowback 2 weeks 3 2 5
Flowback 4 weeks 3 2 5
Flowback 8 weeks 3 2 5
Subtask 2.3.1 Environmental monitoring-Production
Production 3 stations x 3/yr x 4 yrs 36 24 60
Notes
Aqueous/Solids: drilling/completion/productionFreshwater
Completed-flow path identification, otherwise no other value
Completed-see below
Access denied-groundwater will not be sampled
Organics Radionuclides
AnionspH Alkalinity Ag Mg Benzene α
TDS Br Al Mn Toluene β
TSS Cl As Na Ethylbenzene 40 K
Conductance SO4 Ba Ni Xylene226 Ra
Ca Pb MBAS228
Ra
Cr Se
Fe Sr
K Zn
Aqueous chemistry parameters
Cations
Inorganics

DE-FE0024297_WVURC-Coop-Agreement_FY16_Q4-ProgressReport_1Jul-30Sep2016 final.docx 27 of 36
The sampling schedule for surface water and gas well development water/waste streams during
this quarter is detailed in Table 5.a.3. Water quality results received to date may be provided
separately as a PDF and upon request.
Table 5.a.3 Third Quarter Sampling Schedule
Products
Table 5.a.4 Third Quarter Products, Publications, Outreach Activities
Date Location Event Presentation
7/15/16 Morgantown WV Issue press release MSEEL Water
and Waste
Findings
7/20/16 Cannonsburg PA RPSEA Onshore Workshop MSEEL Water
and Waste
Findings
7/26/16 Morgantown WV WAJR Radio 'Inside Shale' MSEEL Water
and Waste
Findings
8/22/16 Charleston WV Joint Committee on Energy
WV Legislature
MSEEL Water
and Waste
Findings
8/25/16 Bridgeport WV Meeting with Antero
MSEEL Water
and Waste
Findings
8/29/16 Morgantown WV Meeting with Senators Capito and
Manchin staff
MSEEL Water
and Waste
Findings
8/31/16 Morgantown WV
Meet with Maryland Legislature
and MDE staff
MSEEL Water
and Waste
Findings
Flowback @ 29 weeks - 3H 1 1
6/29/2016 and
7/1/2016 one sample 3H
Flowback @ 29 weeks - 5H 1 1 6/29/2016 one sample 5H
Surface water sampling 0
scheduled for
7/6/2016
surface water sampling
after 29 weeks production,
plus 1 dup
Flowback @ 36 weeks - 3H 1 1 8/17/2016 one sample 3H
Flowback @ 36 weeks - 5H 2 2 8/17/2016 one sample 5H + duplicate
Surface water sampling 0
scheduled for
8/17/2016
surface water sampling
after 35 weeks production,
plus 1 dup
Flowback @ 41 weeks - 3H 1 1 9/21/2016 one sample 3H
Flowback @ 41 weeks - 5H 1 1 9/21/2016 one sample 5H
Surface water sampling 0
scheduled for
9/28/2016
surface water sampling
after 41 weeks production
drilling
cuttings/
muds
total
aqueous
Ground
water
HF fluid
makeupHF fluids
flowback/
produced
drilling
fluids
total
solids
Sampling
Dates
Freshwater
Sampling Notes
Aqueous/Solids: drilling/completion/production
Mon River

DE-FE0024297_WVURC-Coop-Agreement_FY16_Q4-ProgressReport_1Jul-30Sep2016 final.docx 28 of 36
9/26-
27/16
Lexington KY Eastern Sec. AAPG annual meeting MSEEL Water
and Waste
Findings
9/27/16
Lexington KY Meet with UK desalination
researchers
MSEEL Water
and Waste
Findings
Products
None this quarter.
Plan for Next Quarter
Activities moving forward will continue to include sampling of flowback/produced water (FPW)
from 3H and 5H only.
Task 5b – Surface Environmental – Air and Vehicular
The approach to the CAFEE portion of Topic 5 has been focused on methane and other emissions
associated with unconventional well development. Phase 1 of the initial methane emissions audits
was completed, due to concurrent use of sampling systems the direct quantification portion of the
audit will occur in the following quarter.
Results and Discussion
Researchers collaborated with Dr. Natalia Pekney of NETL to use a FLIR GF-320 oil and gas-
imaging camera to complete a leak and loss audit of the MSEEL site. Additional scanning of
components was completed with hand-held methane detectors.
The following items were determined to be leaking natural gas or to have methane emissions as a
part of normal operation (losses).
Leaks
o Fittings within glycol heater units – 3 total leaks found
o Uncapped vent tube – field gas supply to onsite thermoelectric power generator
o Random well head leaks, all leaks were below the threshold of 500 parts per million
(ppm)
Losses
o Open tank thief hatch/tank vent
o Glycol boiler exhaust stacks
o Onsite natural gas powered thermoelectric power generator exhaust
Figure 5.b.1 shows an example of a leaking fitting within the boiler unit. For all detectable leaks
and small losses, the FFS system described in the previous quarterly report will be employed to
quantify the mass rate of methane emissions. However, researchers have developed alternative
methods to quantify the mass rate of methane emissions for small wellhead leaks and for the
exhausts of the glycol boilers.

DE-FE0024297_WVURC-Coop-Agreement_FY16_Q4-ProgressReport_1Jul-30Sep2016 final.docx 29 of 36
Since the wellhead leaks were all below a handheld detector threshold of 500 ppm, researchers
have obtained a tent structure that will be installed over each wellhead. The FFS system will be
ducted to the top of the tent and operated for periods of up to 1 hour per wellhead. This method
will determine the sum of all small leaks for presentation as a net emission rate or flux for each
wellhead (both active and inactive wells).
To measure the mass rate of methane emissions from the glycol boiler exhausts, the sample port
cap on the exhaust stack will be removed. A stainless steel pitot tube has been made which fits
within the sampling ports inner diameter. This pitot tube has been calibrated against a NIST
traceable laminar flow element at CAFEE laboratories. The pitot-tube will be connected to a Heise
handheld pressure-monitoring device to measure the average differential and stagnant pressures
within the exhaust flow to determine the net exhaust volume flow rate. A long and cooled sampling
tube will be connected to the UGGA to measure the CO2 and CH4 concentration within the exhaust
stream. The concentration and volumetric flow rates will be used to calculate a mass based
emissions rate of methane emissions from these units.
Additional Proposed work at MSEEL
CAFEE are currently in discussions with Dr. Gil Bohrer of the Ohio State University and NNE to
conduct additional research on the effects of hydraulic well stimulation on methane fluxes at, on,
or near, fracture well sites. This project would include the installation of two eddy-covariance flux
towers near the MSEEL site in order to assess anthropogenic and biogenic methane fluxes.
Secondly, CAFEE researchers have collaborated with LI-COR Biosciences in developing a
proposal just submitted to the National Science Foundation’s Environmental Engineering
Program. This project would build upon current site audits and also utilize eddy-covariance flux
techniques. The goal of this program is to assess the validity of employing these techniques to
highly heterogeneous emissions sources such as wells sites.
Products
The data summary that was presented in the previous quarter has been integrated with data under
DE-FE0013689. The initial publication has been submitted, peer-reviewed and published in the
Journal of Air and Waste Management Association. The citation follows.
Johnson, D., Heltzel, R., Nix, A., and Barrow, R., “Development of Engine Activity Cycles
for the Prime Movers of Unconventional, Natural Gas Well Development,” Journal of the Air
DE-FE0024297_WVURC-Coop-Agreement_FY16_Q4-ProgressReport_1Jul-30Sep2016 final.docx 30 of 36
and Waste Management Association, 2016. DOI: 10.1080/10962247.2016.1245220.
Plan for Next Quarter
Complete quantification phase of the site wide leak and loss audit
Continue to highlight MSEEL with new collaborators
Topic 6 – Economic and Societal
Approach
The lead on the political and societal project will work to identify and evaluate the factors
shaping the policymaking response of local political actors. Included in this assessment will be
an accounting, past and present, of the actions of public and private individuals and groups
acting in favor of or opposed to shale gas drilling at the MSEEL site.
First year activity includes developing, distributing, collecting and compiling the responses from
a worker survey and a vendor survey. The worker survey will address job characteristics and
offsite expenditures. The vendor survey will help to identify per-well cost structures.
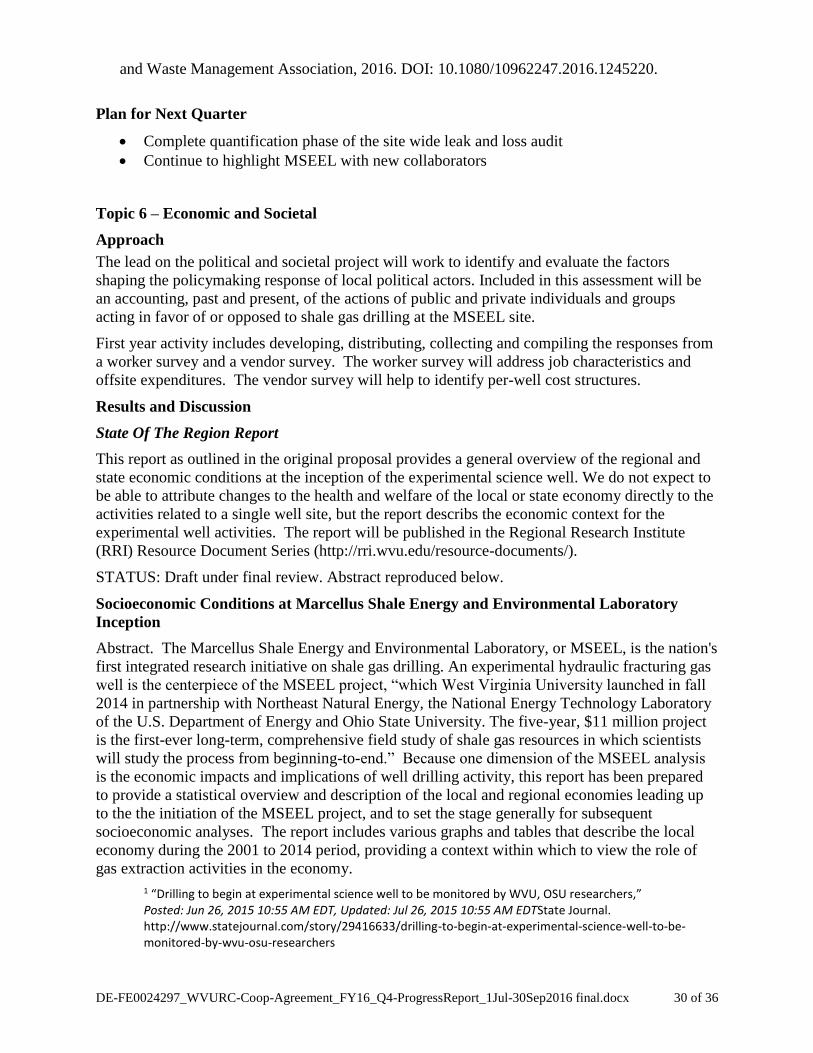
Results and Discussion
State Of The Region Report
This report as outlined in the original proposal provides a general overview of the regional and
state economic conditions at the inception of the experimental science well. We do not expect to
be able to attribute changes to the health and welfare of the local or state economy directly to the
activities related to a single well site, but the report describs the economic context for the
experimental well activities. The report will be published in the Regional Research Institute
(RRI) Resource Document Series (http://rri.wvu.edu/resource-documents/).
STATUS: Draft under final review. Abstract reproduced below.
Socioeconomic Conditions at Marcellus Shale Energy and Environmental Laboratory
Inception
Abstract. The Marcellus Shale Energy and Environmental Laboratory, or MSEEL, is the nation's
first integrated research initiative on shale gas drilling. An experimental hydraulic fracturing gas
well is the centerpiece of the MSEEL project, “which West Virginia University launched in fall
2014 in partnership with Northeast Natural Energy, the National Energy Technology Laboratory
of the U.S. Department of Energy and Ohio State University. The five-year, $11 million project
is the first-ever long-term, comprehensive field study of shale gas resources in which scientists
will study the process from beginning-to-end.” Because one dimension of the MSEEL analysis
is the economic impacts and implications of well drilling activity, this report has been prepared
to provide a statistical overview and description of the local and regional economies leading up
to the the initiation of the MSEEL project, and to set the stage generally for subsequent
socioeconomic analyses. The report includes various graphs and tables that describe the local
economy during the 2001 to 2014 period, providing a context within which to view the role of
gas extraction activities in the economy.
1 “Drilling to begin at experimental science well to be monitored by WVU, OSU researchers,” Posted: Jun 26, 2015 10:55 AM EDT, Updated: Jul 26, 2015 10:55 AM EDTState Journal. http://www.statejournal.com/story/29416633/drilling-to-begin-at-experimental-science-well-to-be-monitored-by-wvu-osu-researchers

DE-FE0024297_WVURC-Coop-Agreement_FY16_Q4-ProgressReport_1Jul-30Sep2016 final.docx 31 of 36
Drilling Expenditures Data
Northeast Natural Energy has provided us with their detailed operating expenditures for the
experimental well. We have used these data to compile a generalized cost tool for estimating
well-drilling costs by industry for Marcellus drilling operations. These data can be used to
populate a production cost function that can be embedded in regional economic systems models
(e.g., economic input-output models). By varying well-specific parameters, the resulting
production functions will be valuable contributions to the impacts assessment community for use
in estimating economic benefits of drilling operations. The cost function is be scalable and
sensitive to the extent possible to a number of variables such as well pad size and accessibility,
number of wells, and depth of wells. The spreadsheet based production cost function estimation
tool will be archived at the Regional Research Institute and implemented by RRI staff to protect
NNE’s proprietary data. The procedure is documented in a report that will be published in the
Regional Research Institute Resource Document Series (http://rri.wvu.edu/resource-documents/).
STATUS: Draft under final review. Abstract reproduced below.
A Marcellus Well Drilling Cost Estimation Tool
Abstract. This report summarizes the transformation of financial data on the MSEEL shale gas
well provided by Northeast Natural Energy (NNE) management into a data based tool that can be
used to estimate a generalized non-linear production function for subsequently embedding within
an economic systems model. The processing required the identification and assignment of
supplying industry classification and a determination for each input cost regarding the extent to
which it varies by well or well characteristics. The initial data and transformation process are
described along with issues confronted in data preparation and how they have been addressed.
Impact estimates for the MSEEL well provided by NNE formed the basis for the development of
a tool for estimating Marcellus shale gas well-drilling costs. The data provided were assigned to
4-digit NAICS industry classifications for each input expenditure, and were then embedded
within a spreadsheet model that estimates industry-specific well production costs that vary with
well-specific parameters. These production costs can form the basis for parameterizing an
economic input-output model to estimate the wage and employment impacts of drilling activities.
By distinguishing between variable and fixed costs, we enable the development of a non-linear
production function where many input expenditures are not proportional to total cost. The
resulting non-linear production function is particularly useful for adapting to other well drilling
scenarios and assessing impacts other Marcellus wells and well-sites. The production cost
functions that are generated are analogous to various different production recipes that are tied
directly to varying well configurations and characteristics, The production function model has
been generalized to the extent that is supported by the data and the expertise of MSEEL
participants.
The format of the resulting production cost report is shown below.
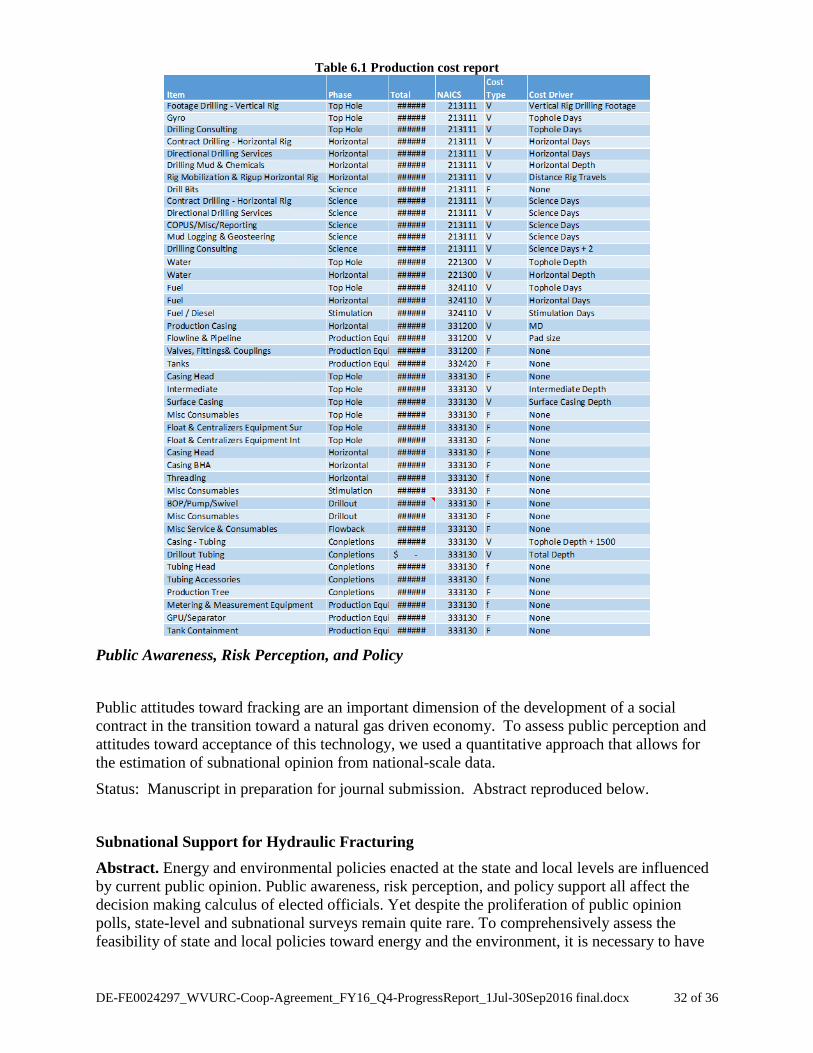
DE-FE0024297_WVURC-Coop-Agreement_FY16_Q4-ProgressReport_1Jul-30Sep2016 final.docx 32 of 36
Table 6.1 Production cost report
Public Awareness, Risk Perception, and Policy
Public attitudes toward fracking are an important dimension of the development of a social
contract in the transition toward a natural gas driven economy. To assess public perception and
attitudes toward acceptance of this technology, we used a quantitative approach that allows for
the estimation of subnational opinion from national-scale data.
Status: Manuscript in preparation for journal submission. Abstract reproduced below.
Subnational Support for Hydraulic Fracturing
Abstract. Energy and environmental policies enacted at the state and local levels are influenced
by current public opinion. Public awareness, risk perception, and policy support all affect the
decision making calculus of elected officials. Yet despite the proliferation of public opinion
polls, state-level and subnational surveys remain quite rare. To comprehensively assess the
feasibility of state and local policies toward energy and the environment, it is necessary to have

DE-FE0024297_WVURC-Coop-Agreement_FY16_Q4-ProgressReport_1Jul-30Sep2016 final.docx 33 of 36
accurate estimates of subnational public opinion on energy and environmental attitudes, their
perceptions of risk, and support for particular policies. To address this need, this study uses
national-scale data and a methodology known as multilevel regression and poststratification
(MRP) to estimate subnational opinion. I find that estimates produced with MRP are comparable
to state-specific surveys on issues like hydraulic fracturing, support for pipelines, and attitudes
toward emissions limits. On an issue like hydraulic fracturing, I find that in both state-specific
surveys and MRP estimates, political partisanship and race are the strongest predictors of support
for the practice. In states with few respondents in national polls, especially those from energy-
rich states like West Virginia and Wyoming, MRP provides a more efficient and cost-friendly
manner of estimating subnational opinion.
Worker Expenditures Survey
The worker expenditure survey instrument was designed to provide greater detail on types and
levels of expenditures by well-site workers. The survey included questions designed to identify
consumption behavior of typical onsite transient workers during their performance periods.
Expenditures types include lodging and accommodations, food, entertainment, and incidentals.
The survey instrument also collected information on income ranges and places of residence.
These data should prove useful, e.g., in characterizing the geography of income and earnings
impacts No other survey-based estimates based on actual well-sites have been collected and
analyzed to our knowledge.
We collected a total of 70 responses, which is estimated to be a response rate of roughly 50% of
well-site workers. Unfortunately, many of the questionnaires were not filled out in their entirety,
and it is unclear whether responses to specific questions will be useful in any meaningful way
(e.g., some respondents chose to rephrase questions and or provided responses that cannot be
coded). The overall value of the survey is limited because of the non-response rate and the
incomplete and inaccurate questionnaire participation.
Status: The survey responses have been coded and compiled and we are continuing to try to
identify ways to use the expenditures summaries to improve the accuracy of drilling impacts
assessments generally, or as part of the basis for an economic impacts assessment for the science
well.

DE-FE0024297_WVURC-Coop-Agreement_FY16_Q4-ProgressReport_1Jul-30Sep2016 final.docx 34 of 36
Cost Status
Year 1
Start: 10/01/2014 End:
09/30/2015
Baseline Reporting Quarter
Q1
(12/31/14)
Q2
(3/30/15)
Q3
(6/30/15)
Q4
(9/30/15)
Baseline Cost Plan
(From 424A, Sec. D)
(from SF-424A)
Federal Share $549,000 $3,549,000
Non-Federal Share $0.00 $0.00
Total Planned (Federal and
Non-Federal) $549,000 $3,549,000
Cumulative Baseline Costs
Actual Incurred Costs
Federal Share $0.00 $14,760.39 $237,451.36
$300,925.66
Non-Federal Share $0.00 $0.00 $0.00
$0.00
Total Incurred Costs -
Quarterly (Federal and Non-
Federal) $0.00 $14,760.39 $237,451.36
$300,925.66
Cumulative Incurred Costs $0.00 $14,760.39 $252,211.75
$553,137.41
Uncosted
Federal Share $549,000 $534,239.61 $3,296,788.25
$2,995,862.59
Non-Federal Share $0.00 $0.00 $2,814,930.00
$2,814,930.00
Total Uncosted - Quarterly
(Federal and Non-Federal) $549,000 $534,239.61 $6,111,718.25
$5,810,792.59

DE-FE0024297_WVURC-Coop-Agreement_FY16_Q4-ProgressReport_1Jul-30Sep2016 final.docx 35 of 36
Start: 10/01/2014 End:
09/30/2015
Baseline Reporting
Quarter
Q5
(12/31/15)
Q6
(3/30/16)
Q7
(6/30/16)
Q8
(9/30/16)
Baseline Cost Plan
(From 424A, Sec. D)
(from SF-424A)
Federal Share $6,247,367 $7,297,926
Non-Federal Share 2,814,930 $4,342,480
Total Planned (Federal
and Non-Federal) $9,062,297 $9,062,297.00 $11,640,406
Cumulative Baseline
Costs
Actual Incurred Costs
Federal Share $577,065.91 $4,480,939.42 $845,967.23
$556,511.68
Non-Federal Share $0.00 $2,189,863.30 $2,154,120.23
$0.00
Total Incurred Costs -
Quarterly (Federal and
Non-Federal) $577,065.91 $6,670,802.72 $3,000,087.46
$556,551.68
Cumulative Incurred
Costs $1,130,203.32 $7,801,006.04 $10,637,732.23
$11,194,243.91
Uncosted
Federal Share $5,117,163.68 $636,224.26 $1,004,177.30
$447,665.62
Non-Federal Share $2,814,930.00 $625,066.70 ($1,503.53)
($1,503.53)
Total Uncosted -
Quarterly (Federal and
Non-Federal) $2,418,796.68 $1,261,290.96 $1,002,673.77
$446,162.09

DE-FE0024297_WVURC-Coop-Agreement_FY16_Q4-ProgressReport_1Jul-30Sep2016 final.docx 36 of 36
National Energy Technology Laboratory
626 Cochrans Mill Road P.O. Box 10940 Pittsburgh, PA 15236-0940 3610 Collins Ferry Road P.O. Box 880 Morgantown, WV 26507-0880 13131 Dairy Ashford, Suite 225 Sugarland, TX 77478 1450 Queen Avenue SW Albany, OR 97321-2198 2175 University Ave. South Suite 201 Fairbanks, AK 99709 Visit the NETL website at: www.netl.doe.gov Customer Service: 1-800-553-7681