NTDA Market Report
2
4x4 Q1 sales were down across all three channels; -1% at national Multiples, -2% at Regional Multiples and -13% at Independents. Passenger car tyre sales were unchanged for National Multiples, up 1% at Regional Multiples and up 3% for Independents. Combining unit sales figures for passenger, 4x4 and LCV tyres, a YOY comparison for Q1 shows that National Multiple sales declined 9.7%, from 2.12 million to 1.91 million, Regional Multiple sales were down 16.3% (578,000 from 691,000) and Independents’ sales down 6.1% (2.33 million from 2.48 million). Sales by Speed Ratings The final information gives sales by speed ratings. Received wisdom is that cars are becoming faster and more powerful and this is borne out by the tyre market data. Sales of R/S and T-rated tyres declined 6% in Q1 and H-rated sales fell 3%. V-rated tyre sales rose by 5% and W/Y and Z-rated tyre sales were up 2%. Q1 unit sales show market shares by speed rating as follows: R/S/T: 22%, H: 21%, V: 27% and W/Y/Z: 29%. No part of this publication may be reproduced, stored in a retrieval system, or transmitted in any form or by any means, mechanical, photocopying, recording or otherwise, without the prior permission in writing of the publishers. Although great care has been taken in the compilation and preparation of this bulletin to ensure accuracy, the publishers cannot in any circumstances accept responsibility for errors or omissions or advice given in this publication. Copyright ©NTDA2011 Ref:05/11 N www.ntda.co.uk UK TYRE MARKET REVIEW How it Works GfK’s retail audit concept begins with defining the channels that sell the product and, for tyres, the panel consists of specialist tyre resellers. These are split into three groups; National Multiples, (100+ stores), Regional Multiples (9 - 100 stores) and Independents (<9 stores). A representative sample is chosen and sales information is collected electronically on a regular basis; this is extrapolated to the wider market. Some areas not included in the panel are wholesale B2B sales, sales from car dealer networks or MOT specialists and sales from non-supermarket linked service stations. Automotive Trends – Q1 2011 Members will be aware of the relationship between the NTDA and research company GfK. GfK stands for “growth from knowledge” and the company describes itself as a “knowledge provider”. Every day, companies need to make decisions and knowledge is the basis for decision-making. GfK has been in business for 35 years and is the fourth largest research company in the world. In the UK, it tracks the performance of a number of products in the automotive industry, one of which is tyres. The standard service includes information on market size, market structures by technical features and by prices and market shares by brands. Much of this information is confidential and commercially sensitive, but the NTDA has permission to publish general market information to provide a snapshot of the state of the UK car tyre market, using data gathered by GfK in the first quarter of the year.
-
Upload
richard-edy -
Category
Documents
-
view
217 -
download
1
description
Snapshot of car tyres sales for first quarter 2011
Transcript of NTDA Market Report
4x4 Q1 sales were down across all three channels; -1% at national Multiples, -2% at Regional Multiples and -13% at Independents. Passenger car tyre sales were unchanged for National Multiples, up 1% at Regional Multiples and up 3% for Independents.
Combining unit sales fi gures for passenger, 4x4 and LCV tyres, a YOY comparison for Q1 shows that National Multiple sales declined 9.7%, from 2.12 million to 1.91 million, Regional Multiple sales were down 16.3% (578,000 from 691,000) and Independents’ sales down 6.1% (2.33 million from 2.48 million).
Sales by Speed RatingsThe fi nal information gives sales by speed ratings. Received wisdom is that cars are becoming faster and more powerful and this is borne out by the tyre market data. Sales of R/S and T-rated tyres declined 6% in Q1 and H-rated sales fell 3%. V-rated tyre sales rose by 5% and W/Y and Z-rated tyre sales were up 2%.
Q1 unit sales show market shares by speed rating as follows:R/S/T: 22%, H: 21%, V: 27% and W/Y/Z: 29%.
No part of this publication may be reproduced, stored in a retrieval system, or transmitted in any form or by any means, mechanical, photocopying, recording or otherwise, without the prior permission in writing of the publishers. Although great care has been taken in the compilation and preparation of this bulletin to ensure accuracy, the publishers cannot in any circumstances accept responsibility for errors or omissions or advice given in this publication.
Copyright ©NTDA2011 Ref:05/11
NEWSwww.ntda.co.uk UK TYRE MARKET REVIEW
How it WorksGfK’s retail audit concept begins with defi ning the channels that sell the product and, for tyres, the panel consists of specialist tyre resellers. These are split into three groups; National Multiples, (100+ stores), Regional Multiples (9 - 100 stores) and Independents (<9 stores). A representative sample is chosen and sales information is collected electronically on a regular basis; this is extrapolated to the wider market.
Some areas not included in the panel are wholesale B2B sales, sales from car dealer networks or MOT specialists and sales from non-supermarket linked service stations.
Automotive Trends – Q1 2011Members will be aware of the relationship between the NTDA and research company GfK. GfK stands for “growth from knowledge” and the company describes itself as a “knowledge provider”.
Every day, companies need to make decisions and knowledge is the basis for decision-making. GfK has been in business for 35 years and is the fourth largest research company in the world. In the UK, it tracks the performance of a number of products in the automotive industry, one of which is tyres.
The standard service includes information on market size, market structures by technical features and by prices and market shares by brands. Much of this information is confi dential and commercially sensitive, but the NTDA has permission to publish general market information to provide a snapshot of the state of the UK car tyre market, using data gathered by GfK in the fi rst quarter of the year.
NEWS www.ntda.co.uk
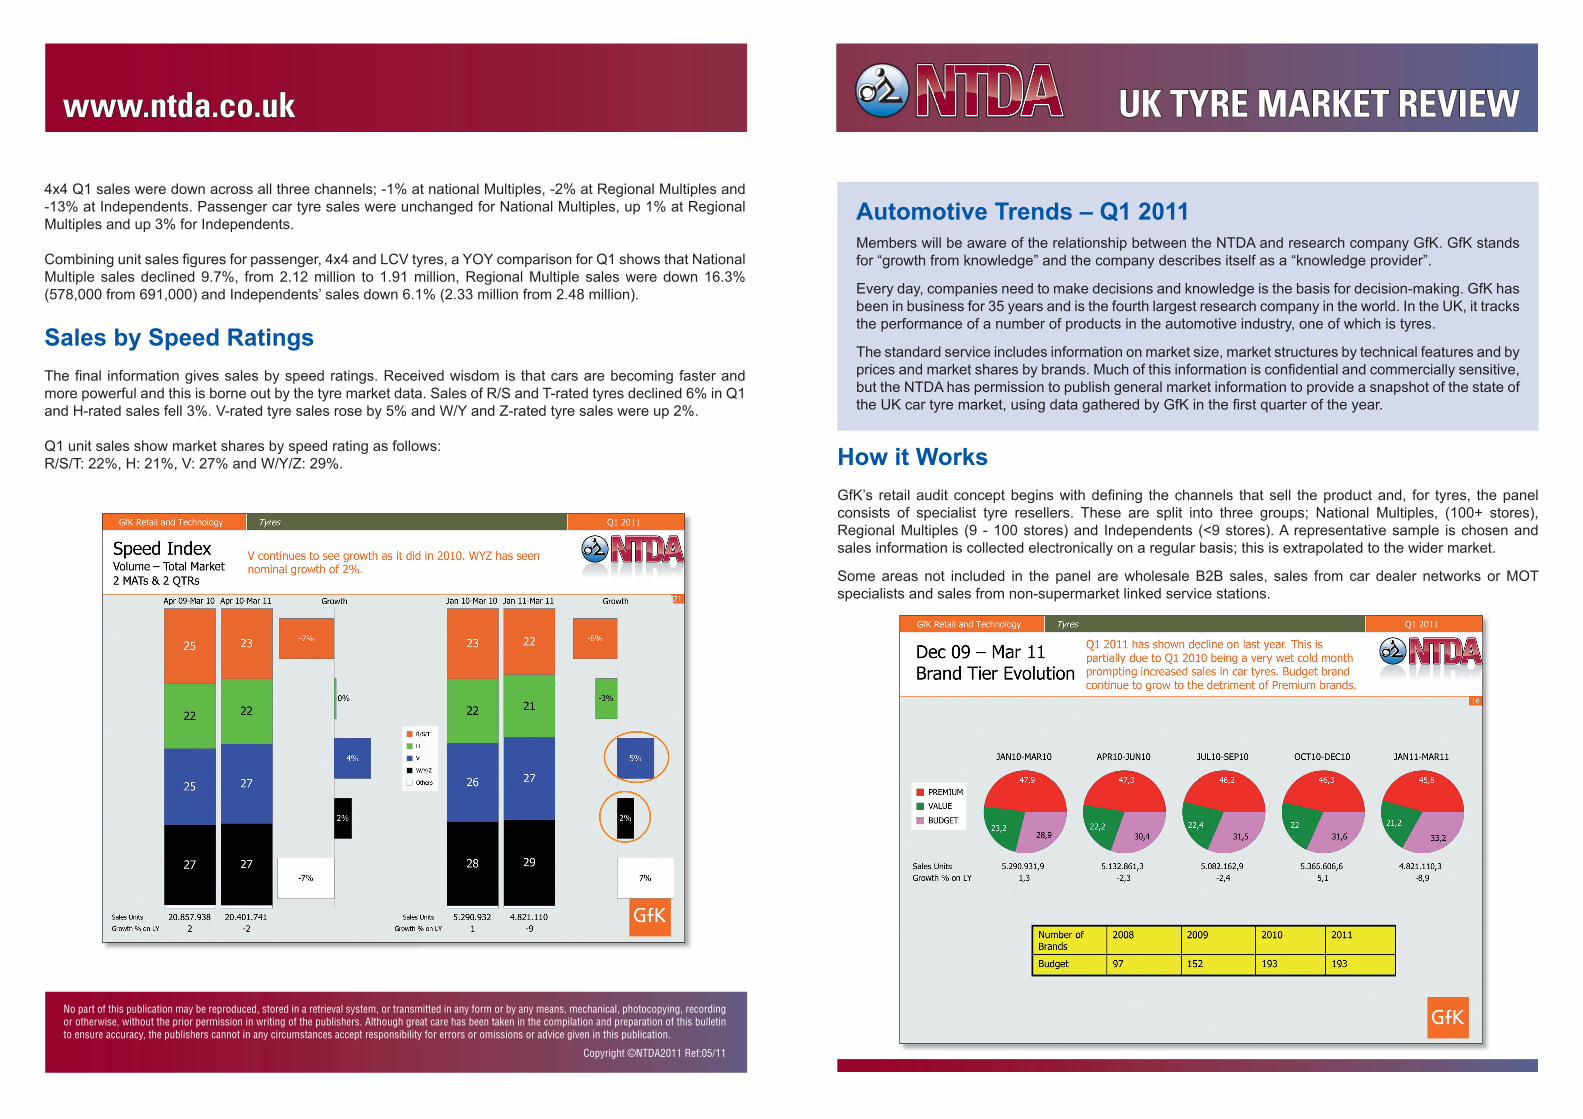
Sales of premium brand tyres continued to decline, with budget brands picking up market share. Having said that, premium brands still make up the largest sector of the market, with 45.6% in Q1 2011. Value tyres had a 21.2% market share and budget tyres accounted for 33.2%. For Q1 2010, the shares were as follows: Premium: 47.9%, Value: 23.2% and Budget: 28.9%. Thus, while the budget sector has grown by 5% year on year, the premium and value sectors have seen double digit declines of 13% and 17% respectively.
One statistic that emerges from the fi gures is the growth in numbers of budget brands on the market. In 2008, there were 97 recorded budget brands, but three years later, this fi gure has almost exactly doubled, with 193 budget brands on sale.
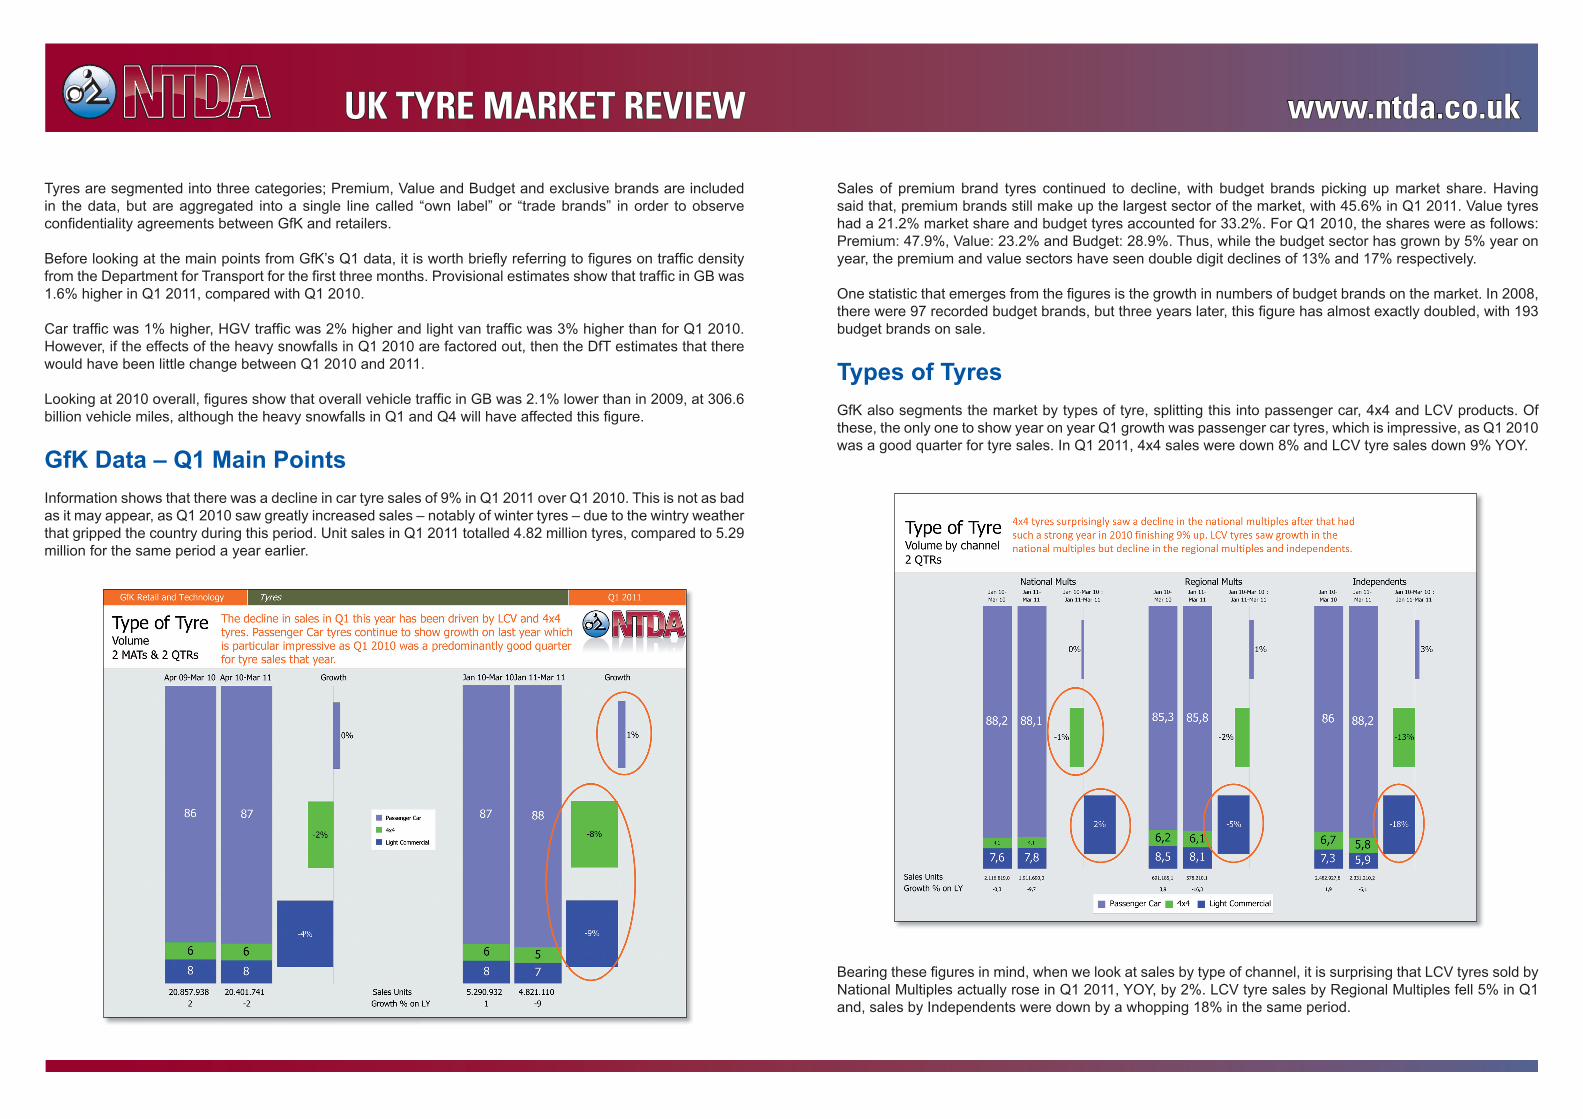
Types of TyresGfK also segments the market by types of tyre, splitting this into passenger car, 4x4 and LCV products. Of these, the only one to show year on year Q1 growth was passenger car tyres, which is impressive, as Q1 2010 was a good quarter for tyre sales. In Q1 2011, 4x4 sales were down 8% and LCV tyre sales down 9% YOY.
Bearing these fi gures in mind, when we look at sales by type of channel, it is surprising that LCV tyres sold by National Multiples actually rose in Q1 2011, YOY, by 2%. LCV tyre sales by Regional Multiples fell 5% in Q1 and, sales by Independents were down by a whopping 18% in the same period.
Tyres are segmented into three categories; Premium, Value and Budget and exclusive brands are included in the data, but are aggregated into a single line called “own label” or “trade brands” in order to observe confi dentiality agreements between GfK and retailers.
Before looking at the main points from GfK’s Q1 data, it is worth briefl y referring to fi gures on traffi c density from the Department for Transport for the fi rst three months. Provisional estimates show that traffi c in GB was 1.6% higher in Q1 2011, compared with Q1 2010.
Car traffi c was 1% higher, HGV traffi c was 2% higher and light van traffi c was 3% higher than for Q1 2010. However, if the effects of the heavy snowfalls in Q1 2010 are factored out, then the DfT estimates that there would have been little change between Q1 2010 and 2011.
Looking at 2010 overall, fi gures show that overall vehicle traffi c in GB was 2.1% lower than in 2009, at 306.6 billion vehicle miles, although the heavy snowfalls in Q1 and Q4 will have affected this fi gure.
GfK Data – Q1 Main PointsInformation shows that there was a decline in car tyre sales of 9% in Q1 2011 over Q1 2010. This is not as bad as it may appear, as Q1 2010 saw greatly increased sales – notably of winter tyres – due to the wintry weather that gripped the country during this period. Unit sales in Q1 2011 totalled 4.82 million tyres, compared to 5.29 million for the same period a year earlier.
UK TYRE MARKET REVIEW