Market Within A Market Report - April
56
-
Upload
michael-lewis -
Category
Documents
-
view
222 -
download
2
description
Market Within A Market Report - April
Transcript of Market Within A Market Report - April


WHAT IS A MARKET WITHIN A MARKET?
Just as the weather is different from Los Feliz to Santa Monica so is the Real Estate climate. While it
may be cloudy & overcast in Marina del Rey, at the same exact time, it may be warm & sunny in
the Mid Wilshire area. The Real Estate market works the same way. Year-to-year there may be a
significant sales increase in Venice while at the same time there is an alarming drop in sales price
from the Palms – Mar Vista area even though they are literally blocks from one another.
With our vast years of experience, we at Keller Williams have come to notice that like the need for
a sweater by the beach and a T-shirt in the Valley, every market within a market has a very different
climate and therefore requires its own set of statistics for you to truly understand what is going on in
your neighborhood. Although you can easily access the broad national, state, and/or country
trends published by the media, they may not have anything to do with what is occurring in your
own backyard. After all, you wouldn’t watch a weather channel report for Seattle to decide if you
need an umbrella that day would you?

WHY THIS BENEFITS YOU – OUR CLIENT
Our extensive experience & knowledge has led us to notice that markets within
markets may be performing in a different way from one another and from national
averages.
With the current stringent lending situation, having knowledge of the specialized
market trends for the neighborhood you are contemplating is vital for true success in
your transaction.
Don’t be mislead by ideas that are not actual facts.
What is in fact occurring in the markets of those areas may be counterintuitive of
notions or ideas you may have perceived from national averages. Knowledge is
power and knowing all the facts will give you the power to make the most educated
choice.

$2,686,194
$533
14.0
17.0
179.0
83.1
8.2
9.50%
$1,060,000
$946
15.0
12.0
117.0
75.8
7.8
10.26%
-60.5%
77.5%
7.1%
-29.4%
-34.6%
-8.7%
-5.2%
8.0%
BEL AIR – HOMBLY HILLS SFR
Median Price ……………………..…….
Average Price per Square Foot ….…
Properties Sold ……………………….
Properties Pending Sale ………………
Properties For Sale …………….……...
Days on Market (Pending Sale) ….…..
Month’s supply of Inventory……….…
Percent Under Contract ………….……
Median Price ……………………..…….
Average Price per Square Foot ….…
Properties Sold ……………………….
Properties Pending Sale ………………
Properties For Sale …………….……...
Days on Market (Pending Sale) ….…..
Month’s supply of Inventory……….…
Percent Under Contract ………….……
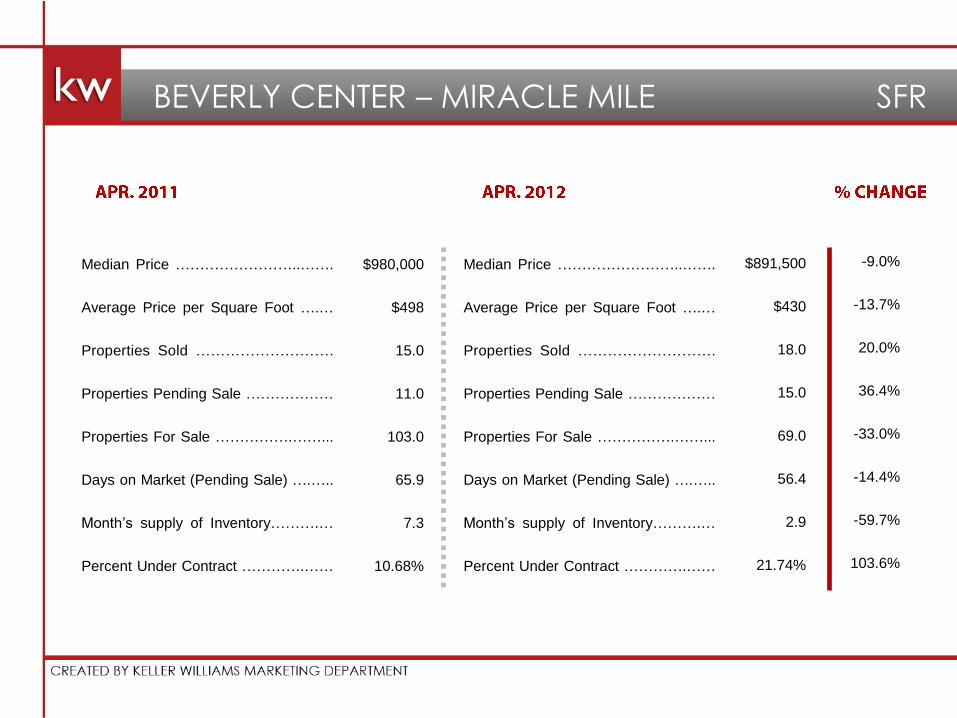
$980,000
$498
15.0
11.0
103.0
65.9
7.3
10.68%
$891,500
$430
18.0
15.0
69.0
56.4
2.9
21.74%
-9.0%
-13.7%
20.0%
36.4%
-33.0%
-14.4%
-59.7%
103.6%
BEVERLY CENTER – MIRACLE MILE SFR
Median Price ……………………..…….
Average Price per Square Foot ….…
Properties Sold ……………………….
Properties Pending Sale ………………
Properties For Sale …………….……...
Days on Market (Pending Sale) ….…..
Month’s supply of Inventory……….…
Percent Under Contract ………….……
Median Price ……………………..…….
Average Price per Square Foot ….…
Properties Sold ……………………….
Properties Pending Sale ………………
Properties For Sale …………….……...
Days on Market (Pending Sale) ….…..
Month’s supply of Inventory……….…
Percent Under Contract ………….……

$497,000
$333
3.0
3.0
37.0
37.3
9.7
8.11%
$501,400
$478
2.0
7.0
24.0
56.3
1.7
29.17%
0.09%
43.5%
-33.3%
133.3%
-35.1%
50.8%
-82.3%
259.7%
BEVERLY CENTER – MIRACLE MILE CONDO
Median Price ……………………..…….
Average Price per Square Foot ….…
Properties Sold ……………………….
Properties Pending Sale ………………
Properties For Sale …………….……...
Days on Market (Pending Sale) ….…..
Month’s supply of Inventory……….…
Percent Under Contract ………….……
Median Price ……………………..…….
Average Price per Square Foot ….…
Properties Sold ……………………….
Properties Pending Sale ………………
Properties For Sale …………….……...
Days on Market (Pending Sale) ….…..
Month’s supply of Inventory……….…
Percent Under Contract ………….……
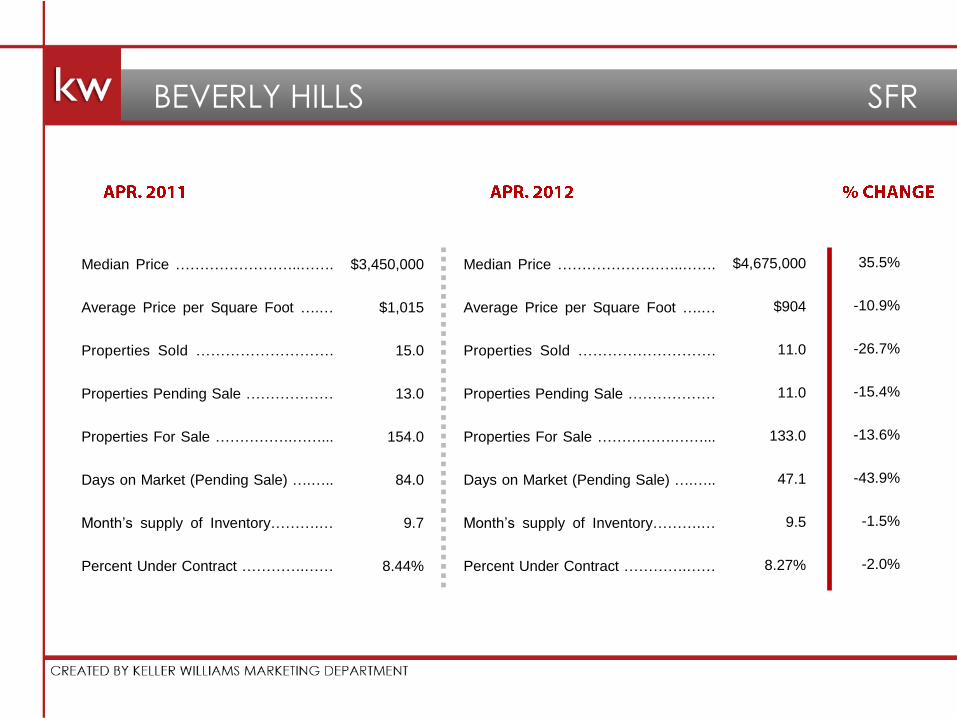
$3,450,000
$1,015
15.0
13.0
154.0
84.0
9.7
8.44%
$4,675,000
$904
11.0
11.0
133.0
47.1
9.5
8.27%
35.5%
-10.9%
-26.7%
-15.4%
-13.6%
-43.9%
-1.5%
-2.0%
BEVERLY HILLS SFR
Median Price ……………………..…….
Average Price per Square Foot ….…
Properties Sold ……………………….
Properties Pending Sale ………………
Properties For Sale …………….……...
Days on Market (Pending Sale) ….…..
Month’s supply of Inventory……….…
Percent Under Contract ………….……
Median Price ……………………..…….
Average Price per Square Foot ….…
Properties Sold ……………………….
Properties Pending Sale ………………
Properties For Sale …………….……...
Days on Market (Pending Sale) ….…..
Month’s supply of Inventory……….…
Percent Under Contract ………….……

$640,000
$361
4.0
7.0
97.0
84.6
11.6
7.22%
$1,055,000
$1,217
5.0
12.0
82.0
67.3
5.0
14.63%
64.8%
237.1%
25.0%
71.4%
-15.5%
-20.4%
-56.8%
102.8%
BEVERLY HILLS CONDO
Median Price ……………………..…….
Average Price per Square Foot ….…
Properties Sold ……………………….
Properties Pending Sale ………………
Properties For Sale …………….……...
Days on Market (Pending Sale) ….…..
Month’s supply of Inventory……….…
Percent Under Contract ………….……
Median Price ……………………..…….
Average Price per Square Foot ….…
Properties Sold ……………………….
Properties Pending Sale ………………
Properties For Sale …………….……...
Days on Market (Pending Sale) ….…..
Month’s supply of Inventory……….…
Percent Under Contract ………….……
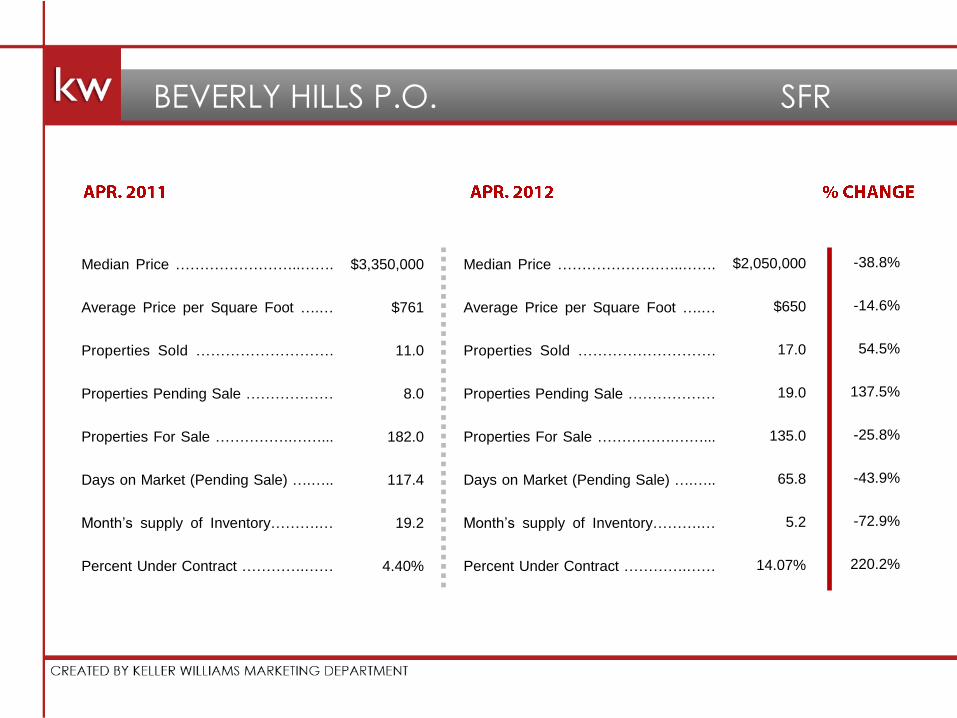
$3,350,000
$761
11.0
8.0
182.0
117.4
19.2
4.40%
$2,050,000
$650
17.0
19.0
135.0
65.8
5.2
14.07%
-38.8%
-14.6%
54.5%
137.5%
-25.8%
-43.9%
-72.9%
220.2%
BEVERLY HILLS P.O. SFR
Median Price ……………………..…….
Average Price per Square Foot ….…
Properties Sold ……………………….
Properties Pending Sale ………………
Properties For Sale …………….……...
Days on Market (Pending Sale) ….…..
Month’s supply of Inventory……….…
Percent Under Contract ………….……
Median Price ……………………..…….
Average Price per Square Foot ….…
Properties Sold ……………………….
Properties Pending Sale ………………
Properties For Sale …………….……...
Days on Market (Pending Sale) ….…..
Month’s supply of Inventory……….…
Percent Under Contract ………….……

$799,000
$480
9.0
21.0
85.0
47.1
2.6
24.71%
$965,000
$483
13.0
11.0
54.0
55.2
3.5
20.37%
20.8%
0.6%
44.4%
-47.6%
-36.5%
17.2%
37.9%
-17.5%
BEVERLYWOOD SFR
Median Price ……………………..…….
Average Price per Square Foot ….…
Properties Sold ……………………….
Properties Pending Sale ………………
Properties For Sale …………….……...
Days on Market (Pending Sale) ….…..
Month’s supply of Inventory……….…
Percent Under Contract ………….……
Median Price ……………………..…….
Average Price per Square Foot ….…
Properties Sold ……………………….
Properties Pending Sale ………………
Properties For Sale …………….……...
Days on Market (Pending Sale) ….…..
Month’s supply of Inventory……….…
Percent Under Contract ………….……
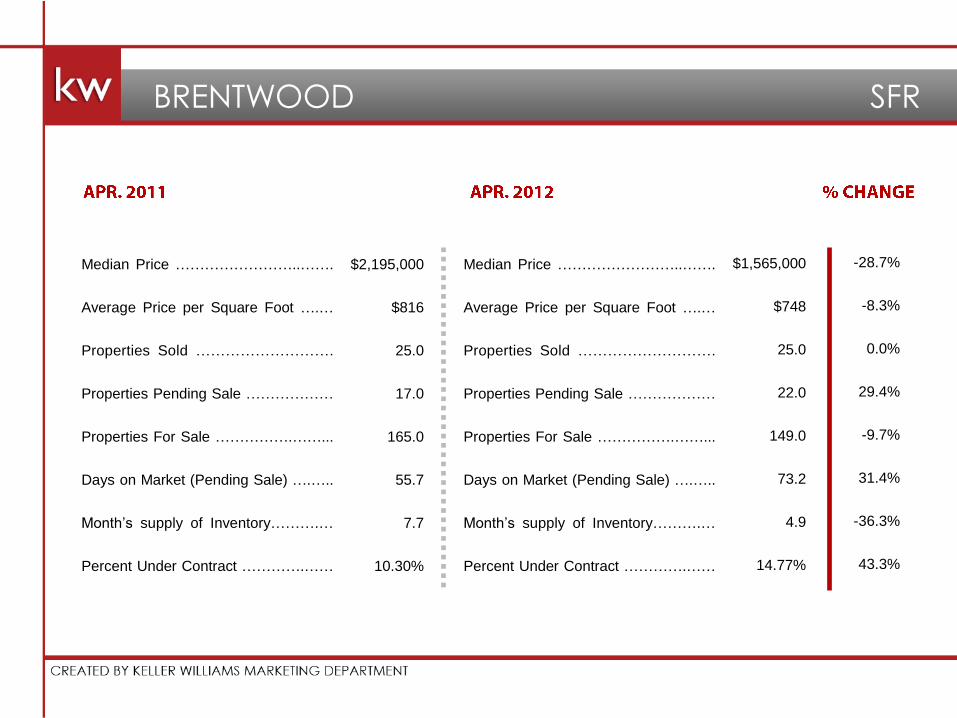
$2,195,000
$816
25.0
17.0
165.0
55.7
7.7
10.30%
$1,565,000
$748
25.0
22.0
149.0
73.2
4.9
14.77%
-28.7%
-8.3%
0.0%
29.4%
-9.7%
31.4%
-36.3%
43.3%
BRENTWOOD SFR
Median Price ……………………..…….
Average Price per Square Foot ….…
Properties Sold ……………………….
Properties Pending Sale ………………
Properties For Sale …………….……...
Days on Market (Pending Sale) ….…..
Month’s supply of Inventory……….…
Percent Under Contract ………….……
Median Price ……………………..…….
Average Price per Square Foot ….…
Properties Sold ……………………….
Properties Pending Sale ………………
Properties For Sale …………….……...
Days on Market (Pending Sale) ….…..
Month’s supply of Inventory……….…
Percent Under Contract ………….……
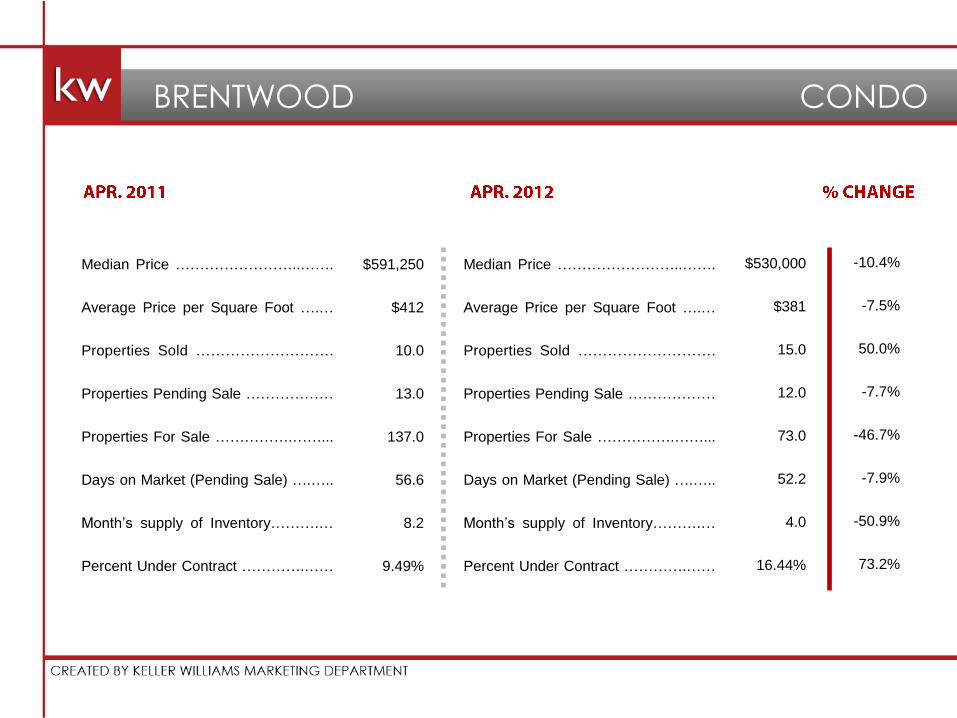
$591,250
$412
10.0
13.0
137.0
56.6
8.2
9.49%
$530,000
$381
15.0
12.0
73.0
52.2
4.0
16.44%
-10.4%
-7.5%
50.0%
-7.7%
-46.7%
-7.9%
-50.9%
73.2%
BRENTWOOD CONDO
Median Price ……………………..…….
Average Price per Square Foot ….…
Properties Sold ……………………….
Properties Pending Sale ………………
Properties For Sale …………….……...
Days on Market (Pending Sale) ….…..
Month’s supply of Inventory……….…
Percent Under Contract ………….……
Median Price ……………………..…….
Average Price per Square Foot ….…
Properties Sold ……………………….
Properties Pending Sale ………………
Properties For Sale …………….……...
Days on Market (Pending Sale) ….…..
Month’s supply of Inventory……….…
Percent Under Contract ………….……

$1,995,000
$455
3.0
2.0
36.0
135.5
15.0
5.56%
$785,000
$315.09
17
65
104
83
2.3
30.0%
-60.7%
-30.7%
466.7%
3150.0%
188.9%
-38.7%
-84.4%
440.0%
CALABASAS SFR
Median Price ……………………..…….
Average Price per Square Foot ….…
Properties Sold ……………………….
Properties Pending Sale ………………
Properties For Sale …………….……...
Days on Market (Pending Sale) ….…..
Month’s supply of Inventory……….…
Percent Under Contract ………….……
Median Price ……………………..…….
Average Price per Square Foot ….…
Properties Sold ……………………….
Properties Pending Sale ………………
Properties For Sale …………….……...
Days on Market (Pending Sale) ….…..
Month’s supply of Inventory……….…
Percent Under Contract ………….……
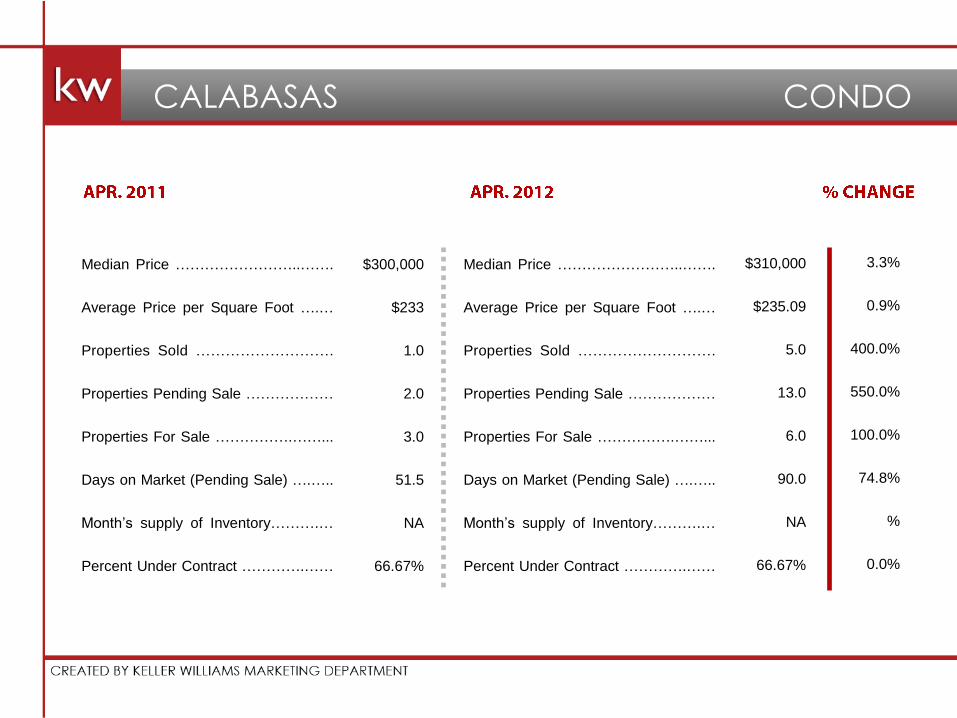
$300,000
$233
1.0
2.0
3.0
51.5
NA
66.67%
$310,000
$235.09
5.0
13.0
6.0
90.0
NA
66.67%
3.3%
0.9%
400.0%
550.0%
100.0%
74.8%
%
0.0%
CALABASAS CONDO
Median Price ……………………..…….
Average Price per Square Foot ….…
Properties Sold ……………………….
Properties Pending Sale ………………
Properties For Sale …………….……...
Days on Market (Pending Sale) ….…..
Month’s supply of Inventory……….…
Percent Under Contract ………….……
Median Price ……………………..…….
Average Price per Square Foot ….…
Properties Sold ……………………….
Properties Pending Sale ………………
Properties For Sale …………….……...
Days on Market (Pending Sale) ….…..
Month’s supply of Inventory……….…
Percent Under Contract ………….……

$1,270,000
$495
6.0
7.0
37.0
26.4
3.7
18.92%
$1,280,000
$519
8.0
7.0
28.0
42.9
2.7
25.0%
0.8%
4.8%
33.3%
0.0%
-24.3%
62.2%
-26.9%
32.1%
CHEVIOT HILLS-RANCH PARK SFR
Median Price ……………………..…….
Average Price per Square Foot ….…
Properties Sold ……………………….
Properties Pending Sale ………………
Properties For Sale …………….……...
Days on Market (Pending Sale) ….…..
Month’s supply of Inventory……….…
Percent Under Contract ………….……
Median Price ……………………..…….
Average Price per Square Foot ….…
Properties Sold ……………………….
Properties Pending Sale ………………
Properties For Sale …………….……...
Days on Market (Pending Sale) ….…..
Month’s supply of Inventory……….…
Percent Under Contract ………….……

$745,000
$449
11.0
11.0
67.0
41.9
4.2
16.42%
$534,500
$463
8.0
15.0
53.0
22.9
1.9
28.30%
-28.3%
3.1%
-27.3%
36.4%
-20.9%
-45.4%
-53.8%
72.4%
CULVER CITY SFR
Median Price ……………………..…….
Average Price per Square Foot ….…
Properties Sold ……………………….
Properties Pending Sale ………………
Properties For Sale …………….……...
Days on Market (Pending Sale) ….…..
Month’s supply of Inventory……….…
Percent Under Contract ………….……
Median Price ……………………..…….
Average Price per Square Foot ….…
Properties Sold ……………………….
Properties Pending Sale ………………
Properties For Sale …………….……...
Days on Market (Pending Sale) ….…..
Month’s supply of Inventory……….…
Percent Under Contract ………….……

$286,500
$299
6.0
15.0
92.0
100.2
4.9
16.30%
$270,000
$250
11.0
26.0
50.0
50.0
0.9
52.0%
-5.8%
-16.4%
83.3%
73.3%
-45.7%
-50.1%
-81.8%
218.9%
CULVER CITY CONDO
Median Price ……………………..…….
Average Price per Square Foot ….…
Properties Sold ……………………….
Properties Pending Sale ………………
Properties For Sale …………….……...
Days on Market (Pending Sale) ….…..
Month’s supply of Inventory……….…
Percent Under Contract ………….……
Median Price ……………………..…….
Average Price per Square Foot ….…
Properties Sold ……………………….
Properties Pending Sale ………………
Properties For Sale …………….……...
Days on Market (Pending Sale) ….…..
Month’s supply of Inventory……….…
Percent Under Contract ………….……

$144,000
$119
5.0
8.0
45.0
49.2
4.4
17.78%
$125,000
$129
3.0
4.0
23.0
26.0
4.5
17.39%
13.2%
8.4%
-40.0%
-50.0%
-48.9%
-47.2%
2.9%
-2.2%
DOWNTOWN SFR
Median Price ……………………..…….
Average Price per Square Foot ….…
Properties Sold ……………………….
Properties Pending Sale ………………
Properties For Sale …………….……...
Days on Market (Pending Sale) ….…..
Month’s supply of Inventory……….…
Percent Under Contract ………….……
Median Price ……………………..…….
Average Price per Square Foot ….…
Properties Sold ……………………….
Properties Pending Sale ………………
Properties For Sale …………….……...
Days on Market (Pending Sale) ….…..
Month’s supply of Inventory……….…
Percent Under Contract ………….……

$304,500
$326
21.0
20.0
209.0
114.7
8.7
9.57%
$380,000
$379
27.0
42.0
124.0
41.5
1.6
33.87%
24.8%
16.3%
28.6%
110.0%
-40.7%
-63.8%
-81.6%
254.0%
DOWNTOWN CONDO
Median Price ……………………..…….
Average Price per Square Foot ….…
Properties Sold ……………………….
Properties Pending Sale ………………
Properties For Sale …………….……...
Days on Market (Pending Sale) ….…..
Month’s supply of Inventory……….…
Percent Under Contract ………….……
Median Price ……………………..…….
Average Price per Square Foot ….…
Properties Sold ……………………….
Properties Pending Sale ………………
Properties For Sale …………….……...
Days on Market (Pending Sale) ….…..
Month’s supply of Inventory……….…
Percent Under Contract ………….……
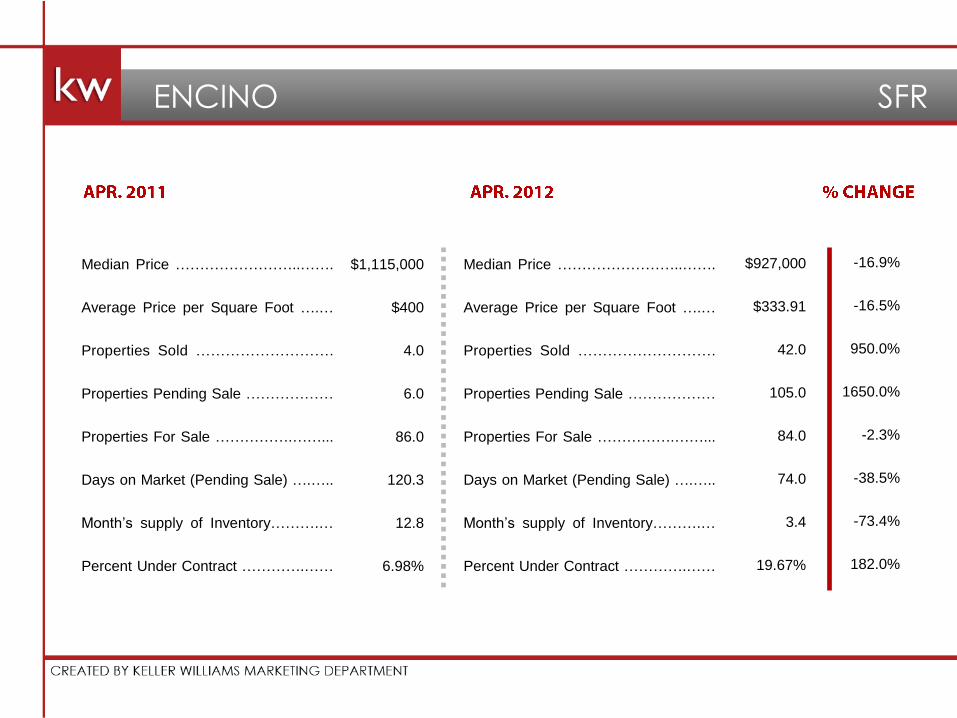
$1,115,000
$400
4.0
6.0
86.0
120.3
12.8
6.98%
$927,000
$333.91
42.0
105.0
84.0
74.0
3.4
19.67%
-16.9%
-16.5%
950.0%
1650.0%
-2.3%
-38.5%
-73.4%
182.0%
ENCINO SFR
Median Price ……………………..…….
Average Price per Square Foot ….…
Properties Sold ……………………….
Properties Pending Sale ………………
Properties For Sale …………….……...
Days on Market (Pending Sale) ….…..
Month’s supply of Inventory……….…
Percent Under Contract ………….……
Median Price ……………………..…….
Average Price per Square Foot ….…
Properties Sold ……………………….
Properties Pending Sale ………………
Properties For Sale …………….……...
Days on Market (Pending Sale) ….…..
Month’s supply of Inventory……….…
Percent Under Contract ………….……

$145,000
$185
3.0
20.0
%
$185,000
$173.51
18.0
49.0
32.0
99.0
4.0
20.0%
27.6%
-6.2%
500.0%
%
60.0%
%
%
%
ENCINO CONDO
Median Price ……………………..…….
Average Price per Square Foot ….…
Properties Sold ……………………….
Properties Pending Sale ………………
Properties For Sale …………….……...
Days on Market (Pending Sale) ….…..
Month’s supply of Inventory……….…
Percent Under Contract ………….……
Median Price ……………………..…….
Average Price per Square Foot ….…
Properties Sold ……………………….
Properties Pending Sale ………………
Properties For Sale …………….……...
Days on Market (Pending Sale) ….…..
Month’s supply of Inventory……….…
Percent Under Contract ………….……

$940,000
$437
23.0
19.0
155.0
46.1
6.4
12.26%
$912,500
$415
22.0
23.0
111.0
67.3
3.1
20.72%
-29.0%
-5.0%
-4.3%
21.1%
-28.4%
46.0%
-50.8%
69.0%
HANCOCK PARK-WILSHIRE SFR
Median Price ……………………..…….
Average Price per Square Foot ….…
Properties Sold ……………………….
Properties Pending Sale ………………
Properties For Sale …………….……...
Days on Market (Pending Sale) ….…..
Month’s supply of Inventory……….…
Percent Under Contract ………….……
Median Price ……………………..…….
Average Price per Square Foot ….…
Properties Sold ……………………….
Properties Pending Sale ………………
Properties For Sale …………….……...
Days on Market (Pending Sale) ….…..
Month’s supply of Inventory……….…
Percent Under Contract ………….……

$450,000
$263
1.0
1.0
26.0
6.0
24.0
3.85%
$805,000
$580
2.0
7.0
20.0
38.7
1.4
35.0%
78.9%
120.5%
100.0%
600.0%
-23.1%
545.2%
-94.0%
810.0%
HOLLYWOOD SFR
Median Price ……………………..…….
Average Price per Square Foot ….…
Properties Sold ……………………….
Properties Pending Sale ………………
Properties For Sale …………….……...
Days on Market (Pending Sale) ….…..
Month’s supply of Inventory……….…
Percent Under Contract ………….……
Median Price ……………………..…….
Average Price per Square Foot ….…
Properties Sold ……………………….
Properties Pending Sale ………………
Properties For Sale …………….……...
Days on Market (Pending Sale) ….…..
Month’s supply of Inventory……….…
Percent Under Contract ………….……

$360,000
$438
4.0
4.0
79.0
121.8
16.2
5.06%
$443,000
$368
8.0
12.0
70.0
31.2
3.5
17.14%
23.1%
-16.0%
100.0%
200.0%
-11.4%
-74.4%
-78.5%
238.6%
HOLLYWOOD CONDO
Median Price ……………………..…….
Average Price per Square Foot ….…
Properties Sold ……………………….
Properties Pending Sale ………………
Properties For Sale …………….……...
Days on Market (Pending Sale) ….…..
Month’s supply of Inventory……….…
Percent Under Contract ………….……
Median Price ……………………..…….
Average Price per Square Foot ….…
Properties Sold ……………………….
Properties Pending Sale ………………
Properties For Sale …………….……...
Days on Market (Pending Sale) ….…..
Month’s supply of Inventory……….…
Percent Under Contract ………….……

$782,500
$346
10.0
6.0
91.0
82.7
12.8
6.59%
$1,205,000
$457
7.0
10.0
59.0
46.2
4.4
16.95%
54.0%
32.1%
-30.0%
66.7%
-35.2%
-44.1%
-65.7%
157.1%
HOLLYWOOD HILLS EAST SFR
Median Price ……………………..…….
Average Price per Square Foot ….…
Properties Sold ……………………….
Properties Pending Sale ………………
Properties For Sale …………….……...
Days on Market (Pending Sale) ….…..
Month’s supply of Inventory……….…
Percent Under Contract ………….……
Median Price ……………………..…….
Average Price per Square Foot ….…
Properties Sold ……………………….
Properties Pending Sale ………………
Properties For Sale …………….……...
Days on Market (Pending Sale) ….…..
Month’s supply of Inventory……….…
Percent Under Contract ………….……

$735,000
$472
15.0
11.0
97.0
42.0
7.5
11.34%
$1,050,000
$476
11.0
23.0
77.0
23.5
2.0
29.87%
42.9%
0.8%
-26.7%
109.1%
-20.6%
-44.1%
-73.8%
163.4%
LOS FELIZ SFR
Median Price ……………………..…….
Average Price per Square Foot ….…
Properties Sold ……………………….
Properties Pending Sale ………………
Properties For Sale …………….……...
Days on Market (Pending Sale) ….…..
Month’s supply of Inventory……….…
Percent Under Contract ………….……
Median Price ……………………..…….
Average Price per Square Foot ….…
Properties Sold ……………………….
Properties Pending Sale ………………
Properties For Sale …………….……...
Days on Market (Pending Sale) ….…..
Month’s supply of Inventory……….…
Percent Under Contract ………….……

$410,000
$275
2.0
1.0
15.0
40.0
13.0
6.67%
$289,000
$343
3.0
2.0
10.0
95.0
3.0
20.0%
-29.5%
24.7%
50.0%
100.0%
-33.3%
137.5%
-76.9%
200.0%
LOS FELIZ CONDO
Median Price ……………………..…….
Average Price per Square Foot ….…
Properties Sold ……………………….
Properties Pending Sale ………………
Properties For Sale …………….……...
Days on Market (Pending Sale) ….…..
Month’s supply of Inventory……….…
Percent Under Contract ………….……
Median Price ……………………..…….
Average Price per Square Foot ….…
Properties Sold ……………………….
Properties Pending Sale ………………
Properties For Sale …………….……...
Days on Market (Pending Sale) ….…..
Month’s supply of Inventory……….…
Percent Under Contract ………….……

$1,512,500
$553
10.0
10.0
298.0
200.4
26.1
3.36%
$1,355,000
$494
9.0
20.0
228.0
96.0
8.8
8.77%
-10.4%
-10.7%
-10.0%
100.0%
-23.5%
-52.1%
-66.1%
161.4%
MALIBU SFR
Median Price ……………………..…….
Average Price per Square Foot ….…
Properties Sold ……………………….
Properties Pending Sale ………………
Properties For Sale …………….……...
Days on Market (Pending Sale) ….…..
Month’s supply of Inventory……….…
Percent Under Contract ………….……
Median Price ……………………..…….
Average Price per Square Foot ….…
Properties Sold ……………………….
Properties Pending Sale ………………
Properties For Sale …………….……...
Days on Market (Pending Sale) ….…..
Month’s supply of Inventory……….…
Percent Under Contract ………….……

$1,600,000
$1,235
1.0
2.0
110.0
178.5
50.0
1.82%
$6,749,500
$2,192
8.0
9.0
90.0
175.1
7.8
10.0%
321.8%
77.5%
700.0%
350.0%
-18.2%
-1.9%
-84.4%
450.0%
MALIBU BEACH SFR
Median Price ……………………..…….
Average Price per Square Foot ….…
Properties Sold ……………………….
Properties Pending Sale ………………
Properties For Sale …………….……...
Days on Market (Pending Sale) ….…..
Month’s supply of Inventory……….…
Percent Under Contract ………….……
Median Price ……………………..…….
Average Price per Square Foot ….…
Properties Sold ……………………….
Properties Pending Sale ………………
Properties For Sale …………….……...
Days on Market (Pending Sale) ….…..
Month’s supply of Inventory……….…
Percent Under Contract ………….……
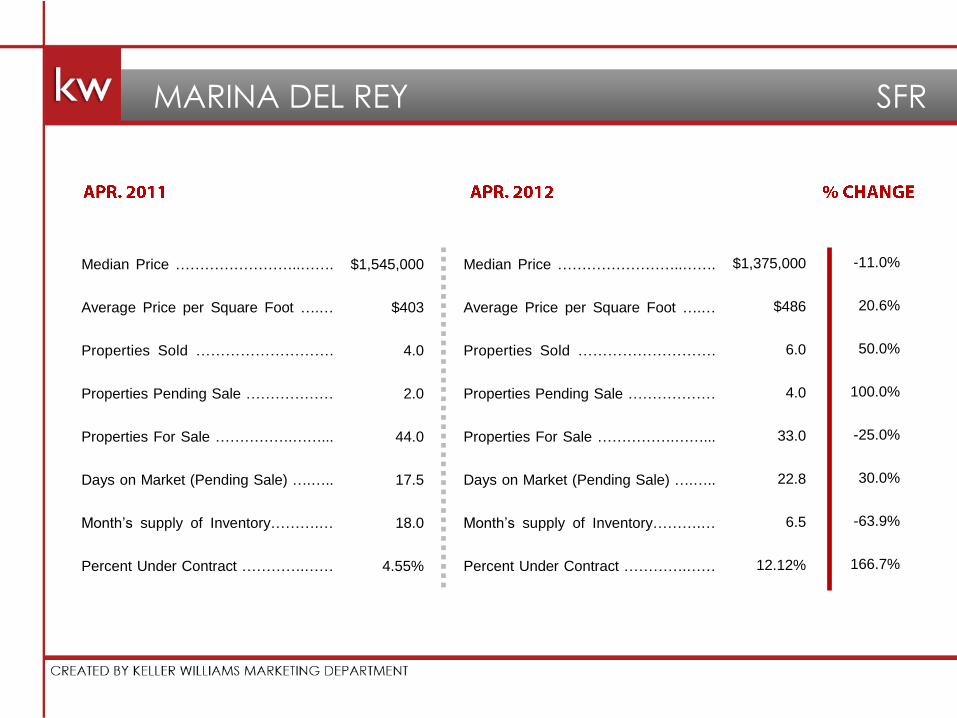
$1,545,000
$403
4.0
2.0
44.0
17.5
18.0
4.55%
$1,375,000
$486
6.0
4.0
33.0
22.8
6.5
12.12%
-11.0%
20.6%
50.0%
100.0%
-25.0%
30.0%
-63.9%
166.7%
MARINA DEL REY SFR
Median Price ……………………..…….
Average Price per Square Foot ….…
Properties Sold ……………………….
Properties Pending Sale ………………
Properties For Sale …………….……...
Days on Market (Pending Sale) ….…..
Month’s supply of Inventory……….…
Percent Under Contract ………….……
Median Price ……………………..…….
Average Price per Square Foot ….…
Properties Sold ……………………….
Properties Pending Sale ………………
Properties For Sale …………….……...
Days on Market (Pending Sale) ….…..
Month’s supply of Inventory……….…
Percent Under Contract ………….……

$605,000
$412
15.0
16.0
229.0
59.2
12.2
6.99%
$605,000
$382
18.0
32.0
161.0
89.2
3.6
19.88%
0.0%
-7.3%
20.0%
100.0%
-29.7%
50.6%
-70.4%
184.5%
MARINA DEL REY CONDO
Median Price ……………………..…….
Average Price per Square Foot ….…
Properties Sold ……………………….
Properties Pending Sale ………………
Properties For Sale …………….……...
Days on Market (Pending Sale) ….…..
Month’s supply of Inventory……….…
Percent Under Contract ………….……
Median Price ……………………..…….
Average Price per Square Foot ….…
Properties Sold ……………………….
Properties Pending Sale ………………
Properties For Sale …………….……...
Days on Market (Pending Sale) ….…..
Month’s supply of Inventory……….…
Percent Under Contract ………….……
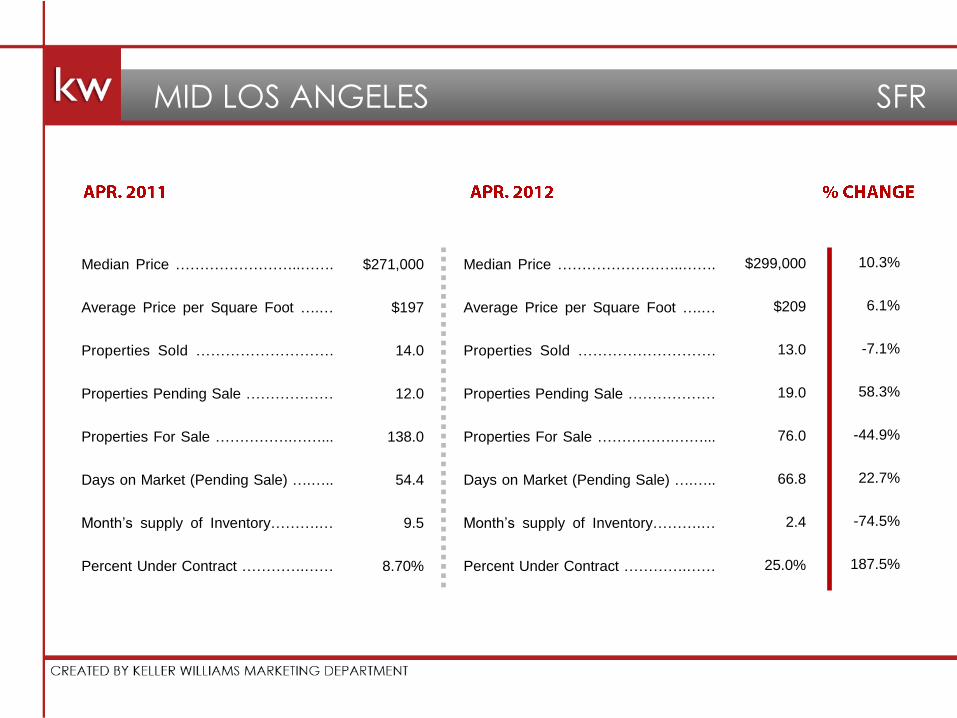
$271,000
$197
14.0
12.0
138.0
54.4
9.5
8.70%
$299,000
$209
13.0
19.0
76.0
66.8
2.4
25.0%
10.3%
6.1%
-7.1%
58.3%
-44.9%
22.7%
-74.5%
187.5%
MID LOS ANGELES SFR
Median Price ……………………..…….
Average Price per Square Foot ….…
Properties Sold ……………………….
Properties Pending Sale ………………
Properties For Sale …………….……...
Days on Market (Pending Sale) ….…..
Month’s supply of Inventory……….…
Percent Under Contract ………….……
Median Price ……………………..…….
Average Price per Square Foot ….…
Properties Sold ……………………….
Properties Pending Sale ………………
Properties For Sale …………….……...
Days on Market (Pending Sale) ….…..
Month’s supply of Inventory……….…
Percent Under Contract ………….……

$610,000
$218
3.0
4.0
35.0
35.2
6.0
11.43%
$410,000
$159
1.0
4.0
25.0
27.2
4.2
16.0%
-32.6%
-27.1%
-66.7%
0.0%
-28.6%
-22.7%
-29.2%
40.0%
MID WILSHIRE SFR
Median Price ……………………..…….
Average Price per Square Foot ….…
Properties Sold ……………………….
Properties Pending Sale ………………
Properties For Sale …………….……...
Days on Market (Pending Sale) ….…..
Month’s supply of Inventory……….…
Percent Under Contract ………….……
Median Price ……………………..…….
Average Price per Square Foot ….…
Properties Sold ……………………….
Properties Pending Sale ………………
Properties For Sale …………….……...
Days on Market (Pending Sale) ….…..
Month’s supply of Inventory……….…
Percent Under Contract ………….……
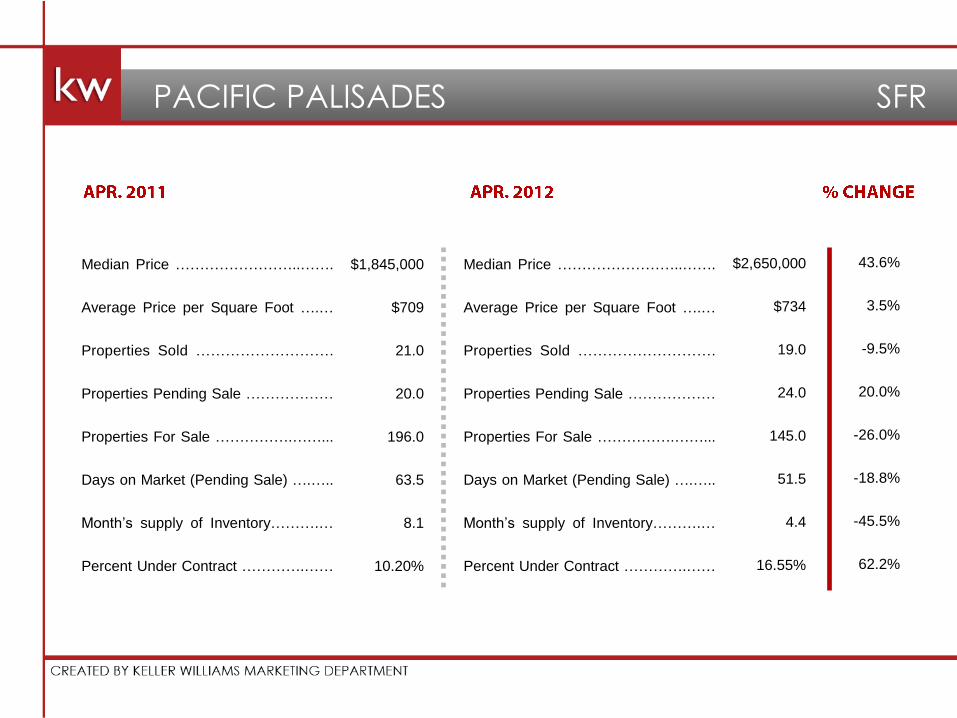
$1,845,000
$709
21.0
20.0
196.0
63.5
8.1
10.20%
$2,650,000
$734
19.0
24.0
145.0
51.5
4.4
16.55%
43.6%
3.5%
-9.5%
20.0%
-26.0%
-18.8%
-45.5%
62.2%
PACIFIC PALISADES SFR
Median Price ……………………..…….
Average Price per Square Foot ….…
Properties Sold ……………………….
Properties Pending Sale ………………
Properties For Sale …………….……...
Days on Market (Pending Sale) ….…..
Month’s supply of Inventory……….…
Percent Under Contract ………….……
Median Price ……………………..…….
Average Price per Square Foot ….…
Properties Sold ……………………….
Properties Pending Sale ………………
Properties For Sale …………….……...
Days on Market (Pending Sale) ….…..
Month’s supply of Inventory……….…
Percent Under Contract ………….……

$687,500
$508
24.0
20.0
104.0
36.9
4.0
19.23%
$695,000
$493
20.0
24.0
80.0
30.9
2.1
30.0%
1.1%
-3.0%
-16.7%
20.0%
-23.1%
-16.3%
-47.9%
56.0%
PALMS – MAR VISTA SFR
Median Price ……………………..…….
Average Price per Square Foot ….…
Properties Sold ……………………….
Properties Pending Sale ………………
Properties For Sale …………….……...
Days on Market (Pending Sale) ….…..
Month’s supply of Inventory……….…
Percent Under Contract ………….……
Median Price ……………………..…….
Average Price per Square Foot ….…
Properties Sold ……………………….
Properties Pending Sale ………………
Properties For Sale …………….……...
Days on Market (Pending Sale) ….…..
Month’s supply of Inventory……….…
Percent Under Contract ………….……

$1,400,000
$656
25.0
11.0
123.0
123.6
9.7
8.94%
$1,725,000
$810
21.0
19.0
107.0
30.1
3.9
17.76%
23.32%
23.5%
-16.0%
72.7%
-13.0%
-75.7%
-59.4%
98.6%
SANTA MONICA SFR
Median Price ……………………..…….
Average Price per Square Foot ….…
Properties Sold ……………………….
Properties Pending Sale ………………
Properties For Sale …………….……...
Days on Market (Pending Sale) ….…..
Month’s supply of Inventory……….…
Percent Under Contract ………….……
Median Price ……………………..…….
Average Price per Square Foot ….…
Properties Sold ……………………….
Properties Pending Sale ………………
Properties For Sale …………….……...
Days on Market (Pending Sale) ….…..
Month’s supply of Inventory……….…
Percent Under Contract ………….……
$505,000
$596
29.0
26.0
220.0
555
6.8
13.18%
$645,000
$579
35.0
40.0
147.0
58.2
2.1
23.81%
27.7%
-2.9%
20.7%
53.8%
-33.2%
4.9%
-69.2%
80.6%
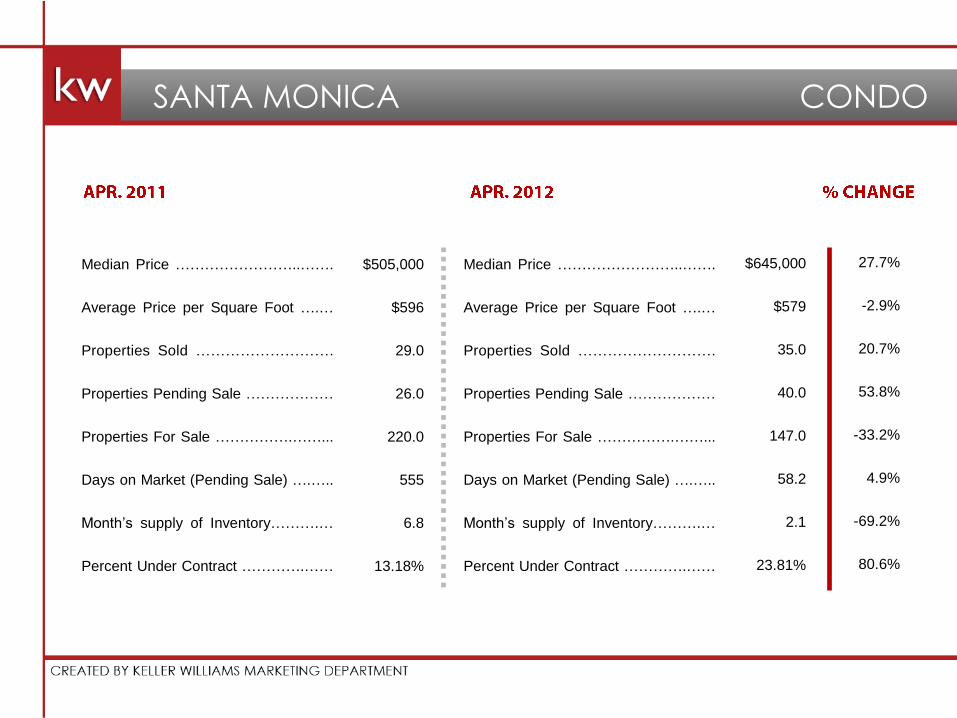
SANTA MONICA CONDO
Median Price ……………………..…….
Average Price per Square Foot ….…
Properties Sold ……………………….
Properties Pending Sale ………………
Properties For Sale …………….……...
Days on Market (Pending Sale) ….…..
Month’s supply of Inventory……….…
Percent Under Contract ………….……
Median Price ……………………..…….
Average Price per Square Foot ….…
Properties Sold ……………………….
Properties Pending Sale ………………
Properties For Sale …………….……...
Days on Market (Pending Sale) ….…..
Month’s supply of Inventory……….…
Percent Under Contract ………….……
$625,000
$416
9.0
12.0
117.0
49.3
7.8
10.26%
$697,000
$357
50
129
133
72
2.2
29.11%
11.5%
-14.2%
455.6%
975.0%
13.7%
46.0%
-72.2%
183.9%
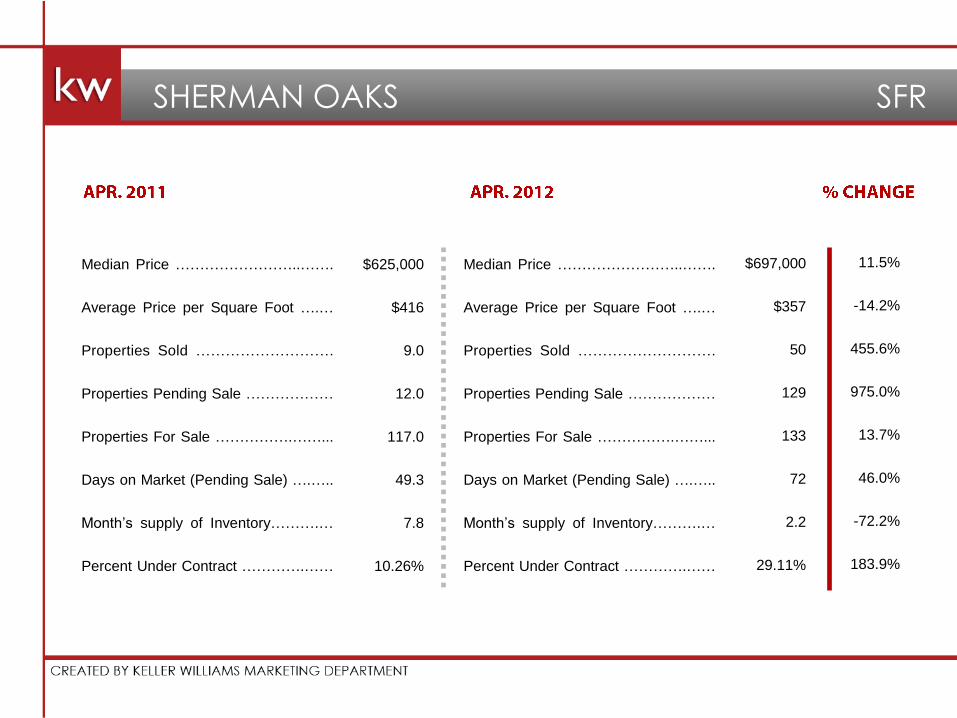
SHERMAN OAKS SFR
Median Price ……………………..…….
Average Price per Square Foot ….…
Properties Sold ……………………….
Properties Pending Sale ………………
Properties For Sale …………….……...
Days on Market (Pending Sale) ….…..
Month’s supply of Inventory……….…
Percent Under Contract ………….……
Median Price ……………………..…….
Average Price per Square Foot ….…
Properties Sold ……………………….
Properties Pending Sale ………………
Properties For Sale …………….……...
Days on Market (Pending Sale) ….…..
Month’s supply of Inventory……….…
Percent Under Contract ………….……
$399,500
$280
4.0
4.0
40.0
52.8
9.0
10.0%
$275,000
$223.76
20.0
86.0
43
122.0
13.0
6.25%
-31.2%
-20.1%
400.0%
2050.0%
7.5%
131.1%
44.4%
-37.5%
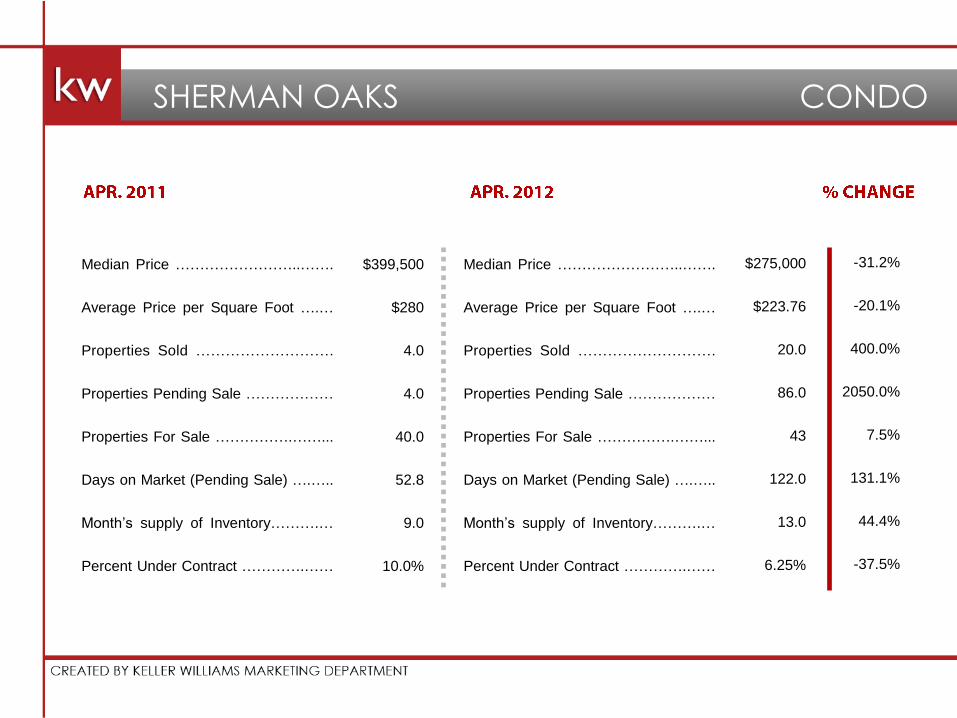
SHERMAN OAKS CONDO
Median Price ……………………..…….
Average Price per Square Foot ….…
Properties Sold ……………………….
Properties Pending Sale ………………
Properties For Sale …………….……...
Days on Market (Pending Sale) ….…..
Month’s supply of Inventory……….…
Percent Under Contract ………….……
Median Price ……………………..…….
Average Price per Square Foot ….…
Properties Sold ……………………….
Properties Pending Sale ………………
Properties For Sale …………….……...
Days on Market (Pending Sale) ….…..
Month’s supply of Inventory……….…
Percent Under Contract ………….……
$600,000
$428
15.0
18.0
116.0
43.1
4.8
15.52%
$620,000
$422
17.0
26.0
80.0
55.4
2.0
32.50%
3.3%
-1.4%
13.3%
44.4%
-31.0%
28.6%
-59.4%
109.4%
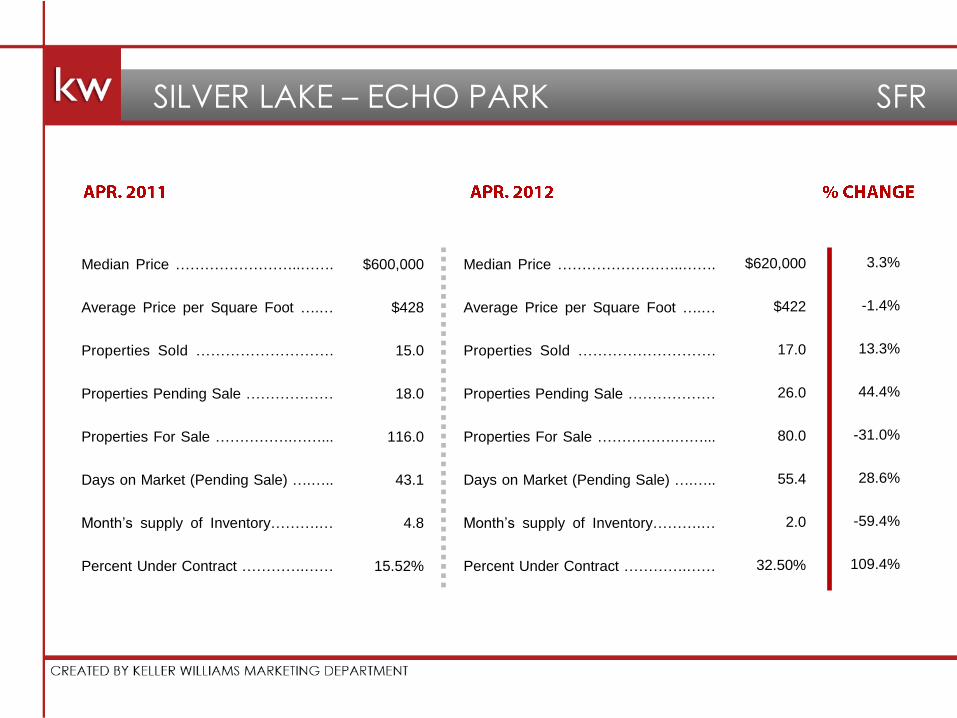
SILVER LAKE – ECHO PARK SFR
Median Price ……………………..…….
Average Price per Square Foot ….…
Properties Sold ……………………….
Properties Pending Sale ………………
Properties For Sale …………….……...
Days on Market (Pending Sale) ….…..
Month’s supply of Inventory……….…
Percent Under Contract ………….……
Median Price ……………………..…….
Average Price per Square Foot ….…
Properties Sold ……………………….
Properties Pending Sale ………………
Properties For Sale …………….……...
Days on Market (Pending Sale) ….…..
Month’s supply of Inventory……….…
Percent Under Contract ………….……
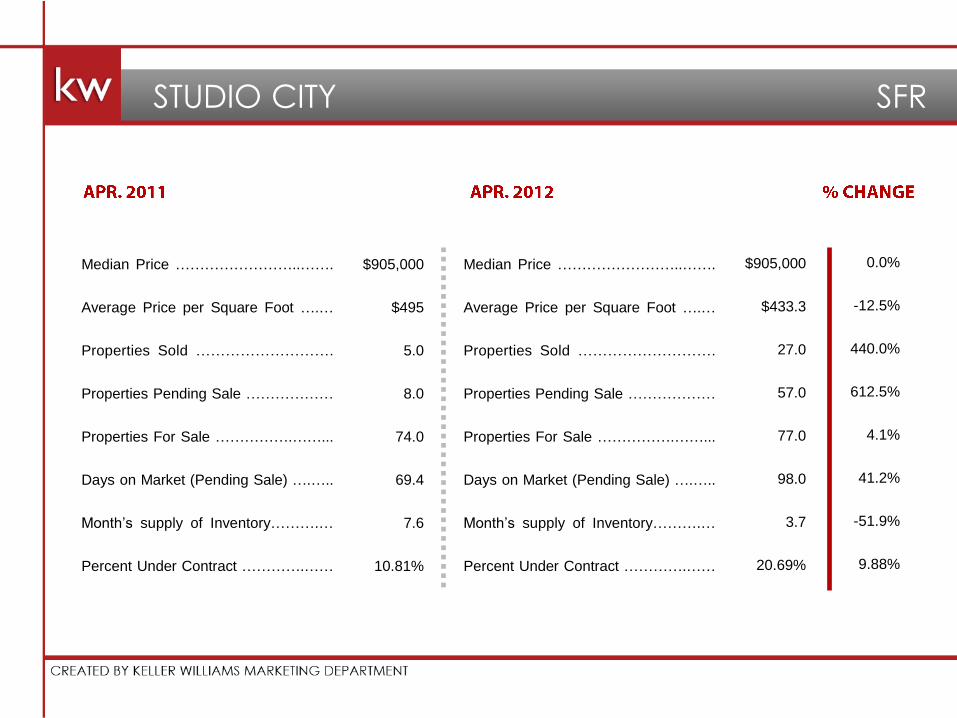
$905,000
$495
5.0
8.0
74.0
69.4
7.6
10.81%
$905,000
$433.3
27.0
57.0
77.0
98.0
3.7
20.69%
0.0%
-12.5%
440.0%
612.5%
4.1%
41.2%
-51.9%
9.88%
STUDIO CITY SFR
Median Price ……………………..…….
Average Price per Square Foot ….…
Properties Sold ……………………….
Properties Pending Sale ………………
Properties For Sale …………….……...
Days on Market (Pending Sale) ….…..
Month’s supply of Inventory……….…
Percent Under Contract ………….……
Median Price ……………………..…….
Average Price per Square Foot ….…
Properties Sold ……………………….
Properties Pending Sale ………………
Properties For Sale …………….……...
Days on Market (Pending Sale) ….…..
Month’s supply of Inventory……….…
Percent Under Contract ………….……
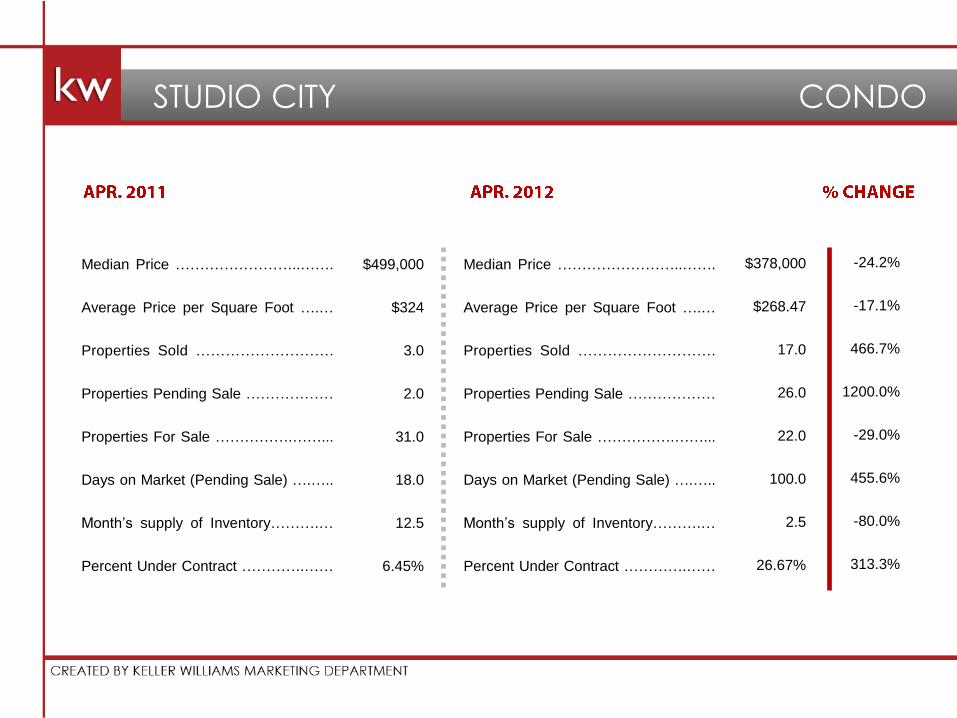
$499,000
$324
3.0
2.0
31.0
18.0
12.5
6.45%
$378,000
$268.47
17.0
26.0
22.0
100.0
2.5
26.67%
-24.2%
-17.1%
466.7%
1200.0%
-29.0%
455.6%
-80.0%
313.3%
STUDIO CITY CONDO
Median Price ……………………..…….
Average Price per Square Foot ….…
Properties Sold ……………………….
Properties Pending Sale ………………
Properties For Sale …………….……...
Days on Market (Pending Sale) ….…..
Month’s supply of Inventory……….…
Percent Under Contract ………….……
Median Price ……………………..…….
Average Price per Square Foot ….…
Properties Sold ……………………….
Properties Pending Sale ………………
Properties For Sale …………….……...
Days on Market (Pending Sale) ….…..
Month’s supply of Inventory……….…
Percent Under Contract ………….……
$1,421,000
$608
26.0
29.0
327.0
87.8
9.2
8.87%
$1,394,000
$580
32.0
31.0
277.0
54.5
6.5
11.19%
-1.9%
-4.6%
23.1%
6.9%
-15.3%
-37.9%
-29.1%
26.2%
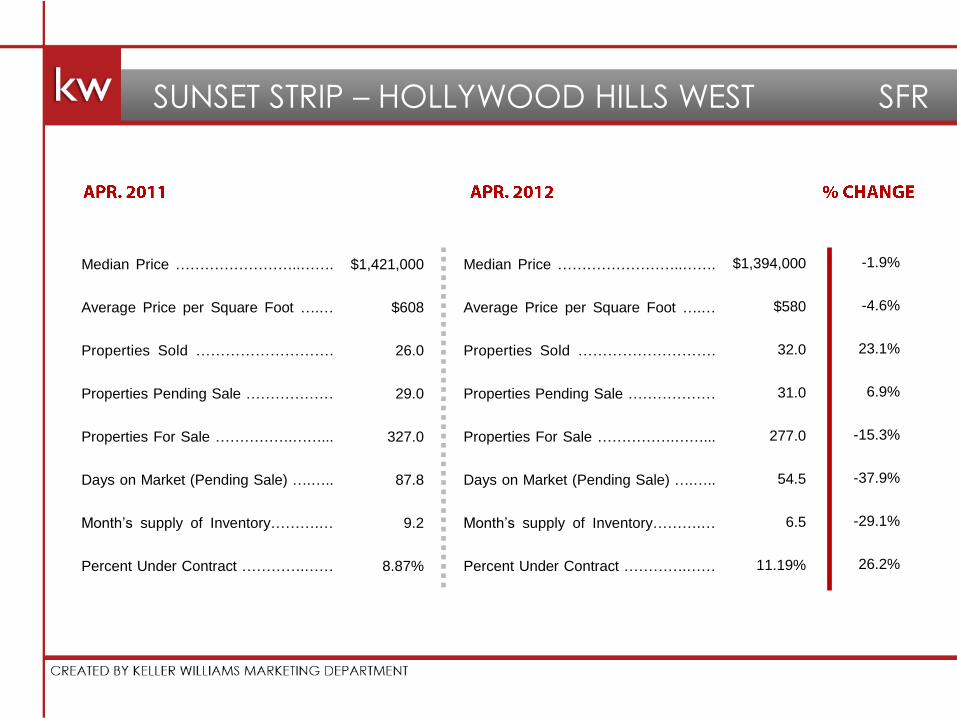
SUNSET STRIP – HOLLYWOOD HILLS WEST SFR
Median Price ……………………..…….
Average Price per Square Foot ….…
Properties Sold ……………………….
Properties Pending Sale ………………
Properties For Sale …………….……...
Days on Market (Pending Sale) ….…..
Month’s supply of Inventory……….…
Percent Under Contract ………….……
Median Price ……………………..…….
Average Price per Square Foot ….…
Properties Sold ……………………….
Properties Pending Sale ………………
Properties For Sale …………….……...
Days on Market (Pending Sale) ….…..
Month’s supply of Inventory……….…
Percent Under Contract ………….……

$448,698
$745
9.0
5.0
51.0
39.0
9.0
9.80%
$440,000
$343
3.0
5.0
33.0
46.0
4.4
15.15%
-1.9%
-54.0%
-66.7%
0.0%
-35.3%
17.9%
-51.1%
54.5%
SUNSET STRIP – HOLLYWOOD HILLS WEST CONDO
Median Price ……………………..…….
Average Price per Square Foot ….…
Properties Sold ……………………….
Properties Pending Sale ………………
Properties For Sale …………….……...
Days on Market (Pending Sale) ….…..
Month’s supply of Inventory……….…
Percent Under Contract ………….……
Median Price ……………………..…….
Average Price per Square Foot ….…
Properties Sold ……………………….
Properties Pending Sale ………………
Properties For Sale …………….……...
Days on Market (Pending Sale) ….…..
Month’s supply of Inventory……….…
Percent Under Contract ………….……

$1,360,000
$445
4.0
8.0
77.0
95.1
7.8
10.39%
$505,000
$543
4.0
10.0
67.0
75.1
4.8
14.93%
62.9%
22.0%
0.0%
25.0%
-13.0%
-21.1%
-38.1%
43.7%
TOPANGA SFR
Median Price ……………………..…….
Average Price per Square Foot ….…
Properties Sold ……………………….
Properties Pending Sale ………………
Properties For Sale …………….……...
Days on Market (Pending Sale) ….…..
Month’s supply of Inventory……….…
Percent Under Contract ………….……
Median Price ……………………..…….
Average Price per Square Foot ….…
Properties Sold ……………………….
Properties Pending Sale ………………
Properties For Sale …………….……...
Days on Market (Pending Sale) ….…..
Month’s supply of Inventory……….…
Percent Under Contract ………….……
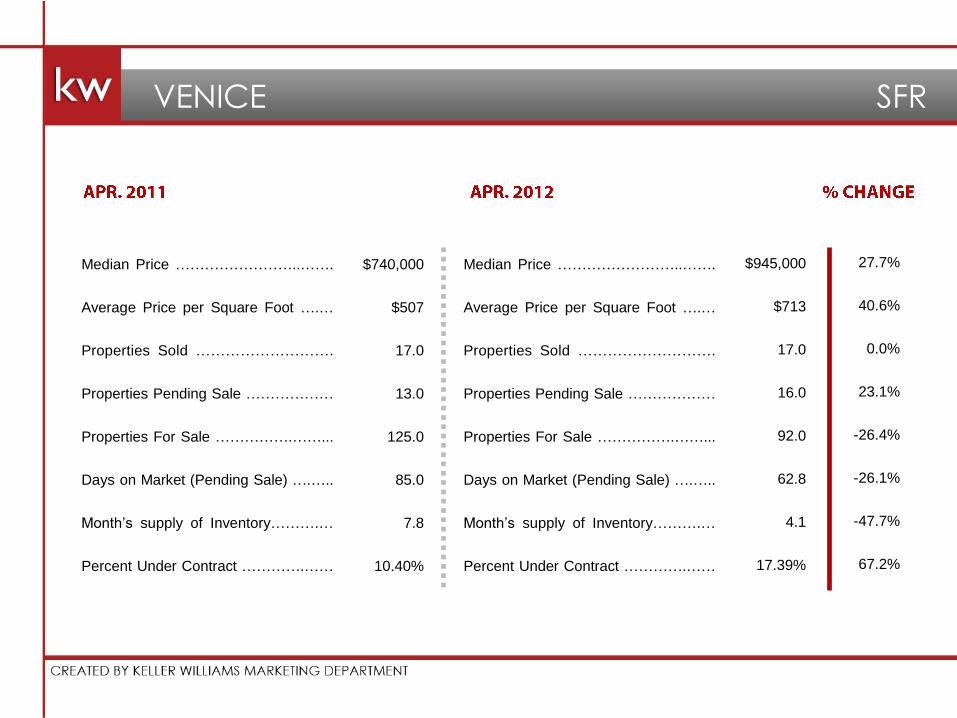
$740,000
$507
17.0
13.0
125.0
85.0
7.8
10.40%
$945,000
$713
17.0
16.0
92.0
62.8
4.1
17.39%
27.7%
40.6%
0.0%
23.1%
-26.4%
-26.1%
-47.7%
67.2%
VENICE SFR
Median Price ……………………..…….
Average Price per Square Foot ….…
Properties Sold ……………………….
Properties Pending Sale ………………
Properties For Sale …………….……...
Days on Market (Pending Sale) ….…..
Month’s supply of Inventory……….…
Percent Under Contract ………….……
Median Price ……………………..…….
Average Price per Square Foot ….…
Properties Sold ……………………….
Properties Pending Sale ………………
Properties For Sale …………….……...
Days on Market (Pending Sale) ….…..
Month’s supply of Inventory……….…
Percent Under Contract ………….……
$965,000
$465
5.0
3.0
36.0
29.7
8.3
8.33%
$1,042,500
$499
2.0
2.0
21.0
98.5
7.0
9.52%
8.0%
7.3%
-60.0%
-33.3%
-41.7%
232.0%
-16.0%
14.3%
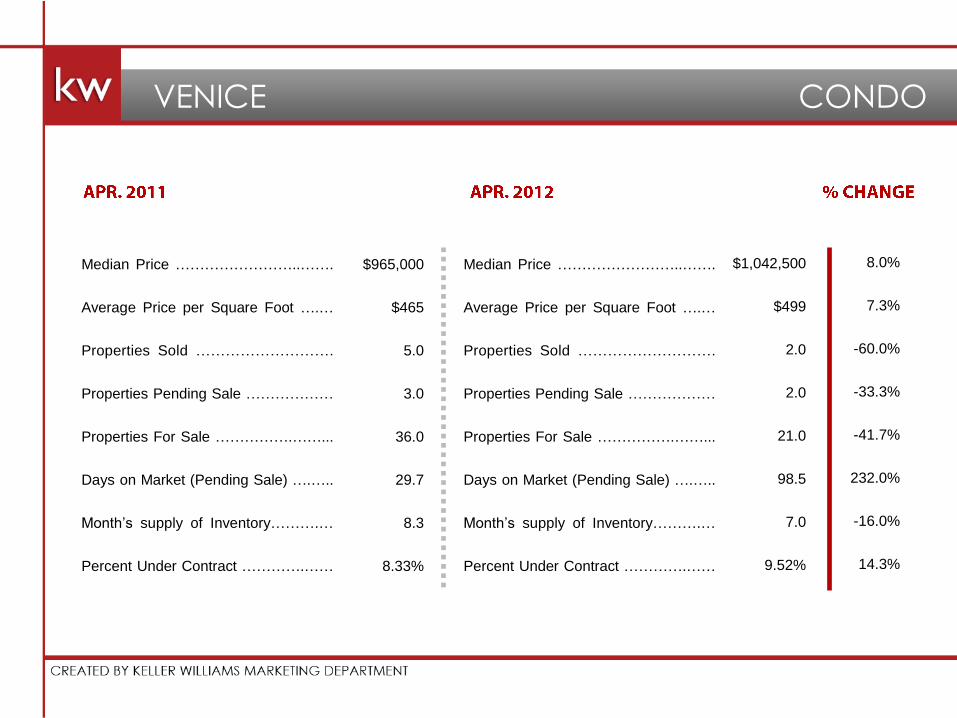
VENICE CONDO
Median Price ……………………..…….
Average Price per Square Foot ….…
Properties Sold ……………………….
Properties Pending Sale ………………
Properties For Sale …………….……...
Days on Market (Pending Sale) ….…..
Month’s supply of Inventory……….…
Percent Under Contract ………….……
Median Price ……………………..…….
Average Price per Square Foot ….…
Properties Sold ……………………….
Properties Pending Sale ………………
Properties For Sale …………….……...
Days on Market (Pending Sale) ….…..
Month’s supply of Inventory……….…
Percent Under Contract ………….……
$1,175,000
$635
9.0
7.0
65.0
95.1
7.0
10.77%
$761,000
$534
8.0
14.0
50.0
31.7
1.9
28.00%
-35.2%
-15.9%
-11.1%
100.0%
-23.1%
-66.7%
-72.4%
160.0%
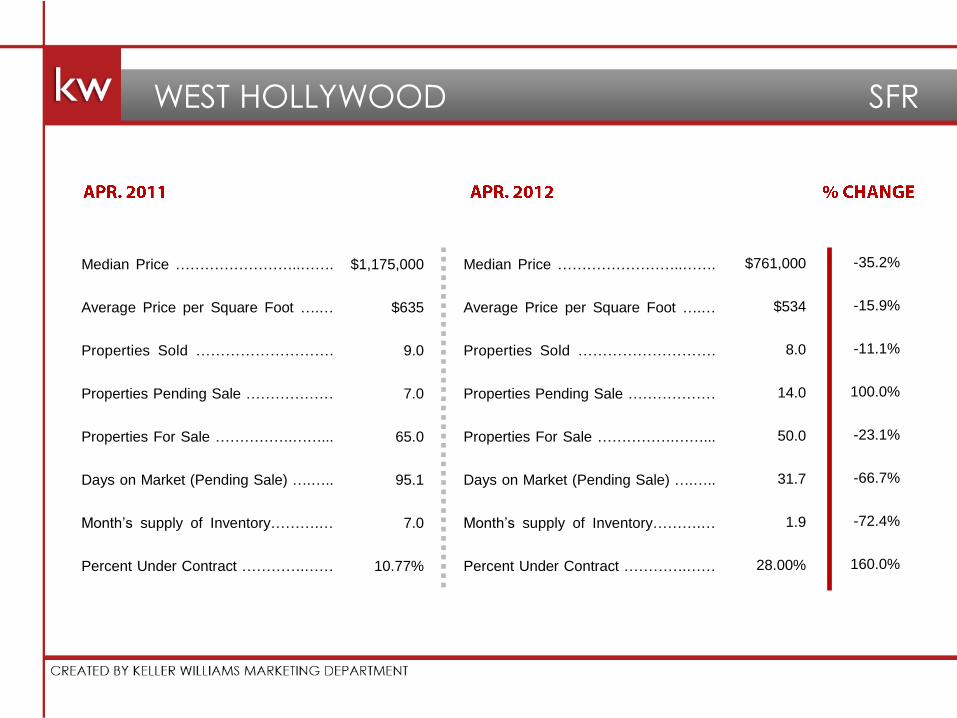
WEST HOLLYWOOD SFR
Median Price ……………………..…….
Average Price per Square Foot ….…
Properties Sold ……………………….
Properties Pending Sale ………………
Properties For Sale …………….……...
Days on Market (Pending Sale) ….…..
Month’s supply of Inventory……….…
Percent Under Contract ………….……
Median Price ……………………..…….
Average Price per Square Foot ….…
Properties Sold ……………………….
Properties Pending Sale ………………
Properties For Sale …………….……...
Days on Market (Pending Sale) ….…..
Month’s supply of Inventory……….…
Percent Under Contract ………….……

$537,500
$430
28.0
30.0
255.0
80.3
6.6
11.76%
$410,000
$392
21.0
40.0
156.0
73.5
2.2
25.64%
-23.7%
-8.8%
-25.0%
33.3%
-38.8%
-8.6%
-66.8%
117.9%
WEST HOLLYWOOD CONDO
Median Price ……………………..…….
Average Price per Square Foot ….…
Properties Sold ……………………….
Properties Pending Sale ………………
Properties For Sale …………….……...
Days on Market (Pending Sale) ….…..
Month’s supply of Inventory……….…
Percent Under Contract ………….……
Median Price ……………………..…….
Average Price per Square Foot ….…
Properties Sold ……………………….
Properties Pending Sale ………………
Properties For Sale …………….……...
Days on Market (Pending Sale) ….…..
Month’s supply of Inventory……….…
Percent Under Contract ………….……

$801,550
$389
2.0
8.0
44.0
41.8
4.2
18.18%
$500,000
$407
2.0
6.0
31.0
42.5
3.8
19.35%
-37.6%
4.6%
0.0%
-25.0%
-29.5%
1.8%
-9.8%
6.5%
WEST LOS ANGELES SFR
Median Price ……………………..…….
Average Price per Square Foot ….…
Properties Sold ……………………….
Properties Pending Sale ………………
Properties For Sale …………….……...
Days on Market (Pending Sale) ….…..
Month’s supply of Inventory……….…
Percent Under Contract ………….……
Median Price ……………………..…….
Average Price per Square Foot ….…
Properties Sold ……………………….
Properties Pending Sale ………………
Properties For Sale …………….……...
Days on Market (Pending Sale) ….…..
Month’s supply of Inventory……….…
Percent Under Contract ………….……

$699,000
$390
19.0
17.0
87.0
53.6
3.6
19.54%
$614,950
$427
14.0
13.0
49.0
26.9
2.3
26.53%
-12.0%
9.5%
-26.3%
-23.5%
-43.7%
-49.8%
-36.7%
35.8%
WESTCHESTER SFR
Median Price ……………………..…….
Average Price per Square Foot ….…
Properties Sold ……………………….
Properties Pending Sale ………………
Properties For Sale …………….……...
Days on Market (Pending Sale) ….…..
Month’s supply of Inventory……….…
Percent Under Contract ………….……
Median Price ……………………..…….
Average Price per Square Foot ….…
Properties Sold ……………………….
Properties Pending Sale ………………
Properties For Sale …………….……...
Days on Market (Pending Sale) ….…..
Month’s supply of Inventory……….…
Percent Under Contract ………….……
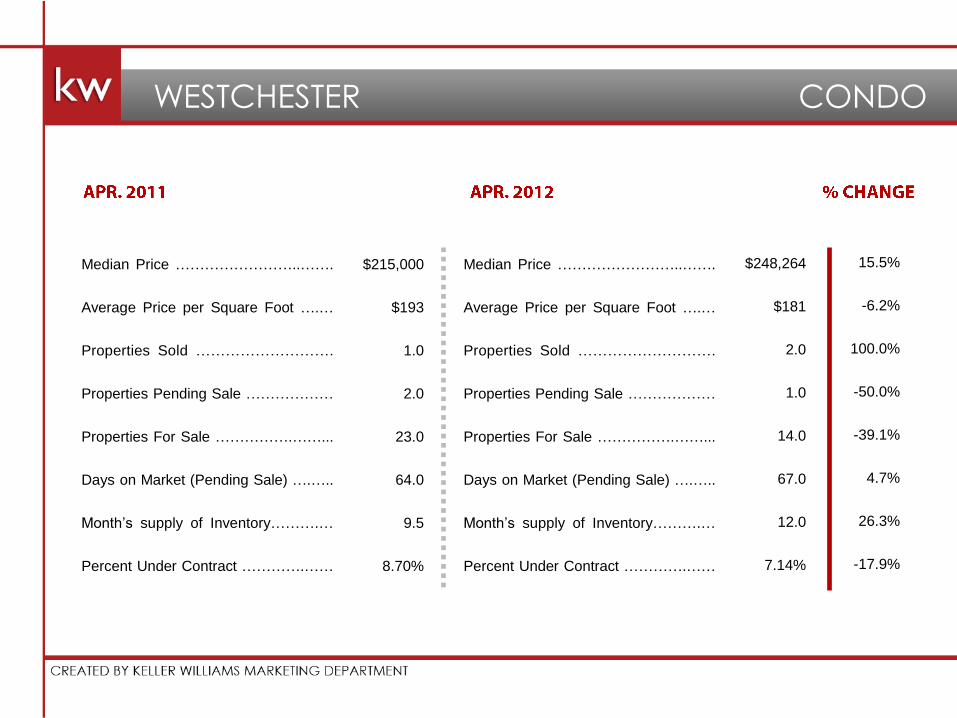
$215,000
$193
1.0
2.0
23.0
64.0
9.5
8.70%
$248,264
$181
2.0
1.0
14.0
67.0
12.0
7.14%
15.5%
-6.2%
100.0%
-50.0%
-39.1%
4.7%
26.3%
-17.9%
WESTCHESTER CONDO
Median Price ……………………..…….
Average Price per Square Foot ….…
Properties Sold ……………………….
Properties Pending Sale ………………
Properties For Sale …………….……...
Days on Market (Pending Sale) ….…..
Month’s supply of Inventory……….…
Percent Under Contract ………….……
Median Price ……………………..…….
Average Price per Square Foot ….…
Properties Sold ……………………….
Properties Pending Sale ………………
Properties For Sale …………….……...
Days on Market (Pending Sale) ….…..
Month’s supply of Inventory……….…
Percent Under Contract ………….……

$1,872,000
$580
3.0
10.0
89.0
9.3
7.0
11.24%
$1,245,000
$562
17.0
14.0
77.0
27.8
3.9
18.18%
-33.5%
-3.1%
466.7%
40.0%
-13.5%
198.8%
-44.9%
61.8%
WESTWOOD – CENTURY CITY SFR
Median Price ……………………..…….
Average Price per Square Foot ….…
Properties Sold ……………………….
Properties Pending Sale ………………
Properties For Sale …………….……...
Days on Market (Pending Sale) ….…..
Month’s supply of Inventory……….…
Percent Under Contract ………….……
Median Price ……………………..…….
Average Price per Square Foot ….…
Properties Sold ……………………….
Properties Pending Sale ………………
Properties For Sale …………….……...
Days on Market (Pending Sale) ….…..
Month’s supply of Inventory……….…
Percent Under Contract ………….……

$575,000
$426
39.0
35.0
406.0
60.7
9.5
8.62%
$578,000
$451
35.0
45.0
291.0
70.1
4.7
15.46%
0.5%
5.9%
-10.3%
28.6%
-28.3%
15.6%
-50.3%
79.4%
WESTWOOD – CENTURY CITY CONDO
Median Price ……………………..…….
Average Price per Square Foot ….…
Properties Sold ……………………….
Properties Pending Sale ………………
Properties For Sale …………….……...
Days on Market (Pending Sale) ….…..
Month’s supply of Inventory……….…
Percent Under Contract ………….……
Median Price ……………………..…….
Average Price per Square Foot ….…
Properties Sold ……………………….
Properties Pending Sale ………………
Properties For Sale …………….……...
Days on Market (Pending Sale) ….…..
Month’s supply of Inventory……….…
Percent Under Contract ………….……

Glossary of Terms
Median Price: A value that separates the upper
half of prices from the lower half of prices. It can
be interpreted like an average, however the
extreme prices (high and low) don’t hold
undue.
Average Price per Square Foot: The price per
each property divided by their respective
square footage then averaged across all
properties sold in the area for a given time
period.
Properties Sold: The number of property
transactions that closed and transferred
ownership.
Properties Pending Sale: The number of
properties that entered escrow in preparation
for sale.
Properties For Sale: The number of properties on
the market and seeking buyers.
Days on Market (Pending Sale): The number of
days that properties currently in escrow were on
the market.
Absorption Rate: The rate at which the inventory
of home for sale are being sold.
Percent Under Contract: The ratio of properties
to properties sale.
Disclaimer
The Market Within A Market Report is brought to you by Regional Marketing Director, Michael Lewis.
Information obtained from Broker Metrics and DataQuick. Broker Metrics and DataQuick statistics are subject to change due to individual real estate company reporting disciplines. The information provided herein is from sources we believe to be reliable. While we do not doubt its accuracy, we have not verified it and make no representations, guarantees or warranties about it.
For More Information, Contact:
Michael Lewis Regional Marketing Director Keller Williams Realty
11812 San Vicente Blvd. Suite 100 Los Angeles, CA 90049 [email protected]