Manitoba Immunization Monitoring System (MIMS)
63
COMMUNICABLE DISEASE CONTROL Manitoba Immunization Monitoring System (MIMS) Annual Report 2003 Manitoba Immunization Report Public Health Branch Manitoba Health
Transcript of Manitoba Immunization Monitoring System (MIMS)

C O M M U N I C A B L E D I S E A S E C O N T R O L
ManitobaImmunization
Monitoring System(MIMS)
Annual Report 2003
Manitoba Immunization Report
Public Health BranchManitoba Health

Contents1. Overview 1
2. Description of Criteria for MIMS Annual Reports 3
3. Acknowledgements 7
Childhood Vaccines:
4. Childhood Immunization Coverage Reports, 9January 1, 2003 – December 31, 2003:
4.1 Coverage by Antigen, by Patient Location 9
• Manitoba 9
• By RHA 10
4.2 Coverage by Patient Age 21
• By RHA 21
4.3 Coverage Based on Health Registration – Per cent Complete for Age 31
• Manitoba 31
• By RHA 31
5. Childhood Vaccine Doses Administered, by Provider Type, 35by Provider Location
• Manitoba 35
• By RHA 35
Influenza and Pneumococcal Vaccines:
6. Influenza/Pneumococcal Immunization Coverage Reports, 41January 1, 2003 – December 31, 2003
6.1 By Patient Location
• Manitoba 41
• By RHA 41
7. Influenza Vaccine Doses Administered, by Provider Type 45
• Manitoba 45
• By RHA 46
8. Pneumococcal Vaccine Doses Administered, by Provider Type 53
• Manitoba 53
• By RHA 54
Manitoba Immunization Monitoring System Annual Report 2003 i
Manitoba Immunization Monitoring System Annual Report 2003ii

1. OverviewData in this report are from the Manitoba Immunization Monitoring System (MIMS).These data reflect immunization service dates up to and including December 31, 2003 andentered into MIMS by April 16, 2004. Immunization records are derived from physicianbilling claims and from manual entry of public health provided immunizations.
In 2003, the Communicable Disease Control Unit, Manitoba Health completed an immu-nization report review, as recommended by the MIMS Steering Committee. This involvedconsultation with key stakeholders, including: Manitoba’s regional health authorities(RHAs), First Nations and Inuit Health Branch (FNIHB), the Manitoba Centre for HealthPolicy, Health Canada and others.
Based on this consultation, the following criteria were incorporated into the MIMS dataanalysis:
■ Immunization service dates are based on the calendar year January 1, 2003 – December31, 2003, rather than the fiscal year.
■ Coverage rates by age reflect a client’s status on his/her birthday.
■ Coverage reports reflect doses a client has received from birth until his/her selectedbirthday. For example, coverage at age two selects all children who turn two in the cal-endar year and assesses these children for recommended vaccines on their birthday.Doses administered to children after their selected birthday will not be reflected in thecoverage report.
■ Analysis of coverage by continuous versus non-continuously enrolled clients. A clientwho is considered “continuous” has been registered for Manitoba Health benefits sincebirth; non-continuously enrolled clients have moved to Manitoba from another juris-diction, or if born here have moved out of Manitoba and then back in again. Note:Immunization coverage reports produced by the Manitoba Centre for Health Policyinclude only continuously enrolled clients.
■ Complete coverage for select ages, i.e., the client has received all the recommendeddoses of each antigen recommended for his/her age.
■ Coverage rate by select antigen in order to assess clients who may have received vac-cines not available in Manitoba: of particular importance for clients who have movedinto Manitoba from another country; also important for tracking coverage rates whenthe combination vaccines available in Manitoba change.
■ Coverage rate by community area (for WRHA only) or by regional health district (allother RHAs). RHAs will receive these data sets for their region only.
■ FNIHB versus non-FNIHB population, with this indicator based on client self-identi-fication at the time of enrollment for Manitoba Health benefits (A-code). FNIHB esti-mates that this indicator represents approximately 65 per cent of the FNIHB popula-tion. Audits indicate that gaps exist between immunizations administered to FNIHBclients (as documented on paper records) versus those data entered into MIMS.Coverage rates for FNIHB clients are therefore, in general, likely higher than those gen-erated from MIMS data.
■ Separate dosage by provider type reports from coverage reports. These reports reflectthe volume of immunizations delivered by each provider type, based on provider RHA.Their usefulness relates to evaluating staffing or projecting workload by vaccine type.The 2003 report reflects vaccines administered from January 1, 2003 – December 31,2003 and entered into the system by April 16, 2004.
Additional details on the timing and criteria for data inclusion and exclusion are providedin “Description of Criteria for MIMS Annual Reports” (see page 3).
Manitoba Immunization Monitoring System Annual Report 2003 1

Manitoba Immunization Monitoring System Annual Report 20032

2. Description of Criteria for MIMS AnnualReports
MIMS Dataset Preparation (numerator)
■ The MIMS dataset used is a snapshot of the MIMS live database provided by ManitobaHealth’s Information Services Branch (ISB). For annual reports, the April snapshot fol-lowing the end of the calendar year is used. As the MIMS dataset is dynamic, each snap-shot includes all previously entered data up to the time the output dataset is created.
■ As of March 2004, the MIMS data is linked to the Manitoba Health Registry to accessthe municipality where the patient resides. This information is used with the MIMSpatient postal code to generate the patient RHA. This corresponds to the methodologyused to allocate geography in the denominator dataset.
■ The MIMS dataset is queried for those records with a service date prior to the end ofthe calendar year and where the service date is not ‘00000000’ (i.e., unknown).
■ The calendar year and report date are appended to the dataset.
■ The age of the patient is calculated as of his/her birthday within the calendar year.
■ The health coverage status (i.e., continuous versus non-continuous coverage) is derivedusing the coverage date and cancel date from the current Manitoba Health Registry.
■ First Nations status is based on self-declaration by the individual at time of registrationwith Manitoba Health.
Population Dataset (denominator)
■ The corporate Manitoba Health population dataset is used.
■ The age of the individual is as of his/her birthday within the calendar year.
■ The population used is based on the figure for June 1 within the calendar year.
■ The health coverage status (i.e., continuous versus non-continuous coverage) is derivedusing the coverage date and cancel date from the current Manitoba Health Registry.
■ After 1995/1996, the geographical location of the individual is derived within the cor-porate system by ISB. It follows the same methodology as for the MIMS dataset.
■ First Nations status is based on self-declaration by the individual at time of registrationwith Manitoba Health, following the same methodology as for the MIMS dataset.
NOTE: MIMS geography is determined as of April, following the report year; the popula-tion geography is determined as of June 1 during the report year. As a result, coverage ratesare occasionally greater than 100 per cent.
Manitoba Immunization Monitoring System Annual Report 2003 3

Creation of Reports
1. Report 4.1 and 4.2 – Childhood Antigen Reports
■ The MIMS subset is queried for the following criteria:
Age = > 1, 2, 7, 11, 17 (only where age equals these ages, ex: for one-year-olds, MIMSis queried on the birth date of all children who turn one year of age within the calen-dar year).
Antigens = > diphtheria, tetanus, pertussis, measles, mumps, rubella, polio, Hib,varicella, hep B, MCV, PCV (all tariffs associated with the antigens, currently andhistorically, are included).
■ Immunizations administered throughout the child’s lifetime up to, and includinghis/her birthday are kept for coverage reports.
■ The data is summarized by id (scrambled PHIN), age, patient location, and FirstNations status providing a count of services for each of the antigens for each indi-vidual. This allows an evaluation of complete versus incomplete immunizations, asrecommended by the provincial schedule, per age group.
■ This dataset is linked to the population data for the rate calculations. Rates are cal-culated as follows:
Rate/100 = # of individuals with complete immunization X 100
# of individuals in population of same age
Antigen-specific coverage calculations: A child must receive three doses of hepati-tis B-containing vaccine to be counted in the HBV coverage data at any age. Thisis for “information” purposes only, as there is no provincial recommendation forHBV until grade 4.
For measles coverage: a child must receive one dose of measles-containing vaccineby age two and two doses by age seven. As the requirement for mumps and rubel-la-containing vaccine is one dose in a lifetime, and MMR vaccine is the commonsource for two doses of measles antigen, mumps and rubella coverage rates arehigher than measles from age seven and up.
Hib doses are reflected in coverage for children at age one (three doses required),ages two and seven (four doses required). Hib is included for children at age 11and 17 (four doses) for “information” only, as there is no provincial recommenda-tion for Hib vaccine once children reach age 11. Hib is therefore not included in“complete for age” requirements for children after the age of seven (doses required= 0).
Varicella, meningococcal conjugate and pneumococcal conjugate vaccines cover-age rates reflect children receiving one or more doses, as in 2003 these vaccines werenot part of the recommended childhood schedule.
Manitoba Immunization Monitoring System Annual Report 20034
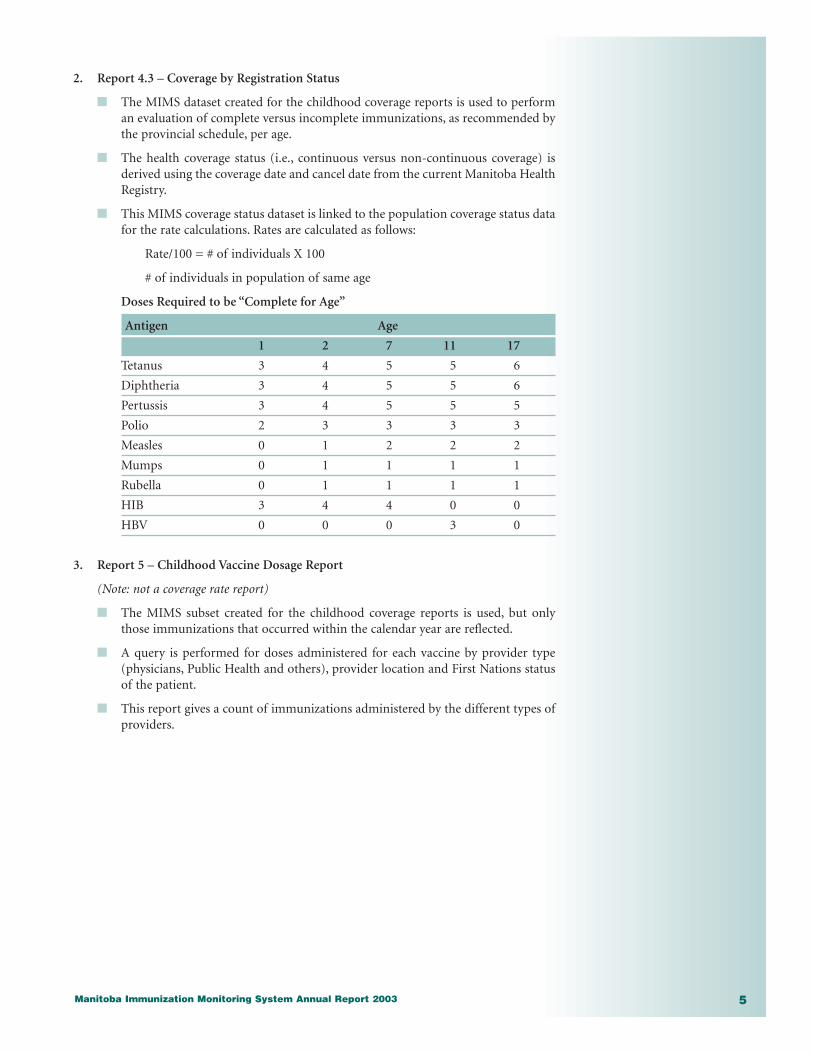
2. Report 4.3 – Coverage by Registration Status
■ The MIMS dataset created for the childhood coverage reports is used to performan evaluation of complete versus incomplete immunizations, as recommended bythe provincial schedule, per age.
■ The health coverage status (i.e., continuous versus non-continuous coverage) isderived using the coverage date and cancel date from the current Manitoba HealthRegistry.
■ This MIMS coverage status dataset is linked to the population coverage status datafor the rate calculations. Rates are calculated as follows:
Rate/100 = # of individuals X 100
# of individuals in population of same age
Doses Required to be “Complete for Age”
Antigen Age
1 2 7 11 17
Tetanus 3 4 5 5 6
Diphtheria 3 4 5 5 6
Pertussis 3 4 5 5 5
Polio 2 3 3 3 3
Measles 0 1 2 2 2
Mumps 0 1 1 1 1
Rubella 0 1 1 1 1
HIB 3 4 4 0 0
HBV 0 0 0 3 0
3. Report 5 – Childhood Vaccine Dosage Report
(Note: not a coverage rate report)
■ The MIMS subset created for the childhood coverage reports is used, but onlythose immunizations that occurred within the calendar year are reflected.
■ A query is performed for doses administered for each vaccine by provider type(physicians, Public Health and others), provider location and First Nations statusof the patient.
■ This report gives a count of immunizations administered by the different types ofproviders.
Manitoba Immunization Monitoring System Annual Report 2003 5

4. Report 6 – Influenza and Pneumococcal Immunization Coverage
■ The initial MIMS subset is queried for the following criteria:
tariff = Influenza – 8791, 8792, 8793, 8799
Pneumococcal – 8961
■ Age data is converted to age groups: under 65, under 65 high-risk, over 65. Wherea patient was under 65 and the reason variable is 2, the patient was classified ashigh risk.
■ For influenza, only those immunizations administered during the calendar yearare used for the report.
■ For pneumococcal, the data is analyzed twice. The first round includes those immu-nizations administered during the calendar year. The second round includes allpneumococcal immunizations recorded over time as a cumulative coverage rate.
■ A query is performed by id (scrambled PHIN), age group, patient RHA, and FirstNations status providing a count of services for each of the vaccines by id.
■ This dataset is linked to population data for the rate calculations. Rates are per 100individuals. The same age groups are applied to the population data with theunder 65 high-risk group defined as 11 per cent of the under 65 population.
5. Report 7 and 8 – Influenza and Pneumococcal Vaccine Doses Administered, byProvider Type
(Note: not a coverage rate report)
■ The MIMS subset created for the influenza/pneumococcal coverage reports isused.
■ A query is performed to obtain doses administered for each vaccine by providertype (physicians, Public Health, and others), reason for immunization, and FirstNations status of the patient.
6. List of Abbreviations
Pop Population
Diphth. Diphtheria
Tet. Tetanus
Pert. Pertussis
HIB Haemophilus influenzae type b
HBV Hepatitis B
V Varicella
M Meningococcal
P Pneumococcal conjugate
DaPTP Diphtheria, acellular pertussis, tetanus, polio
DaPTP/HIB Diphtheria, acellular pertussis, tetanus, polio and Haemophilus influenzae type b
MMR Measles, mumps, rubella
HEPA/B Hepatitis A and B
TdaP Tetanus, diphtheria, acellular pertussis
Manitoba Immunization Monitoring System Annual Report 20036
3. AcknowledgementsThe behind-the-scenes work required to produce this report was vast. A full three years wasspent working on “data in,” first with Public Health and then with physicians, to improvethe quality of, and confidence in “data out.” Many others contributed generously with theirtime during discussions of how best to format coverage reports to meet the needs of mul-tiple stakeholders.
Special thanks to:
Penny Klassen, Betty Miller, Dan Silaghi, Lauralea Klassen, Barbara Law, Jan Roberts, LindaPoffenroth, Randy Fransoo, Randy Walld, Michelle Long, Marilyn McIvor, Carole Beaudoin,Jason Edgerton, Kathy Mestery, Greg Hammond, and of course the dedicated MIMS dataentry staff and MIMS Steering Committee members.
We have come together to produce a comprehensive set of reports that we hope will provideassistance in evaluating immunization programs. Your continued input in this process iswelcome.
Tara Mawhinney, MIMS Steering Committee ChairProgram ConsultantCDC Unit, Manitoba Health
Manitoba Immunization Monitoring System Annual Report 2003 7

Manitoba Immunization Monitoring System Annual Report 20038
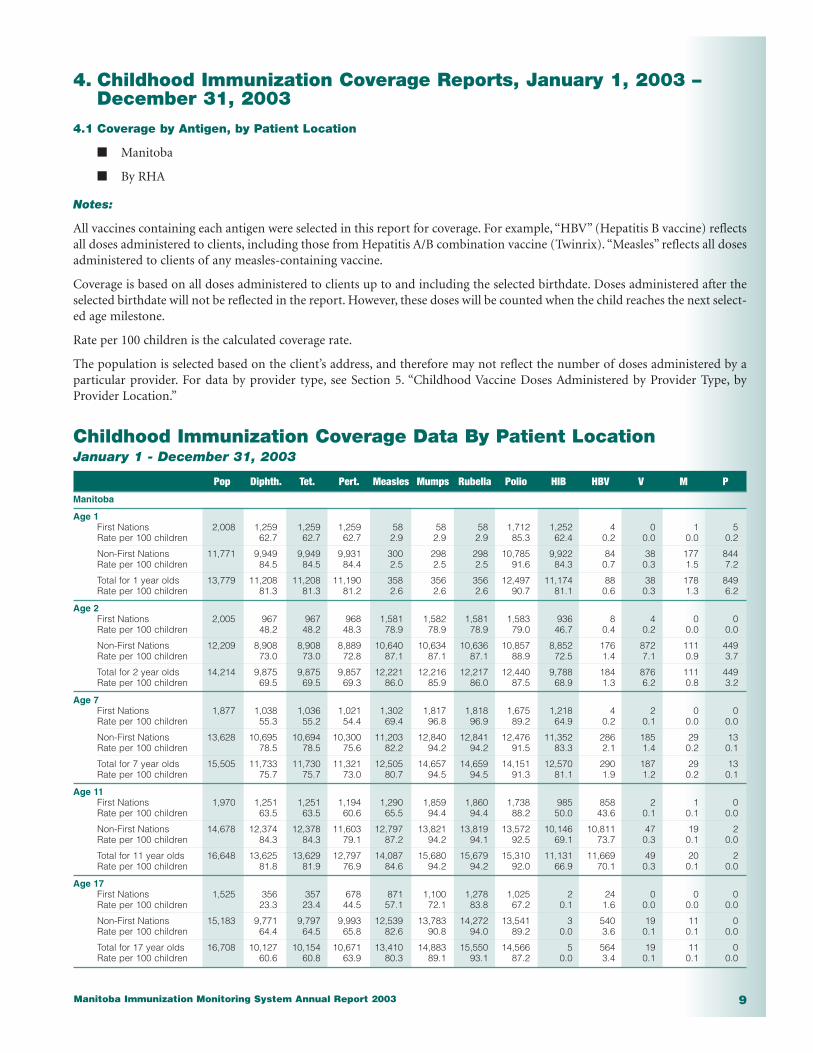
Manitoba Immunization Monitoring System Annual Report 2003 9
4. Childhood Immunization Coverage Reports, January 1, 2003 –December 31, 2003
4.1 Coverage by Antigen, by Patient Location
■ Manitoba
■ By RHA
Notes:
All vaccines containing each antigen were selected in this report for coverage. For example, “HBV” (Hepatitis B vaccine) reflectsall doses administered to clients, including those from Hepatitis A/B combination vaccine (Twinrix). “Measles” reflects all dosesadministered to clients of any measles-containing vaccine.
Coverage is based on all doses administered to clients up to and including the selected birthdate. Doses administered after theselected birthdate will not be reflected in the report. However, these doses will be counted when the child reaches the next select-ed age milestone.
Rate per 100 children is the calculated coverage rate.
The population is selected based on the client’s address, and therefore may not reflect the number of doses administered by aparticular provider. For data by provider type, see Section 5. “Childhood Vaccine Doses Administered by Provider Type, byProvider Location.”
Childhood Immunization Coverage Data By Patient LocationJanuary 1 - December 31, 2003
Pop Diphth. Tet. Pert. Measles Mumps Rubella Polio HIB HBV V M P
Manitoba
Age 1First Nations 2,008 1,259 1,259 1,259 58 58 58 1,712 1,252 4 0 1 5Rate per 100 children 62.7 62.7 62.7 2.9 2.9 2.9 85.3 62.4 0.2 0.0 0.0 0.2
Non-First Nations 11,771 9,949 9,949 9,931 300 298 298 10,785 9,922 84 38 177 844Rate per 100 children 84.5 84.5 84.4 2.5 2.5 2.5 91.6 84.3 0.7 0.3 1.5 7.2
Total for 1 year olds 13,779 11,208 11,208 11,190 358 356 356 12,497 11,174 88 38 178 849Rate per 100 children 81.3 81.3 81.2 2.6 2.6 2.6 90.7 81.1 0.6 0.3 1.3 6.2
Age 2First Nations 2,005 967 967 968 1,581 1,582 1,581 1,583 936 8 4 0 0Rate per 100 children 48.2 48.2 48.3 78.9 78.9 78.9 79.0 46.7 0.4 0.2 0.0 0.0
Non-First Nations 12,209 8,908 8,908 8,889 10,640 10,634 10,636 10,857 8,852 176 872 111 449Rate per 100 children 73.0 73.0 72.8 87.1 87.1 87.1 88.9 72.5 1.4 7.1 0.9 3.7
Total for 2 year olds 14,214 9,875 9,875 9,857 12,221 12,216 12,217 12,440 9,788 184 876 111 449Rate per 100 children 69.5 69.5 69.3 86.0 85.9 86.0 87.5 68.9 1.3 6.2 0.8 3.2
Age 7First Nations 1,877 1,038 1,036 1,021 1,302 1,817 1,818 1,675 1,218 4 2 0 0Rate per 100 children 55.3 55.2 54.4 69.4 96.8 96.9 89.2 64.9 0.2 0.1 0.0 0.0
Non-First Nations 13,628 10,695 10,694 10,300 11,203 12,840 12,841 12,476 11,352 286 185 29 13Rate per 100 children 78.5 78.5 75.6 82.2 94.2 94.2 91.5 83.3 2.1 1.4 0.2 0.1
Total for 7 year olds 15,505 11,733 11,730 11,321 12,505 14,657 14,659 14,151 12,570 290 187 29 13Rate per 100 children 75.7 75.7 73.0 80.7 94.5 94.5 91.3 81.1 1.9 1.2 0.2 0.1
Age 11First Nations 1,970 1,251 1,251 1,194 1,290 1,859 1,860 1,738 985 858 2 1 0Rate per 100 children 63.5 63.5 60.6 65.5 94.4 94.4 88.2 50.0 43.6 0.1 0.1 0.0
Non-First Nations 14,678 12,374 12,378 11,603 12,797 13,821 13,819 13,572 10,146 10,811 47 19 2Rate per 100 children 84.3 84.3 79.1 87.2 94.2 94.1 92.5 69.1 73.7 0.3 0.1 0.0
Total for 11 year olds 16,648 13,625 13,629 12,797 14,087 15,680 15,679 15,310 11,131 11,669 49 20 2Rate per 100 children 81.8 81.9 76.9 84.6 94.2 94.2 92.0 66.9 70.1 0.3 0.1 0.0
Age 17First Nations 1,525 356 357 678 871 1,100 1,278 1,025 2 24 0 0 0Rate per 100 children 23.3 23.4 44.5 57.1 72.1 83.8 67.2 0.1 1.6 0.0 0.0 0.0
Non-First Nations 15,183 9,771 9,797 9,993 12,539 13,783 14,272 13,541 3 540 19 11 0Rate per 100 children 64.4 64.5 65.8 82.6 90.8 94.0 89.2 0.0 3.6 0.1 0.1 0.0
Total for 17 year olds 16,708 10,127 10,154 10,671 13,410 14,883 15,550 14,566 5 564 19 11 0Rate per 100 children 60.6 60.8 63.9 80.3 89.1 93.1 87.2 0.0 3.4 0.1 0.1 0.0

Manitoba Immunization Monitoring System Annual Report 200310
Childhood Immunization Coverage Data By Patient LocationJanuary 1 - December 31, 2003
Pop Diphth. Tet. Pert. Measles Mumps Rubella Polio HIB HBV V M P
10 - Winnipeg
Age 1First Nations 461 300 300 300 10 10 10 385 300 3 0 1 4Rate per 100 children 65.1 65.1 65.1 2.2 2.2 2.2 83.5 65.1 0.7 0.0 0.2 0.9
Non-First Nations 6,683 5,663 5,663 5,646 169 168 167 6,127 5,643 51 27 147 680Rate per 100 children 84.7 84.7 84.5 2.5 2.5 2.5 91.7 84.4 0.8 0.4 2.2 10.2
Total for 1 year olds 7,144 5,963 5,963 5,946 179 178 177 6,512 5,943 54 27 148 684Rate per 100 children 83.5 83.5 83.2 2.5 2.5 2.5 91.2 83.2 0.8 0.4 2.1 9.6
Age 2First Nations 447 230 230 231 354 355 354 369 228 1 4 0 0Rate per 100 children 51.5 51.5 51.7 79.2 79.4 79.2 82.6 51.0 0.2 0.9 0.0 0.0
Non-First Nations 6,969 5,056 5,056 5,038 6,014 6,013 6,013 6,130 5,025 109 697 78 366Rate per 100 children 72.5 72.5 72.3 86.3 86.3 86.3 88.0 72.1 1.6 10.0 1.1 5.3
Total for 2 year olds 7,416 5,286 5,286 5,269 6,368 6,368 6,367 6,499 5,253 110 701 78 366Rate per 100 children 71.3 71.3 71.0 85.9 85.9 85.9 87.6 70.8 1.5 9.5 1.1 4.9
Age 7First Nations 402 231 231 225 256 385 386 367 299 4 0 0 0Rate per 100 children 57.5 57.5 56.0 63.7 95.8 96.0 91.3 74.4 1.0 0.0 0.0 0.0
Non-First Nations 7,735 5,850 5,848 5,564 6,097 7,227 7,227 6,958 6,336 161 147 15 10Rate per 100 children 75.6 75.6 71.9 78.8 93.4 93.4 90.0 81.9 2.1 1.9 0.2 0.1
Total for 7 year olds 8,137 6,081 6,079 5,789 6,353 7,612 7,613 7,325 6,635 165 147 15 10Rate per 100 children 74.7 74.7 71.1 78.1 93.5 93.6 90.0 81.5 2.0 1.8 0.2 0.1
Age 11First Nations 417 286 286 263 307 397 397 387 216 219 0 0 0Rate per 100 children 68.6 68.6 63.1 73.6 95.2 95.2 92.8 51.8 52.5 0.0 0.0 0.0
Non-First Nations 8,234 6,859 6,862 6,379 7,077 7,681 7,680 7,501 5,520 5,941 39 9 2Rate per 100 children 83.3 83.3 77.5 85.9 93.3 93.3 91.1 67.0 72.2 0.5 0.1 0.0
Total for 11 year olds 8,651 7,145 7,148 6,642 7,384 8,078 8,077 7,888 5,736 6,160 39 9 2Rate per 100 children 82.6 82.6 76.8 85.4 93.4 93.4 91.2 66.3 71.2 0.5 0.1 0.0
Age 17First Nations 307 62 62 121 177 232 276 196 0 8 0 0 0Rate per 100 children 20.2 20.2 39.4 57.7 75.6 89.9 63.8 0.0 2.6 0.0 0.0 0.0
Non-First Nations 8,227 4,777 4,792 4,921 6,534 7,205 7,583 7,050 2 357 16 5 0Rate per 100 children 58.1 58.2 59.8 79.4 87.6 92.2 85.7 0.0 4.3 0.2 0.1 0.0
Total for 17 year olds 8,534 4,839 4,854 5,042 6,711 7,437 7,859 7,246 2 365 16 5 0Rate per 100 children 56.7 56.9 59.1 78.6 87.1 92.1 84.9 0.0 4.3 0.2 0.1 0.0
Manitoba Immunization Monitoring System Annual Report 2003 11
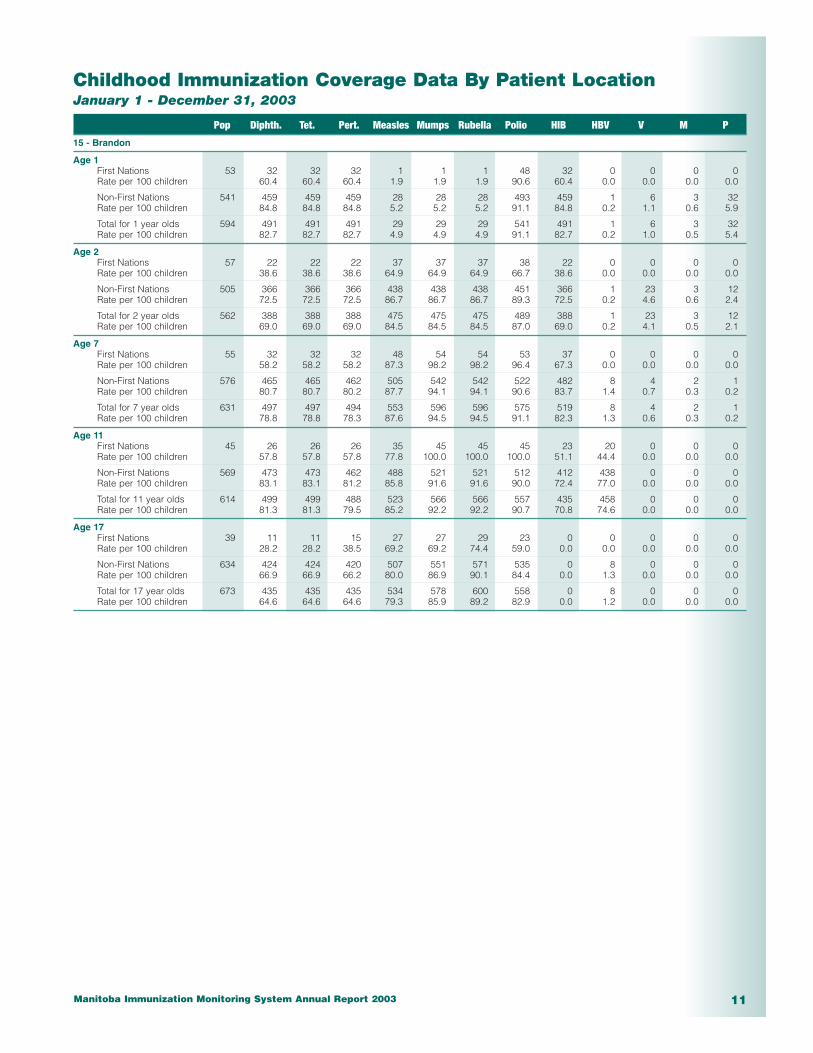
Childhood Immunization Coverage Data By Patient LocationJanuary 1 - December 31, 2003
Pop Diphth. Tet. Pert. Measles Mumps Rubella Polio HIB HBV V M P
15 - Brandon
Age 1First Nations 53 32 32 32 1 1 1 48 32 0 0 0 0Rate per 100 children 60.4 60.4 60.4 1.9 1.9 1.9 90.6 60.4 0.0 0.0 0.0 0.0
Non-First Nations 541 459 459 459 28 28 28 493 459 1 6 3 32Rate per 100 children 84.8 84.8 84.8 5.2 5.2 5.2 91.1 84.8 0.2 1.1 0.6 5.9
Total for 1 year olds 594 491 491 491 29 29 29 541 491 1 6 3 32Rate per 100 children 82.7 82.7 82.7 4.9 4.9 4.9 91.1 82.7 0.2 1.0 0.5 5.4
Age 2First Nations 57 22 22 22 37 37 37 38 22 0 0 0 0Rate per 100 children 38.6 38.6 38.6 64.9 64.9 64.9 66.7 38.6 0.0 0.0 0.0 0.0
Non-First Nations 505 366 366 366 438 438 438 451 366 1 23 3 12Rate per 100 children 72.5 72.5 72.5 86.7 86.7 86.7 89.3 72.5 0.2 4.6 0.6 2.4
Total for 2 year olds 562 388 388 388 475 475 475 489 388 1 23 3 12Rate per 100 children 69.0 69.0 69.0 84.5 84.5 84.5 87.0 69.0 0.2 4.1 0.5 2.1
Age 7First Nations 55 32 32 32 48 54 54 53 37 0 0 0 0Rate per 100 children 58.2 58.2 58.2 87.3 98.2 98.2 96.4 67.3 0.0 0.0 0.0 0.0
Non-First Nations 576 465 465 462 505 542 542 522 482 8 4 2 1Rate per 100 children 80.7 80.7 80.2 87.7 94.1 94.1 90.6 83.7 1.4 0.7 0.3 0.2
Total for 7 year olds 631 497 497 494 553 596 596 575 519 8 4 2 1Rate per 100 children 78.8 78.8 78.3 87.6 94.5 94.5 91.1 82.3 1.3 0.6 0.3 0.2
Age 11First Nations 45 26 26 26 35 45 45 45 23 20 0 0 0Rate per 100 children 57.8 57.8 57.8 77.8 100.0 100.0 100.0 51.1 44.4 0.0 0.0 0.0
Non-First Nations 569 473 473 462 488 521 521 512 412 438 0 0 0Rate per 100 children 83.1 83.1 81.2 85.8 91.6 91.6 90.0 72.4 77.0 0.0 0.0 0.0
Total for 11 year olds 614 499 499 488 523 566 566 557 435 458 0 0 0Rate per 100 children 81.3 81.3 79.5 85.2 92.2 92.2 90.7 70.8 74.6 0.0 0.0 0.0
Age 17First Nations 39 11 11 15 27 27 29 23 0 0 0 0 0Rate per 100 children 28.2 28.2 38.5 69.2 69.2 74.4 59.0 0.0 0.0 0.0 0.0 0.0
Non-First Nations 634 424 424 420 507 551 571 535 0 8 0 0 0Rate per 100 children 66.9 66.9 66.2 80.0 86.9 90.1 84.4 0.0 1.3 0.0 0.0 0.0
Total for 17 year olds 673 435 435 435 534 578 600 558 0 8 0 0 0Rate per 100 children 64.6 64.6 64.6 79.3 85.9 89.2 82.9 0.0 1.2 0.0 0.0 0.0
Manitoba Immunization Monitoring System Annual Report 200312
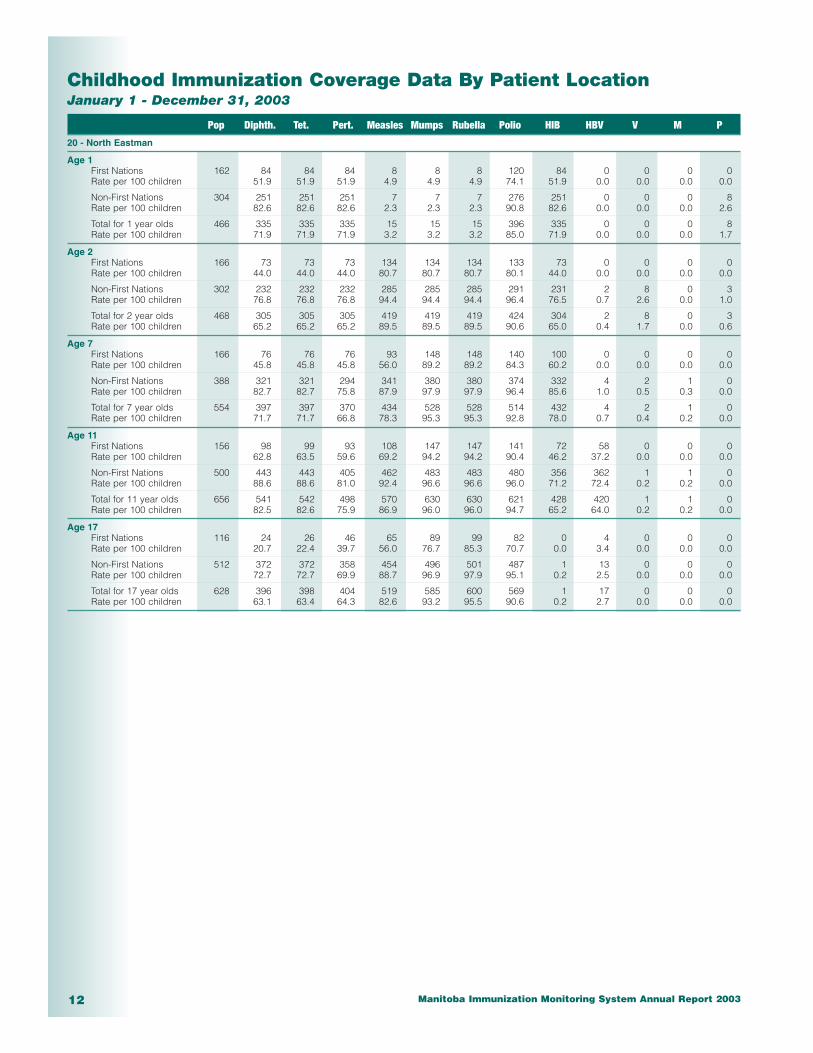
Childhood Immunization Coverage Data By Patient LocationJanuary 1 - December 31, 2003
Pop Diphth. Tet. Pert. Measles Mumps Rubella Polio HIB HBV V M P
20 - North Eastman
Age 1First Nations 162 84 84 84 8 8 8 120 84 0 0 0 0Rate per 100 children 51.9 51.9 51.9 4.9 4.9 4.9 74.1 51.9 0.0 0.0 0.0 0.0
Non-First Nations 304 251 251 251 7 7 7 276 251 0 0 0 8Rate per 100 children 82.6 82.6 82.6 2.3 2.3 2.3 90.8 82.6 0.0 0.0 0.0 2.6
Total for 1 year olds 466 335 335 335 15 15 15 396 335 0 0 0 8Rate per 100 children 71.9 71.9 71.9 3.2 3.2 3.2 85.0 71.9 0.0 0.0 0.0 1.7
Age 2First Nations 166 73 73 73 134 134 134 133 73 0 0 0 0Rate per 100 children 44.0 44.0 44.0 80.7 80.7 80.7 80.1 44.0 0.0 0.0 0.0 0.0
Non-First Nations 302 232 232 232 285 285 285 291 231 2 8 0 3Rate per 100 children 76.8 76.8 76.8 94.4 94.4 94.4 96.4 76.5 0.7 2.6 0.0 1.0
Total for 2 year olds 468 305 305 305 419 419 419 424 304 2 8 0 3Rate per 100 children 65.2 65.2 65.2 89.5 89.5 89.5 90.6 65.0 0.4 1.7 0.0 0.6
Age 7First Nations 166 76 76 76 93 148 148 140 100 0 0 0 0Rate per 100 children 45.8 45.8 45.8 56.0 89.2 89.2 84.3 60.2 0.0 0.0 0.0 0.0
Non-First Nations 388 321 321 294 341 380 380 374 332 4 2 1 0Rate per 100 children 82.7 82.7 75.8 87.9 97.9 97.9 96.4 85.6 1.0 0.5 0.3 0.0
Total for 7 year olds 554 397 397 370 434 528 528 514 432 4 2 1 0Rate per 100 children 71.7 71.7 66.8 78.3 95.3 95.3 92.8 78.0 0.7 0.4 0.2 0.0
Age 11First Nations 156 98 99 93 108 147 147 141 72 58 0 0 0Rate per 100 children 62.8 63.5 59.6 69.2 94.2 94.2 90.4 46.2 37.2 0.0 0.0 0.0
Non-First Nations 500 443 443 405 462 483 483 480 356 362 1 1 0Rate per 100 children 88.6 88.6 81.0 92.4 96.6 96.6 96.0 71.2 72.4 0.2 0.2 0.0
Total for 11 year olds 656 541 542 498 570 630 630 621 428 420 1 1 0Rate per 100 children 82.5 82.6 75.9 86.9 96.0 96.0 94.7 65.2 64.0 0.2 0.2 0.0
Age 17First Nations 116 24 26 46 65 89 99 82 0 4 0 0 0Rate per 100 children 20.7 22.4 39.7 56.0 76.7 85.3 70.7 0.0 3.4 0.0 0.0 0.0
Non-First Nations 512 372 372 358 454 496 501 487 1 13 0 0 0Rate per 100 children 72.7 72.7 69.9 88.7 96.9 97.9 95.1 0.2 2.5 0.0 0.0 0.0
Total for 17 year olds 628 396 398 404 519 585 600 569 1 17 0 0 0Rate per 100 children 63.1 63.4 64.3 82.6 93.2 95.5 90.6 0.2 2.7 0.0 0.0 0.0
Manitoba Immunization Monitoring System Annual Report 2003 13
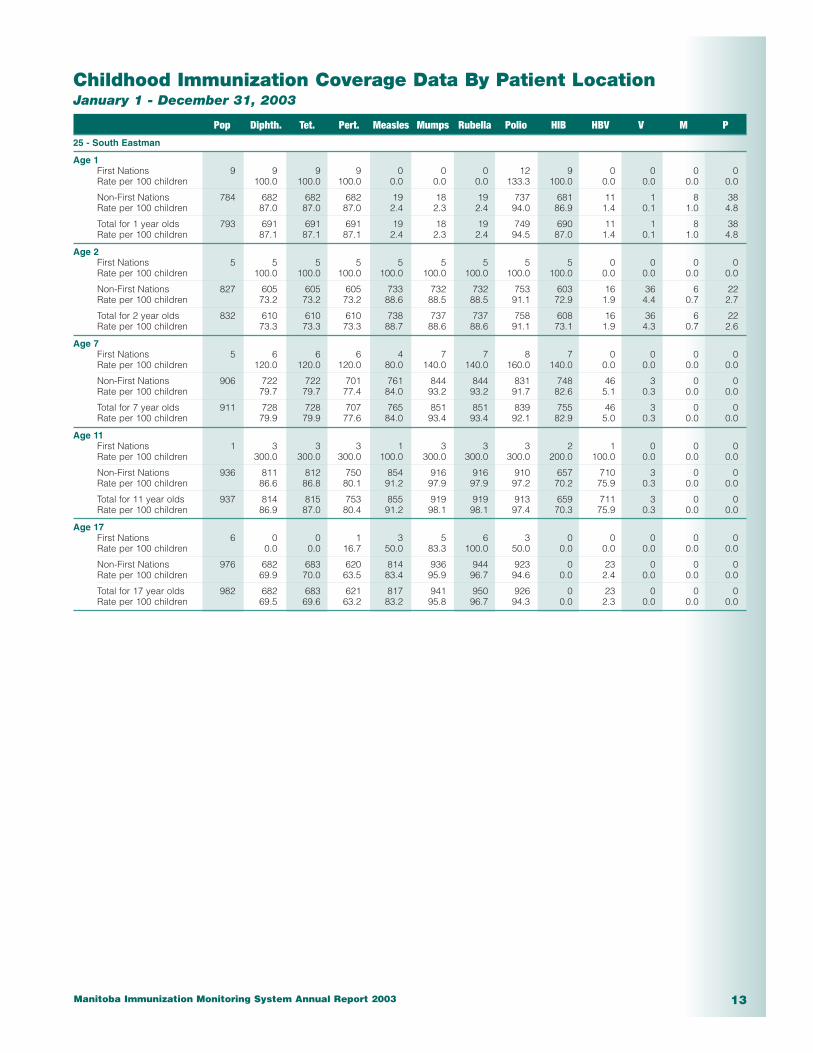
Childhood Immunization Coverage Data By Patient LocationJanuary 1 - December 31, 2003
Pop Diphth. Tet. Pert. Measles Mumps Rubella Polio HIB HBV V M P
25 - South Eastman
Age 1First Nations 9 9 9 9 0 0 0 12 9 0 0 0 0Rate per 100 children 100.0 100.0 100.0 0.0 0.0 0.0 133.3 100.0 0.0 0.0 0.0 0.0
Non-First Nations 784 682 682 682 19 18 19 737 681 11 1 8 38Rate per 100 children 87.0 87.0 87.0 2.4 2.3 2.4 94.0 86.9 1.4 0.1 1.0 4.8
Total for 1 year olds 793 691 691 691 19 18 19 749 690 11 1 8 38Rate per 100 children 87.1 87.1 87.1 2.4 2.3 2.4 94.5 87.0 1.4 0.1 1.0 4.8
Age 2First Nations 5 5 5 5 5 5 5 5 5 0 0 0 0Rate per 100 children 100.0 100.0 100.0 100.0 100.0 100.0 100.0 100.0 0.0 0.0 0.0 0.0
Non-First Nations 827 605 605 605 733 732 732 753 603 16 36 6 22Rate per 100 children 73.2 73.2 73.2 88.6 88.5 88.5 91.1 72.9 1.9 4.4 0.7 2.7
Total for 2 year olds 832 610 610 610 738 737 737 758 608 16 36 6 22Rate per 100 children 73.3 73.3 73.3 88.7 88.6 88.6 91.1 73.1 1.9 4.3 0.7 2.6
Age 7First Nations 5 6 6 6 4 7 7 8 7 0 0 0 0Rate per 100 children 120.0 120.0 120.0 80.0 140.0 140.0 160.0 140.0 0.0 0.0 0.0 0.0
Non-First Nations 906 722 722 701 761 844 844 831 748 46 3 0 0Rate per 100 children 79.7 79.7 77.4 84.0 93.2 93.2 91.7 82.6 5.1 0.3 0.0 0.0
Total for 7 year olds 911 728 728 707 765 851 851 839 755 46 3 0 0Rate per 100 children 79.9 79.9 77.6 84.0 93.4 93.4 92.1 82.9 5.0 0.3 0.0 0.0
Age 11First Nations 1 3 3 3 1 3 3 3 2 1 0 0 0Rate per 100 children 300.0 300.0 300.0 100.0 300.0 300.0 300.0 200.0 100.0 0.0 0.0 0.0
Non-First Nations 936 811 812 750 854 916 916 910 657 710 3 0 0Rate per 100 children 86.6 86.8 80.1 91.2 97.9 97.9 97.2 70.2 75.9 0.3 0.0 0.0
Total for 11 year olds 937 814 815 753 855 919 919 913 659 711 3 0 0Rate per 100 children 86.9 87.0 80.4 91.2 98.1 98.1 97.4 70.3 75.9 0.3 0.0 0.0
Age 17First Nations 6 0 0 1 3 5 6 3 0 0 0 0 0Rate per 100 children 0.0 0.0 16.7 50.0 83.3 100.0 50.0 0.0 0.0 0.0 0.0 0.0
Non-First Nations 976 682 683 620 814 936 944 923 0 23 0 0 0Rate per 100 children 69.9 70.0 63.5 83.4 95.9 96.7 94.6 0.0 2.4 0.0 0.0 0.0
Total for 17 year olds 982 682 683 621 817 941 950 926 0 23 0 0 0Rate per 100 children 69.5 69.6 63.2 83.2 95.8 96.7 94.3 0.0 2.3 0.0 0.0 0.0

Manitoba Immunization Monitoring System Annual Report 200314
Childhood Immunization Coverage Data By Patient LocationJanuary 1 - December 31, 2003
Pop Diphth. Tet. Pert. Measles Mumps Rubella Polio HIB HBV V M P
30 - Interlake
Age 1First Nations 140 93 93 93 4 4 4 120 93 0 0 0 1Rate per 100 children 66.4 66.4 66.4 2.9 2.9 2.9 85.7 66.4 0.0 0.0 0.0 0.7
Non-First Nations 645 552 552 551 14 14 14 619 549 2 1 8 28Rate per 100 children 85.6 85.6 85.4 2.2 2.2 2.2 96.0 85.1 0.3 0.2 1.2 4.3
Total for 1 year olds 785 645 645 644 18 18 18 739 642 2 1 8 29Rate per 100 children 82.2 82.2 82.0 2.3 2.3 2.3 94.1 81.8 0.3 0.1 1.0 3.7
Age 2First Nations 137 67 67 67 98 98 98 99 67 0 0 0 0Rate per 100 children 48.9 48.9 48.9 71.5 71.5 71.5 72.3 48.9 0.0 0.0 0.0 0.0
Non-First Nations 698 529 529 529 625 623 625 637 528 1 30 4 11Rate per 100 children 75.8 75.8 75.8 89.5 89.3 89.5 91.3 75.6 0.1 4.3 0.6 1.6
Total for 2 year olds 835 596 596 596 723 721 723 736 595 1 30 4 11Rate per 100 children 71.4 71.4 71.4 86.6 86.3 86.6 88.1 71.3 0.1 3.6 0.5 1.3
Age 7First Nations 146 77 77 75 83 124 124 116 91 0 0 0 0Rate per 100 children 52.7 52.7 51.4 56.8 84.9 84.9 79.5 62.3 0.0 0.0 0.0 0.0
Non-First Nations 858 709 709 675 719 825 825 805 750 4 6 2 0Rate per 100 children 82.6 82.6 78.7 83.8 96.2 96.2 93.8 87.4 0.5 0.7 0.2 0.0
Total for 7 year olds 1,004 786 786 750 802 949 949 921 841 4 6 2 0Rate per 100 children 78.3 78.3 74.7 79.9 94.5 94.5 91.7 83.8 0.4 0.6 0.2 0.0
Age 11First Nations 170 125 125 117 114 170 170 158 108 73 0 0 0Rate per 100 children 73.5 73.5 68.8 67.1 100.0 100.0 92.9 63.5 42.9 0.0 0.0 0.0
Non-First Nations 943 796 796 744 819 897 897 883 666 730 3 2 0Rate per 100 children 84.4 84.4 78.9 86.9 95.1 95.1 93.6 70.6 77.4 0.3 0.2 0.0
Total for 11 year olds 1,113 921 921 861 933 1,067 1,067 1,041 774 803 3 2 0Rate per 100 children 82.7 82.7 77.4 83.8 95.9 95.9 93.5 69.5 72.1 0.3 0.2 0.0
Age 17First Nations 119 24 24 57 83 100 114 90 0 0 0 0 0Rate per 100 children 20.2 20.2 47.9 69.7 84.0 95.8 75.6 0.0 0.0 0.0 0.0 0.0
Non-First Nations 1,051 774 775 722 930 1,003 1,036 988 0 27 0 0 0Rate per 100 children 73.6 73.7 68.7 88.5 95.4 98.6 94.0 0.0 2.6 0.0 0.0 0.0
Total for 17 year olds 1,170 798 799 779 1,013 1,103 1,150 1,078 0 27 0 0 0Rate per 100 children 68.2 68.3 66.6 86.6 94.3 98.3 92.1 0.0 2.3 0.0 0.0 0.0

Manitoba Immunization Monitoring System Annual Report 2003 15
Childhood Immunization Coverage Data By Patient LocationJanuary 1 - December 31, 2003
Pop Diphth. Tet. Pert. Measles Mumps Rubella Polio HIB HBV V M P
40 - Central
Age 1First Nations 135 83 83 83 1 1 1 110 83 0 0 0 0Rate per 100 children 61.5 61.5 61.5 0.7 0.7 0.7 81.5 61.5 0.0 0.0 0.0 0.0
Non-First Nations 1,265 1,004 1,004 1,004 17 17 17 1,081 1,002 13 0 4 19Rate per 100 children 79.4 79.4 79.4 1.3 1.3 1.3 85.5 79.2 1.0 0.0 0.3 1.5
Total for 1 year olds 1,400 1,087 1,087 1,087 18 18 18 1,191 1,085 13 0 4 19Rate per 100 children 77.6 77.6 77.6 1.3 1.3 1.3 85.1 77.5 0.9 0.0 0.3 1.4
Age 2First Nations 120 34 34 34 83 83 83 87 34 0 0 0 0Rate per 100 children 28.3 28.3 28.3 69.2 69.2 69.2 72.5 28.3 0.0 0.0 0.0 0.0
Non-First Nations 1,295 938 938 937 1,111 1,110 1,110 1,141 923 32 32 6 17Rate per 100 children 72.4 72.4 72.4 85.8 85.7 85.7 88.1 71.3 2.5 2.5 0.5 1.3
Total for 2 year olds 1,415 972 972 971 1,194 1,193 1,193 1,228 957 32 32 6 17Rate per 100 children 68.7 68.7 68.6 84.4 84.3 84.3 86.8 67.6 2.3 2.3 0.4 1.2
Age 7First Nations 134 50 49 47 90 134 134 111 57 0 1 0 0Rate per 100 children 37.3 36.6 35.1 67.2 100.0 100.0 82.8 42.5 0.0 0.7 0.0 0.0
Non-First Nations 1,330 1,100 1,100 1,081 1,155 1,271 1,271 1,259 1,133 38 15 0 0Rate per 100 children 82.7 82.7 81.3 86.8 95.6 95.6 94.7 85.2 2.9 1.1 0.0 0.0
Total for 7 year olds 1,464 1,150 1,149 1,128 1,245 1,405 1,405 1,370 1,190 38 16 0 0Rate per 100 children 78.6 78.5 77.0 85.0 96.0 96.0 93.6 81.3 2.6 1.1 0.0 0.0
Age 11First Nations 132 55 55 49 94 120 120 102 65 38 0 0 0Rate per 100 children 41.7 41.7 37.1 71.2 90.9 90.9 77.3 49.2 28.8 0.0 0.0 0.0
Non-First Nations 1,462 1,315 1,315 1,246 1,360 1,451 1,451 1,439 1,114 1,102 0 1 0Rate per 100 children 89.9 89.9 85.2 93.0 99.2 99.2 98.4 76.2 75.4 0.0 0.1 0.0
Total for 11 year olds 1,594 1,370 1,370 1,295 1,454 1,571 1,571 1,541 1,179 1,140 0 1 0Rate per 100 children 85.9 85.9 81.2 91.2 98.6 98.6 96.7 74.0 71.5 0.0 0.1 0.0
Age 17First Nations 111 26 26 36 49 69 75 68 0 0 0 0 0Rate per 100 children 23.4 23.4 32.4 44.1 62.2 67.6 61.3 0.0 0.0 0.0 0.0 0.0
Non-First Nations 1,554 1,163 1,166 1,236 1,380 1,502 1,505 1,491 0 59 2 1 0Rate per 100 children 74.8 75.0 79.5 88.8 96.7 96.8 95.9 0.0 3.8 0.1 0.1 0.0
Total for 17 year olds 1,665 1,189 1,192 1,272 1,429 1,571 1,580 1,559 0 59 2 1 0Rate per 100 children 71.4 71.6 76.4 85.8 94.4 94.9 93.6 0.0 3.5 0.1 0.1 0.0

Manitoba Immunization Monitoring System Annual Report 200316
Childhood Immunization Coverage Data By Patient LocationJanuary 1 - December 31, 2003
Pop Diphth. Tet. Pert. Measles Mumps Rubella Polio HIB HBV V M P
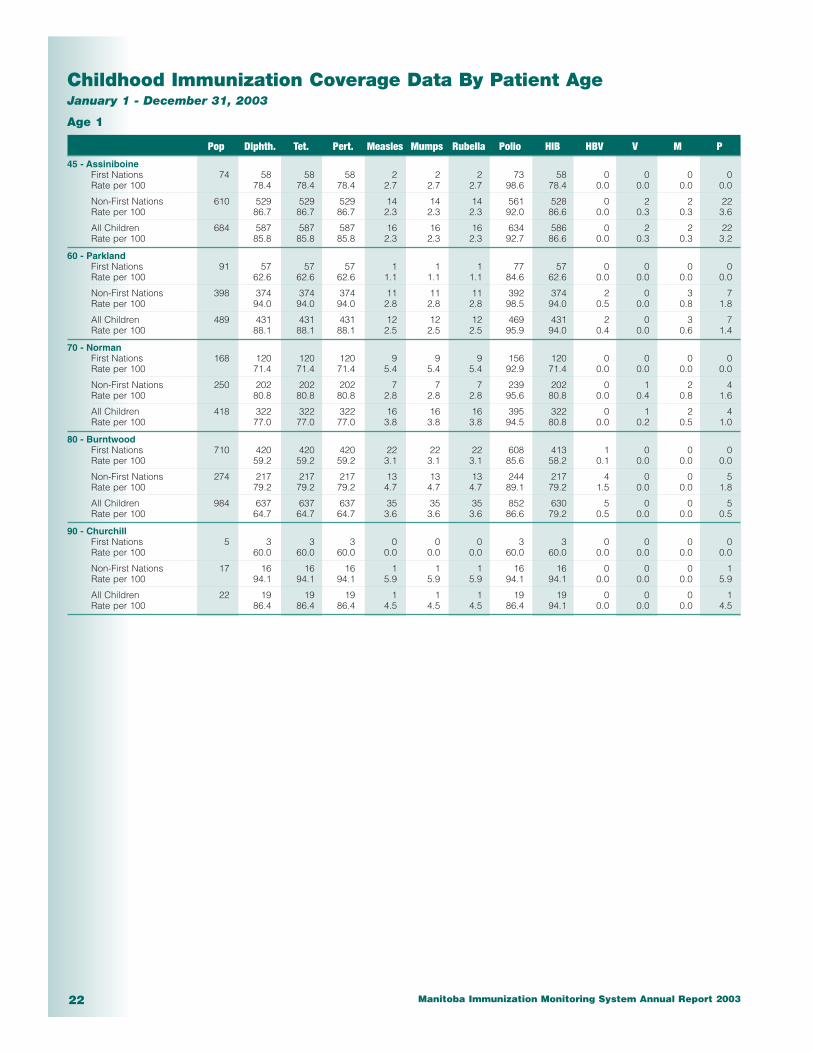
45 - Assiniboine
Age 1First Nations 74 58 58 58 2 2 2 73 58 0 0 0 0Rate per 100 children 78.4 78.4 78.4 2.7 2.7 2.7 98.6 78.4 0.0 0.0 0.0 0.0
Non-First Nations 610 529 529 529 14 14 14 561 528 0 2 2 22Rate per 100 children 86.7 86.7 86.7 2.3 2.3 2.3 92.0 86.6 0.0 0.3 0.3 3.6
Total for 1 year olds 684 587 587 587 16 16 16 634 586 0 2 2 22Rate per 100 children 85.8 85.8 85.8 2.3 2.3 2.3 92.7 85.7 0.0 0.3 0.3 3.2
Age 2First Nations 75 37 37 37 51 51 51 51 37 0 0 0 0Rate per 100 children 49.3 49.3 49.3 68.0 68.0 68.0 68.0 49.3 0.0 0.0 0.0 0.0
Non-First Nations 620 491 491 491 575 574 574 583 489 4 28 5 7Rate per 100 children 79.2 79.2 79.2 92.7 92.6 92.6 94.0 78.9 0.6 4.5 0.8 1.1
Total for 2 year olds 695 528 528 528 626 625 625 634 526 4 28 5 7Rate per 100 children 76.0 76.0 76.0 90.1 89.9 89.9 91.2 75.7 0.6 4.0 0.7 1.0
Age 7First Nations 75 39 39 38 34 72 72 66 51 0 1 0 0Rate per 100 children 52.0 52.0 50.7 45.3 96.0 96.0 88.0 68.0 0.0 1.3 0.0 0.0
Non-First Nations 763 646 646 645 676 715 716 703 654 6 4 6 1Rate per 100 children 84.7 84.7 84.5 88.6 93.7 93.8 92.1 85.7 0.8 0.5 0.8 0.1
Total for 7 year olds 838 685 685 683 710 787 788 769 705 6 5 6 1Rate per 100 children 81.7 81.7 81.5 84.7 93.9 94.0 91.8 84.1 0.7 0.6 0.7 0.1
Age 11First Nations 89 63 63 62 64 92 92 91 76 58 1 1 0Rate per 100 children 70.8 70.8 69.7 71.9 103.4 103.4 102.2 85.4 65.2 1.1 1.1 0.0
Non-First Nations 906 776 776 746 792 839 839 828 685 707 0 5 0Rate per 100 children 85.7 85.7 82.3 87.4 92.6 92.6 91.4 75.6 78.0 0.0 0.6 0.0
Total for 11 year olds 995 839 839 808 856 931 931 919 761 765 1 6 0Rate per 100 children 84.3 84.3 81.2 86.0 93.6 93.6 92.4 76.5 76.9 0.1 0.6 0.0
Age 17First Nations 71 12 12 28 42 49 57 43 0 1 0 0 0Rate per 100 children 16.9 16.9 39.4 59.2 69.0 80.3 60.6 0.0 1.4 0.0 0.0 0.0
Non-First Nations 1,027 756 761 812 878 975 989 967 0 21 1 3 0Rate per 100 children 73.6 74.1 79.1 85.5 94.9 96.3 94.2 0.0 2.0 0.1 0.3 0.0
Total for 17 year olds 1,098 768 773 840 920 1,024 1,046 1,010 0 22 1 3 0Rate per 100 children 69.9 70.4 76.5 83.8 93.3 95.3 92.0 0.0 2.0 0.1 0.3 0.0

Manitoba Immunization Monitoring System Annual Report 2003 17
Childhood Immunization Coverage Data By Patient LocationJanuary 1 - December 31, 2003
Pop Diphth. Tet. Pert. Measles Mumps Rubella Polio HIB HBV V M P
60 - Parkland
Age 1First Nations 91 57 57 57 1 1 1 77 57 0 0 0 0Rate per 100 children 62.6 62.6 62.6 1.1 1.1 1.1 84.6 62.6 0.0 0.0 0.0 0.0
Non-First Nations 398 374 374 374 11 11 11 392 374 2 0 3 7Rate per 100 children 94.0 94.0 94.0 2.8 2.8 2.8 98.5 94.0 0.5 0.0 0.8 1.8
Total for 1 year olds 489 431 431 431 12 12 12 469 431 2 0 3 7Rate per 100 children 88.1 88.1 88.1 2.5 2.5 2.5 95.9 88.1 0.4 0.0 0.6 1.4
Age 2First Nations 88 60 60 60 88 88 88 89 59 0 0 0 0Rate per 100 children 68.2 68.2 68.2 100.0 100.0 100.0 101.1 67.0 0.0 0.0 0.0 0.0
Non-First Nations 406 295 295 295 354 354 354 359 295 2 8 7 5Rate per 100 children 72.7 72.7 72.7 87.2 87.2 87.2 88.4 72.7 0.5 2.0 1.7 1.2
Total for 2 year olds 494 355 355 355 442 442 442 448 354 2 8 7 5Rate per 100 children 71.9 71.9 71.9 89.5 89.5 89.5 90.7 71.7 0.4 1.6 1.4 1.0
Age 7First Nations 88 72 71 71 79 87 87 86 74 0 0 0 0Rate per 100 children 81.8 80.7 80.7 89.8 98.9 98.9 97.7 84.1 0.0 0.0 0.0 0.0
Non-First Nations 468 389 389 386 423 443 443 437 399 12 3 2 0Rate per 100 children 83.1 83.1 82.5 90.4 94.7 94.7 93.4 85.3 2.6 0.6 0.4 0.0
Total for 7 year olds 556 461 460 457 502 530 530 523 473 12 3 2 0Rate per 100 children 82.9 82.7 82.2 90.3 95.3 95.3 94.1 85.1 2.2 0.5 0.4 0.0
Age 11First Nations 102 88 88 86 93 100 100 100 60 81 0 0 0Rate per 100 children 86.3 86.3 84.3 91.2 98.0 98.0 98.0 58.8 79.4 0.0 0.0 0.0
Non-First Nations 496 421 421 406 450 472 471 465 354 392 0 0 0Rate per 100 children 84.9 84.9 81.9 90.7 95.2 95.0 93.8 71.4 79.0 0.0 0.0 0.0
Total for 11 year olds 598 509 509 492 543 572 571 565 414 473 0 0 0Rate per 100 children 85.1 85.1 82.3 90.8 95.7 95.5 94.5 69.2 79.1 0.0 0.0 0.0
Age 17First Nations 72 31 30 57 61 69 69 67 0 1 0 0 0Rate per 100 children 43.1 41.7 79.2 84.7 95.8 95.8 93.1 0.0 1.4 0.0 0.0 0.0
Non-First Nations 579 441 442 485 508 545 551 541 0 12 0 2 0Rate per 100 children 76.2 76.3 83.8 87.7 94.1 95.2 93.4 0.0 2.1 0.0 0.3 0.0
Total for 17 year olds 651 472 472 542 569 614 620 608 0 13 0 2 0Rate per 100 children 72.5 72.5 83.3 87.4 94.3 95.2 93.4 0.0 2.0 0.0 0.3 0.0
Manitoba Immunization Monitoring System Annual Report 200318
Childhood Immunization Coverage Data By Patient LocationJanuary 1 - December 31, 2003
Pop Diphth. Tet. Pert. Measles Mumps Rubella Polio HIB HBV V M P
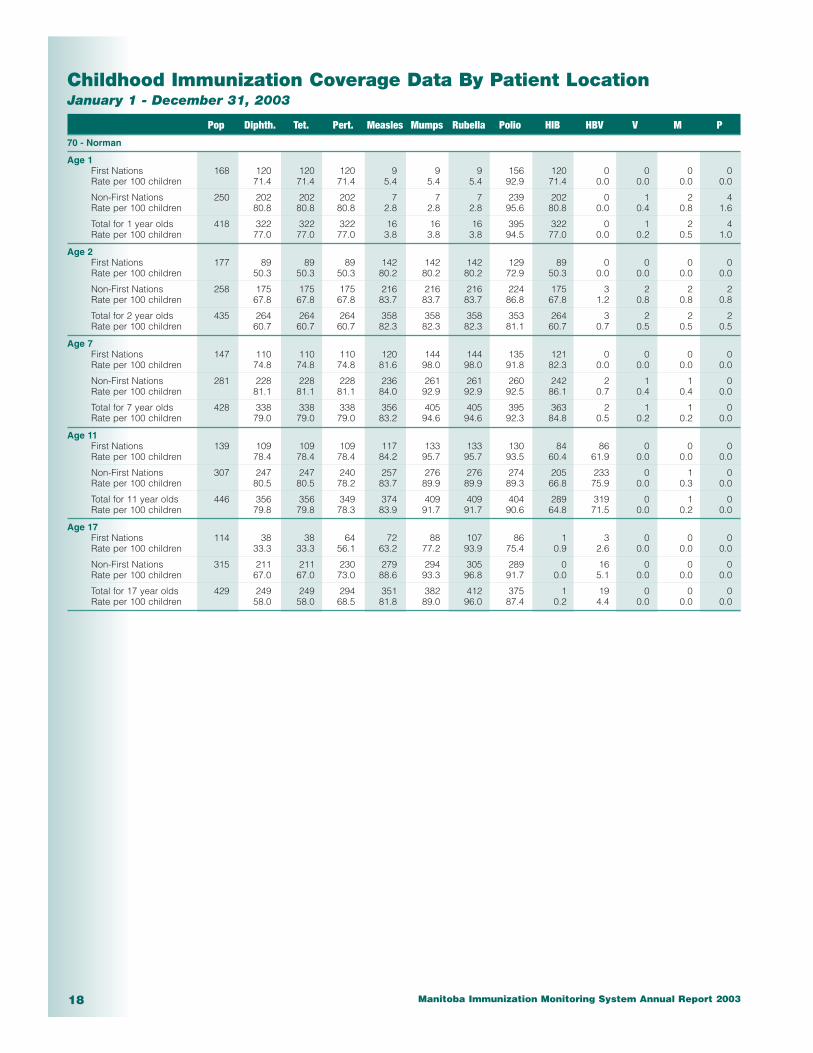
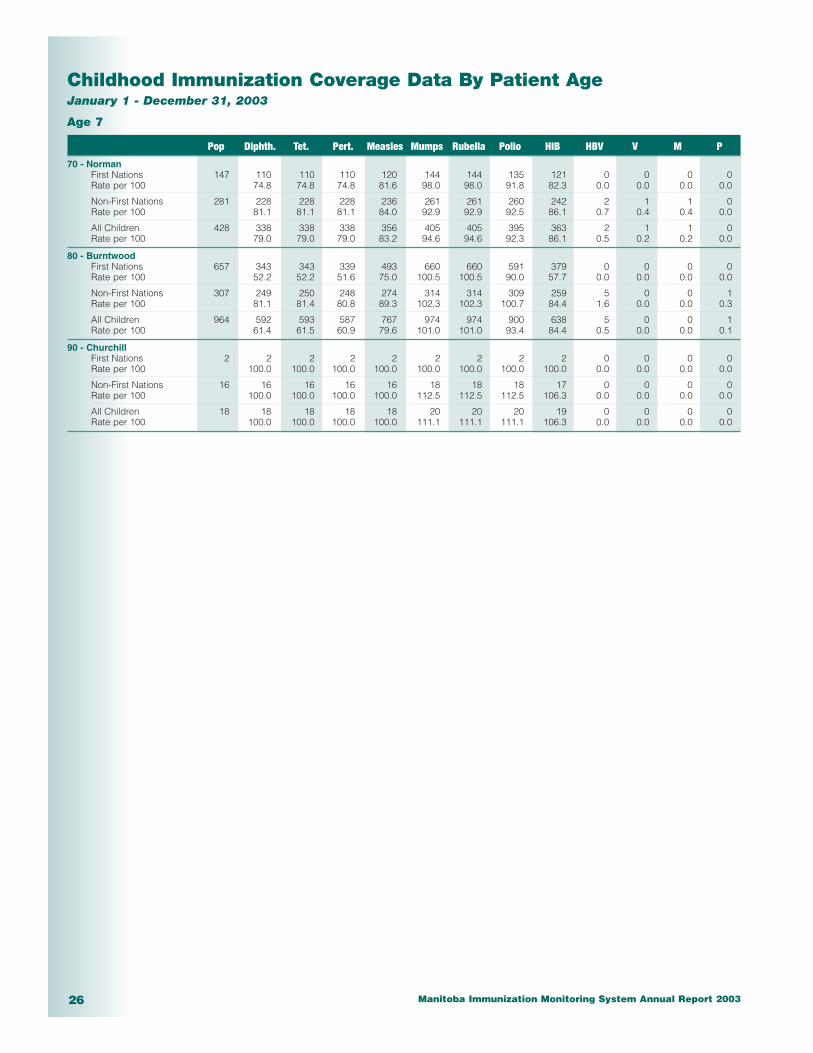
70 - Norman
Age 1First Nations 168 120 120 120 9 9 9 156 120 0 0 0 0Rate per 100 children 71.4 71.4 71.4 5.4 5.4 5.4 92.9 71.4 0.0 0.0 0.0 0.0
Non-First Nations 250 202 202 202 7 7 7 239 202 0 1 2 4Rate per 100 children 80.8 80.8 80.8 2.8 2.8 2.8 95.6 80.8 0.0 0.4 0.8 1.6
Total for 1 year olds 418 322 322 322 16 16 16 395 322 0 1 2 4Rate per 100 children 77.0 77.0 77.0 3.8 3.8 3.8 94.5 77.0 0.0 0.2 0.5 1.0
Age 2First Nations 177 89 89 89 142 142 142 129 89 0 0 0 0Rate per 100 children 50.3 50.3 50.3 80.2 80.2 80.2 72.9 50.3 0.0 0.0 0.0 0.0
Non-First Nations 258 175 175 175 216 216 216 224 175 3 2 2 2Rate per 100 children 67.8 67.8 67.8 83.7 83.7 83.7 86.8 67.8 1.2 0.8 0.8 0.8
Total for 2 year olds 435 264 264 264 358 358 358 353 264 3 2 2 2Rate per 100 children 60.7 60.7 60.7 82.3 82.3 82.3 81.1 60.7 0.7 0.5 0.5 0.5
Age 7First Nations 147 110 110 110 120 144 144 135 121 0 0 0 0Rate per 100 children 74.8 74.8 74.8 81.6 98.0 98.0 91.8 82.3 0.0 0.0 0.0 0.0
Non-First Nations 281 228 228 228 236 261 261 260 242 2 1 1 0Rate per 100 children 81.1 81.1 81.1 84.0 92.9 92.9 92.5 86.1 0.7 0.4 0.4 0.0
Total for 7 year olds 428 338 338 338 356 405 405 395 363 2 1 1 0Rate per 100 children 79.0 79.0 79.0 83.2 94.6 94.6 92.3 84.8 0.5 0.2 0.2 0.0
Age 11First Nations 139 109 109 109 117 133 133 130 84 86 0 0 0Rate per 100 children 78.4 78.4 78.4 84.2 95.7 95.7 93.5 60.4 61.9 0.0 0.0 0.0
Non-First Nations 307 247 247 240 257 276 276 274 205 233 0 1 0Rate per 100 children 80.5 80.5 78.2 83.7 89.9 89.9 89.3 66.8 75.9 0.0 0.3 0.0
Total for 11 year olds 446 356 356 349 374 409 409 404 289 319 0 1 0Rate per 100 children 79.8 79.8 78.3 83.9 91.7 91.7 90.6 64.8 71.5 0.0 0.2 0.0
Age 17First Nations 114 38 38 64 72 88 107 86 1 3 0 0 0Rate per 100 children 33.3 33.3 56.1 63.2 77.2 93.9 75.4 0.9 2.6 0.0 0.0 0.0
Non-First Nations 315 211 211 230 279 294 305 289 0 16 0 0 0Rate per 100 children 67.0 67.0 73.0 88.6 93.3 96.8 91.7 0.0 5.1 0.0 0.0 0.0
Total for 17 year olds 429 249 249 294 351 382 412 375 1 19 0 0 0Rate per 100 children 58.0 58.0 68.5 81.8 89.0 96.0 87.4 0.2 4.4 0.0 0.0 0.0
Manitoba Immunization Monitoring System Annual Report 2003 19
Childhood Immunization Coverage Data By Patient LocationJanuary 1 - December 31, 2003
Pop Diphth. Tet. Pert. Measles Mumps Rubella Polio HIB HBV V M P
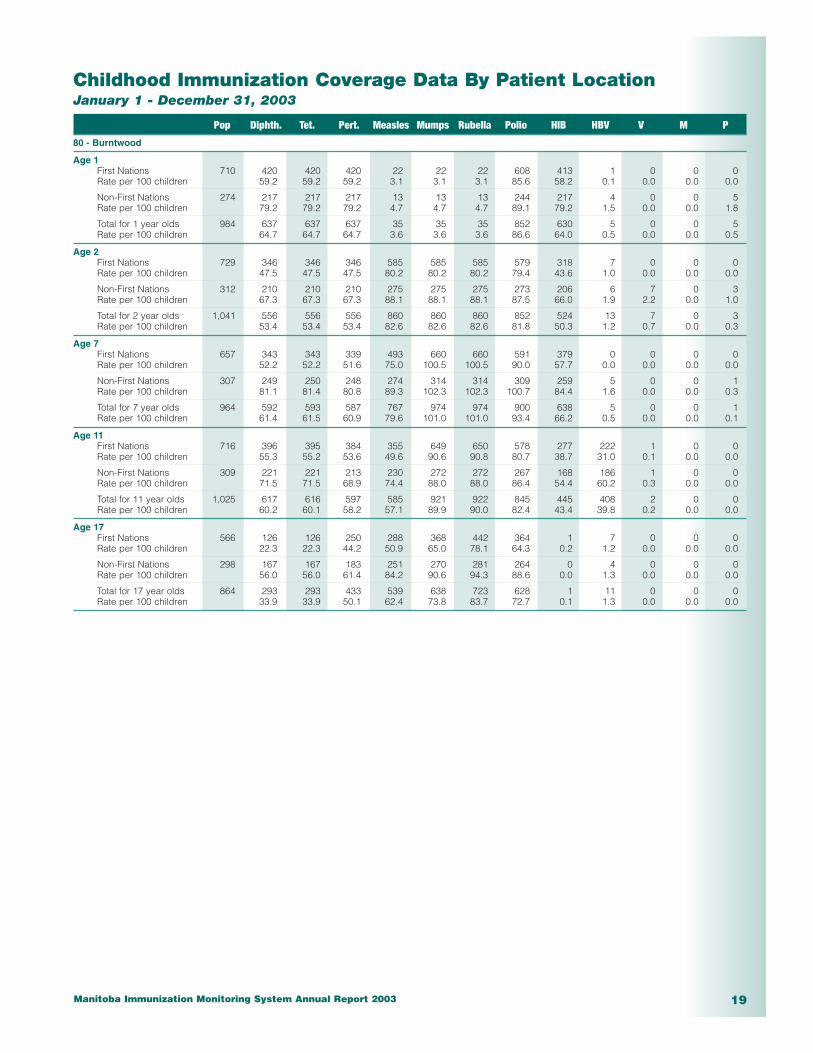
80 - Burntwood
Age 1First Nations 710 420 420 420 22 22 22 608 413 1 0 0 0Rate per 100 children 59.2 59.2 59.2 3.1 3.1 3.1 85.6 58.2 0.1 0.0 0.0 0.0
Non-First Nations 274 217 217 217 13 13 13 244 217 4 0 0 5Rate per 100 children 79.2 79.2 79.2 4.7 4.7 4.7 89.1 79.2 1.5 0.0 0.0 1.8
Total for 1 year olds 984 637 637 637 35 35 35 852 630 5 0 0 5Rate per 100 children 64.7 64.7 64.7 3.6 3.6 3.6 86.6 64.0 0.5 0.0 0.0 0.5
Age 2First Nations 729 346 346 346 585 585 585 579 318 7 0 0 0Rate per 100 children 47.5 47.5 47.5 80.2 80.2 80.2 79.4 43.6 1.0 0.0 0.0 0.0
Non-First Nations 312 210 210 210 275 275 275 273 206 6 7 0 3Rate per 100 children 67.3 67.3 67.3 88.1 88.1 88.1 87.5 66.0 1.9 2.2 0.0 1.0
Total for 2 year olds 1,041 556 556 556 860 860 860 852 524 13 7 0 3Rate per 100 children 53.4 53.4 53.4 82.6 82.6 82.6 81.8 50.3 1.2 0.7 0.0 0.3
Age 7First Nations 657 343 343 339 493 660 660 591 379 0 0 0 0Rate per 100 children 52.2 52.2 51.6 75.0 100.5 100.5 90.0 57.7 0.0 0.0 0.0 0.0
Non-First Nations 307 249 250 248 274 314 314 309 259 5 0 0 1Rate per 100 children 81.1 81.4 80.8 89.3 102.3 102.3 100.7 84.4 1.6 0.0 0.0 0.3
Total for 7 year olds 964 592 593 587 767 974 974 900 638 5 0 0 1Rate per 100 children 61.4 61.5 60.9 79.6 101.0 101.0 93.4 66.2 0.5 0.0 0.0 0.1
Age 11First Nations 716 396 395 384 355 649 650 578 277 222 1 0 0Rate per 100 children 55.3 55.2 53.6 49.6 90.6 90.8 80.7 38.7 31.0 0.1 0.0 0.0
Non-First Nations 309 221 221 213 230 272 272 267 168 186 1 0 0Rate per 100 children 71.5 71.5 68.9 74.4 88.0 88.0 86.4 54.4 60.2 0.3 0.0 0.0
Total for 11 year olds 1,025 617 616 597 585 921 922 845 445 408 2 0 0Rate per 100 children 60.2 60.1 58.2 57.1 89.9 90.0 82.4 43.4 39.8 0.2 0.0 0.0
Age 17First Nations 566 126 126 250 288 368 442 364 1 7 0 0 0Rate per 100 children 22.3 22.3 44.2 50.9 65.0 78.1 64.3 0.2 1.2 0.0 0.0 0.0
Non-First Nations 298 167 167 183 251 270 281 264 0 4 0 0 0Rate per 100 children 56.0 56.0 61.4 84.2 90.6 94.3 88.6 0.0 1.3 0.0 0.0 0.0
Total for 17 year olds 864 293 293 433 539 638 723 628 1 11 0 0 0Rate per 100 children 33.9 33.9 50.1 62.4 73.8 83.7 72.7 0.1 1.3 0.0 0.0 0.0
Manitoba Immunization Monitoring System Annual Report 200320
Childhood Immunization Coverage Data By Patient LocationJanuary 1 - December 31, 2003
Pop Diphth. Tet. Pert. Measles Mumps Rubella Polio HIB HBV V M P
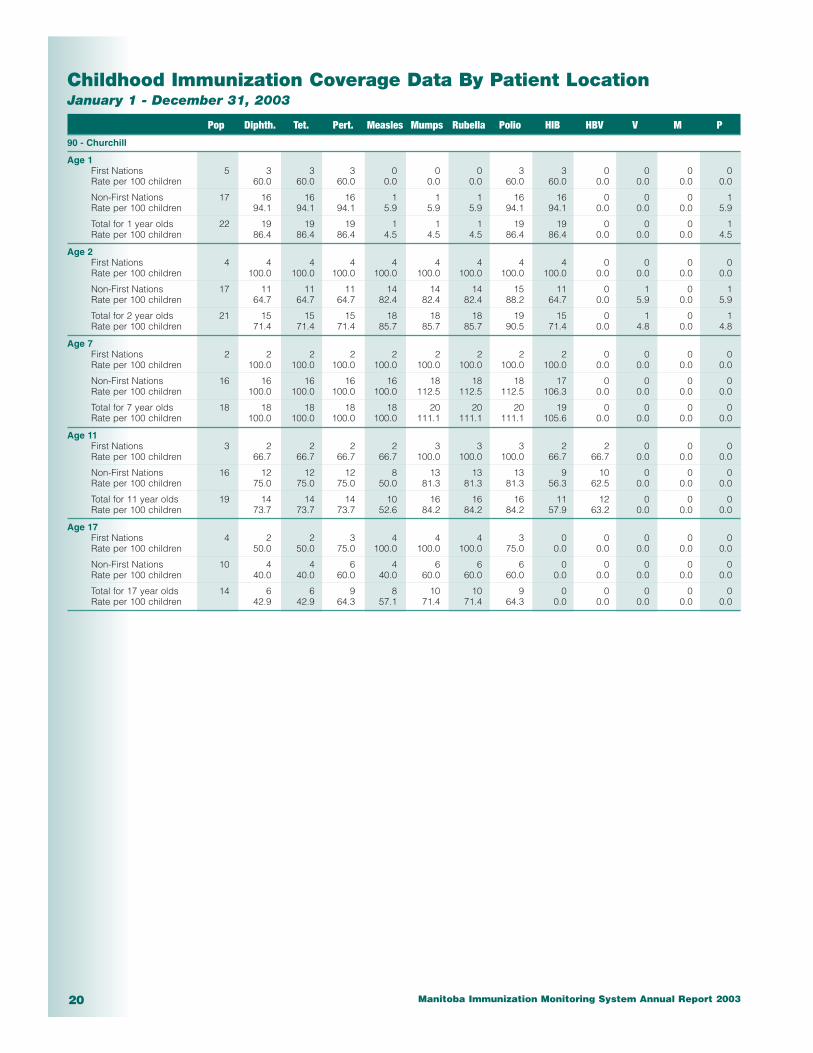
90 - Churchill
Age 1First Nations 5 3 3 3 0 0 0 3 3 0 0 0 0Rate per 100 children 60.0 60.0 60.0 0.0 0.0 0.0 60.0 60.0 0.0 0.0 0.0 0.0
Non-First Nations 17 16 16 16 1 1 1 16 16 0 0 0 1Rate per 100 children 94.1 94.1 94.1 5.9 5.9 5.9 94.1 94.1 0.0 0.0 0.0 5.9
Total for 1 year olds 22 19 19 19 1 1 1 19 19 0 0 0 1Rate per 100 children 86.4 86.4 86.4 4.5 4.5 4.5 86.4 86.4 0.0 0.0 0.0 4.5
Age 2First Nations 4 4 4 4 4 4 4 4 4 0 0 0 0Rate per 100 children 100.0 100.0 100.0 100.0 100.0 100.0 100.0 100.0 0.0 0.0 0.0 0.0
Non-First Nations 17 11 11 11 14 14 14 15 11 0 1 0 1Rate per 100 children 64.7 64.7 64.7 82.4 82.4 82.4 88.2 64.7 0.0 5.9 0.0 5.9
Total for 2 year olds 21 15 15 15 18 18 18 19 15 0 1 0 1Rate per 100 children 71.4 71.4 71.4 85.7 85.7 85.7 90.5 71.4 0.0 4.8 0.0 4.8
Age 7First Nations 2 2 2 2 2 2 2 2 2 0 0 0 0Rate per 100 children 100.0 100.0 100.0 100.0 100.0 100.0 100.0 100.0 0.0 0.0 0.0 0.0
Non-First Nations 16 16 16 16 16 18 18 18 17 0 0 0 0Rate per 100 children 100.0 100.0 100.0 100.0 112.5 112.5 112.5 106.3 0.0 0.0 0.0 0.0
Total for 7 year olds 18 18 18 18 18 20 20 20 19 0 0 0 0Rate per 100 children 100.0 100.0 100.0 100.0 111.1 111.1 111.1 105.6 0.0 0.0 0.0 0.0
Age 11First Nations 3 2 2 2 2 3 3 3 2 2 0 0 0Rate per 100 children 66.7 66.7 66.7 66.7 100.0 100.0 100.0 66.7 66.7 0.0 0.0 0.0
Non-First Nations 16 12 12 12 8 13 13 13 9 10 0 0 0Rate per 100 children 75.0 75.0 75.0 50.0 81.3 81.3 81.3 56.3 62.5 0.0 0.0 0.0
Total for 11 year olds 19 14 14 14 10 16 16 16 11 12 0 0 0Rate per 100 children 73.7 73.7 73.7 52.6 84.2 84.2 84.2 57.9 63.2 0.0 0.0 0.0
Age 17First Nations 4 2 2 3 4 4 4 3 0 0 0 0 0Rate per 100 children 50.0 50.0 75.0 100.0 100.0 100.0 75.0 0.0 0.0 0.0 0.0 0.0
Non-First Nations 10 4 4 6 4 6 6 6 0 0 0 0 0Rate per 100 children 40.0 40.0 60.0 40.0 60.0 60.0 60.0 0.0 0.0 0.0 0.0 0.0
Total for 17 year olds 14 6 6 9 8 10 10 9 0 0 0 0 0Rate per 100 children 42.9 42.9 64.3 57.1 71.4 71.4 64.3 0.0 0.0 0.0 0.0 0.0

Manitoba Immunization Monitoring System Annual Report 2003 21
4. Childhood Immunization Coverage Reports, January 1, 2003 –December 31, 2003
4.2 Coverage by Patient Age
■ By RHA
Notes:
These reports are the same data as in section 4.1, with summary data, by age, provided for each RHA.
Childhood Immunization Coverage Data By Patient AgeJanuary 1 - December 31, 2003
Age 1
Pop Diphth. Tet. Pert. Measles Mumps Rubella Polio HIB HBV V M P
MANITOBAFirst Nations 2,008 1,259 1,259 1,259 58 58 58 1,712 1,252 4 0 1 5Rate per 100 62.7 62.7 62.7 2.9 2.9 2.9 85.3 62.4 0.2 0.0 0.0 0.2
Non-First Nations 11,771 9,949 9,949 9,931 300 298 298 10,785 9,922 84 38 177 844Rate per 100 84.5 84.5 84.4 2.5 2.5 2.5 91.6 84.3 0.7 0.3 1.5 7.2
All Children 13,779 11,208 11,208 11,190 358 356 356 12,497 11,174 88 38 178 849Rate per 100 81.3 81.3 81.2 2.6 2.6 2.6 90.7 84.3 0.6 0.3 1.3 6.2
10 - WinnipegFirst Nations 461 300 300 300 10 10 10 385 300 3 0 1 4Rate per 100 65.1 65.1 65.1 2.2 2.2 2.2 83.5 65.1 0.7 0.0 0.2 0.9
Non-First Nations 6,683 5,663 5,663 5,646 169 168 167 6,127 5,643 51 27 147 680Rate per 100 84.7 84.7 84.5 2.5 2.5 2.5 91.7 84.4 0.8 0.4 2.2 10.2
All Children 7,144 5,963 5,963 5,946 179 178 177 6,512 5,943 54 27 148 684Rate per 100 83.5 83.5 83.2 2.5 2.5 2.5 91.2 84.4 0.8 0.4 2.1 9.6
15 - BrandonFirst Nations 53 32 32 32 1 1 1 48 32 0 0 0 0Rate per 100 60.4 60.4 60.4 1.9 1.9 1.9 90.6 60.4 0.0 0.0 0.0 0.0
Non-First Nations 541 459 459 459 28 28 28 493 459 1 6 3 32Rate per 100 84.8 84.8 84.8 5.2 5.2 5.2 91.1 84.8 0.2 1.1 0.6 5.9
All Children 594 491 491 491 29 29 29 541 491 1 6 3 32Rate per 100 82.7 82.7 82.7 4.9 4.9 4.9 91.1 84.8 0.2 1.0 0.5 5.4
20 - North EastmanFirst Nations 162 84 84 84 8 8 8 120 84 0 0 0 0Rate per 100 51.9 51.9 51.9 4.9 4.9 4.9 74.1 51.9 0.0 0.0 0.0 0.0
Non-First Nations 304 251 251 251 7 7 7 276 251 0 0 0 8Rate per 100 82.6 82.6 82.6 2.3 2.3 2.3 90.8 82.6 0.0 0.0 0.0 2.6
All Children 466 335 335 335 15 15 15 396 335 0 0 0 8Rate per 100 71.9 71.9 71.9 3.2 3.2 3.2 85.0 82.6 0.0 0.0 0.0 1.7
25 - South EastmanFirst Nations 9 9 9 9 0 0 0 12 9 0 0 0 0Rate per 100 100.0 100.0 100.0 0.0 0.0 0.0 133.3 100.0 0.0 0.0 0.0 0.0
Non-First Nations 784 682 682 682 19 18 19 737 681 11 1 8 38Rate per 100 87.0 87.0 87.0 2.4 2.3 2.4 94.0 86.9 1.4 0.1 1.0 4.8
All Children 793 691 691 691 19 18 19 749 690 11 1 8 38Rate per 100 87.1 87.1 87.1 2.4 2.3 2.4 94.5 86.9 1.4 0.1 1.0 4.8
30 - InterlakeFirst Nations 140 93 93 93 4 4 4 120 93 0 0 0 1Rate per 100 66.4 66.4 66.4 2.9 2.9 2.9 85.7 66.4 0.0 0.0 0.0 0.7
Non-First Nations 645 552 552 551 14 14 14 619 549 2 1 8 28Rate per 100 85.6 85.6 85.4 2.2 2.2 2.2 96.0 85.1 0.3 0.2 1.2 4.3
All Children 785 645 645 644 18 18 18 739 642 2 1 8 29Rate per 100 82.2 82.2 82.0 2.3 2.3 2.3 94.1 85.1 0.3 0.1 1.0 3.7
40 - CentralFirst Nations 135 83 83 83 1 1 1 110 83 0 0 0 0Rate per 100 61.5 61.5 61.5 0.7 0.7 0.7 81.5 61.5 0.0 0.0 0.0 0.0
Non-First Nations 1,265 1,004 1,004 1,004 17 17 17 1,081 1,002 13 0 4 19Rate per 100 79.4 79.4 79.4 1.3 1.3 1.3 85.5 79.2 1.0 0.0 0.3 1.5
All Children 1,400 1,087 1,087 1,087 18 18 18 1,191 1,085 13 0 4 19Rate per 100 77.6 77.6 77.6 1.3 1.3 1.3 85.1 79.2 0.9 0.0 0.3 1.4
Manitoba Immunization Monitoring System Annual Report 200322
Childhood Immunization Coverage Data By Patient AgeJanuary 1 - December 31, 2003
Age 1
Pop Diphth. Tet. Pert. Measles Mumps Rubella Polio HIB HBV V M P
45 - AssiniboineFirst Nations 74 58 58 58 2 2 2 73 58 0 0 0 0Rate per 100 78.4 78.4 78.4 2.7 2.7 2.7 98.6 78.4 0.0 0.0 0.0 0.0
Non-First Nations 610 529 529 529 14 14 14 561 528 0 2 2 22Rate per 100 86.7 86.7 86.7 2.3 2.3 2.3 92.0 86.6 0.0 0.3 0.3 3.6
All Children 684 587 587 587 16 16 16 634 586 0 2 2 22Rate per 100 85.8 85.8 85.8 2.3 2.3 2.3 92.7 86.6 0.0 0.3 0.3 3.2
60 - ParklandFirst Nations 91 57 57 57 1 1 1 77 57 0 0 0 0Rate per 100 62.6 62.6 62.6 1.1 1.1 1.1 84.6 62.6 0.0 0.0 0.0 0.0
Non-First Nations 398 374 374 374 11 11 11 392 374 2 0 3 7Rate per 100 94.0 94.0 94.0 2.8 2.8 2.8 98.5 94.0 0.5 0.0 0.8 1.8
All Children 489 431 431 431 12 12 12 469 431 2 0 3 7Rate per 100 88.1 88.1 88.1 2.5 2.5 2.5 95.9 94.0 0.4 0.0 0.6 1.4
70 - NormanFirst Nations 168 120 120 120 9 9 9 156 120 0 0 0 0Rate per 100 71.4 71.4 71.4 5.4 5.4 5.4 92.9 71.4 0.0 0.0 0.0 0.0
Non-First Nations 250 202 202 202 7 7 7 239 202 0 1 2 4Rate per 100 80.8 80.8 80.8 2.8 2.8 2.8 95.6 80.8 0.0 0.4 0.8 1.6
All Children 418 322 322 322 16 16 16 395 322 0 1 2 4Rate per 100 77.0 77.0 77.0 3.8 3.8 3.8 94.5 80.8 0.0 0.2 0.5 1.0
80 - BurntwoodFirst Nations 710 420 420 420 22 22 22 608 413 1 0 0 0Rate per 100 59.2 59.2 59.2 3.1 3.1 3.1 85.6 58.2 0.1 0.0 0.0 0.0
Non-First Nations 274 217 217 217 13 13 13 244 217 4 0 0 5Rate per 100 79.2 79.2 79.2 4.7 4.7 4.7 89.1 79.2 1.5 0.0 0.0 1.8
All Children 984 637 637 637 35 35 35 852 630 5 0 0 5Rate per 100 64.7 64.7 64.7 3.6 3.6 3.6 86.6 79.2 0.5 0.0 0.0 0.5
90 - ChurchillFirst Nations 5 3 3 3 0 0 0 3 3 0 0 0 0Rate per 100 60.0 60.0 60.0 0.0 0.0 0.0 60.0 60.0 0.0 0.0 0.0 0.0
Non-First Nations 17 16 16 16 1 1 1 16 16 0 0 0 1Rate per 100 94.1 94.1 94.1 5.9 5.9 5.9 94.1 94.1 0.0 0.0 0.0 5.9
All Children 22 19 19 19 1 1 1 19 19 0 0 0 1Rate per 100 86.4 86.4 86.4 4.5 4.5 4.5 86.4 94.1 0.0 0.0 0.0 4.5

Manitoba Immunization Monitoring System Annual Report 2003 23
Childhood Immunization Coverage Data By Patient AgeJanuary 1 - December 31, 2003
Age 2
Pop Diphth. Tet. Pert. Measles Mumps Rubella Polio HIB HBV V M P
MANITOBAFirst Nations 2,005 967 967 968 1,581 1,582 1,581 1,583 936 8 4 0 0Rate per 100 48.2 48.2 48.3 78.9 78.9 78.9 79.0 46.7 0.4 0.2 0.0 0.0
Non-First Nations 12,209 8,908 8,908 8,889 10,640 10,634 10,636 10,857 8,852 176 872 111 449Rate per 100 73.0 73.0 72.8 87.1 87.1 87.1 88.9 72.5 1.4 7.1 0.9 3.7
All Children 14,214 9,875 9,875 9,857 12,221 12,216 12,217 12,440 9,788 184 876 111 449Rate per 100 69.5 69.5 69.3 86.0 85.9 86.0 87.5 72.5 1.3 6.2 0.8 3.2
10 - WinnipegFirst Nations 447 230 230 231 354 355 354 369 228 1 4 0 0Rate per 100 51.5 51.5 51.7 79.2 79.4 79.2 82.6 51.0 0.2 0.9 0.0 0.0
Non-First Nations 6,969 5,056 5,056 5,038 6,014 6,013 6,013 6,130 5,025 109 697 78 366Rate per 100 72.5 72.5 72.3 86.3 86.3 86.3 88.0 72.1 1.6 10.0 1.1 5.3
All Children 7,416 5,286 5,286 5,269 6,368 6,368 6,367 6,499 5,253 110 701 78 366Rate per 100 71.3 71.3 71.0 85.9 85.9 85.9 87.6 72.1 1.5 9.5 1.1 4.9
15 - BrandonFirst Nations 57 22 22 22 37 37 37 38 22 0 0 0 0Rate per 100 38.6 38.6 38.6 64.9 64.9 64.9 66.7 38.6 0.0 0.0 0.0 0.0
Non-First Nations 505 366 366 366 438 438 438 451 366 1 23 3 12Rate per 100 72.5 72.5 72.5 86.7 86.7 86.7 89.3 72.5 0.2 4.6 0.6 2.4
All Children 562 388 388 388 475 475 475 489 388 1 23 3 12Rate per 100 69.0 69.0 69.0 84.5 84.5 84.5 87.0 72.5 0.2 4.1 0.5 2.1
20 - North EastmanFirst Nations 166 73 73 73 134 134 134 133 73 0 0 0 0Rate per 100 44.0 44.0 44.0 80.7 80.7 80.7 80.1 44.0 0.0 0.0 0.0 0.0
Non-First Nations 302 232 232 232 285 285 285 291 231 2 8 0 3Rate per 100 76.8 76.8 76.8 94.4 94.4 94.4 96.4 76.5 0.7 2.6 0.0 1.0
All Children 468 305 305 305 419 419 419 424 304 2 8 0 3Rate per 100 65.2 65.2 65.2 89.5 89.5 89.5 90.6 76.5 0.4 1.7 0.0 0.6
25 - South EastmanFirst Nations 5 5 5 5 5 5 5 5 5 0 0 0 0Rate per 100 100.0 100.0 100.0 100.0 100.0 100.0 100.0 100.0 0.0 0.0 0.0 0.0
Non-First Nations 827 605 605 605 733 732 732 753 603 16 36 6 22Rate per 100 73.2 73.2 73.2 88.6 88.5 88.5 91.1 72.9 1.9 4.4 0.7 2.7
All Children 832 610 610 610 738 737 737 758 608 16 36 6 22Rate per 100 73.3 73.3 73.3 88.7 88.6 88.6 91.1 72.9 1.9 4.3 0.7 2.6
30 - InterlakeFirst Nations 137 67 67 67 98 98 98 99 67 0 0 0 0Rate per 100 48.9 48.9 48.9 71.5 71.5 71.5 72.3 48.9 0.0 0.0 0.0 0.0
Non-First Nations 698 529 529 529 625 623 625 637 528 1 30 4 11Rate per 100 75.8 75.8 75.8 89.5 89.3 89.5 91.3 75.6 0.1 4.3 0.6 1.6
All Children 835 596 596 596 723 721 723 736 595 1 30 4 11Rate per 100 71.4 71.4 71.4 86.6 86.3 86.6 88.1 75.6 0.1 3.6 0.5 1.3
40 - CentralFirst Nations 120 34 34 34 83 83 83 87 34 0 0 0 0Rate per 100 28.3 28.3 28.3 69.2 69.2 69.2 72.5 28.3 0.0 0.0 0.0 0.0
Non-First Nations 1,295 938 938 937 1,111 1,110 1,110 1,141 923 32 32 6 17Rate per 100 72.4 72.4 72.4 85.8 85.7 85.7 88.1 71.3 2.5 2.5 0.5 1.3
All Children 1,415 972 972 971 1,194 1,193 1,193 1,228 957 32 32 6 17Rate per 100 68.7 68.7 68.6 84.4 84.3 84.3 86.8 71.3 2.3 2.3 0.4 1.2
45 - AssiniboineFirst Nations 75 37 37 37 51 51 51 51 37 0 0 0 0Rate per 100 49.3 49.3 49.3 68.0 68.0 68.0 68.0 49.3 0.0 0.0 0.0 0.0
Non-First Nations 620 491 491 491 575 574 574 583 489 4 28 5 7Rate per 100 79.2 79.2 79.2 92.7 92.6 92.6 94.0 78.9 0.6 4.5 0.8 1.1
All Children 695 528 528 528 626 625 625 634 526 4 28 5 7Rate per 100 76.0 76.0 76.0 90.1 89.9 89.9 91.2 78.9 0.6 4.0 0.7 1.0
60 - ParklandFirst Nations 88 60 60 60 88 88 88 89 59 0 0 0 0Rate per 100 68.2 68.2 68.2 100.0 100.0 100.0 101.1 67.0 0.0 0.0 0.0 0.0
Non-First Nations 406 295 295 295 354 354 354 359 295 2 8 7 5Rate per 100 72.7 72.7 72.7 87.2 87.2 87.2 88.4 72.7 0.5 2.0 1.7 1.2
All Children 494 355 355 355 442 442 442 448 354 2 8 7 5Rate per 100 71.9 71.9 71.9 89.5 89.5 89.5 90.7 72.7 0.4 1.6 1.4 1.0

Manitoba Immunization Monitoring System Annual Report 200324
Childhood Immunization Coverage Data By Patient AgeJanuary 1 - December 31, 2003
Age 2
Pop Diphth. Tet. Pert. Measles Mumps Rubella Polio HIB HBV V M P
70 - NormanFirst Nations 177 89 89 89 142 142 142 129 89 0 0 0 0Rate per 100 50.3 50.3 50.3 80.2 80.2 80.2 72.9 50.3 0.0 0.0 0.0 0.0
Non-First Nations 258 175 175 175 216 216 216 224 175 3 2 2 2Rate per 100 67.8 67.8 67.8 83.7 83.7 83.7 86.8 67.8 1.2 0.8 0.8 0.8
All Children 435 264 264 264 358 358 358 353 264 3 2 2 2Rate per 100 60.7 60.7 60.7 82.3 82.3 82.3 81.1 67.8 0.7 0.5 0.5 0.5
80 - BurntwoodFirst Nations 729 346 346 346 585 585 585 579 318 7 0 0 0Rate per 100 47.5 47.5 47.5 80.2 80.2 80.2 79.4 43.6 1.0 0.0 0.0 0.0
Non-First Nations 312 210 210 210 275 275 275 273 206 6 7 0 3Rate per 100 67.3 67.3 67.3 88.1 88.1 88.1 87.5 66.0 1.9 2.2 0.0 1.0
All Children 1,041 556 556 556 860 860 860 852 524 13 7 0 3Rate per 100 53.4 53.4 53.4 82.6 82.6 82.6 81.8 66.0 1.2 0.7 0.0 0.3
90 - ChurchillFirst Nations 4 4 4 4 4 4 4 4 4 0 0 0 0Rate per 100 100.0 100.0 100.0 100.0 100.0 100.0 100.0 100.0 0.0 0.0 0.0 0.0
Non-First Nations 17 11 11 11 14 14 14 15 11 0 1 0 1Rate per 100 64.7 64.7 64.7 82.4 82.4 82.4 88.2 64.7 0.0 5.9 0.0 5.9
All Children 21 15 15 15 18 18 18 19 15 0 1 0 1Rate per 100 71.4 71.4 71.4 85.7 85.7 85.7 90.5 64.7 0.0 4.8 0.0 4.8

Manitoba Immunization Monitoring System Annual Report 2003 25
Childhood Immunization Coverage Data By Patient AgeJanuary 1 - December 31, 2003
Age 7
Pop Diphth. Tet. Pert. Measles Mumps Rubella Polio HIB HBV V M P
MANITOBAFirst Nations 1,877 1,038 1,036 1,021 1,302 1,817 1,818 1,675 1,218 4 2 0 0Rate per 100 55.3 55.2 54.4 69.4 96.8 96.9 89.2 64.9 0.2 0.1 0.0 0.0
Non-First Nations 13,628 10,695 10,694 10,300 11,203 12,840 12,841 12,476 11,352 286 185 29 13Rate per 100 78.5 78.5 75.6 82.2 94.2 94.2 91.5 83.3 2.1 1.4 0.2 0.1
All Children 15,505 11,733 11,730 11,321 12,505 14,657 14,659 14,151 12,570 290 187 29 13Rate per 100 75.7 75.7 73.0 80.7 94.5 94.5 91.3 83.3 1.9 1.2 0.2 0.1
10 - WinnipegFirst Nations 402 231 231 225 256 385 386 367 299 4 0 0 0Rate per 100 57.5 57.5 56.0 63.7 95.8 96.0 91.3 74.4 1.0 0.0 0.0 0.0
Non-First Nations 7,735 5,850 5,848 5,564 6,097 7,227 7,227 6,958 6,336 161 147 15 10Rate per 100 75.6 75.6 71.9 78.8 93.4 93.4 90.0 81.9 2.1 1.9 0.2 0.1
All Children 8,137 6,081 6,079 5,789 6,353 7,612 7,613 7,325 6,635 165 147 15 10Rate per 100 74.7 74.7 71.1 78.1 93.5 93.6 90.0 81.9 2.0 1.8 0.2 0.1
15 - BrandonFirst Nations 55 32 32 32 48 54 54 53 37 0 0 0 0Rate per 100 58.2 58.2 58.2 87.3 98.2 98.2 96.4 67.3 0.0 0.0 0.0 0.0
Non-First Nations 576 465 465 462 505 542 542 522 482 8 4 2 1Rate per 100 80.7 80.7 80.2 87.7 94.1 94.1 90.6 83.7 1.4 0.7 0.3 0.2
All Children 631 497 497 494 553 596 596 575 519 8 4 2 1Rate per 100 78.8 78.8 78.3 87.6 94.5 94.5 91.1 83.7 1.3 0.6 0.3 0.2
20 - North EastmanFirst Nations 166 76 76 76 93 148 148 140 100 0 0 0 0Rate per 100 45.8 45.8 45.8 56.0 89.2 89.2 84.3 60.2 0.0 0.0 0.0 0.0
Non-First Nations 388 321 321 294 341 380 380 374 332 4 2 1 0Rate per 100 82.7 82.7 75.8 87.9 97.9 97.9 96.4 85.6 1.0 0.5 0.3 0.0
All Children 554 397 397 370 434 528 528 514 432 4 2 1 0Rate per 100 71.7 71.7 66.8 78.3 95.3 95.3 92.8 85.6 0.7 0.4 0.2 0.0
25 - South EastmanFirst Nations 5 6 6 6 4 7 7 8 7 0 0 0 0Rate per 100 120.0 120.0 120.0 80.0 140.0 140.0 160.0 140.0 0.0 0.0 0.0 0.0
Non-First Nations 906 722 722 701 761 844 844 831 748 46 3 0 0Rate per 100 79.7 79.7 77.4 84.0 93.2 93.2 91.7 82.6 5.1 0.3 0.0 0.0
All Children 911 728 728 707 765 851 851 839 755 46 3 0 0Rate per 100 79.9 79.9 77.6 84.0 93.4 93.4 92.1 82.6 5.0 0.3 0.0 0.0
30 - InterlakeFirst Nations 146 77 77 75 83 124 124 116 91 0 0 0 0Rate per 100 52.7 52.7 51.4 56.8 84.9 84.9 79.5 62.3 0.0 0.0 0.0 0.0
Non-First Nations 858 709 709 675 719 825 825 805 750 4 6 2 0Rate per 100 82.6 82.6 78.7 83.8 96.2 96.2 93.8 87.4 0.5 0.7 0.2 0.0
All Children 1,004 786 786 750 802 949 949 921 841 4 6 2 0Rate per 100 78.3 78.3 74.7 79.9 94.5 94.5 91.7 87.4 0.4 0.6 0.2 0.0
40 - CentralFirst Nations 134 50 49 47 90 134 134 111 57 0 1 0 0Rate per 100 37.3 36.6 35.1 67.2 100.0 100.0 82.8 42.5 0.0 0.7 0.0 0.0
Non-First Nations 1,330 1,100 1,100 1,081 1,155 1,271 1,271 1,259 1,133 38 15 0 0Rate per 100 82.7 82.7 81.3 86.8 95.6 95.6 94.7 85.2 2.9 1.1 0.0 0.0
All Children 1,464 1,150 1,149 1,128 1,245 1,405 1,405 1,370 1,190 38 16 0 0Rate per 100 78.6 78.5 77.0 85.0 96.0 96.0 93.6 85.2 2.6 1.1 0.0 0.0
45 - AssiniboineFirst Nations 75 39 39 38 34 72 72 66 51 0 1 0 0Rate per 100 52.0 52.0 50.7 45.3 96.0 96.0 88.0 68.0 0.0 1.3 0.0 0.0
Non-First Nations 763 646 646 645 676 715 716 703 654 6 4 6 1Rate per 100 84.7 84.7 84.5 88.6 93.7 93.8 92.1 85.7 0.8 0.5 0.8 0.1
All Children 838 685 685 683 710 787 788 769 705 6 5 6 1Rate per 100 81.7 81.7 81.5 84.7 93.9 94.0 91.8 85.7 0.7 0.6 0.7 0.1
60 - ParklandFirst Nations 88 72 71 71 79 87 87 86 74 0 0 0 0Rate per 100 81.8 80.7 80.7 89.8 98.9 98.9 97.7 84.1 0.0 0.0 0.0 0.0
Non-First Nations 468 389 389 386 423 443 443 437 399 12 3 2 0Rate per 100 83.1 83.1 82.5 90.4 94.7 94.7 93.4 85.3 2.6 0.6 0.4 0.0
All Children 556 461 460 457 502 530 530 523 473 12 3 2 0Rate per 100 82.9 82.7 82.2 90.3 95.3 95.3 94.1 85.3 2.2 0.5 0.4 0.0
Manitoba Immunization Monitoring System Annual Report 200326
Childhood Immunization Coverage Data By Patient AgeJanuary 1 - December 31, 2003
Age 7
Pop Diphth. Tet. Pert. Measles Mumps Rubella Polio HIB HBV V M P
70 - NormanFirst Nations 147 110 110 110 120 144 144 135 121 0 0 0 0Rate per 100 74.8 74.8 74.8 81.6 98.0 98.0 91.8 82.3 0.0 0.0 0.0 0.0
Non-First Nations 281 228 228 228 236 261 261 260 242 2 1 1 0Rate per 100 81.1 81.1 81.1 84.0 92.9 92.9 92.5 86.1 0.7 0.4 0.4 0.0
All Children 428 338 338 338 356 405 405 395 363 2 1 1 0Rate per 100 79.0 79.0 79.0 83.2 94.6 94.6 92.3 86.1 0.5 0.2 0.2 0.0
80 - BurntwoodFirst Nations 657 343 343 339 493 660 660 591 379 0 0 0 0Rate per 100 52.2 52.2 51.6 75.0 100.5 100.5 90.0 57.7 0.0 0.0 0.0 0.0
Non-First Nations 307 249 250 248 274 314 314 309 259 5 0 0 1Rate per 100 81.1 81.4 80.8 89.3 102.3 102.3 100.7 84.4 1.6 0.0 0.0 0.3
All Children 964 592 593 587 767 974 974 900 638 5 0 0 1Rate per 100 61.4 61.5 60.9 79.6 101.0 101.0 93.4 84.4 0.5 0.0 0.0 0.1
90 - ChurchillFirst Nations 2 2 2 2 2 2 2 2 2 0 0 0 0Rate per 100 100.0 100.0 100.0 100.0 100.0 100.0 100.0 100.0 0.0 0.0 0.0 0.0
Non-First Nations 16 16 16 16 16 18 18 18 17 0 0 0 0Rate per 100 100.0 100.0 100.0 100.0 112.5 112.5 112.5 106.3 0.0 0.0 0.0 0.0
All Children 18 18 18 18 18 20 20 20 19 0 0 0 0Rate per 100 100.0 100.0 100.0 100.0 111.1 111.1 111.1 106.3 0.0 0.0 0.0 0.0

Manitoba Immunization Monitoring System Annual Report 2003 27
Childhood Immunization Coverage Data By Patient AgeJanuary 1 - December 31, 2003
Age 11
Pop Diphth. Tet. Pert. Measles Mumps Rubella Polio HIB HBV V M P
MANITOBAFirst Nations 1,970 1,251 1,251 1,194 1,290 1,859 1,860 1,738 985 858 2 1 0Rate per 100 63.5 63.5 60.6 65.5 94.4 94.4 88.2 50.0 43.6 0.1 0.1 0.0
Non-First Nations 14,678 12,374 12,378 11,603 12,797 13,821 13,819 13,572 10,146 10,811 47 19 2Rate per 100 84.3 84.3 79.1 87.2 94.2 94.1 92.5 69.1 73.7 0.3 0.1 0.0
All Children 16,648 13,625 13,629 12,797 14,087 15,680 15,679 15,310 11,131 11,669 49 20 2Rate per 100 81.8 81.9 76.9 84.6 94.2 94.2 92.0 69.1 70.1 0.3 0.1 0.0
10 - WinnipegFirst Nations 417 286 286 263 307 397 397 387 216 219 0 0 0Rate per 100 68.6 68.6 63.1 73.6 95.2 95.2 92.8 51.8 52.5 0.0 0.0 0.0
Non-First Nations 8,234 6,859 6,862 6,379 7,077 7,681 7,680 7,501 5,520 5,941 39 9 2Rate per 100 83.3 83.3 77.5 85.9 93.3 93.3 91.1 67.0 72.2 0.5 0.1 0.0
All Children 8,651 7,145 7,148 6,642 7,384 8,078 8,077 7,888 5,736 6,160 39 9 2Rate per 100 82.6 82.6 76.8 85.4 93.4 93.4 91.2 67.0 71.2 0.5 0.1 0.0
15 - BrandonFirst Nations 45 26 26 26 35 45 45 45 23 20 0 0 0Rate per 100 57.8 57.8 57.8 77.8 100.0 100.0 100.0 51.1 44.4 0.0 0.0 0.0
Non-First Nations 569 473 473 462 488 521 521 512 412 438 0 0 0Rate per 100 83.1 83.1 81.2 85.8 91.6 91.6 90.0 72.4 77.0 0.0 0.0 0.0
All Children 614 499 499 488 523 566 566 557 435 458 0 0 0Rate per 100 81.3 81.3 79.5 85.2 92.2 92.2 90.7 72.4 74.6 0.0 0.0 0.0
20 - North EastmanFirst Nations 156 98 99 93 108 147 147 141 72 58 0 0 0Rate per 100 62.8 63.5 59.6 69.2 94.2 94.2 90.4 46.2 37.2 0.0 0.0 0.0
Non-First Nations 500 443 443 405 462 483 483 480 356 362 1 1 0Rate per 100 88.6 88.6 81.0 92.4 96.6 96.6 96.0 71.2 72.4 0.2 0.2 0.0
All Children 656 541 542 498 570 630 630 621 428 420 1 1 0Rate per 100 82.5 82.6 75.9 86.9 96.0 96.0 94.7 71.2 64.0 0.2 0.2 0.0
25 - South EastmanFirst Nations 1 3 3 3 1 3 3 3 2 1 0 0 0Rate per 100 300.0 300.0 300.0 100.0 300.0 300.0 300.0 200.0 100.0 0.0 0.0 0.0
Non-First Nations 936 811 812 750 854 916 916 910 657 710 3 0 0Rate per 100 86.6 86.8 80.1 91.2 97.9 97.9 97.2 70.2 75.9 0.3 0.0 0.0
All Children 937 814 815 753 855 919 919 913 659 711 3 0 0Rate per 100 86.9 87.0 80.4 91.2 98.1 98.1 97.4 70.2 75.9 0.3 0.0 0.0
30 - InterlakeFirst Nations 170 125 125 117 114 170 170 158 108 73 0 0 0Rate per 100 73.5 73.5 68.8 67.1 100.0 100.0 92.9 63.5 42.9 0.0 0.0 0.0
Non-First Nations 943 796 796 744 819 897 897 883 666 730 3 2 0Rate per 100 84.4 84.4 78.9 86.9 95.1 95.1 93.6 70.6 77.4 0.3 0.2 0.0
All Children 1,113 921 921 861 933 1,067 1,067 1,041 774 803 3 2 0Rate per 100 82.7 82.7 77.4 83.8 95.9 95.9 93.5 70.6 72.1 0.3 0.2 0.0
40 - CentralFirst Nations 132 55 55 49 94 120 120 102 65 38 0 0 0Rate per 100 41.7 41.7 37.1 71.2 90.9 90.9 77.3 49.2 28.8 0.0 0.0 0.0
Non-First Nations 1,462 1,315 1,315 1,246 1,360 1,451 1,451 1,439 1,114 1,102 0 1 0Rate per 100 89.9 89.9 85.2 93.0 99.2 99.2 98.4 76.2 75.4 0.0 0.1 0.0
All Children 1,594 1,370 1,370 1,295 1,454 1,571 1,571 1,541 1,179 1,140 0 1 0Rate per 100 85.9 85.9 81.2 91.2 98.6 98.6 96.7 76.2 71.5 0.0 0.1 0.0
45 - AssiniboineFirst Nations 89 63 63 62 64 92 92 91 76 58 1 1 0Rate per 100 70.8 70.8 69.7 71.9 103.4 103.4 102.2 85.4 65.2 1.1 1.1 0.0
Non-First Nations 906 776 776 746 792 839 839 828 685 707 0 5 0Rate per 100 85.7 85.7 82.3 87.4 92.6 92.6 91.4 75.6 78.0 0.0 0.6 0.0
All Children 995 839 839 808 856 931 931 919 761 765 1 6 0Rate per 100 84.3 84.3 81.2 86.0 93.6 93.6 92.4 75.6 76.9 0.1 0.6 0.0
60 - ParklandFirst Nations 102 88 88 86 93 100 100 100 60 81 0 0 0Rate per 100 86.3 86.3 84.3 91.2 98.0 98.0 98.0 58.8 79.4 0.0 0.0 0.0
Non-First Nations 496 421 421 406 450 472 471 465 354 392 0 0 0Rate per 100 84.9 84.9 81.9 90.7 95.2 95.0 93.8 71.4 79.0 0.0 0.0 0.0
All Children 598 509 509 492 543 572 571 565 414 473 0 0 0Rate per 100 85.1 85.1 82.3 90.8 95.7 95.5 94.5 71.4 79.1 0.0 0.0 0.0

Manitoba Immunization Monitoring System Annual Report 200328
Childhood Immunization Coverage Data By Patient AgeJanuary 1 - December 31, 2003
Age 11
Pop Diphth. Tet. Pert. Measles Mumps Rubella Polio HIB HBV V M P
70 - NormanFirst Nations 139 109 109 109 117 133 133 130 84 86 0 0 0Rate per 100 78.4 78.4 78.4 84.2 95.7 95.7 93.5 60.4 61.9 0.0 0.0 0.0
Non-First Nations 307 247 247 240 257 276 276 274 205 233 0 1 0Rate per 100 80.5 80.5 78.2 83.7 89.9 89.9 89.3 66.8 75.9 0.0 0.3 0.0
All Children 446 356 356 349 374 409 409 404 289 319 0 1 0Rate per 100 79.8 79.8 78.3 83.9 91.7 91.7 90.6 66.8 71.5 0.0 0.2 0.0
80 - BurntwoodFirst Nations 716 396 395 384 355 649 650 578 277 222 1 0 0Rate per 100 55.3 55.2 53.6 49.6 90.6 90.8 80.7 38.7 31.0 0.1 0.0 0.0
Non-First Nations 309 221 221 213 230 272 272 267 168 186 1 0 0Rate per 100 71.5 71.5 68.9 74.4 88.0 88.0 86.4 54.4 60.2 0.3 0.0 0.0
All Children 1,025 617 616 597 585 921 922 845 445 408 2 0 0Rate per 100 60.2 60.1 58.2 57.1 89.9 90.0 82.4 54.4 39.8 0.2 0.0 0.0
90 - ChurchillFirst Nations 3 2 2 2 2 3 3 3 2 2 0 0 0Rate per 100 66.7 66.7 66.7 66.7 100.0 100.0 100.0 66.7 66.7 0.0 0.0 0.0
Non-First Nations 16 12 12 12 8 13 13 13 9 10 0 0 0Rate per 100 75.0 75.0 75.0 50.0 81.3 81.3 81.3 56.3 62.5 0.0 0.0 0.0
All Children 19 14 14 14 10 16 16 16 11 12 0 0 0Rate per 100 73.7 73.7 73.7 52.6 84.2 84.2 84.2 56.3 63.2 0.0 0.0 0.0

Manitoba Immunization Monitoring System Annual Report 2003 29
Childhood Immunization Coverage Data By Patient AgeJanuary 1 - December 31, 2003
Age 17
Pop Diphth. Tet. Pert. Measles Mumps Rubella Polio HIB HBV V M P
MANITOBAFirst Nations 1,525 356 357 678 871 1,100 1,278 1,025 2 24 0 0 0Rate per 100 23.3 23.4 44.5 57.1 72.1 83.8 67.2 0.1 1.6 0.0 0.0 0.0
Non-First Nations 15,183 9,771 9,797 9,993 12,539 13,783 14,272 13,541 3 540 19 11 0Rate per 100 64.4 64.5 65.8 82.6 90.8 94.0 89.2 0.0 3.6 0.1 0.1 0.0
All Children 16,708 10,127 10,154 10,671 13,410 14,883 15,550 14,566 5 564 19 11 0Rate per 100 60.6 60.8 63.9 80.3 89.1 93.1 87.2 0.0 3.4 0.1 0.1 0.0
10 - WinnipegFirst Nations 307 62 62 121 177 232 276 196 0 8 0 0 0Rate per 100 20.2 20.2 39.4 57.7 75.6 89.9 63.8 0.0 2.6 0.0 0.0 0.0
Non-First Nations 8,227 4,777 4,792 4,921 6,534 7,205 7,583 7,050 2 357 16 5 0Rate per 100 58.1 58.2 59.8 79.4 87.6 92.2 85.7 0.0 4.3 0.2 0.1 0.0
All Children 8,534 4,839 4,854 5,042 6,711 7,437 7,859 7,246 2 365 16 5 0Rate per 100 56.7 56.9 59.1 78.6 87.1 92.1 84.9 0.0 4.3 0.2 0.1 0.0
15 - BrandonFirst Nations 39 11 11 15 27 27 29 23 0 0 0 0 0Rate per 100 28.2 28.2 38.5 69.2 69.2 74.4 59.0 0.0 0.0 0.0 0.0 0.0
Non-First Nations 634 424 424 420 507 551 571 535 0 8 0 0 0Rate per 100 66.9 66.9 66.2 80.0 86.9 90.1 84.4 0.0 1.3 0.0 0.0 0.0
All Children 673 435 435 435 534 578 600 558 0 8 0 0 0Rate per 100 64.6 64.6 64.6 79.3 85.9 89.2 82.9 0.0 1.2 0.0 0.0 0.0
20 - North EastmanFirst Nations 116 24 26 46 65 89 99 82 0 4 0 0 0Rate per 100 20.7 22.4 39.7 56.0 76.7 85.3 70.7 0.0 3.4 0.0 0.0 0.0
Non-First Nations 512 372 372 358 454 496 501 487 1 13 0 0 0Rate per 100 72.7 72.7 69.9 88.7 96.9 97.9 95.1 0.2 2.5 0.0 0.0 0.0
All Children 628 396 398 404 519 585 600 569 1 17 0 0 0Rate per 100 63.1 63.4 64.3 82.6 93.2 95.5 90.6 0.2 2.7 0.0 0.0 0.0
25 - South EastmanFirst Nations 6 0 0 1 3 5 6 3 0 0 0 0 0Rate per 100 0.0 0.0 16.7 50.0 83.3 100.0 50.0 0.0 0.0 0.0 0.0 0.0
Non-First Nations 976 682 683 620 814 936 944 923 0 23 0 0 0Rate per 100 69.9 70.0 63.5 83.4 95.9 96.7 94.6 0.0 2.4 0.0 0.0 0.0
All Children 982 682 683 621 817 941 950 926 0 23 0 0 0Rate per 100 69.5 69.6 63.2 83.2 95.8 96.7 94.3 0.0 2.3 0.0 0.0 0.0
30 - InterlakeFirst Nations 119 24 24 57 83 100 114 90 0 0 0 0 0Rate per 100 20.2 20.2 47.9 69.7 84.0 95.8 75.6 0.0 0.0 0.0 0.0 0.0
Non-First Nations 1,051 774 775 722 930 1,003 1,036 988 0 27 0 0 0Rate per 100 73.6 73.7 68.7 88.5 95.4 98.6 94.0 0.0 2.6 0.0 0.0 0.0
All Children 1,170 798 799 779 1,013 1,103 1,150 1,078 0 27 0 0 0Rate per 100 68.2 68.3 66.6 86.6 94.3 98.3 92.1 0.0 2.3 0.0 0.0 0.0
40 - CentralFirst Nations 111 26 26 36 49 69 75 68 0 0 0 0 0Rate per 100 23.4 23.4 32.4 44.1 62.2 67.6 61.3 0.0 0.0 0.0 0.0 0.0
Non-First Nations 1,554 1,163 1,166 1,236 1,380 1,502 1,505 1,491 0 59 2 1 0Rate per 100 74.8 75.0 79.5 88.8 96.7 96.8 95.9 0.0 3.8 0.1 0.1 0.0
All Children 1,665 1,189 1,192 1,272 1,429 1,571 1,580 1,559 0 59 2 1 0Rate per 100 71.4 71.6 76.4 85.8 94.4 94.9 93.6 0.0 3.5 0.1 0.1 0.0
45 - AssiniboineFirst Nations 71 12 12 28 42 49 57 43 0 1 0 0 0Rate per 100 16.9 16.9 39.4 59.2 69.0 80.3 60.6 0.0 1.4 0.0 0.0 0.0
Non-First Nations 1,027 756 761 812 878 975 989 967 0 21 1 3 0Rate per 100 73.6 74.1 79.1 85.5 94.9 96.3 94.2 0.0 2.0 0.1 0.3 0.0
All Children 1,098 768 773 840 920 1,024 1,046 1,010 0 22 1 3 0Rate per 100 69.9 70.4 76.5 83.8 93.3 95.3 92.0 0.0 2.0 0.1 0.3 0.0
60 - ParklandFirst Nations 72 31 30 57 61 69 69 67 0 1 0 0 0Rate per 100 43.1 41.7 79.2 84.7 95.8 95.8 93.1 0.0 1.4 0.0 0.0 0.0
Non-First Nations 579 441 442 485 508 545 551 541 0 12 0 2 0Rate per 100 76.2 76.3 83.8 87.7 94.1 95.2 93.4 0.0 2.1 0.0 0.3 0.0
All Children 651 472 472 542 569 614 620 608 0 13 0 2 0Rate per 100 72.5 72.5 83.3 87.4 94.3 95.2 93.4 0.0 2.0 0.0 0.3 0.0

Manitoba Immunization Monitoring System Annual Report 200330
Childhood Immunization Coverage Data By Patient AgeJanuary 1 - December 31, 2003
Age 17
Pop Diphth. Tet. Pert. Measles Mumps Rubella Polio HIB HBV V M P
70 - NormanFirst Nations 114 38 38 64 72 88 107 86 1 3 0 0 0Rate per 100 33.3 33.3 56.1 63.2 77.2 93.9 75.4 0.9 2.6 0.0 0.0 0.0
Non-First Nations 315 211 211 230 279 294 305 289 0 16 0 0 0Rate per 100 67.0 67.0 73.0 88.6 93.3 96.8 91.7 0.0 5.1 0.0 0.0 0.0
All Children 429 249 249 294 351 382 412 375 1 19 0 0 0Rate per 100 58.0 58.0 68.5 81.8 89.0 96.0 87.4 0.0 4.4 0.0 0.0 0.0
80 - BurntwoodFirst Nations 566 126 126 250 288 368 442 364 1 7 0 0 0Rate per 100 22.3 22.3 44.2 50.9 65.0 78.1 64.3 0.2 1.2 0.0 0.0 0.0
Non-First Nations 298 167 167 183 251 270 281 264 0 4 0 0 0Rate per 100 56.0 56.0 61.4 84.2 90.6 94.3 88.6 0.0 1.3 0.0 0.0 0.0
All Children 864 293 293 433 539 638 723 628 1 11 0 0 0Rate per 100 33.9 33.9 50.1 62.4 73.8 83.7 72.7 0.0 1.3 0.0 0.0 0.0
90 - ChurchillFirst Nations 4 2 2 3 4 4 4 3 0 0 0 0 0Rate per 100 50.0 50.0 75.0 100.0 100.0 100.0 75.0 0.0 0.0 0.0 0.0 0.0
Non-First Nations 10 4 4 6 4 6 6 6 0 0 0 0 0Rate per 100 40.0 40.0 60.0 40.0 60.0 60.0 60.0 0.0 0.0 0.0 0.0 0.0
All Children 14 6 6 9 8 10 10 9 0 0 0 0 0Rate per 100 42.9 42.9 64.3 57.1 71.4 71.4 64.3 0.0 0.0 0.0 0.0 0.0
Manitoba Immunization Monitoring System Annual Report 2003 31
4. Childhood Immunization Coverage Reports, January 1, 2003 –December 31, 2003
4.3 Coverage Based on Health Registration – Per Cent Complete for Age
■ Manitoba
■ By RHA
Notes:
A client considered “Complete for Age” has received all of the recommended doses of each vaccine recommended for his / herage. For vaccines considered in “Complete for Age” see Section 2, “Description of Criteria for MIMS Annual Reports.”
Continuous Health Registration – reflects clients who have been registered with Manitoba Health for benefits, without inter-ruption, since birth. Non-Continuous Health Registration – reflects clients who, if born in Manitoba moved out for a periodand then returned, or clients who were born outside of Manitoba and moved into the province (i.e., interrupted health benefitregistration).
Coverage rate calculation methods allow for rates which may exceed 100%, particularly when populations are small. This isbecause the population (i.e., denominator) is assigned using June 2003 data, while the MIMS data are from April 16, 2004.
Childhood Immunization Coverage Report Based on Health Registration January 1 - December 31, 2003
Continuous Health Non-Continuous Health Registration Registration
Age No. of Children Rate per No. of Children Rate per No. of Children Rate perChildren Complete 100 Children Complete 100 Children Complete 100
for Age Children for Age Children for Age Children
Manitoba
1 First Nations 2,008 1,252 62.4 1,990 1,247 62.7 18 5 27.8Non-First Nations 11,771 9,913 84.2 11,334 9,715 85.7 437 198 45.3All 1 Year Olds 13,779 11,165 81.0 13,324 10,962 82.3 455 203 44.6
2 First Nations 2,005 889 44.3 1,970 885 44.9 35 4 11.4Non-First Nations 12,209 8,660 70.9 11,321 8,412 74.3 888 248 27.9All 2 Year Olds 14,214 9,549 67.2 13,291 9,297 69.9 923 252 27.3
7 First Nations 1,877 869 46.3 1,799 852 47.4 78 17 21.8Non-First Nations 13,628 9,710 71.3 11,453 8,981 78.4 2,175 729 33.5All 7 Year Olds 15,505 10,579 68.2 13,252 9,833 74.2 2,253 746 33.1
11 First Nations 1,970 911 46.2 1,841 867 47.1 129 44 34.1Non-First Nations 14,678 11,276 76.8 11,819 9,944 84.1 2,859 1,332 46.6All 11 Year Olds 16,648 12,187 73.2 13,660 10,811 79.1 2,988 1,376 46.1
17 First Nations 1,525 280 18.4 1,387 257 18.5 138 23 16.7Non-First Nations 15,183 7,783 51.3 11,495 6,778 59.0 3,688 1,005 27.3All 17 Year Olds 16,708 8,063 48.3 12,882 7,035 54.6 3,826 1,028 26.9
10 - Winnipeg
1 First Nations 461 300 65.1 451 297 65.9 10 3 30.0Non-First Nations 6,683 5,637 84.3 6,439 5,582 86.7 244 55 22.5All 1 Year Olds 7,144 5,937 83.1 6,890 5,879 85.3 254 58 22.8
2 First Nations 447 214 47.9 435 212 48.7 12 2 16.7Non-First Nations 6,969 4,894 70.2 6,478 4,819 74.4 491 75 15.3All 2 Year Olds 7,416 5,108 68.9 6,913 5,031 72.8 503 77 15.3
7 First Nations 402 190 47.3 369 184 49.9 33 6 18.2Non-First Nations 7,735 5,190 67.1 6,465 4,872 75.4 1,270 318 25.0All 7 Year Olds 8,137 5,380 66.1 6,834 5,056 74.0 1,303 324 24.9
11 First Nations 417 222 53.2 370 207 55.9 47 15 31.9Non-First Nations 8,234 6,215 75.5 6,587 5,496 83.4 1,647 719 43.7All 11 Year Olds 8,651 6,437 74.4 6,957 5,703 82.0 1,694 734 43.3
17 First Nations 307 44 14.3 261 35 13.4 46 9 19.6Non-First Nations 8,227 3,647 44.3 6,005 3,116 51.9 2,222 531 23.9All 17 Year Olds 8,534 3,691 43.3 6,266 3,151 50.3 2,268 540 23.8

Manitoba Immunization Monitoring System Annual Report 200332
Childhood Immunization Coverage Report Based on Health Registration January 1 - December 31, 2003
Continuous Health Non-Continuous Health Registration Registration
Age No. of Children Rate per No. of Children Rate per No. of Children Rate perChildren Complete 100 Children Complete 100 Children Complete 100
for Age Children for Age Children for Age Children
15 - Brandon
1 First Nations 53 32 60.4 53 32 60.4 0 0 0.0Non-First Nations 541 459 84.8 509 442 86.8 32 17 53.1All 1 Year Olds 594 491 82.7 562 474 84.3 32 17 53.1
2 First Nations 57 22 38.6 55 22 40.0 2 0 0.0Non-First Nations 505 360 71.3 456 347 76.1 49 13 26.5All 2 Year Olds 562 382 68.0 511 369 72.2 51 13 25.5
7 First Nations 55 31 56.4 51 30 58.8 4 1 25.0Non-First Nations 576 456 79.2 461 389 84.4 115 67 58.3All 7 Year Olds 631 487 77.2 512 419 81.8 119 68 57.1
11 First Nations 45 19 42.2 42 18 42.9 3 1 33.3Non-First Nations 569 449 78.9 419 373 89.0 150 76 50.7All 11 Year Olds 614 468 76.2 461 391 84.8 153 77 50.3
17 First Nations 39 11 28.2 33 9 27.3 6 2 33.3Non-First Nations 634 353 55.7 476 313 65.8 158 40 25.3All 17 Year Olds 673 364 54.1 509 322 63.3 164 42 25.6
20 - North Eastman
1 First Nations 162 84 51.9 162 84 51.9 0 0 0.0Non-First Nations 304 250 82.2 293 247 84.3 11 3 27.3All 1 Year Olds 466 334 71.7 455 331 72.7 11 3 27.3
2 First Nations 166 68 41.0 164 67 40.9 2 1 50.0Non-First Nations 302 228 75.5 295 225 76.3 7 3 42.9All 2 Year Olds 468 296 63.2 459 292 63.6 9 4 44.4
7 First Nations 166 62 37.3 161 62 38.5 5 0 0.0Non-First Nations 388 281 72.4 341 252 73.9 47 29 61.7All 7 Year Olds 554 343 61.9 502 314 62.5 52 29 55.8
11 First Nations 156 78 50.0 153 77 50.3 3 1 33.3Non-First Nations 500 400 80.0 421 351 83.4 79 49 62.0All 11 Year Olds 656 478 72.9 574 428 74.6 82 50 61.0
17 First Nations 116 20 17.2 110 19 17.3 6 1 16.7Non-First Nations 512 286 55.9 429 247 57.6 83 39 47.0All 17 Year Olds 628 306 48.7 539 266 49.4 89 40 44.9
25 - South Eastman
1 First Nations 9 9 100.0 9 9 100.0 0 0 0.0Non-First Nations 784 681 86.9 754 648 85.9 30 33 110.0All 1 Year Olds 793 690 87.0 763 657 86.1 30 33 110.0
2 First Nations 5 5 100.0 5 5 100.0 0 0 0.0Non-First Nations 827 595 71.9 756 556 73.5 71 39 54.9All 2 Year Olds 832 600 72.1 761 561 73.7 71 39 54.9
7 First Nations 5 3 60.0 4 3 75.0 1 0 0.0Non-First Nations 906 664 73.3 728 593 81.5 178 71 39.9All 7 Year Olds 911 667 73.2 732 596 81.4 179 71 39.7
11 First Nations 1 1 100.0 1 1 100.0 0 0 0.0Non-First Nations 936 734 78.4 730 635 87.0 206 99 48.1All 11 Year Olds 937 735 78.4 731 636 87.0 206 99 48.1
17 First Nations 6 0 0.0 4 0 0.0 2 0 0.0Non-First Nations 976 490 50.2 735 434 59.0 241 56 23.2All 17 Year Olds 982 490 49.9 739 434 58.7 243 56 23.0
30 - Interlake
1 First Nations 140 93 66.4 139 92 66.2 1 1 100.0Non-First Nations 645 548 85.0 631 539 85.4 14 9 64.3All 1 Year Olds 785 641 81.7 770 631 81.9 15 10 66.7
2 First Nations 137 63 46.0 136 63 46.3 1 0 0.0Non-First Nations 698 510 73.1 667 504 75.6 31 6 19.4All 2 Year Olds 835 573 68.6 803 567 70.6 32 6 18.8
7 First Nations 146 60 41.1 141 58 41.1 5 2 40.0Non-First Nations 858 636 74.1 779 610 78.3 79 26 32.9All 7 Year Olds 1,004 696 69.3 920 668 72.6 84 28 33.3
11 First Nations 170 81 47.6 160 79 49.4 10 2 20.0Non-First Nations 943 709 75.2 819 659 80.5 124 50 40.3All 11 Year Olds 1,113 790 71.0 979 738 75.4 134 52 38.8
17 First Nations 119 18 15.1 114 18 15.8 5 0 0.0Non-First Nations 1,051 591 56.2 876 538 61.4 175 53 30.3All 17 Year Olds 1,170 609 52.1 990 556 56.2 180 53 29.4

Manitoba Immunization Monitoring System Annual Report 2003 33
Childhood Immunization Coverage Report Based on Health Registration January 1 - December 31, 2003
Continuous Health Non-Continuous Health Registration Registration
Age No. of Children Rate per No. of Children Rate per No. of Children Rate perChildren Complete 100 Children Complete 100 Children Complete 100
for Age Children for Age Children for Age Children
40 - Central
1 First Nations 135 83 61.5 133 83 62.4 2 0 0.0Non-First Nations 1,265 1,002 79.2 1,216 977 80.3 49 25 51.0All 1 Year Olds 1,400 1,085 77.5 1,349 1,060 78.6 51 25 49.0
2 First Nations 120 33 27.5 118 33 28.0 2 0 0.0Non-First Nations 1,295 914 70.6 1,184 858 72.5 111 56 50.5All 2 Year Olds 1,415 947 66.9 1,302 891 68.4 113 56 49.6
7 First Nations 134 43 32.1 133 43 32.3 1 0 0.0Non-First Nations 1,330 1,025 77.1 1,117 929 83.2 213 96 45.1All 7 Year Olds 1,464 1,068 73.0 1,250 972 77.8 214 96 44.9
11 First Nations 132 42 31.8 126 39 31.0 6 3 50.0Non-First Nations 1,462 1,220 83.4 1,173 1,064 90.7 289 156 54.0All 11 Year Olds 1,594 1,262 79.2 1,299 1,103 84.9 295 159 53.9
17 First Nations 111 18 16.2 102 18 17.6 9 0 0.0Non-First Nations 1,554 1,028 66.2 1,232 919 74.6 322 109 33.9All 17 Year Olds 1,665 1,046 62.8 1,334 937 70.2 331 109 32.9
45 - Assiniboine
1 First Nations 74 58 78.4 73 57 78.1 1 1 100.0Non-First Nations 610 528 86.6 586 506 86.3 24 22 91.7All 1 Year Olds 684 586 85.7 659 563 85.4 25 23 92.0
2 First Nations 75 34 45.3 72 34 47.2 3 0 0.0Non-First Nations 620 482 77.7 577 467 80.9 43 15 34.9All 2 Year Olds 695 516 74.2 649 501 77.2 46 15 32.6
7 First Nations 75 23 30.7 66 22 33.3 9 1 11.1Non-First Nations 763 623 81.7 646 575 89.0 117 48 41.0All 7 Year Olds 838 646 77.1 712 597 83.8 126 49 38.9
11 First Nations 89 54 60.7 71 46 64.8 18 8 44.4Non-First Nations 906 727 80.2 766 665 86.8 140 62 44.3All 11 Year Olds 995 781 78.5 837 711 84.9 158 70 44.3
17 First Nations 71 11 15.5 56 11 19.6 15 0 0.0Non-First Nations 1,027 640 62.3 837 590 70.5 190 50 26.3All 17 Year Olds 1,098 651 59.3 893 601 67.3 205 50 24.4
60 - Parkland
1 First Nations 91 57 62.6 91 57 62.6 0 0 0.0Non-First Nations 398 374 94.0 381 354 92.9 17 20 117.6All 1 Year Olds 489 431 88.1 472 411 87.1 17 20 117.6
2 First Nations 88 58 65.9 86 58 67.4 2 0 0.0Non-First Nations 406 295 72.7 373 272 72.9 33 23 69.7All 2 Year Olds 494 353 71.5 459 330 71.9 35 23 65.7
7 First Nations 88 66 75.0 85 64 75.3 3 2 66.7Non-First Nations 468 372 79.5 394 335 85.0 74 37 50.0All 7 Year Olds 556 438 78.8 479 399 83.3 77 39 50.6
11 First Nations 102 83 81.4 90 79 87.8 12 4 33.3Non-First Nations 496 394 79.4 394 343 87.1 102 51 50.0All 11 Year Olds 598 477 79.8 484 422 87.2 114 55 48.2
17 First Nations 72 24 33.3 63 19 30.2 9 5 55.6Non-First Nations 579 412 71.2 456 353 77.4 123 59 48.0All 17 Year Olds 651 436 67.0 519 372 71.7 132 64 48.5
70 - Norman
1 First Nations 168 120 71.4 166 120 72.3 2 0 0.0Non-First Nations 250 201 80.4 244 197 80.7 6 4 66.7All 1 Year Olds 418 321 76.8 410 317 77.3 8 4 50.0
2 First Nations 177 87 49.2 172 87 50.6 5 0 0.0Non-First Nations 258 170 65.9 236 160 67.8 22 10 45.5All 2 Year Olds 435 257 59.1 408 247 60.5 27 10 37.0
7 First Nations 147 105 71.4 140 103 73.6 7 2 28.6Non-First Nations 281 221 78.6 234 198 84.6 47 23 48.9All 7 Year Olds 428 326 76.2 374 301 80.5 54 25 46.3
11 First Nations 139 100 71.9 128 94 73.4 11 6 54.5Non-First Nations 307 232 75.6 236 184 78.0 71 48 67.6All 11 Year Olds 446 332 74.4 364 278 76.4 82 54 65.9
17 First Nations 114 33 28.9 99 30 30.3 15 3 20.0Non-First Nations 315 190 60.3 218 151 69.3 97 39 40.2All 17 Year Olds 429 223 52.0 317 181 57.1 112 42 37.5

Manitoba Immunization Monitoring System Annual Report 200334
Childhood Immunization Coverage Report Based on Health Registration January 1 - December 31, 2003
Continuous Health Non-Continuous Health Registration Registration
Age No. of Children Rate per No. of Children Rate per No. of Children Rate perChildren Complete 100 Children Complete 100 Children Complete 100
for Age Children for Age Children for Age Children
80 - Burntwood
1 First Nations 710 413 58.2 708 413 58.3 2 0 0.0Non-First Nations 274 217 79.2 266 209 78.6 8 8 100.0All 1 Year Olds 984 630 64.0 974 622 63.9 10 8 80.0
2 First Nations 729 301 41.3 723 300 41.5 6 1 16.7Non-First Nations 312 202 64.7 285 194 68.1 27 8 29.6All 2 Year Olds 1,041 503 48.3 1,008 494 49.0 33 9 27.3
7 First Nations 657 284 43.2 647 281 43.4 10 3 30.0Non-First Nations 307 226 73.6 275 213 77.5 32 13 40.6All 7 Year Olds 964 510 52.9 922 494 53.6 42 16 38.1
11 First Nations 716 229 32.0 697 225 32.3 19 4 21.1Non-First Nations 309 188 60.8 263 169 64.3 46 19 41.3All 11 Year Olds 1,025 417 40.7 960 394 41.0 65 23 35.4
17 First Nations 566 99 17.5 542 96 17.7 24 3 12.5Non-First Nations 298 144 48.3 227 117 51.5 71 27 38.0All 17 Year Olds 864 243 28.1 769 213 27.7 95 30 31.6
90 - Churchill
1 First Nations 5 3 60.0 5 3 60.0 0 0 0.0Non-First Nations 17 16 94.1 15 14 93.3 2 2 100.0All 1 Year Olds 22 19 86.4 20 17 85.0 2 2 100.0
2 First Nations 4 4 100.0 4 4 100.0 0 0 0.0Non-First Nations 17 10 58.8 14 10 71.4 3 0 0.0All 2 Year Olds 21 14 66.7 18 14 77.8 3 0 0.0
7 First Nations 2 2 100.0 2 2 100.0 0 0 0.0Non-First Nations 16 16 100.0 13 15 115.0 3 1 33.3All 7 Year Olds 18 18 100.0 15 17 113.0 3 1 33.3
11 First Nations 3 2 66.7 3 2 66.7 0 0 0.0Non-First Nations 16 8 50.0 11 5 45.5 5 3 60.0All 11 Year Olds 19 10 52.6 14 7 50.0 5 3 60.0
17 First Nations 4 2 50.0 3 2 66.7 1 0 0.0Non-First Nations 10 2 20.0 4 0 0.0 6 2 33.3All 17 Year Olds 14 4 28.6 7 2 28.6 7 2 28.6

Manitoba Immunization Monitoring System Annual Report 2003 35
5. Childhood Vaccine Doses Administered, by Provider Type, byProvider Location, January 1, 2003 – December 31, 2003■ Manitoba
■ By RHA
Notes:
These data reflect doses administered by each provider type, based on the provider’s RHA. They cannot be used to calculateimmunization coverage rates, as the providers do not have a particular population denominator to which they are assigned.
The dates for immunization service are from January 1, 2003 – December 31, 2003, as entered into MIMS by April 16, 2004.
“First Nations/Tribal” provider indicates the provider type was entered into MIMS as First Nations; it does not reflect that theclient has been identified as First Nations.
Childhood Doses Administered Report by Provider Location January 1 - December 31, 2003
Provider DaPTP DaPTP/ Td MMR HBV HEPA/B V TdaP M P Total HIB Doses
MANITOBA
Public Health NurseFirst Nations 910 3,765 364 2,006 2,639 143 3 83 0 0Non-First Nations 3,148 9,567 7,708 6,112 34,309 587 42 1,297 49 158
Total for Public Health Nurse 4,058 13,332 8,072 8,118 36,948 730 45 1,380 49 158 72,890
Percentage of Doses Administered 48.8%
PhysicianFirst Nations 183 1,487 32 573 40 2 9 0 5 17Non-First Nations 6,977 32,492 1,022 16,136 1,950 819 1,921 93 1,676 4,301
Total for Physician 7,160 33,979 1,054 16,709 1,990 821 1,930 93 1,681 4,318 69,735
Percentage of Doses Administered 46.7%
First Nation/Tribal CouncilFirst Nations 223 1,201 57 529 917 0 0 33 0 0Non-First Nations 51 296 13 118 166 0 0 4 0 0
Total for First Nation/Tribal Council 274 1,497 70 647 1,083 0 0 37 0 0 3,608
Percentage of Doses Administered 2.4%
OtherFirst Nations 81 350 120 194 104 0 1 3 0 0Non-First Nations 188 648 494 360 389 30 16 18 7 30
Total for Other 269 998 614 554 493 30 17 21 7 30 3,033
Percentage of Doses Administered 2.0%
Total for MANITOBA 11,761 49,806 9,810 26,028 40,514 1,581 1,992 1,531 1,737 4,506 149,266
10 - Winnipeg
Public Health NurseFirst Nations 11 4 53 27 628 0 0 0 0 0Non-First Nations 115 63 4,318 234 18,529 182 2 18 0 0
Total for Public Health Nurse 126 67 4,371 261 19,157 182 2 18 0 0 24,184
Percentage of Doses Administered 28.5%
PhysicianFirst Nations 147 1,172 27 458 38 2 7 0 3 12Non-First Nations 5,714 26,507 908 13,349 1,893 768 1,761 89 1,600 3,952
Total for Physician 5,861 27,679 935 13,807 1,931 770 1,768 89 1,603 3,964 58,407
Percentage of Doses Administered 68.8%
OtherFirst Nations 78 324 74 174 94 0 1 3 0 0Non-First Nations 144 502 305 255 298 14 10 15 0 13Total for Other 222 826 379 429 392 14 11 18 0 13 2,304
Percentage of Doses Administered 2.7%
Total for 10 - Winnipeg 6,209 28,572 5,685 14,497 21,480 966 1,781 125 1,603 3,977 84,895
NOTE: ‘Other’ providers include facilities, primary care providers, private health care providers, pharmacies, and other unknown providers.
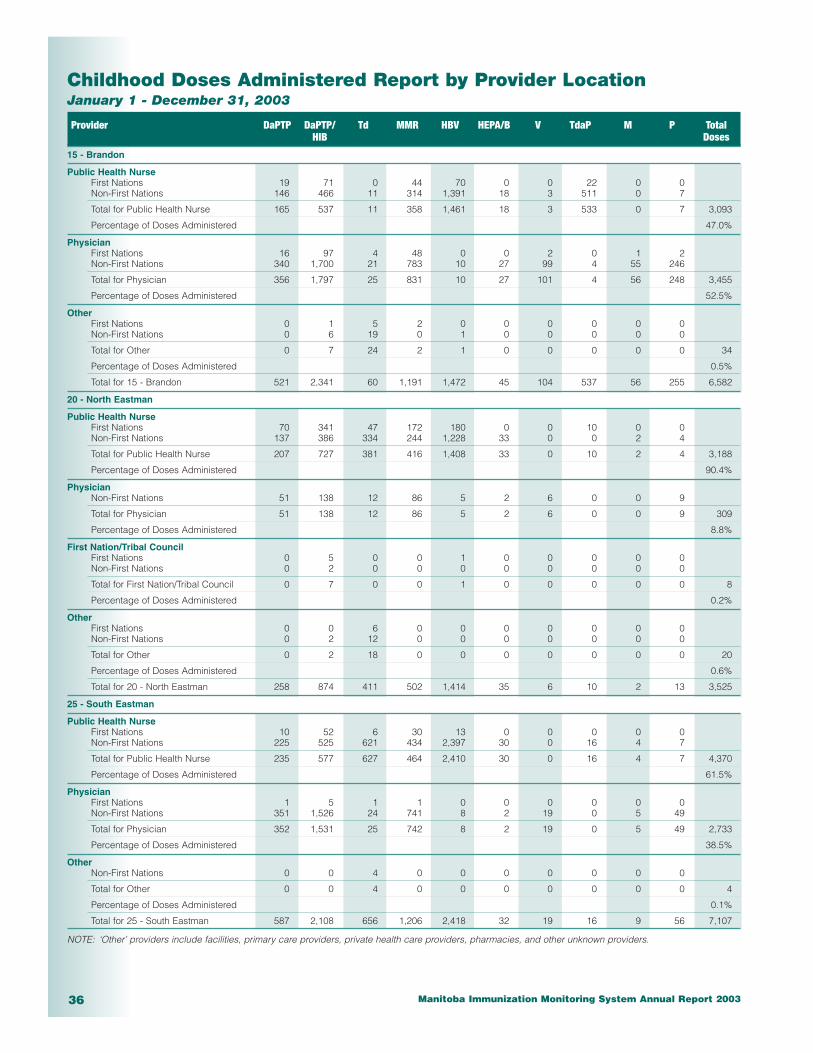
Manitoba Immunization Monitoring System Annual Report 200336
Childhood Doses Administered Report by Provider Location January 1 - December 31, 2003
Provider DaPTP DaPTP/ Td MMR HBV HEPA/B V TdaP M P Total HIB Doses
15 - Brandon
Public Health NurseFirst Nations 19 71 0 44 70 0 0 22 0 0Non-First Nations 146 466 11 314 1,391 18 3 511 0 7
Total for Public Health Nurse 165 537 11 358 1,461 18 3 533 0 7 3,093
Percentage of Doses Administered 47.0%
PhysicianFirst Nations 16 97 4 48 0 0 2 0 1 2Non-First Nations 340 1,700 21 783 10 27 99 4 55 246
Total for Physician 356 1,797 25 831 10 27 101 4 56 248 3,455
Percentage of Doses Administered 52.5%
OtherFirst Nations 0 1 5 2 0 0 0 0 0 0Non-First Nations 0 6 19 0 1 0 0 0 0 0
Total for Other 0 7 24 2 1 0 0 0 0 0 34
Percentage of Doses Administered 0.5%
Total for 15 - Brandon 521 2,341 60 1,191 1,472 45 104 537 56 255 6,582
20 - North Eastman
Public Health NurseFirst Nations 70 341 47 172 180 0 0 10 0 0Non-First Nations 137 386 334 244 1,228 33 0 0 2 4
Total for Public Health Nurse 207 727 381 416 1,408 33 0 10 2 4 3,188
Percentage of Doses Administered 90.4%
PhysicianNon-First Nations 51 138 12 86 5 2 6 0 0 9
Total for Physician 51 138 12 86 5 2 6 0 0 9 309
Percentage of Doses Administered 8.8%
First Nation/Tribal CouncilFirst Nations 0 5 0 0 1 0 0 0 0 0Non-First Nations 0 2 0 0 0 0 0 0 0 0
Total for First Nation/Tribal Council 0 7 0 0 1 0 0 0 0 0 8
Percentage of Doses Administered 0.2%
OtherFirst Nations 0 0 6 0 0 0 0 0 0 0Non-First Nations 0 2 12 0 0 0 0 0 0 0
Total for Other 0 2 18 0 0 0 0 0 0 0 20
Percentage of Doses Administered 0.6%
Total for 20 - North Eastman 258 874 411 502 1,414 35 6 10 2 13 3,525
25 - South Eastman
Public Health NurseFirst Nations 10 52 6 30 13 0 0 0 0 0Non-First Nations 225 525 621 434 2,397 30 0 16 4 7
Total for Public Health Nurse 235 577 627 464 2,410 30 0 16 4 7 4,370
Percentage of Doses Administered 61.5%
PhysicianFirst Nations 1 5 1 1 0 0 0 0 0 0Non-First Nations 351 1,526 24 741 8 2 19 0 5 49
Total for Physician 352 1,531 25 742 8 2 19 0 5 49 2,733
Percentage of Doses Administered 38.5%
OtherNon-First Nations 0 0 4 0 0 0 0 0 0 0
Total for Other 0 0 4 0 0 0 0 0 0 0 4
Percentage of Doses Administered 0.1%
Total for 25 - South Eastman 587 2,108 656 1,206 2,418 32 19 16 9 56 7,107
NOTE: ‘Other’ providers include facilities, primary care providers, private health care providers, pharmacies, and other unknown providers.
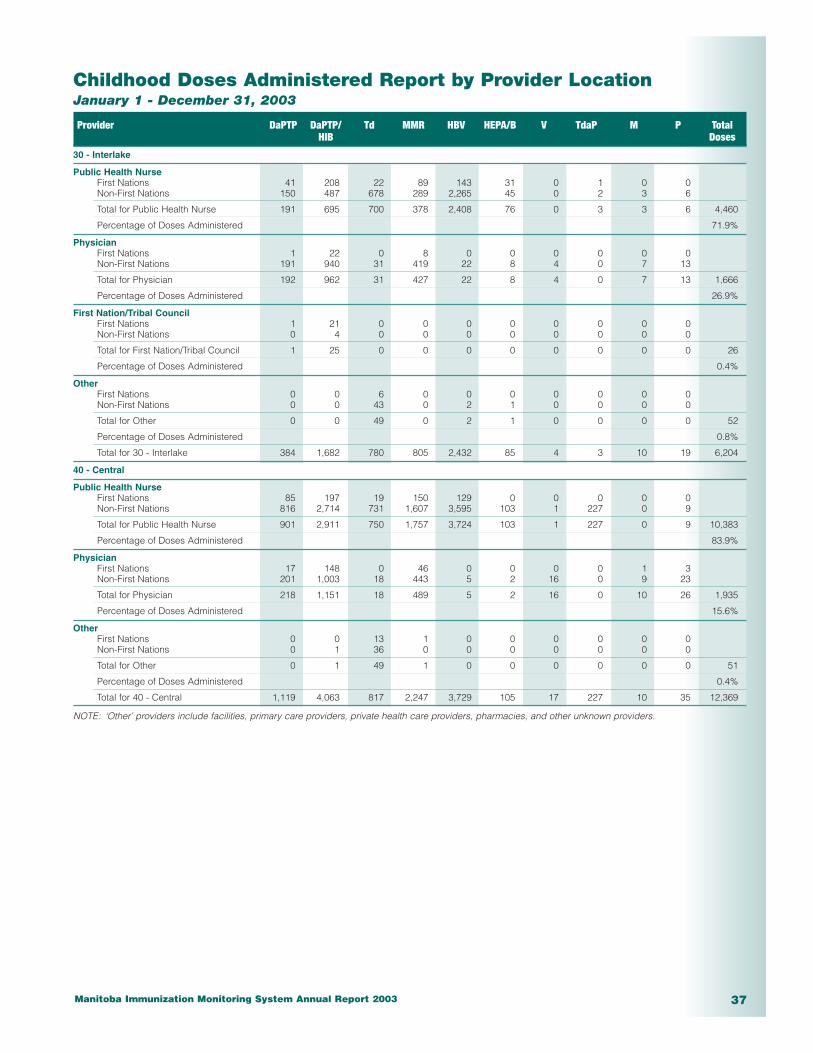
Manitoba Immunization Monitoring System Annual Report 2003 37
Childhood Doses Administered Report by Provider Location January 1 - December 31, 2003
Provider DaPTP DaPTP/ Td MMR HBV HEPA/B V TdaP M P Total HIB Doses
30 - Interlake
Public Health NurseFirst Nations 41 208 22 89 143 31 0 1 0 0Non-First Nations 150 487 678 289 2,265 45 0 2 3 6
Total for Public Health Nurse 191 695 700 378 2,408 76 0 3 3 6 4,460
Percentage of Doses Administered 71.9%
PhysicianFirst Nations 1 22 0 8 0 0 0 0 0 0Non-First Nations 191 940 31 419 22 8 4 0 7 13
Total for Physician 192 962 31 427 22 8 4 0 7 13 1,666
Percentage of Doses Administered 26.9%
First Nation/Tribal CouncilFirst Nations 1 21 0 0 0 0 0 0 0 0Non-First Nations 0 4 0 0 0 0 0 0 0 0
Total for First Nation/Tribal Council 1 25 0 0 0 0 0 0 0 0 26
Percentage of Doses Administered 0.4%
OtherFirst Nations 0 0 6 0 0 0 0 0 0 0Non-First Nations 0 0 43 0 2 1 0 0 0 0
Total for Other 0 0 49 0 2 1 0 0 0 0 52
Percentage of Doses Administered 0.8%
Total for 30 - Interlake 384 1,682 780 805 2,432 85 4 3 10 19 6,204
40 - Central
Public Health NurseFirst Nations 85 197 19 150 129 0 0 0 0 0Non-First Nations 816 2,714 731 1,607 3,595 103 1 227 0 9
Total for Public Health Nurse 901 2,911 750 1,757 3,724 103 1 227 0 9 10,383
Percentage of Doses Administered 83.9%
PhysicianFirst Nations 17 148 0 46 0 0 0 0 1 3Non-First Nations 201 1,003 18 443 5 2 16 0 9 23
Total for Physician 218 1,151 18 489 5 2 16 0 10 26 1,935
Percentage of Doses Administered 15.6%
OtherFirst Nations 0 0 13 1 0 0 0 0 0 0Non-First Nations 0 1 36 0 0 0 0 0 0 0
Total for Other 0 1 49 1 0 0 0 0 0 0 51
Percentage of Doses Administered 0.4%
Total for 40 - Central 1,119 4,063 817 2,247 3,729 105 17 227 10 35 12,369
NOTE: ‘Other’ providers include facilities, primary care providers, private health care providers, pharmacies, and other unknown providers.

Manitoba Immunization Monitoring System Annual Report 200338
Childhood Doses Administered Report by Provider Location January 1 - December 31, 2003
Provider DaPTP DaPTP/ Td MMR HBV HEPA/B V TdaP M P Total HIB Doses
45 - Assiniboine
Public Health NurseFirst Nations 16 88 16 50 97 0 1 9 0 0Non-First Nations 619 1,672 270 1,071 2,100 67 20 444 10 70
Total for Public Health Nurse 635 1,760 286 1,121 2,197 67 21 453 10 70 6,620
Percentageof Doses Administered 91.8%
PhysicianNon-First Nations 68 318 5 156 4 3 5 0 0 3
Total for Physician 68 318 5 156 4 3 5 0 0 3 562
Percentage of Doses Administered 7.8%
First Nation/Tribal CouncilFirst Nations 0 4 0 0 2 0 0 0 0 0
Total for First Nation/Tribal Council 0 4 0 0 2 0 0 0 0 0 6
Percentage of Doses Administered 0.1%
OtherFirst Nations 1 0 0 0 0 0 0 0 0 0Non-First Nations 1 0 19 0 0 0 0 0 0 0
Total for Other 2 0 19 0 0 0 0 0 0 0 21
Percentage of Doses Administered 0.3%
Total for 45 - Assiniboine 705 2,082 310 1,277 2,203 70 26 453 10 73 7,209
60 - Parkland
Public Health NurseFirst Nations 73 323 46 165 187 0 0 0 0 0Non-First Nations 364 1,166 431 690 1,176 14 7 12 1 13
Total for Public Health Nurse 437 1,489 477 855 1,363 14 7 12 1 13 4,668
Percentage of Doses Administered 88.3%
PhysicianFirst Nations 0 33 0 9 0 0 0 0 0 0Non-First Nations 57 337 3 149 0 2 2 0 0 3
Total for Physician 57 370 3 158 0 2 2 0 0 3 595
Percentage of Doses Administered 11.3%
First Nation/Tribal CouncilFirst Nations 0 0 0 1 1 0 0 0 0 0Non-First Nations 0 1 0 1 0 0 0 1 0 0
Total for First Nation/Tribal Council 0 1 0 2 1 0 0 1 0 0 5
Percentage of Doses Administered 0.1%
OtherFirst Nations 0 0 4 0 0 0 0 0 0 0Non-First Nations 0 0 12 1 0 0 0 0 0 0
Total for Other 0 0 16 1 0 0 0 0 0 0 17
Percentage of Doses Administered 0.3%
Total for 60 - Parkland 494 1,860 496 1,016 1,364 16 9 13 1 16 5,285
NOTE: ‘Other’ providers include facilities, primary care providers, private health care providers, pharmacies, and other unknown providers.

Manitoba Immunization Monitoring System Annual Report 2003 39
Childhood Doses Administered Report by Provider Location January 1 - December 31, 2003
Provider DaPTP DaPTP/ Td MMR HBV HEPA/B V TdaP M P Total HIB Doses
70 - Norman
Public Health NurseFirst Nations 119 602 52 309 333 3 0 0 0 0Non-First Nations 250 978 218 521 833 34 1 1 1 11
Total for Public Health Nurse 369 1,580 270 830 1,166 37 1 1 1 11 4,266
Percentage of Doses Administered 99.2%
First Nation/Tribal CouncilFirst Nations 2 1 0 5 1 0 0 0 0 0Non-First Nations 0 1 0 0 0 0 0 0 0 0
Total for First Nation/Tribal Council 2 2 0 5 1 0 0 0 0 0 10
Percentage of Doses Administered 0.2%
OtherFirst Nations 0 1 7 1 0 0 0 0 0 0Non-First Nations 1 0 8 2 1 0 1 0 0 3
Total for Other 1 1 15 3 1 0 1 0 0 3 25
Percentage of Doses Administered 0.6%
Total for 70 - Norman 372 1,583 285 838 1,168 37 2 1 1 14 4,301
80 - Burntwood
Public Health NurseFirst Nations 463 1,853 101 963 850 109 2 41 0 0Non-First Nations 283 958 72 559 693 55 1 65 0 2
Total for Public Health Nurse 746 2,811 173 1,522 1,543 164 3 106 0 2 7,070
Percentage of Doses Administered 98.4%
PhysicianFirst Nations 1 10 0 3 2 0 0 0 0 0Non-First Nations 4 21 0 9 1 5 9 0 0 0
Total for Physician 5 31 0 12 3 5 9 0 0 0 65
Percentage of Doses Administered 0.9%
First Nation/Tribal CouncilFirst Nations 0 3 0 1 2 0 0 0 0 0
Total for First Nation/Tribal Council 0 3 0 1 2 0 0 0 0 0 6
Percentage of Doses Administered 0.1%
OtherFirst Nations 0 0 3 8 8 0 0 0 0 0Non-First Nations 0 0 15 2 4 3 1 0 1 2
Total for Other 0 0 18 10 12 3 1 0 1 2 47
Percentage of Doses Administered 0.7%
Total for 80 - Burntwood 751 2,845 191 1,545 1,560 172 13 106 1 4 7,188
90 - Churchill
Public Health NurseFirst Nations 2 19 2 6 8 0 0 0 0 0Non-First Nations 13 45 5 29 30 4 0 0 0 0
Total for Public Health Nurse 15 64 7 35 38 4 0 0 0 0 163
Percentage of Doses Administered 100.0%
Total for 90 - Churchill 15 64 7 35 38 4 0 0 0 0 163
NOTE: ‘Other’ providers include facilities, primary care providers, private health care providers, pharmacies, and other unknown providers.

Manitoba Immunization Monitoring System Annual Report 200340
Childhood Doses Administered Report by Provider Location January 1 - December 31, 2003
Provider DaPTP DaPTP/ Td MMR HBV HEPA/B V TdaP M P Total HIB Doses
95 - Unknown
Public Health NurseFirst Nations 1 0 0 1 1 0 0 0 0 0Non-First Nations 0 2 0 1 2 0 0 1 0 0
Total for Public Health Nurse 1 2 0 2 3 0 0 1 0 0 9
Percentage of Doses Administered 0.2%
PhysicianNon-First Nations 0 2 0 1 2 0 0 0 0 3
Total for Physician 0 2 0 1 2 0 0 0 0 3 8
Percentage of Doses Administered 0.2%
First Nation/Tribal CouncilFirst Nations 220 1,167 57 522 910 0 0 33 0 0Non-First Nations 51 288 13 117 166 0 0 3 0 0
Total for First Nation/Tribal Council 271 1,455 70 639 1,076 0 0 36 0 0 3,547
Percentage of Doses Administered 95.8%
OtherFirst Nations 2 19 1 6 0 0 0 0 0 0Non-First Nations 17 44 1 34 10 0 0 2 0 1
Total for Other 19 63 2 40 10 0 0 2 0 1 137
Percentage of Doses Administered 3.7%
Total for 95 - Unknown 291 1,522 72 682 1,091 0 0 39 0 4 3,701
99 - Non-Manitoba
Public Health NurseFirst Nations 0 7 0 0 0 0 0 0 0 0Non-First Nations 30 105 19 119 70 2 7 0 28 29
Total for Public Health Nurse 30 112 19 119 70 2 7 0 28 29 416
Percentage of Doses Administered 56.4%
OtherFirst Nations 0 5 1 2 2 0 0 0 0 0Non-First Nations 25 93 20 66 73 12 4 1 6 11
Total for Other 25 98 21 68 75 12 4 1 6 11 321
Percentage of Doses Administered 43.6%
Total for 99 - Non-Manitoba 55 210 40 187 145 14 11 1 34 40 737
NOTE: ‘Other’ providers include facilities, primary care providers, private health care providers, pharmacies, and other unknown providers.

Manitoba Immunization Monitoring System Annual Report 2003 41
6. Influenza/Pneumococcal Immunization Coverage Reports, January 1, 2003 – December 31, 2003
6.1 By Patient Location
■ Manitoba
■ By RHA
Notes:
The population is selected using the client’s address.
The “< 65 high risk” population estimate (i.e., denominator) is based on a calculation of 11 per cent of the total under 65 pop-ulation. The same estimate is used for both influenza and pneumococcal high risk groups, although the target population is notidentical. The “<65 high risk” numerator data are those doses identified as such via public health data entry in MIMS. Thesesame doses are also included in the “all <65” doses and coverage calculations.
Influenza coverage reflects doses administered in the 2003 calendar year, data entered by April 16, 2004. Pneumococcal (2003)reflects doses administered in the 2003 calendar year, while pneumococcal (cumulative) reflects doses administered to clientsfrom all previous years and including 2003.
Rate per 100 is the calculated coverage rate.
Influenza/Pneumococcal Immunization Coverage Report by FirstNations StatusJanuary 1 - December 31, 2003
Influenza Pneumococcal (2003) Pneumococcal (Cumulative)65+ <65 All <65 65+ <65 All <65 65+ <65 All <65
High Risk High Risk High Risk
Patient RHA: MANITOBA
Non-First NationsCount 104,768 14,535 86,019 36,032 2,306 8,674 94,902 3,637 23,682Population 154,052 102,301 930,232 154,052 102,301 930,232 154,052 102,301 930,232Rate per 100 68.0 14.2 9.2 23.4 2.3 0.9 61.6 3.6 2.5
First NationsCount 1,038 2,754 5,144 335 401 512 800 619 1,422Population 2,513 7,996 72,987 2,513 7,996 72,987 2,513 7,996 72,987Rate per 100 41.3 34.4 7.0 13.3 5.0 0.7 31.8 7.7 1.9
TotalCount 105,806 17,289 91,163 36,367 2,707 9,186 95,702 4,256 25,104Population 156,565 110,297 1,003,219 156,565 110,297 1,003,219 156,565 110,297 1,003,219Rate per 100 67.6 15.7 9.1 23.2 2.5 0.9 61.1 3.9 2.5
Patient RHA: 10 - Winnipeg
Non-First NationsCount 62,793 4,928 50,233 22,492 926 5,564 57,164 1,496 14,022Population 90,129 60,695 551,813 90,129 60,695 551,813 90,129 60,695 551,813Rate per 100 69.7 8.1 9.1 25.0 1.5 1.0 63.4 2.5 2.5
First NationsCount 133 449 793 45 64 81 143 117 363Population 372 1,784 16,265 372 1,784 16,265 372 1,784 16,265Rate per 100 35.8 25.2 4.9 12.1 3.6 0.5 38.4 6.6 2.2
TotalCount 62,926 5,377 51,026 22,537 990 5,645 57,307 1,613 14,385Population 90,501 62,479 568,078 90,501 62,479 568,078 90,501 62,479 568,078Rate per 100 69.5 8.6 9.0 24.9 1.6 1.0 63.3 2.6 2.5
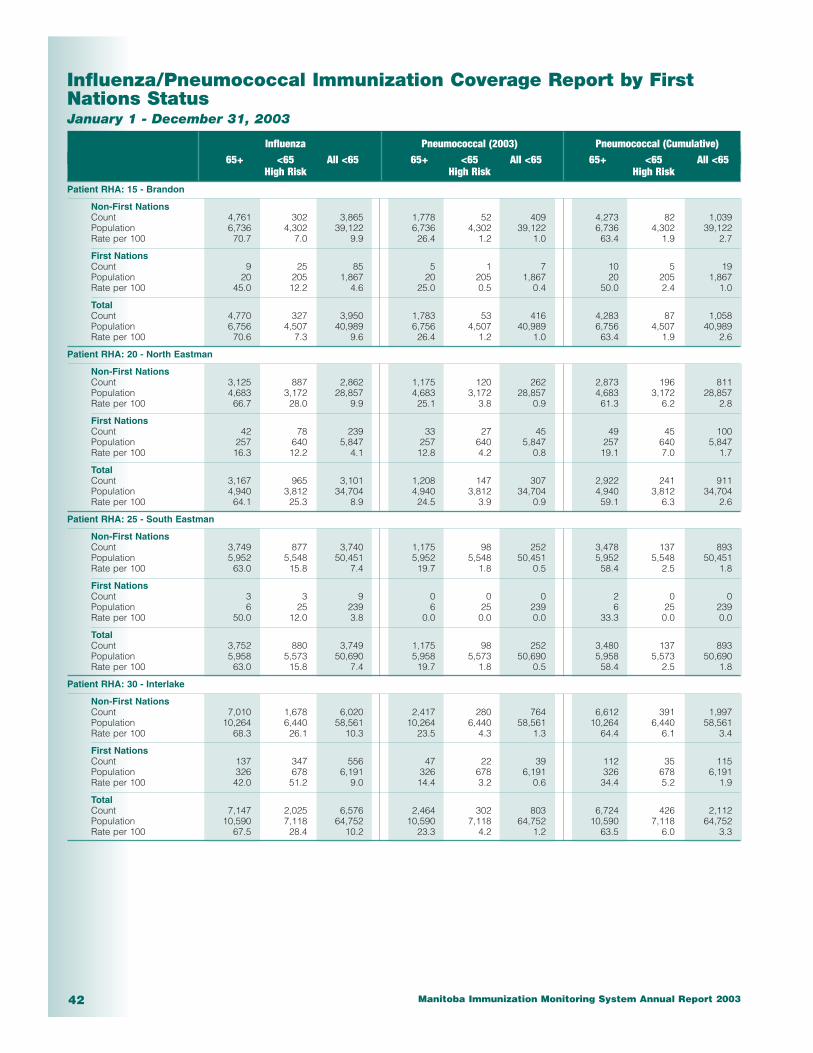
Manitoba Immunization Monitoring System Annual Report 200342
Influenza/Pneumococcal Immunization Coverage Report by FirstNations StatusJanuary 1 - December 31, 2003
Influenza Pneumococcal (2003) Pneumococcal (Cumulative)65+ <65 All <65 65+ <65 All <65 65+ <65 All <65
High Risk High Risk High Risk
Patient RHA: 15 - Brandon
Non-First NationsCount 4,761 302 3,865 1,778 52 409 4,273 82 1,039Population 6,736 4,302 39,122 6,736 4,302 39,122 6,736 4,302 39,122Rate per 100 70.7 7.0 9.9 26.4 1.2 1.0 63.4 1.9 2.7
First NationsCount 9 25 85 5 1 7 10 5 19Population 20 205 1,867 20 205 1,867 20 205 1,867Rate per 100 45.0 12.2 4.6 25.0 0.5 0.4 50.0 2.4 1.0
TotalCount 4,770 327 3,950 1,783 53 416 4,283 87 1,058Population 6,756 4,507 40,989 6,756 4,507 40,989 6,756 4,507 40,989Rate per 100 70.6 7.3 9.6 26.4 1.2 1.0 63.4 1.9 2.6
Patient RHA: 20 - North Eastman
Non-First NationsCount 3,125 887 2,862 1,175 120 262 2,873 196 811Population 4,683 3,172 28,857 4,683 3,172 28,857 4,683 3,172 28,857Rate per 100 66.7 28.0 9.9 25.1 3.8 0.9 61.3 6.2 2.8
First NationsCount 42 78 239 33 27 45 49 45 100Population 257 640 5,847 257 640 5,847 257 640 5,847Rate per 100 16.3 12.2 4.1 12.8 4.2 0.8 19.1 7.0 1.7
TotalCount 3,167 965 3,101 1,208 147 307 2,922 241 911Population 4,940 3,812 34,704 4,940 3,812 34,704 4,940 3,812 34,704Rate per 100 64.1 25.3 8.9 24.5 3.9 0.9 59.1 6.3 2.6
Patient RHA: 25 - South Eastman
Non-First NationsCount 3,749 877 3,740 1,175 98 252 3,478 137 893Population 5,952 5,548 50,451 5,952 5,548 50,451 5,952 5,548 50,451Rate per 100 63.0 15.8 7.4 19.7 1.8 0.5 58.4 2.5 1.8
First NationsCount 3 3 9 0 0 0 2 0 0Population 6 25 239 6 25 239 6 25 239Rate per 100 50.0 12.0 3.8 0.0 0.0 0.0 33.3 0.0 0.0
TotalCount 3,752 880 3,749 1,175 98 252 3,480 137 893Population 5,958 5,573 50,690 5,958 5,573 50,690 5,958 5,573 50,690Rate per 100 63.0 15.8 7.4 19.7 1.8 0.5 58.4 2.5 1.8
Patient RHA: 30 - Interlake
Non-First NationsCount 7,010 1,678 6,020 2,417 280 764 6,612 391 1,997Population 10,264 6,440 58,561 10,264 6,440 58,561 10,264 6,440 58,561Rate per 100 68.3 26.1 10.3 23.5 4.3 1.3 64.4 6.1 3.4
First NationsCount 137 347 556 47 22 39 112 35 115Population 326 678 6,191 326 678 6,191 326 678 6,191Rate per 100 42.0 51.2 9.0 14.4 3.2 0.6 34.4 5.2 1.9
TotalCount 7,147 2,025 6,576 2,464 302 803 6,724 426 2,112Population 10,590 7,118 64,752 10,590 7,118 64,752 10,590 7,118 64,752Rate per 100 67.5 28.4 10.2 23.3 4.2 1.2 63.5 6.0 3.3

Manitoba Immunization Monitoring System Annual Report 2003 43
Influenza/Pneumococcal Immunization Coverage Report by FirstNations StatusJanuary 1 - December 31, 2003
Influenza Pneumococcal (2003) Pneumococcal (Cumulative)65+ <65 All <65 65+ <65 All <65 65+ <65 All <65
High Risk High Risk High Risk
Patient RHA: 40 - Central
Non-First NationsCount 8,261 799 6,300 2,685 61 346 6,346 98 1,009Population 12,829 8,887 80,830 12,829 8,887 80,830 12,829 8,887 80,830Rate per 100 64.4 9.0 7.8 20.9 0.7 0.4 49.5 1.1 1.2
First NationsCount 52 35 179 20 6 37 44 8 76Population 144 542 4,974 144 542 4,974 144 542 4,974Rate per 100 36.1 6.5 3.6 13.9 1.1 0.7 30.6 1.5 1.5
TotalCount 8,313 834 6,479 2,705 67 383 6,390 106 1,085Population 12,973 9,429 85,804 12,973 9,429 85,804 12,973 9,429 85,804Rate per 100 64.1 8.8 7.6 20.9 0.7 0.4 49.3 1.1 1.3
Patient RHA: 45 - Assiniboine
Non-First NationsCount 8,623 2,021 5,823 2,399 318 465 7,901 557 1,809Population 13,186 5,870 53,390 13,186 5,870 53,390 13,186 5,870 53,390Rate per 100 65.4 34.4 10.9 18.2 5.4 0.9 59.9 9.5 3.4
First NationsCount 76 239 474 16 18 21 54 42 80Population 145 340 3,131 145 340 3,131 145 340 3,131Rate per 100 52.4 70.3 15.1 11.0 5.3 0.7 37.2 12.4 2.6
TotalCount 8,699 2,260 6,297 2,415 336 486 7,955 599 1,889Population 13,331 6,210 56,521 13,331 6,210 56,521 13,331 6,210 56,521Rate per 100 65.3 36.4 11.1 18.1 5.4 0.9 59.7 9.6 3.3
Patient RHA: 60 - Parkland
Non-First NationsCount 4,883 1,283 3,063 1,497 214 360 4,714 328 1,075Population 7,834 3,416 31,069 7,834 3,416 31,069 7,834 3,416 31,069Rate per 100 62.3 37.6 9.9 19.1 6.3 1.2 60.2 9.6 3.5
First NationsCount 72 185 329 21 40 45 54 62 127Population 111 393 3,595 111 393 3,595 111 393 3,595Rate per 100 64.9 47.1 9.2 18.9 10.2 1.3 48.6 15.8 3.5
TotalCount 4,955 1,468 3,392 1,518 254 405 4,768 390 1,202Population 7,945 3,809 34,664 7,945 3,809 34,664 7,945 3,809 34,664Rate per 100 62.4 38.5 9.8 19.1 6.7 1.2 60.0 10.2 3.5
Patient RHA: 70 - Norman
Non-First NationsCount 1,195 942 2,271 286 162 165 1,209 244 610Population 1,788 1,932 17,568 1,788 1,932 17,568 1,788 1,932 17,568Rate per 100 66.8 48.8 12.9 16.0 8.4 0.9 67.6 12.6 3.5
First NationsCount 64 222 445 17 25 27 67 49 129Population 160 589 5,367 160 589 5,367 160 589 5,367Rate per 100 40.0 37.7 8.3 10.6 4.2 0.5 41.9 8.3 2.4
TotalCount 1,259 1,164 2,716 303 187 192 1,276 293 739Population 1,948 2,521 22,935 1,948 2,521 22,935 1,948 2,521 22,935Rate per 100 64.6 46.2 11.8 15.6 7.4 0.8 65.5 11.6 3.2
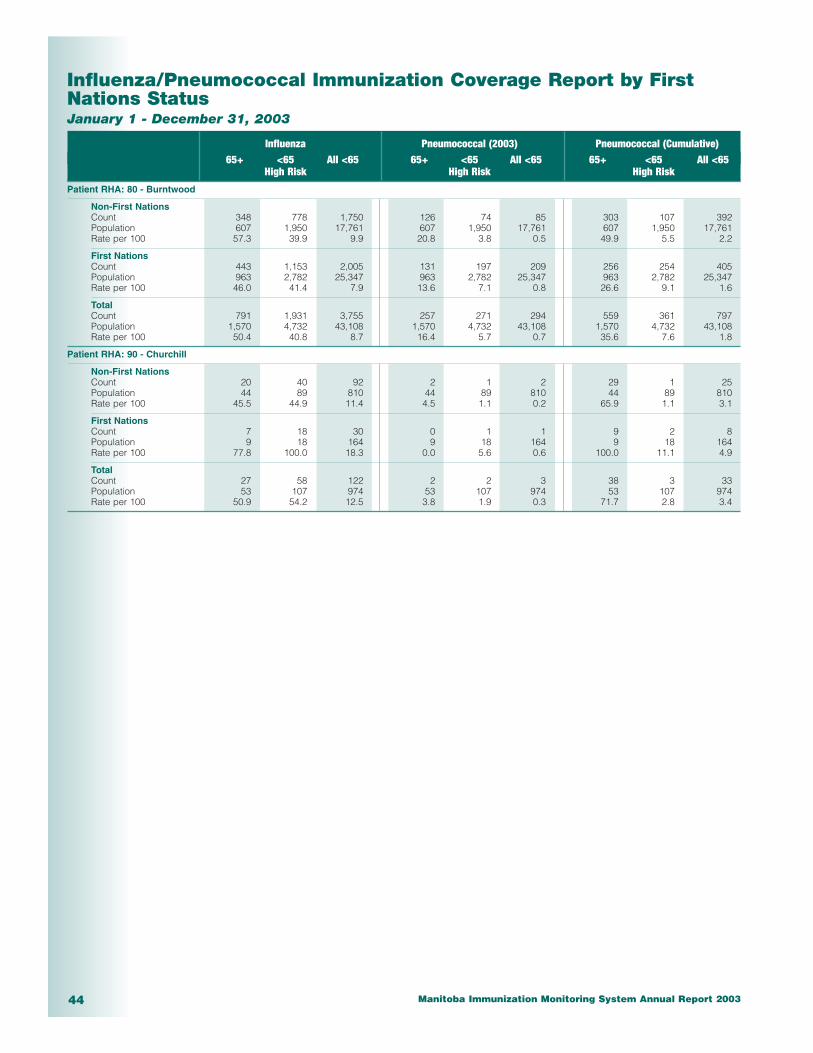
Manitoba Immunization Monitoring System Annual Report 200344
Influenza/Pneumococcal Immunization Coverage Report by FirstNations StatusJanuary 1 - December 31, 2003
Influenza Pneumococcal (2003) Pneumococcal (Cumulative)65+ <65 All <65 65+ <65 All <65 65+ <65 All <65
High Risk High Risk High Risk
Patient RHA: 80 - Burntwood
Non-First NationsCount 348 778 1,750 126 74 85 303 107 392Population 607 1,950 17,761 607 1,950 17,761 607 1,950 17,761Rate per 100 57.3 39.9 9.9 20.8 3.8 0.5 49.9 5.5 2.2
First NationsCount 443 1,153 2,005 131 197 209 256 254 405Population 963 2,782 25,347 963 2,782 25,347 963 2,782 25,347Rate per 100 46.0 41.4 7.9 13.6 7.1 0.8 26.6 9.1 1.6
TotalCount 791 1,931 3,755 257 271 294 559 361 797Population 1,570 4,732 43,108 1,570 4,732 43,108 1,570 4,732 43,108Rate per 100 50.4 40.8 8.7 16.4 5.7 0.7 35.6 7.6 1.8
Patient RHA: 90 - Churchill
Non-First NationsCount 20 40 92 2 1 2 29 1 25Population 44 89 810 44 89 810 44 89 810Rate per 100 45.5 44.9 11.4 4.5 1.1 0.2 65.9 1.1 3.1
First NationsCount 7 18 30 0 1 1 9 2 8Population 9 18 164 9 18 164 9 18 164Rate per 100 77.8 100.0 18.3 0.0 5.6 0.6 100.0 11.1 4.9
TotalCount 27 58 122 2 2 3 38 3 33Population 53 107 974 53 107 974 53 107 974Rate per 100 50.9 54.2 12.5 3.8 1.9 0.3 71.7 2.8 3.4

Manitoba Immunization Monitoring System Annual Report 2003 45
7. Influenza Vaccine Doses Administered, by Provider Type■ Manitoba
■ By RHA
Notes:
These data reflect doses administered by each provider type, based on the provider’s RHA. They cannot be used to calculateimmunization coverage rates, as the providers do not have a particular population denominator to which they are assigned.
The dates for immunization service are from January 1, 2003 – December 31, 2003, as entered into MIMS by April 16, 2004.
“First Nations/Tribal” provider indicates the provider type was entered into MIMS as First Nations; it does not reflect that theclient has been identified as First Nations.
Influenza Vaccine Doses Administered Report by Provider Type andFirst Nations StatusJanuary 1 - December 31, 2003
Health Care High Risk Household No Reason No Risk Outbreak Total Worker Contact Immunization Doses
MANITOBA
PhysicianNon-First Nations Doses 47 226 45 105,098 154 0 105,570
% 0.0 0.1 0.0 52.9 0.1 0.0 53.1
First Nations Doses 0 7 1 646 6 0 660% 0.0 0.0 0.0 0.3 0.0 0.0 0.3
Physician - Total Doses 47 233 46 105,744 160 0 106,230% 0.0 0.1 0.0 53.2 0.1 0.0 53.5
Public Health NurseNon-First Nations Doses 7,281 42,271 7,009 2 853 2 57,418
% 3.7 21.3 3.5 0.0 0.4 0.0 28.9
First Nations Doses 137 918 280 0 91 0 1,426% 0.1 0.5 0.1 0.0 0.0 0.0 0.7
Public Health Nurse - Total Doses 7,418 43,189 7,289 2 944 2 58,844% 3.7 21.7 3.7 0.0 0.5 0.0 29.6
First Nation/TribalNon-First Nations Doses 113 468 175 0 68 0 824
% 0.1 0.2 0.1 0.0 0.0 0.0 0.4
First Nations Doses 353 2,287 623 0 284 0 3,547% 0.2 1.2 0.3 0.0 0.1 0.0 1.8
First Nation/Tribal - Total Doses 466 2,755 798 0 352 0 4,371% 0.2 1.4 0.4 0.0 0.2 0.0 2.2
OtherNon-First Nations Doses 11,189 10,081 1,329 0 6,089 2 28,690
% 5.6 5.1 0.7 0.0 3.1 0.0 14.4
First Nations Doses 79 444 41 0 24 0 588% 0.0 0.2 0.0 0.0 0.0 0.0 0.3
Other - Total Doses 11,268 10,525 1,370 0 6,113 2 29,278% 5.7 5.3 0.7 0.0 3.1 0.0 14.7
MANITOBA - Total Doses 19,199 56,702 9,503 105,746 7,569 4 198,723% 9.7 28.5 4.8 53.2 3.8 0.0 100.0
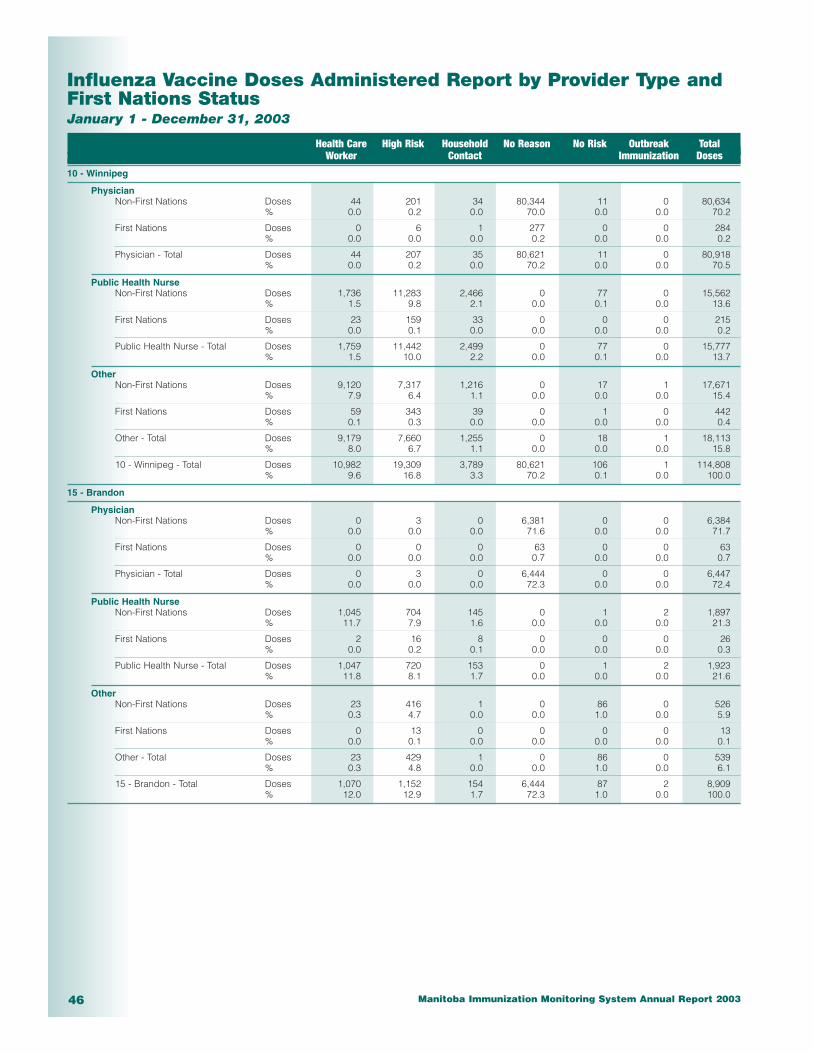
Manitoba Immunization Monitoring System Annual Report 200346
Influenza Vaccine Doses Administered Report by Provider Type andFirst Nations StatusJanuary 1 - December 31, 2003
Health Care High Risk Household No Reason No Risk Outbreak Total Worker Contact Immunization Doses
10 - Winnipeg
PhysicianNon-First Nations Doses 44 201 34 80,344 11 0 80,634
% 0.0 0.2 0.0 70.0 0.0 0.0 70.2
First Nations Doses 0 6 1 277 0 0 284% 0.0 0.0 0.0 0.2 0.0 0.0 0.2
Physician - Total Doses 44 207 35 80,621 11 0 80,918% 0.0 0.2 0.0 70.2 0.0 0.0 70.5
Public Health NurseNon-First Nations Doses 1,736 11,283 2,466 0 77 0 15,562
% 1.5 9.8 2.1 0.0 0.1 0.0 13.6
First Nations Doses 23 159 33 0 0 0 215% 0.0 0.1 0.0 0.0 0.0 0.0 0.2
Public Health Nurse - Total Doses 1,759 11,442 2,499 0 77 0 15,777% 1.5 10.0 2.2 0.0 0.1 0.0 13.7
OtherNon-First Nations Doses 9,120 7,317 1,216 0 17 1 17,671
% 7.9 6.4 1.1 0.0 0.0 0.0 15.4
First Nations Doses 59 343 39 0 1 0 442% 0.1 0.3 0.0 0.0 0.0 0.0 0.4
Other - Total Doses 9,179 7,660 1,255 0 18 1 18,113% 8.0 6.7 1.1 0.0 0.0 0.0 15.8
10 - Winnipeg - Total Doses 10,982 19,309 3,789 80,621 106 1 114,808% 9.6 16.8 3.3 70.2 0.1 0.0 100.0
15 - Brandon
PhysicianNon-First Nations Doses 0 3 0 6,381 0 0 6,384
% 0.0 0.0 0.0 71.6 0.0 0.0 71.7
First Nations Doses 0 0 0 63 0 0 63% 0.0 0.0 0.0 0.7 0.0 0.0 0.7
Physician - Total Doses 0 3 0 6,444 0 0 6,447% 0.0 0.0 0.0 72.3 0.0 0.0 72.4
Public Health NurseNon-First Nations Doses 1,045 704 145 0 1 2 1,897
% 11.7 7.9 1.6 0.0 0.0 0.0 21.3
First Nations Doses 2 16 8 0 0 0 26% 0.0 0.2 0.1 0.0 0.0 0.0 0.3
Public Health Nurse - Total Doses 1,047 720 153 0 1 2 1,923% 11.8 8.1 1.7 0.0 0.0 0.0 21.6
OtherNon-First Nations Doses 23 416 1 0 86 0 526
% 0.3 4.7 0.0 0.0 1.0 0.0 5.9
First Nations Doses 0 13 0 0 0 0 13% 0.0 0.1 0.0 0.0 0.0 0.0 0.1
Other - Total Doses 23 429 1 0 86 0 539% 0.3 4.8 0.0 0.0 1.0 0.0 6.1
15 - Brandon - Total Doses 1,070 1,152 154 6,444 87 2 8,909% 12.0 12.9 1.7 72.3 1.0 0.0 100.0
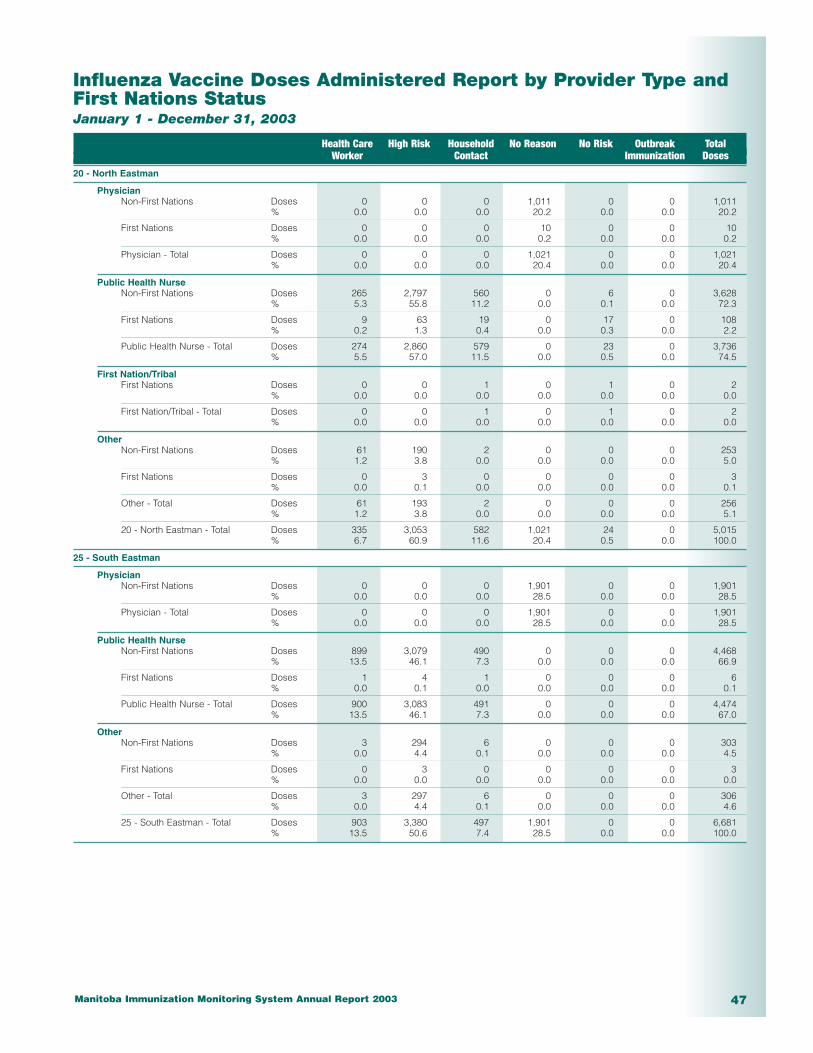
Manitoba Immunization Monitoring System Annual Report 2003 47
Influenza Vaccine Doses Administered Report by Provider Type andFirst Nations StatusJanuary 1 - December 31, 2003
Health Care High Risk Household No Reason No Risk Outbreak Total Worker Contact Immunization Doses
20 - North Eastman
PhysicianNon-First Nations Doses 0 0 0 1,011 0 0 1,011
% 0.0 0.0 0.0 20.2 0.0 0.0 20.2
First Nations Doses 0 0 0 10 0 0 10% 0.0 0.0 0.0 0.2 0.0 0.0 0.2
Physician - Total Doses 0 0 0 1,021 0 0 1,021% 0.0 0.0 0.0 20.4 0.0 0.0 20.4
Public Health NurseNon-First Nations Doses 265 2,797 560 0 6 0 3,628
% 5.3 55.8 11.2 0.0 0.1 0.0 72.3
First Nations Doses 9 63 19 0 17 0 108% 0.2 1.3 0.4 0.0 0.3 0.0 2.2
Public Health Nurse - Total Doses 274 2,860 579 0 23 0 3,736% 5.5 57.0 11.5 0.0 0.5 0.0 74.5
First Nation/TribalFirst Nations Doses 0 0 1 0 1 0 2
% 0.0 0.0 0.0 0.0 0.0 0.0 0.0
First Nation/Tribal - Total Doses 0 0 1 0 1 0 2% 0.0 0.0 0.0 0.0 0.0 0.0 0.0
OtherNon-First Nations Doses 61 190 2 0 0 0 253
% 1.2 3.8 0.0 0.0 0.0 0.0 5.0
First Nations Doses 0 3 0 0 0 0 3% 0.0 0.1 0.0 0.0 0.0 0.0 0.1
Other - Total Doses 61 193 2 0 0 0 256% 1.2 3.8 0.0 0.0 0.0 0.0 5.1
20 - North Eastman - Total Doses 335 3,053 582 1,021 24 0 5,015% 6.7 60.9 11.6 20.4 0.5 0.0 100.0
25 - South Eastman
PhysicianNon-First Nations Doses 0 0 0 1,901 0 0 1,901
% 0.0 0.0 0.0 28.5 0.0 0.0 28.5
Physician - Total Doses 0 0 0 1,901 0 0 1,901% 0.0 0.0 0.0 28.5 0.0 0.0 28.5
Public Health NurseNon-First Nations Doses 899 3,079 490 0 0 0 4,468
% 13.5 46.1 7.3 0.0 0.0 0.0 66.9
First Nations Doses 1 4 1 0 0 0 6% 0.0 0.1 0.0 0.0 0.0 0.0 0.1
Public Health Nurse - Total Doses 900 3,083 491 0 0 0 4,474% 13.5 46.1 7.3 0.0 0.0 0.0 67.0
OtherNon-First Nations Doses 3 294 6 0 0 0 303
% 0.0 4.4 0.1 0.0 0.0 0.0 4.5
First Nations Doses 0 3 0 0 0 0 3% 0.0 0.0 0.0 0.0 0.0 0.0 0.0
Other - Total Doses 3 297 6 0 0 0 306% 0.0 4.4 0.1 0.0 0.0 0.0 4.6
25 - South Eastman - Total Doses 903 3,380 497 1,901 0 0 6,681% 13.5 50.6 7.4 28.5 0.0 0.0 100.0

Manitoba Immunization Monitoring System Annual Report 200348
Influenza Vaccine Doses Administered Report by Provider Type andFirst Nations StatusJanuary 1 - December 31, 2003
Health Care High Risk Household No Reason No Risk Outbreak Total Worker Contact Immunization Doses
30 - Interlake
PhysicianNon-First Nations Doses 0 1 0 4,162 0 0 4,163
% 0.0 0.0 0.0 38.6 0.0 0.0 38.6
First Nations Doses 0 0 0 73 0 0 73% 0.0 0.0 0.0 0.7 0.0 0.0 0.7
Physician - Total Doses 0 1 0 4,235 0 0 4,236% 0.0 0.0 0.0 39.3 0.0 0.0 39.3
Public Health NurseNon-First Nations Doses 426 4,700 482 0 12 0 5,620
% 4.0 43.6 4.5 0.0 0.1 0.0 52.1
First Nations Doses 3 82 0 0 40 0 125% 0.0 0.8 0.0 0.0 0.4 0.0 1.2
Public Health Nurse - Total Doses 429 4,782 482 0 52 0 5,745% 4.0 44.4 4.5 0.0 0.5 0.0 53.3
First Nation/TribalNon-First Nations Doses 1 0 0 0 1 0 2
% 0.0 0.0 0.0 0.0 0.0 0.0 0.0
First Nations Doses 1 3 0 0 0 0 4% 0.0 0.0 0.0 0.0 0.0 0.0 0.0
First Nation/Tribal - Total Doses 2 3 0 0 1 0 6% 0.0 0.0 0.0 0.0 0.0 0.0 0.1
OtherNon-First Nations Doses 334 443 1 0 0 0 778
% 3.1 4.1 0.0 0.0 0.0 0.0 7.2
First Nations Doses 1 15 0 0 0 0 16% 0.0 0.1 0.0 0.0 0.0 0.0 0.1
Other - Total Doses 335 458 1 0 0 0 794% 3.1 4.2 0.0 0.0 0.0 0.0 7.4
30 - Interlake - Total Doses 766 5,244 483 4,235 53 0 10,781% 7.1 48.6 4.5 39.3 0.5 0.0 100.0
40 - Central
PhysicianNon-First Nations Doses 1 11 4 6,897 5 0 6,918
% 0.0 0.1 0.0 50.4 0.0 0.0 50.5
First Nations Doses 0 0 0 143 0 0 143% 0.0 0.0 0.0 1.0 0.0 0.0 1.0
Physician - Total Doses 1 11 4 7,040 5 0 7,061% 0.0 0.1 0.0 51.4 0.0 0.0 51.6
Public Health NurseNon-First Nations Doses 374 2,821 523 0 302 0 4,020
% 2.7 20.6 3.8 0.0 2.2 0.0 29.4
First Nations Doses 1 6 1 0 3 0 11% 0.0 0.0 0.0 0.0 0.0 0.0 0.1
Public Health Nurse - Total Doses 375 2,827 524 0 305 0 4,031% 2.7 20.6 3.8 0.0 2.2 0.0 29.4
First Nation/TribalNon-First Nations Doses 0 0 1 0 0 0 1
% 0.0 0.0 0.0 0.0 0.0 0.0 0.0
First Nation/Tribal - Total Doses 0 0 1 0 0 0 1% 0.0 0.0 0.0 0.0 0.0 0.0 0.0
OtherNon-First Nations Doses 1,250 1,280 13 0 1 0 2,544
% 9.1 9.3 0.1 0.0 0.0 0.0 18.6
First Nations Doses 10 45 0 0 0 0 55% 0.1 0.3 0.0 0.0 0.0 0.0 0.4
Other - Total Doses 1,260 1,325 13 0 1 0 2,599% 9.2 9.7 0.1 0.0 0.0 0.0 19.0
40 - Central - Total Doses 1,636 4,163 542 7,040 311 0 13,692% 11.9 30.4 4.0 51.4 2.3 0.0 100.0
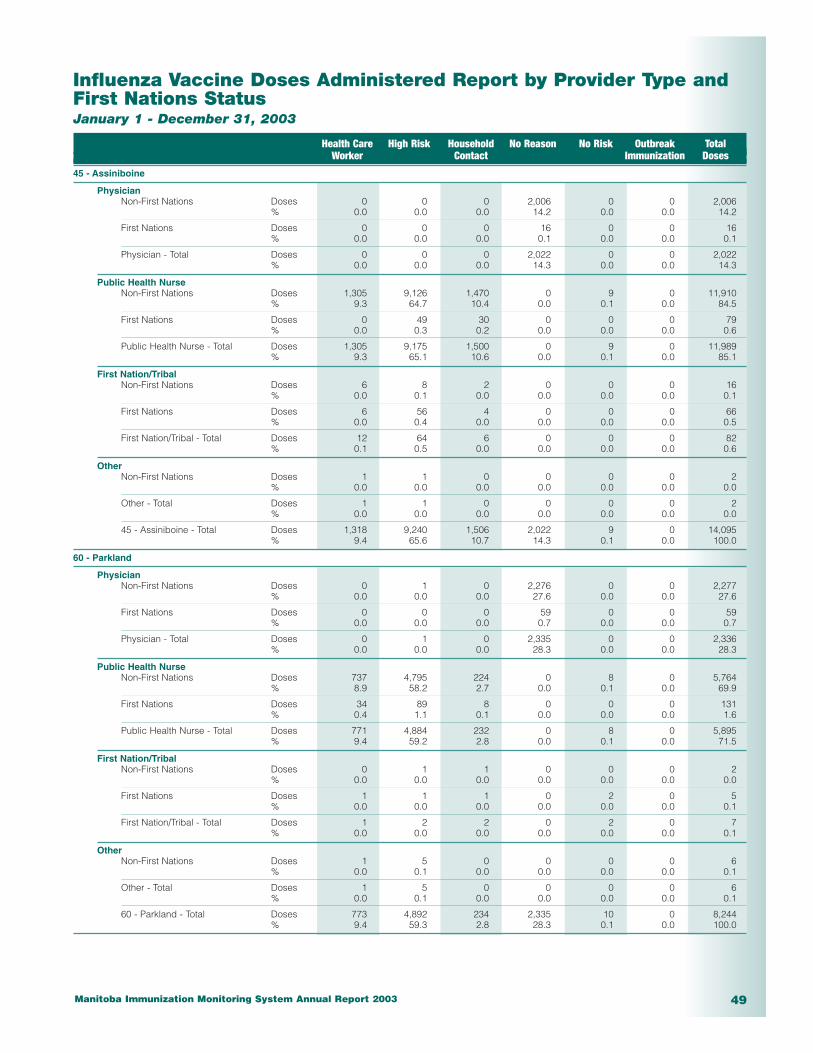
Manitoba Immunization Monitoring System Annual Report 2003 49
Influenza Vaccine Doses Administered Report by Provider Type andFirst Nations StatusJanuary 1 - December 31, 2003
Health Care High Risk Household No Reason No Risk Outbreak Total Worker Contact Immunization Doses
45 - Assiniboine
PhysicianNon-First Nations Doses 0 0 0 2,006 0 0 2,006
% 0.0 0.0 0.0 14.2 0.0 0.0 14.2
First Nations Doses 0 0 0 16 0 0 16% 0.0 0.0 0.0 0.1 0.0 0.0 0.1
Physician - Total Doses 0 0 0 2,022 0 0 2,022% 0.0 0.0 0.0 14.3 0.0 0.0 14.3
Public Health NurseNon-First Nations Doses 1,305 9,126 1,470 0 9 0 11,910
% 9.3 64.7 10.4 0.0 0.1 0.0 84.5
First Nations Doses 0 49 30 0 0 0 79% 0.0 0.3 0.2 0.0 0.0 0.0 0.6
Public Health Nurse - Total Doses 1,305 9,175 1,500 0 9 0 11,989% 9.3 65.1 10.6 0.0 0.1 0.0 85.1
First Nation/TribalNon-First Nations Doses 6 8 2 0 0 0 16
% 0.0 0.1 0.0 0.0 0.0 0.0 0.1
First Nations Doses 6 56 4 0 0 0 66% 0.0 0.4 0.0 0.0 0.0 0.0 0.5
First Nation/Tribal - Total Doses 12 64 6 0 0 0 82% 0.1 0.5 0.0 0.0 0.0 0.0 0.6
OtherNon-First Nations Doses 1 1 0 0 0 0 2
% 0.0 0.0 0.0 0.0 0.0 0.0 0.0
Other - Total Doses 1 1 0 0 0 0 2% 0.0 0.0 0.0 0.0 0.0 0.0 0.0
45 - Assiniboine - Total Doses 1,318 9,240 1,506 2,022 9 0 14,095% 9.4 65.6 10.7 14.3 0.1 0.0 100.0
60 - Parkland
PhysicianNon-First Nations Doses 0 1 0 2,276 0 0 2,277
% 0.0 0.0 0.0 27.6 0.0 0.0 27.6
First Nations Doses 0 0 0 59 0 0 59% 0.0 0.0 0.0 0.7 0.0 0.0 0.7
Physician - Total Doses 0 1 0 2,335 0 0 2,336% 0.0 0.0 0.0 28.3 0.0 0.0 28.3
Public Health NurseNon-First Nations Doses 737 4,795 224 0 8 0 5,764
% 8.9 58.2 2.7 0.0 0.1 0.0 69.9
First Nations Doses 34 89 8 0 0 0 131% 0.4 1.1 0.1 0.0 0.0 0.0 1.6
Public Health Nurse - Total Doses 771 4,884 232 0 8 0 5,895% 9.4 59.2 2.8 0.0 0.1 0.0 71.5
First Nation/TribalNon-First Nations Doses 0 1 1 0 0 0 2
% 0.0 0.0 0.0 0.0 0.0 0.0 0.0
First Nations Doses 1 1 1 0 2 0 5% 0.0 0.0 0.0 0.0 0.0 0.0 0.1
First Nation/Tribal - Total Doses 1 2 2 0 2 0 7% 0.0 0.0 0.0 0.0 0.0 0.0 0.1
OtherNon-First Nations Doses 1 5 0 0 0 0 6
% 0.0 0.1 0.0 0.0 0.0 0.0 0.1
Other - Total Doses 1 5 0 0 0 0 6% 0.0 0.1 0.0 0.0 0.0 0.0 0.1
60 - Parkland - Total Doses 773 4,892 234 2,335 10 0 8,244% 9.4 59.3 2.8 28.3 0.1 0.0 100.0

Manitoba Immunization Monitoring System Annual Report 200350
Influenza Vaccine Doses Administered Report by Provider Type andFirst Nations StatusJanuary 1 - December 31, 2003
Health Care High Risk Household No Reason No Risk Outbreak Total Worker Contact Immunization Doses
70 - Norman
PhysicianNon-First Nations Doses 2 9 7 31 129 0 178
% 0.1 0.2 0.2 0.9 3.6 0.0 4.9
First Nations Doses 0 1 0 1 3 0 5% 0.0 0.0 0.0 0.0 0.1 0.0 0.1
Physician - Total Doses 2 10 7 32 132 0 183% 0.1 0.3 0.2 0.9 3.7 0.0 5.1
Public Health NurseNon-First Nations Doses 134 2,007 510 0 90 0 2,741
% 3.7 55.6 14.1 0.0 2.5 0.0 76.0
First Nations Doses 10 164 96 0 4 0 274% 0.3 4.5 2.7 0.0 0.1 0.0 7.6
Public Health Nurse - Total Doses 144 2,171 606 0 94 0 3,015% 4.0 60.2 16.8 0.0 2.6 0.0 83.6
First Nation/TribalNon-First Nations Doses 0 3 4 0 0 0 7
% 0.0 0.1 0.1 0.0 0.0 0.0 0.2
First Nations Doses 3 4 10 0 3 0 20% 0.1 0.1 0.3 0.0 0.1 0.0 0.6
First Nation/Tribal - Total Doses 3 7 14 0 3 0 27% 0.1 0.2 0.4 0.0 0.1 0.0 0.7
OtherNon-First Nations Doses 308 59 1 0 0 0 368
% 8.5 1.6 0.0 0.0 0.0 0.0 10.2
First Nations Doses 8 6 0 0 0 0 14% 0.2 0.2 0.0 0.0 0.0 0.0 0.4
Other - Total Doses 316 65 1 0 0 0 382% 8.8 1.8 0.0 0.0 0.0 0.0 10.6
70 - Norman - Total Doses 465 2,253 628 32 229 0 3,607% 12.9 62.5 17.4 0.9 6.3 0.0 100.0
80 - Burntwood
PhysicianNon-First Nations Doses 0 0 0 89 9 0 98
% 0.0 0.0 0.0 4.0 0.4 0.0 4.4
First Nations Doses 0 0 0 4 3 0 7% 0.0 0.0 0.0 0.2 0.1 0.0 0.3
Physician - Total Doses 0 0 0 93 12 0 105% 0.0 0.0 0.0 4.2 0.5 0.0 4.7
Public Health NurseNon-First Nations Doses 323 893 122 0 348 0 1,686
% 14.6 40.3 5.5 0.0 15.7 0.0 76.1
First Nations Doses 49 257 77 0 27 0 410% 2.2 11.6 3.5 0.0 1.2 0.0 18.5
Public Health Nurse - Total Doses 372 1,150 199 0 375 0 2,096% 16.8 51.9 9.0 0.0 16.9 0.0 94.6
First Nation/TribalFirst Nations Doses 2 5 1 0 1 0 9
% 0.1 0.2 0.0 0.0 0.0 0.0 0.4
First Nation/Tribal - Total Doses 2 5 1 0 1 0 9% 0.1 0.2 0.0 0.0 0.0 0.0 0.4
OtherNon-First Nations Doses 0 0 0 0 6 0 6
% 0.0 0.0 0.0 0.0 0.3 0.0 0.3
Other - Total Doses 0 0 0 0 6 0 6% 0.0 0.0 0.0 0.0 0.3 0.0 0.3
80 - Burntwood - Total Doses 374 1,155 200 93 394 0 2,216% 16.9 52.1 9.0 4.2 17.8 0.0 100.0
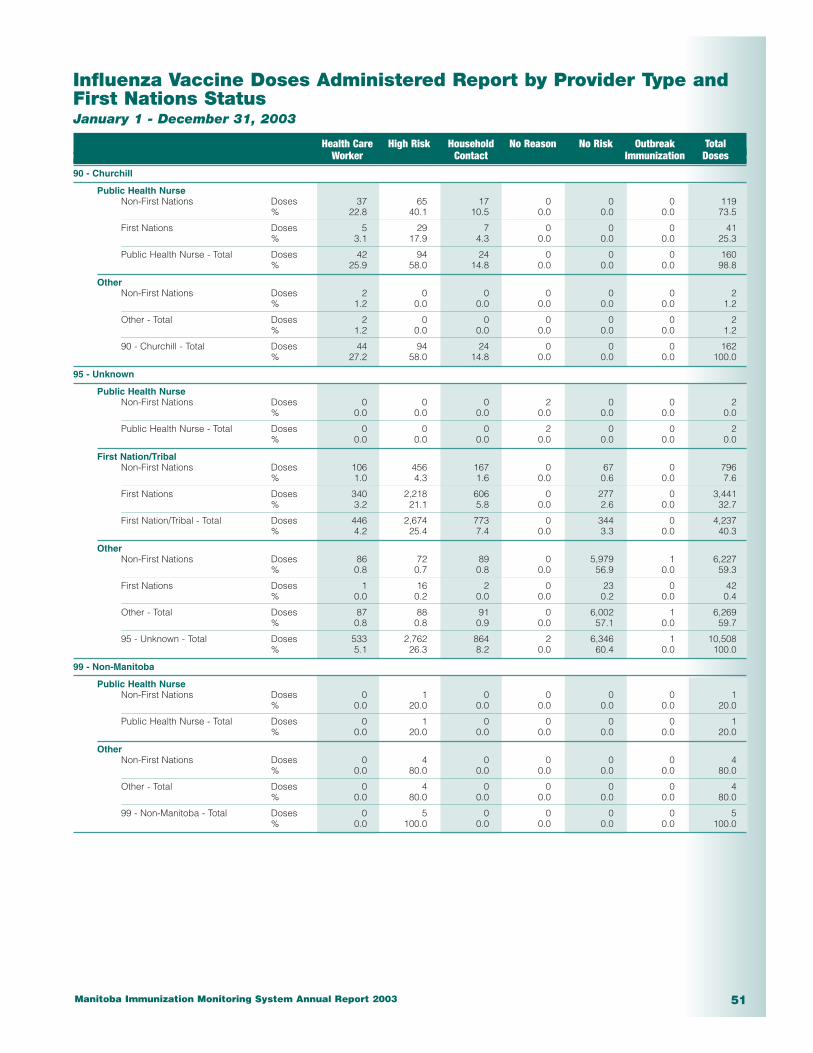
Manitoba Immunization Monitoring System Annual Report 2003 51
Influenza Vaccine Doses Administered Report by Provider Type andFirst Nations StatusJanuary 1 - December 31, 2003
Health Care High Risk Household No Reason No Risk Outbreak Total Worker Contact Immunization Doses
90 - Churchill
Public Health NurseNon-First Nations Doses 37 65 17 0 0 0 119
% 22.8 40.1 10.5 0.0 0.0 0.0 73.5
First Nations Doses 5 29 7 0 0 0 41% 3.1 17.9 4.3 0.0 0.0 0.0 25.3
Public Health Nurse - Total Doses 42 94 24 0 0 0 160% 25.9 58.0 14.8 0.0 0.0 0.0 98.8
OtherNon-First Nations Doses 2 0 0 0 0 0 2
% 1.2 0.0 0.0 0.0 0.0 0.0 1.2
Other - Total Doses 2 0 0 0 0 0 2% 1.2 0.0 0.0 0.0 0.0 0.0 1.2
90 - Churchill - Total Doses 44 94 24 0 0 0 162% 27.2 58.0 14.8 0.0 0.0 0.0 100.0
95 - Unknown
Public Health NurseNon-First Nations Doses 0 0 0 2 0 0 2
% 0.0 0.0 0.0 0.0 0.0 0.0 0.0
Public Health Nurse - Total Doses 0 0 0 2 0 0 2% 0.0 0.0 0.0 0.0 0.0 0.0 0.0
First Nation/TribalNon-First Nations Doses 106 456 167 0 67 0 796
% 1.0 4.3 1.6 0.0 0.6 0.0 7.6
First Nations Doses 340 2,218 606 0 277 0 3,441% 3.2 21.1 5.8 0.0 2.6 0.0 32.7
First Nation/Tribal - Total Doses 446 2,674 773 0 344 0 4,237% 4.2 25.4 7.4 0.0 3.3 0.0 40.3
OtherNon-First Nations Doses 86 72 89 0 5,979 1 6,227
% 0.8 0.7 0.8 0.0 56.9 0.0 59.3
First Nations Doses 1 16 2 0 23 0 42% 0.0 0.2 0.0 0.0 0.2 0.0 0.4
Other - Total Doses 87 88 91 0 6,002 1 6,269% 0.8 0.8 0.9 0.0 57.1 0.0 59.7
95 - Unknown - Total Doses 533 2,762 864 2 6,346 1 10,508% 5.1 26.3 8.2 0.0 60.4 0.0 100.0
99 - Non-Manitoba
Public Health NurseNon-First Nations Doses 0 1 0 0 0 0 1
% 0.0 20.0 0.0 0.0 0.0 0.0 20.0
Public Health Nurse - Total Doses 0 1 0 0 0 0 1% 0.0 20.0 0.0 0.0 0.0 0.0 20.0
OtherNon-First Nations Doses 0 4 0 0 0 0 4
% 0.0 80.0 0.0 0.0 0.0 0.0 80.0
Other - Total Doses 0 4 0 0 0 0 4% 0.0 80.0 0.0 0.0 0.0 0.0 80.0
99 - Non-Manitoba - Total Doses 0 5 0 0 0 0 5% 0.0 100.0 0.0 0.0 0.0 0.0 100.0

Manitoba Immunization Monitoring System Annual Report 200352

Manitoba Immunization Monitoring System Annual Report 2003 53
8. Pneumococcal Vaccine Doses Administered, by Provider Type■ Manitoba
■ By RHA
Notes:
These data reflect doses administered by each provider type, based on the provider’s RHA. They cannot be used to calculateimmunization coverage rates, as the providers do not have a particular population denominator to which they are assigned.
The dates for immunization service are from January 1, 2003 – December 31, 2003, as entered into MIMS by April 16, 2004.
“First Nations/Tribal” provider indicates the provider type was entered into MIMS as First Nations; it does not reflect that theclient has been identified as First Nations.
“Other providers” include facilities, primary care providers, private health care providers, pharmacies and other unknownproviders.
Pneumococcal Vaccine Doses Administered Report by Provider Typeand First Nations StatusJanuary 1 - December 31, 2003
Health Care High Risk Household No Reason No Risk Outbreak Total Worker Contact Immunization Doses
MANITOBA
PhysicianNon-First Nations Doses 0 67 0 33,473 0 0 33,540
% 0.0 0.1 0.0 71.1 0.0 0.0 71.2
First Nations Doses 0 0 0 150 0 0 150% 0.0 0.0 0.0 0.3 0.0 0.0 0.3
Physician - Total Doses 0 67 0 33,623 0 0 33,690% 0.0 0.1 0.0 71.4 0.0 0.0 71.6
Public Health NurseNon-First Nations Doses 0 10,802 0 0 6 0 10,808
% 0.0 22.9 0.0 0.0 0.0 0.0 23.0
First Nations Doses 0 188 0 0 5 0 193% 0.0 0.4 0.0 0.0 0.0 0.0 0.4
Public Health Nurse - Total Doses 0 10,990 0 0 11 0 11,001% 0.0 23.3 0.0 0.0 0.0 0.0 23.4
First Nation/TribalNon-First Nations Doses 0 70 0 0 3 0 73
% 0.0 0.1 0.0 0.0 0.0 0.0 0.2
First Nations Doses 0 423 0 0 9 0 432% 0.0 0.9 0.0 0.0 0.0 0.0 0.9
First Nation/Tribal - Total Doses 0 493 0 0 12 0 505% 0.0 1.0 0.0 0.0 0.0 0.0 1.1
OtherNon-First Nations Doses 0 1,803 0 0 1 0 1,804
% 0.0 3.8 0.0 0.0 0.0 0.0 3.8
First Nations Doses 0 75 0 0 0 0 75% 0.0 0.2 0.0 0.0 0.0 0.0 0.2
Other - Total Doses 0 1,878 0 0 1 0 1,879% 0.0 4.0 0.0 0.0 0.0 0.0 4.0
MANITOBA - Total Doses 0 13,428 0 33,623 24 0 47,075% 0.0 28.5 0.0 71.4 0.1 0.0 100.0

Manitoba Immunization Monitoring System Annual Report 200354
Pneumococcal Vaccine Doses Administered Report by Provider Typeand First Nations StatusJanuary 1 - December 31, 2003
Health Care High Risk Household No Reason No Risk Outbreak Total Worker Contact Immunization Doses
10 - Winnipeg
PhysicianNon-First Nations Doses 0 42 0 25,522 0 0 25,564
% 0.0 0.1 0.0 83.0 0.0 0.0 83.2
First Nations Doses 0 0 0 60 0 0 60% 0.0 0.0 0.0 0.2 0.0 0.0 0.2
Physician - Total Doses 0 42 0 25,582 0 0 25,624% 0.0 0.1 0.0 83.2 0.0 0.0 83.4
Public Health NurseNon-First Nations Doses 0 3,619 0 0 0 0 3,619
% 0.0 11.8 0.0 0.0 0.0 0.0 11.8
First Nations Doses 0 37 0 0 0 0 37% 0.0 0.1 0.0 0.0 0.0 0.0 0.1
Public Health Nurse - Total Doses 0 3,656 0 0 0 0 3,656% 0.0 11.9 0.0 0.0 0.0 0.0 11.9
OtherNon-First Nations Doses 0 1,392 0 0 0 0 1,392
% 0.0 4.5 0.0 0.0 0.0 0.0 4.5
First Nations Doses 0 67 0 0 0 0 67% 0.0 0.2 0.0 0.0 0.0 0.0 0.2
Other - Total Doses 0 1,459 0 0 0 0 1,459% 0.0 4.7 0.0 0.0 0.0 0.0 4.7
10 - Winnipeg - Total Doses 0 5,157 0 25,582 0 0 30,739% 0.0 16.8 0.0 83.2 0.0 0.0 100.0
15 - Brandon
PhysicianNon-First Nations Doses 0 14 0 2,095 0 0 2,109
% 0.0 0.6 0.0 87.9 0.0 0.0 88.5
First Nations Doses 0 0 0 15 0 0 15% 0.0 0.0 0.0 0.6 0.0 0.0 0.6
Physician - Total Doses 0 14 0 2,110 0 0 2,124% 0.0 0.6 0.0 88.5 0.0 0.0 89.1
Public Health NurseNon-First Nations Doses 0 243 0 0 0 0 243
% 0.0 10.2 0.0 0.0 0.0 0.0 10.2
First Nations Doses 0 4 0 0 0 0 4% 0.0 0.2 0.0 0.0 0.0 0.0 0.2
Public Health Nurse - Total Doses 0 247 0 0 0 0 247% 0.0 10.4 0.0 0.0 0.0 0.0 10.4
OtherNon-First Nations Doses 0 13 0 0 0 0 13
% 0.0 0.5 0.0 0.0 0.0 0.0 0.5
Other - Total Doses 0 13 0 0 0 0 13% 0.0 0.5 0.0 0.0 0.0 0.0 0.5
15 - Brandon - Total Doses 0 274 0 2,110 0 0 2,384% 0.0 11.5 0.0 88.5 0.0 0.0 100.0
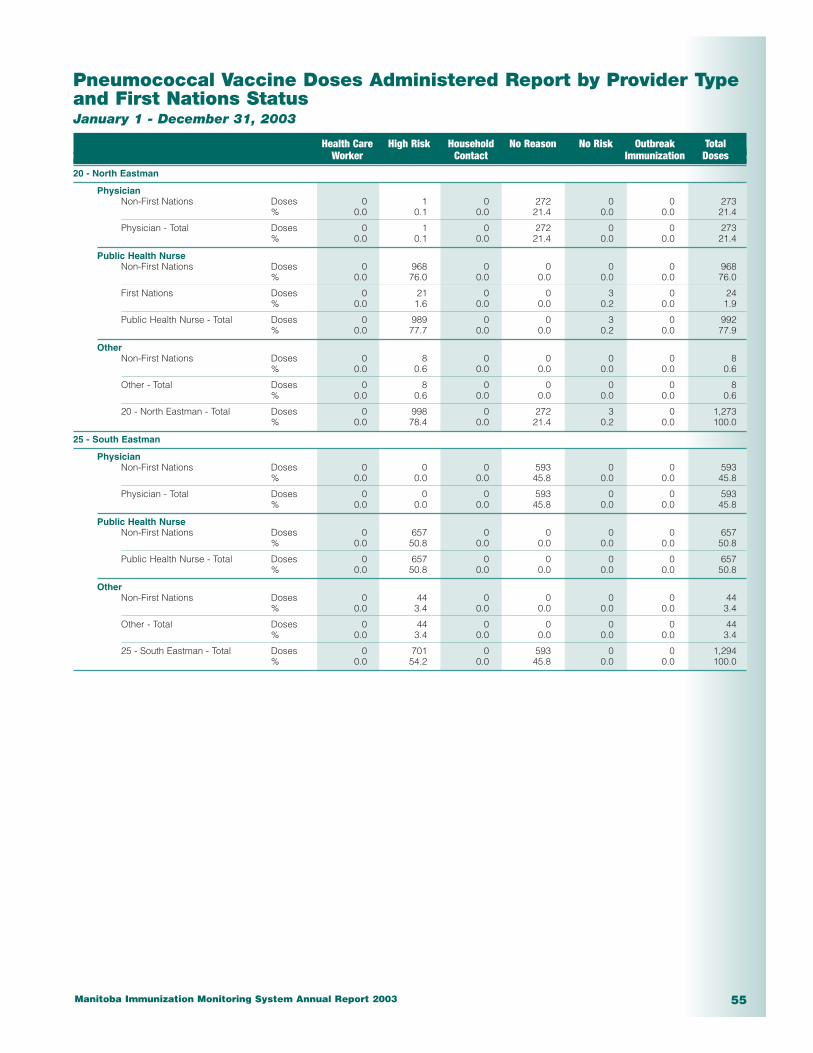
Manitoba Immunization Monitoring System Annual Report 2003 55
Pneumococcal Vaccine Doses Administered Report by Provider Typeand First Nations StatusJanuary 1 - December 31, 2003
Health Care High Risk Household No Reason No Risk Outbreak Total Worker Contact Immunization Doses
20 - North Eastman
PhysicianNon-First Nations Doses 0 1 0 272 0 0 273
% 0.0 0.1 0.0 21.4 0.0 0.0 21.4
Physician - Total Doses 0 1 0 272 0 0 273% 0.0 0.1 0.0 21.4 0.0 0.0 21.4
Public Health NurseNon-First Nations Doses 0 968 0 0 0 0 968
% 0.0 76.0 0.0 0.0 0.0 0.0 76.0
First Nations Doses 0 21 0 0 3 0 24% 0.0 1.6 0.0 0.0 0.2 0.0 1.9
Public Health Nurse - Total Doses 0 989 0 0 3 0 992% 0.0 77.7 0.0 0.0 0.2 0.0 77.9
OtherNon-First Nations Doses 0 8 0 0 0 0 8
% 0.0 0.6 0.0 0.0 0.0 0.0 0.6
Other - Total Doses 0 8 0 0 0 0 8% 0.0 0.6 0.0 0.0 0.0 0.0 0.6
20 - North Eastman - Total Doses 0 998 0 272 3 0 1,273% 0.0 78.4 0.0 21.4 0.2 0.0 100.0
25 - South Eastman
PhysicianNon-First Nations Doses 0 0 0 593 0 0 593
% 0.0 0.0 0.0 45.8 0.0 0.0 45.8
Physician - Total Doses 0 0 0 593 0 0 593% 0.0 0.0 0.0 45.8 0.0 0.0 45.8
Public Health NurseNon-First Nations Doses 0 657 0 0 0 0 657
% 0.0 50.8 0.0 0.0 0.0 0.0 50.8
Public Health Nurse - Total Doses 0 657 0 0 0 0 657% 0.0 50.8 0.0 0.0 0.0 0.0 50.8
OtherNon-First Nations Doses 0 44 0 0 0 0 44
% 0.0 3.4 0.0 0.0 0.0 0.0 3.4
Other - Total Doses 0 44 0 0 0 0 44% 0.0 3.4 0.0 0.0 0.0 0.0 3.4
25 - South Eastman - Total Doses 0 701 0 593 0 0 1,294% 0.0 54.2 0.0 45.8 0.0 0.0 100.0

Manitoba Immunization Monitoring System Annual Report 200356
Pneumococcal Vaccine Doses Administered Report by Provider Typeand First Nations StatusJanuary 1 - December 31, 2003
Health Care High Risk Household No Reason No Risk Outbreak Total Worker Contact Immunization Doses
30 - Interlake
PhysicianNon-First Nations Doses 0 1 0 1,344 0 0 1,345
% 0.0 0.0 0.0 50.9 0.0 0.0 50.9
First Nations Doses 0 0 0 16 0 0 16% 0.0 0.0 0.0 0.6 0.0 0.0 0.6
Physician - Total Doses 0 1 0 1,360 0 0 1,361% 0.0 0.0 0.0 51.5 0.0 0.0 51.5
Public Health NurseNon-First Nations Doses 0 1,216 0 0 2 0 1,218
% 0.0 46.0 0.0 0.0 0.1 0.0 46.1
First Nations Doses 0 9 0 0 2 0 11% 0.0 0.3 0.0 0.0 0.1 0.0 0.4
Public Health Nurse - Total Doses 0 1,225 0 0 4 0 1,229% 0.0 46.4 0.0 0.0 0.2 0.0 46.5
First Nation/TribalNon-First Nations Doses 0 1 0 0 0 0 1
% 0.0 0.0 0.0 0.0 0.0 0.0 0.0
First Nation/Tribal - Total Doses 0 1 0 0 0 0 1% 0.0 0.0 0.0 0.0 0.0 0.0 0.0
OtherNon-First Nations Doses 0 49 0 0 0 0 49
% 0.0 1.9 0.0 0.0 0.0 0.0 1.9
First Nations Doses 0 2 0 0 0 0 2% 0.0 0.1 0.0 0.0 0.0 0.0 0.1
Other - Total Doses 0 51 0 0 0 0 51% 0.0 1.9 0.0 0.0 0.0 0.0 1.9
30 - Interlake - Total Doses 0 1,278 0 1,360 4 0 2,642% 0.0 48.4 0.0 51.5 0.2 0.0 100.0
40 - Central
PhysicianNon-First Nations Doses 0 9 0 2,341 0 0 2,350
% 0.0 0.3 0.0 86.9 0.0 0.0 87.2
First Nations Doses 0 0 0 49 0 0 49% 0.0 0.0 0.0 1.8 0.0 0.0 1.8
Physician - Total Doses 0 9 0 2,390 0 0 2,399% 0.0 0.3 0.0 88.7 0.0 0.0 89.0
Public Health NurseNon-First Nations Doses 0 65 0 0 0 0 65
% 0.0 2.4 0.0 0.0 0.0 0.0 2.4
Public Health Nurse - Total Doses 0 65 0 0 0 0 65% 0.0 2.4 0.0 0.0 0.0 0.0 2.4
OtherNon-First Nations Doses 0 225 0 0 0 0 225
% 0.0 8.4 0.0 0.0 0.0 0.0 8.4
First Nations Doses 0 5 0 0 0 0 5% 0.0 0.2 0.0 0.0 0.0 0.0 0.2
Other - Total Doses 0 230 0 0 0 0 230% 0.0 8.5 0.0 0.0 0.0 0.0 8.5
40 - Central - Total Doses 0 304 0 2,390 0 0 2,694% 0.0 11.3 0.0 88.7 0.0 0.0 100.0
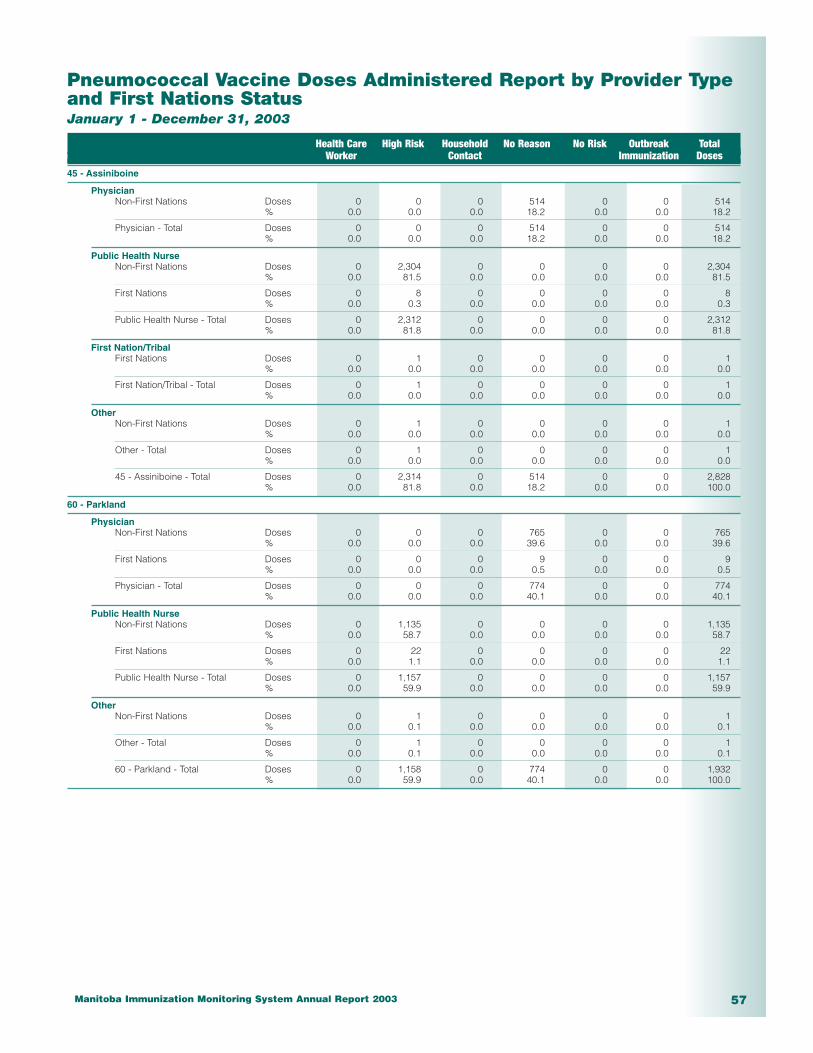
Manitoba Immunization Monitoring System Annual Report 2003 57
Pneumococcal Vaccine Doses Administered Report by Provider Typeand First Nations StatusJanuary 1 - December 31, 2003
Health Care High Risk Household No Reason No Risk Outbreak Total Worker Contact Immunization Doses
45 - Assiniboine
PhysicianNon-First Nations Doses 0 0 0 514 0 0 514
% 0.0 0.0 0.0 18.2 0.0 0.0 18.2
Physician - Total Doses 0 0 0 514 0 0 514% 0.0 0.0 0.0 18.2 0.0 0.0 18.2
Public Health NurseNon-First Nations Doses 0 2,304 0 0 0 0 2,304
% 0.0 81.5 0.0 0.0 0.0 0.0 81.5
First Nations Doses 0 8 0 0 0 0 8% 0.0 0.3 0.0 0.0 0.0 0.0 0.3
Public Health Nurse - Total Doses 0 2,312 0 0 0 0 2,312% 0.0 81.8 0.0 0.0 0.0 0.0 81.8
First Nation/TribalFirst Nations Doses 0 1 0 0 0 0 1
% 0.0 0.0 0.0 0.0 0.0 0.0 0.0
First Nation/Tribal - Total Doses 0 1 0 0 0 0 1% 0.0 0.0 0.0 0.0 0.0 0.0 0.0
OtherNon-First Nations Doses 0 1 0 0 0 0 1
% 0.0 0.0 0.0 0.0 0.0 0.0 0.0
Other - Total Doses 0 1 0 0 0 0 1% 0.0 0.0 0.0 0.0 0.0 0.0 0.0
45 - Assiniboine - Total Doses 0 2,314 0 514 0 0 2,828% 0.0 81.8 0.0 18.2 0.0 0.0 100.0
60 - Parkland
PhysicianNon-First Nations Doses 0 0 0 765 0 0 765
% 0.0 0.0 0.0 39.6 0.0 0.0 39.6
First Nations Doses 0 0 0 9 0 0 9% 0.0 0.0 0.0 0.5 0.0 0.0 0.5
Physician - Total Doses 0 0 0 774 0 0 774% 0.0 0.0 0.0 40.1 0.0 0.0 40.1
Public Health NurseNon-First Nations Doses 0 1,135 0 0 0 0 1,135
% 0.0 58.7 0.0 0.0 0.0 0.0 58.7
First Nations Doses 0 22 0 0 0 0 22% 0.0 1.1 0.0 0.0 0.0 0.0 1.1
Public Health Nurse - Total Doses 0 1,157 0 0 0 0 1,157% 0.0 59.9 0.0 0.0 0.0 0.0 59.9
OtherNon-First Nations Doses 0 1 0 0 0 0 1
% 0.0 0.1 0.0 0.0 0.0 0.0 0.1
Other - Total Doses 0 1 0 0 0 0 1% 0.0 0.1 0.0 0.0 0.0 0.0 0.1
60 - Parkland - Total Doses 0 1,158 0 774 0 0 1,932% 0.0 59.9 0.0 40.1 0.0 0.0 100.0
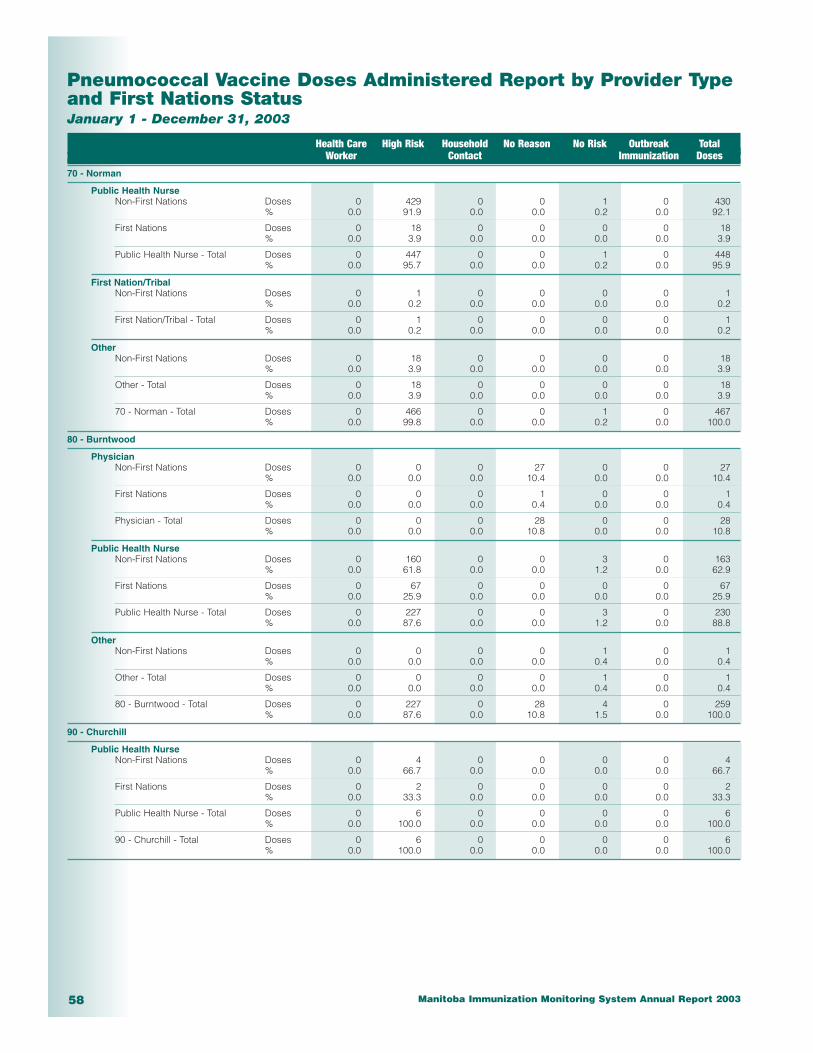
Manitoba Immunization Monitoring System Annual Report 200358
Pneumococcal Vaccine Doses Administered Report by Provider Typeand First Nations StatusJanuary 1 - December 31, 2003
Health Care High Risk Household No Reason No Risk Outbreak Total Worker Contact Immunization Doses
70 - Norman
Public Health NurseNon-First Nations Doses 0 429 0 0 1 0 430
% 0.0 91.9 0.0 0.0 0.2 0.0 92.1
First Nations Doses 0 18 0 0 0 0 18% 0.0 3.9 0.0 0.0 0.0 0.0 3.9
Public Health Nurse - Total Doses 0 447 0 0 1 0 448% 0.0 95.7 0.0 0.0 0.2 0.0 95.9
First Nation/TribalNon-First Nations Doses 0 1 0 0 0 0 1
% 0.0 0.2 0.0 0.0 0.0 0.0 0.2
First Nation/Tribal - Total Doses 0 1 0 0 0 0 1% 0.0 0.2 0.0 0.0 0.0 0.0 0.2
OtherNon-First Nations Doses 0 18 0 0 0 0 18
% 0.0 3.9 0.0 0.0 0.0 0.0 3.9
Other - Total Doses 0 18 0 0 0 0 18% 0.0 3.9 0.0 0.0 0.0 0.0 3.9
70 - Norman - Total Doses 0 466 0 0 1 0 467% 0.0 99.8 0.0 0.0 0.2 0.0 100.0
80 - Burntwood
PhysicianNon-First Nations Doses 0 0 0 27 0 0 27
% 0.0 0.0 0.0 10.4 0.0 0.0 10.4
First Nations Doses 0 0 0 1 0 0 1% 0.0 0.0 0.0 0.4 0.0 0.0 0.4
Physician - Total Doses 0 0 0 28 0 0 28% 0.0 0.0 0.0 10.8 0.0 0.0 10.8
Public Health NurseNon-First Nations Doses 0 160 0 0 3 0 163
% 0.0 61.8 0.0 0.0 1.2 0.0 62.9
First Nations Doses 0 67 0 0 0 0 67% 0.0 25.9 0.0 0.0 0.0 0.0 25.9
Public Health Nurse - Total Doses 0 227 0 0 3 0 230% 0.0 87.6 0.0 0.0 1.2 0.0 88.8
OtherNon-First Nations Doses 0 0 0 0 1 0 1
% 0.0 0.0 0.0 0.0 0.4 0.0 0.4
Other - Total Doses 0 0 0 0 1 0 1% 0.0 0.0 0.0 0.0 0.4 0.0 0.4
80 - Burntwood - Total Doses 0 227 0 28 4 0 259% 0.0 87.6 0.0 10.8 1.5 0.0 100.0
90 - Churchill
Public Health NurseNon-First Nations Doses 0 4 0 0 0 0 4
% 0.0 66.7 0.0 0.0 0.0 0.0 66.7
First Nations Doses 0 2 0 0 0 0 2% 0.0 33.3 0.0 0.0 0.0 0.0 33.3
Public Health Nurse - Total Doses 0 6 0 0 0 0 6% 0.0 100.0 0.0 0.0 0.0 0.0 100.0
90 - Churchill - Total Doses 0 6 0 0 0 0 6% 0.0 100.0 0.0 0.0 0.0 0.0 100.0
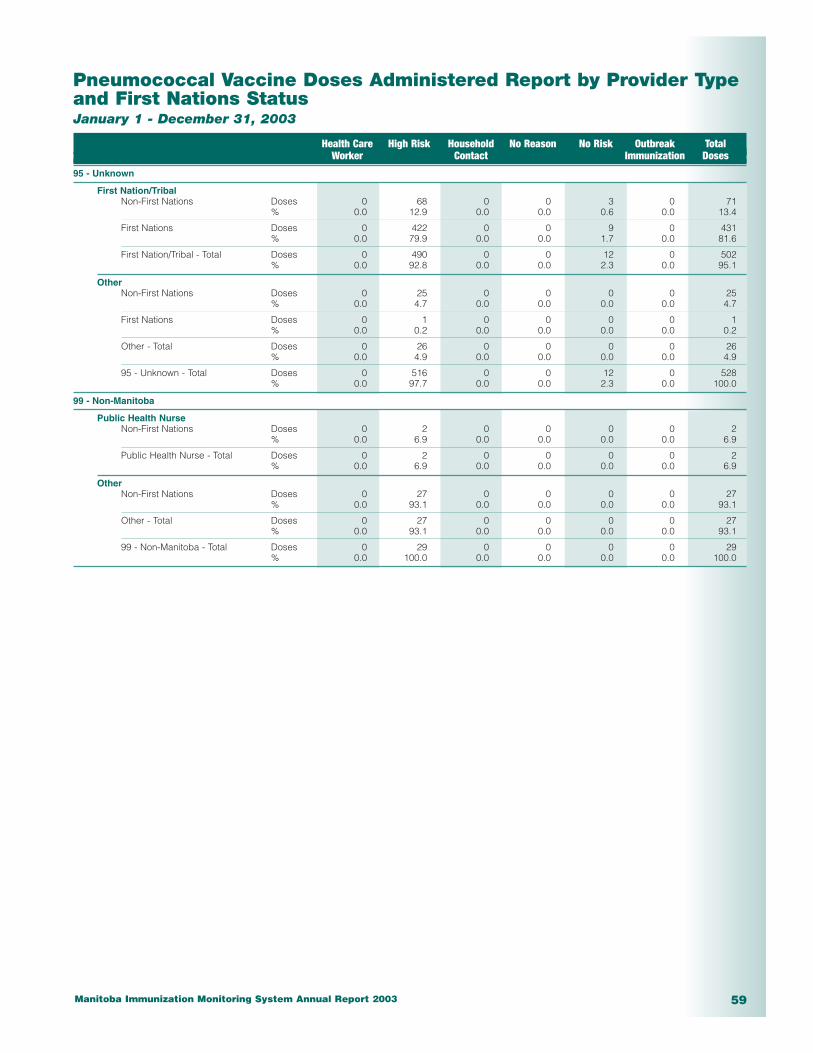
Manitoba Immunization Monitoring System Annual Report 2003 59
Pneumococcal Vaccine Doses Administered Report by Provider Typeand First Nations StatusJanuary 1 - December 31, 2003
Health Care High Risk Household No Reason No Risk Outbreak Total Worker Contact Immunization Doses
95 - Unknown
First Nation/TribalNon-First Nations Doses 0 68 0 0 3 0 71
% 0.0 12.9 0.0 0.0 0.6 0.0 13.4
First Nations Doses 0 422 0 0 9 0 431% 0.0 79.9 0.0 0.0 1.7 0.0 81.6
First Nation/Tribal - Total Doses 0 490 0 0 12 0 502% 0.0 92.8 0.0 0.0 2.3 0.0 95.1
OtherNon-First Nations Doses 0 25 0 0 0 0 25
% 0.0 4.7 0.0 0.0 0.0 0.0 4.7
First Nations Doses 0 1 0 0 0 0 1% 0.0 0.2 0.0 0.0 0.0 0.0 0.2
Other - Total Doses 0 26 0 0 0 0 26% 0.0 4.9 0.0 0.0 0.0 0.0 4.9
95 - Unknown - Total Doses 0 516 0 0 12 0 528% 0.0 97.7 0.0 0.0 2.3 0.0 100.0
99 - Non-Manitoba
Public Health NurseNon-First Nations Doses 0 2 0 0 0 0 2
% 0.0 6.9 0.0 0.0 0.0 0.0 6.9
Public Health Nurse - Total Doses 0 2 0 0 0 0 2% 0.0 6.9 0.0 0.0 0.0 0.0 6.9
OtherNon-First Nations Doses 0 27 0 0 0 0 27
% 0.0 93.1 0.0 0.0 0.0 0.0 93.1
Other - Total Doses 0 27 0 0 0 0 27% 0.0 93.1 0.0 0.0 0.0 0.0 93.1
99 - Non-Manitoba - Total Doses 0 29 0 0 0 0 29% 0.0 100.0 0.0 0.0 0.0 0.0 100.0

Manitoba Immunization Monitoring System Annual Report 200360