KEY FACTORS IN HYPERMARKET BUSINESS THAT EFFECT ON ...
100
KEY FACTORS IN HYPERMARKET BUSINESS THAT EFFECT ON CUSTOMER ‘S REPURCHASE
Transcript of KEY FACTORS IN HYPERMARKET BUSINESS THAT EFFECT ON ...
KEY FACTORS IN HYPERMARKET BUSINESS THAT EFFECT
ON CUSTOMER ‘S REPURCHASE
KEY FACTORS IN HYPERMARKET BUSINESS THAT EFFECT
ON CUSTOMER ‘S REPURCHASE
Rani Pandey
This Independent Study Manu script Presented to
The Graduate School of Bangkok University
in Partial Fulfillment
Of the Requirement for the Degree
Master of Business Administration
2015

© 2015
Rani Pandey
All Rights Reserved
Pandey, R. M.B.A., December 2015, Graduate School, Bangkok University
Key Factors in Hypermarket Business that Effect on Customer‘s Repurchase (88 pp.)
Advisor: Sumas Wongsunopparat, Ph.D.
ABSTRACT
In this research aims to study and identify the key factors in hypermarket business
that effect on customer and keeps them coming back, such as the factors of service,
product quality, price, sales promotion, place, facilities, categories, brand, and consumer
behaviors. These factors effect on customers and keep them coming back to use their
service and purchase their decision and their needs in hypermarket. This study is a
quantitative research based on customer decision to keep coming back to use the service
in hypermarket business. The sample group is from 400 respondents by both male and
female from Bangkok area only. This research is using online and self-administered
questionnaire which is used via Facebook, Email, and Electronic paper, which separated
into the importance aspects that is content validity and reliability and follow by the
analysis of general demographics and consumer behavior the data used to do with
frequency and percentage to find more reliable in the questionnaire part, the analysis of
cross tabulation to differentiate the number of variables to make more clear on the point
of keep customer coming back to hypermarket business, the analysis of nominal logistic
regression to study more in detail of the factors that keep customer coming back in
hypermarket business to analysis the impact of customer decision in purchasing in which
type of hypermarket, and the hypothesis testing is to test the reliable of factors that make
customer come back, the results show that most of the factors there are 7 factors out of 8
factors are significant that is service, product quality, price, sales promotion, facilities,
categories, and brand variety, and the factors that are not significant is place factors it
mean that place is not the important for customer to repurchase in hypermarket business.

V
ACKNOWLEDGEMENT
In performing my MBA independent study, I had to take the help and guideline
of some respected persons, who deserve our greatest thankfulness. The completion of this
independent study gives me much pleasure. I would like to show my thankfulness Dr.
Sumas Wongsunopparat for giving me a good guideline for independent study throughout
various consultations. I would also like to expand our sincere thankfulness to all those
who have directly and indirectly guided me in writing this independent study. In addition,
a thank you to Professor Dr. Sumas Wongsunopparat who introduced me to the
Methodology of work, and whose passion for the “underlying structures” had lasting
effect. I also express thanks the Bangkok University for consent to include copyrighted
pictures as a part of my paper. Many people, especially the respondents who help me to
fill in questionnaire itself, have made valuable comment suggestions on this proposal
which gave me an inspiration to improve my assignment. I thank all the people for their
help directly and indirectly to complete my independent study.

TABLE OF CONTENTS
Page
ABSTRACT……………………………………………………………………………. iv
ACKNOWLEDGEMENT……………………………………………………………... v
LIST OF TABLES……..………………………………………………………………. viii
LIST OF FIGURES……………………………………………………………………. x
CHAPTER 1 RESEARCH PROPOSAL………………………………………………. 1
Background……………………………………………............................................... 1
Statement of problem……………………………………………………………....... 4
Intention and reason for study………………………………………………………...4
Research objectives………………………………………………………………….. 5
Scope of research……………………………………………………………………. 5
Benefit of research…………………………………………………………………... 6
Limitation of research……………………………………………………………….. 6
CHAPTER 2 LITERATURE REVIEW……………………………………………….. 7
Introduction……………………………………………………….............................. 7
Service……………………………………………………………………………….. 7
Product Quality ……………………………………………………………………… 8
Price…………………………………………………………………………………. 9
Sales & Promotion…………………………………………………........................... 10
Place…………………………………………………………………………………. 11
Facilities……………………………………………………………………………... 12
Categories…………………………………………………………………………… 16
Brand…………………………………………………………………........................ 18
Consumer behavior………………………………………………………………….. 19
Related Research…………………………………………………………………….. 20

vii
TABLE OF CONTENTS (Continued)
CHAPTER 2 LITERATURE REVIEW (Continued) Page
Research Framework…………………………………………………………………23
Hypothesis……………………………………………………………………………24
CHAPTER 3 RESEARCH METHDOLOGY………………………………………… 25
Introduction………………………………………………………………………… 25
Research Design……………………………………………………......................... 25
Population and Sample Selection………………………........................................... 25
Research Instrument……………………………………………............................... 26
Reliability and Validity Assessment……………………………………………….. 30
Data Collection Procedure………………………………………………………….. 33
Statistic for Data Analysis………………………………………………………….. 33
CHAPTER 4 RESEARCH FINDING AND DATA ANALYSIS……………………. 35
Introduction………………………………………………………………………… 35
The Analysis of Frequency and Percentage……………............................................ 36
The Analysis of Cross Tabulation…………………………….…………………….. 41
The Analysis of Nominal Regression………………………................................... 47
The Hypothesis Testing…………………………………………………………….. 57
CHAPTER 5 DISCUSSION AND CONCLUSION………………………………… 63
Introduction………………………………………………………………………… 63
Conclusion……………………………………………………………………………65
Discussion………………………………………………………….......................... 69
Managerial Implication…………………………………………………………….. 73
Recommendation for Future Research……………………………………………... 75
BIBLIOGRAPHY……………………………………………………………………………... 76
APPENDIX…………………………………………………………………………….............80
BIODATA…………………………………………………………………………………… 87
LICENSE AGREEMENT………………………………………………………………………88
viii
LIST OF TABLES
Page
Table 1: Level of information measurement and criteria………………………….. 26
Table 2: Criteria of reliability………………………………………........................ 32
Table 3: Reliability Statistics……………………………………………………… 32
Table 4: Frequency and percentage…………………………................................... 36
Table 5: Frequency and percentage………………………………........................... 36
Table 6: Frequency and percentage……………………………………................... 37
Table 7: Frequency and percentage………………………………........................... 38
Table 8: Frequency and percentage……………………………............................... 38
Table 9: Frequency and percentage………………………………………............... 39
Table 10: Frequency and percentage……………………………………………… 39
Table 11: Frequency and percentage………………………………………………. 40
Table 12: Cross tabulation…………………………………………………………. 41
Table 13: Cross tabulation…………………………………………………………. 42
Table 14: Cross tabulation…………………………………………………………. 43
Table 15: Cross tabulation…………………………………………………………. 44
Table 16: Cross tabulation…………………………………………………………. 46
Table 17: Multinomial Logistic Regression of the factors………………………… 47
Table 18: Multinomial Logistic Regression of the factors…………………............ 48
Table 19: Multinomial Logistic Regression details of the factors……………….... 49
Table 20: Multinomial Logistic Regression details of the factors…........................ 50
Table 21: Multinomial Regression details of the factors…...................................... 52
ix
LIST OF TABLES (Continued)
Page
Table 22: Multinomial Logistic Regression details of the factors………………… 54
Table 23: Multinomial Logistic Regression of demographic……………………… 55
Table 24: Multinomial Logistic Regression of demographic……………………… 56
Table 25: Hypothesis testing………………………………………………………. 57
Table 26: Hypothesis testing………………………………………………………. 58
Table 27: Hypothesis testing………………………………………………………. 58
Table 28: Hypothesis testing………………………………………………………. 59
Table 29: Hypothesis testing………………………………………………………. 60
Table 30: Hypothesis testing………………………………………………………. 61
Table 31: Hypothesis testing………………………………………………………. 61

x
LIST OF FIGURES
Page
Figure1: Research Framework…………………………………………………………...22
CHAPTER1
RESEARCH PROPOSAL
This chapter described the general of the research which includes the research
background, research objectives, research questions and additionally the research
methodology, definition of terms, limitation of the research and conclusion are for a
short time described.
1.1 Background
In trade a hypermarket is a super store combining a supermarket and a department
store. The result is an expansive retail capability carrying a large range of products
under one roof, including full groceries lines and general products. In theory,
hypermarkets allow consumers to convince all their regular shopping needs in one
expedition .The hypermarket normally comprises meat, fresh produce, dairy, and
baked good aisles, along with shelf space kept for canned and packaged goods as well
as for a range of non-food items such as kitchenware, household cleaners, pharmacy
products and pet supplies. Some hypermarkets moreover sell a variety other
household products that are consumed regularly, such as alcohol, medicine, and
clothes, and some stores sell a much wider choice of non-food products, such as
DVDs, sporting equipment, board games, and seasonal items.
The established hypermarket occupies a large amount of floor space, regularly on
a single level. It is frequently situated near a residential area in order to be suitable to
consumers. The basic application is the accessibility of a broad selection of goods
under a single roof, at relatively low prices. Other compensation includes ease of
parking and commonly the convenience of shopping house that enlarge into the
evening of day. Hypermarket regularly allocates large budgets to advertising,
naturally through newspapers. They also present complex in shop displays of
2
products. The shops are regularly parts of corporate chains that own or control other
hypermarket located close to even global thus increasing opportunities for economies
of scale.
Hypermarkets normally are supplied by the supply centers of their parent
companies, regularly in the largest city in the area. Hypermarkets frequently offer
products at relatively low prices by using their buying power to buy goods from
manufacturers at lower prices than smaller stores can. They also reduce financing
costs by paying for goods at least 30 days after receipt and some extract credit terms
of 90 days or more from vendors. Certain products like staple foods such as bread,
milk, sugar are very occasionally sold as loss leaders, that is, with depressing profit
margins so as to catch the attention of shoppers to their store. There is some debate as
to the usefulness of this tactic. To maintain a profit, hypermarkets make up for the
lower margins by a higher overall volume of sales, and with the sale of higher-margin
items bought by the future higher volume of shoppers. Consumers should shop by
placing their selected merchandise into shopping carts or baskets and pay for the
merchandise at the check-out. At present, many hypermarket chains are attempting to
further decrease labor costs by changing to self-service check out machines, where a
single employee can manage a group of four or five machines at once, secondary
multiple customers at that time. A larger full service hypermarket joint with a
department store is sometime known as supermarket. Other services presented at
some hypermarkets may contain those of banks, cafe, and toy world for children and
so on. Hypermarkets, since they appeared, have played an important role in food
distribution. This distribution model was widely accepted by both companies and
consumers. The evolution of these stores in recent years has been quite dynamic on
the basis of their good combination of supply, proximity and service. Hypermarkets
are increasingly valued by consumers, compared to other commercial formats, which
triggers the gradual disappearance of traditional markets (Maslow, 1943).
All the persons have different needs, and they want to satisfy these needs
(Maslow, 1943). formulates a hierarchy of human needs and he defends that when the
person satisfies their basic needs, they develop higher needs and wishes. Among the
3
needs, it found a food needs, and it is here where the importance of hypermarkets is
important.
These stores satisfy the food need of human beings, so their target audience ranges
all the population. It is a highly competitive market. In these modern times the
different chains use all kind of strategies to increase their sales, becoming the sales
process almost a science. That is because of the process of merchandising are
involved studies of psychology, science and business, which seek to know the tastes,
habits, needs and way of thinking of consumers (Martinez, 1997). For this reason and
in these times of ruthless competition is an excellent idea to have tools like
“merchandising“, to try to gain advantage against the other competitors (Martinez,
1997).
The Supermarket Industry is Highly Competitive. The supermarket industry is
characterized by narrow profit margins and competes on value, location and service.
Additionally, increasingly competitive markets and economic uncertainty have made
it difficult generally for grocery store operators to achieve comparable store sales
gains. Because sales growth has been difficult to attain, hypermarket’s competitors
have attempted to maintain market share through increased levels of promotional
activities and discount pricing, creating a more difficult environment in which to
achieve consistent sales gains. Some of hypermarket’s competitors have greater
financial resources and could use these resources to take measures which could
adversely affect hypermarket competitive position. Accordingly, hypermarket’s
business, financial condition or results of operations could be adversely affected by
competitive factors, including product mix and pricing changes which may be made
in response to competition from existing or new competitors (teeter, 2008).
As markets shrink, companies are scrambling to boost customer satisfaction
and keep their current customers rather than devoting additional resources to chase
potential new customers. The claim that it costs five to eight times as much to get
new customers than to hold on to old ones is key to understanding the drive toward
benchmarking and tracking customer satisfaction (Cacioppo, 1998).
4
1.2 Statement of problem
Hypermarket business is one of the most competitive businesses. And one of
the most important points is the customers. Problem is how to make these
customers return to the hypermarket. What should be the key factors that keep
them coming back? We found that in this business service, product quality, brand
variety, price, sales promotion, and place can be one of the reasons one of their
choice that make them keep repurchase in hypermarket. Why should a business
like to maintain current customer? This should be one problem for the researcher
to study and find the result.
Measuring customer satisfaction is a relatively new concept to many
companies that have been focused exclusively on income statements and balance
sheets. Companies now recognize that the new global economy has changed
things forever. Increased competition, crowded markets with little product
differentiation and years of continual sales growth followed by two decades of
flattened sales curves have indicated to today's sharp competitors that their focus
must change. Competitors that are prospering in the new global economy
recognize that measuring customer satisfaction is key. Only by doing so can they
hold on to the customers they have and understand how to better attract new
customers. The competitors who will be successful recognize that customer
satisfaction is a critical strategic weapon that can bring increased market share and
increased profits (Cacioppo, 1998).
1.3 Intention and Reason for Study
This research is done for identifying customers liking and keep repurchasing in
hypermarket business to use the service of this kind of business and keep this
business growing in the future also. In term of business benefit, hypermarket will
recognize customer’s needs; moreover, hypermarket can focus on how to work
and develop customer’s service. The information gain from study would help to
guide the hypermarket business to increase their responsiveness and understand
5
the key factors that would be increasing the customers. Consequently, the overall
of this research would be the valuable information in order to plan to apply and
develop further. In term of customer benefit, customer can present their opinion
about this hypermarket business.
1.4 Research Objectives
There are some objectives to be measured. The objectives to be achieved are
given below as follows.
1. In this research objective we are trying to study the hypermarket business
management.
2. In this research objective we are trying to study the factors that attractive on
customer and make them repurchase in hypermarket business.
3. In this research we are study the way to make the customer to repurchase in
hypermarket business.
4. In this research we are trying to find out the relationship between the customer
and the factors to make the decision on purchasing in hypermarket business.
1.5 Scope of Research
This research studies the key factors that how to keep customers repurchasing to
our hypermarket business. The scope of this research is limited to the customer that
use the service of hypermarket in Bangkok, On the other hand the findings possibly
useful for other branches in Bangkok, So the consequence of the study cannot be
represented other provinces in Thailand.

6
1.6 Benefit of Research
This research is conducted to recognize the factors of how to keep customer
repurchasing into hypermarket business. In term of company benefit, the company
will understand the customer’s need and wants. On the other hand the company
can focus on how to work and develop their marketing strategies. And for the
benefits of the customers they can present their opinion and experience after
repurchase in hypermarket business.
1.7 Limitation of Research
This research performed has several constraints. First, there is the limitation of
the time. This research survey was performed at a specific time, so it might be
used with caution for studying in other period of time. Second, this research has
focused on the key factors that keep customer repurchase in hypermarket business.
So the result of the study cannot be represented for other provinces in Thailand.
CHAPTER 2
LITERATUE REVIEW
Objective of this chapter is to review documents, electronic document (internet),
textbooks, foreign journal and local journals that provide information about the keys
factor in hypermarket business and the way that make customer happy in that factors
and keep them coming back. The chapter has shown the five factors that are common,
service, product quality, price, sale promotion, place and four more factors that are
facility, category, brand variety and customer behavior that can keep customer
repurchasing in this business.
Imagine about favorite service, companies, or brand. What keep you going back for
more? Its might be the outstanding prices, the amazing customer service, or the free
gifts that they give you as a returning for customer. And also make customer
remembering strategies, which is one of the most important uniqueness in marketing
strategy.
If our business looking for the ways to keep or grow your customer base, going to
review some valuable customer to remembering strategies that will keep our users and
customers coming back for more. These are some key factors that related to the
strategies of 4P’s that most of the business are follow in its.
2.2 Service
Service is a commercial enterprise that provides work performed in an expert
manner by an individual or term for the benefit of its customers. The typical service
business provides intangible products, such as accounting, banking, consulting,
cleaning, landscaping, education, insurance, treatment, and transportation service
(Townley, 1991).
8
Good customer service is the support of all business. Can offer promotions and
slash prices to bring in as many new customers as want, but unless can get some of
those customer to come back; business won’t be profitable for long. Good customer
service is all about bringing customers back. And about sending them away happy and
happy sufficient to pass positive feedback about business along to others, who try the
product or service offer for themselves and in their turn become repeat customer.
If we are a good salesperson, then we can sell anything to anyone once. But it
will be approach to customer service that determines whether or not we will ever be
able to sell that person anything else. The essence of good customer service is
forming a relationship with customers, a relationship that individual customer feels
that they would like to pursue. By remembering the one true secret of good customer
service and acting as the result; “We will be judge through what we perform, not what
we say".
2.3 Product Quality
Definitions of a quality construct are by nature cross-disciplinary and encompass
operations, strategy, marketing, engineering and philosophy. Although researchers
cannot agree on a particular definition for quality, a conceptual framework for
categorizing divergent approaches to defining quality was developed by Garvin
(Garvin, 1984).
It is difficult to find any organization today that is not aware of quality and the
increased emphasis placed on quality and value by consumers. Products as varied as
automobiles, super-computers and even candy are all subject to the demands of real or
perceived quality. Indeed, Townley proposes that quality has become a strategic
component in organizational performance (Townley, 1991).
Quality in business, engineering and manufacturing are practical understand as
the weakness or control of something: it is also defined as health for principle. Quality
is a perceptual, condition, and rather subjective quality and may be understood
9
differently by different people. Customers may focus on the requisite quality of a
product and service, or how to compares to competitors in the market. Produces might
measure the conformance quality, or quantity to which the product and service was
produced (https://en.wikipedia.org/wiki/Quality_(business).
2.4 Price
A business can use a variety of pricing strategies when selling
a product or service. The price can be set to maximize profitability for each unit sold
or from the market overall. It can be used to defend an existing market from new
entrants, to increase market share within a market or to enter a new market.
Businesses may benefit from lowering or raising prices, depending on the needs and
behaviors of customers and clients in the particular market. Finding the right pricing
strategy is an important element in running a successful business (Gregson, 2008).
The price variable is among the most powerful weapons in the arsenal of the
executives to achieve entry deterrence objectives. It is inherently flexible, can be
modified quickly, and is directly associated with profitability. In one survey, pricing
was deemed to be “extremely important” by seventy- 2 eight per cent of the
respondents and ranked third among fifteen key marketing issues (Srinivasan et al.,
2000) Chen and McMillan (1992) reported that the likelihood of competitive response
is higher, the response delay is shorter, and the likelihood of a matching response is
higher for price cuts than they are for other competitive actions. Incumbent firms
often reduce price when they encounter new market entry (Calantone and Benedetto,
1990).
Pricing is one of the four main of the marketing mix, with product, place and
promotion. Pricing strategies is most important for the companies to desire to get
success by finding more on the price point where they can make best use of sales and
profits. So the companies may use these strategies to get more chance in sales and this
also can keep customer coming back into the hypermarket business. And these also
depend on the unique marketing goals and objectives (Grensing-Pophal, 2005).

10
2.5 Sale & Promotion
For this study, the parent discipline reviews the concept of keeping customers coming
back in hypermarket business that effect customer satisfaction in hypermarket.
The sale promotion is a type of marketing that target to the distribution channel of
directly on the customer. Sale promotion includes several communications activities
that attempt to provide added value or incentives to consumer, wholesalers, retailers,
or other organizational customers to stimulate immediate sales. Sales promotion is
also wanted to attract new customer, to hold present customers, to offset competition,
and to take advantage of opportunities that are exposed by market research. It is made
up of activities, both outside and inside activities, to enhance company sales. (Taylor,
1978).
Sale promotion often comes in the form of discounts. Discounts impact the way
consumers think and behave while shopping. The type of savings and its location can
effect on the way in which consumers view a product and affect their purchase
decision. The two most common discounts are price discounts and bonus packs. Price
discounts are the fall of an original sale by certain percentage while bonus packs are
deals in which the consumer receives more for the original price. Many companies
present different forms of discounts in advertisements, hoping to convince consumers
to buy their products (Huang, 2014).
2.5.2 Consumer Sales Promotion Types
Price deal: An impermanent decrease in the price, such as 50% off.
Loyal Reward program: Consumers collect the points, the credit, and exchange it in
to rewards, gifts, or coupons.
Cents-off deals: Offers a brand at aloe price, and decrease by percentage marked on
the package.

11
Price-pack/ Bonus packs deals: The packaging offers a consumer a certain percentage
more of the product for the same price. This is another types of deal in which
customers are offered more of the product for the same price (Huang 2014).
Coupons: Coupons have become a standard instrument for sales promotions.
Loss leader: The price of a popular product is for the time being cheap below cost in
order to stimulate other profitable sales.
Free-standing insert < FSI >: A coupon booklet is inserted into the local newspaper
for delivery.
Checkout dispensers: On list of the customer is given a coupon created on products
purchased.
Mobile couponing: Coupons are available on a mobile phone. Customers show the
offer on a mobile phone to a salesclerk for recovery.
Online interactive promotion game: Customers play a collaborating game related
with the promoted product.
Rebates: Customer is return money back if the receipt and barcode are sent to the
producer.
Kids eat free specials: Offers a discount on the total dining bill by offering 1 free kids
meal with each fixed meal purchased.
Sampling: Customers get one sample for free, after their experimental and then could
decide whether to purchase or not.
2.6 Place
Marketing, especially international marketing is a great challenge even for private
corporations, which are often regarded as specialists in marketing practices (Duffy
1995; Sergeant 1999). Places are public organizations, and it is, therefore, no wonder
that places suffer even worse from the same dilemma. In this study, the term “place”
12
is used to mean all kinds of places like cities, city-regions, regions, communities,
areas, states and nations1. There is now a consensus about the suitability of marketing
for places, and that places, indeed, should be marketed as efficiently as firm’s market
products or services (Kotler & Hamlin & Rein & Haider 2002), (Braun 1994), (Herrn
1997), (Holcomb 1993), (Ward 1998), (Witt & Moutinho 1995).
Place is one the importance thing that all business are realized to have and
should be convenient for customer. Place ensure that the product is distributed and
made conveniently available for the customer at the right location at the right time.
And also the outside location should be convenient for customers and should be
compatibility with the owner life style. For place of the business should be easy for
the customer to come and location should be clean and convenient for customer (Berg
& Klaasen & Meer 1990).
After the 4P’s strategies we can look inside that most of the business are using
these strategies to survive their business. Many people believe that marketing is just
about advertising or sales. Everything a company does to acquire customer and
maintain the relationship with them. Ultimately, goal of marketing is to competition a
company’s products and services to the people who need and want them to ensure
profitability. And these are other key factors that keep customer coming back in
hypermarket business (Kearns & Philo 1993).
2.7 Facilities
Facility management is an interdisciplinary field devoted to the coordination of
space, infrastructure, people and organization, often associated with the
administration of office blocks, arenas, schools, sporting complexes, convention
centers, shopping complexes, hospitals, hotels, manufacturing, shipping (Wagenberg,
and Wubben, 2004). If talking about facility in hypermarket, a lot of things inside the
hypermarket are make customer coming back. People use a range of service everyday

13
although some talking on the phone, using a credit card, withdrawing money from an
ATM, other service purchase may involve more consideration and may be more
memorable for instance, and booking a ticket of vacation, and also getting financial
advice, or having a medical examination. We use of these services is an example of
service consumption at the individual, or this call business to consumer <B2C>
strategy (Lovelock, and Wirtz, 2011). These are the example of facility that have in
hypermarket and keep customer coming back into this business. The opportunity in
facility is to increase more customers by giving more facility for customer to make
decision in repurchasing they also have more option more choice to do in only one
place , it make more convenient for customer to have more activities in side one roof
of shopping place.
2.7.1 Restaurant Variety
Talking about restaurant in the mall or hypermarket most of customers are
coming to find this thing first, because food is a part of their life and they also want to
sit and talk and find the variety of food to eat meals that are cooked and served on the
place. And they also can choose the restaurant inside the market with a lot kind of
brand and a lot of kind of food, For example Kfc, Pizza, Raman, mk restaurant,
Swensen ice-cream, Chinese food, Japanese food. From the example we can imagine
the design of these restaurant with different color and different atmosphere and it also
depend on customer lifestyle and their need to choose and keep coming back to use
the service on it. These all restaurant also want customer to coming back again
because they need to make more profit to pay the rent when they open their shop, and
the major strategy that all business need is profit and their success, so they will need
to present the advertisement to keep coming back of customers.
2.7.2 Food Court
Food court is generally an indoor plaza or common area within the facility that
is contiguous with the counters of multiple food vendors and provides a common area
14
for self-serve dining (Landlord, 2009). Food court may found in the shopping malls,
airport, and parks (George, 2000). Food court consists of a numbers of vendors at
food stalls or service counters. Meals are ordered at one of the vendors and then
carried to a common dining area. The food may also be ordered as takeout for
consumption at another location, such as a home, or workplace. In this case, it may be
packaged in foam food containers, though one common food tray used by all the stalls
might also be utilized to allow the food to be carried to the table. Food courts may
also have shops which sell prepared meals for consumers to take home and warm,
making the food court a daily stop for some (Underhill, 2004). Food court is one of
the convenient places for customer to come and use the service. And this good sign to
keep customer coming back in hypermarket and to digest after meals by walking
around and shopping in it.
2.7.3 Parking Area
The retail business, or any business for that matter, is competitive enough
without losing customers because of a parking lot. Some folks may purposely stray
away from a place of business because of either the condition or configuration of the
parking lot. In summary, a parking lot is more than just a place to park. It is a
perception enhancer, a customer draw, and a great deal of responsibility. While it is
understandable to invest in aspects of the business that make it run, one should never
neglect to take care of this crucial element. Remember, parking lots are a welcome
mat to your business. In hypermarket business parking area is one of the most
important places for customer to come and used the service, parking area is a business
that hypermarket add in it. There are two type of parking area, first is to payment and
second is or free. By payment mostly have in big mall customer can booked it before
coming. And for free parking everyone can use the service. This business can also
have and creative idea for customer like they create the moon parking and the sun
parking, the moon parking is inside the building and the sun parking is outside the
building. Depending on the location of the parking space, there can be regulations
regarding the time allowed to park and a fee paid to use the parking space (kerb,
2009).

15
2.7.4 Inside & Outside shopping booth
Booth a stall compartment or light structure for the sale of goods or for display
purposes, as at a market, exhibition, or fair. Shopping booth effect on customer
because of the variety of the goods make customer to come and join with them and
purchase on it, most of the goods is like the clothes booth, food booth, etc. This also
can make customer go and purchase more in hypermarket because customer can join
different type of goods to find and purchase on it. If customer tough or pick up the
goods they are more likely to buy it. Customer shopping style are different some can
shopping alone this type of person only come and see the goods but not purchasing,
some coming with friend and their both have to purchase on the goods which they like
2.7.5 Banking Area
A bank is a financial agent that creates credit by lending money to a borrow,
thereby creating a consequent deposit on the bank’s balance sheet. Lending activates
can be performed either directly or indirectly through capital markets. Due to their
importance in the financial system and pressure on national economies, banks are
highly keeping pace in most countries. Most nations have institutionalized a system
known as incomplete preserve banking under which banks hold liquid assets equal to
only a fraction of their current liabilities. In addition to other regulations intended to
make sure liquidity, banks are generally subject to minimum capital necessities based
on an international set of capital standard, known as the Basel accords
(Hoggson,.1926). Banking Area in one of the important thing inside hypermarket it’s
convenient for customer to using the service. Different between street bank and bank
inside hypermarket, street bank is closed before bank inside hypermarket and most of
customer they are leaving their job late or after street bank closed and they have no
choice to come inside hypermarket and used the service.

16
2.8 Categories
Category management is a retailing and purchasing concept in which the range of
products purchased by a business organization or sold by a retailer is broken down
into discrete groups of similar or related products; these groups are known as product
categories (examples of grocery categories might be: tinned fish, washing detergent,
toothpastes). It is a systematic, disciplined approach to managing a product category
as a strategic business unit (Pradham, 2007). A lot of category can be defined in
hypermarket but researcher will talk about the facility in atmosphere in side
hypermarket.
2.8.1 Interior design
Interior design is all-around profession in which creative and technical solutions
are of use within a structure to complete a built interior environment. These solutions
are functional; improve the quality of life and culture of the occupants and are
aesthetically attractive. Designs are created in response to and matched with the
building shell and acknowledge the physical location and social framework of the
project. Designs must stick on to code and dictatorial requirements, and support the
principles of environmental sustainability. The interior design development follows a
systematic and coordinated methodology, including research, analysis and integration
of knowledge into the creative process, whereby the needs and resources of the client
are fulfilled to produce an interior space that fulfills the project goals
(http://www.ncidqexam.org/about-interior-design/definition-of-interior-design/). For
interior design in hypermarket inside we can see that they arrange and follow by the
season or the famous festival that happen at that time. Interior design is one of the
important things that can give customer coming back; most of the people are purchase
their money by seeing the color and the design of the places.
17
2.8.2 Layout
For Lotus and Big C their used type of layout in grid layout because both are
hypermarket that has much kind of products and there are limit merchandisers. It has
to separate products into categories for using space usefully, easy to find products, the
lighting should allow for large obstructions such as signage and seasonal decorations
to be displayed without causing shadowing, and there are always have music or
announcement in the stores to let people know about promotion in products
(http://achiism.onsugar.com/Store-type-layout-hypermarket-3732972). Store layout
should be convenience, allocation of shelf space to products, store flow pattern,
merchandise display, bendable, changeable and beautiful and attractive on customer
to make them come and make them interested on it. In hypermarket business layout
are important because its show that how professional you are in business, it have to
attractive on customer when they come and shop, and it have to be convenient for
them to find the goods.
2.8.3 Atmosphere
In marketing the term atmosphere is used to describe the discipline of designing
commercial spaces. Atmospherics was coined by Philip Kotler in a 1973 article in the
journal of Retailing (Kotler, 1973). Kotler argues that the tangible product is only a
small part of the total consumption package. Buyers respond to the total product,
which include service, warranties, packaging, advertising, financing, pleasantries,
images and so on. Atmospherics covers three major art forms important to retail:
architecture: exterior structure, interior design, and the design of window displays.
The atmosphere of a commercial space performs three functions: creating attention,
communication and affect (Kotler, 1973). Atmosphere in a retail store factors such as
design and fixtures, flooring, smell, sound level, store lighting and temperature, wall
coverings, and other elements of store’s ambience, which can be studied and
controller by a retailer to influence the customer’s buying mood, they should impress
when they come inside and have shopping. In today’s competitive marketplace,
retailers find it more difficult to differentiate their stores exclusively on the basis of
18
merchandise, price, and promotion, or location, place. Though, the store itself, can
offer a unique atmosphere that may influence the customers patronage decision
(Kotler, 1973 p. 74). In store elements such as color, lighting, style of music may have
more immediate effects on decision making than other marketing inputs such as
advertisements that are not present at the point of purchase (Baker & Grewal, 1994).
2.9 Brand
In 2001 His lop defined branding as "the process of creating a relationship or a
connection between a company's product and emotional perception of the customer
for the purpose of generating segregation among competition and building loyalty
among customers." In 2004 and 2008, Kapferer and Keller respectively defined it as a
fulfillment in customer expectations and consistent customer satisfaction (Shamoon &
Saiqa, 2011). Brand management is a function of marketing that uses special
techniques in order to increase the perceived value of a product. Based on the aims of
the established marketing strategy, brand management enables the price of products to
grow and builds loyal customers through positive associations and images or a strong
awareness of the brand ("Brand Management Definition", 2015).
2.9.1 Brand variety
Grocery retailing especially hypermarket is mainly based on self-service
(Swoboda, Morschett & Schramm, 2007). Grocery retailers sell variety of products
(Esbjerg and Larsen, 2009) and this is exactly what is being offered by hypermarkets.
Hypermarket retailing is a common industry to everyone regardless of social status,
income and even background. Product by hypermarket brand extension is also known
as private brand, store brand, retail brand, distributor brand, own label, own brand or
private label product (Burt and Davies, 2010), (Gomez and Rubio, 2008), (Tifferet
and Herstein, 2010). There are many varieties of brands with quality and good price
for customer to choose and selected the best one. In my opinion it is the good idea in
19
business to add more brand variety inside on place, it is convenient for customer to
come and used the service and they also can compare to another brand.
In hypermarket business brand variety is one of the most importance factors for
customer when they come and used the service inside. More of the customer likes to
buy on quality of brand more like to buy because of the brand. There are many
varieties of brands with quality and good price for customer to choose and selected
the best one. In my opinion it is the good idea in business to add more brand variety
inside on place, it is convenient for customer to come and used the service and they
also can compare to another brand. Variety of brand make customer easy to take
decision to purchase on it.
2.10 Consumer Behavior
2.10.1 Lifestyle
The term lifestyle can denote the interest, opinions, behaviors, and behavioral
orientations of an individual, group, or culture (Lynn, Angeline, 2011). Lifestyle is all
about the customer behavior or their hobby, it’s all about what they want in their life,
How they interested in their life, There are many lifestyle of the person, some in
luxury style, normal style, low style, relax style etc. We can see our lifestyle in many
action and many places, when we shopping in market that behavior can point out that
how we behavior when we shopping, we feel happy, lazy, or bored it shows our
lifestyle, some like to buy the expensive goods and some like to buy the cheapest
goods, some specific in quality and some specific in quantity. This call lifestyle of
person, in hypermarket most of the customer behavior is looking for cheapest price of
the goods, some like sale promotion, some like service, and this can see the different
lifestyle of person.
20
2.11 Related Research
Rajshekhar S Inglay & Rizwan S Dhalla (January 9 – 10, 2010) Application of
Systematic Layout Planning in Hypermarkets to study store layout is a very important
part of the store atmospherics and plays a major role in the customer’s store
experience. The store experience decides the customers repeat visit to the store. From
a retailer's perspective, the store layout determines the exposure to goods and thus
affects the chances of customer buying the goods. There is a need for developing a
systematic procedure of layout planning in retail stores which can provide a
competitive advantage to the retailer. Store Planning is considered more of an art.
Introducing a systematic procedure in the store layout planning can make the process
holistic and bring-in objectivity. An attempt is being made to modify and customize
the SLP for application in retail store/hypermarket planning. The modified SLP can
then serve as a very useful planning tool for the store layout planner. The approach
can be further extended by application of analytical methods to store layout planning.
Kah Loong Leow & Arsiah Bahron & Vincent Kong (Volume 6, Number 2,
December 2011) Commitment in the Hypermarket Industry: Today, Tomorrow, and
Days to Come International Journal of Business and Information this study aims at a
better understanding of organizational commitment in the hypermarket industry. It
focuses on hypermarkets that provide services in Klang Valley, Malaysia; namely,
Carrefour, Tesco, and Giant. Specifically, it seeks to measure the commitment level of
non-executives in those hypermarkets. A sample of 1,500 non-executives was drawn,
from which there were 463 respondents. Data were collected using self-administered
questionnaires designed by the researchers. Results showed a positive relationship
between organizational commitment and job satisfaction, organizational
empowerment and trust, career advancement opportunities, and perceived
organizational justice, but showed a negative relationship between education level and
organizational commitment; that is, the higher the employee’s education, the lower
his or her commitment level to the organization.
21
Hasliza Hassan & Muhammad Sabbir Rahman 2012 International Conference on
Economics, Business Innovation IPEDR vol.38 (2012) Conceptual Study of National
Brand towards Hypermarket Brand Extension through Brand Asset Valuator retailing
industry has been aggressively moving forward in the past two decades.
Hypermarkets have been introducing brand extension products by using the corporate
retail brand name to attract consumers to purchase more at affordable prices. This
concept has been widely accepted by Westerners as a way to reduce overall expenses
especially in fast moving consumption products. However, it is less accepted by
Malaysian due to their perceived quality. The introduction of “1 Malaysia” as a
national brand by the government has enlightened consumer on this branding concept.
This research paper is proposing a conceptual study to discover how far the national
brand could give impact on hypermarket brand extension. It is expected that the
positive valuation of national brand will influence similar valuation towards
hypermarkets brand extension and vice versa.
Salomão Alencar de Farias, & Edvan Cruz Aguiar1 & Francisco Vicente Sales
Melo (Online Published: January 23, 2014) Store Atmospherics and Experiential
Marketing: A Conceptual Framework and Research Propositions for An
Extraordinary Customer Experience the components of a store atmosphere that can be
manipulated to generate answers on individuals are related to sensory factors.
Experiential marketing that enhances the sensory aspects of consumption helps in
understanding the impact of retail environment on consumer behavior. Retailers
around the world have embraced the concept of customer experience management,
with many incorporating the notion into their mission statements, searching for the
creation of a distinctive customer experience for their customers (Verhoef et al.,
2009). The main objective of this paper is to propose a conceptual framework for an
extraordinary customer experience. The construction of this theoretical paper was
possible through the usage of desk research methodology. We reviewed the theory on
store atmospherics and customer experience, both related to the retail setting,
beginning on the 1950’s and ending on 2011. We also provide some research
propositions aiming to develop the knowledge in this field. It is concluded that it is
22
imperative for retailers today to take in account customers’ holistic experience as a
relevant tool to manage the retail operation in a scenario of global competition.
Han-Shen Chen & Tsuifang Hsieh (Accepted 22 November, 2010). The effect of
atmosphere on customer perceptions and customer behavior responses in chain store
supermarkets this study aims at exploring the theme of creating and managing store
atmosphere of chain store supermarket from customer’s point of view. The findings
from the study indicate: (1) The customer perceived factors of store atmosphere of
supermarket include 6 factors in 3 categories, that is, design factors, ambient factors
(including intangible factors and visual stimulus) and social factors (including image
of service personnel, image of other customers and environmental crowding); (2)
Store atmospheric factors have significant positive correlation with customer
approach behaviors, design factors being the most significant impact among all
factors. Store atmospheric factors will influence not only customer emotions but also
customer cognitive valuations of commodities and services. Customer cognitive
valuations and emotional responses will affect customer approach behaviors
significantly; meanwhile, customers’ cognitions and emotional responses will
moderator the impact of store atmosphere on customer behaviors partially; (3)
Customers with various characteristics (including different shopping planning, time
urgency, environmental familiarity etc.) have significant differences in customer
perceptions and behaviors in general. Finally, this study proposes specific suggestions
and measures of how to create a pleasant store atmosphere in chain store supermarket
according to results of empirical analyses.
23
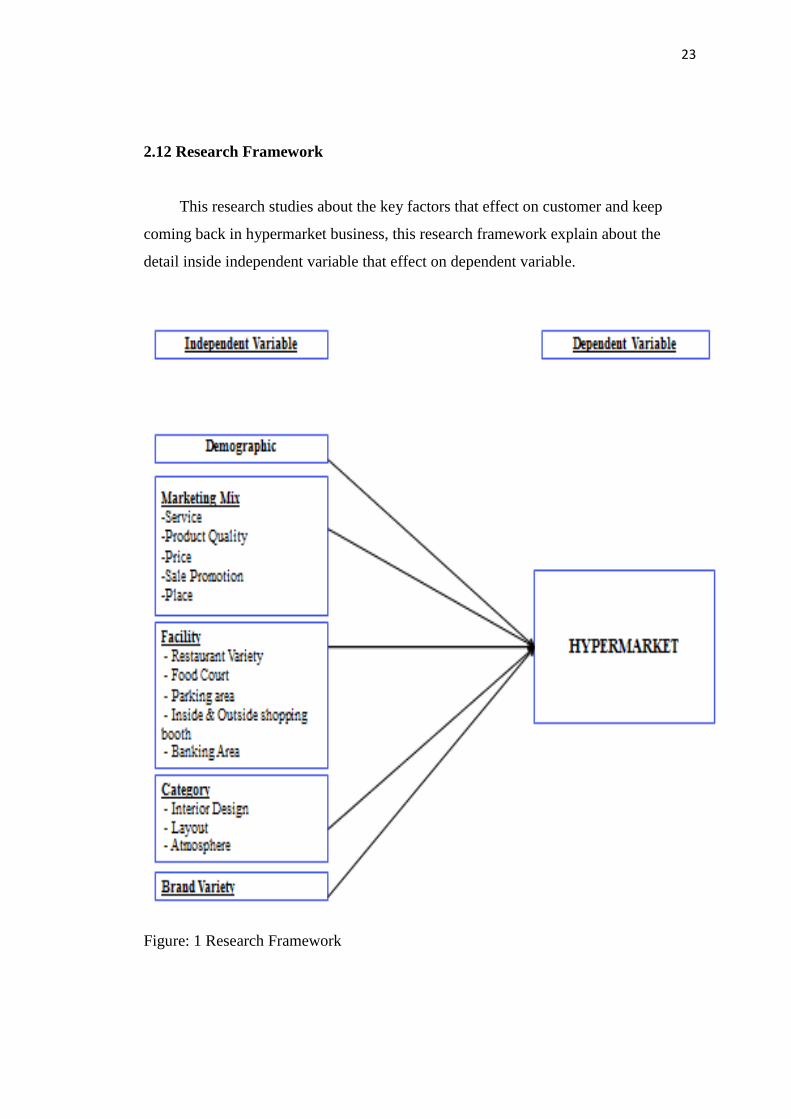
2.12 Research Framework
This research studies about the key factors that effect on customer and keep
coming back in hypermarket business, this research framework explain about the
detail inside independent variable that effect on dependent variable.
Figure: 1 Research Framework
24
2.13 Hypothesis
H1o: β service1, service2, service3 = 0
H1a: At least one of β service1, service2, service3 ≠ 0
H2o: β product quality1, product quality2 = 0
H2a: At least one of β product quality1, product quality2 ≠ 0
H3o: β price1, price2 = 0
H3a: At least one of β price1, price2, ≠ 0
H4o: β sale promotion1, sale promotion 2, sale promotion 3 = 0
H4a: At least one of β sale promotion 1, sale promotion 2, sale promotion 3 ≠ 0
H5o: β place1, place 2, place 3, place4 = 0
H5a: At least one of β place 1, place 2, place 3, place4 ≠ 0
H6o: β facility1, facility2, facility3, facility4 = 0
H6a: At least one of βfacility1, facility2, facility3, facility4 ≠ 0
H7o: β interior design1, interior design 2 = 0
H7a: At least one of β interior design1, interior design 2 ≠ 0
H8o: β brand variety1, brand variety 2, brand variety 3 = 0
H8a: At least one of β brand variety1, brand variety 2, brand variety 3 ≠ 0
CHAPTER 3
RESEARCH METHODOLOGY
This chapter researcher analysis about research design, populations and sample
selection, research instrument, reliability and validity assessment, data collection
procedure, statistic for data analysis.
3.2 Research Design
This research used a quantitative data, which distribute questionnaire using
Facebook, Email, and electronic paper to casual the group of population of data
collection process. The reason to study is done for identifying customers liking and
keep coming back to use the service of this kind of business and keep this business
growing in the future also. In term of business benefit, hypermarket will recognize
customer’s needs moreover, hypermarket can focus on how to work and develop
customer’s service. The information gain from study would help to guide the
hypermarket business to increase their responsiveness and understand the key factors
that would be increase the customers. Consequently, the overall of this research would
be the valuable information in order to plan to apply and develop further. In term of
customer benefit, customer can present their opinion about this hypermarket business.
This research could provide accurate the relation between variables which is related to
hypothesis.
3.3 Population and Sample Selection
Population in this research is a common person who knows the hypermarket
business and they used their service in daily life. They can be the student, officer,
employed, and self-employed in Thailand.
26
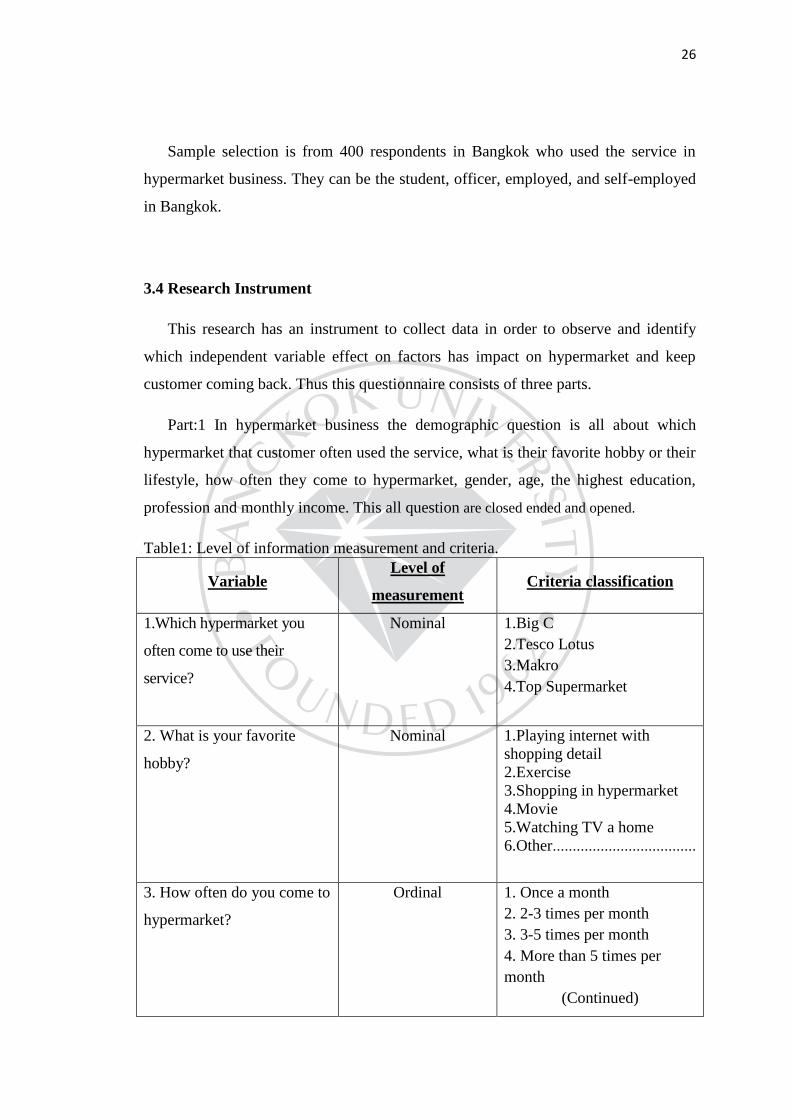
Sample selection is from 400 respondents in Bangkok who used the service in
hypermarket business. They can be the student, officer, employed, and self-employed
in Bangkok.
3.4 Research Instrument
This research has an instrument to collect data in order to observe and identify
which independent variable effect on factors has impact on hypermarket and keep
customer coming back. Thus this questionnaire consists of three parts.
Part:1 In hypermarket business the demographic question is all about which
hypermarket that customer often used the service, what is their favorite hobby or their
lifestyle, how often they come to hypermarket, gender, age, the highest education,
profession and monthly income. This all question are closed ended and opened.
Table1: Level of information measurement and criteria.
Variable Level of
measurement Criteria classification
1.Which hypermarket you
often come to use their
service?
Nominal 1.Big C
2.Tesco Lotus
3.Makro
4.Top Supermarket
2. What is your favorite
hobby?
Nominal 1.Playing internet with
shopping detail
2.Exercise
3.Shopping in hypermarket
4.Movie
5.Watching TV a home
6.Other....................................
3. How often do you come to
hypermarket?
Ordinal 1. Once a month
2. 2-3 times per month
3. 3-5 times per month
4. More than 5 times per
month
(Continued)
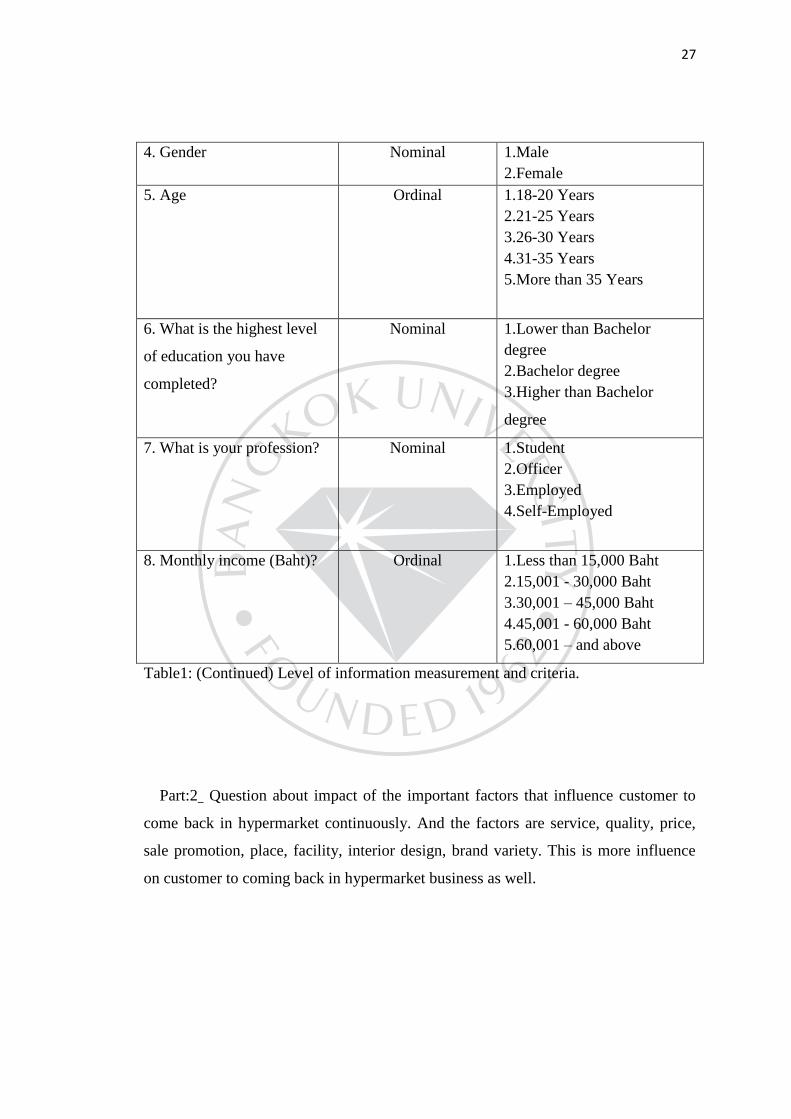
27
4. Gender Nominal 1.Male
2.Female
5. Age Ordinal 1.18-20 Years
2.21-25 Years
3.26-30 Years
4.31-35 Years
5.More than 35 Years
6. What is the highest level
of education you have
completed?
Nominal 1.Lower than Bachelor
degree
2.Bachelor degree
3.Higher than Bachelor
degree
7. What is your profession? Nominal 1.Student
2.Officer
3.Employed
4.Self-Employed
8. Monthly income (Baht)? Ordinal 1.Less than 15,000 Baht
2.15,001 - 30,000 Baht
3.30,001 – 45,000 Baht
4.45,001 - 60,000 Baht
5.60,001 – and above
Table1: (Continued) Level of information measurement and criteria.
Part:2 Question about impact of the important factors that influence customer to
come back in hypermarket continuously. And the factors are service, quality, price,
sale promotion, place, facility, interior design, brand variety. This is more influence
on customer to coming back in hypermarket business as well.
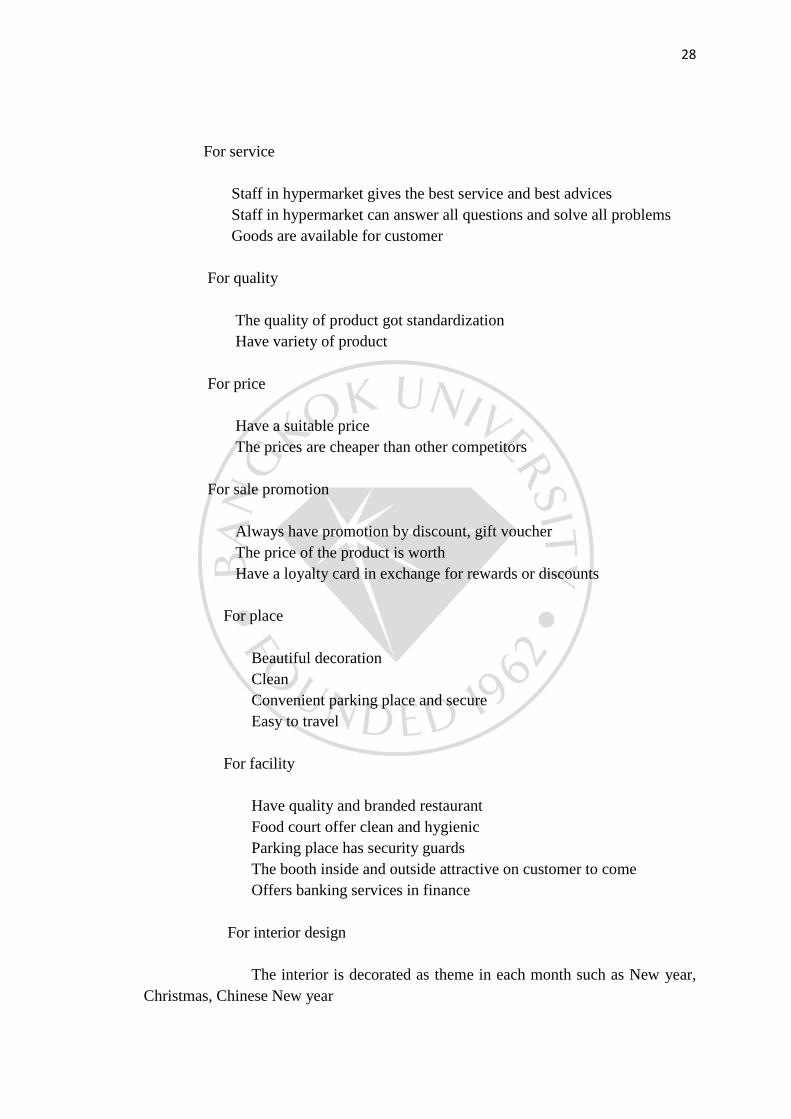
28
For service
Staff in hypermarket gives the best service and best advices
Staff in hypermarket can answer all questions and solve all problems
Goods are available for customer
For quality
The quality of product got standardization
Have variety of product
For price
Have a suitable price
The prices are cheaper than other competitors
For sale promotion
Always have promotion by discount, gift voucher
The price of the product is worth
Have a loyalty card in exchange for rewards or discounts
For place
Beautiful decoration
Clean
Convenient parking place and secure
Easy to travel
For facility
Have quality and branded restaurant
Food court offer clean and hygienic
Parking place has security guards
The booth inside and outside attractive on customer to come
Offers banking services in finance
For interior design
The interior is decorated as theme in each month such as New year,
Christmas, Chinese New year

29
The music system opens as in each season in that month
For brand variety
Have variety of brand with quality and price
Brand is famous
Brand is well known
These questionnaires are rated by respondents by five Likert scale. And each
scale is beginning with Strongly Agree, Agree, Neutral, Disagree, and Strong
Disagree. The score is set in each level as below,
Strong agree = 5
Agree = 4
Neutral = 3
Disagree = 2
Strong disagree = 1
The dimension analysis of the researcher used mean and interval class formula
to calculate the range of data in each stage as following.
= 0.8
Interval class = 𝑅𝑎𝑛𝑔𝑒 𝑀𝑎𝑥 𝑣𝑎𝑙𝑢𝑒 𝑀𝑖𝑛 𝑣𝑎𝑙𝑢𝑒
𝑁𝑢𝑚𝑏𝑒𝑟 𝑜𝑓 𝑖𝑛𝑡𝑒𝑟𝑣𝑎𝑙
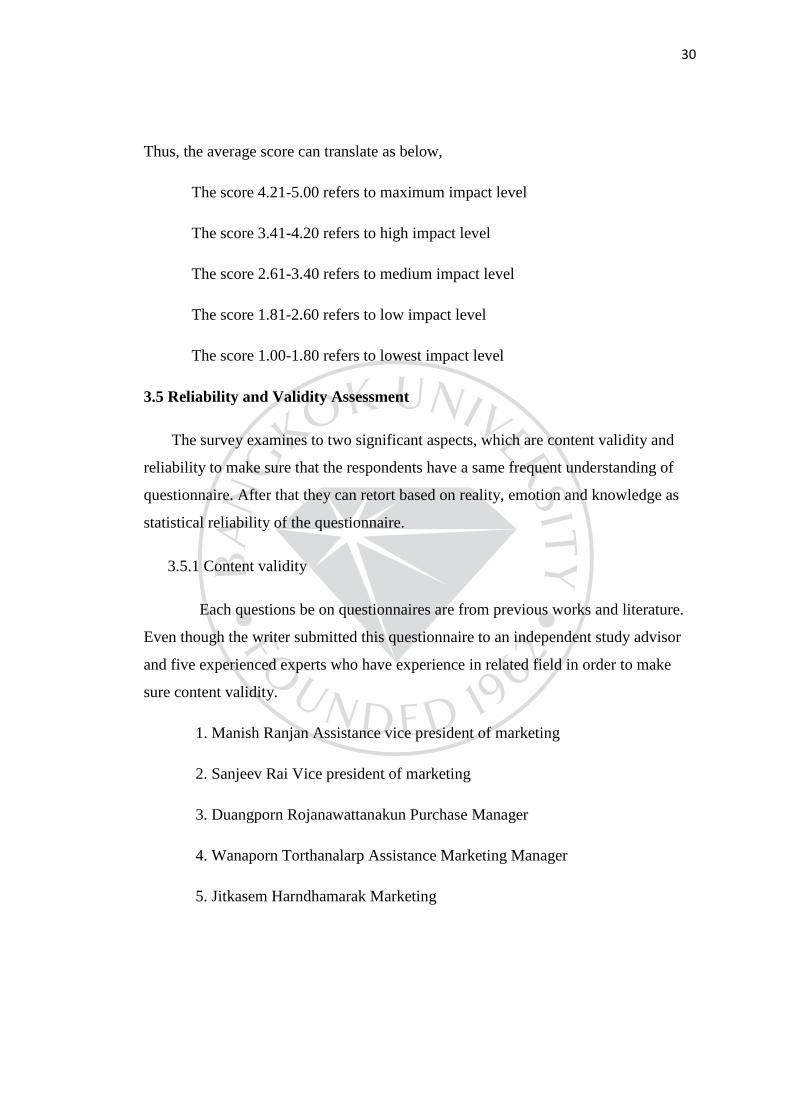
30
Thus, the average score can translate as below,
The score 4.21-5.00 refers to maximum impact level
The score 3.41-4.20 refers to high impact level
The score 2.61-3.40 refers to medium impact level
The score 1.81-2.60 refers to low impact level
The score 1.00-1.80 refers to lowest impact level
3.5 Reliability and Validity Assessment
The survey examines to two significant aspects, which are content validity and
reliability to make sure that the respondents have a same frequent understanding of
questionnaire. After that they can retort based on reality, emotion and knowledge as
statistical reliability of the questionnaire.
3.5.1 Content validity
Each questions be on questionnaires are from previous works and literature.
Even though the writer submitted this questionnaire to an independent study advisor
and five experienced experts who have experience in related field in order to make
sure content validity.
1. Manish Ranjan Assistance vice president of marketing
2. Sanjeev Rai Vice president of marketing
3. Duangporn Rojanawattanakun Purchase Manager
4. Wanaporn Torthanalarp Assistance Marketing Manager
5. Jitkasem Harndhamarak Marketing
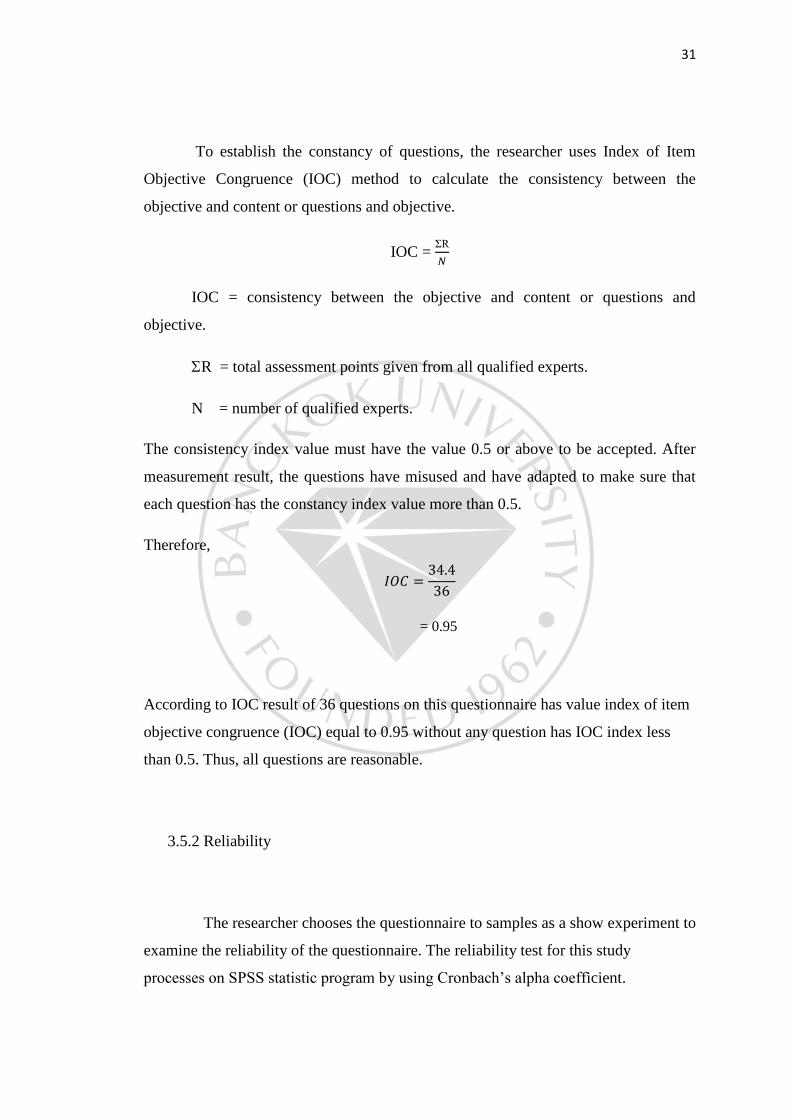
31
To establish the constancy of questions, the researcher uses Index of Item
Objective Congruence (IOC) method to calculate the consistency between the
objective and content or questions and objective.
IOC =
IOC = consistency between the objective and content or questions and
objective.
R = total assessment points given from all qualified experts.
N = number of qualified experts.
The consistency index value must have the value 0.5 or above to be accepted. After
measurement result, the questions have misused and have adapted to make sure that
each question has the constancy index value more than 0.5.
Therefore,
= 0.95
According to IOC result of 36 questions on this questionnaire has value index of item
objective congruence (IOC) equal to 0.95 without any question has IOC index less
than 0.5. Thus, all questions are reasonable.
3.5.2 Reliability
The researcher chooses the questionnaire to samples as a show experiment to
examine the reliability of the questionnaire. The reliability test for this study
processes on SPSS statistic program by using Cronbach’s alpha coefficient.
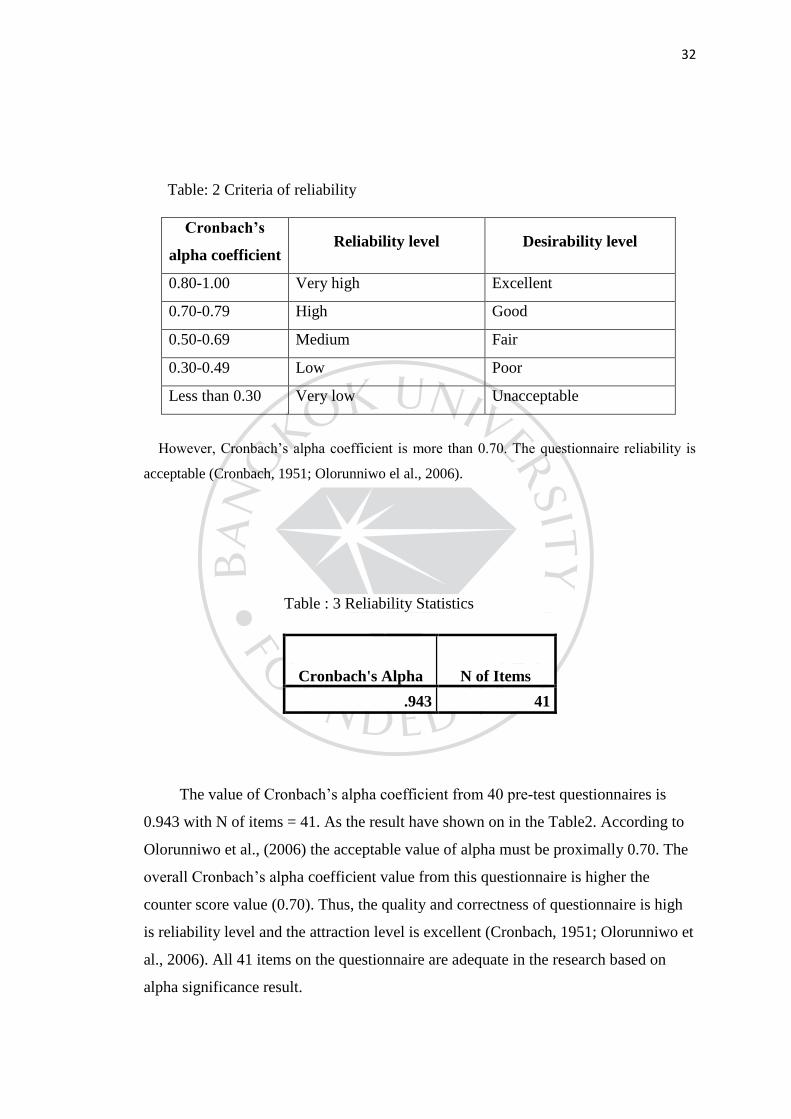
32
Table: 2 Criteria of reliability
Cronbach’s
alpha coefficient Reliability level Desirability level
0.80-1.00 Very high Excellent
0.70-0.79 High Good
0.50-0.69 Medium Fair
0.30-0.49 Low Poor
Less than 0.30 Very low Unacceptable
However, Cronbach’s alpha coefficient is more than 0.70. The questionnaire reliability is
acceptable (Cronbach, 1951; Olorunniwo el al., 2006).
The value of Cronbach’s alpha coefficient from 40 pre-test questionnaires is
0.943 with N of items = 41. As the result have shown on in the Table2. According to
Olorunniwo et al., (2006) the acceptable value of alpha must be proximally 0.70. The
overall Cronbach’s alpha coefficient value from this questionnaire is higher the
counter score value (0.70). Thus, the quality and correctness of questionnaire is high
is reliability level and the attraction level is excellent (Cronbach, 1951; Olorunniwo et
al., 2006). All 41 items on the questionnaire are adequate in the research based on
alpha significance result.
Table : 3 Reliability Statistics
Cronbach's Alpha N of Items
.943 41

33
3.6 Data Collection Procedure
The data that used in this research are from two sources, which are primary data
and secondary data.
For primary data the data is received from questionnaire implement that has been
self-administered by sample group. Total number of accomplished questionnaire is
400 respondents. The questionnaire spread by random sample groups that have
selected by the research in the capital city (Bangkok).
For secondary data the data has been composed, analyzed, and prepared on the
previous studies and literatures in related topic on EBSCO database, online articles,
books, journal, and website on top of related research.
Data collection process has been collected on September to October 2015 by
issue self-administered questionnaires to sample group as a result of channels by
using website questionnaires. The researcher separated the questionnaire into two
parts, which are General demographic questionnaires which are age, gender, monthly
income, profession, education level. & Main factors questionnaire which are
marketing mix questionnaire, facility questionnaire, category questionnaire, brand
variety questionnaire, and consumer behavior questionnaire.
3.7 Statistic for Data Analysis
Researcher processed and analysis by using SPSS program for dispensation and
statics analysis. The statistical are used to examine the information in this study are
following
Descriptive statistics to present the results by percentage used to analyze
the data for consumer in Bangkok area. Frequency, the percentage and
frequency (number of respondents) for the qualitative variables including
age, education, occupation, income, Hobby and lifestyle. Cross
tabulation, the contingency analysis to analyze categorical data by the
34
number of frequency of respondents that can explain specific characteristic
of the research (dominance).
Inferential statistics correlations factors those are connected with a
statistically in hypothesis. Data were analyzed using the statistic package
(SPSS) for the computer to test the relationship between the dependent
variable and independent variable in the hypothesis. Regression Analysis
is used to test hypothesis that both variables are quantitative variables. And
especially used the main of questionnaire in part two to analysis the
hypothesis testing.
CHAPTER 4
RESEARCH FINDING AND DATA ANALYSIS
This chapter will discuss the analysis methodology and describe data presentation
from the analysis to understand the factor that effect on the customer and keep them
coming back in hypermarket business, this research will use SPSS program for showing
the data presentation in this chapter and analyze the result. Information of this chapter
acquire from the questionnaires survey by using 400 Respondents based on the
conceptual framework was presented and discussed in order to prove the research
objective which include data analysis and the results of this study.
The result of hypermarket that effect on customer and keep them coming back
will be separate in to four parts,
4.2 The analysis of general demographics and consumer behavior the data used to
do with frequency and percentage.
4.3 The analysis of cross tabulation to explained the factors that keep customer
coming back to hypermarket business.
4.4 The analysis of multinomial logistic regression to study the most important
factors that keep customer coming back in hypermarket business.
4.5 The hypothesis testing

36
4.2 The Analysis of General Demographics and Consumer Behavior the Data
used to do with Frequency and Percentage.
Table: 4 frequency and percentage
Which hypermarket you often come to use their service?
Frequency Percent Valid Percent
Cumulative
Percent
Valid Big C 156 39.0 39.0 39.0
Tesco Lotus 124 31.0 31.0 70.0
Makro 59 14.8 14.8 84.8
Top Supermarket 61 15.3 15.3 100.0
Total 400 100.0 100.0
The majority of respondents are often come to use the service is in Big C with
frequency of 156 in (39%) follow by Tesco Lotus with frequency of 124 in (31%),
Top Supermarket with frequency of 61 in (15.3%) and Makro with respondent less
than 60 people with 59 in (14.8%) respectively.
Table: 5 frequency and percentage
What is your favorite hobby?
Frequency Percent Valid Percent
Cumulative
Percent
Valid Playing internet with
shopping detail 71 17.8 17.8 17.8
Exercise 61 15.3 15.3 33.0
Shopping in hypermarket 111 27.8 27.8 60.8
Movie 40 10.0 10.0 70.8
Watching TV a home 113 28.3 28.3 99.0
Other 4 1.0 1.0 100.0
Total 400 100.0 100.0
37
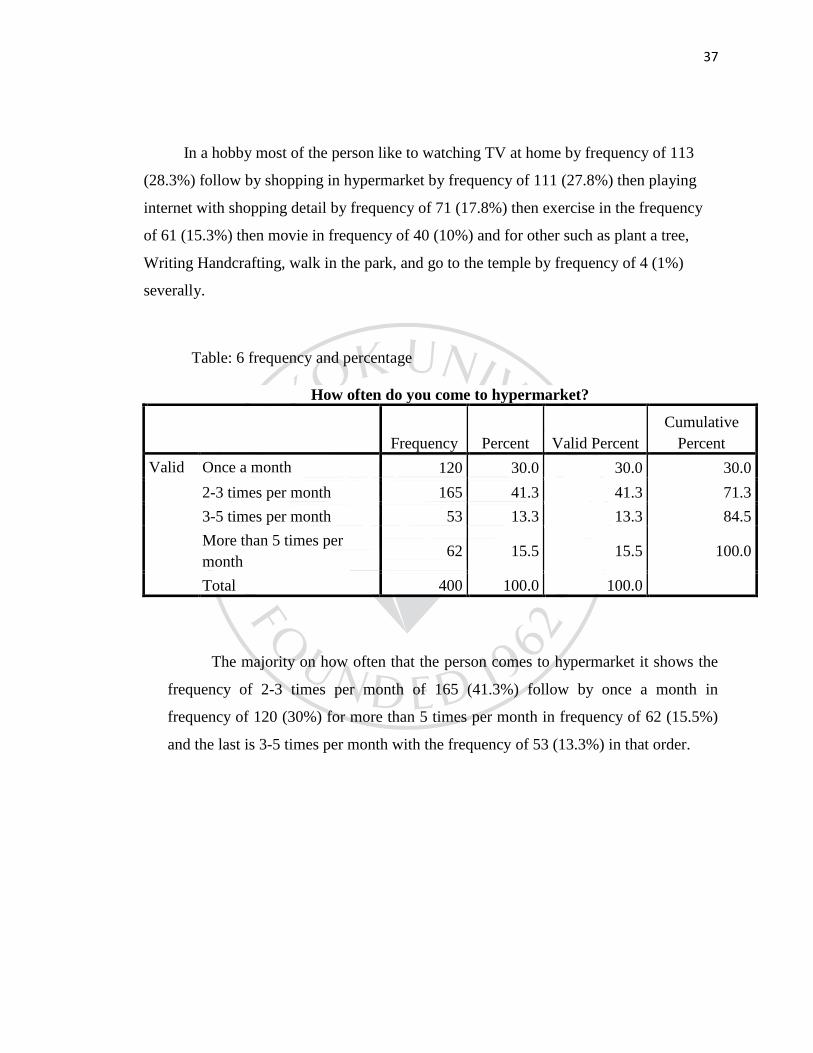
In a hobby most of the person like to watching TV at home by frequency of 113
(28.3%) follow by shopping in hypermarket by frequency of 111 (27.8%) then playing
internet with shopping detail by frequency of 71 (17.8%) then exercise in the frequency
of 61 (15.3%) then movie in frequency of 40 (10%) and for other such as plant a tree,
Writing Handcrafting, walk in the park, and go to the temple by frequency of 4 (1%)
severally.
Table: 6 frequency and percentage
How often do you come to hypermarket?
Frequency Percent Valid Percent
Cumulative
Percent
Valid Once a month 120 30.0 30.0 30.0
2-3 times per month 165 41.3 41.3 71.3
3-5 times per month 53 13.3 13.3 84.5
More than 5 times per
month 62 15.5 15.5 100.0
Total 400 100.0 100.0
The majority on how often that the person comes to hypermarket it shows the
frequency of 2-3 times per month of 165 (41.3%) follow by once a month in
frequency of 120 (30%) for more than 5 times per month in frequency of 62 (15.5%)
and the last is 3-5 times per month with the frequency of 53 (13.3%) in that order.
38
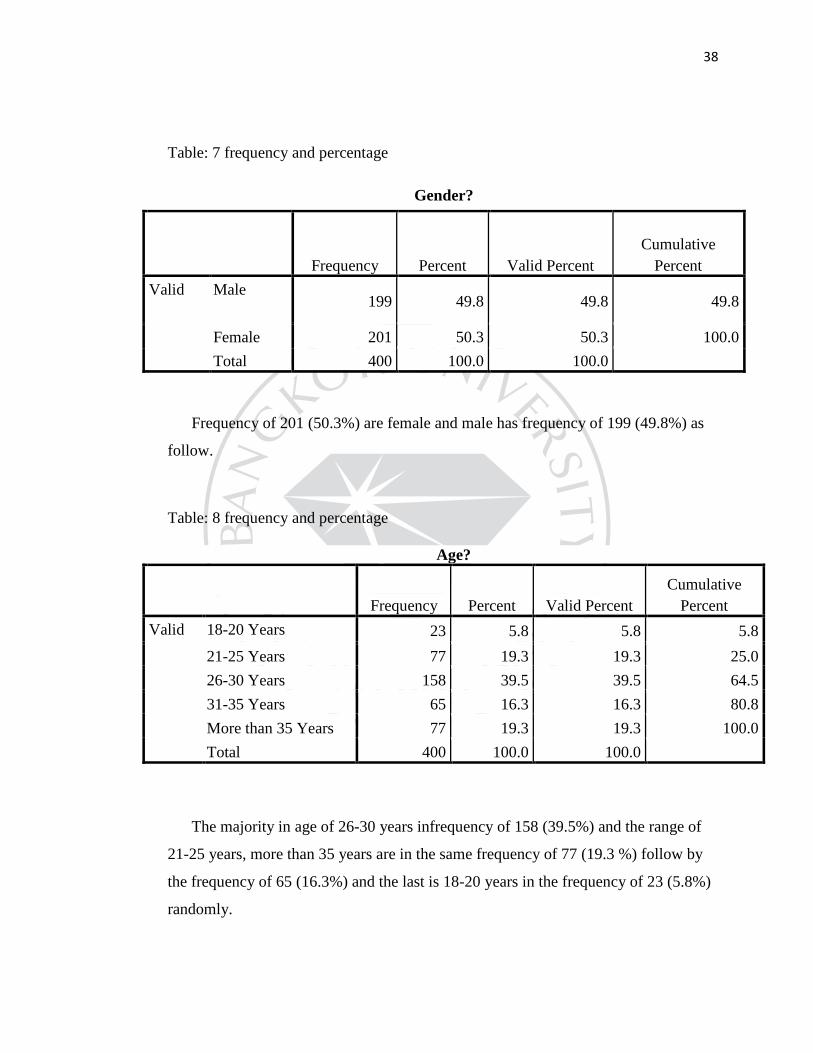
Table: 7 frequency and percentage
Gender?
Frequency Percent Valid Percent
Cumulative
Percent
Valid Male 199 49.8 49.8 49.8
Female 201 50.3 50.3 100.0
Total 400 100.0 100.0
Frequency of 201 (50.3%) are female and male has frequency of 199 (49.8%) as
follow.
Table: 8 frequency and percentage
Age?
Frequency Percent Valid Percent
Cumulative
Percent
Valid 18-20 Years 23 5.8 5.8 5.8
21-25 Years 77 19.3 19.3 25.0
26-30 Years 158 39.5 39.5 64.5
31-35 Years 65 16.3 16.3 80.8
More than 35 Years 77 19.3 19.3 100.0
Total 400 100.0 100.0
The majority in age of 26-30 years infrequency of 158 (39.5%) and the range of
21-25 years, more than 35 years are in the same frequency of 77 (19.3 %) follow by
the frequency of 65 (16.3%) and the last is 18-20 years in the frequency of 23 (5.8%)
randomly.
39
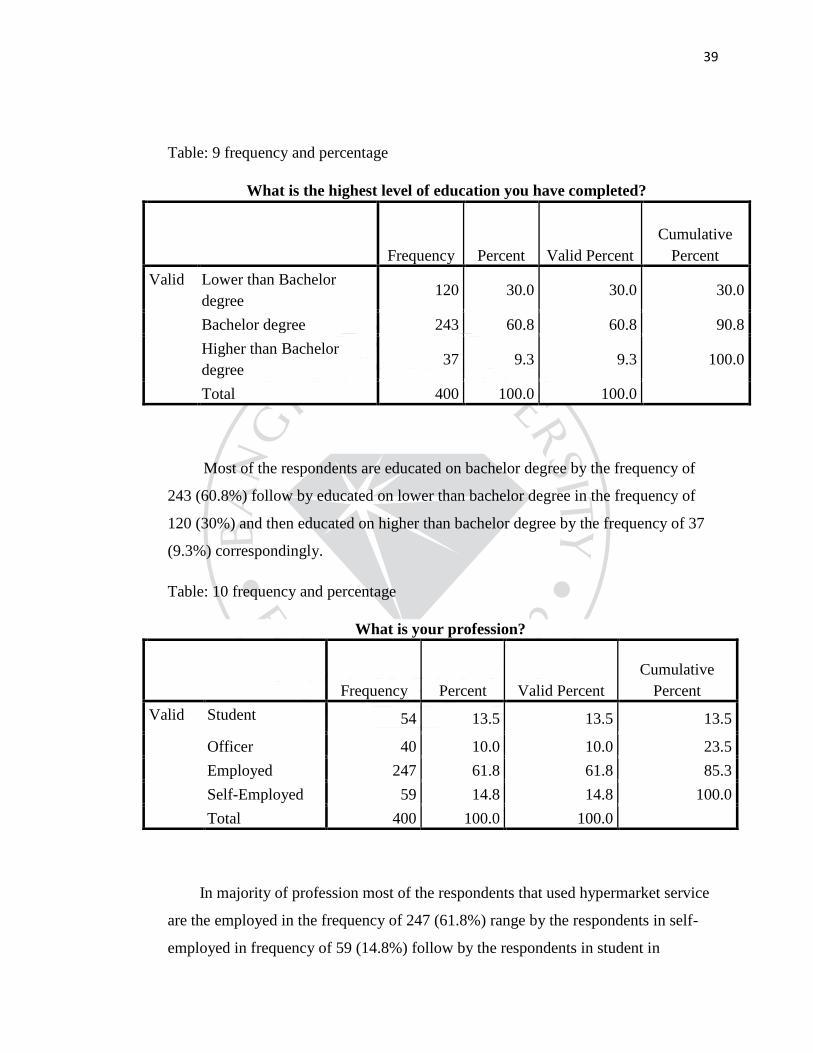
Table: 9 frequency and percentage
What is the highest level of education you have completed?
Frequency Percent Valid Percent
Cumulative
Percent
Valid Lower than Bachelor
degree 120 30.0 30.0 30.0
Bachelor degree 243 60.8 60.8 90.8
Higher than Bachelor
degree 37 9.3 9.3 100.0
Total 400 100.0 100.0
Most of the respondents are educated on bachelor degree by the frequency of
243 (60.8%) follow by educated on lower than bachelor degree in the frequency of
120 (30%) and then educated on higher than bachelor degree by the frequency of 37
(9.3%) correspondingly.
Table: 10 frequency and percentage
What is your profession?
Frequency Percent Valid Percent
Cumulative
Percent
Valid Student 54 13.5 13.5 13.5
Officer 40 10.0 10.0 23.5
Employed 247 61.8 61.8 85.3
Self-Employed 59 14.8 14.8 100.0
Total 400 100.0 100.0
In majority of profession most of the respondents that used hypermarket service
are the employed in the frequency of 247 (61.8%) range by the respondents in self-
employed in frequency of 59 (14.8%) follow by the respondents in student in
40
frequency of 54 (13.5%) and the last with respondent in officer in frequency of 40
(10%) respectively.
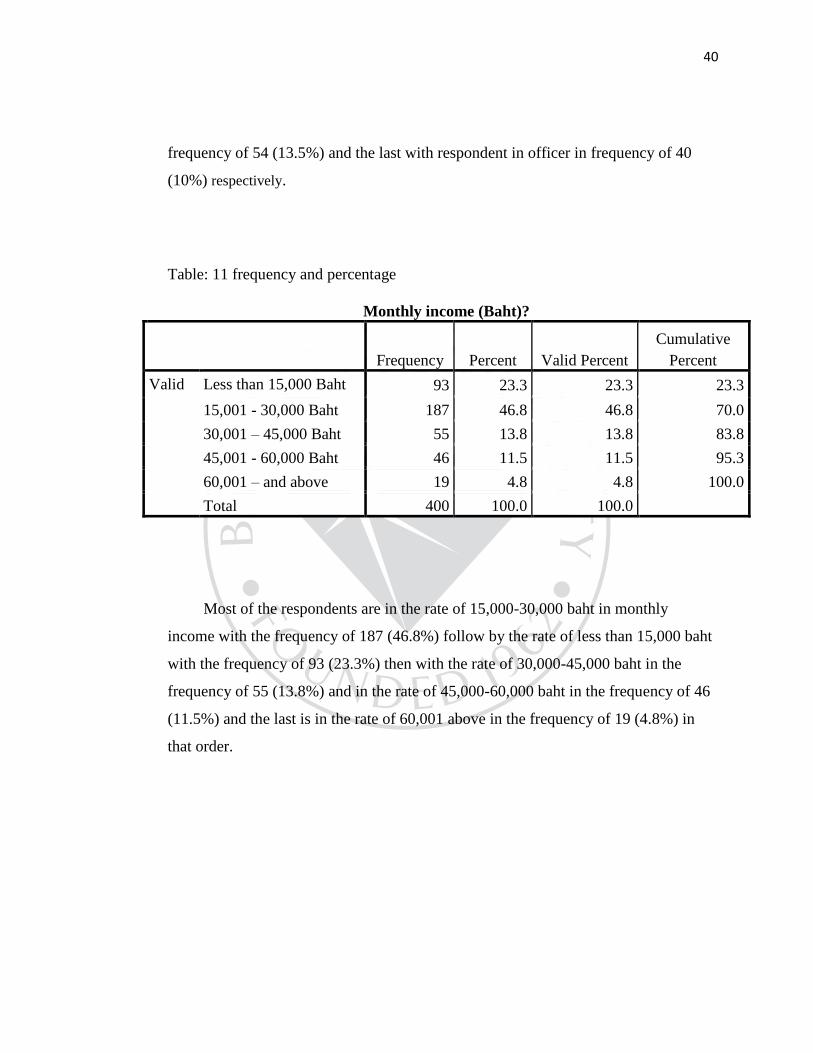
Table: 11 frequency and percentage
Monthly income (Baht)?
Frequency Percent Valid Percent
Cumulative
Percent
Valid Less than 15,000 Baht 93 23.3 23.3 23.3
15,001 - 30,000 Baht 187 46.8 46.8 70.0
30,001 – 45,000 Baht 55 13.8 13.8 83.8
45,001 - 60,000 Baht 46 11.5 11.5 95.3
60,001 – and above 19 4.8 4.8 100.0
Total 400 100.0 100.0
Most of the respondents are in the rate of 15,000-30,000 baht in monthly
income with the frequency of 187 (46.8%) follow by the rate of less than 15,000 baht
with the frequency of 93 (23.3%) then with the rate of 30,000-45,000 baht in the
frequency of 55 (13.8%) and in the rate of 45,000-60,000 baht in the frequency of 46
(11.5%) and the last is in the rate of 60,001 above in the frequency of 19 (4.8%) in
that order.
41
4.3 The Analysis of Cross Tabulation to Explained the Factors that Keep Customer
Coming Back to Hypermarket Business.
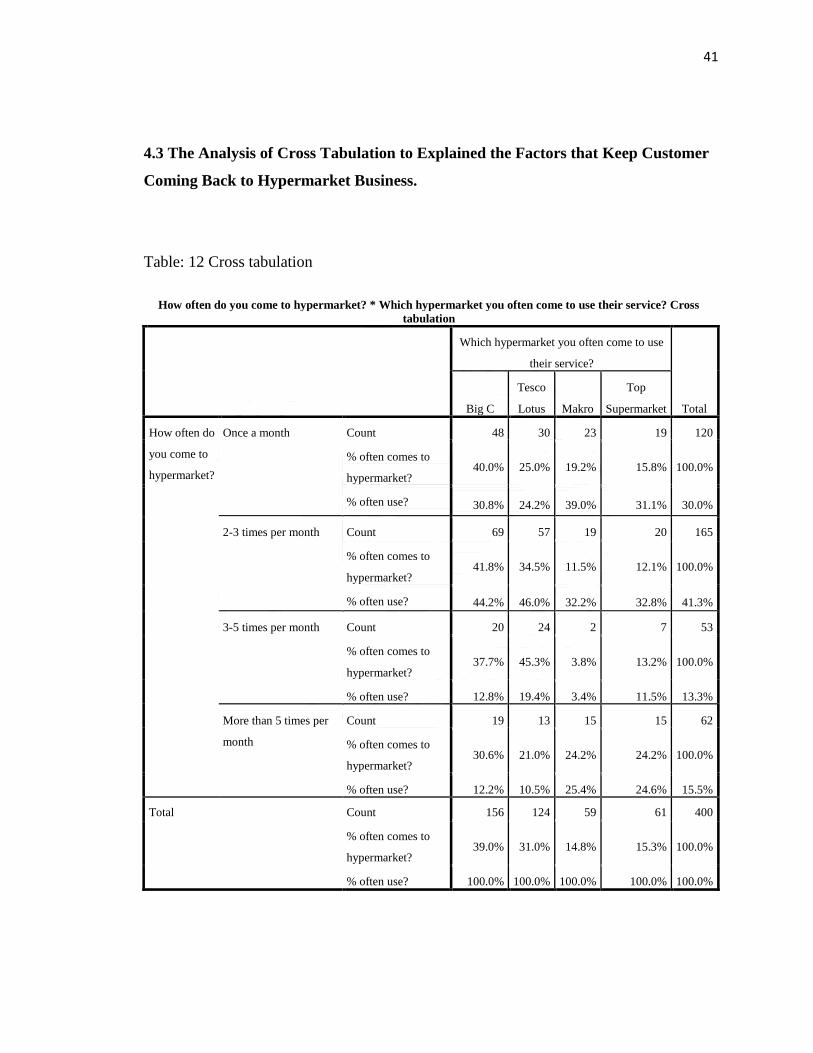
Table: 12 Cross tabulation
How often do you come to hypermarket? * Which hypermarket you often come to use their service? Cross
tabulation
Which hypermarket you often come to use
their service?
Total Big C
Tesco
Lotus Makro
Top
Supermarket
How often do
you come to
hypermarket?
Once a month Count 48 30 23 19 120
% often comes to
hypermarket? 40.0% 25.0% 19.2% 15.8% 100.0%
% often use? 30.8% 24.2% 39.0% 31.1% 30.0%
2-3 times per month Count 69 57 19 20 165
% often comes to
hypermarket? 41.8% 34.5% 11.5% 12.1% 100.0%
% often use? 44.2% 46.0% 32.2% 32.8% 41.3%
3-5 times per month Count 20 24 2 7 53
% often comes to
hypermarket? 37.7% 45.3% 3.8% 13.2% 100.0%
% often use? 12.8% 19.4% 3.4% 11.5% 13.3%
More than 5 times per
month
Count 19 13 15 15 62
% often comes to
hypermarket? 30.6% 21.0% 24.2% 24.2% 100.0%
% often use? 12.2% 10.5% 25.4% 24.6% 15.5%
Total Count 156 124 59 61 400
% often comes to
hypermarket? 39.0% 31.0% 14.8% 15.3% 100.0%
% often use? 100.0% 100.0% 100.0% 100.0% 100.0%
42
For the often of the customer to come into the hypermarket can show that in this table most of
the respondents often come into Big C with the number of 156 out of 400 respondents or (39%) and
then Tesco Lotus is the second range by the number of 124 out of 400 respondents or (31%) and
follow by Makro in the number of 61 out of 400 respondent or (15.3%) and end by Top supermarket
with the lowest number of 59 out of 400 respondents or (14.8%) randomly.
In this table researcher analyzed that most of the respondents often come to used Big C, service
with the number of (44.2%) Tesco Lotus with the number of (46%) and Top supermarket with the
number of (32.2%) and their regularly come around 2-3 times per month and for Makro the
respondents come to used their service with the number of (39%) in the regularly of once a month.
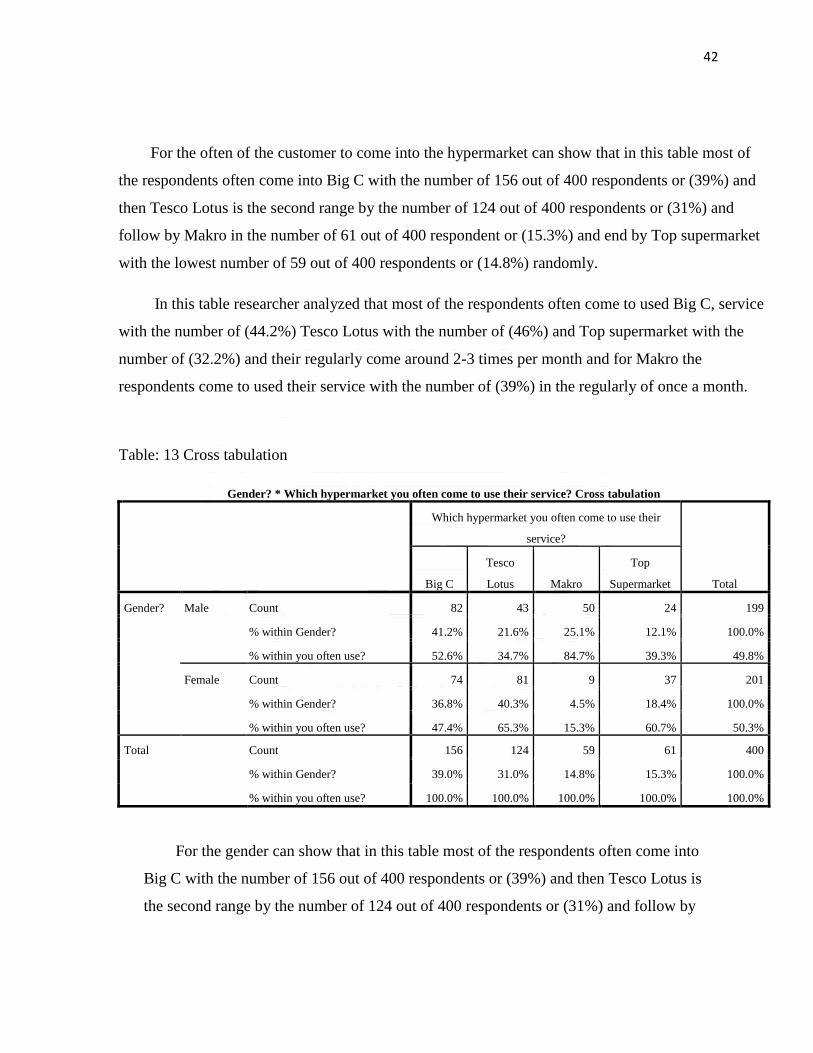
Table: 13 Cross tabulation
Gender? * Which hypermarket you often come to use their service? Cross tabulation
Which hypermarket you often come to use their
service?
Total Big C
Tesco
Lotus Makro
Top
Supermarket
Gender? Male Count 82 43 50 24 199
% within Gender? 41.2% 21.6% 25.1% 12.1% 100.0%
% within you often use? 52.6% 34.7% 84.7% 39.3% 49.8%
Female Count 74 81 9 37 201
% within Gender? 36.8% 40.3% 4.5% 18.4% 100.0%
% within you often use? 47.4% 65.3% 15.3% 60.7% 50.3%
Total Count 156 124 59 61 400
% within Gender? 39.0% 31.0% 14.8% 15.3% 100.0%
% within you often use? 100.0% 100.0% 100.0% 100.0% 100.0%
For the gender can show that in this table most of the respondents often come into
Big C with the number of 156 out of 400 respondents or (39%) and then Tesco Lotus is
the second range by the number of 124 out of 400 respondents or (31%) and follow by
43
Makro in the number of 61 out of 400 respondent or (15.3%) and end by Top
supermarket with the lowest number of 59 out of 400 respondents or (14.8%) randomly.
In this table researcher analyzed that most of the respondent’s gender in Big C are
male by the number of (52.6%) and in Tesco Lotus most of the respondents are female
by the number of (65.3%) and in Makro most of the respondents are male by the number
of (84.7%) and the last in Top supermarket most of the respondents are female by the
number of (60.7%).
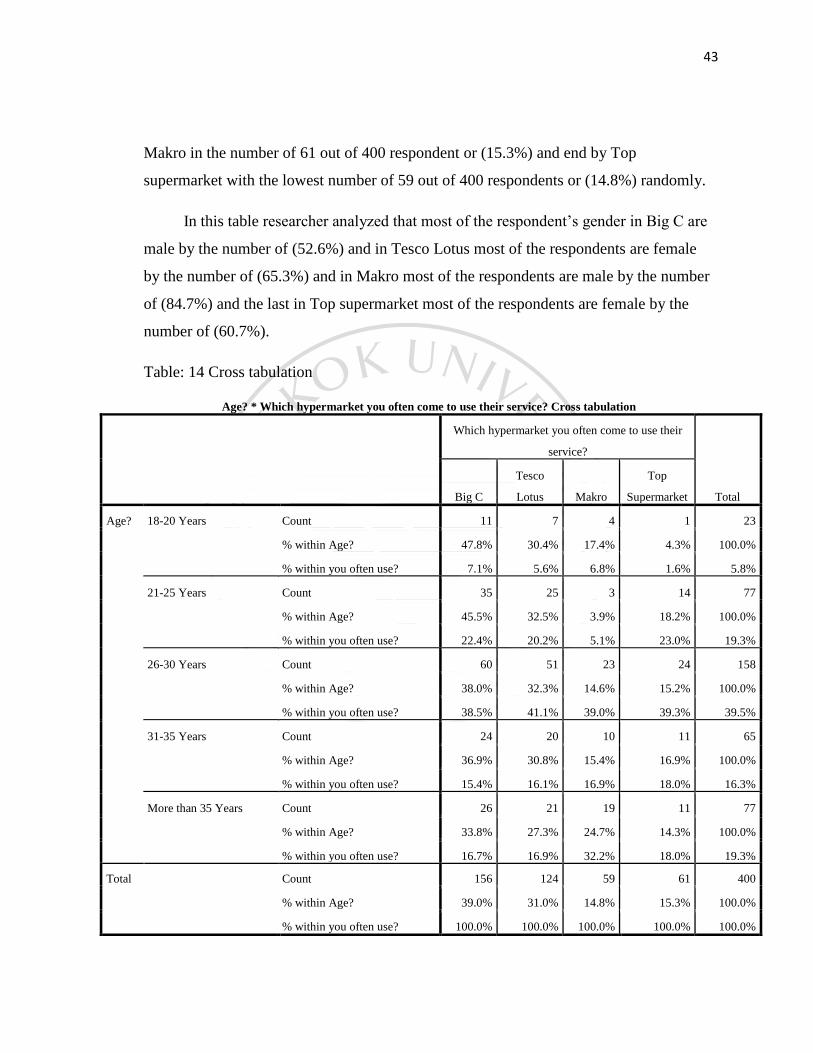
Table: 14 Cross tabulation
Age? * Which hypermarket you often come to use their service? Cross tabulation
Which hypermarket you often come to use their
service?
Total Big C
Tesco
Lotus Makro
Top
Supermarket
Age? 18-20 Years Count 11 7 4 1 23
% within Age? 47.8% 30.4% 17.4% 4.3% 100.0%
% within you often use? 7.1% 5.6% 6.8% 1.6% 5.8%
21-25 Years Count 35 25 3 14 77
% within Age? 45.5% 32.5% 3.9% 18.2% 100.0%
% within you often use? 22.4% 20.2% 5.1% 23.0% 19.3%
26-30 Years Count 60 51 23 24 158
% within Age? 38.0% 32.3% 14.6% 15.2% 100.0%
% within you often use? 38.5% 41.1% 39.0% 39.3% 39.5%
31-35 Years Count 24 20 10 11 65
% within Age? 36.9% 30.8% 15.4% 16.9% 100.0%
% within you often use? 15.4% 16.1% 16.9% 18.0% 16.3%
More than 35 Years Count 26 21 19 11 77
% within Age? 33.8% 27.3% 24.7% 14.3% 100.0%
% within you often use? 16.7% 16.9% 32.2% 18.0% 19.3%
Total Count 156 124 59 61 400
% within Age? 39.0% 31.0% 14.8% 15.3% 100.0%
% within you often use? 100.0% 100.0% 100.0% 100.0% 100.0%
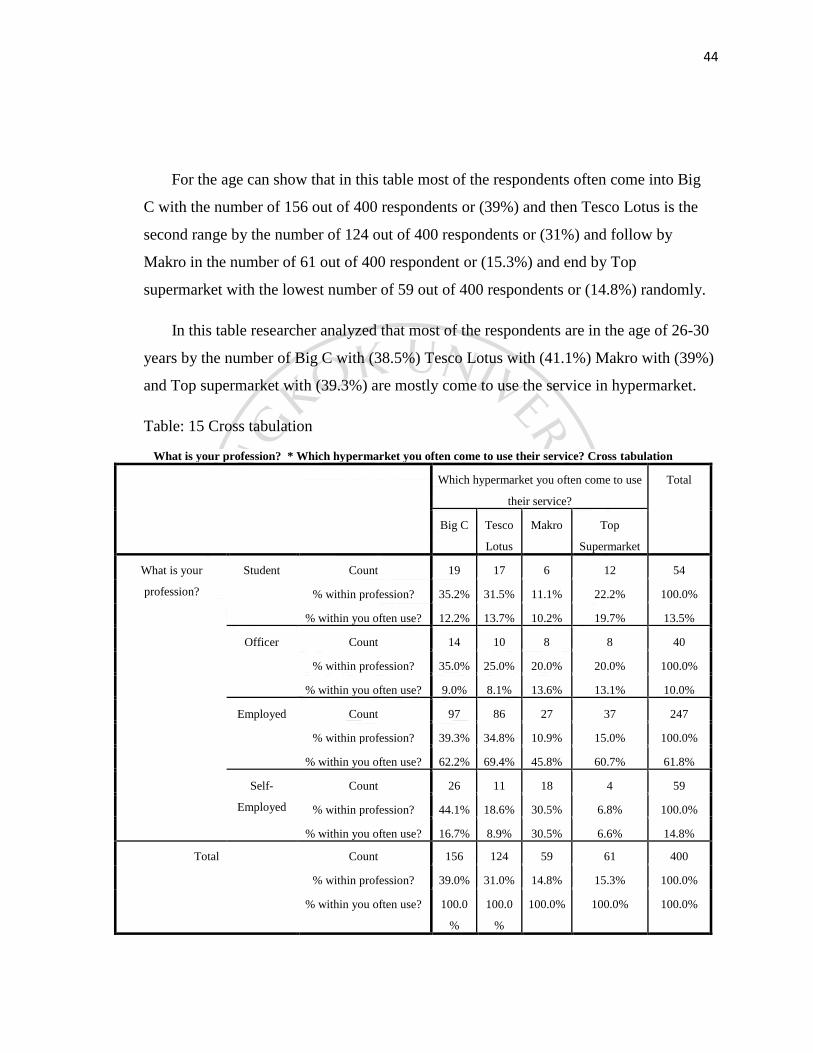
44
For the age can show that in this table most of the respondents often come into Big
C with the number of 156 out of 400 respondents or (39%) and then Tesco Lotus is the
second range by the number of 124 out of 400 respondents or (31%) and follow by
Makro in the number of 61 out of 400 respondent or (15.3%) and end by Top
supermarket with the lowest number of 59 out of 400 respondents or (14.8%) randomly.
In this table researcher analyzed that most of the respondents are in the age of 26-30
years by the number of Big C with (38.5%) Tesco Lotus with (41.1%) Makro with (39%)
and Top supermarket with (39.3%) are mostly come to use the service in hypermarket.
Table: 15 Cross tabulation
What is your profession? * Which hypermarket you often come to use their service? Cross tabulation
Which hypermarket you often come to use
their service?
Total
Big C Tesco
Lotus
Makro Top
Supermarket
What is your
profession?
Student Count 19 17 6 12 54
% within profession? 35.2% 31.5% 11.1% 22.2% 100.0%
% within you often use? 12.2% 13.7% 10.2% 19.7% 13.5%
Officer Count 14 10 8 8 40
% within profession? 35.0% 25.0% 20.0% 20.0% 100.0%
% within you often use? 9.0% 8.1% 13.6% 13.1% 10.0%
Employed Count 97 86 27 37 247
% within profession? 39.3% 34.8% 10.9% 15.0% 100.0%
% within you often use? 62.2% 69.4% 45.8% 60.7% 61.8%
Self-
Employed
Count 26 11 18 4 59
% within profession? 44.1% 18.6% 30.5% 6.8% 100.0%
% within you often use? 16.7% 8.9% 30.5% 6.6% 14.8%
Total Count 156 124 59 61 400
% within profession? 39.0% 31.0% 14.8% 15.3% 100.0%
% within you often use? 100.0
%
100.0
%
100.0% 100.0% 100.0%
45
For the profession can show that in this table most of the respondents often come
into Big C with the number of 156 out of 400 respondents or (39%) and then Tesco
Lotus is the second range by the number of 124 out of 400 respondents or (31%) and
follow by Makro in the number of 61 out of 400 respondent or (15.3%) and end by Top
supermarket with the lowest number of 59 out of 400 respondents or (14.8%) randomly.
In this table researcher analyzed that most of the respondents are employed with the
number in Big C with (62.2%) Tesco Lotus with (69.4%) Makro with (45.8%) and the
last is Top supermarket with (60.7%) respectively.
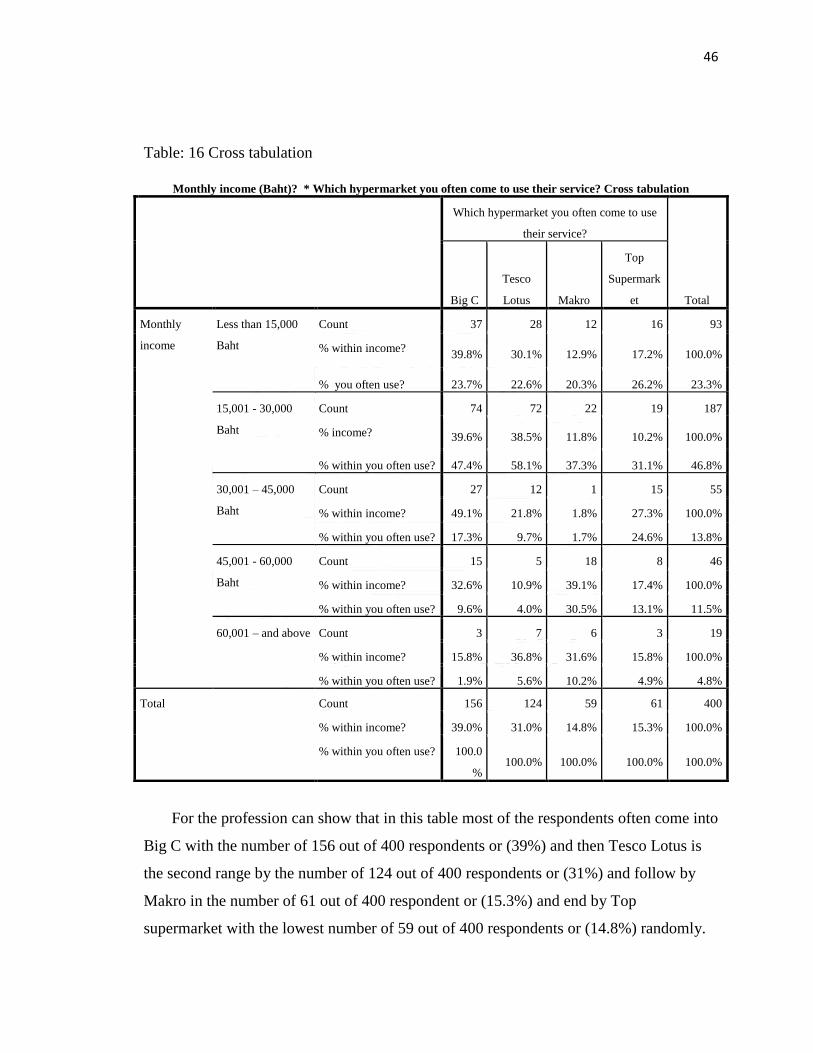
46
Table: 16 Cross tabulation
For the profession can show that in this table most of the respondents often come into
Big C with the number of 156 out of 400 respondents or (39%) and then Tesco Lotus is
the second range by the number of 124 out of 400 respondents or (31%) and follow by
Makro in the number of 61 out of 400 respondent or (15.3%) and end by Top
supermarket with the lowest number of 59 out of 400 respondents or (14.8%) randomly.
Monthly income (Baht)? * Which hypermarket you often come to use their service? Cross tabulation
Which hypermarket you often come to use
their service?
Total Big C
Tesco
Lotus Makro
Top
Supermark
et
Monthly
income
Less than 15,000
Baht
Count 37 28 12 16 93
% within income? 39.8% 30.1% 12.9% 17.2% 100.0%
% you often use? 23.7% 22.6% 20.3% 26.2% 23.3%
15,001 - 30,000
Baht
Count 74 72 22 19 187
% income? 39.6% 38.5% 11.8% 10.2% 100.0%
% within you often use? 47.4% 58.1% 37.3% 31.1% 46.8%
30,001 – 45,000
Baht
Count 27 12 1 15 55
% within income? 49.1% 21.8% 1.8% 27.3% 100.0%
% within you often use? 17.3% 9.7% 1.7% 24.6% 13.8%
45,001 - 60,000
Baht
Count 15 5 18 8 46
% within income? 32.6% 10.9% 39.1% 17.4% 100.0%
% within you often use? 9.6% 4.0% 30.5% 13.1% 11.5%
60,001 – and above Count 3 7 6 3 19
% within income? 15.8% 36.8% 31.6% 15.8% 100.0%
% within you often use? 1.9% 5.6% 10.2% 4.9% 4.8%
Total Count 156 124 59 61 400
% within income? 39.0% 31.0% 14.8% 15.3% 100.0%
% within you often use? 100.0
% 100.0% 100.0% 100.0% 100.0%
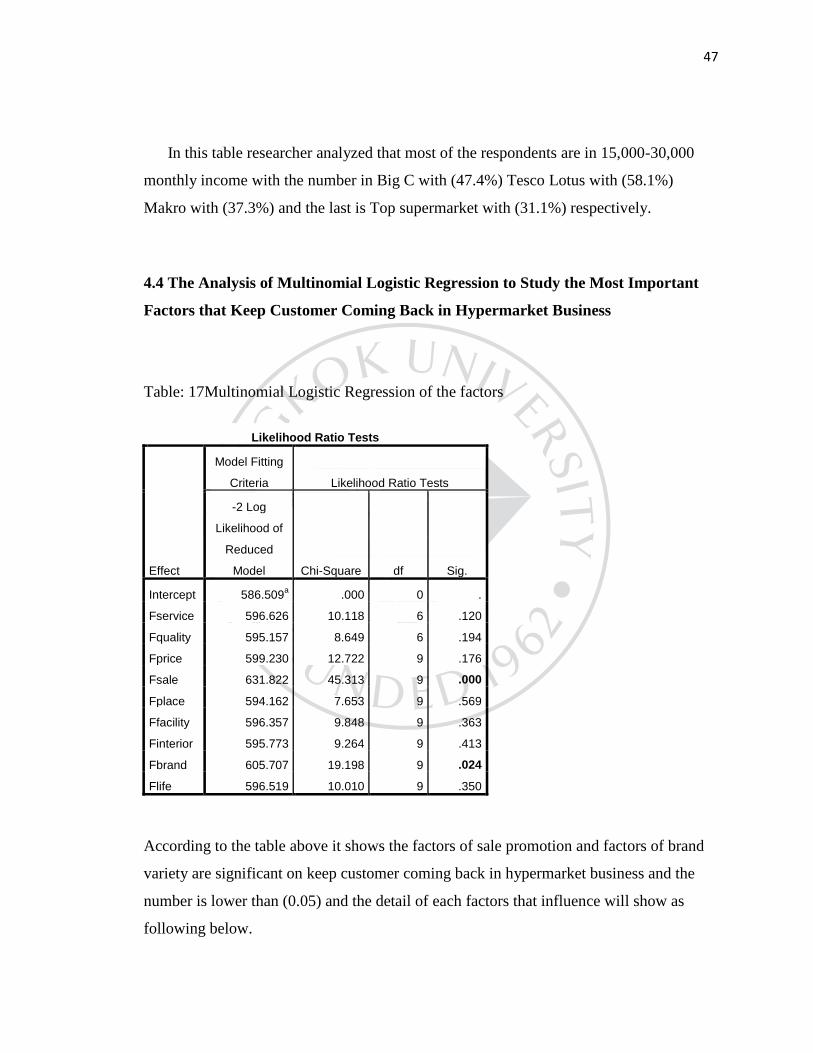
47
In this table researcher analyzed that most of the respondents are in 15,000-30,000
monthly income with the number in Big C with (47.4%) Tesco Lotus with (58.1%)
Makro with (37.3%) and the last is Top supermarket with (31.1%) respectively.
4.4 The Analysis of Multinomial Logistic Regression to Study the Most Important
Factors that Keep Customer Coming Back in Hypermarket Business
Table: 17Multinomial Logistic Regression of the factors
Likelihood Ratio Tests
Effect
Model Fitting
Criteria Likelihood Ratio Tests
-2 Log
Likelihood of
Reduced
Model Chi-Square df Sig.
Intercept 586.509a .000 0 .
Fservice 596.626 10.118 6 .120
Fquality 595.157 8.649 6 .194
Fprice 599.230 12.722 9 .176
Fsale 631.822 45.313 9 .000
Fplace 594.162 7.653 9 .569
Ffacility 596.357 9.848 9 .363
Finterior 595.773 9.264 9 .413
Fbrand 605.707 19.198 9 .024
Flife 596.519 10.010 9 .350
According to the table above it shows the factors of sale promotion and factors of brand
variety are significant on keep customer coming back in hypermarket business and the
number is lower than (0.05) and the detail of each factors that influence will show as
following below.
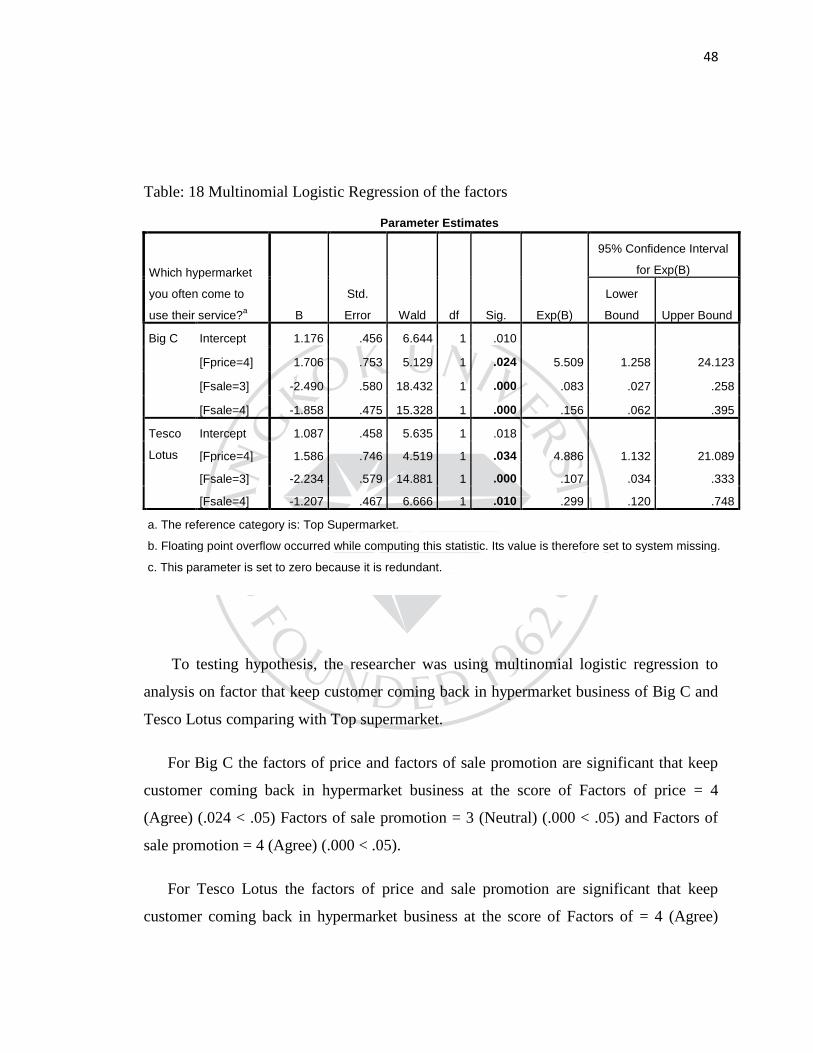
48
To testing hypothesis, the researcher was using multinomial logistic regression to
analysis on factor that keep customer coming back in hypermarket business of Big C and
Tesco Lotus comparing with Top supermarket.
For Big C the factors of price and factors of sale promotion are significant that keep
customer coming back in hypermarket business at the score of Factors of price = 4
(Agree) (.024 < .05) Factors of sale promotion = 3 (Neutral) (.000 < .05) and Factors of
sale promotion = 4 (Agree) (.000 < .05).
For Tesco Lotus the factors of price and sale promotion are significant that keep
customer coming back in hypermarket business at the score of Factors of = 4 (Agree)
Table: 18 Multinomial Logistic Regression of the factors
Parameter Estimates
Which hypermarket
you often come to
use their service?a B
Std.
Error Wald df Sig. Exp(B)
95% Confidence Interval
for Exp(B)
Lower
Bound Upper Bound
Big C Intercept 1.176 .456 6.644 1 .010
[Fprice=4] 1.706 .753 5.129 1 .024 5.509 1.258 24.123
[Fsale=3] -2.490 .580 18.432 1 .000 .083 .027 .258
[Fsale=4] -1.858 .475 15.328 1 .000 .156 .062 .395
Tesco
Lotus
Intercept 1.087 .458 5.635 1 .018
[Fprice=4] 1.586 .746 4.519 1 .034 4.886 1.132 21.089
[Fsale=3] -2.234 .579 14.881 1 .000 .107 .034 .333
[Fsale=4] -1.207 .467 6.666 1 .010 .299 .120 .748
a. The reference category is: Top Supermarket.
b. Floating point overflow occurred while computing this statistic. Its value is therefore set to system missing.
c. This parameter is set to zero because it is redundant.
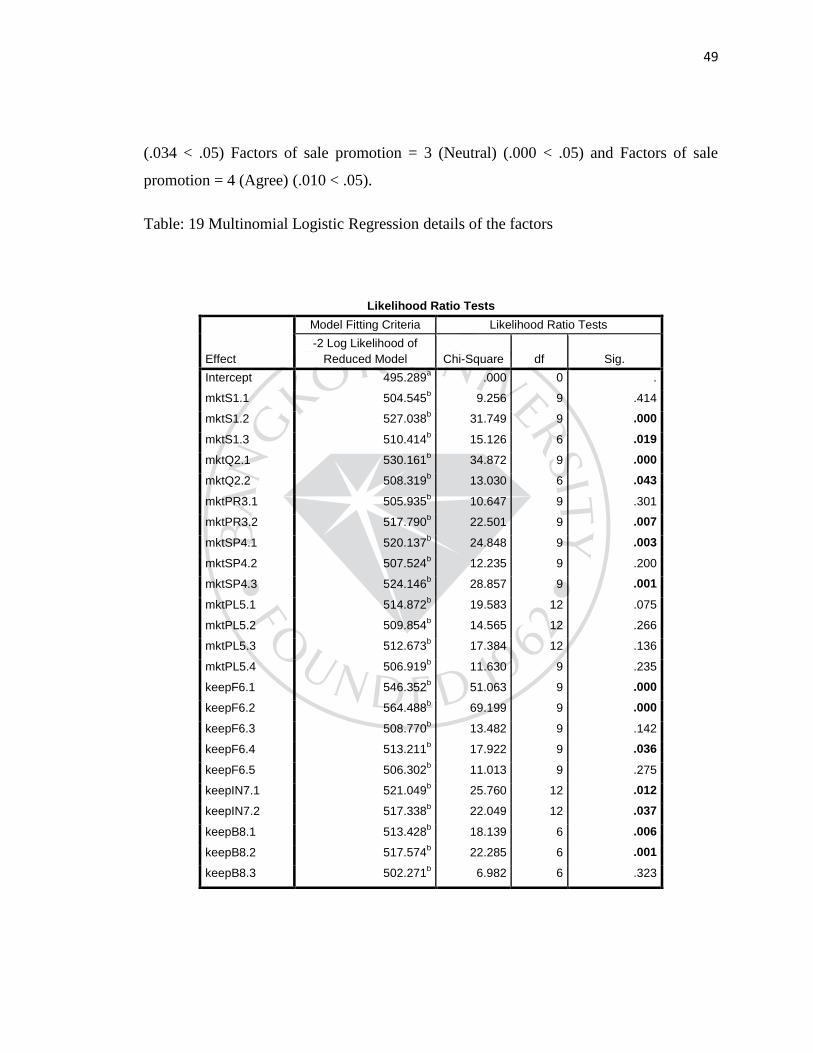
49
(.034 < .05) Factors of sale promotion = 3 (Neutral) (.000 < .05) and Factors of sale
promotion = 4 (Agree) (.010 < .05).
Table: 19 Multinomial Logistic Regression details of the factors
Likelihood Ratio Tests
Effect
Model Fitting Criteria Likelihood Ratio Tests
-2 Log Likelihood of
Reduced Model Chi-Square df Sig.
Intercept 495.289a .000 0 .
mktS1.1 504.545b 9.256 9 .414
mktS1.2 527.038b 31.749 9 .000
mktS1.3 510.414b 15.126 6 .019
mktQ2.1 530.161b 34.872 9 .000
mktQ2.2 508.319b 13.030 6 .043
mktPR3.1 505.935b 10.647 9 .301
mktPR3.2 517.790b 22.501 9 .007
mktSP4.1 520.137b 24.848 9 .003
mktSP4.2 507.524b 12.235 9 .200
mktSP4.3 524.146b 28.857 9 .001
mktPL5.1 514.872b 19.583 12 .075
mktPL5.2 509.854b 14.565 12 .266
mktPL5.3 512.673b 17.384 12 .136
mktPL5.4 506.919b 11.630 9 .235
keepF6.1 546.352b 51.063 9 .000
keepF6.2 564.488b 69.199 9 .000
keepF6.3 508.770b 13.482 9 .142
keepF6.4 513.211b 17.922 9 .036
keepF6.5 506.302b 11.013 9 .275
keepIN7.1 521.049b 25.760 12 .012
keepIN7.2 517.338b 22.049 12 .037
keepB8.1 513.428b 18.139 6 .006
keepB8.2 517.574b 22.285 6 .001
keepB8.3 502.271b 6.982 6 .323
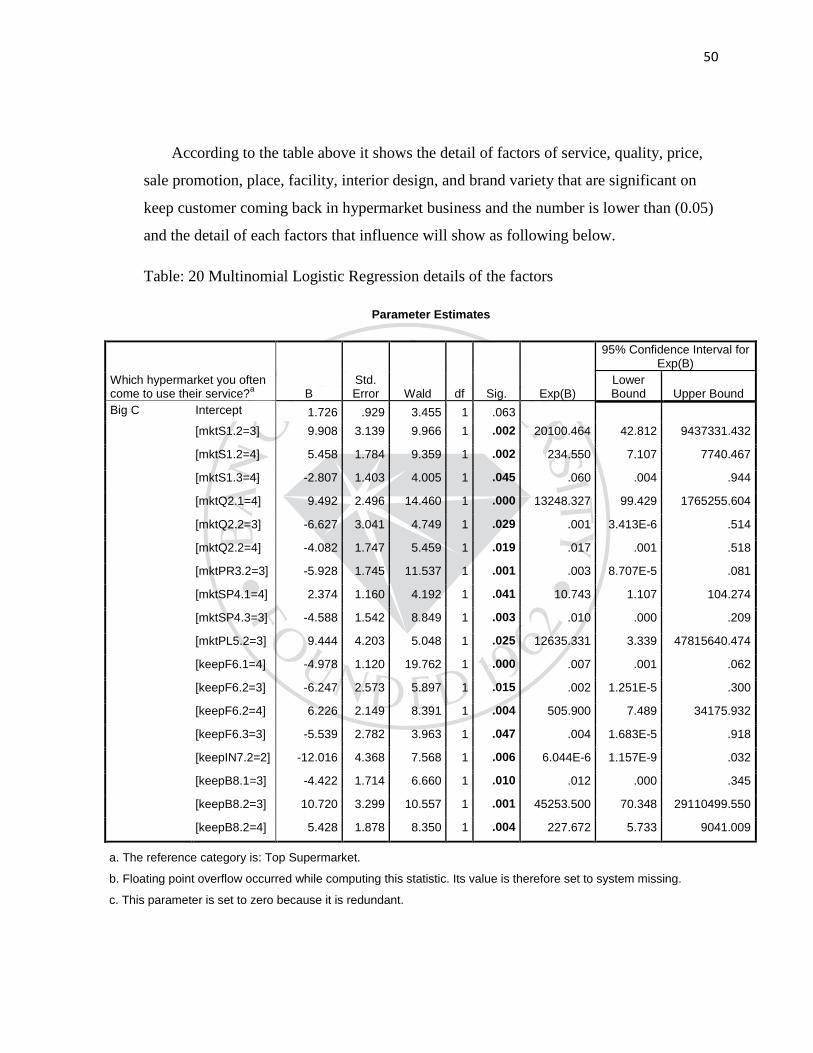
50
According to the table above it shows the detail of factors of service, quality, price,
sale promotion, place, facility, interior design, and brand variety that are significant on
keep customer coming back in hypermarket business and the number is lower than (0.05)
and the detail of each factors that influence will show as following below.
Table: 20 Multinomial Logistic Regression details of the factors
Parameter Estimates
Which hypermarket you often come to use their service?
a B
Std. Error Wald df Sig. Exp(B)
95% Confidence Interval for Exp(B)
Lower Bound Upper Bound
Big C Intercept 1.726 .929 3.455 1 .063 [mktS1.2=3] 9.908 3.139 9.966 1 .002 20100.464 42.812 9437331.432
[mktS1.2=4] 5.458 1.784 9.359 1 .002 234.550 7.107 7740.467
[mktS1.3=4] -2.807 1.403 4.005 1 .045 .060 .004 .944
[mktQ2.1=4] 9.492 2.496 14.460 1 .000 13248.327 99.429 1765255.604
[mktQ2.2=3] -6.627 3.041 4.749 1 .029 .001 3.413E-6 .514
[mktQ2.2=4] -4.082 1.747 5.459 1 .019 .017 .001 .518
[mktPR3.2=3] -5.928 1.745 11.537 1 .001 .003 8.707E-5 .081
[mktSP4.1=4] 2.374 1.160 4.192 1 .041 10.743 1.107 104.274
[mktSP4.3=3] -4.588 1.542 8.849 1 .003 .010 .000 .209
[mktPL5.2=3] 9.444 4.203 5.048 1 .025 12635.331 3.339 47815640.474
[keepF6.1=4] -4.978 1.120 19.762 1 .000 .007 .001 .062
[keepF6.2=3] -6.247 2.573 5.897 1 .015 .002 1.251E-5 .300
[keepF6.2=4] 6.226 2.149 8.391 1 .004 505.900 7.489 34175.932
[keepF6.3=3] -5.539 2.782 3.963 1 .047 .004 1.683E-5 .918
[keepIN7.2=2] -12.016 4.368 7.568 1 .006 6.044E-6 1.157E-9 .032
[keepB8.1=3] -4.422 1.714 6.660 1 .010 .012 .000 .345
[keepB8.2=3] 10.720 3.299 10.557 1 .001 45253.500 70.348 29110499.550
[keepB8.2=4] 5.428 1.878 8.350 1 .004 227.672 5.733 9041.009
a. The reference category is: Top Supermarket.
b. Floating point overflow occurred while computing this statistic. Its value is therefore set to system missing.
c. This parameter is set to zero because it is redundant.
51
To testing hypothesis, the researcher was using multinomial logistic regression to
analysis on the detail of factors that keep customer coming back in hypermarket business
of Big C, Tesco Lotus and Makro comparing with Top supermarket.
For Big C the detail of factors of service (mktS1.2 solve problem) are significant that
keep customer coming back in hypermarket business at the score of Factors of service = 3
(Neutral) (.002 < .05), Factors of service (mktS1.2 solve problem) = 4 (Agree) (.002 <
.05) and Factors of service (mktS1.3 goods available) = 4 (Agree) (.045 < .05), Factors of
quality (mktQ2.1 standardization) = 4 (Agree) (.000 < .05), Factors of quality (mktQ2.2
variety) = 3 (Neutral) (.029 < .05), Factors of quality (mktQ2.2 variety) = 4 (Agree) (.019
< .05), Factors of price (mktPR3.2 cheaper than competitor) = 3 (Neutral) (.001 < .05),
Factors of sale promotion (mktSP4.1 always discount) = 4 (Agree) (.041 < .05), Factors
of sale promotion (mktSP4.3 loyalty card) = 3 (Neutral) (.003 < .05), Factors of place
(mktPL5.2 clean) = 3 (Neutral) (.025 < .05), Factors of facility (keepF6.1 quality
restaurant) = 4 (Agree) (.000 < .05), Factors of facility (keep6.2 clean food) = 3 (Neutral)
(.015 < .05), Factors of facility (keep6.2 clean food) = 4 (Agree) (.004 < .05), Factors of
facility (keep6.3 security guard) = 3 (Neutral) (.047 < .05), Factors of interior design
(keep7.2 music) = 2 (Disagree) (.006 < .05), Factors of brand variety (keep8.1 variety of
brand) = 3 (Neutral) (.010 < .05), Factors of brand variety (keep8.2 famous) = 3 (Neutral)
(.001 < .05), Factors of brand variety (keep8.2 famous) = 4 (Agree) (.004 < .05).
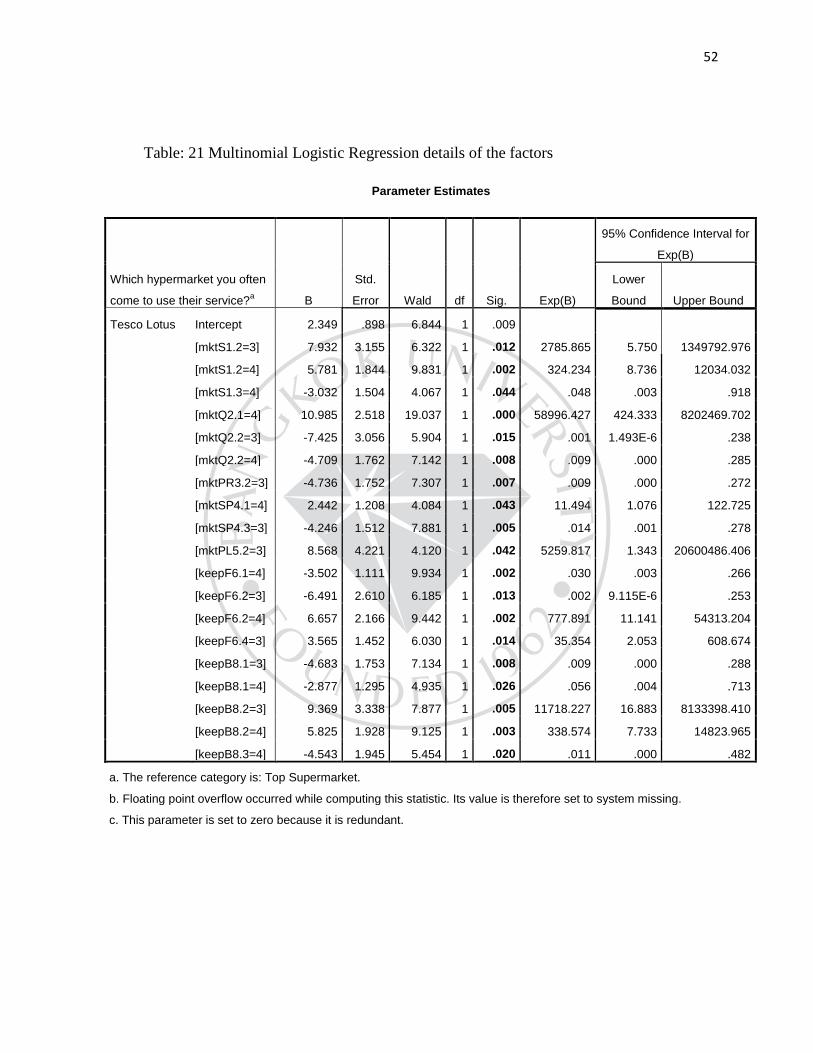
52
Table: 21 Multinomial Logistic Regression details of the factors
Parameter Estimates
Which hypermarket you often
come to use their service?a B
Std.
Error Wald df Sig. Exp(B)
95% Confidence Interval for
Exp(B)
Lower
Bound Upper Bound
Tesco Lotus Intercept 2.349 .898 6.844 1 .009
[mktS1.2=3] 7.932 3.155 6.322 1 .012 2785.865 5.750 1349792.976
[mktS1.2=4] 5.781 1.844 9.831 1 .002 324.234 8.736 12034.032
[mktS1.3=4] -3.032 1.504 4.067 1 .044 .048 .003 .918
[mktQ2.1=4] 10.985 2.518 19.037 1 .000 58996.427 424.333 8202469.702
[mktQ2.2=3] -7.425 3.056 5.904 1 .015 .001 1.493E-6 .238
[mktQ2.2=4] -4.709 1.762 7.142 1 .008 .009 .000 .285
[mktPR3.2=3] -4.736 1.752 7.307 1 .007 .009 .000 .272
[mktSP4.1=4] 2.442 1.208 4.084 1 .043 11.494 1.076 122.725
[mktSP4.3=3] -4.246 1.512 7.881 1 .005 .014 .001 .278
[mktPL5.2=3] 8.568 4.221 4.120 1 .042 5259.817 1.343 20600486.406
[keepF6.1=4] -3.502 1.111 9.934 1 .002 .030 .003 .266
[keepF6.2=3] -6.491 2.610 6.185 1 .013 .002 9.115E-6 .253
[keepF6.2=4] 6.657 2.166 9.442 1 .002 777.891 11.141 54313.204
[keepF6.4=3] 3.565 1.452 6.030 1 .014 35.354 2.053 608.674
[keepB8.1=3] -4.683 1.753 7.134 1 .008 .009 .000 .288
[keepB8.1=4] -2.877 1.295 4.935 1 .026 .056 .004 .713
[keepB8.2=3] 9.369 3.338 7.877 1 .005 11718.227 16.883 8133398.410
[keepB8.2=4] 5.825 1.928 9.125 1 .003 338.574 7.733 14823.965
[keepB8.3=4] -4.543 1.945 5.454 1 .020 .011 .000 .482
a. The reference category is: Top Supermarket.
b. Floating point overflow occurred while computing this statistic. Its value is therefore set to system missing.
c. This parameter is set to zero because it is redundant.
53
To testing hypothesis, the researcher was using multinomial logistic regression to
analysis on the detail of factors that keep customer coming back in hypermarket business
of Big C, Tesco Lotus and Makro comparing with Top supermarket.
For Tesco Lotus the detail of factors of service (mktS1.2 solve problem) are
significant that keep customer coming back in hypermarket business at the score of the
factors of service = 3 (Neutral) (.012 < .05), Factors of service (mktS1.2 solve problem) =
4 (Agree) (.002 < .05) and Factors of service (mktS1.3 goods available) = 4 (Agree) (.044
< .05), Factors of quality (mktQ2.1 standardization) = 4 (Agree) (.000 < .05), Factors of
quality (mktQ2.2 variety) = 3 (Neutral) (.015 < .05), Factors of quality (mktQ2.2 variety)
= 4 (Agree) (.008 < .05), Factors of price (mktPR3.2 cheaper than competitor) = 3
(Neutral) (.007 < .05), Factors of sale promotion (mktSP4.1 always discount) = 4
(Agree) (.043 < .05), Factors of sale promotion (mktSP4.3 loyalty card) = 3 (Neutral)
(.005 < .05), Factors of place (mktPL5.2 clean) = 3 (Neutral) (.042 < .05), Factors of
facility (keepF6.1 quality restaurant) = 4 (Agree) (.002 < .05), Factors of facility (keep6.2
clean food) = 3 (Neutral) (.013 < .05), Factors of facility (keep6.2 clean food) = 4
(Agree) (.002 < .05), Factors of facility (keep6.4 booth ) = 3 (Neutral) (.014 < .05),
Factors of brand variety (keep8.1 variety of brand) = 3 (Neutral) (.008 < .05), Factors of
brand variety (keep8.1 variety of brand) = 4 (Agree) (.026 < .05), Factors of brand variety
(keep8.2 famous) = 3 (Neutral) (.005 < .05), Factors of brand variety (keep8.2 famous) =
4 (Agree) (.003 < .05), Factors of brand variety (keep8.3 well known) = 4 (Agree) (.020 <
.05).
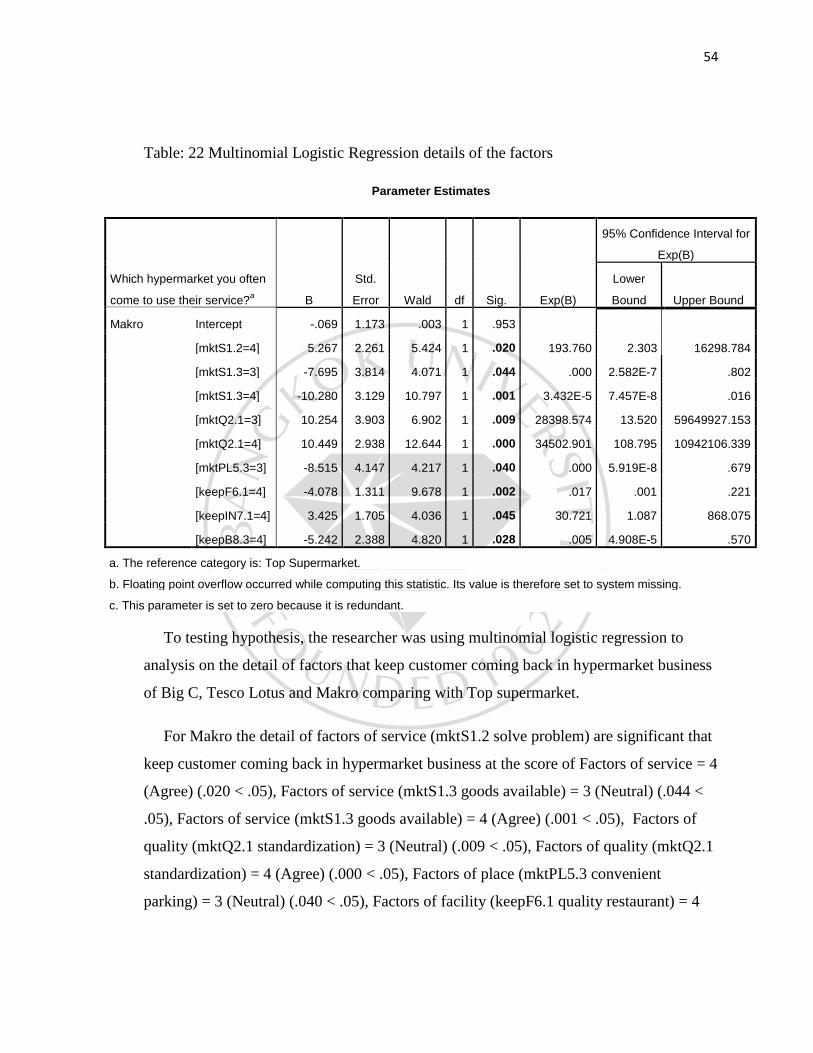
54
Table: 22 Multinomial Logistic Regression details of the factors
Parameter Estimates
To testing hypothesis, the researcher was using multinomial logistic regression to
analysis on the detail of factors that keep customer coming back in hypermarket business
of Big C, Tesco Lotus and Makro comparing with Top supermarket.
For Makro the detail of factors of service (mktS1.2 solve problem) are significant that
keep customer coming back in hypermarket business at the score of Factors of service = 4
(Agree) (.020 < .05), Factors of service (mktS1.3 goods available) = 3 (Neutral) (.044 <
.05), Factors of service (mktS1.3 goods available) = 4 (Agree) (.001 < .05), Factors of
quality (mktQ2.1 standardization) = 3 (Neutral) (.009 < .05), Factors of quality (mktQ2.1
standardization) = 4 (Agree) (.000 < .05), Factors of place (mktPL5.3 convenient
parking) = 3 (Neutral) (.040 < .05), Factors of facility (keepF6.1 quality restaurant) = 4
Which hypermarket you often
come to use their service?a B
Std.
Error Wald df Sig. Exp(B)
95% Confidence Interval for
Exp(B)
Lower
Bound Upper Bound
Makro Intercept -.069 1.173 .003 1 .953
[mktS1.2=4] 5.267 2.261 5.424 1 .020 193.760 2.303 16298.784
[mktS1.3=3] -7.695 3.814 4.071 1 .044 .000 2.582E-7 .802
[mktS1.3=4] -10.280 3.129 10.797 1 .001 3.432E-5 7.457E-8 .016
[mktQ2.1=3] 10.254 3.903 6.902 1 .009 28398.574 13.520 59649927.153
[mktQ2.1=4] 10.449 2.938 12.644 1 .000 34502.901 108.795 10942106.339
[mktPL5.3=3] -8.515 4.147 4.217 1 .040 .000 5.919E-8 .679
[keepF6.1=4] -4.078 1.311 9.678 1 .002 .017 .001 .221
[keepIN7.1=4] 3.425 1.705 4.036 1 .045 30.721 1.087 868.075
[keepB8.3=4] -5.242 2.388 4.820 1 .028 .005 4.908E-5 .570
a. The reference category is: Top Supermarket.
b. Floating point overflow occurred while computing this statistic. Its value is therefore set to system missing.
c. This parameter is set to zero because it is redundant.
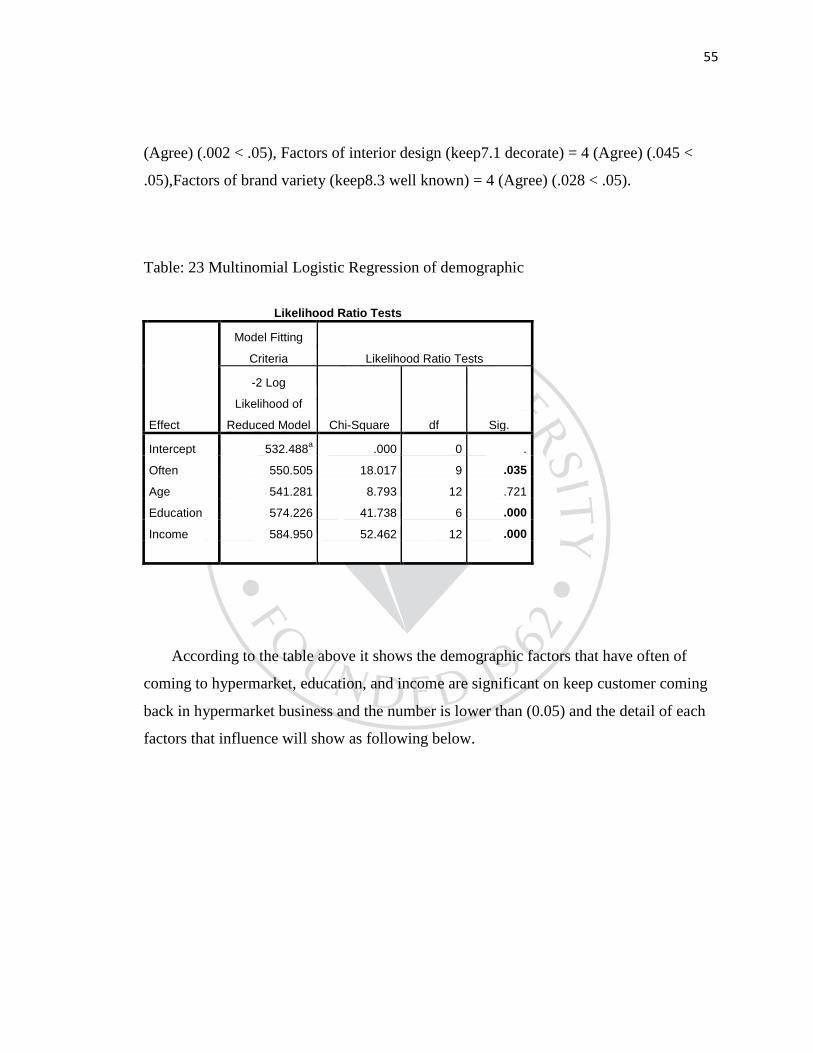
55
(Agree) (.002 < .05), Factors of interior design (keep7.1 decorate) = 4 (Agree) (.045 <
.05),Factors of brand variety (keep8.3 well known) = 4 (Agree) (.028 < .05).
Table: 23 Multinomial Logistic Regression of demographic
Likelihood Ratio Tests
Effect
Model Fitting
Criteria Likelihood Ratio Tests
-2 Log
Likelihood of
Reduced Model Chi-Square df Sig.
Intercept 532.488a .000 0 .
Often 550.505 18.017 9 .035
Age 541.281 8.793 12 .721
Education 574.226 41.738 6 .000
Income 584.950 52.462 12 .000
According to the table above it shows the demographic factors that have often of
coming to hypermarket, education, and income are significant on keep customer coming
back in hypermarket business and the number is lower than (0.05) and the detail of each
factors that influence will show as following below.

56
Table: 24 Multinomial Logistic Regression of demographic
To testing hypothesis, the researcher was using multinomial logistic regression to
analysis on demographic factors that keep customer coming back in hypermarket
business of Big C, Tesco Lotus and Makro comparing with Top supermarket.
For Big C the factors of (often2 2-3 times per month) are significant and keep
customer coming back in hypermarket business at the score of often2 = 2-3 times per
month (.016 < .05).
For Tesco Lotus the factors of (often2 2-3 times per month), (often3 3-5 times per
month) are significant that keep customer coming back in hypermarket business at the
score of often2 = 2-3 times per month (.007 < .05), often3 = 3-5 times per month (.009 <
.05).
Parameter Estimates
Which hypermarket you often come
to use their service?a B
Std.
Error Wald df Sig. Exp(B)
95% Confidence
Interval for Exp(B)
Lower
Bound
Upper
Bound
Big C Intercept .314 1.124 .078 1 .780
[Often=2] 1.098 .458 5.758 1 .016 2.999 1.223 7.357
Tesco
Lotus
Intercept 1.228 1.070 1.317 1 .251
[Often=2] 1.348 .498 7.331 1 .007 3.850 1.451 10.214
[Often=3] 1.636 .628 6.781 1 .009 5.136 1.499 17.596
Makro Intercept .281 1.195 .055 1 .814
[Education=1] 1.933 .941 4.215 1 .040 6.907 1.092 43.709
[Income=1] -2.405 1.085 4.909 1 .027 .090 .011 .758
[Income=3] -3.509 1.366 6.604 1 .010 .030 .002 .435
a. The reference category is: Top Supermarket.
b. This parameter is set to zero because it is redundant.
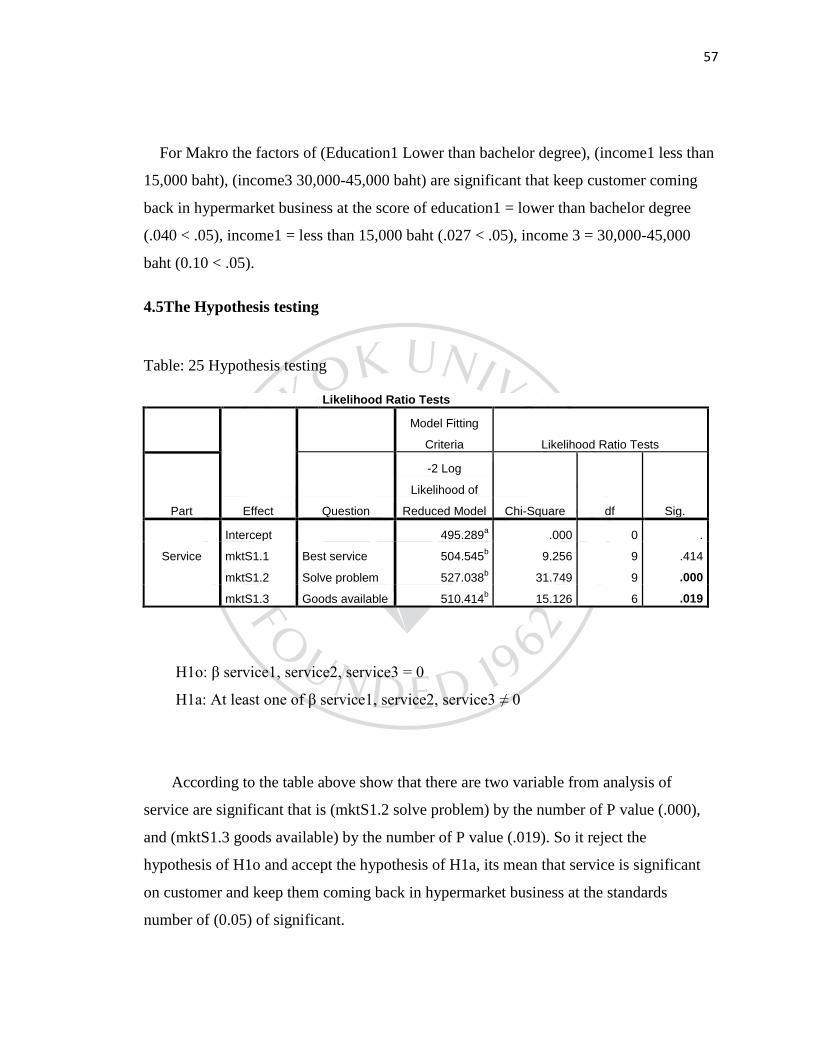
57
For Makro the factors of (Education1 Lower than bachelor degree), (income1 less than
15,000 baht), (income3 30,000-45,000 baht) are significant that keep customer coming
back in hypermarket business at the score of education1 = lower than bachelor degree
(.040 < .05), income1 = less than 15,000 baht (.027 < .05), income 3 = 30,000-45,000
baht (0.10 < .05).
4.5The Hypothesis testing
Table: 25 Hypothesis testing
Likelihood Ratio Tests
Effect
Model Fitting
Criteria Likelihood Ratio Tests
Part Question
-2 Log
Likelihood of
Reduced Model Chi-Square df Sig.
Intercept 495.289a .000 0 .
Service mktS1.1 Best service 504.545b 9.256 9 .414
mktS1.2 Solve problem 527.038b 31.749 9 .000
mktS1.3 Goods available 510.414b 15.126 6 .019
H1o: β service1, service2, service3 = 0
H1a: At least one of β service1, service2, service3 ≠ 0
According to the table above show that there are two variable from analysis of
service are significant that is (mktS1.2 solve problem) by the number of P value (.000),
and (mktS1.3 goods available) by the number of P value (.019). So it reject the
hypothesis of H1o and accept the hypothesis of H1a, its mean that service is significant
on customer and keep them coming back in hypermarket business at the standards
number of (0.05) of significant.
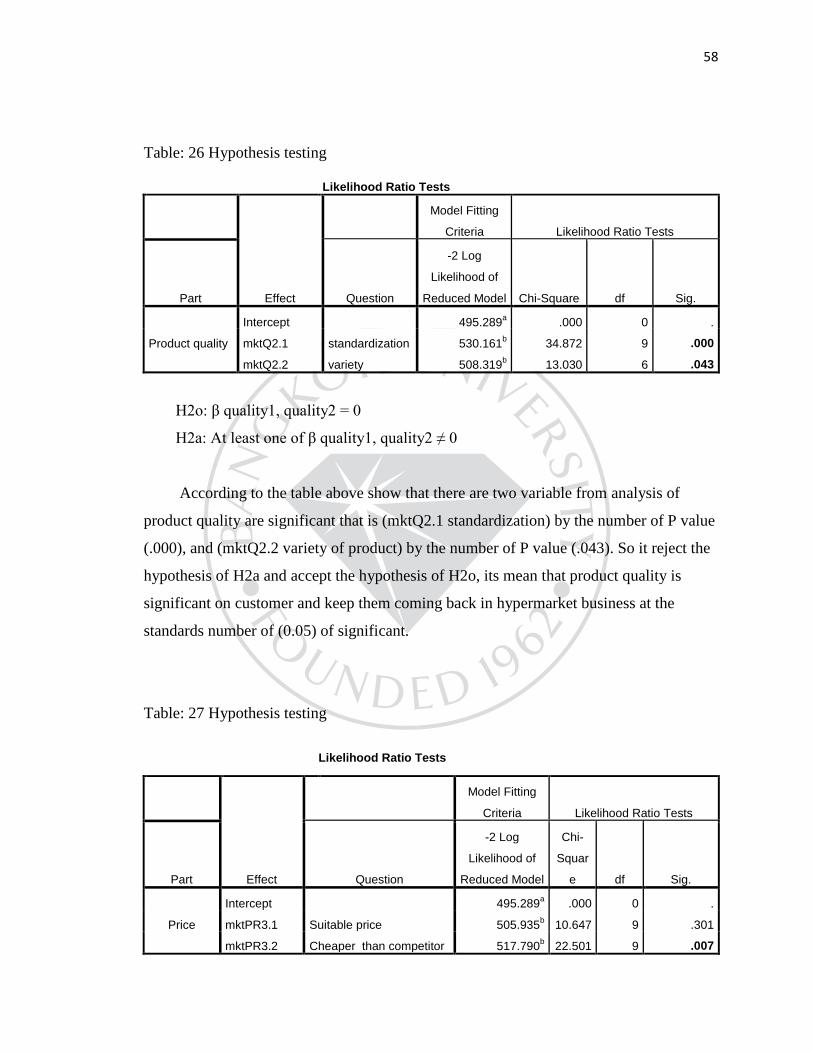
58
Table: 26 Hypothesis testing
Likelihood Ratio Tests
Effect
Model Fitting
Criteria Likelihood Ratio Tests
Part Question
-2 Log
Likelihood of
Reduced Model Chi-Square df Sig.
Intercept 495.289a .000 0 .
Product quality mktQ2.1 standardization 530.161b 34.872 9 .000
mktQ2.2 variety 508.319b 13.030 6 .043
H2o: β quality1, quality2 = 0
H2a: At least one of β quality1, quality2 ≠ 0
According to the table above show that there are two variable from analysis of
product quality are significant that is (mktQ2.1 standardization) by the number of P value
(.000), and (mktQ2.2 variety of product) by the number of P value (.043). So it reject the
hypothesis of H2a and accept the hypothesis of H2o, its mean that product quality is
significant on customer and keep them coming back in hypermarket business at the
standards number of (0.05) of significant.
Table: 27 Hypothesis testing
Likelihood Ratio Tests
Effect
Model Fitting
Criteria Likelihood Ratio Tests
Part Question
-2 Log
Likelihood of
Reduced Model
Chi-
Squar
e df Sig.
Intercept 495.289a .000 0 .
Price mktPR3.1 Suitable price 505.935b 10.647 9 .301
mktPR3.2 Cheaper than competitor 517.790b 22.501 9 .007

59
H3o: β price1, price2 = 0
H3a: At least one of β price1, price2, ≠ 0
According to the table above show that there is one variable from analysis of price is
significant that is (mktPR3.2 cheaper than competitor) by the number of P value (.007).
So it reject the hypothesis of H3o and accept the hypothesis of H3a, its mean that the
price is significant on customer and keep them coming back in hypermarket business at
the standards number of (0.05) of significant.
Table: 28 Hypothesis testing
Likelihood Ratio Tests
Effect
Model Fitting
Criteria Likelihood Ratio Tests
Part Question
-2 Log
Likelihood of
Reduced Model Chi-Square df Sig.
Intercept 495.289a .000 0 .
Sale promotion mktSP4.1 Always discount 520.137b 24.848 9 .003
mktSP4.2 Price is worth 507.524b 12.235 9 .200
mktSP4.3 Loyalty card 524.146b 28.857 9 .001
H4o: β sale promotion1, sale promotion 2, sale promotion 3 = 0
H4a: At least one of β sale promotion 1, sale promotion 2, sale promotion 3 ≠ 0
According to the table above show that there are two variable from analysis of sale
promotion are significant that is (mktSP4.1 always discount) by the number of P value
(.003), and (mktSP4.3 loyalty card) by the number of P value (.001). So it reject the
hypothesis of H4o and accept the hypothesis of H4a, its mean that the sale promotion is
significant on customer and keep them coming back in hypermarket business at the
standards number of (0.05) of significant.
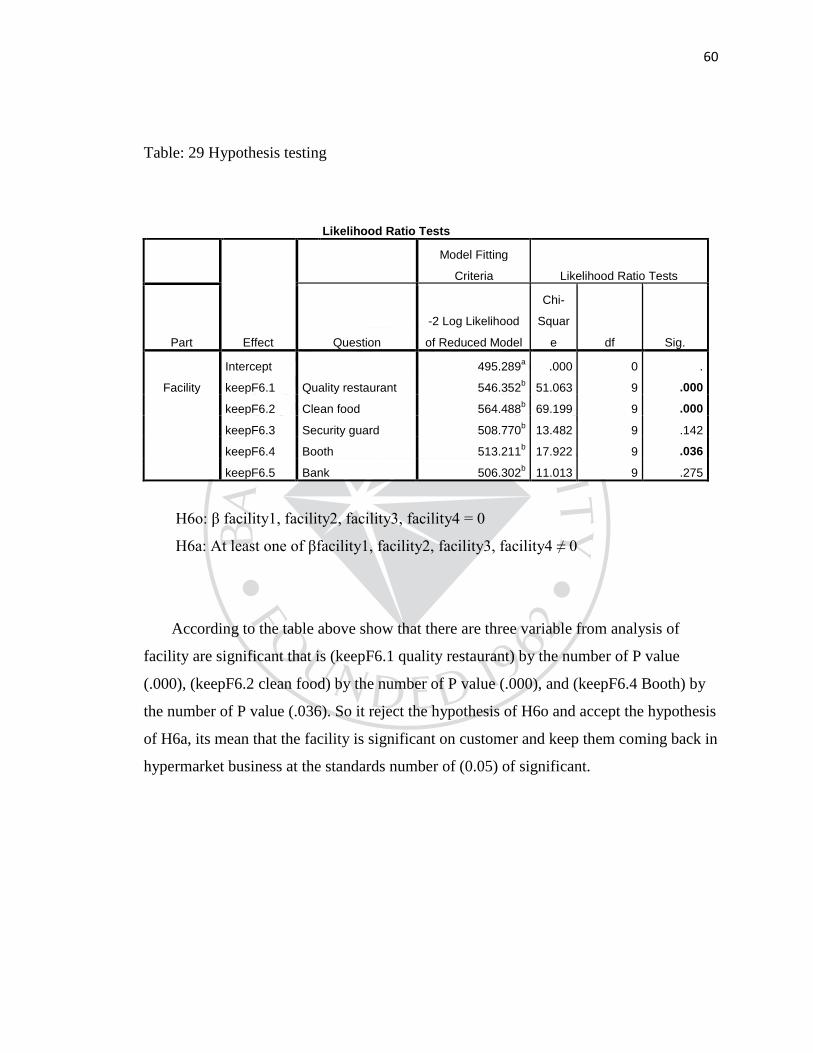
60
Table: 29 Hypothesis testing
Likelihood Ratio Tests
Effect
Model Fitting
Criteria Likelihood Ratio Tests
Part Question
-2 Log Likelihood
of Reduced Model
Chi-
Squar
e df Sig.
Intercept 495.289a .000 0 .
Facility keepF6.1 Quality restaurant 546.352b 51.063 9 .000
keepF6.2 Clean food 564.488b 69.199 9 .000
keepF6.3 Security guard 508.770b 13.482 9 .142
keepF6.4 Booth 513.211b 17.922 9 .036
keepF6.5 Bank 506.302b 11.013 9 .275
H6o: β facility1, facility2, facility3, facility4 = 0
H6a: At least one of βfacility1, facility2, facility3, facility4 ≠ 0
According to the table above show that there are three variable from analysis of
facility are significant that is (keepF6.1 quality restaurant) by the number of P value
(.000), (keepF6.2 clean food) by the number of P value (.000), and (keepF6.4 Booth) by
the number of P value (.036). So it reject the hypothesis of H6o and accept the hypothesis
of H6a, its mean that the facility is significant on customer and keep them coming back in
hypermarket business at the standards number of (0.05) of significant.
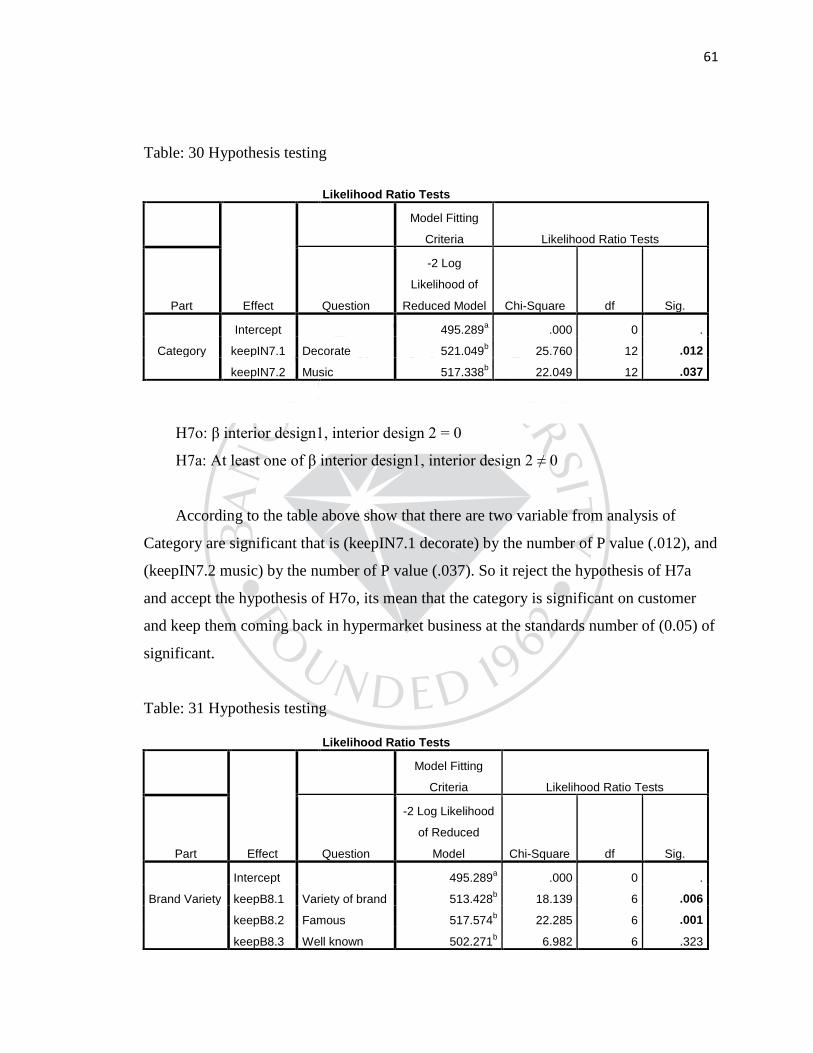
61
Table: 30 Hypothesis testing
Likelihood Ratio Tests
Effect
Model Fitting
Criteria Likelihood Ratio Tests
Part Question
-2 Log
Likelihood of
Reduced Model Chi-Square df Sig.
Intercept 495.289a .000 0 .
Category keepIN7.1 Decorate 521.049b 25.760 12 .012
keepIN7.2 Music 517.338b 22.049 12 .037
H7o: β interior design1, interior design 2 = 0
H7a: At least one of β interior design1, interior design 2 ≠ 0
According to the table above show that there are two variable from analysis of
Category are significant that is (keepIN7.1 decorate) by the number of P value (.012), and
(keepIN7.2 music) by the number of P value (.037). So it reject the hypothesis of H7a
and accept the hypothesis of H7o, its mean that the category is significant on customer
and keep them coming back in hypermarket business at the standards number of (0.05) of
significant.
Table: 31 Hypothesis testing
Likelihood Ratio Tests
Effect
Model Fitting
Criteria Likelihood Ratio Tests
Part Question
-2 Log Likelihood
of Reduced
Model Chi-Square df Sig.
Intercept 495.289a .000 0 .
Brand Variety keepB8.1 Variety of brand 513.428b 18.139 6 .006
keepB8.2 Famous 517.574b 22.285 6 .001
keepB8.3 Well known 502.271b 6.982 6 .323

62
H8o: β brand variety1, brand variety 2, brand variety 3 = 0
H8a: At least one of β brand variety1, brand variety 2, brand variety 3 ≠ 0
According to the table above show that there are two variable from analysis of Brand
variety are significant that is (keepB8.1 variety of brand) by the number of P value (.006),
and (keepB8.2 famous) by the number of P value (.001). So it reject the hypothesis of
H8o and accept the hypothesis of H8a, its mean that the brand variety is significant on
customer and keep them coming back in hypermarket business at the standards number of
(0.05) of significant.
For the hypothesis result show that the seven factors is service, product quality,
price, sale promotion, facility, category, and brand variety factors are significant on
customer to come and repurchasing in hypermarket and only one factor that is place
factor is not significant or not important for customer to repurchasing inside hypermarket
business.
CHAPTER 5
DISCUSSION AND CONCLUSION
In this chapter the researcher summarized in the general the important components of
research studied, hypothesis, concept of theories, related research and testing hypothesis
show as the result of key factors in hypermarket business that effect on customer and
keep them coming back.
This research will useful for hypermarket business, related business, business owner
marketers and staffs, investors and researcher which are related to hypermarket business.
The result of this study can improve the way to keep customer coming back in to
hypermarket business, it can help to create more appropriate marketing strategy to their
market segment and competitor in this business and to focus more on over all of facility,
category, brand variety, and consumer behavior inside and outside the business. This
research used a quantitative data, which distribute questionnaire using Facebook, Email,
and electronic paper to casual the group of population of data collection process. The
reason to study is done for identifying customers liking and keep coming back to use the
service of this kind of business and keep this business growing in the future also. In term
of business benefit, hypermarket will recognize customer’s needs moreover, hypermarket
can focus on how to work and develop customer’s service. The information gain from
study would help to guide the hypermarket business to increase their responsiveness and
understand the key factors that would be increase the customers. Consequently, the
overall of this research would be the valuable information in order to plan to apply and
develop further. In term of customer benefit, customer can present their opinion about
this hypermarket business. In this research there are the theoretical foundations of
conceptual framework that can measure the related to coming of customer in hypermarket
business and analyzed to hypothesis as following;
64
H1o: β service1, service2, service3 = 0
H1a: At least one of β service1, service2, service3 ≠ 0
H2o: β quality1, quality2 = 0
H2a: At least one of β quality1, quality2 ≠ 0
H3o: β price1, price2 = 0
H3a: At least one of β price1, price2, ≠ 0
H4o: β sale promotion1, sale promotion 2, sale promotion 3 = 0
H4a: At least one of β sale promotion 1, sale promotion 2, sale promotion 3 ≠ 0
H5o: β place1, place 2, place 3, place4 = 0
H5a: At least one of β place 1, place 2, place 3, place4 ≠ 0
H6o: β facility1, facility2, facility3, facility4 = 0
H6a: At least one of βfacility1, facility2, facility3, facility4 ≠ 0
H7o: β interior design1, interior design 2 = 0
H7a: At least one of β interior design1, interior design 2 ≠ 0
H8o: β brand variety1, brand variety 2, brand variety 3 = 0
H8a: At least one of β brand variety1, brand variety 2, brand variety 3 ≠ 0
This research is quantitative research; the data collect by the questionnaire. The
sample size is 400 respondents in Bangkok. The hypothesis analyzed through Frequency,
Cross Tabulation, Multinomial Logistic Regression and Analysis of hypothesis testing.
65
5.2 Conclusion
From the research of the factors that effect on customer and keep them coming back
into hypermarket business and able to finish off the result as following;
The majority on how often that the person comes to hypermarket it shows the
frequency of 2-3 times per month of 165 (41.3%), most are the female by the number of
201 (50.3%), The majority in age of 26-30 years infrequency of 158 (39.5%), Most of the
respondents are educated on bachelor degree by the frequency of 243 (60.8%), In
majority of profession most of the respondents that used hypermarket service are the
employed in the frequency of 247 (61.8%), Most of the respondents are in the rate of
15,000-30,000 baht in monthly income with the frequency of 187 (46.8%).
The majority of respondents are often come to use the service is in Big C with
frequency of 156 in (39%), In life style of person, most of them like to watching TV at
home by frequency of 113 (28.3%).
In the analysis of cross tabulation for the often of the customer to come into the
hypermarket can show that in this research most of the respondents often come into Big
C with the number of 156 out of 400 respondents or (39%) and then Tesco Lotus is the
second range by the number of 124 out of 400 respondents or (31%) and follow by
Makro in the number of 61 out of 400 respondent or (15.3%) and end by Top
supermarket with the lowest number of 59 out of 400 respondents or (14.8%) randomly.
In the research analyzed that most of the respondents often come to used Big C, service
with the number of (44.2%) their regularly come around 2-3 times per month. In the
research analyzed that most of the respondents are in the age of 26-30 years by the
number of Big C with (38.5%) Tesco Lotus with (41.1%) Makro with (39%) and Top
supermarket with (39.3%) are mostly come to use the service in hypermarket. In the
research analyzed that most of the respondents are employed with the number in Big C
with (62.2%) Tesco Lotus with (69.4%) Makro with (45.8%) and the last is Top
66
supermarket with (60.7%). In the research analyzed that most of the respondents are in
15,000-30,000 monthly income with the number in Big C with (47.4%) Tesco Lotus with
(58.1%) Makro with (37.3%) and the last is Top supermarket with (31.1%).
In the analysis of multinomial logistic regression the result of Big C, Tesco Lotus,
Makro, and compare with Top supermarket in the standard level of (0.05) are significant
and that effect on customer and keep them coming back in hypermarket business.
For the analysis of factors of Big C the factors of price and factors of sale promotion
are significant that keep customer coming back in hypermarket business at the factors of
price (Agree) (.024 < .05) factors of sale promotion (Neutral) (.000 < .05) and factors of
sale promotion (Agree) (.000 < .05).
For the analysis of Tesco Lotus the factors of price and sale promotion are significant
that keep customer coming back in hypermarket business at factors of (Agree) (.034 <
.05) factors of sale promotion (Neutral) (.000 < .05) and factors of sale promotion
(Agree) (.010 < .05).
For the analysis of the detail of factors of Big C the detail of factors of service (solve
problem) are significant that keep customer coming back in hypermarket business at the
score of Factors of service (Neutral) (.002 < .05), Factors of service (solve problem)
(Agree) (.002 < .05) and Factors of service (goods available) (Agree) (.045 < .05),
Factors of quality (standardization) (Agree) (.000 < .05), Factors of quality (variety)
(Neutral) (.029 < .05), Factors of quality (variety) (Agree) (.019 < .05), Factors of price
(cheaper than competitor) (Neutral) (.001 < .05), Factors of sale promotion (always
discount) (Agree) (.041 < .05), Factors of sale promotion (loyalty card) (Neutral) (.003 <
.05), Factors of place (clean) (Neutral) (.025 < .05), Factors of facility (quality restaurant)
(Agree) (.000 < .05), Factors of facility (clean food) (Neutral) (.015 < .05), Factors of
facility (clean food) (Agree) (.004 < .05), Factors of facility (security guard) (Neutral)
(.047 < .05), Factors of interior design (music) (Disagree) (.006 < .05), Factors of brand
67
variety (variety of brand) (Neutral) (.010 < .05), Factors of brand variety (famous)
(Neutral) (.001 < .05), Factors of brand variety (famous) (Agree) (.004 < .05).
For the analysis of Tesco Lotus the detail of factors of service (solve problem) are
significant that keep customer coming back in hypermarket business at the score of the
factors of service (Neutral) (.012 < .05), Factors of service (solve problem)(Agree) (.002
< .05) and Factors of service (goods available) (Agree) (.044 < .05), Factors of quality
(standardization) (Agree) (.000 < .05), Factors of quality (variety) (Neutral) (.015 < .05),
Factors of quality (variety) (Agree) (.008 < .05), Factors of price (cheaper than
competitor) (Neutral) (.007 < .05), Factors of sale promotion (always discount) (Agree)
(.043 < .05), Factors of sale promotion (loyalty card) (Neutral) (.005 < .05), Factors of
place (clean) (Neutral) (.042 < .05), Factors of facility (quality restaurant) (Agree) (.002
< .05), Factors of facility (clean food) (Neutral) (.013 < .05), Factors of facility (clean
food) (Agree) (.002 < .05), Factors of facility (booth ) (Neutral) (.014 < .05), Factors of
brand variety (variety of brand) (Neutral) (.008 < .05), Factors of brand variety (variety
of brand) (Agree) (.026 < .05), Factors of brand variety (famous) (Neutral) (.005 < .05),
Factors of brand variety (famous) = (Agree) (.003 < .05), Factors of brand variety (well
known) (Agree) (.020 < .05).
For the analysis of Makro the detail of factors of service (solve problem) are
significant that keep customer coming back in hypermarket business at the score of
Factors of service (Agree) (.020 < .05), Factors of service (goods available) (Neutral)
(.044 < .05), Factors of service (goods available) (Agree) (.001 < .05), Factors of quality
(standardization) (Neutral) (.009 < .05), Factors of quality (standardization) (Agree) (.000
< .05), Factors of place (convenient parking) (Neutral) (.040 < .05), Factors of facility
(quality restaurant) (Agree) (.002 < .05), Factors of interior design (decorate) (Agree)
(.045 < .05),Factors of brand variety (well known) (Agree) (.028 < .05).
For the analysis of demographic of Big C the factors of (2-3 times per month) are
significant and keep customer coming back in hypermarket business at the score of 2-3
times per month (.016 < .05).
68
For the analysis of demographic of Tesco Lotus the factors of (2-3 times per month),
(3-5 times per month) are significant that keep customer coming back in hypermarket
business at the score of 2-3 times per month (.007 < .05), 3-5 times per month (.009 <
.05).
For the analysis of demographic of Makro the factors of (Lower than bachelor degree),
(less than 15,000 baht), (30,000-45,000 baht) are significant that keep customer coming
back in hypermarket business at the score of lower than bachelor degree (.040 < .05), less
than 15,000 baht (.027 < .05), 30,000-45,000 baht (0.10 < .05).
In the analysis of hypothesis test it show that there are two variable from analysis of
service are significant that are (solve problem) by the number of P value (.000), and
(goods available) by the number of P value (.019). Two variable from analysis of product
quality are significant that is (standardization) by the number of P value (.000), and
(variety of product) by the number of P value (.043). One variable from analysis of price
is significant that is (mktPR3.2 cheaper than competitor) by the number of P value (.007).
Two variable from analysis of sale promotion are significant that is (always discount) by
the number of P value (.003), and (loyalty card) by the number of P value (.001). Three
variable from analysis of facility are significant that is (quality restaurant) by the number
of P value (.000), (clean food) by the number of P value (.000), and (Booth) by the
number of P value (.036). Two variable from analysis of Category are significant that is
(decorate) by the number of P value (.012), and (music) by the number of P value (.037).
Two variable from analysis of Brand variety are significant that is (variety of brand) by
the number of P value (.006), and (famous) by the number of P value (.001).
69
5.3 Discussion
Rajshekhar S Inglay & Rizwan S Dhalla (January 9 – 10, 2010) Application of
Systematic Layout Planning in Hypermarkets to study store layout is a very important
part of the store atmospherics and plays a major role in the customer’s store experience.
The store experience decides the customers repeat visit to the store. From a retailer's
perspective, the store layout determines the exposure to goods and thus affects the
chances of customer buying the goods. There is a need for developing a systematic
procedure of layout planning in retail stores which can provide a competitive advantage
to the retailer. Store Planning is considered more of an art. Introducing a systematic
procedure in the store layout planning can make the process holistic and bring-in
objectivity. An attempt is being made to modify and customize the SLP for application in
retail store/hypermarket planning. The modified SLP can then serve as a very useful
planning tool for the store layout planner. The approach can be further extended by
application of analytical methods to store layout planning.
For study of Rajshekhar S Inglay & Rizwan S Dhalla. Application of Systematic
Layout Planning in Hypermarkets are related with my study in the part of category
factors, this study result is show that the modified SLP can then serve as a very useful
planning tool for the store layout planner mean this plan are significant on customer in
SLP layout plan. Also my researches of category factors are also significant for customer
to come and make decision in side hypermarket business.
Kah Loong Leow & Arsiah Bahron & Vincent Kong (Volume 6, Number 2,
December 2011) Commitment in the Hypermarket Industry: Today, Tomorrow, and Days
to Come International Journal of Business and Information this study aims at a better
understanding of organizational commitment in the hypermarket industry. It focuses on
hypermarkets that provide services in Klang Valley, Malaysia; namely, Carrefour, Tesco,
and Giant. Specifically, it seeks to measure the commitment level of non-executives in
those hypermarkets. A sample of 1,500 non-executives was drawn, from which there

70
were 463 respondents. Data were collected using self-administered questionnaires
designed by the researchers. Results showed a positive relationship between
organizational commitment and job satisfaction, organizational empowerment and trust,
career advancement opportunities, and perceived organizational justice, but showed a
negative relationship between education level and organizational commitment; that is, the
higher the employee’s education, the lower his or her commitment level to the
organization.
For this study is focuses on hypermarkets that provide services in Klang Valley,
Malaysia; namely, Carrefour, Tesco, and Giant. Specifically, it seeks to measure the
commitment level of non-executives in those hypermarkets. Related with my study in the
topic of finding is hypermarket business and the result of Kah Loong Leow & Arsiah
Bahron & Vincent Kong shoe that relationship between organizational commitment and
job satisfaction, organizational empowerment and trust, career advancement
opportunities, and perceived organizational justice, and in my study is about the customer
satisfaction that how customer can come back to repurchase in this business.
Hasliza Hassan & Muhammad Sabbir Rahman 2012 International Conference on
Economics, Business Innovation IPEDR vol.38 (2012) Conceptual Study of National
Brand towards Hypermarket Brand Extension through Brand Asset Valuator retailing
industry has been aggressively moving forward in the past two decades. Hypermarkets
have been introducing brand extension products by using the corporate retail brand name
to attract consumers to purchase more at affordable prices. This concept has been widely
accepted by Westerners as a way to reduce overall expenses especially in fast moving
consumption products. However, it is less accepted by Malaysian due to their perceived
quality. The introduction of “1 Malaysia” as a national brand by the government has
enlightened consumer on this branding concept. This research paper is proposing a
conceptual study to discover how far the national brand could give impact on
hypermarket brand extension. It is expected that the positive valuation of national brand
will influence similar valuation towards hypermarkets brand extension and vice versa.
71
For the study of Hasliza Hassan & Muhammad Sabbir Rahman they study about
Conceptual Study of National Brand towards Hypermarket Brand Extension through
Brand Asset Valuator is about brand extension related with my research in hypermarket
topic only and different in brand variety. The result of Hasliza Hassan & Muhammad
Sabbir Rahman show that it is expected that the positive valuation of national brand will
influence similar valuation towards hypermarkets brand extension and vice versa. And
for my study show that brand variety are significant on customer to coming and
repurchase in hypermarket business.
Salomão Alencar de Farias, & Edvan Cruz Aguiar1 & Francisco Vicente Sales
Melo (Online Published: January 23, 2014) Store Atmospherics and Experiential
Marketing: A Conceptual Framework and Research Propositions for An Extraordinary
Customer Experience the components of a store atmosphere that can be manipulated to
generate answers on individuals are related to sensory factors. Experiential marketing that
enhances the sensory aspects of consumption helps in understanding the impact of retail
environment on consumer behavior. Retailers around the world have embraced the
concept of customer experience management, with many incorporating the notion into
their mission statements, searching for the creation of a distinctive customer experience
for their customers (Verhoef et al., 2009). The main objective of this paper is to propose a
conceptual framework for an extraordinary customer experience. The construction of this
theoretical paper was possible through the usage of desk research methodology. We
reviewed the theory on store atmospherics and customer experience, both related to the
retail setting, beginning on the 1950’s and ending on 2011. We also provide some
research propositions aiming to develop the knowledge in this field. It is concluded that it
is imperative for retailers today to take in account customers’ holistic experience as a
relevant tool to manage the retail operation in a scenario of global competition.
For this study is about Store Atmospherics and Experiential Marketing of Salomão
Alencar de Farias, & Edvan Cruz Aguiar1 & Francisco Vicente Sales Melo related with
72
my research in category factors about atmospheres, their research showed that the
components of a store atmosphere that can be manipulated to generate answers on
individuals are related to sensory factors. The main objective of this paper is to propose a
conceptual framework for an extraordinary customer experience. And for my research
show that the atmospheres are significant on customer to come back and repurchase in
hypermarket business.
Han-Shen Chen & Tsuifang Hsieh (Accepted 22 November, 2010). The effect of
atmosphere on customer perceptions and customer behavior responses in chain store
supermarkets this study aims at exploring the theme of creating and managing store
atmosphere of chain store supermarket from customer’s point of view. The findings from
the study indicate: (1) The customer perceived factors of store atmosphere of supermarket
include 6 factors in 3 categories, that is, design factors, ambient factors (including
intangible factors and visual stimulus) and social factors (including image of service
personnel, image of other customers and environmental crowding); (2) Store atmospheric
factors have significant positive correlation with customer approach behaviors, design
factors being the most significant impact among all factors. Store atmospheric factors
will influence not only customer emotions but also customer cognitive valuations of
commodities and services. Customer cognitive valuations and emotional responses will
affect customer approach behaviors significantly; meanwhile, customers’ cognitions and
emotional responses will moderator the impact of store atmosphere on customer
behaviors partially; (3) Customers with various characteristics (including different
shopping planning, time urgency, environmental familiarity etc.) have significant
differences in customer perceptions and behaviors in general. Finally, this study proposes
specific suggestions and measures of how to create a pleasant store atmosphere in chain
store supermarket according to results of empirical analyses.
For this study is about the effect of atmosphere on customer perceptions and
customer behavior responses in chain store supermarkets related with my research in
73
category factors and customer behavior factors, this study aims at exploring the theme of
creating and managing store atmosphere of chain store supermarket from customer’s
point of view. And for my research show that the atmospheres are significant on
customer to come back and repurchase in hypermarket business and customer behavior
are also significant for customer.
5.4 Managerial Implication
In business part, business owners, investors, managers and staffs can use the results
from this study in which open that the major factors that effect on customer and keep
them coming back in hypermarket business are the main components that help
contributing both customers and to answer their require before using the service in
hypermarket. This paper can be applied and develop in marketing strategy and the main
factors as following;
Service factor
For the service factors after get survey from 400 respondent the result show that
service factors are significant for customer to come to use the hypermarket service, most
of them like the service at solving the problem of the staff, staff can help them and
suggested them with the knowledge and experience, and most of them also like at the
point of the goods are available for all customer to take and get the best thing.
Product quality factor
For the product quality factor after the survey from 400 respondent the result show
that the product quality factor are significant on customer and keep them coming back in
hypermarket business on standardization of the quality and variety of quality that
customer keep coming back and come to use the service.
74
Price factor
For the price factors after the survey from the 400 respondent the result of price factor are
significant on the cheaper than other competitors, it mean that price is one of the factor
that keep customer coming back into hypermarket business.
Sale promotion factors
For the sale promotion factors after the survey from the 400 respondent the result of
sale promotion factor are significant on always have discount for customer to make them
more attractive and repeat to coming back, customer also agree on the loyalty card or
member card they can get give or discount in the next time when they come and purchase
on it.
Facility factors
For the facility factors after the survey from the 400 respondent the result of facility
factor are significant on quality of the restaurant inside the food court and inside that are
clean also it make customer impress and repetitively come to used the service, more on
booth that customer like to shopping and like to the inside and outside the booth before
going inside hypermarket.
Category factors
For the category factors after the survey from the 400 respondent the result of
category factor are significant on decoration inside the hypermarket, they decorate in the
theme of each festival that happen in each month and music also open follow the theme
as the decoration at that time.
75
Brand variety factor
For the brand variety factors after the survey from the 400 respondent the result of
brand variety factor are significant on variety of each brand that hypermarket keep for
customer to choose and take it, also most of variety of brand are famous and well known.
5.5 Recommendation for Future Research
For the new researcher should add more sample size; get increase sample size to get
the better understand of the customers and potential buyer that can replicate the true
population. Should be search for more factors such as add more in marketing mix
strategy from 4p to 7p that can effect on customers to keep them coming back more into
hypermarket business. Nowadays in Bangkok the AEC are the newly project of the
government to expand more market in all business so in hypermarket business should add
more product that related to other country for customer to come and used the service.
76
BIBLIOGRAPHY
Place in the Marketing Mix: Definition & Concept. (2003). Retrieved from
http://study.com/academy/lesson/place-in-the-marketing-mix-definition-lesson-
quiz.html
Landlord Tenant Common Areas Law& Legal Definition. (2009, March 12). Retrieved
from Definitions.uslegal.com.
Marketing. (2009, August 02). Retrieved from INVESTOPEDIA:
http://www.investopedia.com/terms/m/marketing.asp
atmospherics . (2014). Retrieved 2010, from Business Dictionary.com:
http://www.businessdictionary.com/definition/atmospherics.html
Hypermarket. (2016, January 06). Retrieved from Wikipedia:
http://en.wikipedia.org/wiki/Hypermarket
service business. (2016). Retrieved from BusinessDictionary.com:
http://www.businessdictionary.com/definition/service-business.html)
What is the definition of a sales promotion. (2016). Retrieved from Ask.com:
http://www.ask.com/business-finance/definition-sales-promotion-
e64f69f4d105bc42#full-answer
achiism. (2009, August 03). Store type & Layout ,,,: HyperMarket. Retrieved 2009 from
Achiiz's blog: http://achiism.onsugar.com/Store-type-layout-hypermarket-
3732972
Baker, J. &. (1994). The influence pf store environment on quality inferences and store
image. Journal of Academy of Marketing Science, Vol. 22, pp. 328-39.
Berg, L. v. (1990). Marketing Metropolitan Regions, Rotterdam. Erasmus University,
EURICUR.
Braun, G. O. (1994). Managing and Marketing of Urban Development and Urban life. .
Proceedings of the IGU-Commission on “Urban Development and Urban Life”
Berlin, August 15th to 20th.
77
Burt, S. &. (2010). From the retail brand to the retail-er as a brand: themes and issues in
retail branding research. International Journal of Retail & Distribution
Management, Vol. 38(11/12), pp. 865-878.
Calantone, R. J. (1990). "Defensive Industrial Marketing Strategies,". Industrial
Marketing Management,, 19 (3), 267-79.
Chen, M.-J. a. (1992). "Nonresponse and Delayed Response to Competitive Moves: The
Roles of Competitor Dependence and Action Irreversibility," . Academy of
Management Journal 35 (August), 539-70.
Diamond, B. (2014, July 14). Why are parking lots important? Retrieved from
BlackDiamond: http://blackdiamondgrp.com/parking-lots/
Duffy, H. (1995). Competitive Cities: Succeeding in the Global Economy. Spon, London.
Esbjerg, L. &.-L. (2009). The brand architecture of grocery retailers:setting material and
symbolic boundaries for customer choice. Journal of Retailing and Consumer
Service, 16, 414-423.
Flex. (2009, June 10). Designing Supermarket. Retrieved from Slideshare:
http://www.slideshare.net/glenferry/designing-supermarket
Garvin, D. (1984). "What Does Product Quality Really Mean?" . Sloan Management
Review, Fall, pp. 25-39.
Gregson, A. (2008). Pricing Strategies for Small Business 2008 Self Counsel Press. ISBN
978-1-55180-979-3.
Grensing-Pophal, L. (2005). Marketing with the End in Mind. Retrieved 2005
Hamlett, J. (2008, April). Regulatin UK supermarkets: an oral-history perspective.
Retrieved from History & Policy United Kingdom.
Hamlett, J. (2008, April). Supermarket. Retrieved from Wikipedia:
https://en.wikipedia.org/wiki/Supermarket
Hamlett, J. (2010). "Regulating UK supermarkets: an oral-history perspective". History &
Policy United Kingdom.
Herrn, D. (1997). Marketing, Non-profit Programs and Services. Jossey-Bass Publishers,
San Francisco.
78
Hoggson, N. F. (1926). Banking Through the Ages, New York, Dodd, Mead &
Company.
Holcomb, B. (1993). Revisioning Place: De- and Re-Constructing the image of the
industrial city. Oxford, pp. 133-143.
Kearns, G. &. (1993). The city as cultural capital, past and present. Pergamon Press Ltd,
Oxford.
Kerb, P. (2009, July 25). Spacemanagementsolutions. Retrieved from wikipedia:
http://en.wikipedia.org/wiki.parking_space
Kotler, P. &. (2002). Marketing Asian Places. Places.John Wiley & Sons (Asia),
Singapore.
Kotler, P. (1973). Atmostpherics as a marketing tool Journal of Retailing. Journal of
Retailing, 49(4), 48-64.
Leigh Richards. (n.d.). Different Types of Pricing Strategy. Retrieved from Small
Business: http://smallbusiness.chron.com/different-types-pricing-strategy-
4688.html
Lynn R. Kahle, A. G. (2011). Consumer Behavior Knowledge for Effective Sports and
Event Marketing. New York: Routledge, ISBN 978-0-415087358-1.
Maslow, A. (2009, May 21). A theory of human Motivation. Retrieved Pradham, S.
(2007). Retailing Management 2E. The McGraw Hill Companies, pp. 226–
228.ISBN 978-0-07-062020-9.
Sergeant, A. (1999). Marketing management for nonprofit organisations. Oxford.
Shamoon, S. a. (n.d.). "Brand Management: What Next?" Interdisciplinary Journal Of
Contemporary Research In Business 2.12 (2011). Business Source Complete.
Web.435–441.
Srinivasan, S. P. (2000). "Market Share Response and Competitive Interaction: The
Impact of Temporary, Evolving and Structural Changes in Prices," . International
Journal of Research in Marketing, 17 (4), 281-305.
Swoboda, B. H.-k. (2007). An intersector analysis of the relevance of service in building
a strong retail brand Managing Service quality. 17(4, 428-448).
79
Townley, P. (1991). From the President." In Tank, A.G., ed. Global Perspectives on Total
Quality. Conference Board, New York, New York, .
Underhill, P. (2004). Call of the mall. Retrieved 2004, from Simon & Schuster:
http://en.wikipedia.org/wiki/food_court
Wagenberg, A. a. (2004). "Assessing the innovative ability of FM teams: a review".
Facilities, Vol. 22 Nos 11/12, pp. 290–5.
Ward, S. (1998). The Marketing and Promotion of Towns and Cities, 1850- 2000.
Routledge, New York.
Witt, S. &. (1995). Tourism Marketing and Management Handbook. PrenticeHall Int.,
Cambridge.

APPENDIX
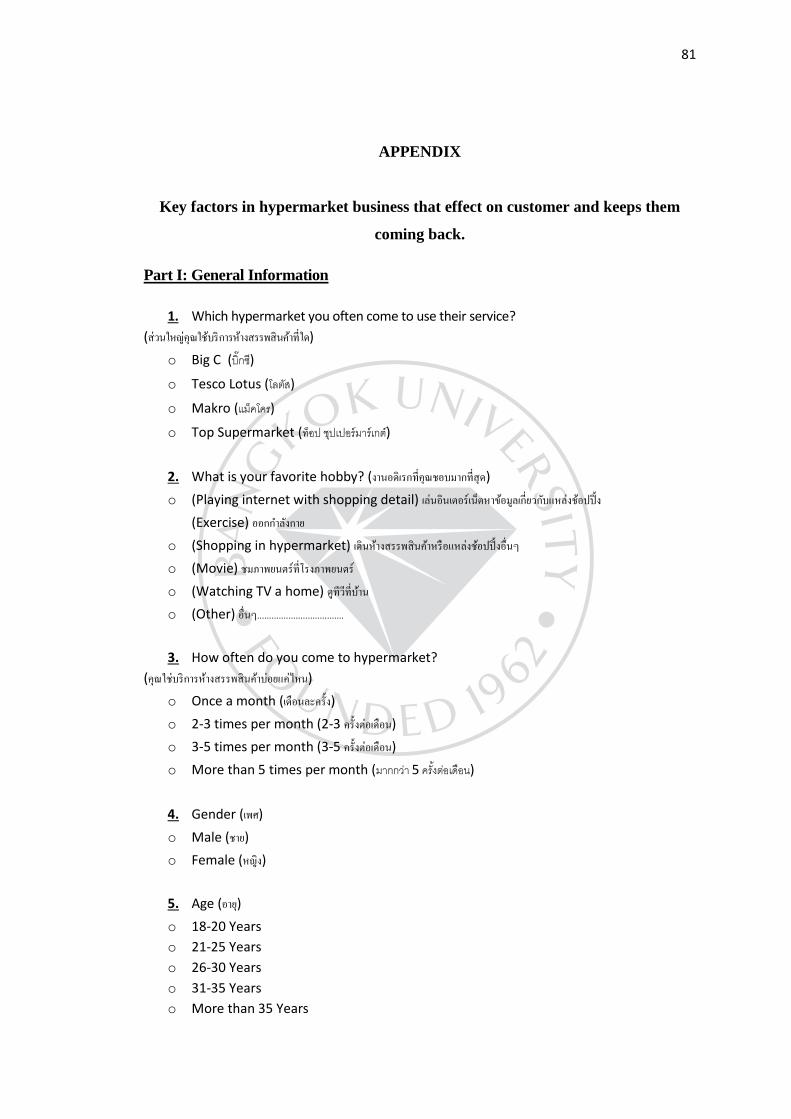
81
APPENDIX
Key factors in hypermarket business that effect on customer and keeps them
coming back.
Part I: General Information
1. Which hypermarket you often come to use their service? (สวนใหญคณใชบรการหางสรรพสนคาทใด)
o Big C (บกซ)
o Tesco Lotus (โลตส)
o Makro (แมคโคร)
o Top Supermarket (ทอป ชปเปอรมารเกต)
2. What is your favorite hobby? (งานอดเรกทคณชอบมากทสด)
o (Playing internet with shopping detail) เลนอนเตอรเนตหาขอมลเกยวกบแหลงชอปปง
(Exercise) ออกก าลงกาย
o (Shopping in hypermarket) เดนหางสรรพสนคาหรอแหลงชอปปงอนๆ
o (Movie) ชมภาพยนตรทโรงภาพยนตร
o (Watching TV a home) ดทวทบาน
o (Other) อนๆ....................................
3. How often do you come to hypermarket? (คณใชบรการหางสรรพสนคาบอยแคไหน)
o Once a month (เดอนละครง)
o 2-3 times per month (2-3 ครงตอเดอน)
o 3-5 times per month (3-5 ครงตอเดอน)
o More than 5 times per month (มากกวา 5 ครงตอเดอน)
4. Gender (เพศ)
o Male (ชาย)
o Female (หญง)
5. Age (อาย)
o 18-20 Years
o 21-25 Years
o 26-30 Years
o 31-35 Years
o More than 35 Years
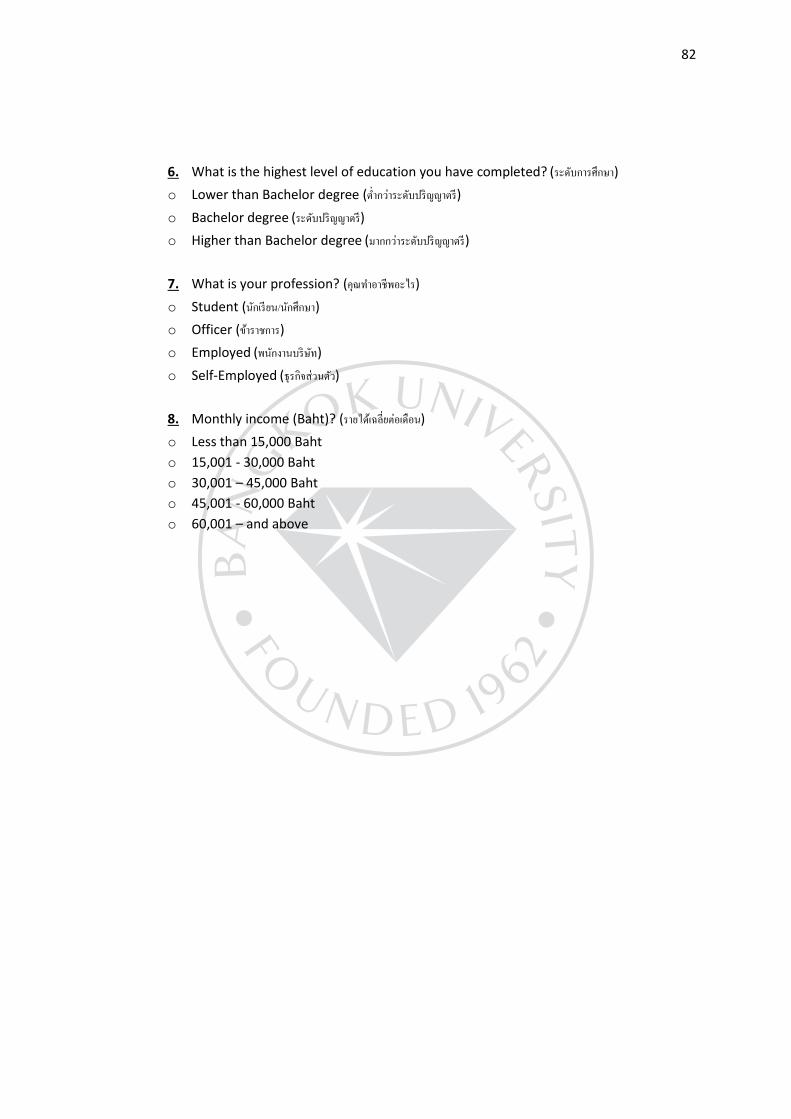
82
6. What is the highest level of education you have completed? (ระดบการศกษา)
o Lower than Bachelor degree (ต ากวาระดบปรญญาตร)
o Bachelor degree (ระดบปรญญาตร)
o Higher than Bachelor degree (มากกวาระดบปรญญาตร)
7. What is your profession? (คณท าอาชพอะไร)
o Student (นกเรยน/นกศกษา)
o Officer (ขาราชการ)
o Employed (พนกงานบรษท)
o Self-Employed (ธรกจสวนตว)
8. Monthly income (Baht)? (รายไดเฉลยตอเดอน)
o Less than 15,000 Baht
o 15,001 - 30,000 Baht
o 30,001 – 45,000 Baht
o 45,001 - 60,000 Baht
o 60,001 – and above
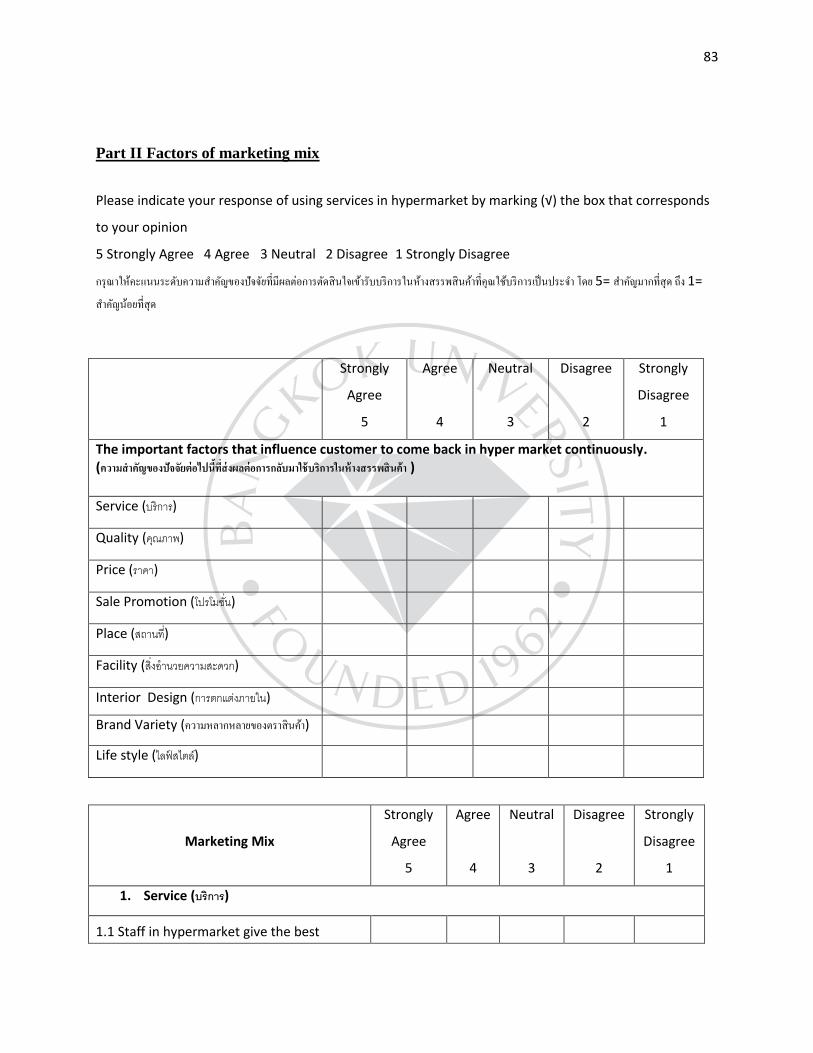
83
Part II Factors of marketing mix
Please indicate your response of using services in hypermarket by marking (√) the box that corresponds
to your opinion
5 Strongly Agree 4 Agree 3 Neutral 2 Disagree 1 Strongly Disagree
กรณาใหคะแนนระดบความส าคญของปจจยทมผลตอการตดสนใจเขารบบรการในหางสรรพสนคาทคณใชบรการเปนประจ า โดย 5= ส าคญมากทสด ถง 1=
ส าคญนอยทสด
Strongly
Agree
5
Agree
4
Neutral
3
Disagree
2
Strongly
Disagree
1
The important factors that influence customer to come back in hyper market continuously. (ความส าคญของปจจยตอไปนทสงผลตอการกลบมาใชบรการในหางสรรพสนคา )
Service (บรการ)
Quality (คณภาพ)
Price (ราคา)
Sale Promotion (โปรโมชน)
Place (สถานท)
Facility (สงอ านวยความสะดวก)
Interior Design (การตกแตงภายใน)
Brand Variety (ความหลากหลายของตราสนคา)
Life style (ไลฟสไตล)
Marketing Mix
Strongly
Agree
5
Agree
4
Neutral
3
Disagree
2
Strongly
Disagree
1
1. Service (บรการ)
1.1 Staff in hypermarket give the best
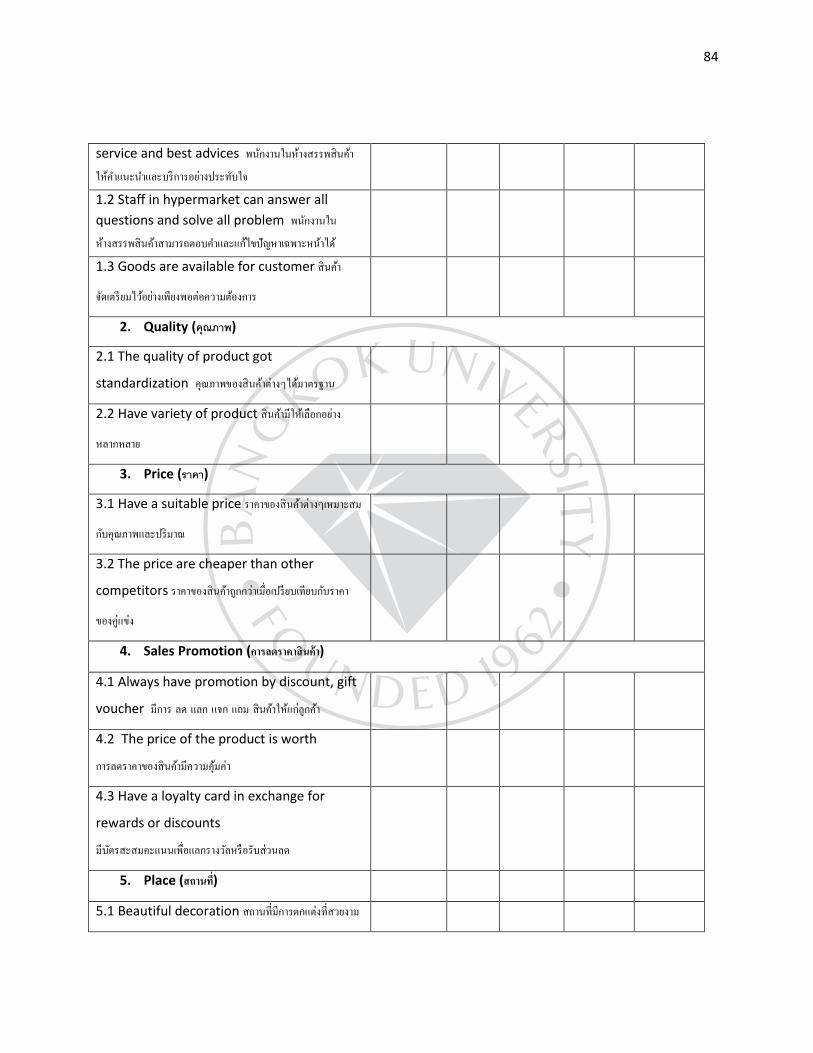
84
service and best advices พนกงานในหางสรรพสนคา
ใหค าแนะน าและบรการอยางประทบใจ
1.2 Staff in hypermarket can answer all
questions and solve all problem พนกงานใน
หางสรรพสนคาสามารถตอบค าและแกไขปญหาเฉพาะหนาได
1.3 Goods are available for customer สนคา
จดเตรยมไวอยางเพยงพอตอความตองการ
2. Quality (คณภาพ)
2.1 The quality of product got
standardization คณภาพของสนคาตางๆไดมาตรฐาน
2.2 Have variety of product สนคามใหเลอกอยาง
หลากหลาย
3. Price (ราคา)
3.1 Have a suitable price ราคาของสนคาตางๆเหมาะสม
กบคณภาพและปรมาณ
3.2 The price are cheaper than other
competitors ราคาของสนคาถกกวาเมอเปรยบเทยบกบราคา
ของคแขง
4. Sales Promotion (การลดราคาสนคา)
4.1 Always have promotion by discount, gift
voucher มการ ลด แลก แจก แถม สนคาใหแกลกคา
4.2 The price of the product is worth
การลดราคาของสนคามความคมคา
4.3 Have a loyalty card in exchange for
rewards or discounts
มบตรสะสมคะแนนเพอแลกรางวลหรอรบสวนลด
5. Place (สถานท)
5.1 Beautiful decoration สถานทมการตกแตงทสวยงาม
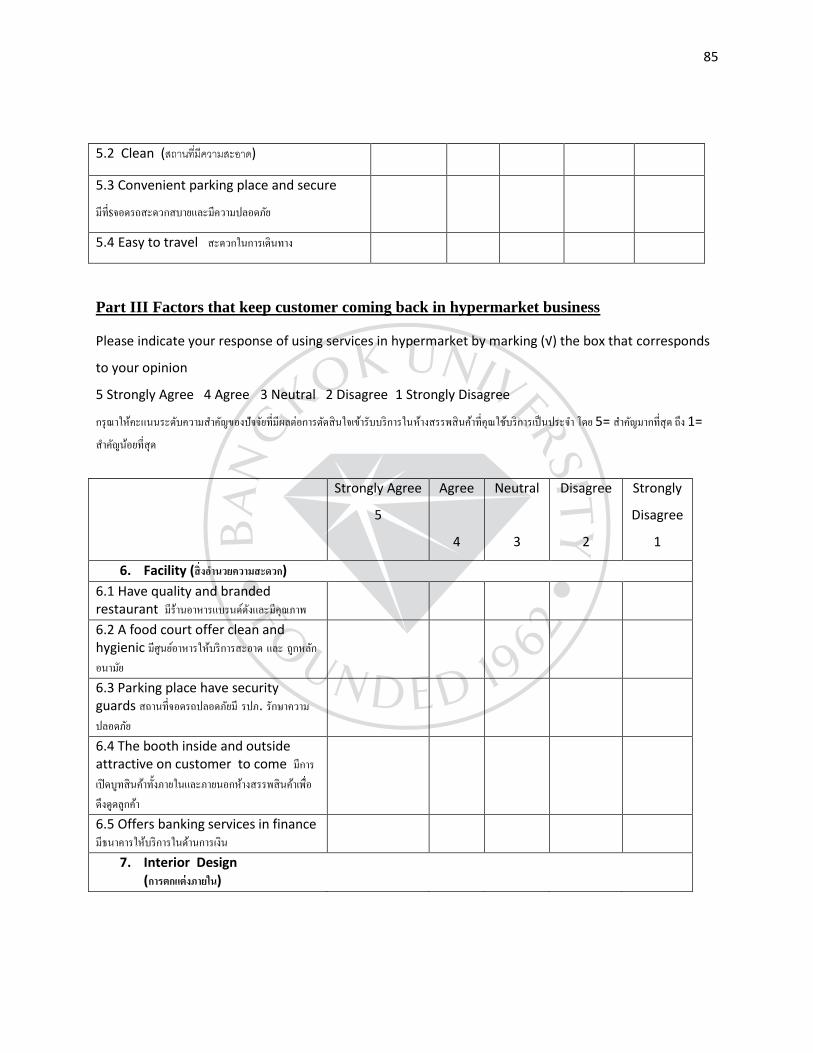
85
5.2 Clean (สถานทมความสะอาด)
5.3 Convenient parking place and secure
มท$จอดรถสะดวกสบายและมความปลอดภย
5.4 Easy to travel สะดวกในการเดนทาง
Part III Factors that keep customer coming back in hypermarket business
Please indicate your response of using services in hypermarket by marking (√) the box that corresponds
to your opinion
5 Strongly Agree 4 Agree 3 Neutral 2 Disagree 1 Strongly Disagree
กรณาใหคะแนนระดบความส าคญของปจจยทมผลตอการตดสนใจเขารบบรการในหางสรรพสนคาทคณใชบรการเปนประจ า โดย 5= ส าคญมากทสด ถง 1=
ส าคญนอยทสด
Strongly Agree
5
Agree
4
Neutral
3
Disagree
2
Strongly
Disagree
1
6. Facility (สงอ านวยความสะดวก)
6.1 Have quality and branded restaurant มรานอาหารแบรนดดงและมคณภาพ
6.2 A food court offer clean and hygienic มศนยอาหารใหบรการสะอาด และ ถกหลกอนามย
6.3 Parking place have security guards สถานทจอดรถปลอดภยม รปภ. รกษาความปลอดภย
6.4 The booth inside and outside attractive on customer to come มการเปดบทสนคาทงภายในและภายนอกหางสรรพสนคาเพอดงดดลกคา
6.5 Offers banking services in finance มธนาคารใหบรการในดานการเงน
7. Interior Design (การตกแตงภายใน)
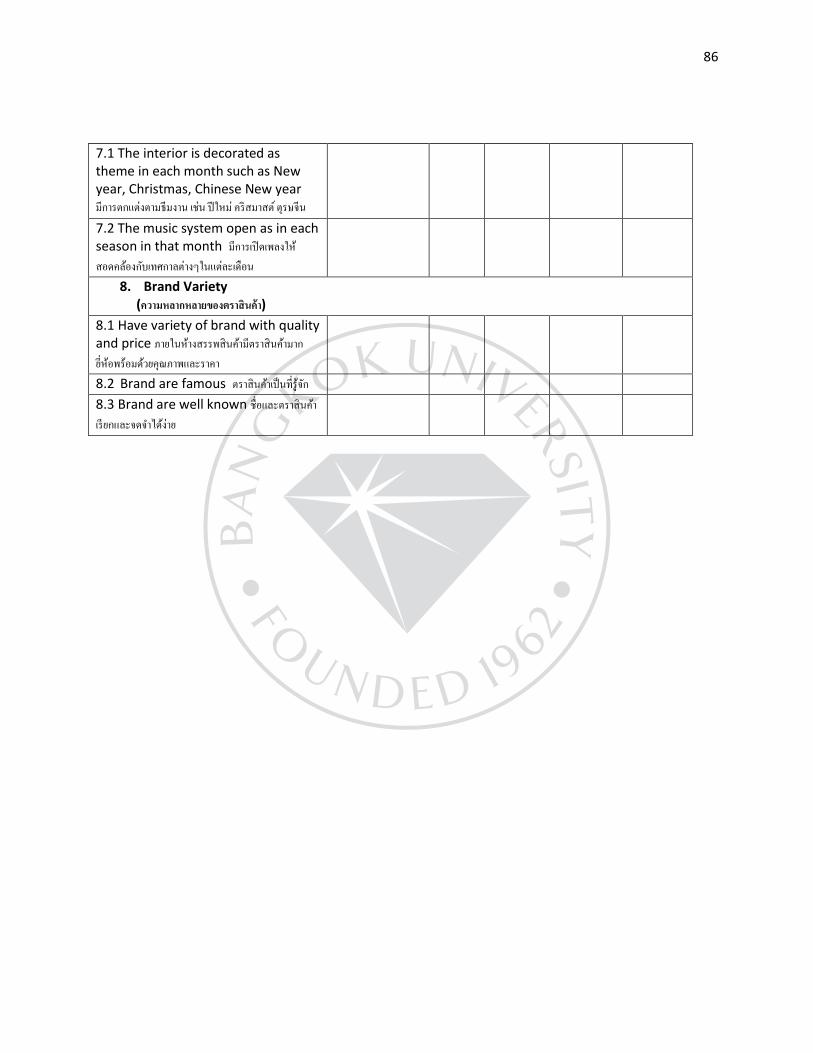
86
7.1 The interior is decorated as theme in each month such as New year, Christmas, Chinese New year มการตกแตงตามธมงาน เชน ปใหม ครสมาสต ตรษจน
7.2 The music system open as in each season in that month มการเปดเพลงใหสอดคลองกบเทศกาลตางๆในแตละเดอน
8. Brand Variety (ความหลากหลายของตราสนคา)
8.1 Have variety of brand with quality and price ภายในหางสรรพสนคามตราสนคามากยหอพรอมดวยคณภาพและราคา
8.2 Brand are famous ตราสนคาเปนทรจก
8.3 Brand are well known ชอและตราสนคาเรยกและจดจ าไดงาย
87
BIODATA
Name: Rani Pandey
Address: 435/35 prachautid 90 prachautid road Bangkok 10290.
Email: [email protected]
Mobile: 085-368-3836, 02-461-5986
Educational: Bachelor of Bachelor Degree of Political Science from Ramkhamhang
University
Occupation: Sales executive in Raymond International co., ltd
Languages: Thai, Hindi, and English Language (good)
Professional Software: Microsoft, HTML