
EFFECT OF PHYSICOCHEMICAL FACTORS AND DYKE ON …
64
EFFECT OF PHYSICOCHEMICAL FACTORS AND DYKE ON CONSERVATION OF Oreochromis esculentus AND Oreochromis variabilis IN LAKE KANYABOLI, KENYA BY PETRUS ODUOR JALAU A THESIS SUBMITTED IN PARTIAL FULFILMENT OF THE REQUIREMENTS FOR DEGREE OF MASTER OF SCIENCE IN CONSERVATION BIOLOGY DEPARTMENT OF ZOOLOGY MASENO UNIVERSITY © 2017
Transcript of EFFECT OF PHYSICOCHEMICAL FACTORS AND DYKE ON …

EFFECT OF PHYSICOCHEMICAL FACTORS AND DYKE ON
CONSERVATION OF Oreochromis esculentus AND Oreochromis
variabilis IN LAKE KANYABOLI, KENYA
BY
PETRUS ODUOR JALAU
A THESIS SUBMITTED IN PARTIAL FULFILMENT OF THE
REQUIREMENTS FOR DEGREE OF MASTER OF SCIENCE IN
CONSERVATION BIOLOGY
DEPARTMENT OF ZOOLOGY
MASENO UNIVERSITY
© 2017

i
DECLARATION
I hereby declare that this thesis is my own work and has not been submitted for any other
qualification at Maseno University or any other institution.
Signature_________________________ Date ________________
Petrus Oduor Jalau
Admn. No. PG/MSC/00067/2012
This thesis has been submitted to Maseno University for examination with our approval as
University supervisors.
Dr. Patrick Ogola Onyango
Department of Zoology
Maseno University
Signature ____________________________ Date _______________
Dr. Dickson Otieno Owiti
Department of Fisheries and Natural Resources
Maseno University
Signature ______________________________ Date _______________
ii
ACKNOWLEDGEMENT
I would like to express my gratitude to God for His love, care and grace that has enabled me
reach this far. I would like to sincerely thank my supervisors Dr. Patrick Onyango and Dr.
Dickson Owiti for their guidance, assistance and encouragement during the course of this
study. Their support has been invaluable and much appreciated. My sincere appreciation also
goes to Zoology laboratory assistants, James Jonge and Philip Nyapola for having assisted me
in laboratory work. I also thank Lake Kanyaboli Beach management for having organized for
me fishing equipments to enable me carry out my fieldwork activities. I want to appreciate
moral support given to me by Mr. Geofrey Kilo, Mr. Kevin Ongoma, Erick Mito and
Maryline Ombima all from Maranda High School. Lastly I thank members of my family, they
have been my source of inspiration and strength from the commencement of this academic
journey to its logical conclusion.

iii
DEDICATION
This work is dedicated to my family members Caroline Atieno, Mary Atieno, Vivian
Adhiambo, Esther Achieng’, Michael Jalau, Conslate Akoth, Brian Otieno, Leah Adhiambo
and Nicholus Owiti.

iv
ABSTRACT
Lake Victoria witnessed mass extinction of native fish species that coincided with
introductions of Lates niloticus and Oreochromis niloticus about five decades ago. Small
populations of O. esculentus and O. variabilis that are locally extinct in L. Victoria are found
in Lake Kanyaboli, a satellite lake of L. Victoria. L. Kanyaboli thus has potential to serve as a
refugium where cichlid relics are protected from the invasive L. niloticus. However, the status
and thus factors that may negatively impact the survival of the two cichlids are presently not
known. In addition, although a dyke that divides the lake into two components was
constructed in 2003, its effects on key trophic levels such as phytoplankton species are not
known. The goal of this study was to investigate physicochemical factors and effect of the
dyke that may constrain the conservation of both O. esculentus and O. variabilis in L.
Kanyaboli. Specifically, the study aimed to: compare present and previous estimates of
temperature, dissolved oxygen (DO), pH and turbidity; determine whether temperature,
dissolved oxygen, pH and turbidity predict the distribution of Oreochromis esculentus and O.
variabilis; compare size of O. esculentus and O. variabilis in the lake against their respective
sizes published by International Union of Conservation of Nature (IUCN); and determine
effect of the dyke on phytoplankton species diversity in L. Kanyaboli. Levels of DO, pH,
temperature using Environmental Multiparameter Monitoring System YSI Hydrolab and
Secchi depth were measured using Secchi disk and compared to previous estimates from the
lake to determine the extent which the four physicochemical factors have changed and
whether they predicted the distribution of each of the two species. The study employed a
cross-sectional study design. Lengths of fish caught during the study were measured and
compared against respective lengths of each species published the IUCN. Diversity of
phytoplankton was determined from water samples. The study found that DO and
temperature are decreasing but pH and Secchi depth are increasing, which suggests that
quality of water in the lake is deteriorating. The results showed that Secchi depth was
positively proportional to the abundance of O. variabilis (z = 2.000, p < 0.0455). None of the
four physicochemical factors predicted the distribution of O. esculentus. The results also
showed that O. esculentus and O. variabilis in L. Kanyaboli were significantly shorter than
their respective lengths published literature by IUCN (t = -19.564, p < 0.0001 and t = -
45.960, p < 0.0001 respectively). The small size of fish may arise from high fishing pressure
and deteriorating quality of the water. Results on the effect of the dyke showed that the
western component of the lake had a lower phytoplankton species diversity compared to the
smaller component, H= 3.033 vs. H = 1.281. All species of phytoplankton that were abundant
in the larger component are associated with polluted waters. In contrast, species that were
more abundant in the smaller component of the lake are associated with relatively less
polluted waters. Results on phytoplankton species diversity suggest that the two components
of the lake may be under different limnological processes. In the aggregate, conservation
efforts should aim at improving water quality and regulating both fishing effort and fishing
gear in Lake Kanyaboli so as to safeguard its roles as a biological refugium for endangered
fishes in L. Victoria.
v
Table of Contents
DECLARATION ..................................................................................................................................... i
ACKNOWLEDGEMENT ...................................................................................................................... ii
DEDICATION ....................................................................................................................................... iii
ABSTRACT ........................................................................................................................................... iv
LIST OF TABLES ................................................................................................................................ vii
LIST OF FIGURES ............................................................................................................................. viii
LIST OF PLATES ................................................................................................................................. ix
CHAPTER ONE: INTRODUCTION ................................................................................................. 1
1.1 Background ................................................................................................................................... 1
1.2 Statement of the problem .............................................................................................................. 3
1.3 Justification of study ..................................................................................................................... 3
1.3 General objectives ......................................................................................................................... 4
1.4 Specific objectives ........................................................................................................................ 4
1.5 Null hypotheses ............................................................................................................................. 4
1.6 Significance of study ..................................................................................................................... 5
CHAPTER TWO: LITERATURE REVIEW .................................................................................... 6
2.1 Physicochemical characteristics of aquatic ecosystems ............................................................ 7
2.1.1 Dissolved oxygen ................................................................................................................... 8
2.1.2 pH ........................................................................................................................................... 9
2.1.3 Temperature ......................................................................................................................... 10
2.1.4 Turbidity .............................................................................................................................. 11
2.2 Factors that influence size of Oreochromis esculentus and Oreochromis variabilis .............. 12
2.3 The Dyke ................................................................................................................................. 13
2.4 General Biology of Oreochromis esculentus and Oreochromis variabilis ............................. 14
2.4.1Oreochromis esculentus ........................................................................................................ 14
2.4.2 Oreochromis variabilis ........................................................................................................ 16
CHAPTER THREE: MATERIALS AND METHODS ................................................................... 18
3.1 Study site: Lake Kanyaboli ..................................................................................................... 18
3.2.0 Methods of data collection ................................................................................................... 19

vi
3.2.1 Measurements of DO, pH, temperature and turbidity .......................................................... 21
3.2.2 Determining size of fish in Lake Kanyaboli ........................................................................ 22
3.2.3 Determining phytoplankton species diversity in Lake Kanyaboli ....................................... 22
3.3 Data analysis. .............................................................................................................................. 22
CHAPTER FOUR: RESULT AND DISCUSSION ........................................................................ 24
4.1 Comparison of measurements of physicochemical factors between 2014 and 1981- 2002 studies
.............................................................................................................................................................. 24
4.2 Influence of physicochemical factors on the distribution of O. variabilis and O. esculentus..... 26
4.3 Comparison of size of O.esculentus and O.variabilis in L. Kanyaboli against size published by
IUCN ................................................................................................................................................. 28
4.4 Effect of dyke on phytoplankton species diversity ..................................................................... 30
CHAPTER FIVE: SUMMARY, CONCLUSIONS, AND RECOMMENDATIONS ................... 34
5.1 Summary ..................................................................................................................................... 34
5.2 Conclusion .................................................................................................................................. 34
5.3 Recommendations ....................................................................................................................... 35
5.3.1 Recommendations from present study .................................................................................... 35
5.3.2 Recommendations for future studies ...................................................................................... 36
REFERENCES .................................................................................................................................... 37
APPENDICES………………………………………………………………………………47
APPENDIX I ........................................................................................................................................ 47
APPENDIX II ....................................................................................................................................... 49
APPENDIX III ...................................................................................................................................... 51
APPENDIX IV……………………………………………………………………………….53

vii
LIST OF TABLES
Table 4.1: Measurements of physicochemical factors in L. Kanyaboli from 2014 and
previous studies………………………………………………………………………...page 20.
Table 4.2: Influence of physicochemical factors and distribution of O. variabilis in L.
Kanyaboli………………………………………………………………………………Page 23.
Table 4.3: Influence of physicochemical factors and distribution of O. esculentus in L.
Kanyaboli……………………………………………………………………………… Page 23
Table4.4 Size of O. esculentus and O. variabilisin L. Kanyaboli…………………..…Page 50
Table 4.5:Phytoplankton species diversity in eastern component of L. Kanyaboli……Page 27
Table 4.6:Phytoplankton species diversity in western component of L.
Kanyaboli…………………………………………………………………………….…Page 38
Table4.7: Phytoplankton species frequency distribution in two components of the L.
Kanyaboli………………………………………………………………………………Page 31.

viii
LIST OF FIGURES
Figure 1: Map of Lake Kanyaboli showing the location of the dyke and the extent of papyrus
swamp around the lake…………………………………………………………………Page18.
Figure 2: Map of study site with points indicating sampling units……………………Page19.

ix
LIST OF PLATES
Plate 1:Oreochromis esculentus…………………………………………………..Page 16.
Plate 2:Oreochromis variabilis…………………………………………………… Page17.

1
CHAPTER ONE
Introduction
1.1 Background
The collapse of native fisheries and population declines of cichlid species in Lake Victoria is
one of the well-documented biodiversity disasters in modern times (Kaufman, 1992; Pringle,
2005). The introduced species, most notably Lates niloticus, dramatically altered the ecosystem
of the lake and consequently led to the extinction of over 300 haplochromine cichlid species in
L. Victoria (Ogutu-Ohwayo, 1990). Today two tilapiine species, Oreochromis esculentus and
Oreochromis variabilis, have disappeared from L. Victoria (Twongo, 1995; Aloo, 2003;
Balirwa; 2003) and are now classified as critically endangered (IUCN, 2015). The
disappearance of O. esculentus and O. variabilis from L. Victoria might have been caused by
predation by L. niloticus, competitive exclusion by O. niloticus or by ecological displacement
by introduced fishes and overfishing (Twongo, 1995). However remnant populations of O.
esculentus and O. variabilis still persist in L. Kanyaboli, a satellite lake of L. Victoria (Abila,
2005; Angienda, 2011).
Biodiversity in L. Kanyaboli just like that of L. Victoria is under several threats. One
of the major threats that L. Kanyaboli faces is overexploitation of its fish resources. In 2003,
the active number of boats in the lake was estimated at 65 (Abila, 2003), which was quite high
for a lake of 10.5 km2 in size and is thought to have exerted considerable pressure on fish
population in the lake. Lake Kanyaboli acts as refugium for L. Victoria fishes (Abila, 2005)
and thus may serve as a potential source for future reintroductions of native fishes to L.
Victoria. Despite the importance of the lake and its cichlids to the local community, empirical
data on the status of prevailing physicochemical characteristics (temperature, dissolved
oxygen, pH and turbidity) was last determined in 2003 (Aloo, 2003) which is over a decade
ago. This is worrying particularly given the fact that the maintenance of conducive aquatic
2
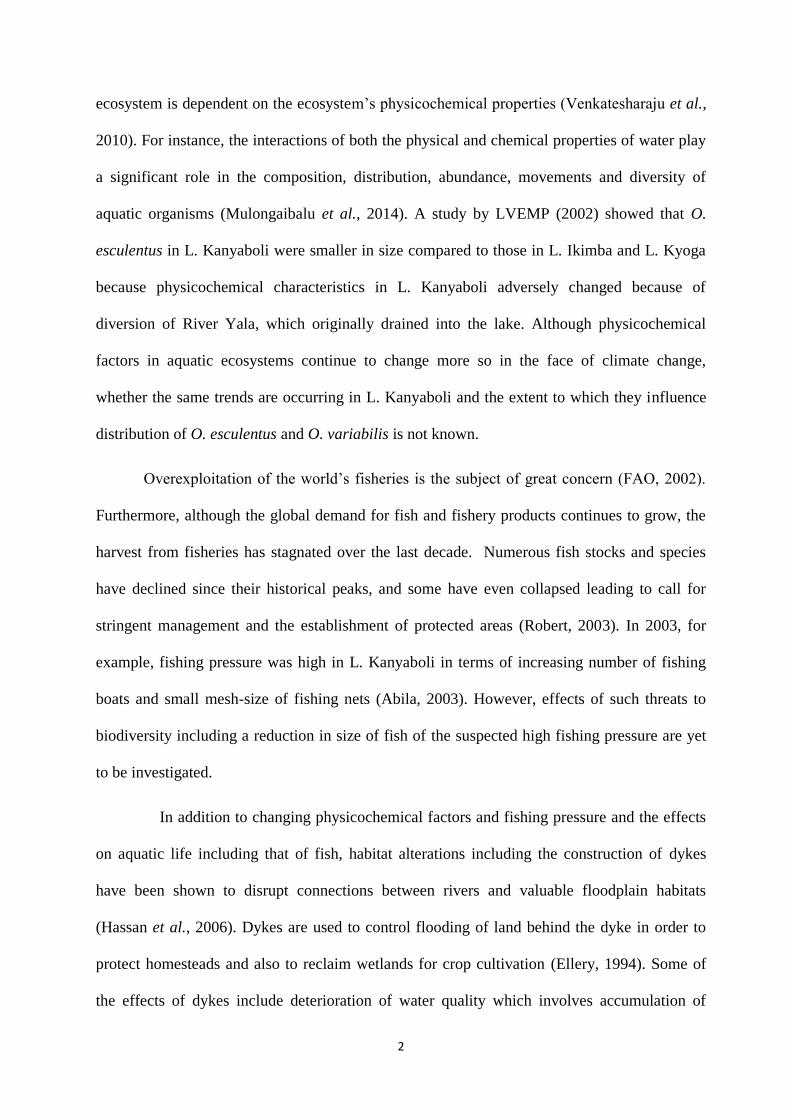
ecosystem is dependent on the ecosystem’s physicochemical properties (Venkatesharaju et al.,
2010). For instance, the interactions of both the physical and chemical properties of water play
a significant role in the composition, distribution, abundance, movements and diversity of
aquatic organisms (Mulongaibalu et al., 2014). A study by LVEMP (2002) showed that O.
esculentus in L. Kanyaboli were smaller in size compared to those in L. Ikimba and L. Kyoga
because physicochemical characteristics in L. Kanyaboli adversely changed because of
diversion of River Yala, which originally drained into the lake. Although physicochemical
factors in aquatic ecosystems continue to change more so in the face of climate change,
whether the same trends are occurring in L. Kanyaboli and the extent to which they influence
distribution of O. esculentus and O. variabilis is not known.
Overexploitation of the world’s fisheries is the subject of great concern (FAO, 2002).
Furthermore, although the global demand for fish and fishery products continues to grow, the
harvest from fisheries has stagnated over the last decade. Numerous fish stocks and species
have declined since their historical peaks, and some have even collapsed leading to call for
stringent management and the establishment of protected areas (Robert, 2003). In 2003, for
example, fishing pressure was high in L. Kanyaboli in terms of increasing number of fishing
boats and small mesh-size of fishing nets (Abila, 2003). However, effects of such threats to
biodiversity including a reduction in size of fish of the suspected high fishing pressure are yet
to be investigated.
In addition to changing physicochemical factors and fishing pressure and the effects
on aquatic life including that of fish, habitat alterations including the construction of dykes
have been shown to disrupt connections between rivers and valuable floodplain habitats
(Hassan et al., 2006). Dykes are used to control flooding of land behind the dyke in order to
protect homesteads and also to reclaim wetlands for crop cultivation (Ellery, 1994). Some of
the effects of dykes include deterioration of water quality which involves accumulation of

3
pollutants, sediments and minerals due to low circulation of water in water bodies (Djkema,
1987). Dykes may also lead to loss of natural habitats for some species as they lead to habitat
fragmentation (Combes, 2003).
In L. Kanyaboli, a dyke was constructed by Dominion Farms in 2003 to facilitate land-
based transport between two communities, Alego and Yimbo, on either side of the lake.
However, the effects of the dyke on aquatic life in the lake are not known. More specifically,
the effects of the dyke on primary producers such as phytoplankton, which are also the natural
food for fish, have not been evaluated.
1.2 Statement of the problem
Despite the potential role of L. Kanyaboli as a refugium for some tilapiine species of
L. Victoria, knowledge of factors that may threaten O. esculentus and O. variabilis in the lake
is incomplete. In addition, effect of the dyke, contrasted in 2003, on biodiversity in the lake
remains unknown. More specifically, first, whether physicochemical factors in the lake have
changed and the extent to which they predict the distribution of O. esculentus and O. variabilis
is not known. Second, the effects of increasing fishing pressure on the size of O. esculentus and
O. variabilis is not known. Third, the effect of the dyke that separates the lake into two
components on biodiversity in the lake is yet to be determined.
1.3 Justification of study
Although L. Kanyaboli has the potential to act as a refugium for L. Victoria, major research
gaps persist and these limit the extent to which decision makers including the Kenya Marine
and Fisheries Institute can formulate targeted conservation action plans to manage fish species
in the lake. Specifically, data on the physicochemical and dyke that threaten Oreochromis
esculentus and Oreochromis variabilis, cichlids presently thought to be extinct in L. Victoria,
are needed in order to formulate a holistic and sustainable management and conservation

4
program of these critically endangered species in L. Kanyaboli.
1.3 General objective
To investigate physicochemical factors and effect of the dyke that may constrain the
conservation of both Oreochromis esculentus and Oreochromis variabilis in Lake Kanyaboli.
1.4 Specific objectives
1. To compare present and previous estimates of temperature, dissolved oxygen, pH and
turbidity in L. Kanyaboli.
2. To determine whether temperature, dissolved oxygen, pH and turbidity predict the
distribution of Oreochromis esculentus and Oreochromis variabilis in L. Kanyaboli.
3. To compare size of O. esculentus and O. variabilis in L. Kanyaboli against size published
by IUCN.
4. To determine differences in phytoplankton species diversity between the two components
of L. Kanyaboli.
1.5 Null hypotheses
1. Present and previous estimates of temperature, dissolved oxygen, pH and turbidity in Lake
Kanyaboli are not different.
2. Temperature, dissolved oxygen, pH, and turbidity do not influence the distribution of
Oreochromis esculentus and Oreochromis variabilis in L. Kanyaboli.
3. Lengths of O. esculentus and O. variabilis in L. Kanyaboli at adult stage are not different
from the species’ reference sizes as published by the International Union for the
Conservation of Nature.
4. There are no differences in phytoplankton species diversity between the two components of
L. Kanyaboli.

5
1.6 Significance of study
The findings of the study will help first, to provide baseline data on the status of water quality
in the lake that may form an important guideline for future monitoring by agencies such as the
Kenya Marine Fisheries Research Institute. Second, to come up with factors that may
negatively impact on the growth of the two species of fish to their maturity in L. Kanyaboli.
Third, to find out the effect of dyke on primary producers such as phytoplankton in L.
Kanyaboli

6
CHAPTER TWO
Literature review
In Lake Victoria, the two introduced species, Lates niloticus and Oreochromis
niloticus, have altered the ecosystem of the lake causing extinction of over 300 haplochromine
species (Ogutu-Ohwayo, 1990; Barilwa, 2003). A huge predaceous fish, the Nile perch (Lates
niloticus) from the Nile River, was introduced to improve fish market. However, its
introduction into L. Victoria provoked mass extinction of native fishes.
Remnant populations of the native tilapiine species such as Oreochromis esculentus and
Oreochromis variabilis that are now extinct in the main L. Victoria still persist in waters of L.
Kanyaboli (Loiselle, 1996; Aloo, 2003; Angienda; et al. 2011). Such peripheral waters are
thought to play an important role in conservation and even speciation of fishes and other
aquatic organisms (Mwanja et al. 2000). However, these satellite lakes are also facing several
threats to their biodiversity thus limiting their potential future role as biological refugia in the
L. Victoria basin.
Of the major threats that face biodiversity, biological invasion ranks second after
habitat fragmentation in contributing to species extinction in aquatic environment worldwide
(USEPA, 2008). Invasive species increase competition for food and living space, physically or
chemically modify aquatic habitats, hybridize with native species and decrease biodiversity by
removing native species (Sala et al., 2000). Aquatic invasive species thrive due to lack of
natural predators and they have high reproductive rates compared to native species, resulting in
a shift in native species distribution and transformation of ecosystem structure and function
(Lockwood, 1999). In L. Victoria, the introduction of Lates niloticus has been associated with

7
serious ecological problems including rapid declines in the richness and diversity of endemic
cichlids species (Schofield, 2011). For instance, the local extinctions of over 300 native species
coincided with the introduction of L. niloticus (Schofield, 1999). In addition to the direct
effects of L. niloticus, it has led to massive algal blooms in the lake partly caused by a top
down effect due to the disappearance of the phytoplanktivorous and detritivorous
haplochromine cichlids attributed to predation by L. niloticus (Schofield, 1999).
In addition to biological introductions, changes in physicochemical factors particularly
in the face of increased effluents from industries and farmlands and climate change, although
not the focus of this research study, have been shown to negatively influence aquatic life
(Ellery,1994).
2.1 Physicochemical characteristics of aquatic ecosystems
The use of a particular habitat by fish is influenced by changes in the physicochemical
factors (Braeton and Guy, 1999) and the choice relates to how fish are able to locate food,
mate, avoid predators, reduce competition for the same resources and promote successful
reproduction, growth and development. However optimal conditions in aquatic ecosystems are
influenced by pollution. Water pollution is a major challenge brought by urbanization,
industrialization and modern agricultural practices. It leads to alteration in physical, chemical
and biochemical properties of water bodies (Shiddamallaya and Pratima, 2008). High human
and livestock population accelerate rates of deforestation, erosion, sedimentation, siltation and
nutrient loading and degrade fish habitats in East African lakes (Hecky, 1993; Odhiambo and
Gichuki, 2000). In L. Kanyaboli, livestock droppings, urine and chemicals from farms around
the lake that are swept by overflow during the rainy season into the lake may alter the
physicochemical parameters which eventually affect life in the lake. Effect of land use around
East African lakes prompted the Lake Victoria Environmental Management Programme
(LVEMP) in 2002 to determine and compare physicochemical parameters in Lakes Kanyaboli
8
(Kenya), Kahanja (Uganda) and Ikimba (Tanzania) (LVEMP, 2002). The study noted that
River Yala which drained into L. Kanyaboli was partly diverted and part of the swamp that
surrounds the lake was reclaimed for rice cultivation, this made the lake to shrink in size. The
lake is surrounded by large rice farms grown by Dominion Farms. Inorganic fertilizers used
during planting and chemicals sprayed to control diseases are finally washed down the lake, the
chemicals may finally change the physicochemical factors in the lake affecting biological lives
in water. The extent to which such habitat changes and land use systems have influenced
physicochemical factors such as temperature, dissolved oxygen, pH, and turbidity and whether
these factors in turn influence distribution of Oreochromis esculentus and Oreochromis
variabilis in the lake is not known. As much as the two native species are still found in L.
Kanyaboli, they may still encounter ecological threats like competition from other related
species like Oreochromis niloticus and adverse physicochemical conditions which may still
engineer their extinction if not checked. Sometimes it’s difficult to notice which factor actually
influences the distribution of the two native species, because the species may move to riparian
zone not because of adverse physicochemical factors in open waters but because they are
escaping fishermen from catching them.
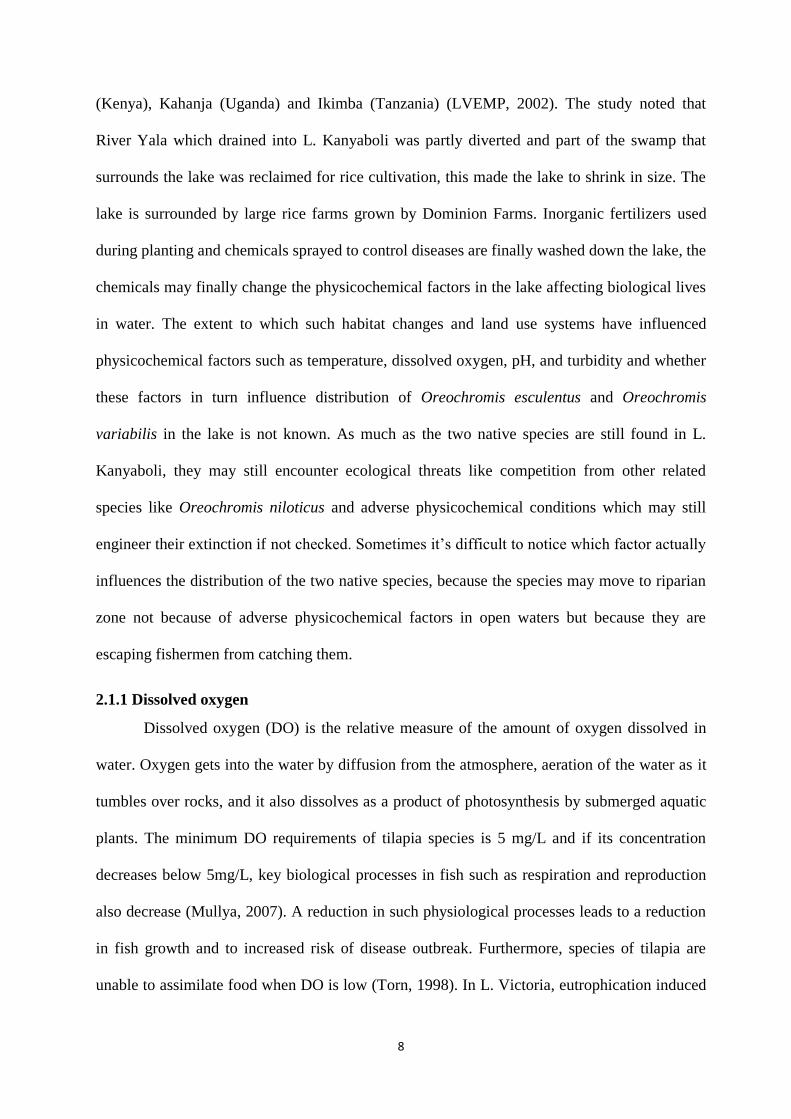
2.1.1 Dissolved oxygen
Dissolved oxygen (DO) is the relative measure of the amount of oxygen dissolved in
water. Oxygen gets into the water by diffusion from the atmosphere, aeration of the water as it
tumbles over rocks, and it also dissolves as a product of photosynthesis by submerged aquatic
plants. The minimum DO requirements of tilapia species is 5 mg/L and if its concentration
decreases below 5mg/L, key biological processes in fish such as respiration and reproduction
also decrease (Mullya, 2007). A reduction in such physiological processes leads to a reduction
in fish growth and to increased risk of disease outbreak. Furthermore, species of tilapia are
unable to assimilate food when DO is low (Torn, 1998). In L. Victoria, eutrophication induced

9
decrease in DO which started in the early 1960s. This contributed to the 1980s collapse of
indigenous fish stocks by eliminating suitable habitats for certain deep-water cichlids (Ogutu-
Ohwayo, 1990).
Nutrient enrichment of L. Victoria led to pronounced blooms of algae especially of the
toxic blue-green algae (Lung’ayia et al., 2000). Consequently, the lake witnessed a reduction in
DO over the years, at times as low as 1.9 mg/L, a level considered lethal to cichlid fishes
(Mhlanga et al., 2006). For example, low DO concentrations have contributed to fish mortality
in the Nyanza Gulf of L. Victoria in 1987 (Ochumba, 1990). According to Okemwa (1981),
northern section of L. Kanyaboli had adequate DO supply (7.2 mg/L) to support fish, but the
southern section of the lake had less DO (3.6 mg/L), which could not support fish. However,
how 2014 measurement of DO compares to DO measurements of 1981 and 2002 and how DO
may influence the distribution of O .esculentus and O. variabilis in the lake has not been
determined.
2.1.2 pH
The concentration of hydrogen ions in a solution, pH, is an important abiotic factor in
aquatic environments. It is known that acid rain induces the acidification of inland waters,
which results in damage to aquatic ecosystems including habitats of fish. A negative effect of
low pH on fish manifests as the production of mucus on the gill epithelium, which interferes
with the exchange of respiratory gases and ions across the gill leading to respiratory distress
and osmotic imbalance that are the primary physiological symptoms of acid stress in fish (Ellis,
1937). Below a pH of 5.0, mortality occurs in some life stages of certain fish species. Although
some fishes can be acclimated to pH levels below 4.0, pH can also affect fish indirectly
through its negative effects on macro-invertebrates that some fishes feed on (Ellis, 1937). More
generally, the primary productivity of fresh water ecosystems is reduced considerably below
pH of 5.0, which in turn reduces the food supply for higher aquatic organisms (Alabaster and

10
Lyod, 1980).
The majority of freshwater fishes and macro-invertebrates experience harmful effects at
one or more life stages at extreme pH levels (Wiebe, 1931; Alabaster and Lyod, 1980). In
salty fishponds, a pH of 9 begins to depress appetite of tilapia (Popma and Lovshin, 1995).
Opiyo and Dadzie (1994) demonstrated that large quantities of phytoplankton ingested by
Orechromis esculentus in L. Kanyaboli, the bulk of the blue green algae passed out of the gut
undigested. The indigestibility of blue green algae in the stomach of O. esculentus was
attributed to the pH of the stomach (4.0- 8.0), which is not acidic enough to lyse the cell walls
of many algae. For L. Kanyaboli, however, whether the level of pH has changed over the years
and how pH may influence the distribution of O. esculentus and O. variabilis in the lake has
not been studied.
2.1.3 Temperature
Temperature exerts a major influence on aquatic organisms (Myrick and Cech, 2005).
In general, high temperature is associated with increased levels of biological activity including
growth rate. The optimal temperature for growth of most tilapiine species is 25- 280C. Feeding
stops at temperature below 200C and reproduction at 22
0C (Wohlfarth and Hulata, 1983).
Generally, extreme temperatures impair growth and increase susceptibility to diseases (Myrick
and Cech, 2001).
In addition, the rate of chemical reactions within water increases as water temperature
increases, resulting in increase in the rate of biological activities (Michuad, 1991). This leads to
increase in oxygen use by organisms such that warm water holds less oxygen, resulting in
oxygen shortage. Spotted tilapia, (Tilapia mariae), a native of west coast of Africa, prefers
temperatures between 25 and 33°C, and can tolerate temperatures of up to 37
°C beyond which
its metabolic rate decreases (Siemien and Stauffer, 1989). According to Maithya (1998), the
temperature range of Lake Kanyaboli waters was between 20.5-33.2oC, which was thought to

11
be conducive for cichlids such as Oreochromis esculentus that was found to be abundant at the
time of this report. However, the current estimate of temperature, how it compares to previous
estimates, and how temperature may influence the distribution of O. esculentus and O.
variabilis in the lake is not known.
2.1.4 Turbidity
Extremely turbid waters can directly affect fish growth and survival by interfering with
gill function (Bash et al., 2001). Turbidity limits fish vision, which may interfere with social
behavior (Berg and Northcote, 1985), foraging, and predator avoidance (Gregory, 1993). High
concentrations of particulate matter can modify light penetration, cause shallow lakes and bays
to fill in faster, and smother benthic habitats, thereby negatively impacting across life history
stages of fish. For example, as particles of silt, clay and other organic materials settle to the
bottom, they can suffocate larvae and fill in spaces between rocks that may alter important fish
microhabitats. Fine particulate material also clogs or damages sensitive gill structures, decrease
resistance of fish to diseases, prevent proper egg and larval development and potentially
interfere with feeding activities (Michuad, 1991).
Indirectly, if light penetration is reduced significantly, both macrophyte and microphyte
growth may decrease to levels that may negatively impact organisms that rely on them for food
and cover. Moreover, at lower trophic levels, adequate amount of light that is conducive for
phytoplankton and thus important for primary production may influence the number of fish that
rely on phytoplankton for food. According to Okemwa (1981), northern part of L. Kanyaboli
had a Secchi depth of 1 m and the southern part of the lake had a Secchi depth of 0.5 m.
Okemwa (1981) found that there were more fish in the northern part of the lake compared to
the southern part of the lake, which may have arisen from differential light penetration and thus
primary productivity across the lake. However, how current estimate of turbidity compares to
previous estimates, and how turbidity may influence the distribution of O .esculentus and O.

12
variabilis in the lake is not yet known.
2.2 Factors that influence size of Oreochromis esculentus and Oreochromis variabilis
Many fish species survive within a certain range of temperature, dissolved oxygen,
pH and turbidity (Muyodi et al., 2011). Factors such as water pollution leads to alteration of
these physicochemical factors hence directly or indirectly affect growth and reproduction of
fish in water (Shiddamallaya and Pratima, 2008). A study by LVEMP (2002) shows that River
Yala which drained into L. Kanyaboli was partly diverted and part of the swamp reclaimed for
rice cultivation, which resulted in a reduction in the size of the lake. In particular, diversion of
the river resulted in a reduction in water level in the lake, which may have altered levels of
physicochemical factors in ways that may impacted fish growth and thus size.
In addition to the influence of abiotic factors on fish in the lake, fishing pressure and
use of illegal fishing gear are thought to have negative effects on fish in the lake. According to
Fryer (1961), previous gillnet mesh size of 10cm introduced in1956 in L. Victoria was to be
used to catch O .esculentus and O .variabilis following unprecedented decrease in fish stocks.
Although the introduction of Lates niloticus and the non-native tilapiines O. niloticus, that
performed better than native species, was meant to reduce fishing pressure on native cichlids,
that was not to be so due to the invasive nature of the introduced species (Ogutu-Ohwayo,
1984). In any case, fishing pressure continued while catch rates decreased in L. Victoria and
surrounding waters. In 2003, it was estimated that there were over 65 fishing boats in L.
Kanyaboli (Abila, 2003). In addition, a majority of fishermen used gillnets of mesh sizes
ranging in size from 2.5cm to 5 cm, which together with the high fishing effort (even if
estimated coarsely from the number of active fishing boats in the lake) is thought to have
caused a rapid decline in the size of fish in the lake (Abila, 2003).
Competition and predation may also limit some species to areas where their
competitors are found. Among the six species of cichlids in L. Kanyaboli (O. esculentus and

13
O. variabilis included) found to have a certain degree of overlap in the diet (Abila et al., 2008),
no species fed exclusively on a single food item. This suggests either that such food items
occurred in high abundance or that there was some level of competition for food in the lake.
Regardless of cause, small size of fish is indicative of the presence of constraining factors. Size
of fish may be changing due to changes in physicochemical factors, food types or any other
pressures, therefore it’s necessary to investigate the real causes of changes in fish size.
However, how the size of Oreochromis esculentus and Oreochromis variabilis in L.Kanyaboli
compares to the sizes of these species as published by the International Union for the
Conservation of Nature is not known.
2.3 Human activities
Fresh water ecosystems throughout the world are threatened by human activities such
as construction of physical barriers including dykes, dams, and flood walls (Combes, 2003).
These activities can lead to changes in aquatic habitats. Barriers have been shown to disrupt
connections between rivers and floodplain habitats, which among other things serve as refugia
and spawning grounds for many aquatic organisms (Combes, 2003).
Dykes are used to control flooding of land behind the dyke in order to protect homesteads
and also to reclaim wetlands for crop cultivation (Ellery, 1994). Some of the effects of dykes
include deterioration of water quality which involve accumulation of pollutants, sediments and
minerals due to low circulation of water in water bodies (Djkema, 1987). Dykes may also lead
to loss of natural habitats for some species as they lead to habitat fragmentation (Combes,
2003).
In L. Kanyaboli, a dyke was constructed by Dominion Farms in 2003 to facilitate land-based
transport between Alego and Yimbo, the two communities on either size of the lake. The dyke
thus divides the lake into two components separated by weir that remains closed throughout.
Consequently, water circulation between the two components of the lake has been constrained.

14
Construction of the dyke was done without carrying out ecological impact assessment
of the dyke on biodiversity in L. Kanyaboli. It would be shocking to find that the adverse
ecological effects of the dyke to the lake ecosystem may out way its benefits to the community.
However, the ecological effects of the dyke have never been evaluated. Phytoplankton species
are an important key aspect of aquatic ecosystems not only because there are important
indicators of habitat health but also because they are the primary producers that support a wide
range of foragers including fish. Consequently, their identity and diversity may highlight the
status of water quality in aquatic ecosystems. In particular, species of phytoplankton are useful
indicators of pollution in aquatic ecosystems. For instance, previous studies have demonstrated
that arrange of phytoplankton species associated with with less polluted water include
Chroocccus turgidus (Witton et al. 2002), Cyclotella ocellata (Kadri,1998), Euglena acus (
Haughey, 1970 ), Kirchnella obese (Frank, 2014), Nitzschia recta (Batniet al. 2015),
Pediastum boryanum (Komarek, 2001), Planktolybya limnetica (Komarek, 2001). In constrast,
The phytoplankton species associated with polluted water are: Aulacoseira schroidera
(Akunga et al. 2014 ), Coelomoron vestitus (Naziriwo, 2011), Monoraphidium sp.(Basci et al.
2015), Navicula sp.( Elisa et al. 2009), Nitzschia sub-acicularis, Nitzschia acicularis,
Nitzschia pale, Nitzschia recta ( Batni et al. 2015 ), Oocystis parva, Pediastrum tetras,
Pediastum boryanum (Komarek, 2001), Trachelomonas armata, and Trachelomonas volvocina
(Komarek, 2015). In L. Kanyaboli, despite the obvious limnological processes including water
turbulence that are likely to have been impacted by the construction of the dyke, research gaps
on the ecological effects of the dyke persist.
2.4 General Biology of Oreochromis esculentus and Oreochromis variabilis
2.4.1Oreochromis esculentus
Oreochromis esculentus is an indigenous tilapiine species in Lake Victoria. It has
somewhat pointed head with body not conspicuously spotted (Graham, 1929). It uses cross

15
flow filtration to extract food items during suspension feeding (Goodrich et al., 2000;
Sanderson et al., 2001). During cross-flow filtration, hydrodynamic forces such as inertial lift
causes particles to remain suspended but become concentrated in the fluid travelling parallel to
filter surface (Brainerd 2000; Sanderson et al., 2001). The particles are then swallowed with
very little accompanying water (Sanderson et al., 2001). It is expected that turbid waters may
negatively affect feeding in this species. The species prefers a somewhat narrow pH range of
between 7.2 and 8.6.With regards to temperature, O. esculentus is able to withstand
temperature of 100C for short periods, but its temperature range is 23-28
oC (Fryer and Iles,
1972).
In terms of size, male total length (TL) measure 35 cm at adult size compared to 30
cm(TL) for females (IUCN, 2015). Both sexes reach sexual maturity when they are about 8.75
cm. Males are more colourful while breeding (exhibit an overall pink red colour). Females
when breeding are tinged pink. Breeding fish are found throughout the year (Graham, 1929),
and distinct spawning areas can be identified in the water such as sandy bottoms in shallow
water. Open waters are the preferred habitat for adults and sexual maturity occurs within six
months after hatching but adult size is reached after 9 to 10 months (Graham, 1929). Adults
school in open waters where they forage for plankton blooms while the young inhabit inshore
waters in areas of dense aquatic vegetation (Fryer and Iles, 1972). Brooding females raise their
young in their mouth for up to two weeks in these macrophyte areas where growth is rapid. In
the wild, O. esculentus forages on plankton and detritus from the muddy bottom (Fryer and
Iles, 1972). The females are mouth-brooders (Fryer and Iles, 1972). Threats faced by O.
esculentus are displacement by introduced fishes, predominantly O. niloticus, intense fishing
pressure, siltation of spawning grounds and pollution from domestic and agricultural effluents
(Abila, 2003).

16
Plate 1: Oreochromis esculentus. Note: Head somewhat pointed, snout with relatively steep
forehead, body not conspicuously spotted.
2.4.2 Oreochromis variabilis
Oreochromis variabilis is an indigenous tilapiine species in Lake Victoria. It is grey-
green in colour and margin of dorsal fin is orange in females and non-breeding males. It
occasionally forms schools. Adults feed predominantly on bottom algae; some of the plankton
organisms that have been found in their stomach are probably those which have settled on the
bottom or were washed shore-wards from open waters but they do not feed directly on
plankton (Trewavas, 1983), and may graze on algae from rocks and aquatic plants (Witte and
Wanink, 1995).The length of males is 26.7 cm (TL) at adult stage whereas that of females is
24.8 cm (TL) (IUCN, 2015). The margin of the dorsal fin is orange in females and non-
breeding males but turns to an intense hue of orange and scarlet in breeding males (Fryer,
1961). The species is most abundant on exposed and sandy shores where there is considerable
water movement and also occurs in the calm waters with aquatic plants such as water lily

17
swamps (Lowe, 2000). The species used to be found at depths ranging from 0-40 m in L.
victoria but most commonly at depths of less than 10 m in L. Victoria (Witte and Wanink,
1995). Young O. variabilis feed on planktonic algae on rocks in shallow waters and may ingest
small copepods (Fryer, 1961). Young are brooded until when they are about 1.5cm in length
(Fryer, 1961). Brooding females have been caught in the rushes and among vegetation near the
edges of the lake and their nests are built on sandy bottoms in shallow waters. Female lays
batches of eggs after which she picks them up and sucks at the male genital tassel to collect
sperms to fertilize eggs (Fryer, 1961). O. variabilis can survive pH range of between 7.2 and
8.6 (Trewavas, 1983). The female broods the eggs in the mouth for 3 weeks before releasing
them in shallow waters (Fryer 1961).Adults are distinguished from immature stages by their
characteristic orange to red dorsal fin lappets (Trewavas, 1983).
Plate 2:Oreochromis variabilis. Note: Although not quite visible on the plate, it has two rows
of scales on cheek. Body colour is grey-green and margin of dorsal fin is orange in females and
non- breeding males.

18
CHAPTER THREE
Materials and methods
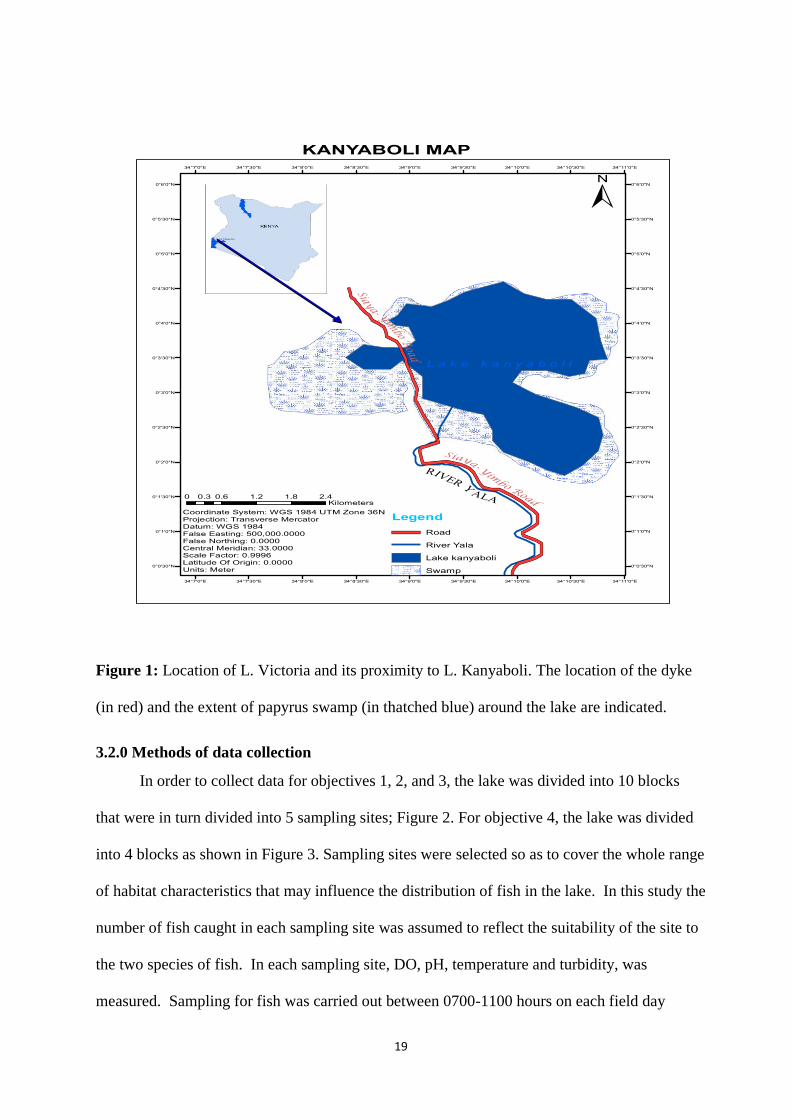
3.1 Study site: Lake Kanyaboli
The study was conducted in Lake Kanyaboli (Figure1), a satellite lake of L. Victoria.
Lake Kanyaboli is located between latitudes 0°1’30’’N- 0
°4’30’’N and longitudes 34
°8’0’’E-
34°4’30’’E. It is a fresh-water lake lying to the northeast of L. Victoria in Kenya. The lake is
about 10.5 km2 in area and has an average depth of 2.5m and a maximum depth of 4.5m
(Crafter et al. 1992). The lake is separated from L. Victoria by a papyrus swamp (the Yala
Swamp). The lake is home to Oreochromis esculentus and Oreochromis variabilis, the two
cichlids that are locally extinct in L. Victoria (Kaufman,1992) and are presently listed as
critically endangered (IUCN, 2015). One species of antelope, Sitatunga (Tragecephalusspekei)
and a wide range of birds live in the papyrus swamp that surrounds the lake. Human activities
around the lake include settlement, cultivation of vegetables, sweet potatoes, and maize. In
addition to these, other land-use types include aquaculture and livestock keeping. In recent
years, habitat restoration primarily involving planting of trees has also been undertaken by the
Lake Victoria Environmental Management Program (LVEMP).
The lake is divided into two components by a dyke running from south to north. The dyke
measuring 6 m width by 2600 m length was constructed by Dominion Farms in 2003. The dyke
therefore divides the lake into eastern waters and western waters. The eastern part is larger
compared to the western part. There is a weir constructed at the northern end to allow water to
flow from east to west; a wire mesh laid over the weir is meant to stop fish moving between the
components of the lake. However, the weir remains permanent closed and so movement of
water between the two components does not occur. Although the lake was previously fed
directly by River Yala, the water entering the lake is currently via a weir since much of the
water is diverted into neighboring commercial rice farm.
19
Figure 1: Location of L. Victoria and its proximity to L. Kanyaboli. The location of the dyke
(in red) and the extent of papyrus swamp (in thatched blue) around the lake are indicated.
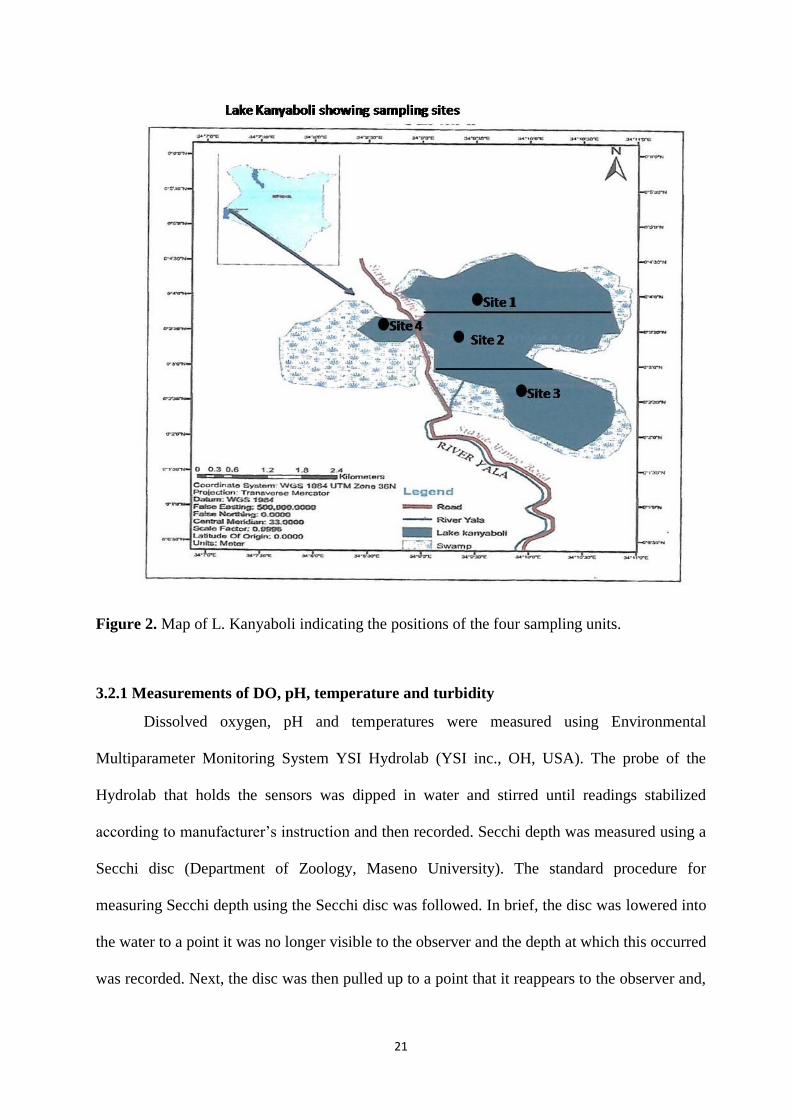
3.2.0 Methods of data collection
In order to collect data for objectives 1, 2, and 3, the lake was divided into 10 blocks
that were in turn divided into 5 sampling sites; Figure 2. For objective 4, the lake was divided
into 4 blocks as shown in Figure 3. Sampling sites were selected so as to cover the whole range
of habitat characteristics that may influence the distribution of fish in the lake. In this study the
number of fish caught in each sampling site was assumed to reflect the suitability of the site to
the two species of fish. In each sampling site, DO, pH, temperature and turbidity, was
measured. Sampling for fish was carried out between 0700-1100 hours on each field day

20
because external factors like wind and time of day are known to influence the physicochemical
characteristics (Tallic 1966).
Figure 2. Map of Lake Kanyaboli showing 10 sampling blocks (black rectangles).
21
Figure 2. Map of L. Kanyaboli indicating the positions of the four sampling units.
3.2.1 Measurements of DO, pH, temperature and turbidity
Dissolved oxygen, pH and temperatures were measured using Environmental
Multiparameter Monitoring System YSI Hydrolab (YSI inc., OH, USA). The probe of the
Hydrolab that holds the sensors was dipped in water and stirred until readings stabilized
according to manufacturer’s instruction and then recorded. Secchi depth was measured using a
Secchi disc (Department of Zoology, Maseno University). The standard procedure for
measuring Secchi depth using the Secchi disc was followed. In brief, the disc was lowered into
the water to a point it was no longer visible to the observer and the depth at which this occurred
was recorded. Next, the disc was then pulled up to a point that it reappears to the observer and,

22
again, the depth at which this occurred was recorded. The average of the two depths, Secchi
depth, was calculated and recorded for each sampling site. Secchi depth is a measure of the
transparency of the water (Secchi depth is thus inversely related to turbidity).
3.2.2 Determining size of fish in Lake Kanyaboli
Fish was caught by beach seine method using a nylon fishing net measuring 40 m by 4
m with mesh size of 2.5 cm (manufactured by Johnflies Fly Factory Ltd. in Kenya). The
number of fish caught per sampling site was recorded. The length and weight of each fish
caught were measured and recorded. Total fish length, measured from tip of mouth to tip of tail
fin, was measured using a 30 cm ruler whereas the weight of fish was measured in grams using
a simple spring balance manufactured by Desco Company, China.
3.2.3 Determining phytoplankton species diversity in Lake Kanyaboli
Phytoplankton species diversity and differences between the two lake components
was estimated from water samples. From Figure 3, sampling unit 4 formed western component
of the lake while sampling units 1, 2 and 3 were merged to represent the eastern component of
the lake. Water samples were collected early in the morning before sun rise using glass vials
measuring 40 cm3 from each sampling site. Each water sample was fixed using Lugol’s
solution and then transported to Kenya Marine and Fisheries Research Institute (KEMFRI) in
Kisumu for laboratory analysis. In the laboratory, 2 ml of water from each sampling unit was
placed in a raft cell and then mounted on alight microscope (Sony model No. 436605, Japan)
and examined at a magnification of ×400. Phytoplankton was classified up to species level
using identification key (Agriculture and Agri- food Canada, 2011).
3.3 Data analysis
Each physicochemical characteristic obtained in the present study was compared to
values obtained in previous studies by Lake Victoria Environmental Management Programme
2002 (LVEMP 2002) and Okemwa 1981 using one sample t- test. In each case, previous

23
estimate was set as the µ.
The one sample t - test was calculated using the formula:
t = X-µ SE
In order to determine the extent to which physicochemical factors predicted the
distribution of the two species, data was separately analyzed, for Oreochromis esculentus and
Oreochromis variabilis, using generalized linear model with temperature, pH, DO and
turbidity as factors and number of fish caught in each block as the response variable. Chi-
square test was used to determine differences in frequency of each species between the two
components of the lake. The Shannon-Weiner diversity index, H, was used to determine
species diversity of phytoplankton in each component of the lake. The index was calculated
using the formula:
𝐻 = − 𝑝𝑖ln𝑝𝑖
𝑛
𝑖−1
where H is the Shannon-Weiner diversity index, pi is the relative abundance of species i.
Values of the H typically range from 1 to 4 such that values close to 1 indicate low diversity
and higher value of H indicates a large number of species with similar abundances (Jost, 2006).
In order to more meaningfully interpret H, it was converted, by finding its exponent, into
effective number of species (Jost, 2006). The one sample t- test was used to compare data on
size of the two fishes against their size in published literature by IUCN. Statistical significance
was evaluated at p≤0.05. All data were analyzed in R version 2.14.1.
24
CHAPTER FOUR
Results and Discussion
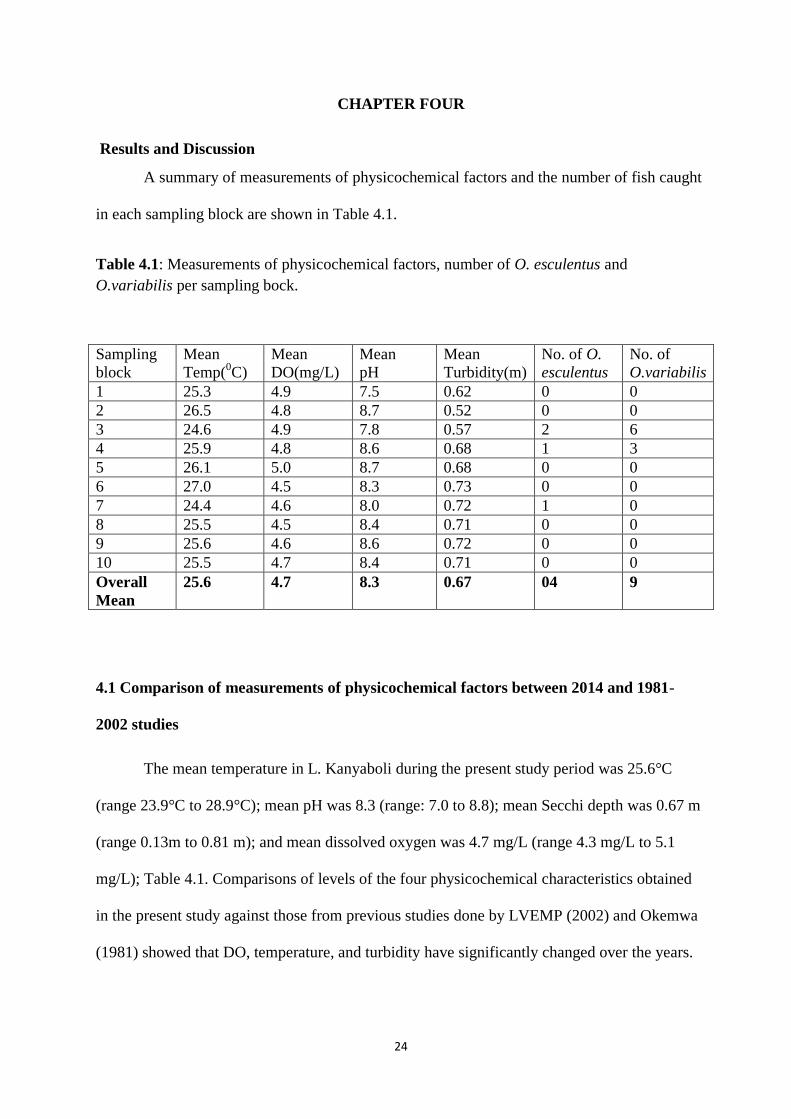
A summary of measurements of physicochemical factors and the number of fish caught
in each sampling block are shown in Table 4.1.
Table 4.1: Measurements of physicochemical factors, number of O. esculentus and
O.variabilis per sampling bock.
Sampling
block
Mean
Temp(0C)
Mean
DO(mg/L)
Mean
pH
Mean
Turbidity(m)
No. of O.
esculentus
No. of
O.variabilis
1 25.3 4.9 7.5 0.62 0 0
2 26.5 4.8 8.7 0.52 0 0
3 24.6 4.9 7.8 0.57 2 6
4 25.9 4.8 8.6 0.68 1 3
5 26.1 5.0 8.7 0.68 0 0
6 27.0 4.5 8.3 0.73 0 0
7 24.4 4.6 8.0 0.72 1 0
8 25.5 4.5 8.4 0.71 0 0
9 25.6 4.6 8.6 0.72 0 0
10 25.5 4.7 8.4 0.71 0 0
Overall
Mean
25.6 4.7 8.3 0.67 04 9
4.1 Comparison of measurements of physicochemical factors between 2014 and 1981-
2002 studies
The mean temperature in L. Kanyaboli during the present study period was 25.6°C
(range 23.9°C to 28.9°C); mean pH was 8.3 (range: 7.0 to 8.8); mean Secchi depth was 0.67 m
(range 0.13m to 0.81 m); and mean dissolved oxygen was 4.7 mg/L (range 4.3 mg/L to 5.1
mg/L); Table 4.1. Comparisons of levels of the four physicochemical characteristics obtained
in the present study against those from previous studies done by LVEMP (2002) and Okemwa
(1981) showed that DO, temperature, and turbidity have significantly changed over the years.

25
More specifically, pH appeared to have increased from 1981 to 2002. In contrast, both DO and
turbidity have declined over the years as shown in Table 4.2.
Table 4.2: Comparisons between present and previous measurements of physicochemical
factors in L. Kanyaboli.
Physicochemical
characteristic
2014
measurements
(n=50)
Year and previous
measurements t-
statistic p-value
Year Mean measure
Dissolved
oxygen (mg/L) 4.7 Okemwa1981 5.4 -25.449 <0.0001
LVEMP2002 6.79 -78.885 <0.0001
pH 8.3
Okemwa1981; 7.7 10.667 <0.0001
LVEMP2002 8.28 0.2026 >0.05
Temperature (°C) 25.6 LVEMP2002 25.8 -9.907 <0.0001
Turbidity (m) 0.67
Okemwa1981 0.75 -5.516 <0.0001
LVEMP2002 0.48 12.647 <0.0001
With regards to pH levels in the lake, high and increasing basicity in the lake may be
attributed to a rise in the rate of photosynthesis by blue green algae possibly as a result of
fertilizer discharge from farms around the lake (Gichuki et al., 2006). Increased fertilizer use in
agricultural farms around the lake, as is the case throughout the African continent where
fertilize use continues to increase (FAO, 2012) will continue to adversely affect quality of
water in L. Kanyaboli.
The low DO in the lake may be attributed partly to papyrus swamps that are
characterized by severe oxygen depletion (Carter, 1955). In addition, the low DO may arise
from blooms of algae associated with increased discharge of effluents into the lake by the local
community; blooms of blue green algae have been associated with depletion of oxygen in

26
aquatic systems (Chapman et al., 1995). Although investigating the direct effects of low DO on
fish in the lake was beyond the scope of the present study, the low and declining levels of DO
in the lake are of great concern because of adverse physiological functions associated with low
levels of DO. In particular, fish experience slow rates of growth, increased susceptibility to
disease under low DO (Torn, 1998).
Measurements of temperature showed that temperature declined since 2002. Although the
decline in temperature was found to be significant, it is important to note that the analysis was
based on comparison with only one previous estimate, (LVEMP, 2002), and so the comparison
must be interpreted with caution. A potential source of the difference between present and
previous measurement of temperature is difference in sampling times between studies. In the
present case, the current study was conducted during the months of April to July whereas the
previous study was done in the months of January and March. Between months of May and
July there is normally heavy rains hence streams of water are released in to the lake, which
often causes high water circulation that affect, among other things, physicochemical factors of
the lake. Between months of January and March normally there is drought accompanied by
very little rain, which is associated with low run off into the lake and thus low rate of water
circulation in the lake. Reduction in temperature may be caused by high cover of water surface
by papyrus swamp and adequate wind blowing over open water surface to cause upwelling.
Nonetheless, it was noted that the present range of temperature has shifted to the lower range
of the optimal range, 29oC to 31
oC, for growth of tilapia (Teichert-Coddington et al., 1997).
However, O. niloticus a closely related species has been reported to tolerate temperatures as
low as between 110C and 13
0 C (Chervinski, 1976), hence the decrease in temperature might
have not affected the fish significantly. The temperature range of both O. escullentus and O.
variabilis is 250C – 28
0C.
4.2 Influence of physicochemical factors on the distribution of O. variabilis and O.
esculentus
Turbidity predicted the distribution of O. variabilis such that abundance of this species

27
increased with increase in Secchi depth (z = 2.000, p< 0.045); Table 4.3 and Appendix I. In
contrast, temperature, DO, and pH did not significantly predict the distribution of O. variabilis
in L. Kanyaboli, Table 4.3. Turbid waters can directly affect fish growth and survival by
interfering with gill function (Bash et al., 2001). Turbidity also limits fish vision, which may
interfere with social behavior (Berg and Northcote, 1985), foraging, and predator avoidance
(Gregory, 1993). Fine particulate matter also clog or damage gill structures, decrease their
resistance to diseases, prevent proper egg and larval development and potentially interfere with
feeding activities (Michuad, 1991). If light penetration is reduced significantly, macrophyte
growth may decrease to levels that may negatively impact organisms that rely on them for food
and cover. These effects of turbidity on fish may explain why distribution of O. variabilis is
influenced by turbidity such that fish preferred areas with high light penetration.
Table 4.3: Influence of physicochemical factors on distribution of O. variabilis in L.
Kanyaboli
Variable Estimate Std Error Z-value P-value
Temperature(0C) -0.2437 0.9747 -0.2500 0.8026
DO (mg/L) 2.6078 3.2265 0.8080 0.4189
pH -0.5981 1.5688 -0.3810 0.7030
Turbidity (m) 16.6632 8.3306 2.0000 0.0455
None of the four physicochemical factors predicted the distribution of O. esculentus,
Table 4.4; Appendix II. Although the results suggest that the variation (after accounting for the
effect of month on sampling) in the four physicochemical factors in the lake was not
substantial to influence the distribution of O. esculentus, it must be pointed out that the number
of this species that were caught was so low. The low catch success for this species may

28
account for the fact that none of the four physicochemical factors significantly predicted the
distribution of this species. The role of small sample size in influencing the foregoing results is
supported by the fact that one of the physicochemical factors, turbidity, predicted the
distribution of the closely related O. variabilis as discussed earlier. More O. variabilis than O.
esculentus were caught during the present study. Perhaps the four physicochemical did not
affect the distribution of Oreochromis escullentus because their range is still within the
tolerable range (Trewavas, 1983).
Table 4.4: Influence of physicochemical factors on distribution of O. esculentus in L.
Kanyaboli.
Variable Estimate Std Error Z-value P-value
Temperature(0C) -1.3434 1.1456 -1.1730 0.2410
DO ( mg/L) 2.3511 3.6423 0.6460 0.5190
pH 0.7578 1.8520 0.4090 0.6820
Turbidity (m) -1.7172 3.8681 -1.4440 0.6570
4.3 Comparison of size of O .esculentus and O. variabilis in L. Kanyaboli against size
published by IUCN
The mean total length of O.esculentus obtained in the present study was 16.5 cm
(range: 12.0 to 21.8 cm) n = 30 whereas the mean weight was 79.2 g (range: 23.4 to 170.8 g) n
= 30. The mean length of O. esculentus in L. Kanyaboli was significantly shorter than the
length of this species published by IUCN (t=-19.564, p < 0.0001).Results of the present study
on the length of the two species compared to their length as published by IUCN (2015) show
that the lengths of O. esculentus have decreased. This is consistent with findings of (LVEMP,
2002; Okemwa 1981). None of the four physicochemical factors predicted the distribution of
O. esculentus.

29
For O. variabilis, the mean total length was 14.1 cm (range: 11.5 to 17.1 cm, n= 38)
and the mean weight was 44.0 g (range: 25.0 to 71.5 g, n = 38). It was found that O. variabilis
in L. Kanyaboli is significantly shorter compared to length of the species published by IUCN (t
= -45.960, p<0.0001).
The findings of the present study must be interpreted in a broader context. For instance,
the findings of LVEMP (2002) showed that there were no O .variabilis in L. Kanyaboli
suggesting that the species was depleted from the lake. According to the Fisheries Manager at
Dominion Farms, the Dominion Farms Limited introduced 500,000 fingerlings of O. variabilis
into L. Kanyaboli in 2011. The reintroduction could account for the presence of O. variabilis
during the present study as opposed to 1981 and 2002, which further underscores the
magnitude of threat it faces in the lake.
The small size of the two species in the lake may be due to widespread use of fishing
nets with small mesh size and increased number of fishing boats. Between 2003 and 2014,
there has been 46% increase in the number of active fishing boats in the lake; from 65 boats in
2003 (Abila, 2003) to 95 boats in 2014. Although the number of fishing boats per se is not a
direct indicator of the intensity of fishing pressure, it can be argued that it indirectly does so. In
other words, the small size of fish in the lake may be attributed to high fishing pressure. The
mesh size used in 2003 averaged 4.0 cm but has declined to 2.5 cm in 2014. The result of both
high intensity of fishing and the use of fishing nets with extremely small mesh size is that small
sized fish including those that have not yet reached age and size of reproductive maturity are
removed from the population.
The small size of fish in L. Kanyaboli as shown in Appendix III may also be as a result
of changes in physicochemical characteristics including those that affect water quality, which
ultimately retard the growth of fish in the lake. For instance, Myrick and Cech (2001) found

30
that changes in physicochemical characteristics in aquatic environment affects growth of fish.
Alternatively, an argument can be made that the small sizes of fish that were caught could be
attributed to an over-representation of immature fish in the fish that were caught through
systematic sampling as well as those purchased from local fishermen. However, this argument
is not supported by the experiences of the local fishermen.
4.4 Effect of the dyke on phytoplankton species diversity
The result shows that the western component of L. Kanyaboli has higher phytoplankton
species diversity (H = 3.033) compared to eastern component (H = 1.281), Table 4.5 and Table
4.6 in the appendix. When the diversity index in each component was translated to effective
species number (Jost, 2006), the results indicated that the eastern part of the lake had 4 equally
abundant species compared to the western part that had 21 equally abundant species.
The results indicate that out of the 21 species of phytoplankton compared between the
two components of the lake, 60% (13 out of 21) were more abundant in the larger eastern
component. Perhaps more interesting is the fact that all of the 12 species that occurred at higher
abundance in the eastern component than in the western component are associated with
polluted waters; Table 4.7. In contrast, all species that occurred in greater abundance in the
western component than in the eastern component of the lake are associated with less polluted
waters, Table 4.7.The table shows that phytoplankton species that thrive in polluted water are
the ones found in eastern component of the lake, suggesting that eastern waters of the lake is
polluted. The phytoplankton species found in western component of the lake are associated
with less polluted water, indicating that western water of the lake is less polluted. The result is
that as a result of dyke construction the two components of the lake experience different
pollution levels.

31
Table 4.7 Phytoplankton species frequency distribution in the two components of L.
Kanyaboli
Name of species Eastern
Component
Western
Component
Chi-square
statistic
P- value High
Abundance
in Eastern
Component
Thrives
in
polluted
water
Aulacoseira
schroidera
5733276 66666 5536342.0 < 0.05 Yes Yes
Chroocccus turgidus 1133322 13049869 10012140.7 < 0.05 No No
Coelomoron vestitus 1866648 1133322 179257.4 <0.05 Yes Yes
Cyclotella ocellata 199998 399996 66666.0 < 0. 05 No No
Euglena acus 199998 633327 225331.1 < 0. 05 No No
Kirchnella obese 99999 533328 296488.2 < 0. 05 No No
Monoraphidium sp. 999990 583327 109648.3 < 0. 05 Yes Yes
Navicula sp. 1499985 322219 761239.0 < 0. 05 Yes Yes
Nitzschia sub-
acicularis
899991 49999 760520.0 < 0. 05 Yes Yes
Nitzschia acicularis 399996 33333 310253.3 < 0. 05 Yes Yes
Nitzschia palea 2099979 1155544 273982.8 < 0. 05 Yes Yes
Nitzschia recta 399996 4566621 3495487.4 < 0. 05 No No
Oocystis parva 1599984 566661 492815.6 < 0. 05 Yes Yes
Pediastrum tetras 2099979 33333 2002063.3 < 0. 05 Yes Yes
Pediastum boryanum 566661 799992 39837.0 < 0. 05 No No
Planktolybya
limnetica
866658 899991 629.0 < 0. 05 No No
Planktolybya talingi 1766649 166665 1324124.7 < 0. 05 Yes Yes
Romeria elegans 99999 222220 60888.3 < 0. 05 No No

32
Synedra cunningtonii 1433319 316663 712532.8 < 0. 05 Yes Yes
Trachelomonas
armata
599994 133332 296966.7 < 0. 05 Yes Yes
Trachelomonas
volvocina
4766619 899991 2638404.9 < 0. 05 Yes Yes
Highly abundant phytoplankton species in the eastern component are associated with polluted
waters in contrast to those abundant in the western component of the lake.
Major changes in phytoplankton assemblages have long been associated with
increasing pollution of aquatic ecosystems. In L. Victoria, an increase in certain species of
blue-green algae was attributed to increased discharge of effluents into the lake (Hecky et al.,
1993). In other words, different phytoplankton species, including toxic ones, prefer specific
ranges of nutrient ratios such that shifts in nutrient ratios result in changes in the relative
abundance of phytoplankton sometimes with catastrophic effects in aquatic ecosystems
(reviewed in Anderson et al., 2002). The major sources of nutrients in aquatic ecosystems
include runoffs from farms and industries as well as discharges from sewage treatment plants.
Increasing use of agrochemicals such as fertilizers throughout Africa (FAO, 2012; Anderson et
al., 2002) including farms around L. Kanyaboli is expected to result in shifts in nutrient ratios
and thus phytoplankton communities in ways that may have serious biodiversity consequences.
The eastern component of L. Kanyaboli is more exposed to pollutants from agricultural farms
than the western component. As mentioned earlier, the mostly closed weir that separately the
two components of the lake may exacerbate the effect of pollutants between the two
components of the lake.

34
CHAPTER FIVE
Summary, conclusions, and recommendations
5.1 Summary
Four major findings arose from the current study. First, the study found that the quality of
water in the lake has deteriorated. In particular, the amount of dissolved oxygen, temperature,
and turbidity decreased whereas measurement of pH suggests that the water is becoming more
basic. Second, of the four physicochemical factors studied, only turbidity influenced the
distribution of Oreochromis variabilis. In contrast, none of the four physicochemical factors
influenced the distribution of O. esculentus. Third, the two species of fish studied in the present
study were found to be smaller in size compared to their respective sizes as published by the
IUCN. Fourth, results on phytoplankton species diversity suggest that the dyke, which divides
the lake into two has resulted in differences in phytoplankton species diversity. Although the
eastern component of the lake had a lower species diversity of phytoplankton, species that were
abundant in this component of the lake have been found to be associated with polluted water
compared to species that were abundant on the western component of the lake.
5.2 Conclusion
1. Declining water quality in L. Kanyaboli is likely a result of the dyke that was constructed in
2003 by the Dominion Farms Limited.
2. Although results from the present study suggest that water quality in the lake is
deteriorating, the fact that only turbidity influenced the distribution of one of the two study
species, O. varibilis, suggests that the physicochemical factors are still within the respective
ranges preferred by the two species of fish.
3 .The small size of both species of fish, O. variabilis and O. esculentus is evidence that there
is pressure that either limits growth rate of the fish or removes fish at a relatively small size.
35
With regards to pressures that might limit growth rate of fish, the study contends that the
changes in physicochemical factors, in particular turbidity, in the lake may be involved in
determining size of fish. As for preferential off-take, observed and documented evidence
suggest that the level of fishing pressure and use of fishing nets with extremely smaller mesh
size are the main potential causes.
4. Differences in phytoplankton diversity between the eastern and western components of the
lake may derive from changes in limnological processes following the construction of the
dyke.
5.3 Recommendations
5.3.1 Recommendations from present study
1. In order to address the issue of deteriorating water quality in the lake, it is recommended that
responsible local, regional, and national agencies including the Kenya Fisheries and Marine
Research Institute identify the sources of pollution so as to put in place measures to mitigate
their influence on biodiversity in the lake.
2. Local, regional, and national agencies must address the issue of small size of fish in the lake.
In particular, concerned agencies must regulate fishing in the lake so as to limit fishing
pressure and discourage the use of fishing nets with small mesh sizes.
3. To the extent that differences in phytoplankton species diversity may have arisen from
differences in limnological processes between the two components of the lake, it is
recommended that water flow between the components be increased. Secondly, changes in key
limnological processes that may derive from the diversion of River Yala to the nearby
commercial rice farm be regulated to increase water flow into the lake.

36
5.3.2 Recommendations for future studies
1. It is recommended that monitoring of physicochemical factors be regularized. Routine
monitoring will require the engagement of concerned agencies such as the Kenya Marine and
Fisheries Research Institute. In addition, future research should focus on the causes of changes
in physicochemical factors in the lake.
2. Longitudinal research is needed to fine-tune the extent to which key trophic levels may be
influenced by changes in physicochemical factors in the lake.
3. Experiments to more specifically investigate the effects of fishing pressure and
physicochemical factors on the size of fish in the lake. For instance, use of cages in the lake
such that fish in cages are not subject to the same fishing pressure yet exposed to the same
physicochemical factors may decouple the effects of fishing pressure and physicochemical
factors on size of fish in the lake.
4. Expand on the preliminary findings on diversity of phytoplankton species in the lake. A
potential next step would be to investigate how differences in phytoplankton diversity impact
organisms that forage on them.

37
REFERENCES
Abila, R. 2003. A socio-economic study of the Yala Swamp fisheries. Paper presented at
ECOTOOLS Scientific Workshop on Yala Swamp. Switel Hotel, Bondo, Kenya 9th
10th
Dec. 2003.
Abila, R. 2005. Biodiversity and Sustainable Management of a Tropical Wetland Ecosystem:
Acase Study of Lake Kanyaboli,Department of Zoology Maseno University Kenya.
Abila, R., Salburger, W., Engelken, J., Ndonga, M., Owiti, D.O., Barluenga, M., and Meyer, A.
2008. The Role of the Yala Swamp lakes in the conservation of Lake Victoria region
haplochromine cichlids: evidence from genetic and tropic ecology studies. Lakes
Reservoirs: Res. Manage., 13:95-104.
Akunga, G., Migiro, E. 2014. Effects of selected water quality parameters on
phytoplankton abundance and diversity in River Chepkoilel, Eldoret, Kenya.
International Journal of Advance Research (2014) Volume 2, Issue 3, 863- 871.
Alabaster, J.S., and Lyod, R. 1980. Water quality criteria for freshwater fish. European Inland
Fisheries Advisory Commission Report (FAO). Buttersworth, London-Boston 297pp.
Aloo, P. A. 2003. Biological diversity of the Yala Swamp lakes, with special emphasis on fish
species composition, in relation to changes in the Lake Victoria Basin (Kenya). Threats
and conservation measures. Biodiversity Conservation 12, 905-920.
Anderson, D.M., Glibert, P.M., and Burkholder, J.M. 2002. Harmful algal blooms and
eutrophication: nutrient sources, composition, an consequences. Estuaries 25, 704-726.
Angienda, P., Lee, H.J., Kathryn, R., Elmer, Abila, R., Waindi, E.N., and Meyer, A. 2011.
Genetic structure and gene flow in an endangered native tilapia fish (Oreochromisesculentus)
compared to Nile tilapia (Oreochromisniloticus) in Yala swamp, East Africa.
Conservation Genetics 12, 243-255.
38
Bacsi, Z., Novak, M., Janoszky, V., Beres, B., Grigorszky, S., and Nagy, A. 2015. The
Sensitivity of two Monoraphidium species to Zinc: their possible future role in
bioremediation. International Journal of Environmental Science and Technology (2015)
12: 2455- 2466.
Balirwa, J.S., Chapman, C.A., Chapman, L.J., Cowx, I.G., Heheb, K., Kaufman, L., Lowe
McConnel, R.H., Seehausen, O., Wanink, J.H., Welcomme, R.L., and Witte, F. 2003.
Biodiversity and fishery sustainability in the Lake Victoria basin. Bioscience 42,703-
710.
Bash, J.C., Berman, G., and Bolton, S. 2001. Effects of turbidity and suspended solids on
Salmonids. Centre for Streamside Studies, University of Washington. November 2001.
74pp.
Batni, A., Karthinck, B., Jonathan, C., and Paul, B. 2015. Two new Species of Nitzschia from
fresh water environs. Nature 63: 29- 36.
Berg, L., and Northcote, T.G. 1985. Changes in territorial, gill-flaring, and feeding behavior in
juvenile Coho salmon following short-term pulses of suspended sediment. Canadian
Journal of Fisheries and Aquatic Sciences 42, 1410-1417.
Braeton, P. and Guy, C.S. 1999. The relations between physicochemical factors and abundance
of fish in tributary confluences of lower MISSOURI river- U.S.A.
http://afs.allenpress.com/perser . Accessed on 7/07/2015.
Brainerd, E.L. 2000. Caught in the cross flow. Nature 412, 387-388.
Carter, G.S. 1955. The papyrus swamps of Uganda. Heffer and Sons, Cambridge, England.
Chapman, L. J., Kaufman, L. S., Chapman, C. A., and Ellis, F.M. 1995. Hypoxia tolerance in
twelve species of East African cichlids: Potential low oxygen refugia in Lake Victoria.
Conservation Biology 9, 1274-1287.

39
Chervinski, J. 1976. The effect of exposure to low temperature on fingerlings of local tilapia
(Tilapia Aurelia) (Steindachner) and imported tilapia (Tilapia vulcani) (Trewavas) and
Tilapia nilotica (Linne) in Israel. Bamidgeh 28: 25-29.
Chervinski, J. 1982. Environmental physiology of tilapia. Pp.119-125. In: R.S.V. Pullin, and
R.H. Lowe-McConnel, (Eds.). Biology and Culture of Tilapia. International Centre for
Living Aquatic Resources Management. Conference Proceedings 7,Manila, Phillipines.
Combes, S. 2003. Protecting freshwater ecosystem in the face of global climate
change.University of Washington, Department of Biology.
Crafter, S.A., Njuguna, S.G. and Horward, G.W. 1992. Wetlands of Kenya. In: Proceedings of
the KWWG seminar on wetlands of Kenya. National Museum of Kenya. Nairobi,
Kenya. 3-5 July 1991. IUCN.
Dijkema, K.S. 1987. Changes in Salt- marsh area in Netherlands Wadden Sea: Vegetation
between land and sea. A.H.L. Huiskes et al., eds. Amsterdam: Dr. W. Junk Publishers.
Elisa, F., Saul, B., Francesca, B., Joan, G. 2009. Taxonomy, morphology and distribution of
the Sellaphorastroemii complex. Fottea 9 (2): 243- 256.
Ellery, W.N. 1994. Principles for the sustainable utililization of the Okavango Delter
ecosystem, Botswana. Biological Conservation 70: 159-168.
Ellis, M.M. 1937. Detection and measurement of stream pollution. United States Bureau of
Fisheries 22, 365-437.
Food and Agriculture Organization of the United Nations. 2002. The state of World Fisheries
and Aquaculture 2002 Rome: FAO Fisheries Department.
Food and Agriculture Organization of the United Nations.2012. Current fertilizer trends and
outlook to 2016. http//www.fao.org/worldfoodsituation/FoodPrices/Index/en

40
Frank, M. 2014. Phytoplankton Community, Functional Classification and Trophic state
Indices of Yadik and Dam Lake (Amasya). Environmental Science 2014, 8 (24), 133-
141.
Fryer, G. 1961. Observations on the biology of the cichlid Oreochromis variabilisBoulenger in
the northern waters of Lake Victoria (East Africa). Review Zoology, Botany Africa 64,
1-33.
Fryer, G. 1972. The Cichlid fishes of the Great Lakes of Africa, their Biology and
Evolution. Edinburg, Oliver and Boyd 641pp.
Gichuki, J., Maithya, J., and Masai, D.J. 2006. Recent ecological changes in Lake Sare,
western Kenya. A report to Kenya Marine and Fisheries Research Institute.
Goodrich, J.S., Sanderson, S.L., Batjakas, I.E., and Kaufman, L.S. 2000. Branchial arches of
suspension-feeding Oreochromisesculentus sieve or sticky filter. Fish Biology 56, 858
875.
Graham, M., 1929. The Victoria Nyanza and its fisheries. A report on the fish survey of Lake
Victoria 1927-28. Crown Agents for the Colonies, London. 225p.
Gregory, R.S. 1993. Effect of turbidity on the predator avoidance-behavior of juvenile Chinook
Salmon. Canadian Journal of Fisheries and Aquatic Sciences 50, 241-246.
Harvey, A., and Hecky, R. E. 1993. Conservation of African Great Lakes: Conservation
Biology 7, 644-656.
Hassan, R., Scholes, R. 2006. Environmental Impact Assessment of the Bor Counties’ Dyke
Rehabilitation Project, South Sudan: Intergrated Assessment Report.
Haughey, A. 1970. Notes on Euglena acus from Sewage treatment ponds. British Phycology
Journal 5 (1) 97- 102.

41
Hecky, R. E. 1993. The eutrophication of Lake Victoria. Limnology 25: 39-48.
Hecky, R. E., Campbell, R., and Hendzel, L.L. 1993. The stoichiometry of carbon, nitrogen,
and phosphorus in particulate matter of lakes and oceans. American Society of
Limnology and Oceanography 38,709-724.
Ikuta, K. 1995. Effects of low pH exposure of adult salmonids on gametogenesis and embryo
development. Water, Air and Soil Pollution 85, 327-332.
IUCN Red List of Threatened Species. Version 2015.1. www.iucnredlist.org. Downloaded on
10 April 2015. Accessed:10- 4 - 2015.
Jost, L. 2006. Entropy and Diversity. Oikos 113, 363-375.
Kaufman, L.S. 1992. Catastrophic change in species-rich fresh water ecosystems: the lessons
of Lake Victoria. Bioscience 42, 846-858.
Kadri, A. 1998. Diatoms in the phytoplankton of Kebor Reservoir and their seasonal
variation.Tr. J. of Botany 22 (1998) 25- 33.
Komarek, J. 2001. Review of the Green Algal Genus Pediastrum; Implication for Pollen-
analytical Research. Bibliotheca Phycologica. Cramer J. Berlin- Struttgart, pp. 108.
Lake Victoria Environmental Management Programme, 2002. Fish Biology and Biodiversity
Subcomponent. Report of the Regional sampling of Satellite Lakes. Kanyaboli,
(Kenya), Nabugabo,(Uganda), Ikimba, (Tanzania). A report to Kenya Marine and
Fisheries Research Institute.
Lockwood, J.L. 1999. Using taxonomy to predict success and introduced avifauna: Relative
Importance of Transport and Establishment. Conservation Biology 13, 560-567.
Loiselle, P.V. 1996. ‘Fulu’ of Yala Swamp-part 1: Overview of the fishes. Cichlid News 5, 11 18.
Lowe, R.H. 2000. The roles of tilapia in ecosystem. In: Beveridge MCM, Andrews B.J. (Eds.)

42
Tilapias: biology and exploitation. Kluwer Press, Dordrecht, pp 129-162.
Lung’ayia, H.B.O., M’Harzi, A., Tackx, M., Gichuki, J., and Symeons, J.J. 2000.
Phytoplankton community structure and environment in the Kenyan waters of Lake
Victoria. Freshwater Biology 43: 529-543.
Maithya, J. 1998. A survey of the Itchthyofauna of L. Kanyaboli and other small water bodies
in Kenya: Alternative refugia for endangered fish species NAGA. ICLAM. Quarterly
Jan-March, pp54-56.
Mhlanga, L., Day, J., Cronberg, C., and Chimbari M. 2006. Observations on limnological
conditions associated with a fish kill of Oreochromisniloticus in Lake Chivero
following collapse of an algal bloom. African Journal of Ecology 44, 199- 208.
Michuad, J.P. 1991. A citizen’s guide to understanding and monitoring lakes and streams.
Publication #94-149. Washington State Department of Ecology, Publications Office,
Olympia, Washington, U.S.A. 407-7472. Moore, M.L. 1989.
Mullya, J. 2007. The effects of dissolved oxygen on fish growth in aquaculture: Ministry of
Natural Resources and Tourism, Tanzania. Fisheries Training programme, 30pp.
Mulongaibalu, M., Jean, J.M.B., Muderhwa, N., and Mujungu, E.K. 2014. Assessment of
physicochemical parameters in relation with fish ecology in Ishasha River and Lake
Edward, East Africa. International Journal of Current Microbiology and Applied
Sciences 3, 230-244.
Muyodi, F., Mwanuzi, L., and Kapiyo, R. 2011. Environmental quality and fish communities
in selected catchments of Lake Victoria. The Open Engineering Journal 4, 54-65.
Mwanja, W.W., Armoudlian, A.S., Wandera, S.B., Kaufman, L., Booton, G.C., and Fuerst,
P.A. 2000. The bounty of minor lakes: The role of small water bodies in evolution and
conservation of fishes in the Lake Victoria region, East Africa. Hydrobiologia 458, 55-
43
62.
Myrick, C.A., and Cech, J. J. 2001. Temperature Effects on Chinook salmon and Steelhead: a
review focusing on California’s Central Valley Populations. Bay-Delta Modeling
Forum. Technical Publication 01-1. 57pp.
Myrick, C.A., and Cech, J.J. 2005. Effect of temperature on the growth, food consumption and
thermal tolerance of age- 0 Nimbus-strain steelhead. North American Journal of
Aquaculture 67, 324-330.
Naziriwo, B. 2011. Dynamic movements of Heavy Metals in Aquatic Environment and their
Influence on Phytoplankton production in the Water of Lake Victoria. Thesis submitted
in fulfillment for the award of Doctor of Philosophy Degree in Environmental
Chemistry of the University of Nairobi.
Odhiambo, W., Gichuki, J. 2000. Seasonal dynamics of the phytoplankton community in
relation to environment in Lake Baringo, Kenya. Hydrobiology of Fish 9: 1- 17.
Ochumba, P. B. O. 1990. Massive fish kills within the Nyanza Gulf of Lake Victoria, Kenya.
Hydrobiologia 208, 95-99.
Ogutu-Ohwayo, R. 1990. The decline of native fish of Lake Victoria and Kyoga (East Africa)
and the impact of introduced species, especially the Nile perch, Latesniloticus and the
Nile tilapia, Oreochromisniloticus. Environmental Biology of Fishes 27, 81-96.
Okemwa, E.N. 1981. A preliminary Survey of the Fishes and Limnology of Lake Kanyaboli
and Lake Sare in Western Kenya. Proceedings of the Workshop of the Kenya Marine
and Fisheries Research on ‘Aquatic Resources of Kenya. pp. 192- 211.
Opiyo, S.V., and Dadzie, S. 1994. Diet and food utilization in Lake Kanyaboli, Kenya.
Fisheries Management Ecology1, 79-90.

44
Popma, J. T., and Lovshin, L. 1995. Worldwide prospects for commercial production of tilapia.
Alabama 36849, 42pp.
Pringle, R.M. 2005. The origins of the Nile Perch in Lake Victoria. Bioscience55, 780-788.
R Development Core Team. 2011. R: a language and environment for statistical computing.
R Foundation for statistical computing, Vienna, Austria.
Roberts, C.M. 2003. Application of ecological criteria in selecting marine reserves and
developing reserve networks. Ecological Applications 13:S215-S228.
Sala, O.E.F.S., Chapin, J.J., Armesto, E., Berlow, J., Bloomfield, E., Huber-sanwald, L.F.,
Huenneke, R.B., Jackson, A., Kinzig, R., Leemans, D.M., Lodge, H.A., Mooney, M.,
Oesterheld, N.L., Poff, M.T., Sykes, B.H., Walker, M., and Wall, D.H. 2000.
Biodiversity: Global biodiversity scenarios for the year 2000. Science 287, 1770-1774.
Sanderson, S.L., Cheer, A.Y., Goodrich, J.S., Graziano, J.D., andCallan, W.T. 2001. Cross
flow filtration in suspension-feeding fishes. Nature 412, 439-441.
Schofield, P.J. 1999. Interactions between Nile perch, Latesniloticus, and other fishes in Lake
Nabugabo, Uganda. Environmental Biology of Fishes 55, 343-358.
Schofield, P.J. 2011. Latesniloticus. USGS Nonindigenous aquatic species database,
Gainesville, F.L.http ://nas.er.Usgs.gov/queries/FactSheetospx? Species D-412.
Downloaded on 10 August 2014.
Shiddamallayya, N., Pratima M. 2008. Impact of domestic on fresh water body. Environmental
Biology 29:303-308.
Siemien, M.J., and Stauffer, J. 1989. Temperature preference and tolerance of the Spotted
tilapia and Rio grande cichlids. Archiv fur Hydrobiologia 115, 287-303.
45
Talling, J.F. 1966. The annual cycle of stratification and phytoplankton growth in Lake
Victoria, East Africa. Hydrobiologia 51, 545-621.
Teichert-Coddington, D.R., Popma, T.J., and Lovshin, L.L. 1997. Attributes of tropical pond-
cultured fish, pp 183-198. In:Enga H.S. and Boyd, C.E. (Eds.) Dynamics of Pond
Aquaculture. CRC press, Boca Raton, Florida USA.
Torn, L. 1998. Nutritional and feeding of fish. Kluwer Academic Publishers.2nd
ed. Boston,
USA, 267pp.
Trewavas, E. 1983. Tilapiine fishes of the genera Sarotherodon, Oreochromis . Danakilia,
British Museum of Natural History: London.
Twongo, T. 1995. Impact of fish species introductions on the tilapias of Lake Victoria and
Kyoga. In: Pitcher T.J. Hart P.J.B. The impact of species changes in African lakes.
Chapman and Hall, Londson, pp 47-57.
United States Environmental Protection Agency (USEPA), 2008. Invasive species. Available at
http://www.epa.gov/owow/invasivespecies . Modified: 03-20-2008. Accessed: 07-24
2014.
United States Environmental Protection Agency (USEPA), 2013. Impacts of climate change on
the occurrence of Harmful Algal Blooms. Available at
https://www.epa.gov/climatehabs. Accessed: 09-02-2016.
Venkatesharaju, K., Ravikumar, P., Samashekar,K.R., Prakash, K. L. 2010. Physicochemical
and bacteriological investigation on the River Calvery of Kollegal stretch in
Kaarnataka. Kathmandu University Journal of Science, Engineering and Technology 6,
1, 50 – 59.
Wiebe, A.H. 1931. Note on the exposure of several species to sudden changes in PH. 50, 380-383.

46
Witte, F., and Wanink, J.H. 1995. Fish stocks and fisheries of Lake Victoria. Samara
Publishing Cardigan, UK, pp. 301-320.
Witton, B.A. 2011. Fresh water algal flora of the British Isles. An Identification guide to
Freshwater and Terrestrial algae pp. 31-158. Cambridge: Cambridge University press.
Wohlfarth, G.W., and Hulata, G. 1983. Applied Genetics of Tilapia, ICLARM Studies and
Review 6; Manila, Philippines. 26pp.

47
APPENDICES
APPENDIX I
> Model=lmer(no_var~temp+do+ph+secci depth+(1|month),family=poisson)
>summary(Model)
Generalized linear mixed model fit by the Laplace approximation
Formula: no_var ~ temp + do + ph + secci depth + (1 | month)
AIC BIClogLik deviance
37.63 49.1 -12.81 25.63
Random effects:
Groups Name Variance Std.Dev.
month (Intercept) 2.811 1.6766
Number of obs: 50, groups: month, 5
Fixed effects:
Estimate Std. Error z value Pr(>|z|)
(Intercept) -15.8181 33.2980 -0.475 0.6348
temp -0.2437 0.9747 -0.250 0.8026
do 2.6078 3.2265 0.808 0.4189
ph -0.5981 1.5688 -0.381 0.7030
secci depth 16.6632 8.3306 2.000 0.0455 *
---
Signif. codes: 0 ‘***’ 0.001 ‘**’ 0.01 ‘*’ 0.05 ‘.’ 0.1 ‘ ’ 1
Correlation of Fixed Effects:
(Intr) temp do ph
temp -0.787

48
do -0.776 0.528
ph 0.058 -0.540 -0.256
secci depth -0.436 0.053 0.106 0.436

49
APPENDIX II
>Model=lmer(no_esc~temp+do+ph+secci depth+(1|month),family=poisson)
>summary(model)
Generalized linear mixed model fit by the Laplace approximation
Formula: no_esc ~ temp + do + ph + secci depth + (1 | month)
AIC BIC logLik deviance
27.92 39.39 -7.959 15.92
Random effects:
Groups Name Variance Std.Dev.
month (Intercept) 0 0
Number of obs: 50, groups: month, 5
Fixed effects:
Estimate Std. Error z value Pr(>|z|)
(Intercept) 15.0521 22.9318 0.656 0.512
temp -1.3434 1.1456 -1.173 0.241
do 2.3511 3.6423 0.646 0.519
ph 0.7578 1.8520 0.409 0.682
secci depth -1.7172 3.8681 -0.444 0.657
Correlation of Fixed Effects:
(Intr) temp doph

50
temp -0.551
do -0.513 -0.323
ph 0.130 -0.687 0.169
secci depth -0.041 -0.030 0.410 -0.516
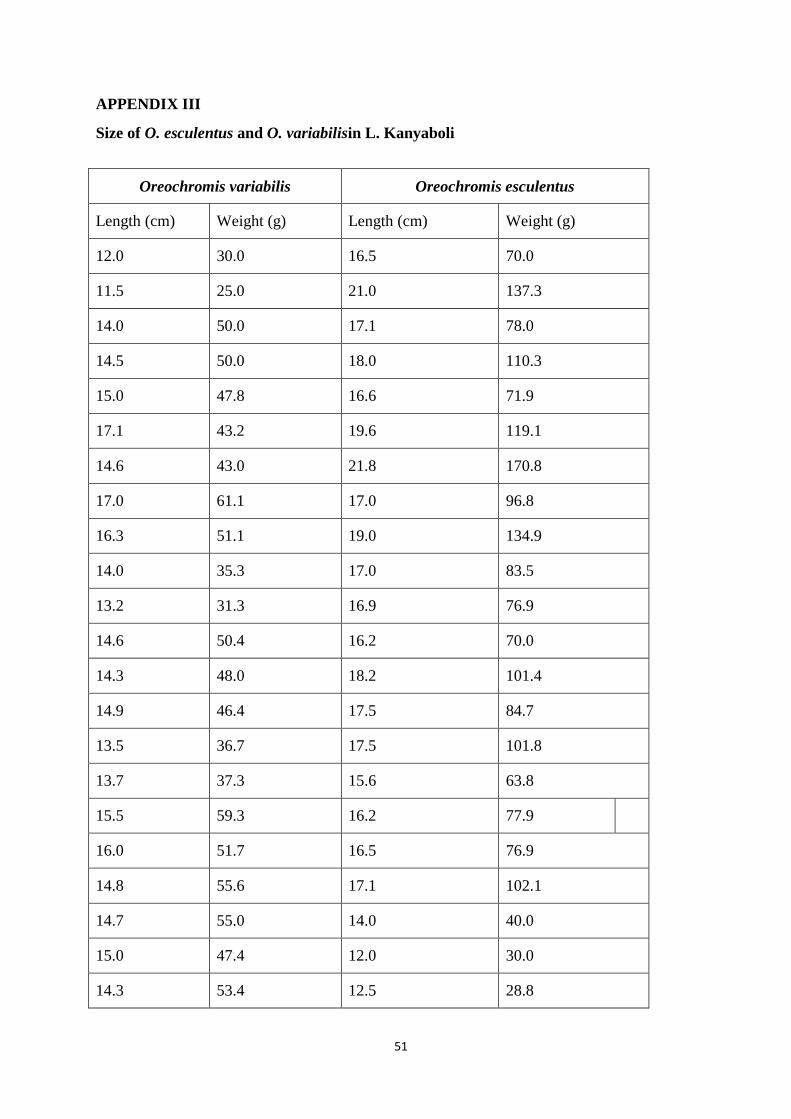
51
APPENDIX III
Size of O. esculentus and O. variabilisin L. Kanyaboli
Oreochromis variabilis Oreochromis esculentus
Length (cm) Weight (g) Length (cm) Weight (g)
12.0 30.0 16.5 70.0
11.5 25.0 21.0 137.3
14.0 50.0 17.1 78.0
14.5 50.0 18.0 110.3
15.0 47.8 16.6 71.9
17.1 43.2 19.6 119.1
14.6 43.0 21.8 170.8
17.0 61.1 17.0 96.8
16.3 51.1 19.0 134.9
14.0 35.3 17.0 83.5
13.2 31.3 16.9 76.9
14.6 50.4 16.2 70.0
14.3 48.0 18.2 101.4
14.9 46.4 17.5 84.7
13.5 36.7 17.5 101.8
13.7 37.3 15.6 63.8
15.5 59.3 16.2 77.9
16.0 51.7 16.5 76.9
14.8 55.6 17.1 102.1
14.7 55.0 14.0 40.0
15.0 47.4 12.0 30.0
14.3 53.4 12.5 28.8

52
11.5 25.0 16.6 69.3
12.0 30.0 16.7 75.7
12.0 30.0 17.3 78.4
14.0 40.0 15.4 55.7
12.0 30.0 15.5 55.8
13.7 42.5 15.9 62.3
13.6 44.5 12.5 28.8
12.1 27.6 12.0 23.4
13.7 38.6
13.4 36.3
14.4 40.2
13.1 42.8
14.1 46.3
13.9 48.0
15.3 68.0
15.5 71.5
Mean= 14.1cm Mean= 44.0g Mean= 16.5cm Mean=79.2g

53
APPENDIX IV
Table 4.5: Phytoplankton species diversity in eastern component of L. Kanyaboli.
Name of species Average no.
of
individuals(i)
(pi) In(pi) (pi) ×
In(pi)
Cosmarium minimum 199998 0.0009 -6.9531 0.0062
Cosmarium regnelii 466662 0.0002 -8.4084 0.0016
Crucigenia menenghiana 33333 0.0001 -8.7448 0.0008
Crucigenia sp 99999 0.0004 -7.6462 0.0007
Cyclotella ocellata 399996 0.0019 -6.2599 0.0118
Cymbella cistula 33333 0.0001 -8.7448 0.0008
Cymbella cistulla 266664 0.0012 -6.6654 0.0079
Diatoma elongatum 699993 0.0033 -5.7003 0.0188
Diatoma hemiale 1266654 0.0060 -5.1072 0.0306
Diatoma hiemiale 199998 0.0009 -6.9531 0.0062
Dictyosphaerium
reniforme
1833315 0.0087 -4.7375 0.0412
Euglena acus 633327 0.0030 -5.8004 0.0174
Fragilaria athiopica 633327 0.0030 -5.8004 0.0174
Fragilaria binods 133332 0.0006 -7.3585 0.0044
Glenordinium pulvasistoz 399996 0.0019 -6.2599 0.0118
Glenodinium pernardii 277775 0.0013 -6.6245 0.0086
Glenordinium pernadii 99999 0.0004 -7.6462 0.0233
Glenordinium pernardii 566661 0.0027 -5.9116 0.0159
Gomphocymbella beccari 933324 0.0044 -5.4126 0.0238
Kirchnella lunaris 344441 0.0016 -6.4094 0.0102
Kirchnella obesa 533328 0.0025 -5.9722 0.0449
Kirchneriella dianae 299997 0.0014 -6.5476 0.0091
Merismopedia punctata 3466632 0.0165 -4.1004 0.0676
Microcystis aeruginosa 157909532 0.7545 -0.2816 0.2124
Microcystis wasenbergii 366663 0.0017 -6.3469 0.0107
Monoraphidium griffitnii 466662 0.0022 -6.1058 0.0134
Monorapidium sp 233331 0.0011 -6.7989 0.0074
Monoraphidium sp 583327.5 0.0027 -5.8826 0.0178
Navicula contenta 1133322 0.0054 -5.2182 0.0281
Navicula granatum 155554 0.0007 -7.2044 0.0050
Navicula merostoides 233331 0.0011 -6.7989 0.0074
Navicula pupula 266664 0.0012 -6.6654 0.0079
Navicula sp 322219 0.0015 -6.4761 0.0097
Navicula sp. 566661 0.0027 -5.9116 0.0178
Nitzchia lucastris 399996 0.0019 -6.2599 0.0118
Nitzchia recta 233331 0.0011 -6.7989 0.0074
Nitzschia sub -acicularis 4099959 0.0195 -3.9326 0.0766
Nitzschia sub-acicularis 49999.5 0.0002 -8.3394 0.0016
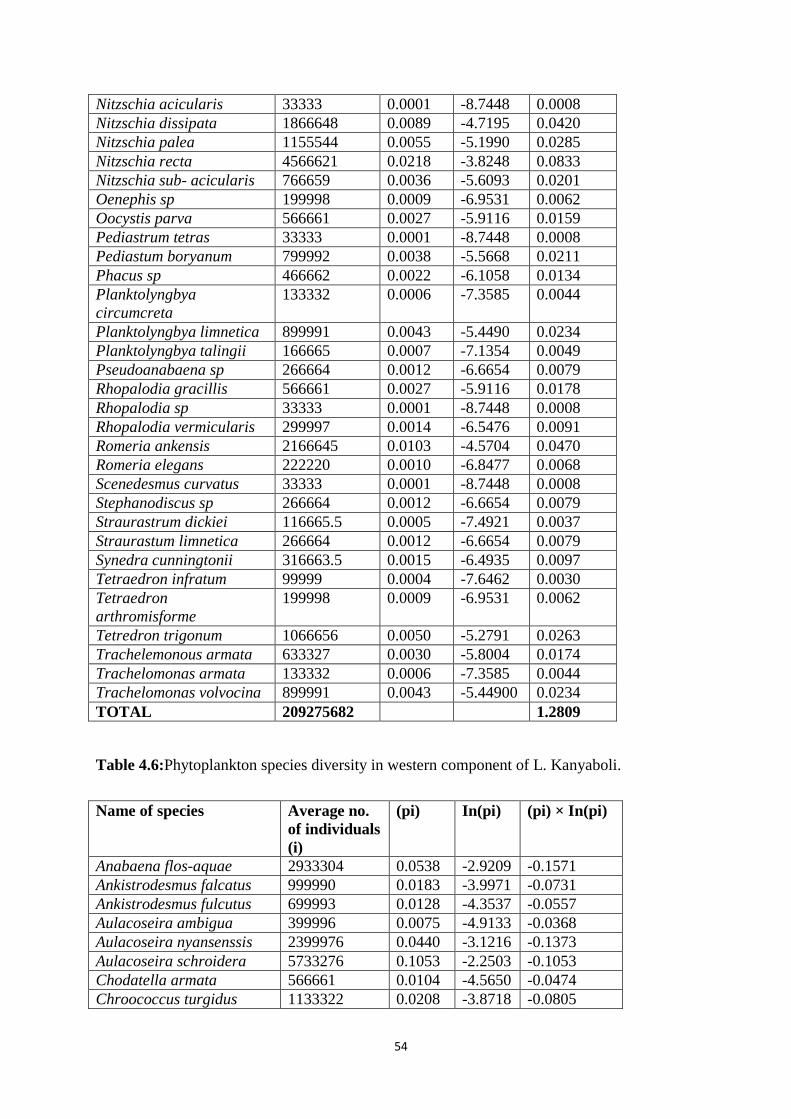
54
Nitzschia acicularis 33333 0.0001 -8.7448 0.0008
Nitzschia dissipata 1866648 0.0089 -4.7195 0.0420
Nitzschia palea 1155544 0.0055 -5.1990 0.0285
Nitzschia recta 4566621 0.0218 -3.8248 0.0833
Nitzschia sub- acicularis 766659 0.0036 -5.6093 0.0201
Oenephis sp 199998 0.0009 -6.9531 0.0062
Oocystis parva 566661 0.0027 -5.9116 0.0159
Pediastrum tetras 33333 0.0001 -8.7448 0.0008
Pediastum boryanum 799992 0.0038 -5.5668 0.0211
Phacus sp 466662 0.0022 -6.1058 0.0134
Planktolyngbya
circumcreta
133332 0.0006 -7.3585 0.0044
Planktolyngbya limnetica 899991 0.0043 -5.4490 0.0234
Planktolyngbya talingii 166665 0.0007 -7.1354 0.0049
Pseudoanabaena sp 266664 0.0012 -6.6654 0.0079
Rhopalodia gracillis 566661 0.0027 -5.9116 0.0178
Rhopalodia sp 33333 0.0001 -8.7448 0.0008
Rhopalodia vermicularis 299997 0.0014 -6.5476 0.0091
Romeria ankensis 2166645 0.0103 -4.5704 0.0470
Romeria elegans 222220 0.0010 -6.8477 0.0068
Scenedesmus curvatus 33333 0.0001 -8.7448 0.0008
Stephanodiscus sp 266664 0.0012 -6.6654 0.0079
Straurastrum dickiei 116665.5 0.0005 -7.4921 0.0037
Straurastum limnetica 266664 0.0012 -6.6654 0.0079
Synedra cunningtonii 316663.5 0.0015 -6.4935 0.0097
Tetraedron infratum 99999 0.0004 -7.6462 0.0030
Tetraedron
arthromisforme
199998 0.0009 -6.9531 0.0062
Tetredron trigonum 1066656 0.0050 -5.2791 0.0263
Trachelemonous armata 633327 0.0030 -5.8004 0.0174
Trachelomonas armata 133332 0.0006 -7.3585 0.0044
Trachelomonas volvocina 899991 0.0043 -5.44900 0.0234
TOTAL 209275682 1.2809
Table 4.6:Phytoplankton species diversity in western component of L. Kanyaboli.
Name of species Average no.
of individuals
(i)
(pi) In(pi) (pi) × In(pi)
Anabaena flos-aquae 2933304 0.0538 -2.9209 -0.1571
Ankistrodesmus falcatus 999990 0.0183 -3.9971 -0.0731
Ankistrodesmus fulcutus 699993 0.0128 -4.3537 -0.0557
Aulacoseira ambigua 399996 0.0075 -4.9133 -0.0368
Aulacoseira nyansenssis 2399976 0.0440 -3.1216 -0.1373
Aulacoseira schroidera 5733276 0.1053 -2.2503 -0.1053
Chodatella armata 566661 0.0104 -4.5650 -0.0474
Chroococcus turgidus 1133322 0.0208 -3.8718 -0.0805

55
Coelastum microphorum 33333 0.0006 -7.3982 -0.0044
Coelomoron vestitus 1866648 0.0342 -3.3729 -0.1153
Crucigenia rectangularis 466662 0.0085 -4.7592 -0.0404
Cyclotella ocellata 199998 0.0036 -5.6065 -0.0201
Cylindrospermopsis
africana
233331 0.0042 -5.4523 -0.0228
Dictyosphaerium
pulchellum
1333320 0.0244 -3.7094 -0.0905
Euglena acus 199998 0.0036 -5.6065 -0.0201
Euglena virids 233331 0.0042 -5.4523 -0.0228
Euglena vivds 233331 0.0042 -5.4523 -0.0228
Fragilaria crotonensis 433329 0.0079 -4.8333 -0.0381
Kirchnella obesa 99999 0.0018 -6.2996 -0.0113
Kirchneriella pseudoaperta 399996 0.0073 -4.9133 -0.0358
Monoraphidium sp 999990 0.0183 -3.9971 -0.0731
Monoraphidium carbeum 33333 0.0006 -7.3982 -0.0044
Navicula sp 1499985 0.0275 -3.5916 -0.0987
Nitzschia sub-acicularis 899991 0.0165 -4.1024 -0.0676
Nitzschia acicularis 399996 0.0073 -4.9133 -0.0358
Nitzschia palea 2099979 0.0385 -3.2551 -0.1253
Nitzschia recta 399996 0.0073 -4.9133 -0.0358
Oocystis lucastris 266664 0.0048 -5.3188 -0.0255
Oocystis nageli 299997 0.0055 -5.2010 -0.0286
Oocystis parva 1599984 0.0293 -3.5270 -0.1033
Pediastrum tetras 2099979 0.0385 -3.2551 -0.1253
Pediastum boryanum 566661 0.0104 -4.5650 -0.0474
Pinnularia brauni 2599974 0.0477 -3.0415 -0.1450
Plankolyngbya circumcreta 266664 0.0048 -5.3188 -0.0255
Planktolyngbya limnetica 866658 0.0159 -4.1402 -0.0658
Planktolyngbya talingii 1766649 0.0324 -3.4280 -0.1110
Rhombcystis lacrymas 1866648 0.0342 -3.3728 -0.1153
Romeria elegans 99999 0.0018 -6.2996 -0.0113
Selenastrum gracile 99999 0.0018 -6.2996 -0.0113
Sorastrum hathoris 199998 0.0036 -5.6065 -0.0201
Straurastrum gracile 499995 0.0091 -4.6902 -0.0426
Synedra cunningtonii 1433319 0.0263 -3.6370 -0.0956
Synedra nyassae 233331 0.0042 -5.4523 -0.0228
Synedra ulna 33333 0.0006 -7.3982 -0.0044
Tetredron arthromisforme 566661 0.0104 -4.5650 -0.04740
Tetraedron trigonum 733326 0.0134 -4.3072 -0.0577
Trachelomonas armata 599994 0.0110 -4.5079 -0.0495
Trachelomonas volvocina 4766619 0.0875 -2.4354 -0.2130
TOTAL 54439516 3.0325